A Case Study on Improving Productivity by Reducing ... (150-159).pdf · Improving Productivity by...
11
150 Elin Appliances A Case Study on Improving Productivity by Reducing Operation Cost as Six Sigma Process Improvement Keywords: DMAIC, FMEA, KPI Dash Board, NVA, Pilot Verification, Root cause Analysis, Risk Analysis, Six sigma process improvement, VOC Abstract This case study illustrates the application of six sigma process improvement to productivity improvement in manufacturing process. Introduction To ensure sustainable profitable growth in a highly price-sensitive appliance market Cost reduction through operational excellence is the key imperative. Elin Appliances upgrades can often be justified in terms of savings due to increased productivity. However, in a Six Sigma organization, the DMAIC Method & host of tools can be used to improve productivity through process improvements. Six Sigma DMAIC Six Sigma is a quality improvement program that looks at processes with a view to analyzing process steps, determining what process elements need improvement, developing alternatives for improvement, then selecting and implementing one. It relies on a variety of qualitative and quantitative tools, emphasizing the use of data and statistical analysis with in a method called DMAIC, an acronym for the names of its five phases (Define, Measure, Analyze, Improve, and Control) (Table 1). Six Sigma projects are typically selected for their potential savings in improving any process, whether it is in production, administration, engineering, or services. A Six Sigma project typically begins with a high level definition of a process, using a diagram to specify the process boundaries, inputs, outputs, customers, and requirement. In the measure phase, a process metric is selected and used to baseline the current performance of the process. In the analysis phase, the process is analyzed, usually with a process map and a failure modes and effects analysis (FMEA), but may include other types of analysis. The process map shows each process step with its inputs and outputs and provides the basis for either a FMEA or a quantitative, usually statistical, analysis. Areas for improvement are pinpointed and alternatives are generated and evaluated. Once an improvement option is selected and implemented, the project enters the control phase. In this phase, a plan is established for monitoring and controlling the process to ensure that gains are maintained. The use of the DMAIC method may vary between projects. For example, the Measure and Analyze phases of this project ran concurrently rather than
Transcript of A Case Study on Improving Productivity by Reducing ... (150-159).pdf · Improving Productivity by...

150 Elin Appliances
A Case Study on Improving Productivity by Reducing Operation Cost as Six Sigma Process Improvement
Keywords: DMAIC, FMEA, KPI Dash Board, NVA, Pilot Verification, Root cause Analysis, Risk Analysis, Six sigma process improvement, VOC
AbstractThis case study illustrates the application of six sigma process improvement to productivity improvement in manufacturing process.
Introduction
To ensure sustainable profitable growth in a highly price-sensitive appliance market Cost reduction through operational excellence is the key imperative. Elin Appliances upgrades can often be justified in terms of savings due to increased productivity. However, in a Six Sigma organization, the DMAIC Method & host of tools can be used to improve productivity through process improvements.
Six Sigma DMAIC
Six Sigma is a quality improvement program that looks at processes with a view to analyzing process steps, determining what process elements need improvement, developing alternatives for improvement, then selecting and implementing one. It relies on a variety of qualitative and quantitative tools, emphasizing the use of data and statistical analysis with in a method called DMAIC, an acronym for the names of its five phases (Define, Measure, Analyze, Improve, and Control) (Table 1). Six Sigma projects are typically selected for their potential savings in improving any process, whether it is in production, administration, engineering, or services. A Six Sigma project typically begins with a high level definition of a process, using a diagram to specify the process boundaries, inputs, outputs, customers, and requirement. In the measure phase, a process metric is selected and used to baseline the current performance of the process. In the analysis phase, the process is analyzed, usually with a process map and a failure modes and effects analysis (FMEA), but may include other types of analysis. The process map shows each process step with its inputs and outputs and provides the basis for either a FMEA or a quantitative, usually statistical, analysis. Areas for improvement are pinpointed and alternatives are generated and evaluated. Once an improvement option is selected and implemented, the project enters the control phase. In this phase, a plan is established for monitoring and controlling the process to ensure that gains are maintained.
The use of the DMAIC method may vary between projects. For example, the Measure and Analyze phases of this project ran concurrently rather than

Improving Productivity by Reducing Operation Cost as Six Sigma Process Improvement 151
sequentially. Also, a proposed solution may emerge early in the Measure and Analysis phase, leading to an emphasis on planning and implementation in the Improve phase. Such was the case in the Productivity Improvement project. Consequently, this paper focuses on the Measure and Analyze phases in which a simulation based on a process map provided the justification for Productivity Improvement.
Table 1. DMAIC Method for Process Improvement
Phase Steps
Define - Identify an opportunity and define a project to address it.
Measure -Analyze the current process and specify the desired outcome.
Analyze - Identify root causes and proposed solutions.
Improve - Prioritize solutions; select, plan, validate, and implement a solution.
Control - Develop a plan for measuring progress and maintaining gains.
Define Phase
As per “Voice of the Customer( VOC )”,customer products should have price stability & products should be competitive in pricing. To meet customer requirement cost reduction is the key driver for profitable growth.
Problem / Opportunity statement
Estimated losses in factory due to poor productivity exceeded 100 K Euros 1. in 2006-2007 financial year
Productivity improvement would generate hard and soft savings.2.
Measure Phase
The Flow through M-Phase-1.
Develop process measures2.
Collect Process data3.
Check data Quality4.
Understand Process behavior5.
6. Baseline Process Capability
Process mapping data for Problem statement – Throughput time: Data collected for all assembly lines
Observation
Thro
uput
time
9181716151413121111
110
100
90
80
70
60
50
40
_X=66.83
UCL=75.18
LCL=58.48111
111
1
11111111
11
1
1
111
11
1111
111
1
1
111111
I Chart of throughput time for Steam Iron
Reduce NVA on line

152 Elin Appliances
Observation
Throu
gh pu
t time
28252219161310741
55
50
45
40
35
30
25
_X=37.43
UCL=50.41
LCL=24.45
11
1
I Chart of throughput time of Juicer Mixer Grinder
As per data, there is wide variation in process through put times
Cycle Time Study of Line
Work stages- LEDI
Cycle
time
in s
econ
ds
Weg
h A Bo
x
Put tin
g f bo
x in A
Box
Fanc
y pac
king
sticke
ring &
Ant i ru
st
visua
l clea
ning
Clean
ing &
visua
l che
ck
Dial fix
ing &on
off p
ositio
n
Coolin
g
Temp C
HECKIN
G
Pre he
at ing
Safet
y tes
t
Inlay
fixing
Cord
routin
g
Housi
ng fix
ing
Mains c
ord fix
ing
Earth
ing sc
rew fix
ing
Sq nu
t , te
rmina
l
Neon l
amp f
ixing
Body
sc rew
fixing
Body
mou
nting
Metal co
ver f
ixing,t
ype p
late
Metal co
ver k
eepin
g
Rotar
y bkt
fixing
cold
set t in
g
2500
2000
1500
1000
500
0
Chart of Cycletime vs Work stages- LEDI
Work stages - JMG
Cycl
etim
e in
sec
onds
Palle
t
Bopp
TAP
E
Fanc
y box
Buffe
r pac
king
Numbe
ring
poly
bag p
ackin
g
clean
ing
Jar m
atchin
g
Sieve
matc
hing
Safety
Botto
m fixing
wire co
nn.2
wire co
nn.1
Middle&
top ho
using
Motor f
ixing
Spee
d switc
h
Middle
hous
ing vi
sual
180
160
140
120
100
80
60
40
20
0
Chart of Cycletime vs Work stages - JMG
Assembly lines are highly unbalanced due to no value added content.
Root cause analysis of line stoppage
Count 28877173202845 2545 2270 1605 1699Percent 50.5 30.3 5.0 4.5 4.0 2.8 3.0Cum % 50.5 80.8 85.8 90.2 94.2 97.0 100.0
Time i
n minu
tes
Perce
nt
Factors causing line stoppageOther
Utility p
roblems
Manpower issues
Machine breakdown
kit not is
sued
Component not av
ailable
Component qualit
y
60000
50000
40000
30000
20000
10000
0
100
80
60
40
20
0
Pareto of Line stoppage factors for period Jan'07- July'07
Component having high Quality issue

Improving Productivity by Reducing Operation Cost as Six Sigma Process Improvement 153
Why analysis of Non Value Added activity on line
S.No.
Non valuedadded stage
WHY WHY WHY WHY WHY
1 Toaster cooling stage
time Heat dissipation Is not properly controlled
Cooling equipment deficiency
Design of cooling equipment is not optimised
2 Sieve matching and jar matching
Selective assay process
To check for noise and vibration
Unbalanclng of sieve
Interaction effect of components
specs ofcomponentsnotoptimised
3 Iron cooling stage Cooling time is high Uniform cooling is not happening
Iron farthest from fan takes longer time to cool
Iron coding is influenced by ambient conditions also
cooling arrangement Is adequate
4 Preheating stage Has to go through 3 heating cycles
This is a to ensure iron attains steady state
Requirement for 100% temp validation
Reliability of cold setting
Cold settingprocessInadequate
5 Packaging and cleaning
line Packaging stages are not balanced
Manual and too many offline activities
To many items in packaging design
Packaging design not simple
6 Pop up testing time at the testing stage
Only four toasters can be tested at a time
Testing equipment capacity is a bottleneck
Equipment is not designed to line speed.
Analyze Phase
The flow through A-phase
Determine potential root cause to measure1.
Analyze data using process stratification2.
Verify root causes with test data3.
Solution selection process
Evaluating criterias Generate
solution ideas
Select solutions determine cost benefit
Verify solutions with tests & data
Map new process

154 Elin Appliances
High impact solutions selected against each problem statement
Problem statement Line stoppage
Remove hex screw
Problem statement High NVA & TPT
Problem statement High TPT
Replicate steam iron cooling jig
Introduce conveyor belt
Recalibrate standard
Duplicate /repair moulds
Plastic JMG collar
Enclosed chamber for powder
Jar assy relocation Near to comaker
Source sieve from better supplier
Automate cold setting process
Temperature checking on sampling basis
Control Sieve unbalance <10 mg& motor coupler Within 0.1 mm run out
Increase capacity of pop up testing jig
Simplify packing and cleaning stages
Strengthen engineering function at comaker
Standing working
Streamline material feeding
Automate RTV application
Implement phase
The Flow through implement phase-
Assess risk using FMEA•
Design implementation plan•
Communicate to People•
Pilot solution and track improved performance •

Improving Productivity by Reducing Operation Cost as Six Sigma Process Improvement 155
Elements of an implementation plan
Project plan
Budget/control
Communication
Updating the business case & objectives
Identifying resource requirements
Dealing with resistance
The implementation plan
Risk analysis by FMEA
Overview of pilots
Some of the high risks for solutions that were addressed through FMEA
S.No. Solution Failure mode Recommended actions
1 Conveyorisation a. Breakdownb. Misalignment in speed
1. Proper design evaluation and release 2. Preventive maintenance plan 3. Proper pilot.
2 Standing working a. High fatigue levels below morale in operators
1. reconfirm working ergonomics during pilot
2. have a proper communication plan to deal with resistance and change
3. show bench marks
3 Milkman feeder Material not reaching on main line on time.
1. Proper routing plan2. proper design of material transfer trolleys
4 Sampling checking of temperature at nine stage
Irons with high/ ow temp, passing Into market
1. Cold setting and nine stage in a con-trolled atmosphere
2. Control plan far cold setting process 3. Introduce automation in cold setting process
5 Automation In RTV application
a. Machine breakdownb. High cycle times c. High wastages
1. Preventive maintenance plan 2. SOP for Job setup validation and how to
operate the machine.
6 Deletion of antirust in finished irons
Oxidation of soleplate in market 1. Proper evaluation and release 2. ControlonT1088 Aluminium composition

156 Elin Appliances
Pilot verification plan was used to modify the proposed solutions before implementation
S.No. Pilot on Proposed solution
Pilot Verification Modifications done on solutions
1 Automation on RTV application
1. High wastage of RTV2. Misalignment of RTV
dispenser with soleplate3. new failure points identified
1. Reprogramming of m/c 2. reduce nozzle dia3. make work instruction and
training4. revision of critical spares list
2 Oil shields in Jar pots
1 Paper caps not durable 2. Fitment Issues3, Operator needs training.
1. change into plastic caps 2. modify dimensions 3.Training was provided.
S Introduce cooling jigs
1 Metal cover not cooling in required time
2. Compressor not getting burnt
1. Addition of cooling fans on top
2. proper capacity of compressors were incorporated in the design.
4 Standing Working 1. Operator fatigue 2. mental bafflers 3. working ergonomics not
proper
1. Gradual phasing in of standing working
2. one to one communication channels
3. lncrease table height
The improved process-Primary metric unit/man hour
809803749743737731725719713707701
1000
500
0
Week no
Wee
kly
D.T
in m
inut
es
_X=165
UC L=516
LC L=-186
b a
809803749743737731725719713707701
600
450
300
150
0
Week no
Mov
ing
Rang
e
__MR=132.1
UC L=431.6
LC L=0
b a
1
1
Down time trend of Low end dry Iron

Improving Productivity by Reducing Operation Cost as Six Sigma Process Improvement 157
Process mean improved with reduced variation
808802746740734729723716709703
6
5
4
3
2
Week no
Wee
kly
unit/
man
hou
r
_X=4.658
UC L=5.287
LC L=4.030
A B
808802746740734729723716709703
3
2
1
0
Week no
Mov
ing
Rang
e
__MR=0.236
UC L=0.772
LC L=0
A B
Unit / man hour for Dry Irons(NDI/ODI )
Down Time Trend
Control Phase
Implement permanent control methods
• Track and confirm improved long term process capability
• Standardize control plan
• Identify leverage opportunities
• Validate final financial results
• Project handout
KPI Dash board – The Process outputs to be monitored
S.No.
What are the Y’s to be monitored
Who will measure/ monitor
Control methods
1 Unit per man hour Production manager Control chart & OCAP
2 TPTof main assy process Line supervisor Control chart & OCAP
3 Hourly rate of production for main assy
PPC manager Control chart & OCAP
4 Line stoppage time Production manager Control chart & OCAP
5 DPMO Quality manager Control chart

158 Elin Appliances
Results of Project
Financial Pulse
Improving Productivity by Reducing Operation Cost as Six Sigma Process Improvement 159
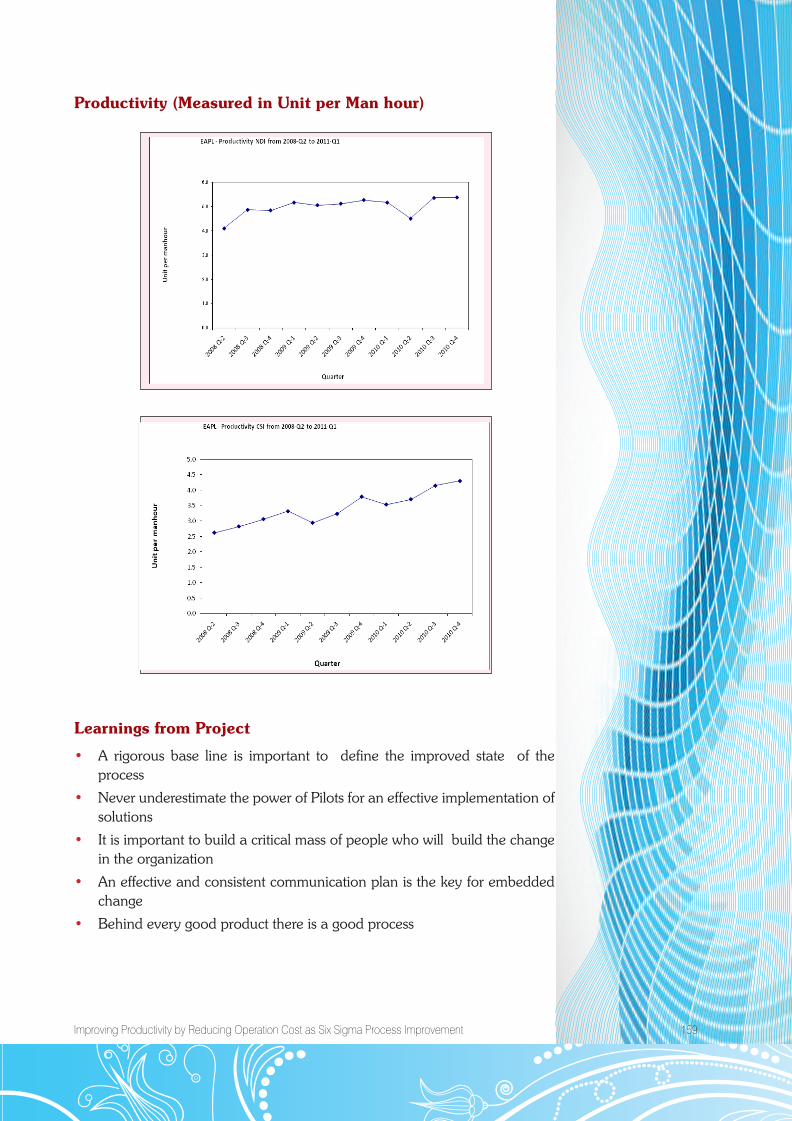
Productivity (Measured in Unit per Man hour)
Learnings from Project
• A rigorous base line is important to define the improved state of the process
• Never underestimate the power of Pilots for an effective implementation of solutions
• It is important to build a critical mass of people who will build the change in the organization
• An effective and consistent communication plan is the key for embedded change
• Behind every good product there is a good process