A Case Study from Sri Lanka - Home | UNICEF · PDF fileA Case Study from Sri Lanka ... control...
39
A Case Study from Sri Lanka Ministry of Health Nutrition coordination unit COMBATING MALNUTRITION THROUGH MULTISECTORAL NUTRITION PROGRAMMING
Transcript of A Case Study from Sri Lanka - Home | UNICEF · PDF fileA Case Study from Sri Lanka ... control...
A Case Studyfrom Sri Lanka
Ministry of HealthNutrition coordination unit
Combating malnutrition
through multisectoralnutrition programming
CombAting mALnutrition through muLtiSeCtorAL nutrition progrAmming
prof. rAjithA WiCkrAmASinghA
Dr. renukA jAyAtiSSA
Dr. ShAnthi gunAWArADAnA
miniStry of heALth
AnD
uniCef Sri LAnkA
2015
A CAse study from sri LAnkA

ContentS
eXeCutiVe SummAry Viii
ChApter 1introDuCtion 11.1 Background 21.2 Country profile 21.3 Purpose of the study 21.4 Constraints, challenges and limitations 41.5 Report structure 4
ChApter 2probLem StAtement 5
ChApter 3 methoDoLogy 93.1 Selection of pilot districts 93.2 The process 103.3 Administrative structure and process 14
ChApter 4 pre-interVention StAtuS 174.1 Sample characteristics 174.2 Prevalence of Low Birth Weight 204.3 Prevalence of malnutrition among children under 21
ChApter 5 interVention 275.1 Interventions related to the health sector 275.2 Interventions in other sectors 30
ChApter 6 poSt interVention StAtuS 35
ChApter 7DAtA AnALySiS 437.1 Results from routine monitoring activities 487.1.1 Results from routine monitoring activities in the Nuwara Eliya district 497.1.2 Results from routine monitoring activities in the Moneragala district 50
ChApter 8DiSCuSSion 578.1 Impact 578.2 Relevance 578.3 Effectiveness 588.4 Efficiency 588.5 Lessons learnt 59
referenCeS 61
AnneX 1Sri LAnkA At A gLAnCe 63
ii iiiCombating Malnutrition Through Multisectoral Nutrition ProgrammingA Case Study from Sri Lanka
Contents
List of tabLes
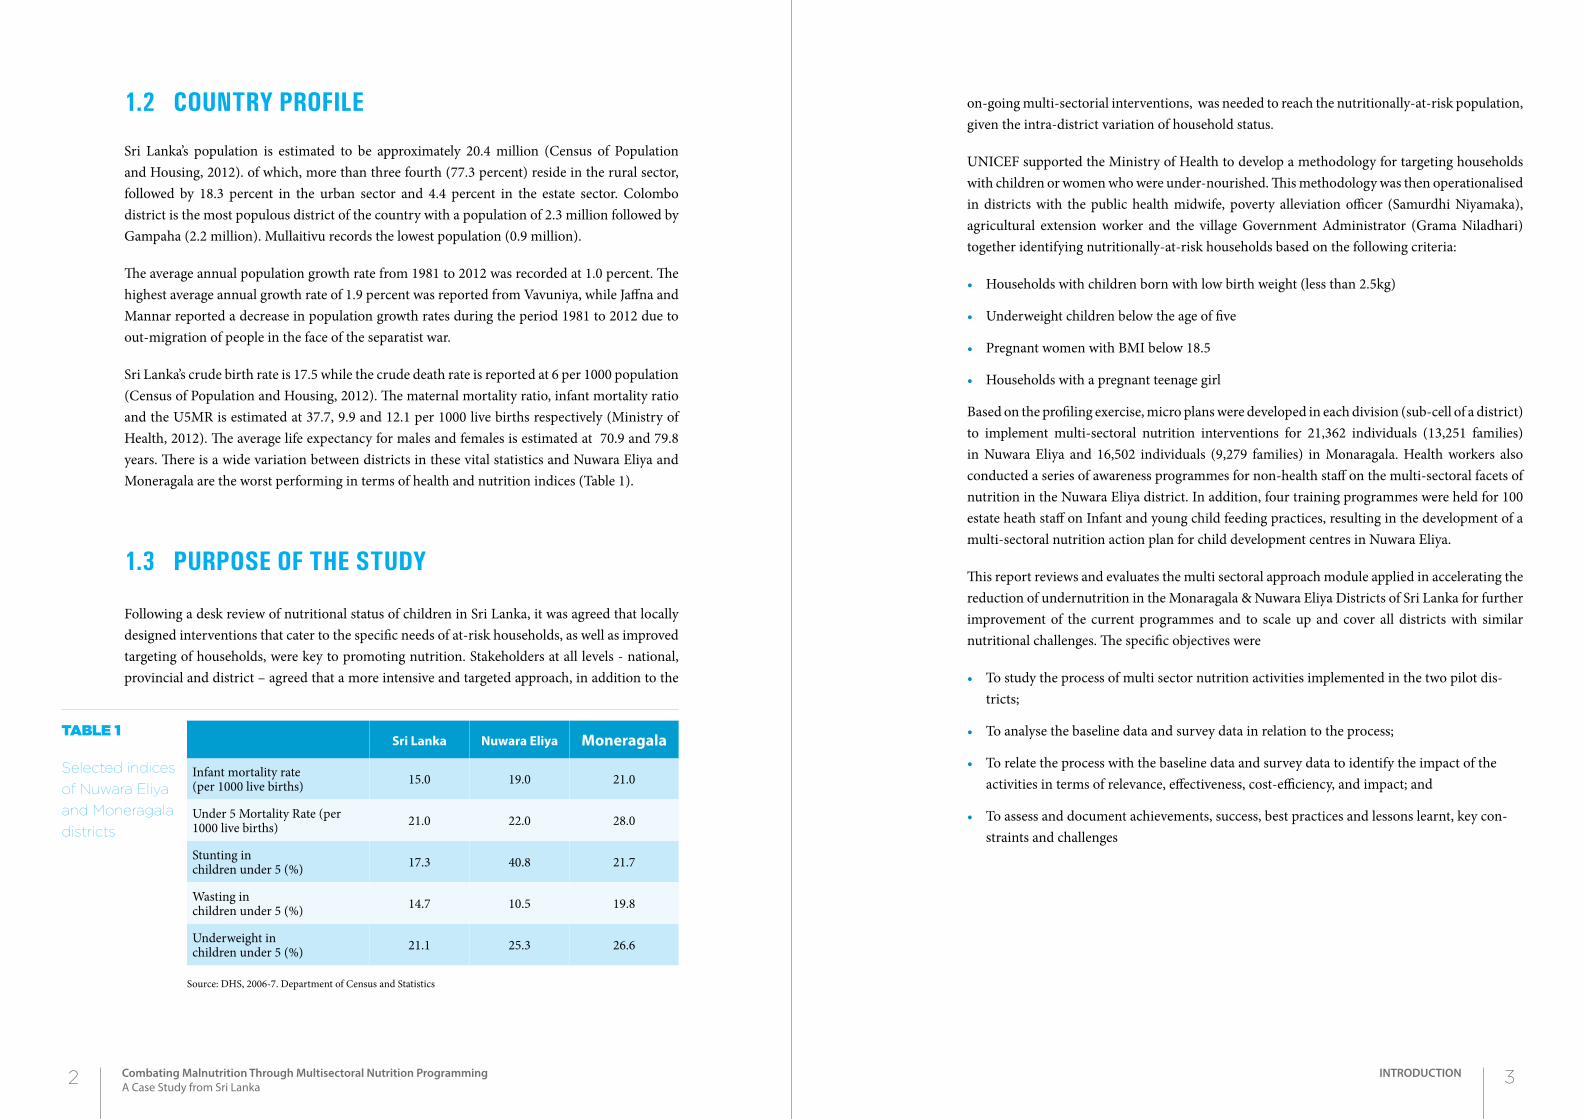
Table 1: Selected indices of Nuwara Eliya and Moneragala districts 2
Table 2: Prevalence of malnutrition by district 2006/07 7
Table 3: Distribution of children surveyed in 2009 by age, sex and district 18
Table 4: Summary of logistic regression analyses using underweight as the dependent variable 25
Table 5: Summary of logistic regression analyses using stunting as the dependent variable 25
Table 6: Summary of logistic regression analyses using wasting as the dependent variable 26
Table 7: Summary of logistic regression analyses using BMI for age as the dependent variable 26
Table 8: Distribution of children surveyed in 2012 by age, sex and district 36
Table 9: Summary of logistic regression analyses using underweight as the dependent variable – 2012 survey
41
Table 10: Summary of logistic regression analyses using stunting as the dependent variable – 2012 survey
42
Table 11: Summary of logistic regression analyses using wasting as the dependent variable – 2012 survey
42
Table 12: Summary of logistic regression analyses using BMI for age as the dependent variable – 2012 survey
42
Table 13: Absolute and relative change in stunting by selected variables 45
List of figures
Figure 1 Nutritional status of Sri Lankan children under 5 (2008) 6
Figure 2 Plan of the MsAPN 11
Figure 3 Key partners of the programme at the provincial level 14
Figure 4 Administrative structure of the Multi-sector Nutrition (MsN) Initiative at the district level 14
Figure 5 Process of implementation 15
Figure 6 Distribution of children under 5 by district and sector – 2009 survey 19
Figure 7 Distribution of children under 5 by district and wealth quintile – 2009 survey 19
Figure 8 Prevalence of low birth weight by district 20
Figure 9 Prevalence of malnutrition among children under 5 by district – 2009 survey 20
Figure 10 Prevalence of malnutrition by sector 21
Figure 11 Prevalence of malnutrition among children under 5 by wealth quintile 22
Figure 12 Prevalence of malnutrition among children under 5 by educational level of head of household 23
Figure 13 Prevalence of malnutrition among children under 5 by mother’s educational level 23
Figure 14 Prevalence of malnutrition among children under 5 by birth weight 24
Figure 15 PHM and health staff participating in healthy meal preparation with community participation 28
Figure 16 Focus group discussions with Primary Health Care team on proper child rearing practices 29
Figure 17 Activities carried out by different sectors 31
Figure 18 Interventions provided to families in the Moneragala District after the baseline survey in 2010 32
Figure 19 Interventions provided to families in the Nuwara Eliya District after the baseline sur-vey in 2010 33
Figure 20 Distribution of children under 5 by district and sector – 2012 survey 37
Figure 21 Distribution of children under 5 by district and wealth quintile – 2012 survey 37
Figure 22 Prevalence of low birth weight by district – 2012 survey 38
Figure 23 Prevalence of malnutrition among children under 5 by district – 2012 survey 38
Figure 24 Prevalence of malnutrition by sector – 2012 survey 39
Figure 25 Prevalence of malnutrition among children under 5 by wealth quintile - 2012 survey 39
Figure 26 Prevalence of malnutrition among children under 5 by mother’s educational level 40
Figure 27 Prevalence of malnutrition among children under 5 by birth weight – 2012 survey 41
iv vCombating Malnutrition Through Multisectoral Nutrition ProgrammingA Case Study from Sri Lanka
List of Figures
Figure 28 Change in prevalence of malnutrition between 2009 and 2012 in the selected districts 44
Figure 29 Change in prevalence of malnutrition indices between 2009 and 2012 by sector 44
Figure 30 Prevalence of malnutrition indices in 2012 in the rural sector by intervention and control districts 46
Figure 31 Prevalence of malnutrition indices in 2012 in the estate sector by intervention and control districts 46
Figure 32 Prevalence of underweight and stunting in 2009 and 2012 surveys in the rural sector by age groups and intervention and control districts 47
Figure 33 Change in prevalence of underweight and stunting between 2009 and 2012 surveys in the rural sector by age groups and intervention and control districts 48
Figure 34 Monitoring of underweight in selected districts by the Family Health Bureau 49
Figure 35 Monitoring of stunting in selected districts by the Family Health Bureau 49
Figure 36 Change in prevalence of underweight among under five children in Nuwara Eliya between January and August 2012 50
Figure 37 Prevalence of low birth weight in the Moneragala district 2010-2013 51
Figure 38 Decrease in prevalence of underweight among children under 5 in the Moneragala district 2010-2014 51
Figure 39 Prevalence of underweight among infants in the Moneragala district 2010-2013 52
Figure 40 Prevalence of underweight among children 1-2 years in the Moneragala district 2010-2013 52
Figure 41 Prevalence of underweight among children 2-5 years in the Moneragala district 2010-2013 53
Figure 42 Prevalence of stunting among school children in the Moneragala district 2010-2013 53
Figure 43 Prevalence of wasting among school children in the Moneragala district 2010-2013 54
Figure 44 Percentage of pregnant women in the Moneragala district having a BMI less than 18.5 54
List of boxes
Box 1 Some interventions carried out in the Moneragala District 31
Box 2 Some interventions carried out in the Nuwara Eliya District 32
List of abbreviations
BMI Body Mass Index
DALYs Disability Adjusted Life Years
GNP Gross Domestic Product
GoSL Government of Sri Lanka
IHME Institute for Health Metrics and Evaluation
LRI Lower Respiratory Infections
MsAPN Multi-sector Action Plan for Nutrition
MsN Multi-sector Nutrition
MOH Medical Officer of Health
PEM Protein-Energy Malnutrition
PHMs Public Health Mid wives
UNICEF United Nations Children’s Fund
vi viiCombating Malnutrition Through Multisectoral Nutrition ProgrammingA Case Study from Sri Lanka
List of Abbreviations
micro-nutrients and food supplements for pregnant and lactating mothers and young children by the government. The root causes and underlying issues that affect the nutritional status of a household were further identified through a series of workshops and focus group discussions with selected service providers.
This special project was carried out under the direct leadership of His Excellency the President at the Central level and the Chief Minister of the Province at the Provincial level with support from the Nutrition Coordination Unit of the Ministry of Health and UNICEF. The Chief Secretary of the Province convened meetings of all stakeholders at the Provincial level under the leadership of the Chief Minister of the province.
After the eligible families were identified, based on a detailed analysis, targeted tailor-made interventions were designed that would have an impact on individual families. Interventions that were offered were not only restricted to the health sector but other sectors as well.
Activities related to the health sector included nutritional related behaviour change communication, empowering communities regarding correct child care practices and monitoring and evaluation. Group training sessions with community participation were conducted by the PHM and other health staff on preparation of healthy meals using locally available cheap ingredients. Focus group discussions were conducted to empower communities. The PHM and the MOH of the area closely monitored all activities.
A number of interventions were provided through other sectors such as the departments of Ayurveda, Agriculture and livestock development, Samurdhi officers, education etc. The interventions included awareness programmes on home gardening and provision of vegetable and fruit seeds, assistance to construct sanitary toilets, provision of Samurdhi assistance, provision of water pumps and sewing machines for self employment activities, provision of milk cows and chicks, provision of agricultural lands, and assistance in re-enrolling children who had dropped out of school
Data were compared between intervention districts (Moneragala and Nuwara Eliya) and two control districts (Ratnapura and Badulla) which were considered similar to the intervention districts in terms of distribution of population by sector and socioeconomic status. Data from two surveys conducted in 2009 (before intervention) and in 2012 (after intervention) were compared. In addition, routine monitoring data were used for analyses.
There has been a decrease in the prevalence of stunting in children under 5 in both the control and intervention districts. The decrease in the prevalence of stunting is greater in the intervention
eXeCutiVe SummAry
Despite many interventions and programmes to combat malnutrition in the country for many years, it still remains a major public health problem in Sri Lanka, though the burden has decreased significantly in the last 2-3 decades. Malnutrition is unevenly distributed and is more prevalent in the rural and estate sectors. In 2012, 13.1% of Sri Lankan children under 5 were stunted and 19.6 % were wasted.
Based on previous analyses, the number of living children in the family, age of child, sector of residence, work status of mother, access to media by mother, mother’s educational level, type of latrine, whether the child was given colostrum, whether the mother washes her hands with soap after the child defecates, sex of child, and access to safe drinking water have been associated with malnutrition.
Given the high prevalence of malnutrition and the causes of malnutrition, a pilot exercise aimed to target interventions that would assist in reducing undernutrition, provide evidence on the current gaps in services, including inequalities of opportunities to access existing services and the inequities in the delivery of services was conducted in the Nuwara Eliya district. The project began with an analysis of available primary and secondary data and a literature review on malnutrition and its determinants. Based on the analysis of data of a survey carried out in 2009, low birth weight, sector, wealth index quintile, education of head of household and education of mother were significant predictors of malnutrition in children under 5.
Based on the findings of the review, a concept note was prepared to scale up Multi sectoral Action Plan for Nutrition (MsAPN). The review concluded that there is a need for locally designed interventions catering to the specific needs of at-risk households and improved targeting of households that are food insecure, rather than the existing uniform and universal programmes.
Stakeholders at National, Provincial and District level agreed on the need for a more intensive and targeted approach to reach the nutritionally-at-risk population given the intra-district variation of household income status, whilst continuing to implement existing health and related sector services. It was recognised that the households need to be made accountable for the family’s nutritional status and that it is a joint responsibility of the family members along with the service providers.
A total of 21, 362 individuals (13, 251 families) were targeted in the Nuwara Eliya district and 16,502 individuals (9,279 families) in the Moneragala district. The targeting of nutritionally-at-risk households compelled the Public Health Midwives and the primary health care staff to pay additional attention to these households and closely monitor the progress of the nutritional status of vulnerable persons. All targeted households were given priority and provided with multiple
viii ixCombating Malnutrition Through Multisectoral Nutrition ProgrammingA Case Study from Sri Lanka
Executive summary
districts especially in children over 36 months of age. In the rural sector, there has been a significant decrease in the prevalence of underweight children, in the 48-59 month age group. There was no significant impact of the intervention in decreasing the prevalence of wasting.
Locally designed, planned and acceptable interventions are required to combat malnutrition in the country. The health as well as the non-health sector can make significant contributions to improving nutritional status of communities. Targeted and customized interventions, both in health and non-health sector, assists in improvement of nutritional status of families. Interventions that are currently available to assist disadvantaged families are not been optimally utilized. The interventions has improved nutritional status of older children (especially in reducing the prevalence of stunting in children >12 months of age). No impact on underweight and wasting was seen. Inputs focusing on pregnant mothers and infants should be strengthened. Leadership at the highest level, though important, is by itself not sufficient for the successful implementation of nutritional projects. A formal structure needs to be developed for the motivation of staff and sustaining the project. A formal monitoring and evaluation system including external evaluation is needed to ensure that the intervention is applied to meet the targets.
1.1 background
Sri Lanka is on track to achieve most of the Millennium Developmental Goals in the area of child survival and other sectors such as social, health and education. Nutrition remains an unfinished development agenda. Achievements in combating malnutrition over the last few decades have been modest and the issue remains an unresolved public health problem with profound, irreversible and life threatening consequences on child survival and development.
Due to the magnitude of the issues and the multi-sectoral nature of the manifestation of nutrition, the Government of Sri Lanka (GoSL) set up a Nutritional Council in March 2011. The main objective of this Council was to focus attention of all social sectors to collectively reduce the prevalence of undernutrition, which is a manifestation of numerous socio-economic factors.
UNICEF is supporting the GoSL to model the multi-sector nutrition approach in two selected districts namely, Nuwara Eliya and Moneragala. This has involved establishing multi-sector coordination mechanisms at national, provincial, district, divisional and community levels, facilitating development of a plan by providing technical and financial support for key nutrition interventions and strengthening monitoring and evaluation.
x 1Combating Malnutrition Through Multisectoral Nutrition ProgrammingA Case Study from Sri Lanka
INTRODUCTION
2Chapter1
introDuCtion
1.2 country profiLe
Sri Lanka’s population is estimated to be approximately 20.4 million (Census of Population and Housing, 2012). of which, more than three fourth (77.3 percent) reside in the rural sector, followed by 18.3 percent in the urban sector and 4.4 percent in the estate sector. Colombo district is the most populous district of the country with a population of 2.3 million followed by Gampaha (2.2 million). Mullaitivu records the lowest population (0.9 million).
The average annual population growth rate from 1981 to 2012 was recorded at 1.0 percent. The highest average annual growth rate of 1.9 percent was reported from Vavuniya, while Jaffna and Mannar reported a decrease in population growth rates during the period 1981 to 2012 due to out-migration of people in the face of the separatist war.
Sri Lanka’s crude birth rate is 17.5 while the crude death rate is reported at 6 per 1000 population (Census of Population and Housing, 2012). The maternal mortality ratio, infant mortality ratio and the U5MR is estimated at 37.7, 9.9 and 12.1 per 1000 live births respectively (Ministry of Health, 2012). The average life expectancy for males and females is estimated at 70.9 and 79.8 years. There is a wide variation between districts in these vital statistics and Nuwara Eliya and Moneragala are the worst performing in terms of health and nutrition indices (Table 1).
1.3 purpose of the study
Following a desk review of nutritional status of children in Sri Lanka, it was agreed that locally designed interventions that cater to the specific needs of at-risk households, as well as improved targeting of households, were key to promoting nutrition. Stakeholders at all levels - national, provincial and district – agreed that a more intensive and targeted approach, in addition to the
on-going multi-sectorial interventions, was needed to reach the nutritionally-at-risk population, given the intra-district variation of household status.
UNICEF supported the Ministry of Health to develop a methodology for targeting households with children or women who were under-nourished. This methodology was then operationalised in districts with the public health midwife, poverty alleviation officer (Samurdhi Niyamaka), agricultural extension worker and the village Government Administrator (Grama Niladhari) together identifying nutritionally-at-risk households based on the following criteria:
• Households with children born with low birth weight (less than 2.5kg)
• Underweight children below the age of five
• Pregnant women with BMI below 18.5
• Households with a pregnant teenage girl
Based on the profiling exercise, micro plans were developed in each division (sub-cell of a district) to implement multi-sectoral nutrition interventions for 21,362 individuals (13,251 families) in Nuwara Eliya and 16,502 individuals (9,279 families) in Monaragala. Health workers also conducted a series of awareness programmes for non-health staff on the multi-sectoral facets of nutrition in the Nuwara Eliya district. In addition, four training programmes were held for 100 estate heath staff on Infant and young child feeding practices, resulting in the development of a multi-sectoral nutrition action plan for child development centres in Nuwara Eliya.
This report reviews and evaluates the multi sectoral approach module applied in accelerating the reduction of undernutrition in the Monaragala & Nuwara Eliya Districts of Sri Lanka for further improvement of the current programmes and to scale up and cover all districts with similar nutritional challenges. The specific objectives were
• To study the process of multi sector nutrition activities implemented in the two pilot dis-tricts;
• To analyse the baseline data and survey data in relation to the process;
• To relate the process with the baseline data and survey data to identify the impact of the activities in terms of relevance, effectiveness, cost-efficiency, and impact; and
• To assess and document achievements, success, best practices and lessons learnt, key con-straints and challenges
Sri Lanka Nuwara Eliya Moneragala
Infant mortality rate (per 1000 live births) 15.0 19.0 21.0
Under 5 Mortality Rate (per 1000 live births) 21.0 22.0 28.0
Stunting in children under 5 (%) 17.3 40.8 21.7
Wasting in children under 5 (%) 14.7 10.5 19.8
Underweight in children under 5 (%) 21.1 25.3 26.6
Source: DHS, 2006-7. Department of Census and Statistics
Table 1
Selected indices
of Nuwara Eliya
and Moneragala
districts
2 3Combating Malnutrition Through Multisectoral Nutrition ProgrammingA Case Study from Sri Lanka
INTRODUCTION
1.4 constraints, chaLLenges and Limitations
• Competing projects and other issues were responsible for attention being diverted from the project.
• Even though leadership was provided at the highest level, there was a lack of a formal mech-anism for the continuation of the project.
• Internal monitoring system was flawed with no proper system of verifying data. There was no formal monitoring system. Grass roots level personnel were collecting and recording in various formats that could not be compiled properly.
• No external monitoring and evaluation system and feedback.
• Motivation of staff including supervisory staff was poor and staff interest decreased after a certain period of time. Towards the latter stages, regular projects meetings were not held as scheduled and monitoring was erratic.
• Early coordination of different sectors was difficult due to administrative and financial regu-lations but these were overcome with intervention from higher authorities.
1.5 report structure
This report is structured to describe the design and implementation of the project. Chapter one discusses briefly the background to this study and the status of the health sector. Chapter two does an in-depth analysis of the problem highlighted in the study. It elaborates on the problem of child malnutrition in the country and its components such as stunting, underweight, wasting and low BMI. Chapter three describes the methodology including the selection of the target districts and the process adopted in designing the intervention and the implementation of the intervention.
Chapter four describes the pre-intervention status in the two intervention districts (Nuwara Eliya and Moneragla) and in the two control districts (Badulla and Ratnapura) based on the special survey conducted in 2009. Chapter five describes the intervention in detail including specific activities carried out in the two intervention districts.
Chapter six describes the post-intervention status based on the special survey conducted in 2012. Comparisons were made between intervention and control districts. Chapter seven presents the results of data analysis based on both the special surveys done in 2009 and 2012, and the routine monitoring data obtained from the Family Health Bureau and the Provincial and Regional directorates of Health in the intervention districts. Chapter eight discusses the findings and results in terms of impact, relevance, effectiveness, efficiency and lessons learnt.
Child malnutrition produces a wide and diverse range of adverse economic and social consequences. Malnutrition substantially increases the risk of infant and child deaths, and the vulnerability to a variety of diseases in later life. Malnutrition impairs cognitive function and decreases school performance, labour productivity and lifetime earnings. Combating child malnutrition is of central importance to the future economic and social welfare of countries.
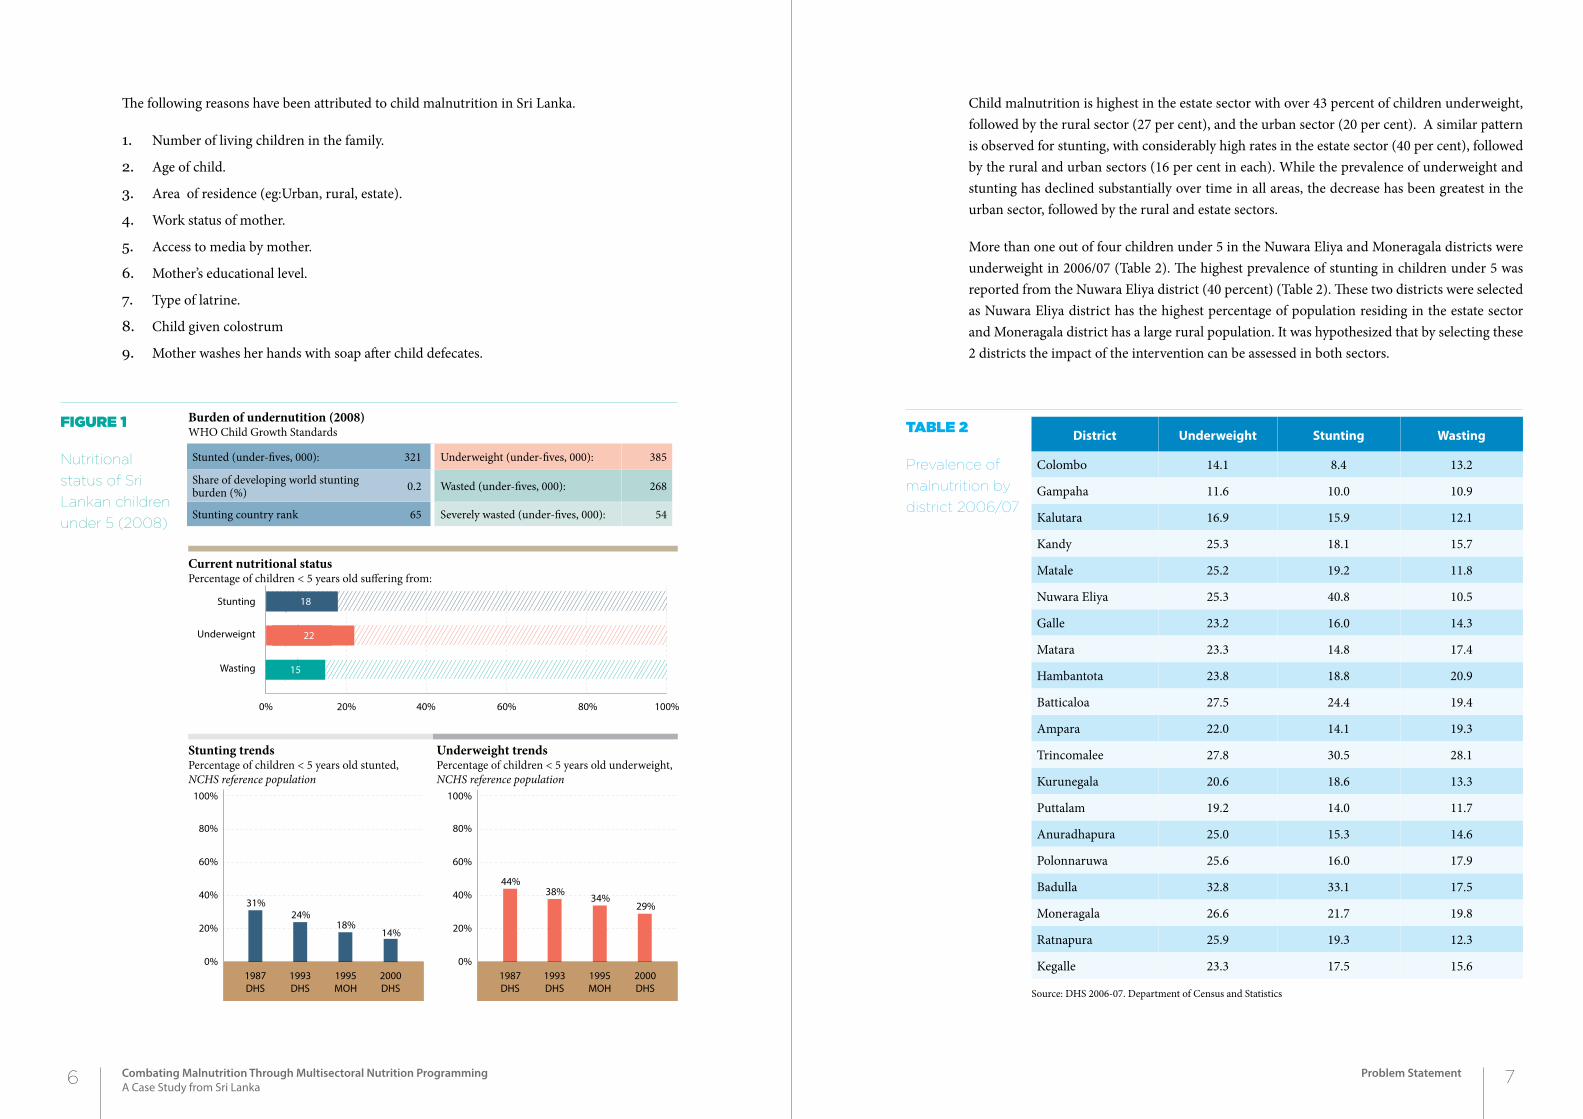
Child malnutrition in Sri Lanka is very high. Nearly one in three children (29 per cent) aged 3-59 months is underweight, and more than one in ten children in this age group suffer from chronic or acute malnutrition (Figure 1). A smaller, but still unacceptably high proportion (14 per cent) of children in this age group suffer from stunting and wasting. This implies that children suffer from short-term acute food deficit, reflected in low weight for age, as well as longer-term chronic under-nutrition, manifested in high rates of stunting and wasting.
The level of child malnutrition has been declining over time. The prevalence of underweight children fell from 38 per cent in 1993 to 29 per cent in 2000. The prevalence of stunted children declined even more – from 25 per cent to 14 per cent, the prevalences declining at impressive rates of 1.3 per cent and 1.6 per cent annually, respectively.
Data from the DHS surveys from 1993 and 2000 indicate that infant feeding practices had changed rapidly. Over this period, there was a sharp increase in the percentage of children exclusively breast-fed in their first three months of life, and a very significant increase in the mean duration of exclusive breast-feeding. A much larger proportion of children under 5 received colostrum in 2000 as compared to 1993 (Department of Census and Statistics).
4 5Combating Malnutrition Through Multisectoral Nutrition ProgrammingA Case Study from Sri Lanka
Problem Statement
2Chapter2probLem StAtement
Child malnutrition is highest in the estate sector with over 43 percent of children underweight, followed by the rural sector (27 per cent), and the urban sector (20 per cent). A similar pattern is observed for stunting, with considerably high rates in the estate sector (40 per cent), followed by the rural and urban sectors (16 per cent in each). While the prevalence of underweight and stunting has declined substantially over time in all areas, the decrease has been greatest in the urban sector, followed by the rural and estate sectors.
More than one out of four children under 5 in the Nuwara Eliya and Moneragala districts were underweight in 2006/07 (Table 2). The highest prevalence of stunting in children under 5 was reported from the Nuwara Eliya district (40 percent) (Table 2). These two districts were selected as Nuwara Eliya district has the highest percentage of population residing in the estate sector and Moneragala district has a large rural population. It was hypothesized that by selecting these 2 districts the impact of the intervention can be assessed in both sectors.
The following reasons have been attributed to child malnutrition in Sri Lanka.
1. Number of living children in the family.
2. Age of child.
3. Area of residence (eg:Urban, rural, estate).
4. Work status of mother.
5. Access to media by mother.
6. Mother’s educational level.
7. Type of latrine.
8. Child given colostrum
9. Mother washes her hands with soap after child defecates.
Figure 1
Nutritional
status of Sri
Lankan children
under 5 (2008)
District Underweight Stunting Wasting
Colombo 14.1 8.4 13.2
Gampaha 11.6 10.0 10.9
Kalutara 16.9 15.9 12.1
Kandy 25.3 18.1 15.7
Matale 25.2 19.2 11.8
Nuwara Eliya 25.3 40.8 10.5
Galle 23.2 16.0 14.3
Matara 23.3 14.8 17.4
Hambantota 23.8 18.8 20.9
Batticaloa 27.5 24.4 19.4
Ampara 22.0 14.1 19.3
Trincomalee 27.8 30.5 28.1
Kurunegala 20.6 18.6 13.3
Puttalam 19.2 14.0 11.7
Anuradhapura 25.0 15.3 14.6
Polonnaruwa 25.6 16.0 17.9
Badulla 32.8 33.1 17.5
Moneragala 26.6 21.7 19.8
Ratnapura 25.9 19.3 12.3
Kegalle 23.3 17.5 15.6
Source: DHS 2006-07. Department of Census and Statistics
Table 2
Prevalence of
malnutrition by
district 2006/07
Stunting trendsPercentage of children < 5 years old stunted, NCHS reference population
Current nutritional statusPercentage of children < 5 years old suffering from:
Burden of undernutition (2008)WHO Child Growth Standards
Underweight trendsPercentage of children < 5 years old underweight,NCHS reference population
Stunted (under-fives, 000): 321 Underweight (under-fives, 000): 385
Share of developing world stunting burden (%) 0.2 Wasted (under-fives, 000): 268
Stunting country rank 65 Severely wasted (under-fives, 000): 54
0% 20% 40% 60% 80% 100%
31%24%
18%14%
0%
20%
40%
60%
80%
100%
Stunting
Underweignt
Wasting 15
22
18
1987DHS
1993DHS
1995MOH
2000DHS
44%38%
34%29%
0%
20%
40%
60%
80%
100%
1987DHS
1993DHS
1995MOH
2000DHS
6 7Combating Malnutrition Through Multisectoral Nutrition ProgrammingA Case Study from Sri Lanka
Problem Statement
This section describes the methodology used since the inception of the project. It describes the selection of pilot districts and the process of implementation of the project.
3.1 seLection of piLot districts
As a result of the discussions among His Excellency the President of the GOSL, the Minister of Health, the Secretary to the President, the UNICEF Regional Director and the UNICEF Sri Lanka Country Office Representative, with the concurrence of the Chief Ministers of the Central and Uva Provinces, representatives of the districts of Nuwara Eliya (from the Central Province) and Moneragala (from the Uva province), both having a high prevalence of undernutrition, were selected to pilot a model multi-sectoral integrated approach to address the issue of malnutrition in children under 5 (Figure 2).Nuwara Eliya district represents an estate population with a 34 percent prevalence of LBW and a 41 percent prevalence of stunting. Moneragala district represented a remote rural population; the prevalence of LBW was 18 percent and the prevalence of stunting was 22 percent (DHS 2006 data). The national average prevalence of LBW was 17 percent and of stunting was 18 percent (Demographic Health Survey 2006).
Nuwara Eliya district is located in the hill country of the Central Province. The terrain is generally mountainous, with deep valleys. The total population of the Nuwara Eliya district is 703,610
8 9Combating Malnutrition Through Multisectoral Nutrition ProgrammingA Case Study from Sri Lanka
Methodology
2Chapter
methoDoLogy
3
(2001) with the estimated population for 2009 being 742,152. There were 13 MOH areas, 44 primary health care institutions, 3 secondary care institutions and 4 special units in the Nuwara Eliya district in 2009.
Monaragala District, known as Wellassa in ancient times, is situated in the Eastern and South-Eastern part of the Uva province of Sri Lanka. It is the second largest district in area comprising a total land area of 5959 km2. This district is bordered by the Ampara District in the North East, the Badulla district in the North West, the Hambantota district in the South and the Ratnapura district in the South East; the entire district is blessed with natural resources.
The district consists of 11 divisional secretariats, 319 grama niladari areas, 1324 villages and 10 prahdeshiya sabhas.
There is 1 district general hospital, 3 Base Hospitals, 14 District Hospitals, 10 Central Dispensaries and 11 MOH areas in the Moneragala District.
As a control group, the districts of Badulla and Ratnapura were selected for comparison. The Badulla district has a large estate population; the Ratnapura district has a large rural population.
In 2006/07, the prevalences of stunting in the Badulla and Ratnapura districts were 33 and 19 percent, respectively.
3.2 the process
The project began with an analysis of available primary and secondary data and a literature review on malnutrition and its determinants. The objective of this exercise was to acquire a thorough understanding of how multi-sector nutrition actions are being planned, coordinated, implemented and monitored at the national, district, divisional and community levels. In particular, the goal was to identify the successes or achievements realized thus far, and the existing problems or barriers to the multi-sector nutrition initiative. The review aimed to understand caregivers’ and staff perceptions and knowledge of the importance of improving nutrition related services involving the key sectors (Health, Agriculture, Economic Development and Social Welfare and Local Development), especially for nutritionally at risk families.
Based on the findings of the review (see draft report), a concept note was prepared to scale up MsAPN. The review concluded that there is a need for locally designed interventions catering to the specific needs of at-risk households and improved targeting of households that are food insecure, rather than the existing uniform and universal programmes.
Stakeholders at national, provincial and district levels agreed on the need for a more intensive and targeted approach to reach the nutritionally-at-risk population given the intra-district variation of household status, whilst continuing to implement existing health and related sector services.
It was recognised that households need to be made accountable for the family’s nutritional status and that it is joint a responsibility of the family members along with the service providers. In addition, due to the absence of severe clinical forms of undernutrition in the country, undernutrition is not considered a major issue by many communities. For instance, stunting (or being short) to wasting (being thin) is most often not perceived as undernutrition and is not given special attention by the family. Therefore, the implications of undernutrition need to be better understood and benefits of good nutrition internalised at household level to achieve the desired nutritional status among vulnerable population segments.
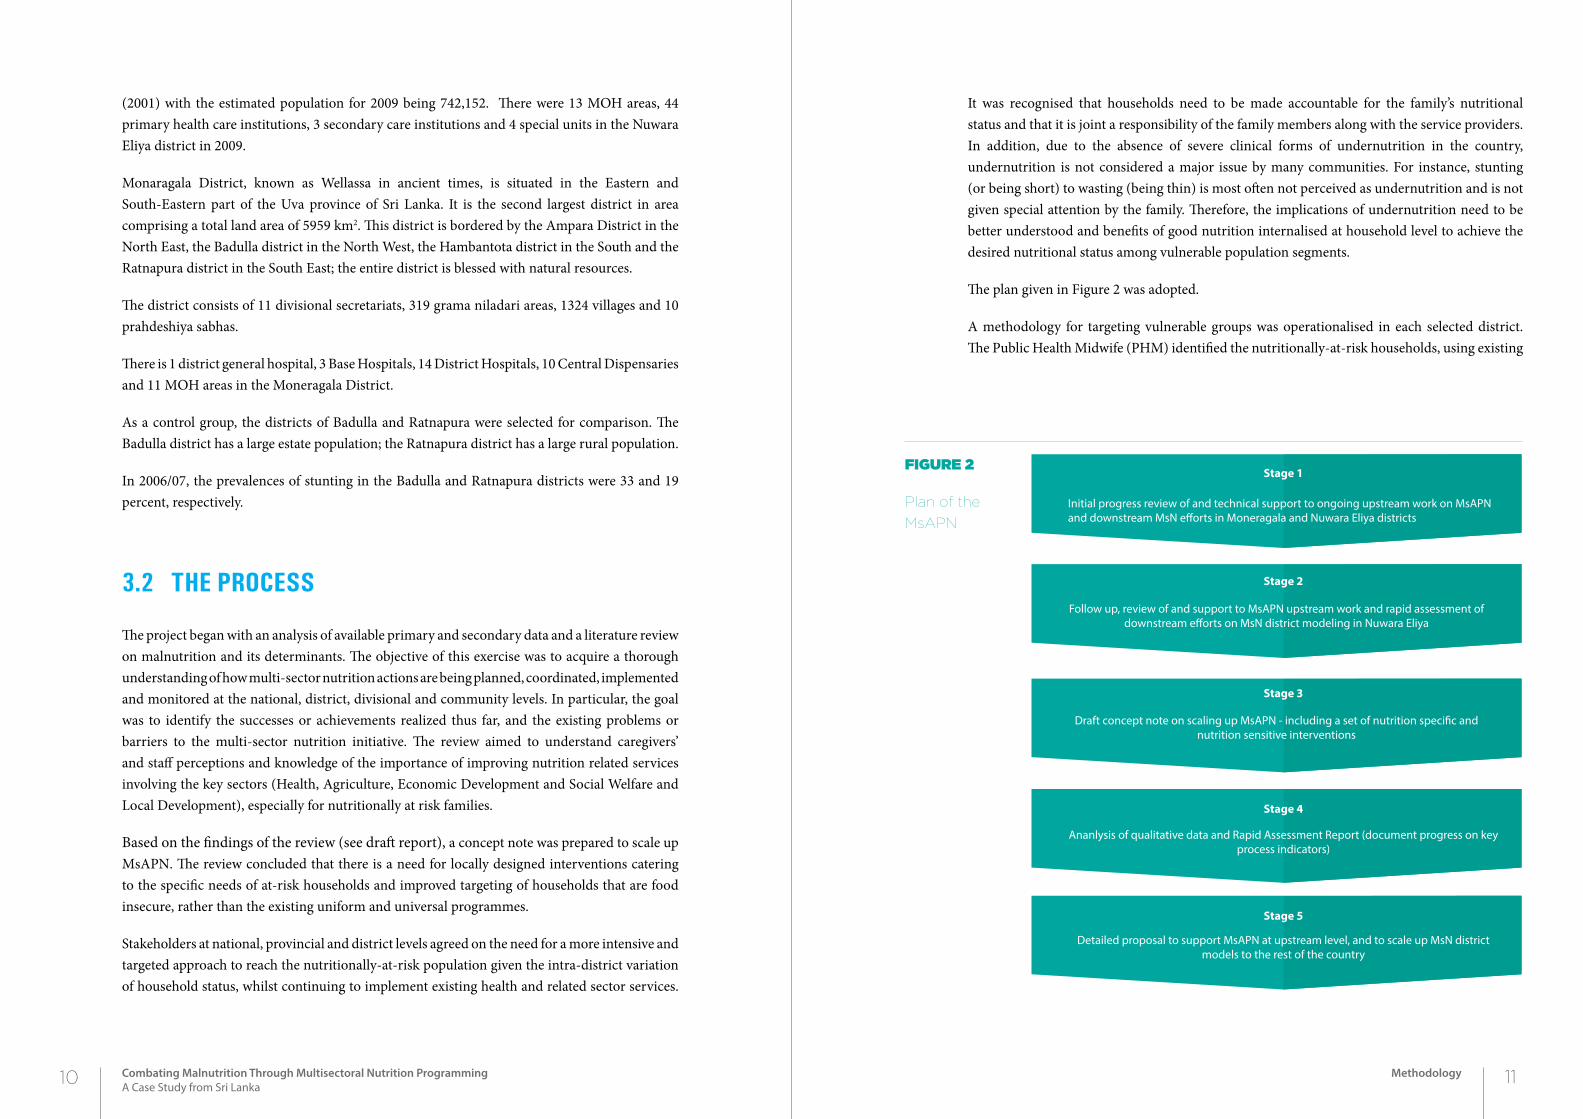
The plan given in Figure 2 was adopted.
A methodology for targeting vulnerable groups was operationalised in each selected district. The Public Health Midwife (PHM) identified the nutritionally-at-risk households, using existing
Figure 2
Plan of the
MsAPN
Stage 1
Initial progress review of and technical support to ongoing upstream work on MsAPN and downstream MsN e�orts in Moneragala and Nuwara Eliya districts
Stage 3
Draft concept note on scaling up MsAPN - including a set of nutrition speci�c and nutrition sensitive interventions
Stage 4
Ananlysis of qualitative data and Rapid Assessment Report (document progress on key process indicators)
Stage 5
Detailed proposal to support MsAPN at upstream level, and to scale up MsN district models to the rest of the country
Stage 2
Follow up, review of and support to MsAPN upstream work and rapid assessment of downstream e�orts on MsN district modeling in Nuwara Eliya
10 11Combating Malnutrition Through Multisectoral Nutrition ProgrammingA Case Study from Sri Lanka
Methodology
routine data collected through the primary health care system based on the following criteria:
1. households with a low birth weight child (birth weight less than 2.5kg);
2. households with an underweight child below five years;
3. households having a pregnant female with a BMI less than 18.5;
4. households with a pregnant female with inadequate weight gain during pregnancy; and
5. households with a teenage pregnancy.
A preliminary brain storming session was conducted among all stakeholders. Economic reasons, poor child care practices, poor feeding, HH food insecurity, communicable diseases, poor housing conditions, alcoholism and drugs, and poor pre-school and child development centres were identified as the main reasons for under-nutrition.
The targeted households were profiled according to the identified nutritional issues by village level service providers including the public health midwife, the poverty alleviation officer (samurdhi niyamaka), agricultural extension worker and the village level government administrator (grama niladhari). Based on the profiling exercise, micro plans were developed to implement multi-sectoral nutrition interventions in each divisional secretary division to address the range of issues identified. The developed divisional level micro plans helped put nutrition on the agenda of other sectors, and institutionalised and strengthened the capacity of local planners and service providers in identifying and targeting the most vulnerable and undeserved in order to address inequities.
To support implementation, a series of awareness programmes were conducted for non-health staff on the multi-sectoral facets of nutrition in the Nuwara Eliya district. In addition, four training programmes were held for 100 estate health staff on infant and young child feeding practices, resulting in the development of a multi-sectoral nutrition action plan for child development centres in Nuwara Eliya. A similar programme was conducted in the Moneragala district and the sharing of the best practices was supported through exposure visits and seminars to strengthen multi-sectoral interventions targeting undernutrition.
A total of 21, 362 individuals (13, 251 families) were targeted in the Nuwara Eliya district and 16,502 individuals (9,279 families) in the Moneragala district. The targeting of nutritionally-at-risk households compelled the public health midwives and the primary health care staff to pay additional attention to these households and closely monitor the progress of the nutritional status of vulnerable persons. All targeted households were given priority and provided with multiple micro-nutrients and food supplements for pregnant and lactating mothers and young children by the government. The root causes and underlying issues that affect the nutritional status of a household were further identified through a series of workshops and focus group discussions with selected service providers.
The summary of the major activities carried out under this programme include
• Initial discussions with H E the President and the President’s secretary
• Desk review on nutritional determinants and interventions
• Discussions with provincial authorities on piloting the multi-sectoral approach
• Conducting advocacy workshops at provincial, district and divisional levels to advocate and sensitise stakeholders on the multi-sectoral dimensions of undernutrition
• Development of a draft multi-sectoral model to address undernutrition and inequity issues
• Selection of nutritionally-at-risk households based on identified criteria by the Ministry of Health
• Profiling of households based on causes of undernutrition by the four village level field staff
• Tabulating and analysis of information for stakeholders to plan interventions
• Conducting workshops at the divisional secretary level to develop a micro plan for identi-fied interventions including stake holder accountability.
• Approval of micro plans at a provincial and district level and release of funds for implemen-tation
• Implementation of micro plans by the different ministries at the divisional level
• Working with the communities including establishing mother support groups
• Leveraging/mobilisation of funds from the provincial budget to complement UNICEF’s initial contribution
• Establishment of a monitoring mechanism through divisional nutritional committees and reporting of progress at the district and provincial level.
• Feedback of initial project outputs to the Presidential/National Nutrition Secretariat for incorporation in the National Nutrition Action Plan for 2012-2015, which was launched in 2013.
• Reviewing the effectiveness of interventions to identify those that can be institutionalised and allocated from the provincial budget
• Documentation of the process and development of guidelines for replication in other dis-tricts.
12 13Combating Malnutrition Through Multisectoral Nutrition ProgrammingA Case Study from Sri Lanka
Methodology
3.3 administrative structure and process
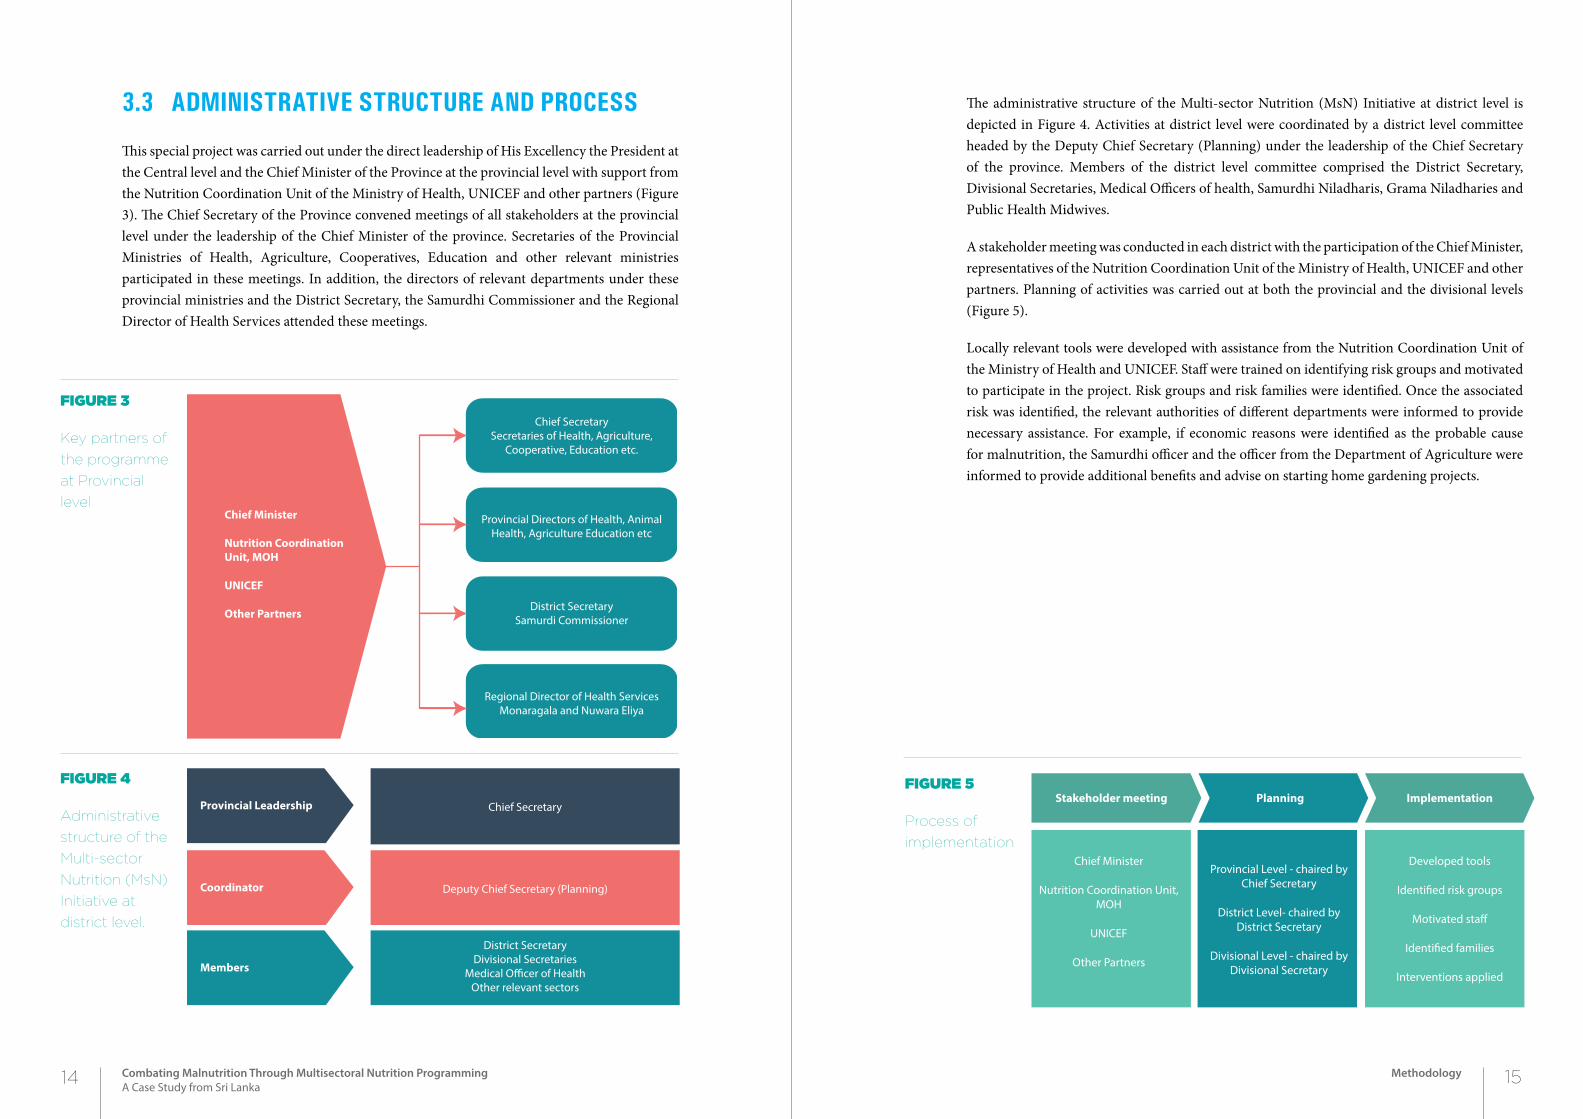
This special project was carried out under the direct leadership of His Excellency the President at the Central level and the Chief Minister of the Province at the provincial level with support from the Nutrition Coordination Unit of the Ministry of Health, UNICEF and other partners (Figure 3). The Chief Secretary of the Province convened meetings of all stakeholders at the provincial level under the leadership of the Chief Minister of the province. Secretaries of the Provincial Ministries of Health, Agriculture, Cooperatives, Education and other relevant ministries participated in these meetings. In addition, the directors of relevant departments under these provincial ministries and the District Secretary, the Samurdhi Commissioner and the Regional Director of Health Services attended these meetings.
The administrative structure of the Multi-sector Nutrition (MsN) Initiative at district level is depicted in Figure 4. Activities at district level were coordinated by a district level committee headed by the Deputy Chief Secretary (Planning) under the leadership of the Chief Secretary of the province. Members of the district level committee comprised the District Secretary, Divisional Secretaries, Medical Officers of health, Samurdhi Niladharis, Grama Niladharies and Public Health Midwives.
A stakeholder meeting was conducted in each district with the participation of the Chief Minister, representatives of the Nutrition Coordination Unit of the Ministry of Health, UNICEF and other partners. Planning of activities was carried out at both the provincial and the divisional levels (Figure 5).
Locally relevant tools were developed with assistance from the Nutrition Coordination Unit of the Ministry of Health and UNICEF. Staff were trained on identifying risk groups and motivated to participate in the project. Risk groups and risk families were identified. Once the associated risk was identified, the relevant authorities of different departments were informed to provide necessary assistance. For example, if economic reasons were identified as the probable cause for malnutrition, the Samurdhi officer and the officer from the Department of Agriculture were informed to provide additional benefits and advise on starting home gardening projects.
Figure 3
Key partners of
the programme
at Provincial
level
Figure 4
Administrative
structure of the
Multi-sector
Nutrition (MsN)
Initiative at
district level.
Chief Minister
Nutrition Coordination Unit, MOH
UNICEF
Other Partners
Chief Secretary Secretaries of Health, Agriculture,
Cooperative, Education etc.
Provincial Directors of Health, Animal Health, Agriculture Education etc
District Secretary Samurdi Commissioner
Regional Director of Health Services Monaragala and Nuwara Eliya
Provincial Leadership
Coordinator
Members
Chief Secretary
Deputy Chief Secretary (Planning)
District SecretaryDivisional Secretaries
Medical O�cer of Health Other relevant sectors
Stakeholder meeting Planning Implementation
Chief Minister
Nutrition Coordination Unit, MOH
UNICEF
Other Partners
Provincial Level - chaired by Chief Secretary
District Level- chaired by District Secretary
Divisional Level - chaired by Divisional Secretary
Developed tools
Identi�ed risk groups
Motivated sta�
Identi�ed families
Interventions applied
14 15Combating Malnutrition Through Multisectoral Nutrition ProgrammingA Case Study from Sri Lanka
Methodology
Figure 5
Process of
implementation
This section discusses the pre-intervention status of malnutrition in the Nuwara Eliya and Moneragala districts. The evidence of the pre-intervention status is captured through a survey conducted in 2009 among the households in these districts. This section discusses the sampled children aged 0-59 months by their sex, age group and the district and area of residence. It also discusses the prevalences of low birth weight, underweight, stunting, wasting and low BMI for age generated from the survey data.
4.1 sampLe characteristics
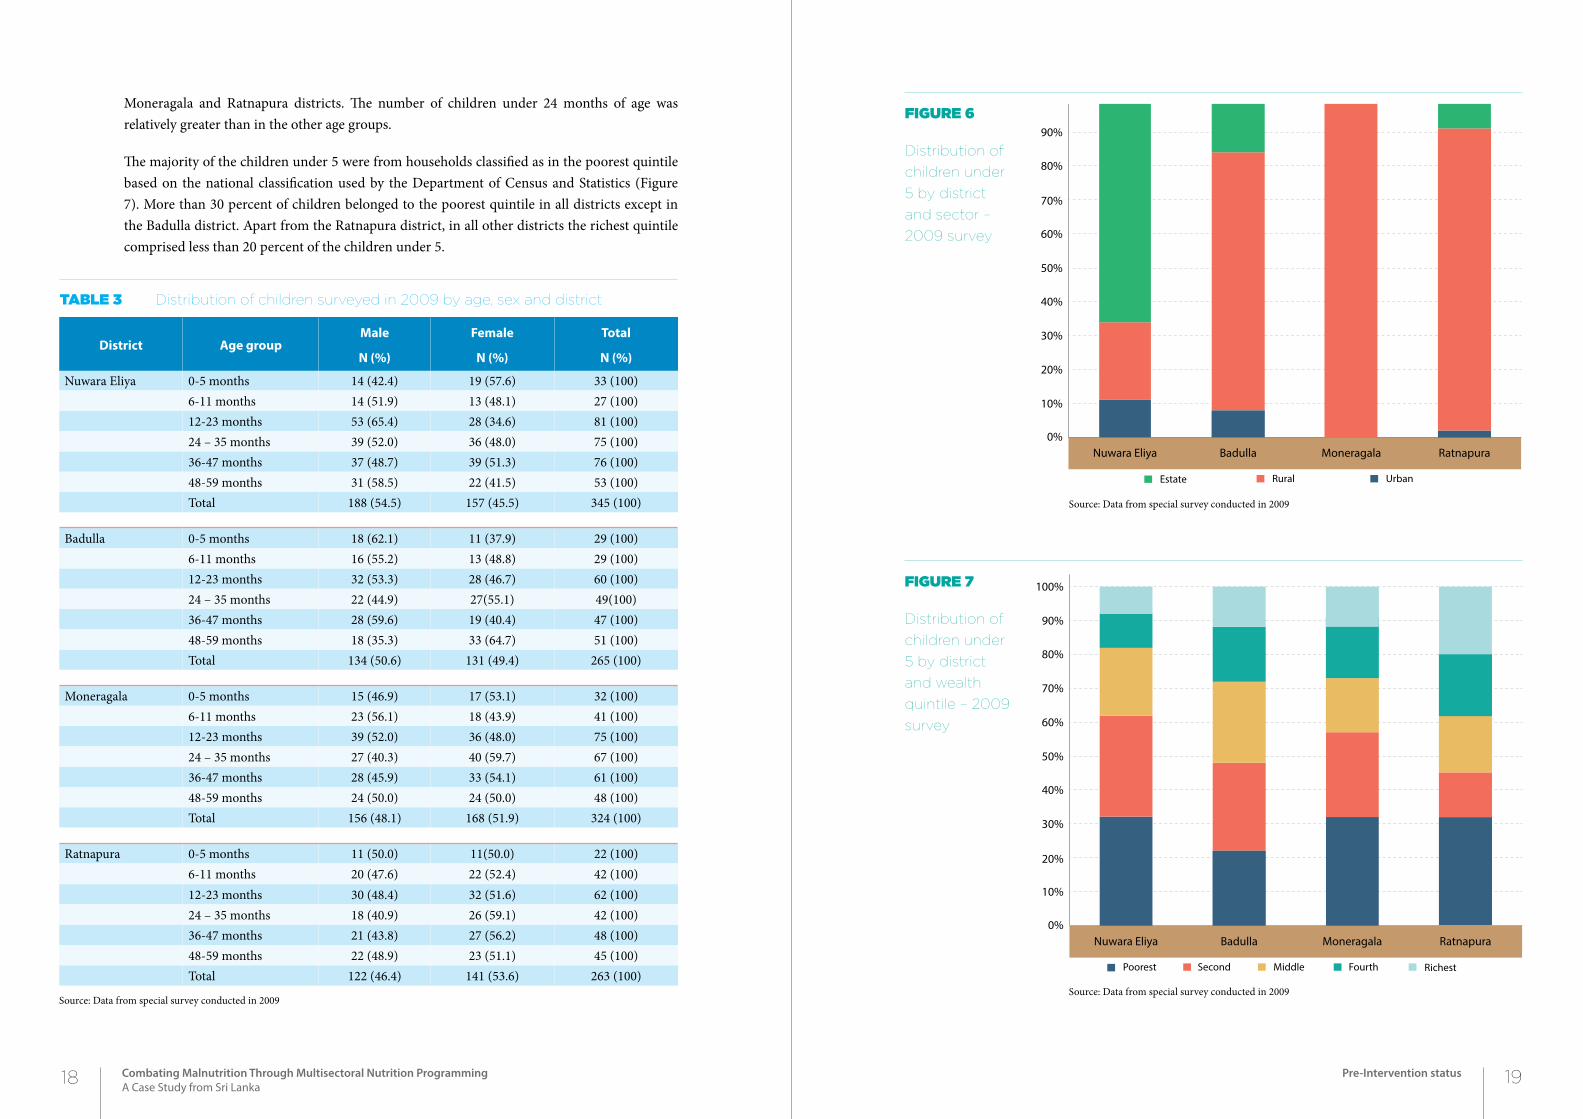
The distribution of children under 5 in the surveyed households in the four districts are given in Table 3.
In all the districts which were considered, the majority comprised the rural sector except in the Nuwara Eliya district where 56 percent of children under 5 were from the estate sector. In the Moneragala district, all children sampled were from the rural sector. The highest urban population was also seen in the Nuwara Eliya district (slightly above 10 percent) (Figure 6). The distribution of children by sector was significantly different in the four districts.
The majority of children in the Nuwara Eliya and Badulla districts were male but not in the
16 17Combating Malnutrition Through Multisectoral Nutrition ProgrammingA Case Study from Sri Lanka
Pre-Intervention status
2Chapter4pre-interVention StAtuS
District Age groupMale
N (%)
Female
N (%)
Total
N (%)
Nuwara Eliya 0-5 months 14 (42.4) 19 (57.6) 33 (100)6-11 months 14 (51.9) 13 (48.1) 27 (100)12-23 months 53 (65.4) 28 (34.6) 81 (100)24 – 35 months 39 (52.0) 36 (48.0) 75 (100)36-47 months 37 (48.7) 39 (51.3) 76 (100)48-59 months 31 (58.5) 22 (41.5) 53 (100)Total 188 (54.5) 157 (45.5) 345 (100)
Badulla 0-5 months 18 (62.1) 11 (37.9) 29 (100)6-11 months 16 (55.2) 13 (48.8) 29 (100)12-23 months 32 (53.3) 28 (46.7) 60 (100)24 – 35 months 22 (44.9) 27(55.1) 49(100)36-47 months 28 (59.6) 19 (40.4) 47 (100)48-59 months 18 (35.3) 33 (64.7) 51 (100)Total 134 (50.6) 131 (49.4) 265 (100)
Moneragala 0-5 months 15 (46.9) 17 (53.1) 32 (100)6-11 months 23 (56.1) 18 (43.9) 41 (100)12-23 months 39 (52.0) 36 (48.0) 75 (100)24 – 35 months 27 (40.3) 40 (59.7) 67 (100)36-47 months 28 (45.9) 33 (54.1) 61 (100)48-59 months 24 (50.0) 24 (50.0) 48 (100)Total 156 (48.1) 168 (51.9) 324 (100)
Ratnapura 0-5 months 11 (50.0) 11(50.0) 22 (100)6-11 months 20 (47.6) 22 (52.4) 42 (100)12-23 months 30 (48.4) 32 (51.6) 62 (100)24 – 35 months 18 (40.9) 26 (59.1) 42 (100)36-47 months 21 (43.8) 27 (56.2) 48 (100)48-59 months 22 (48.9) 23 (51.1) 45 (100)Total 122 (46.4) 141 (53.6) 263 (100)
Source: Data from special survey conducted in 2009
Table 3 Distribution of children surveyed in 2009 by age, sex and district
Figure 6
Distribution of
children under
5 by district
and sector –
2009 survey
Moneragala and Ratnapura districts. The number of children under 24 months of age was relatively greater than in the other age groups.
The majority of the children under 5 were from households classified as in the poorest quintile based on the national classification used by the Department of Census and Statistics (Figure 7). More than 30 percent of children belonged to the poorest quintile in all districts except in the Badulla district. Apart from the Ratnapura district, in all other districts the richest quintile comprised less than 20 percent of the children under 5.
Figure 7
Distribution of
children under
5 by district
and wealth
quintile – 2009
survey
Source: Data from special survey conducted in 2009
Source: Data from special survey conducted in 2009
0%
10%
20%
30%
40%
50%
60%
70%
80%
90%
100%
Nuwara Eliya Badulla Moneragala Ratnapura
Estate Rural Urban
0%
10%
20%
30%
40%
50%
60%
70%
80%
90%
100%
Nuwara Eliya Badulla Moneragala Ratnapura
RichestFourthMiddleSecondPoorest
18 19Combating Malnutrition Through Multisectoral Nutrition ProgrammingA Case Study from Sri Lanka
Pre-Intervention status
4.2 prevaLence of Low birth weight
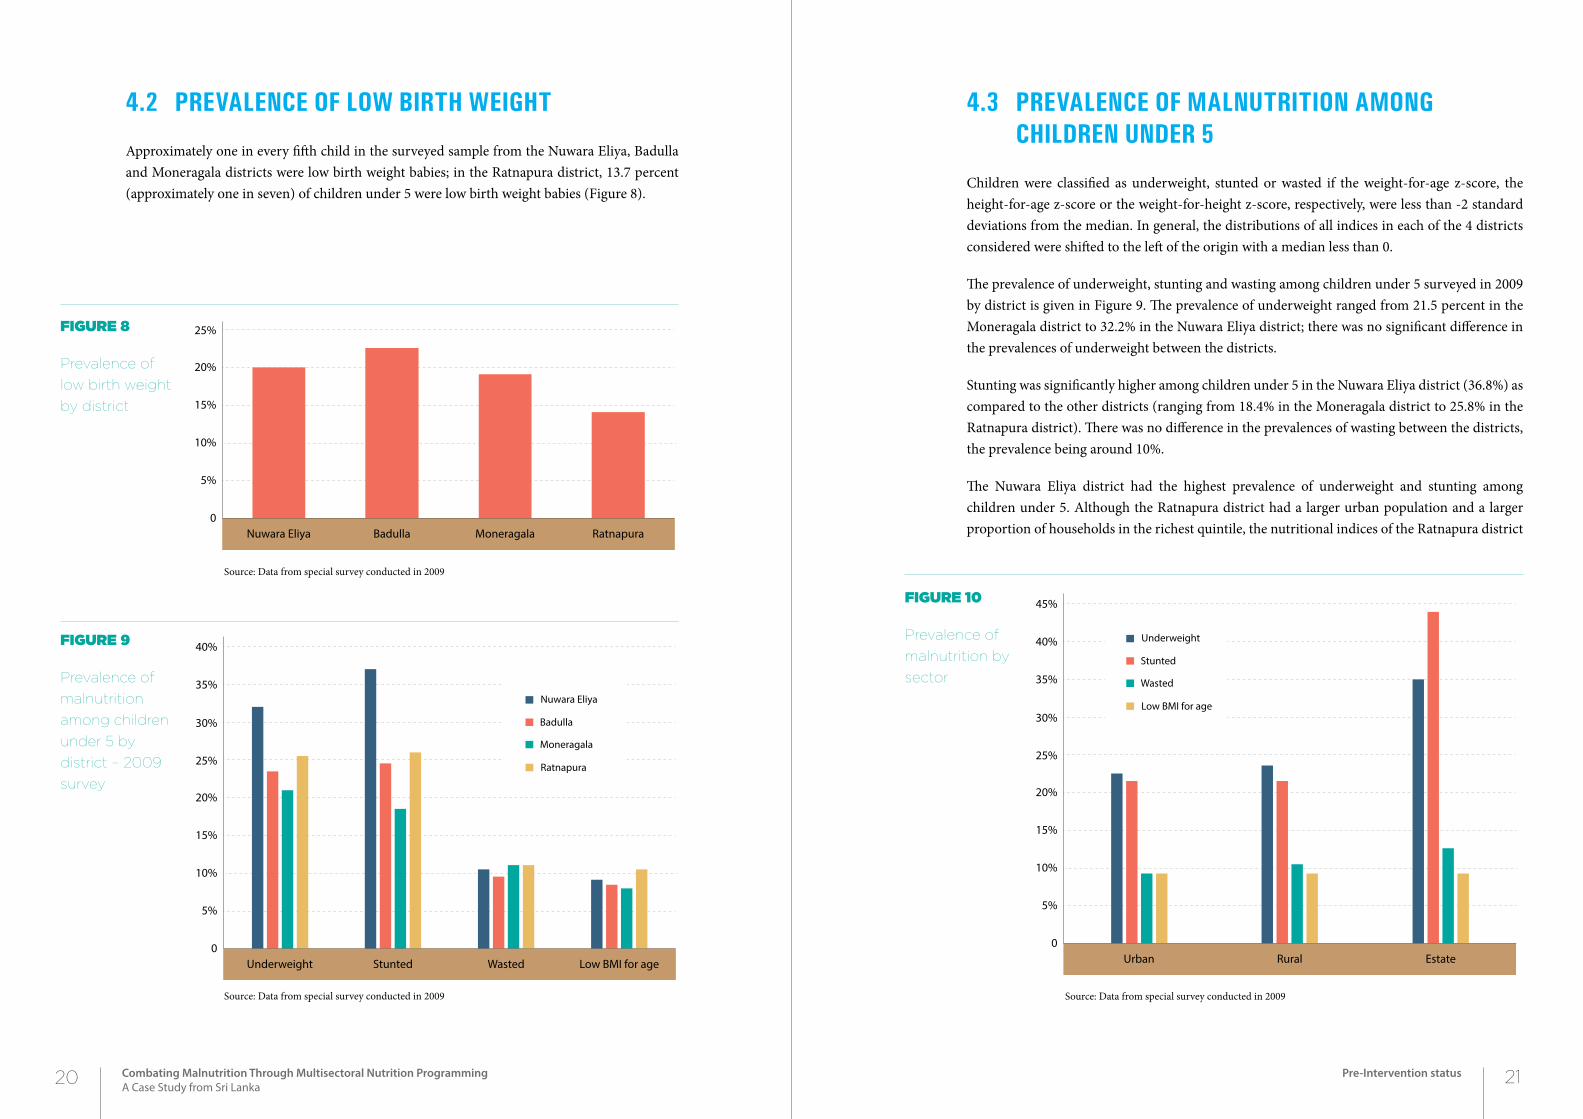
Approximately one in every fifth child in the surveyed sample from the Nuwara Eliya, Badulla and Moneragala districts were low birth weight babies; in the Ratnapura district, 13.7 percent (approximately one in seven) of children under 5 were low birth weight babies (Figure 8).
4.3 prevaLence of maLnutrition among chiLdren under 5
Children were classified as underweight, stunted or wasted if the weight-for-age z-score, the height-for-age z-score or the weight-for-height z-score, respectively, were less than -2 standard deviations from the median. In general, the distributions of all indices in each of the 4 districts considered were shifted to the left of the origin with a median less than 0.
The prevalence of underweight, stunting and wasting among children under 5 surveyed in 2009 by district is given in Figure 9. The prevalence of underweight ranged from 21.5 percent in the Moneragala district to 32.2% in the Nuwara Eliya district; there was no significant difference in the prevalences of underweight between the districts.
Stunting was significantly higher among children under 5 in the Nuwara Eliya district (36.8%) as compared to the other districts (ranging from 18.4% in the Moneragala district to 25.8% in the Ratnapura district). There was no difference in the prevalences of wasting between the districts, the prevalence being around 10%.
The Nuwara Eliya district had the highest prevalence of underweight and stunting among children under 5. Although the Ratnapura district had a larger urban population and a larger proportion of households in the richest quintile, the nutritional indices of the Ratnapura district
Figure 8
Prevalence of
low birth weight
by district
Figure 9
Prevalence of
malnutrition
among children
under 5 by
district – 2009
survey
Source: Data from special survey conducted in 2009
Source: Data from special survey conducted in 2009
Figure 10
Prevalence of
malnutrition by
sector
Source: Data from special survey conducted in 2009
Nuwara Eliya Badulla Moneragala Ratnapura0
5%
10%
15%
20%
25%
Underweight Stunted Wasted Low BMI for age0
5%
10%
15%
20%
25%
30%
35%
40%
Ratnapura
Moneragala
Badulla
Nuwara Eliya
Urban Rural Estate0
5%
10%
15%
20%
25%
30%
35%
40%
45%
Low BMI for age
Wasted
Stunted
Underweight
20 21Combating Malnutrition Through Multisectoral Nutrition ProgrammingA Case Study from Sri Lanka
Pre-Intervention status
were, in general, poorer to those of the Badulla and Moneragala districts which had a smaller urban population and poorer segments of society.
Based on the analysis of the four districts, the prevalence of underweight and stunting was highest in the estate sector (Figure 10). There was no difference in the prevalences of underweight and stunting between the urban and rural sectors; however, national data suggest that there is a difference in the prevalences of underweight and stunting between the urban and rural sectors. The reason why such a difference is not seen in this analysis is probably due to the smaller number of children from the urban sector.
There were no differences in the prevalences of wasting and low BMI for age between the sectors.
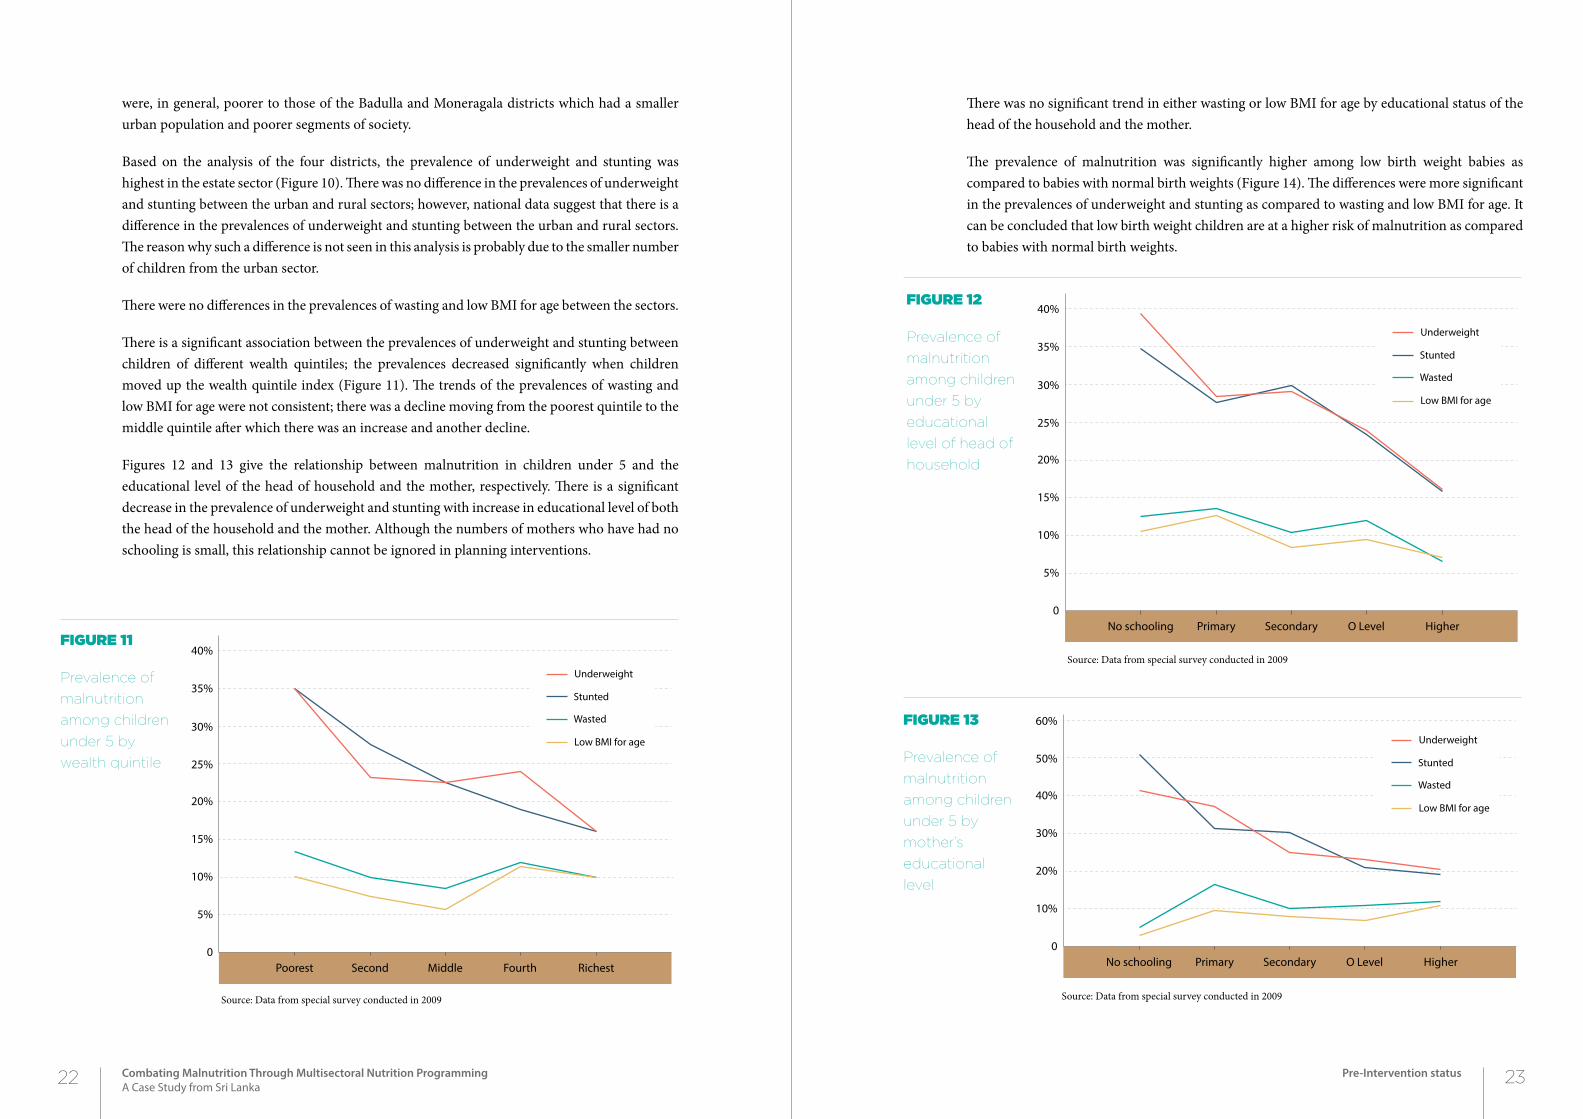
There is a significant association between the prevalences of underweight and stunting between children of different wealth quintiles; the prevalences decreased significantly when children moved up the wealth quintile index (Figure 11). The trends of the prevalences of wasting and low BMI for age were not consistent; there was a decline moving from the poorest quintile to the middle quintile after which there was an increase and another decline.
Figures 12 and 13 give the relationship between malnutrition in children under 5 and the educational level of the head of household and the mother, respectively. There is a significant decrease in the prevalence of underweight and stunting with increase in educational level of both the head of the household and the mother. Although the numbers of mothers who have had no schooling is small, this relationship cannot be ignored in planning interventions.
There was no significant trend in either wasting or low BMI for age by educational status of the head of the household and the mother.
The prevalence of malnutrition was significantly higher among low birth weight babies as compared to babies with normal birth weights (Figure 14). The differences were more significant in the prevalences of underweight and stunting as compared to wasting and low BMI for age. It can be concluded that low birth weight children are at a higher risk of malnutrition as compared to babies with normal birth weights.
Figure 11
Prevalence of
malnutrition
among children
under 5 by
wealth quintile
Source: Data from special survey conducted in 2009
Figure 12
Prevalence of
malnutrition
among children
under 5 by
educational
level of head of
household
Source: Data from special survey conducted in 2009
Figure 13
Prevalence of
malnutrition
among children
under 5 by
mother’s
educational
level
Source: Data from special survey conducted in 2009
Poorest Second Middle Fourth Richest0
5%
10%
15%
20%
25%
30%
35%
40%
Low BMI for age
Wasted
Stunted
Underweight
No schooling Primary Secondary O Level Higher0
5%
10%
15%
20%
25%
30%
35%
40%
Low BMI for age
Wasted
Stunted
Underweight
No schooling Primary Secondary O Level Higher0
10%
20%
30%
40%
50%
60%
Low BMI for age
Wasted
Stunted
Underweight
22 23Combating Malnutrition Through Multisectoral Nutrition ProgrammingA Case Study from Sri Lanka
Pre-Intervention status
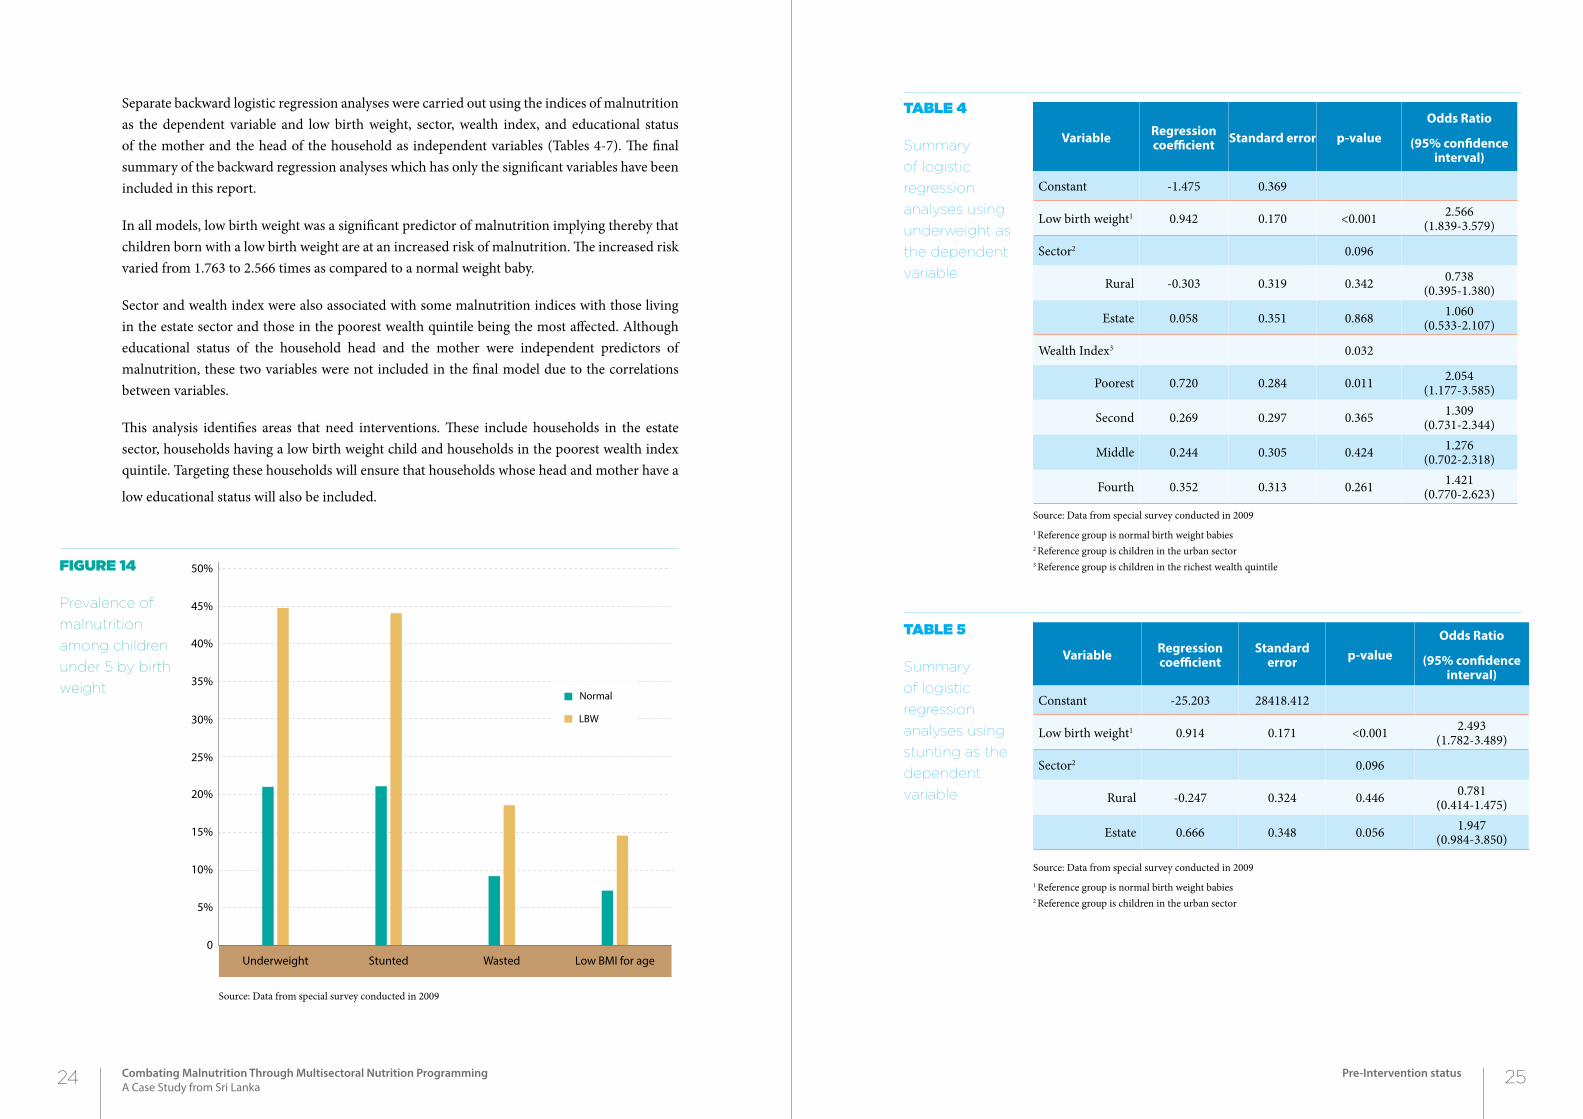
Separate backward logistic regression analyses were carried out using the indices of malnutrition as the dependent variable and low birth weight, sector, wealth index, and educational status of the mother and the head of the household as independent variables (Tables 4-7). The final summary of the backward regression analyses which has only the significant variables have been included in this report.
In all models, low birth weight was a significant predictor of malnutrition implying thereby that children born with a low birth weight are at an increased risk of malnutrition. The increased risk varied from 1.763 to 2.566 times as compared to a normal weight baby.
Sector and wealth index were also associated with some malnutrition indices with those living in the estate sector and those in the poorest wealth quintile being the most affected. Although educational status of the household head and the mother were independent predictors of malnutrition, these two variables were not included in the final model due to the correlations between variables.
This analysis identifies areas that need interventions. These include households in the estate sector, households having a low birth weight child and households in the poorest wealth index quintile. Targeting these households will ensure that households whose head and mother have a
low educational status will also be included.
Figure 14
Prevalence of
malnutrition
among children
under 5 by birth
weight
Source: Data from special survey conducted in 2009
Variable Regression coefficient Standard error p-value
Odds Ratio
(95% confidence interval)
Constant -1.475 0.369
Low birth weight1 0.942 0.170 <0.001 2.566(1.839-3.579)
Sector2 0.096
Rural -0.303 0.319 0.342 0.738(0.395-1.380)
Estate 0.058 0.351 0.868 1.060(0.533-2.107)
Wealth Index3 0.032
Poorest 0.720 0.284 0.011 2.054(1.177-3.585)
Second 0.269 0.297 0.365 1.309(0.731-2.344)
Middle 0.244 0.305 0.424 1.276(0.702-2.318)
Fourth 0.352 0.313 0.261 1.421(0.770-2.623)
Source: Data from special survey conducted in 20091 Reference group is normal birth weight babies2 Reference group is children in the urban sector3 Reference group is children in the richest wealth quintile
Table 4
Summary
of logistic
regression
analyses using
underweight as
the dependent
variable
Table 5
Summary
of logistic
regression
analyses using
stunting as the
dependent
variable
Variable Regression coefficient
Standard error p-value
Odds Ratio
(95% confidence interval)
Constant -25.203 28418.412
Low birth weight1 0.914 0.171 <0.001 2.493(1.782-3.489)
Sector2 0.096
Rural -0.247 0.324 0.446 0.781(0.414-1.475)
Estate 0.666 0.348 0.056 1.947(0.984-3.850)
Source: Data from special survey conducted in 20091 Reference group is normal birth weight babies2 Reference group is children in the urban sector
Underweight Stunted Wasted Low BMI for age0
5%
10%
15%
20%
25%
30%
35%
40%
45%
50%
LBW
Normal
24 25Combating Malnutrition Through Multisectoral Nutrition ProgrammingA Case Study from Sri Lanka
Pre-Intervention status
Once the eligible families were identified, the targeted custom interventions were designed that would have an impact on the individual families. Interventions that were offered were not only restricted to the health sector but other sectors as well. The interventions were carried out from July 2010 onwards.
5.1 interventions reLated to the heaLth sector
Interventions related to the health sector included nutritional related behaviour change communication, empowering communities regarding correct child care practices and monitoring and evaluation.
Behaviour change communication focused on the following:
• Hygienic practices such as washing of hands with soap after defecation
• Use of locally available cheap ingredients
• Preparation of healthy meals
• Correct child care and feeding practices
Table 7
Summary
of logistic
regression
analyses using
BMI for age as
the dependent
variable
Table 6
Summary
of logistic
regression
analyses using
wasting as the
dependent
variable
Variable Regression coefficient Standard error p-value
Odds Ratio
(95% confidence interval)
Constant -2.064 0.116
Low birth weight1 0.533 0.258 0.039 1.763(1.028-2.822)
Wealth Index2 0.073
Poorest -0.318 0.345 0.356 0.727(0.370-1.431)
Second -0.555 0.373 0.137 0.574(0.276-1.193)
Middle -1.231 0.461 0.008 0.292(0.118-0.720)
Fourth -0.180 0.384 0.639 0.835(0.393-1.773)
Source: Data from special survey conducted in 20091 Reference group is normal birth weight babies2 Reference group is children in the richest wealth quintile
Variable Regression coefficient Standard error p-value
Odds Ratio
(95% confidence interval)
Constant -2.228 0.116
Low birth weight1 0.587 0.225 0.009 1.799(1.157-2.797)
Source: Data from special survey conducted in 20091 Reference group is normal birth weight babies
26 27Combating Malnutrition Through Multisectoral Nutrition ProgrammingA Case Study from Sri Lanka
Intervention
2Chapter5
interVention
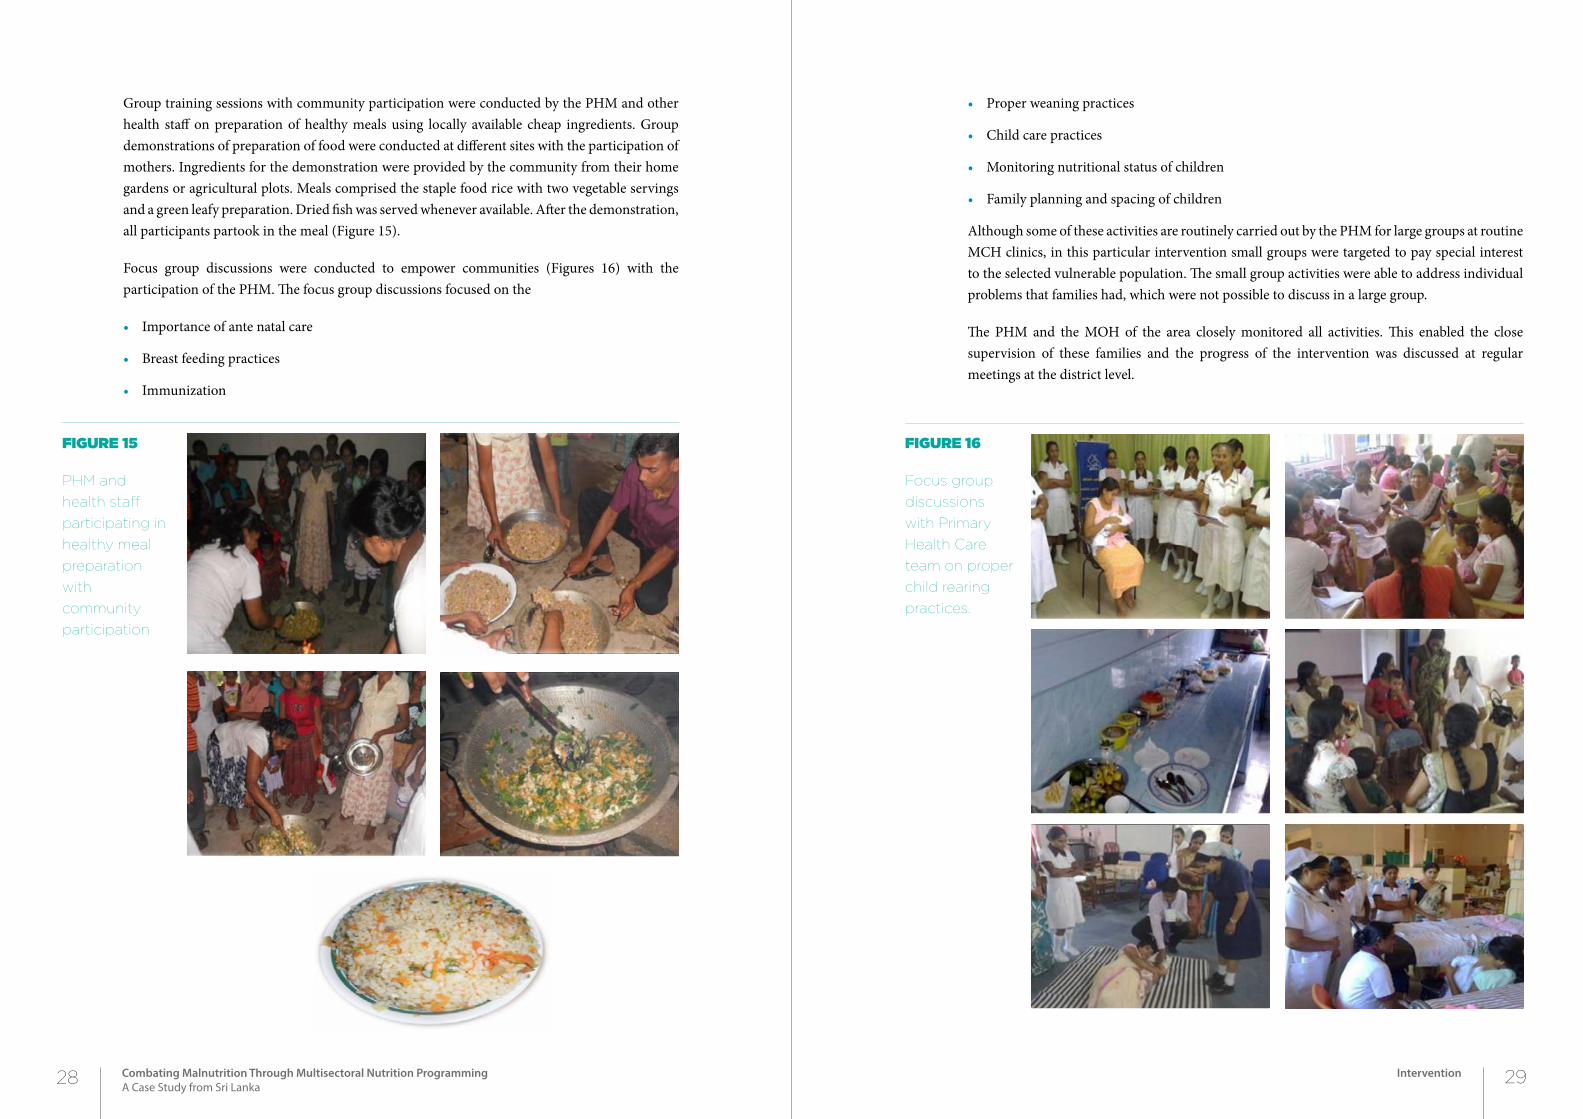
Group training sessions with community participation were conducted by the PHM and other health staff on preparation of healthy meals using locally available cheap ingredients. Group demonstrations of preparation of food were conducted at different sites with the participation of mothers. Ingredients for the demonstration were provided by the community from their home gardens or agricultural plots. Meals comprised the staple food rice with two vegetable servings and a green leafy preparation. Dried fish was served whenever available. After the demonstration, all participants partook in the meal (Figure 15).
Focus group discussions were conducted to empower communities (Figures 16) with the participation of the PHM. The focus group discussions focused on the
• Importance of ante natal care
• Breast feeding practices
• Immunization
• Proper weaning practices
• Child care practices
• Monitoring nutritional status of children
• Family planning and spacing of children
Although some of these activities are routinely carried out by the PHM for large groups at routine MCH clinics, in this particular intervention small groups were targeted to pay special interest to the selected vulnerable population. The small group activities were able to address individual problems that families had, which were not possible to discuss in a large group.
The PHM and the MOH of the area closely monitored all activities. This enabled the close supervision of these families and the progress of the intervention was discussed at regular meetings at the district level.
Figure 15
PHM and
health staff
participating in
healthy meal
preparation
with
community
participation
Figure 16
Focus group
discussions
with Primary
Health Care
team on proper
child rearing
practices.
28 29Combating Malnutrition Through Multisectoral Nutrition ProgrammingA Case Study from Sri Lanka
Intervention
5.2 interventions in other sectors
A number of interventions were provided through other sectors such as the departments of Ayurveda, Agriculture and livestock development, Samurdhi officers, Education etc. The interventions that were carried out included ones that are routinely available to the general public through various government departments but which are not properly targeted or which the public are ignorant about. Thus, there were no additional investment or funds required for the interventions. The interventions included
• Awareness programmes on home gardening and provision of vegetable and fruit seeds. These were coordinated by the PHM and Agriculture Extension Officers were invited to address the communities. In addition to advising on home gardening practices and man-agement, various fruit and vegetable seeds were provided to families. Additional visits were made by the Agriculture Extension Officers to monitor progress.
• Assistance to construct sanitary toilets.
This was facilitated by the Public Health Inspector of the area and the Medical Officer of Health.
• Provision of Samurdhi stamps
Samurdhi benefits were given to families that had a very low income. A maximum of Rs 1500.00 were provided to families.
• Provision of water pumps.
This was facilitated through the Departments of Agriculture and Social Services. Families having plots of land and were engaged in agricultural work were presented with water pumps.
• Provision of sewing machines for self employment activities.
This was facilitated through the Samurdhi officers and the Social Services Department. Females who had been trained in sewing were presented with sewing machines.
• Provision of milk cows and chicks
The livestock was provided by the National Livestock Development Board. Advice was given to recipients on how to manage and maintain the livestock.
• Provision of agricultural lands
This was facilitated through Grama Niladhari officers, the District Secretariat and the Chief Minister.
• Assistance in re-enrolling children who had dropped out of school.
The Zonal Education Officers in the area facilitated this process after having discussions with the school principals in the area.
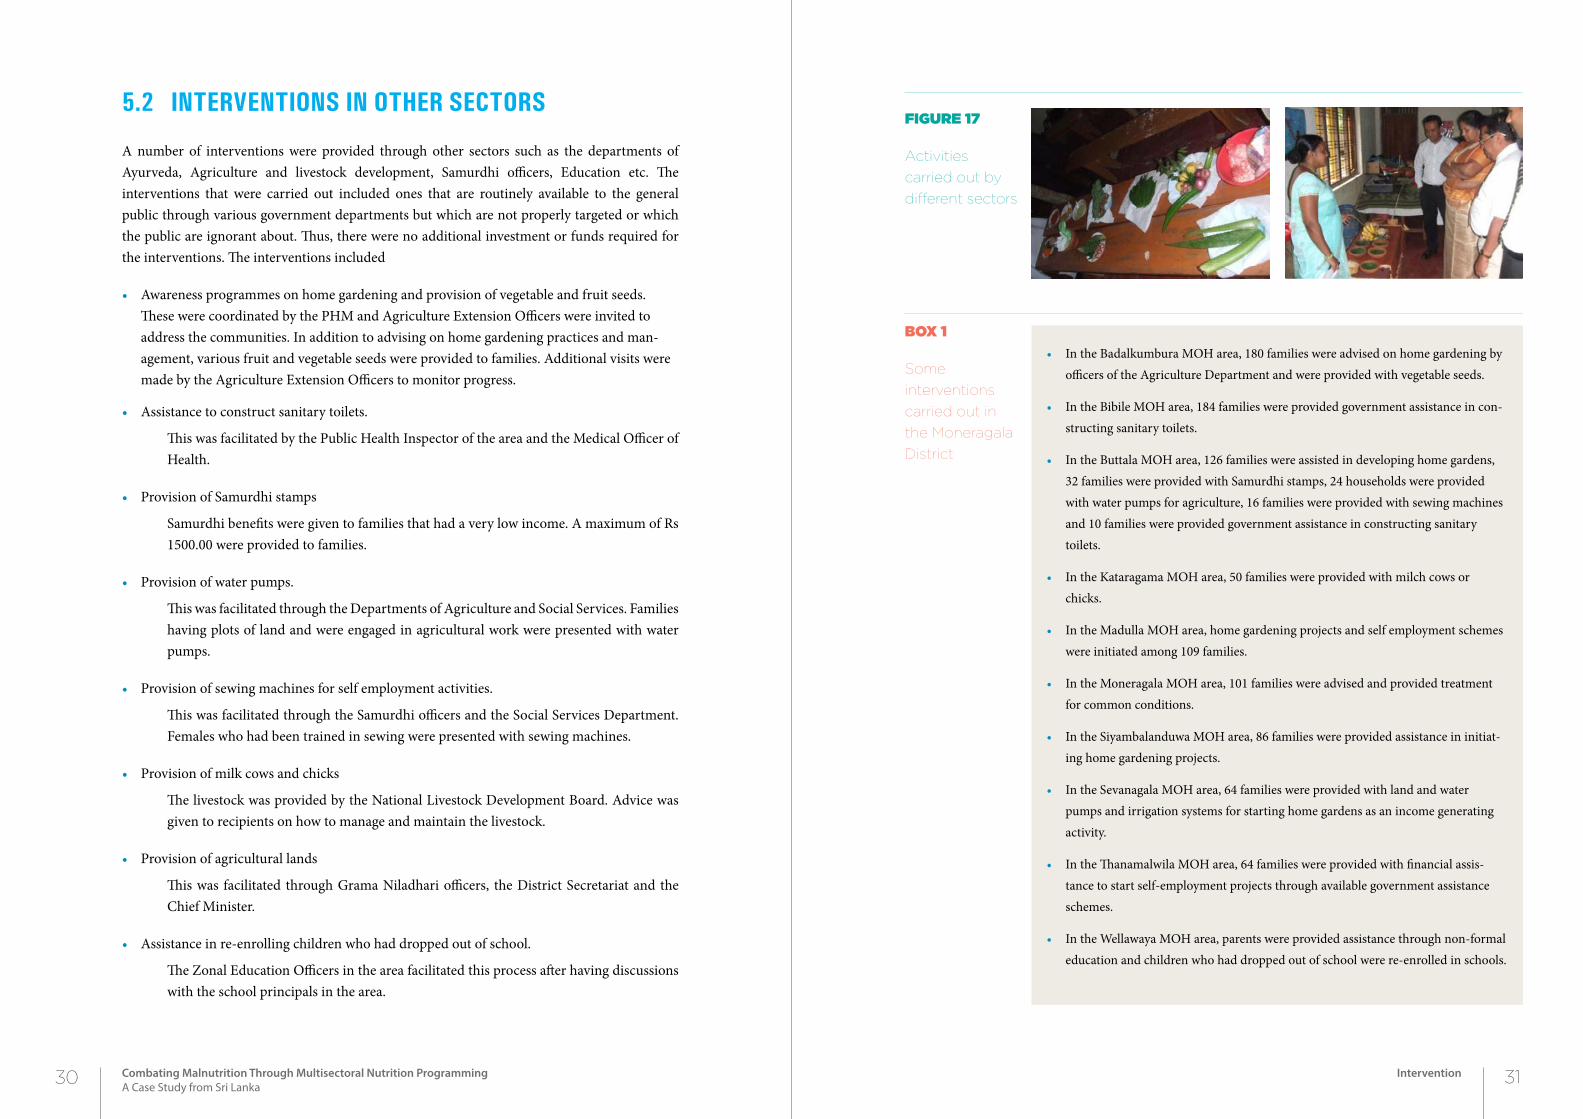
Figure 17
Activities
carried out by
different sectors
• In the Badalkumbura MOH area, 180 families were advised on home gardening by officers of the Agriculture Department and were provided with vegetable seeds.
• In the Bibile MOH area, 184 families were provided government assistance in con-structing sanitary toilets.
• In the Buttala MOH area, 126 families were assisted in developing home gardens, 32 families were provided with Samurdhi stamps, 24 households were provided with water pumps for agriculture, 16 families were provided with sewing machines and 10 families were provided government assistance in constructing sanitary toilets.
• In the Kataragama MOH area, 50 families were provided with milch cows or chicks.
• In the Madulla MOH area, home gardening projects and self employment schemes were initiated among 109 families.
• In the Moneragala MOH area, 101 families were advised and provided treatment for common conditions.
• In the Siyambalanduwa MOH area, 86 families were provided assistance in initiat-ing home gardening projects.
• In the Sevanagala MOH area, 64 families were provided with land and water pumps and irrigation systems for starting home gardens as an income generating activity.
• In the Thanamalwila MOH area, 64 families were provided with financial assis-tance to start self-employment projects through available government assistance schemes.
• In the Wellawaya MOH area, parents were provided assistance through non-formal education and children who had dropped out of school were re-enrolled in schools.
box 1
Some
interventions
carried out in
the Moneragala
District
30 31Combating Malnutrition Through Multisectoral Nutrition ProgrammingA Case Study from Sri Lanka
Intervention
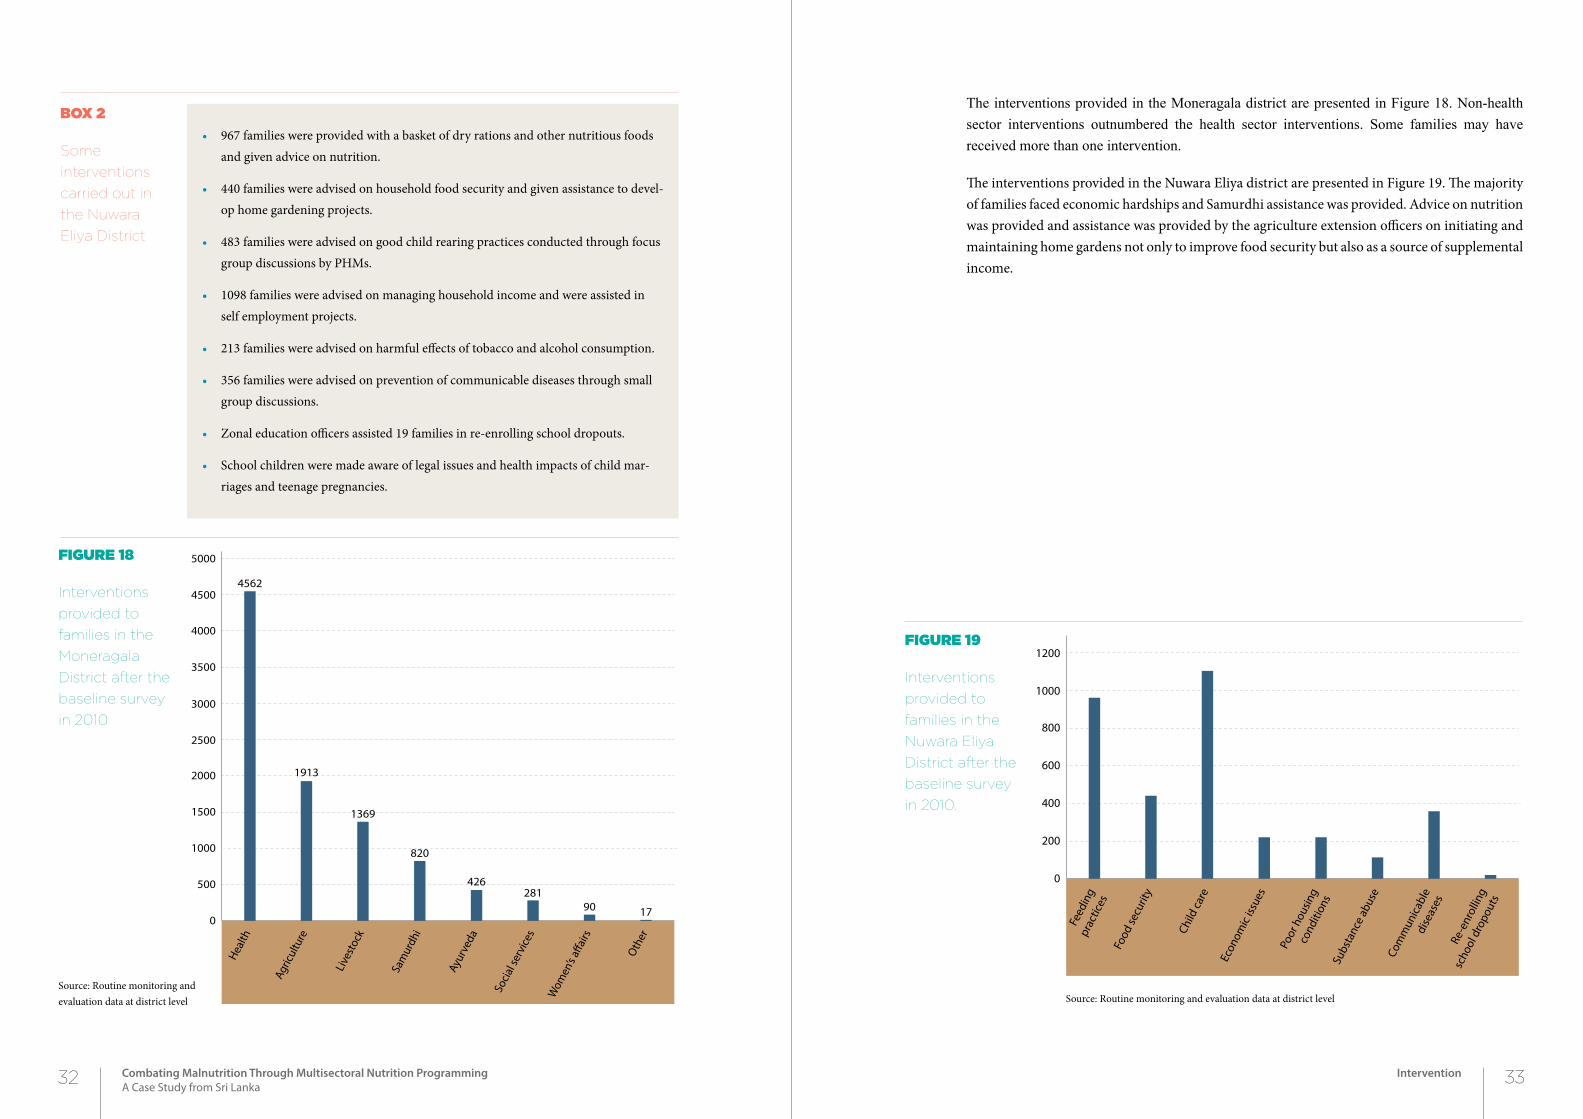
The interventions provided in the Moneragala district are presented in Figure 18. Non-health sector interventions outnumbered the health sector interventions. Some families may have received more than one intervention.
The interventions provided in the Nuwara Eliya district are presented in Figure 19. The majority of families faced economic hardships and Samurdhi assistance was provided. Advice on nutrition was provided and assistance was provided by the agriculture extension officers on initiating and maintaining home gardens not only to improve food security but also as a source of supplemental income.
• 967 families were provided with a basket of dry rations and other nutritious foods and given advice on nutrition.
• 440 families were advised on household food security and given assistance to devel-op home gardening projects.
• 483 families were advised on good child rearing practices conducted through focus group discussions by PHMs.
• 1098 families were advised on managing household income and were assisted in self employment projects.
• 213 families were advised on harmful effects of tobacco and alcohol consumption.
• 356 families were advised on prevention of communicable diseases through small group discussions.
• Zonal education officers assisted 19 families in re-enrolling school dropouts.
• School children were made aware of legal issues and health impacts of child mar-riages and teenage pregnancies.
box 2
Some
interventions
carried out in
the Nuwara
Eliya District
Figure 18
Interventions
provided to
families in the
Moneragala
District after the
baseline survey
in 2010
Figure 19
Interventions
provided to
families in the
Nuwara Eliya
District after the
baseline survey
in 2010.
Source: Routine monitoring and evaluation data at district level Source: Routine monitoring and evaluation data at district level
Health
Agric
ultu
re
Live
stoc
k
Sam
urdh
i
Ayur
veda
Socia
l ser
vice
s
Wom
en’s
a�ai
rs
Oth
er
0
500
1000
1500
2000
2500
3000
3500
4000
4500
5000
4562
1913
1369
820
426281
90 17
Feed
ing
prac
tices
Food
secu
rity
Child
care
Econ
omic
issue
s
Poor
hou
sing
cond
ition
sSu
bsta
nce
abus
eCo
mm
unica
ble
dise
ases
Re-e
nrol
ling
scho
ol d
ropo
uts
0
200
400
600
800
1000
1200
32 33Combating Malnutrition Through Multisectoral Nutrition ProgrammingA Case Study from Sri Lanka
Intervention
In 2012, a survey was carried out in the same selected districts as in 2009. The distribution of children by district is given in Table 8. There was approximately an equal number of males and females.
The majority of children were from the rural sector (Figure 20). The Badulla district alone had children from the urban sector. The Nuwara Eliya district had the largest percentage of children from the estate sector followed by the Badulla and Ratnapura districts. The Moneragala district had only children from the rural sector. The distribution of children within districts in the 2012 survey was different to that of the 2009 survey. In the 2009 survey, there was a higher percentage of children from the estate sector and a higher percentage of children from the urban sector in the Nuwara Eliya, Badulla and Ratnapura districts.
In contrast to the distribution of children by wealth quintile in 2009, in the 2012 survey there was a higher percentage of children from the higher wealth quintiles among children in Nuwara Eliya (Figure 21). This may be attributed to the lower percentage of estate sector children included in the 2012 survey as compared to the 2009 survey. As in 2009, Ratnapura district had the highest percentage of children in the richest wealth quintile and Moneragala district had the highest percentage of children in the poorest wealth quintile.
34 35Combating Malnutrition Through Multisectoral Nutrition ProgrammingA Case Study from Sri Lanka
Post intervention status
2Chapter
poSt interVention StAtuS
6
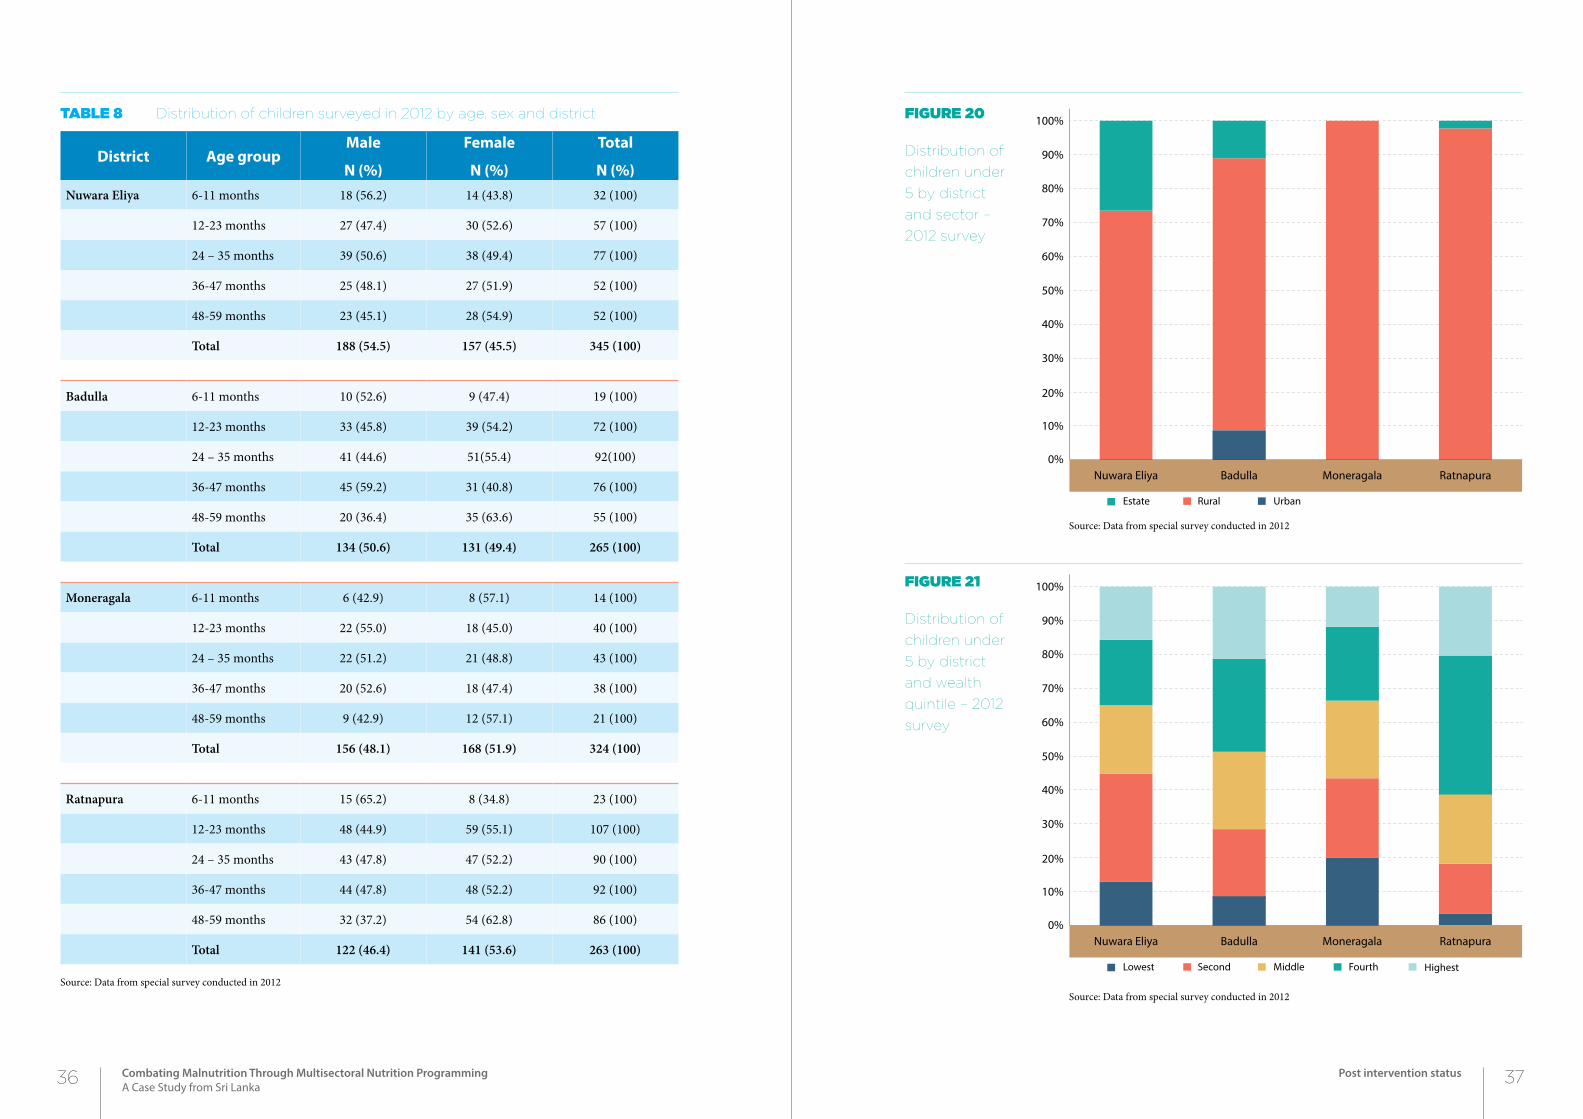
Table 8 Distribution of children surveyed in 2012 by age, sex and district
District Age groupMale
N (%)
Female
N (%)
Total
N (%)Nuwara Eliya 6-11 months 18 (56.2) 14 (43.8) 32 (100)
12-23 months 27 (47.4) 30 (52.6) 57 (100)
24 – 35 months 39 (50.6) 38 (49.4) 77 (100)
36-47 months 25 (48.1) 27 (51.9) 52 (100)
48-59 months 23 (45.1) 28 (54.9) 52 (100)
Total 188 (54.5) 157 (45.5) 345 (100)
Badulla 6-11 months 10 (52.6) 9 (47.4) 19 (100)
12-23 months 33 (45.8) 39 (54.2) 72 (100)
24 – 35 months 41 (44.6) 51(55.4) 92(100)
36-47 months 45 (59.2) 31 (40.8) 76 (100)
48-59 months 20 (36.4) 35 (63.6) 55 (100)
Total 134 (50.6) 131 (49.4) 265 (100)
Moneragala 6-11 months 6 (42.9) 8 (57.1) 14 (100)
12-23 months 22 (55.0) 18 (45.0) 40 (100)
24 – 35 months 22 (51.2) 21 (48.8) 43 (100)
36-47 months 20 (52.6) 18 (47.4) 38 (100)
48-59 months 9 (42.9) 12 (57.1) 21 (100)
Total 156 (48.1) 168 (51.9) 324 (100)
Ratnapura 6-11 months 15 (65.2) 8 (34.8) 23 (100)
12-23 months 48 (44.9) 59 (55.1) 107 (100)
24 – 35 months 43 (47.8) 47 (52.2) 90 (100)
36-47 months 44 (47.8) 48 (52.2) 92 (100)
48-59 months 32 (37.2) 54 (62.8) 86 (100)
Total 122 (46.4) 141 (53.6) 263 (100)
Source: Data from special survey conducted in 2012
Figure 20
Distribution of
children under
5 by district
and sector –
2012 survey
Figure 21
Distribution of
children under
5 by district
and wealth
quintile – 2012
survey
Source: Data from special survey conducted in 2012
Source: Data from special survey conducted in 2012
0%
10%
20%
30%
40%
50%
60%
70%
80%
90%
100%
Nuwara Eliya Badulla Moneragala Ratnapura
UrbanRuralEstate
0%
10%
20%
30%
40%
50%
60%
70%
80%
90%
100%
Nuwara Eliya Badulla Moneragala Ratnapura
HighestFourthMiddleSecondLowest
36 37Combating Malnutrition Through Multisectoral Nutrition ProgrammingA Case Study from Sri Lanka
Post intervention status
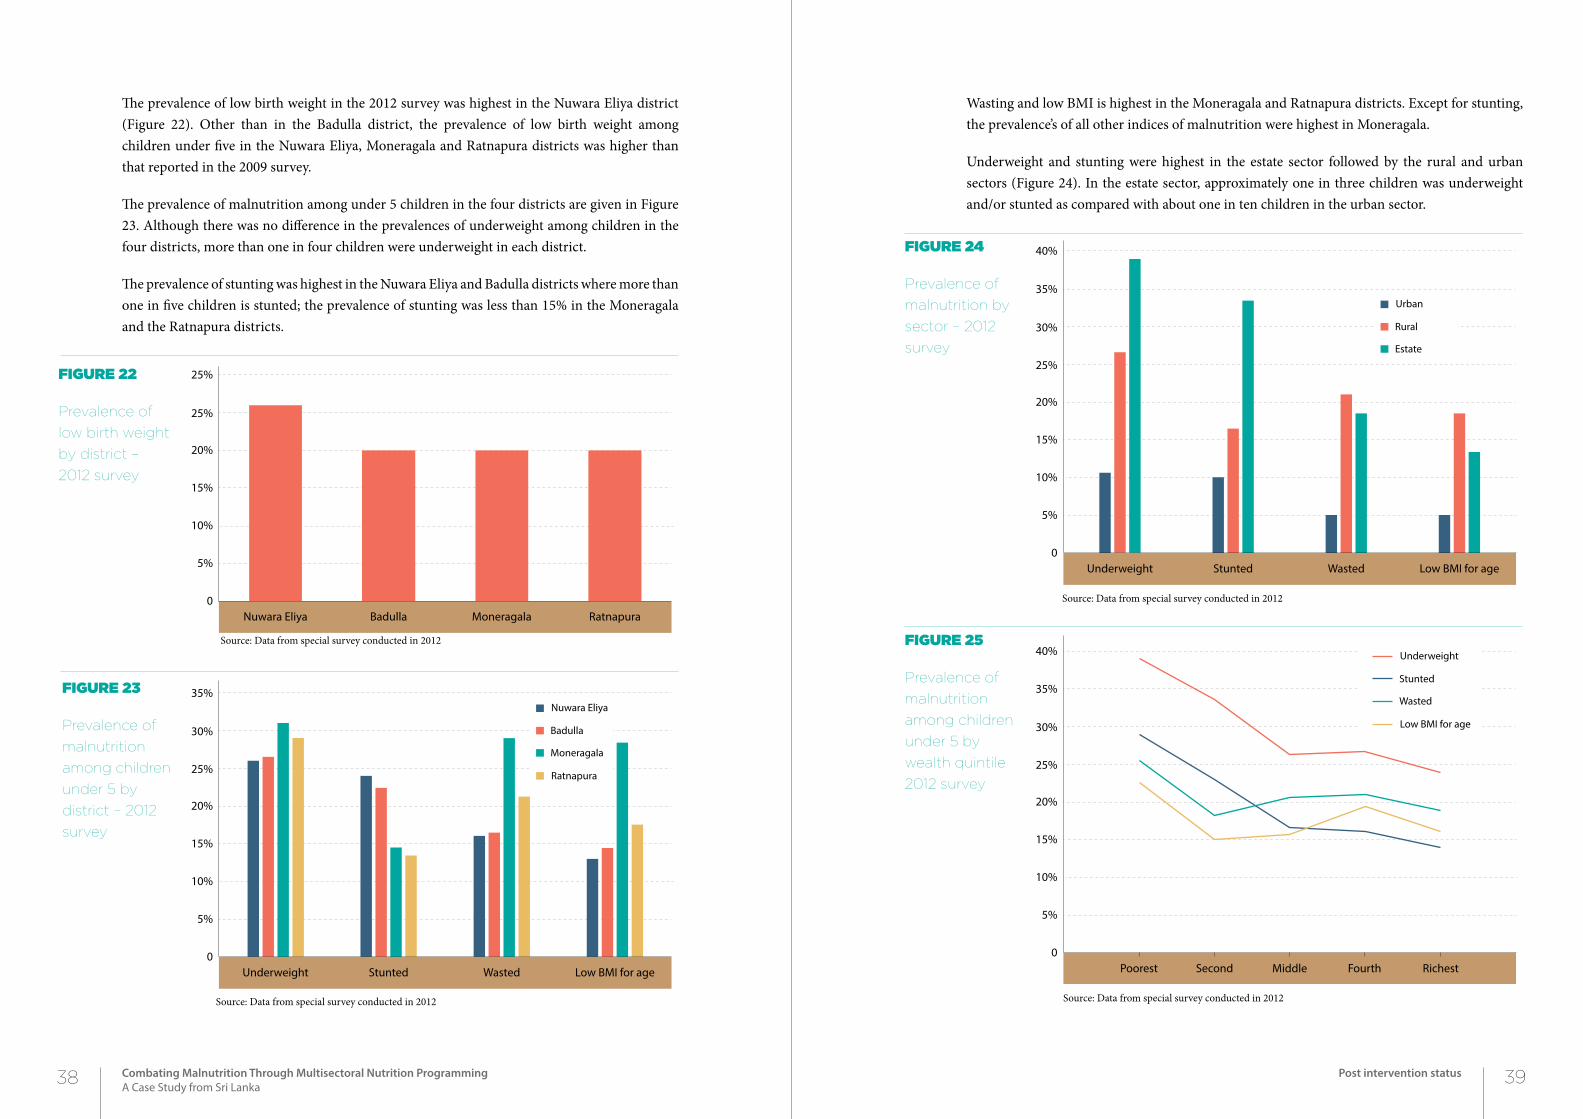
The prevalence of low birth weight in the 2012 survey was highest in the Nuwara Eliya district (Figure 22). Other than in the Badulla district, the prevalence of low birth weight among children under five in the Nuwara Eliya, Moneragala and Ratnapura districts was higher than that reported in the 2009 survey.
The prevalence of malnutrition among under 5 children in the four districts are given in Figure 23. Although there was no difference in the prevalences of underweight among children in the four districts, more than one in four children were underweight in each district.
The prevalence of stunting was highest in the Nuwara Eliya and Badulla districts where more than one in five children is stunted; the prevalence of stunting was less than 15% in the Moneragala and the Ratnapura districts.
Wasting and low BMI is highest in the Moneragala and Ratnapura districts. Except for stunting, the prevalence’s of all other indices of malnutrition were highest in Moneragala.
Underweight and stunting were highest in the estate sector followed by the rural and urban sectors (Figure 24). In the estate sector, approximately one in three children was underweight and/or stunted as compared with about one in ten children in the urban sector.
Figure 22
Prevalence of
low birth weight
by district –
2012 survey
Figure 23
Prevalence of
malnutrition
among children
under 5 by
district – 2012
survey
Figure 24
Prevalence of
malnutrition by
sector – 2012
survey
Figure 25
Prevalence of
malnutrition
among children
under 5 by
wealth quintile
2012 survey
Source: Data from special survey conducted in 2012
Source: Data from special survey conducted in 2012 Source: Data from special survey conducted in 2012
Source: Data from special survey conducted in 2012
Nuwara Eliya Badulla Moneragala Ratnapura0
5%
10%
15%
20%
25%
25%
Underweight Stunted Wasted Low BMI for age0
5%
10%
15%
20%
25%
30%
35%
Ratnapura
Moneragala
Badulla
Nuwara Eliya
Underweight Stunted Wasted Low BMI for age0
5%
10%
15%
20%
25%
30%
35%
40%
Estate
Rural
Urban
Poorest Second Middle Fourth Richest0
5%
10%
15%
20%
25%
30%
35%
40%
Low BMI for age
Wasted
Stunted
Underweight
38 39Combating Malnutrition Through Multisectoral Nutrition ProgrammingA Case Study from Sri Lanka
Post intervention status
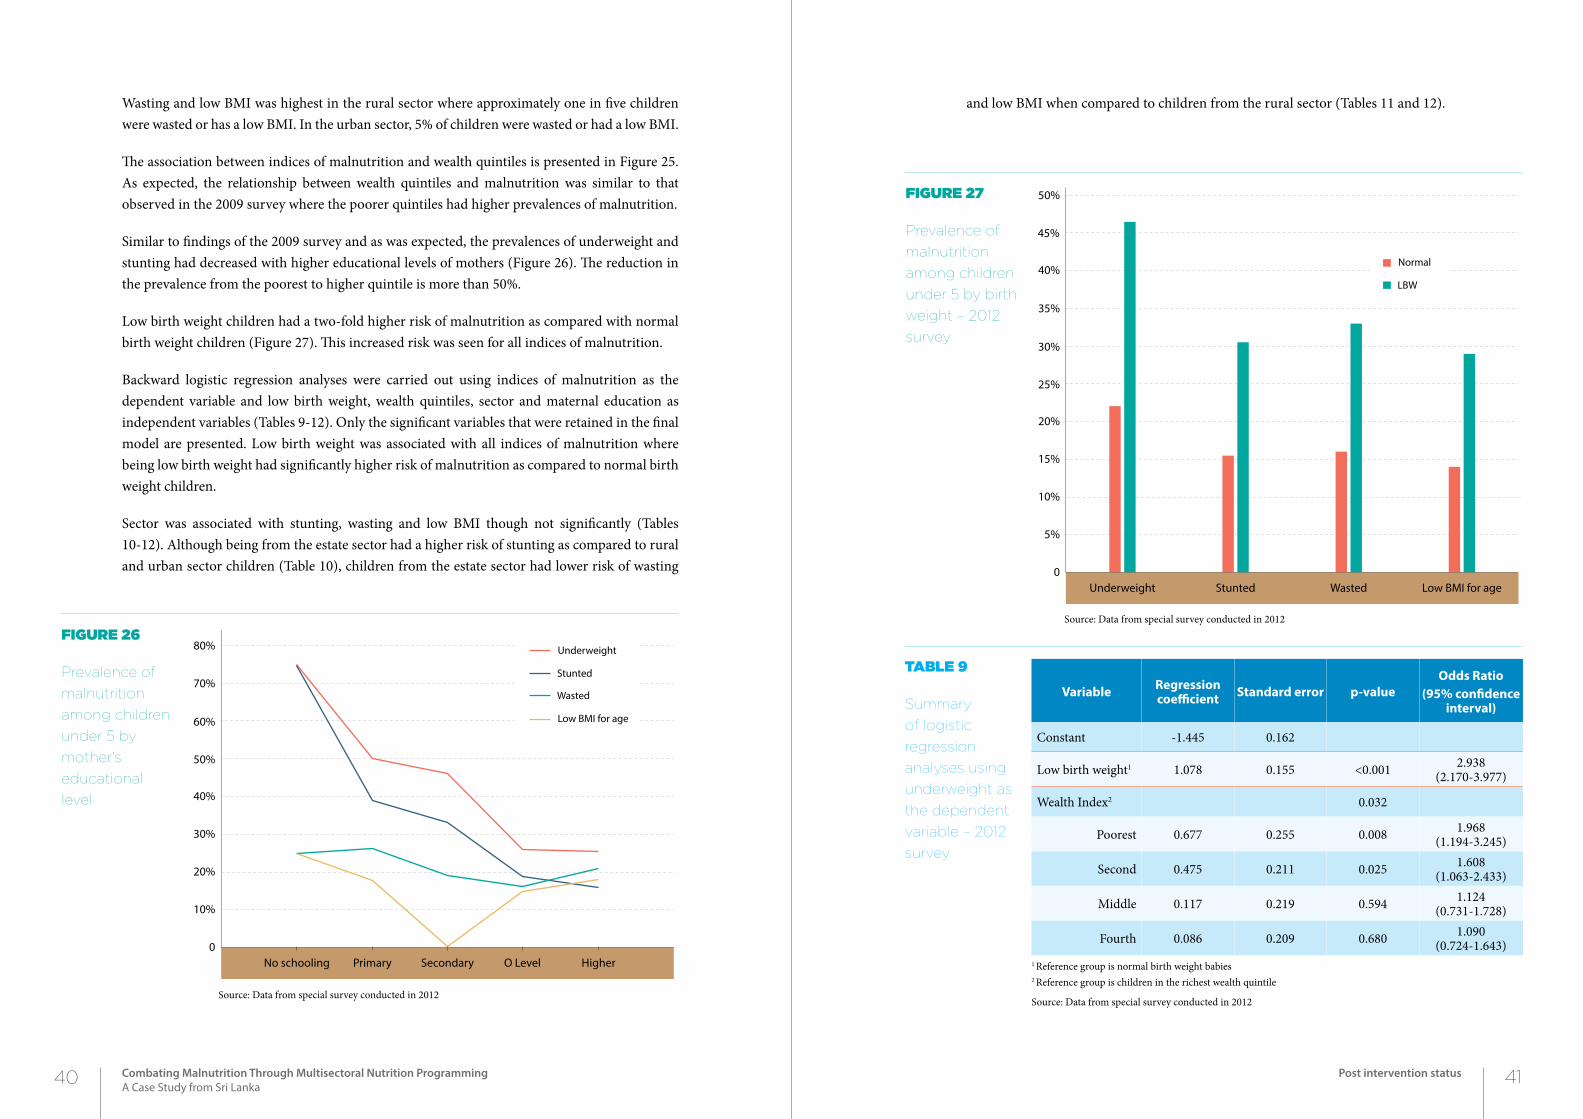
Wasting and low BMI was highest in the rural sector where approximately one in five children were wasted or has a low BMI. In the urban sector, 5% of children were wasted or had a low BMI.
The association between indices of malnutrition and wealth quintiles is presented in Figure 25. As expected, the relationship between wealth quintiles and malnutrition was similar to that observed in the 2009 survey where the poorer quintiles had higher prevalences of malnutrition.
Similar to findings of the 2009 survey and as was expected, the prevalences of underweight and stunting had decreased with higher educational levels of mothers (Figure 26). The reduction in the prevalence from the poorest to higher quintile is more than 50%.
Low birth weight children had a two-fold higher risk of malnutrition as compared with normal birth weight children (Figure 27). This increased risk was seen for all indices of malnutrition.
Backward logistic regression analyses were carried out using indices of malnutrition as the dependent variable and low birth weight, wealth quintiles, sector and maternal education as independent variables (Tables 9-12). Only the significant variables that were retained in the final model are presented. Low birth weight was associated with all indices of malnutrition where being low birth weight had significantly higher risk of malnutrition as compared to normal birth weight children.
Sector was associated with stunting, wasting and low BMI though not significantly (Tables 10-12). Although being from the estate sector had a higher risk of stunting as compared to rural and urban sector children (Table 10), children from the estate sector had lower risk of wasting
and low BMI when compared to children from the rural sector (Tables 11 and 12).
Figure 26
Prevalence of
malnutrition
among children
under 5 by
mother’s
educational
level
Source: Data from special survey conducted in 2012
Figure 27
Prevalence of
malnutrition
among children
under 5 by birth
weight – 2012
survey
Source: Data from special survey conducted in 2012
Variable Regression coefficient Standard error p-value
Odds Ratio (95% confidence
interval)
Constant -1.445 0.162
Low birth weight1 1.078 0.155 <0.001 2.938(2.170-3.977)
Wealth Index2 0.032
Poorest 0.677 0.255 0.008 1.968(1.194-3.245)
Second 0.475 0.211 0.025 1.608(1.063-2.433)
Middle 0.117 0.219 0.594 1.124(0.731-1.728)
Fourth 0.086 0.209 0.680 1.090(0.724-1.643)
1 Reference group is normal birth weight babies2 Reference group is children in the richest wealth quintile
Source: Data from special survey conducted in 2012
Table 9
Summary
of logistic
regression
analyses using
underweight as
the dependent
variable – 2012
survey
No schooling Primary Secondary O Level Higher0
10%
20%
30%
40%
50%
60%
70%
80%
Low BMI for age
Wasted
Stunted
Underweight
Underweight Stunted Wasted Low BMI for age0
5%
10%
15%
20%
25%
30%
35%
40%
45%
50%
LBW
Normal
40 41Combating Malnutrition Through Multisectoral Nutrition ProgrammingA Case Study from Sri Lanka
Post intervention status
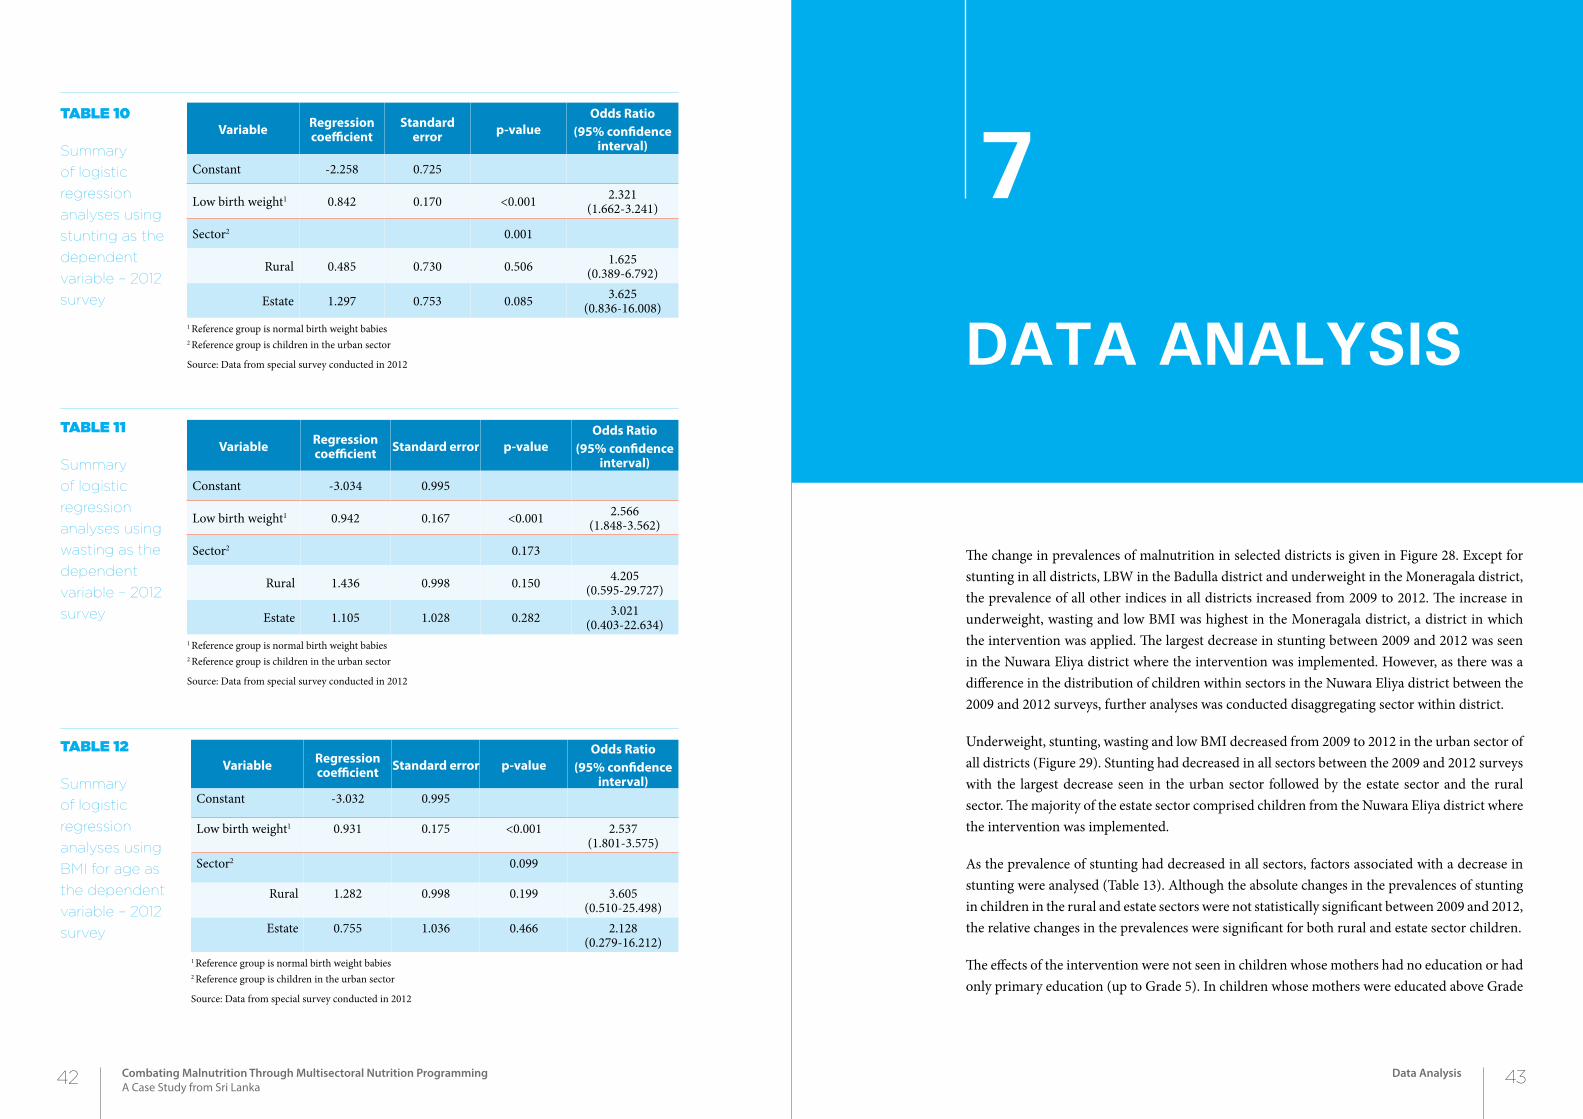
The change in prevalences of malnutrition in selected districts is given in Figure 28. Except for stunting in all districts, LBW in the Badulla district and underweight in the Moneragala district, the prevalence of all other indices in all districts increased from 2009 to 2012. The increase in underweight, wasting and low BMI was highest in the Moneragala district, a district in which the intervention was applied. The largest decrease in stunting between 2009 and 2012 was seen in the Nuwara Eliya district where the intervention was implemented. However, as there was a difference in the distribution of children within sectors in the Nuwara Eliya district between the 2009 and 2012 surveys, further analyses was conducted disaggregating sector within district.
Underweight, stunting, wasting and low BMI decreased from 2009 to 2012 in the urban sector of all districts (Figure 29). Stunting had decreased in all sectors between the 2009 and 2012 surveys with the largest decrease seen in the urban sector followed by the estate sector and the rural sector. The majority of the estate sector comprised children from the Nuwara Eliya district where the intervention was implemented.
As the prevalence of stunting had decreased in all sectors, factors associated with a decrease in stunting were analysed (Table 13). Although the absolute changes in the prevalences of stunting in children in the rural and estate sectors were not statistically significant between 2009 and 2012, the relative changes in the prevalences were significant for both rural and estate sector children.
The effects of the intervention were not seen in children whose mothers had no education or had only primary education (up to Grade 5). In children whose mothers were educated above Grade
Table 10
Summary
of logistic
regression
analyses using
stunting as the
dependent
variable – 2012
survey
Table 11
Summary
of logistic
regression
analyses using
wasting as the
dependent
variable – 2012
survey
Variable Regression coefficient
Standard error p-value
Odds Ratio (95% confidence
interval)
Constant -2.258 0.725
Low birth weight1 0.842 0.170 <0.001 2.321(1.662-3.241)
Sector2 0.001
Rural 0.485 0.730 0.506 1.625(0.389-6.792)
Estate 1.297 0.753 0.085 3.625(0.836-16.008)
1 Reference group is normal birth weight babies2 Reference group is children in the urban sector
Source: Data from special survey conducted in 2012
Variable Regression coefficient Standard error p-value
Odds Ratio (95% confidence
interval)
Constant -3.034 0.995
Low birth weight1 0.942 0.167 <0.001 2.566(1.848-3.562)
Sector2 0.173
Rural 1.436 0.998 0.150 4.205(0.595-29.727)
Estate 1.105 1.028 0.282 3.021(0.403-22.634)
1 Reference group is normal birth weight babies2 Reference group is children in the urban sector
Source: Data from special survey conducted in 2012
Table 12
Summary
of logistic
regression
analyses using
BMI for age as
the dependent
variable – 2012
survey
Variable Regression coefficient Standard error p-value
Odds Ratio (95% confidence
interval)Constant -3.032 0.995
Low birth weight1 0.931 0.175 <0.001 2.537(1.801-3.575)
Sector2 0.099
Rural 1.282 0.998 0.199 3.605(0.510-25.498)
Estate 0.755 1.036 0.466 2.128(0.279-16.212)
1 Reference group is normal birth weight babies2 Reference group is children in the urban sector
Source: Data from special survey conducted in 2012
42 43Combating Malnutrition Through Multisectoral Nutrition ProgrammingA Case Study from Sri Lanka
Data Analysis
2Chapter
DAtA AnALySiS
7
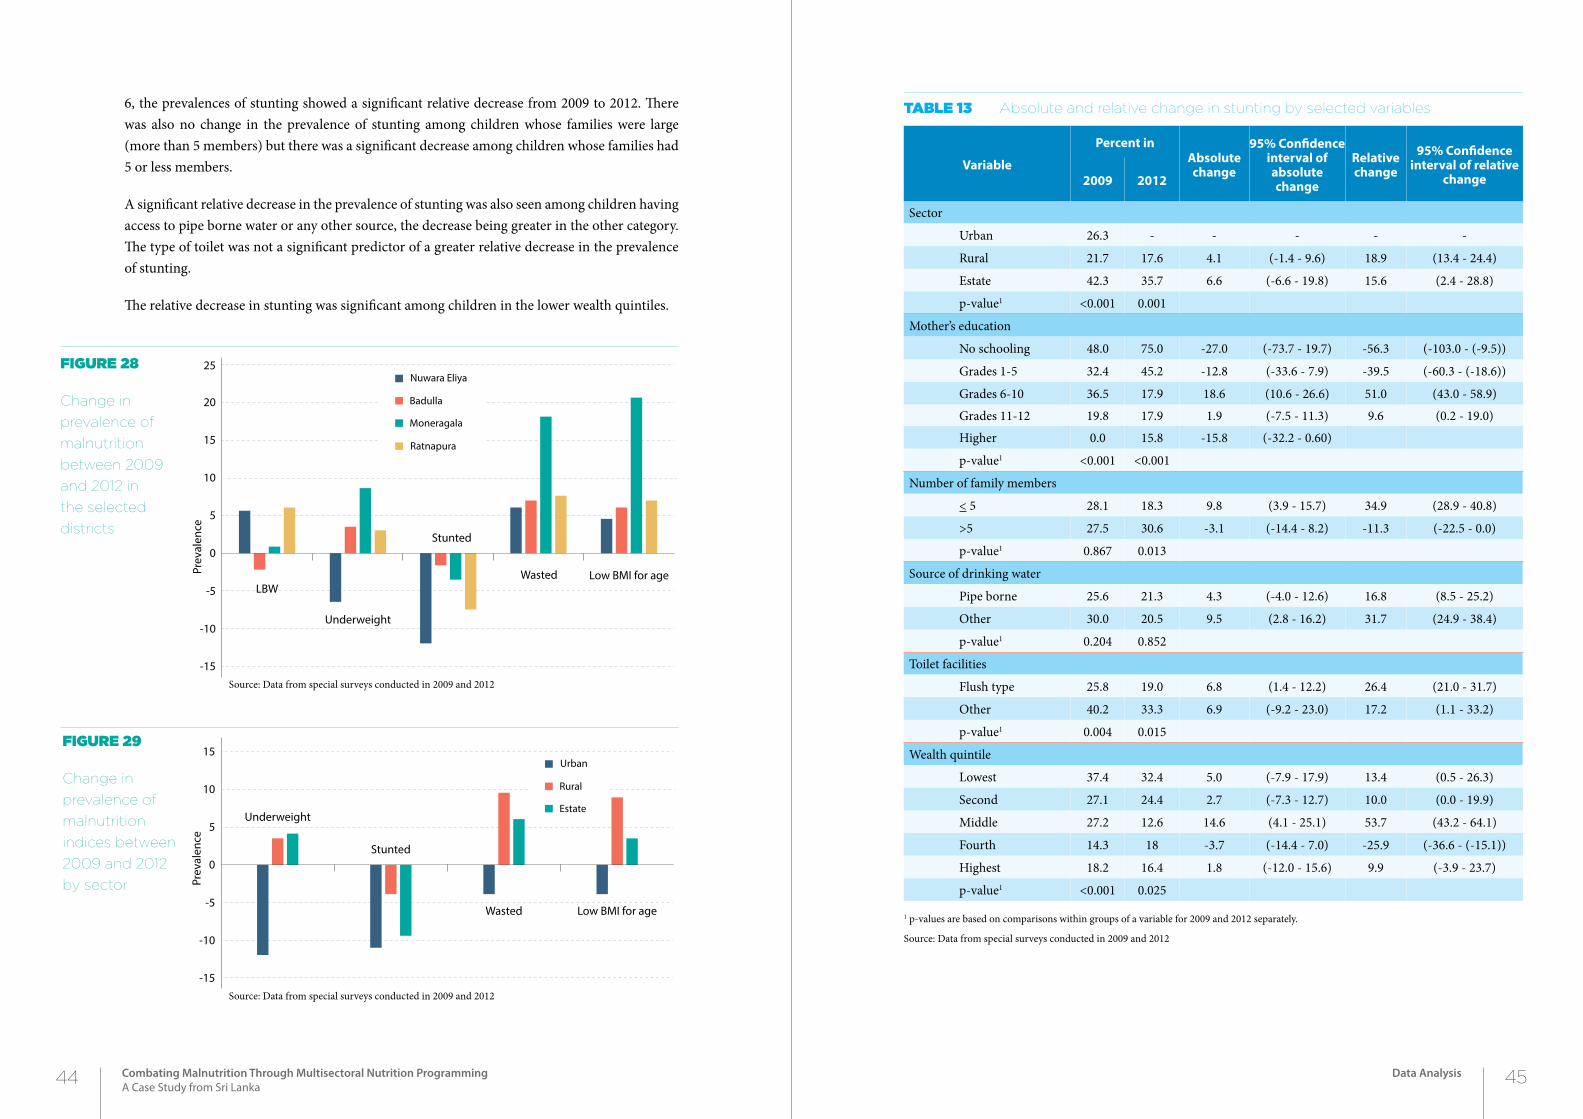
6, the prevalences of stunting showed a significant relative decrease from 2009 to 2012. There was also no change in the prevalence of stunting among children whose families were large (more than 5 members) but there was a significant decrease among children whose families had 5 or less members.
A significant relative decrease in the prevalence of stunting was also seen among children having access to pipe borne water or any other source, the decrease being greater in the other category. The type of toilet was not a significant predictor of a greater relative decrease in the prevalence of stunting.
The relative decrease in stunting was significant among children in the lower wealth quintiles.
Figure 29
Change in
prevalence of
malnutrition
indices between
2009 and 2012
by sector
Figure 28
Change in
prevalence of
malnutrition
between 2009
and 2012 in
the selected
districts
Source: Data from special surveys conducted in 2009 and 2012
Source: Data from special surveys conducted in 2009 and 2012
Table 13 Absolute and relative change in stunting by selected variables
Variable
Percent in Absolute change
95% Confidence interval of absolute change
Relative change
95% Confidence interval of relative
change2009 2012
Sector
Urban 26.3 - - - - -
Rural 21.7 17.6 4.1 (-1.4 - 9.6) 18.9 (13.4 - 24.4)
Estate 42.3 35.7 6.6 (-6.6 - 19.8) 15.6 (2.4 - 28.8)
p-value1 <0.001 0.001
Mother’s education
No schooling 48.0 75.0 -27.0 (-73.7 - 19.7) -56.3 (-103.0 - (-9.5))
Grades 1-5 32.4 45.2 -12.8 (-33.6 - 7.9) -39.5 (-60.3 - (-18.6))
Grades 6-10 36.5 17.9 18.6 (10.6 - 26.6) 51.0 (43.0 - 58.9)
Grades 11-12 19.8 17.9 1.9 (-7.5 - 11.3) 9.6 (0.2 - 19.0)
Higher 0.0 15.8 -15.8 (-32.2 - 0.60)
p-value1 <0.001 <0.001
Number of family members
< 5 28.1 18.3 9.8 (3.9 - 15.7) 34.9 (28.9 - 40.8)
>5 27.5 30.6 -3.1 (-14.4 - 8.2) -11.3 (-22.5 - 0.0)
p-value1 0.867 0.013
Source of drinking water
Pipe borne 25.6 21.3 4.3 (-4.0 - 12.6) 16.8 (8.5 - 25.2)
Other 30.0 20.5 9.5 (2.8 - 16.2) 31.7 (24.9 - 38.4)
p-value1 0.204 0.852
Toilet facilities
Flush type 25.8 19.0 6.8 (1.4 - 12.2) 26.4 (21.0 - 31.7)
Other 40.2 33.3 6.9 (-9.2 - 23.0) 17.2 (1.1 - 33.2)
p-value1 0.004 0.015
Wealth quintile
Lowest 37.4 32.4 5.0 (-7.9 - 17.9) 13.4 (0.5 - 26.3)
Second 27.1 24.4 2.7 (-7.3 - 12.7) 10.0 (0.0 - 19.9)
Middle 27.2 12.6 14.6 (4.1 - 25.1) 53.7 (43.2 - 64.1)
Fourth 14.3 18 -3.7 (-14.4 - 7.0) -25.9 (-36.6 - (-15.1))
Highest 18.2 16.4 1.8 (-12.0 - 15.6) 9.9 (-3.9 - 23.7)
p-value1 <0.001 0.025
1 p-values are based on comparisons within groups of a variable for 2009 and 2012 separately.
Source: Data from special surveys conducted in 2009 and 2012
0
5
10
-10
-15
-5
15
20
25
Ratnapura
Moneragala
Badulla
Nuwara Eliya
Prev
alen
ce
Underweight
LBW
Stunted
Wasted Low BMI for age
0
5
10
-10
-15
-5
15
Estate
Rural
Urban
Prev
alen
ce
Underweight
Stunted
Wasted Low BMI for age
44 45Combating Malnutrition Through Multisectoral Nutrition ProgrammingA Case Study from Sri Lanka
Data Analysis
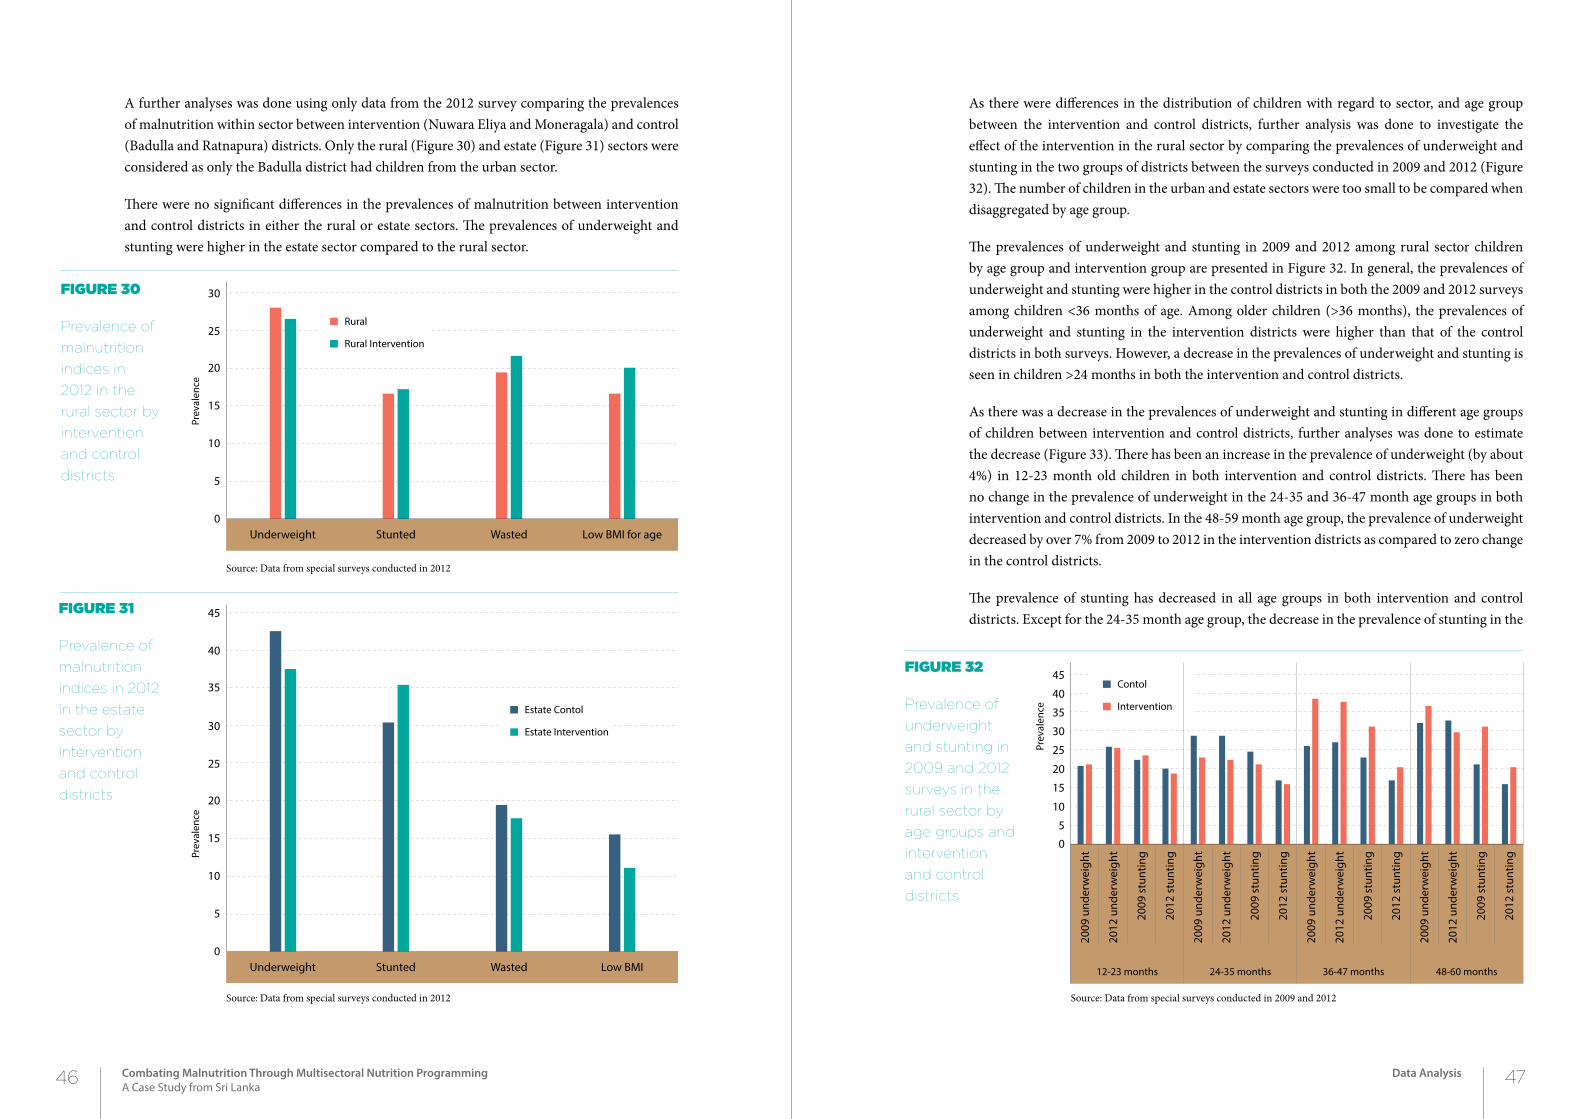
A further analyses was done using only data from the 2012 survey comparing the prevalences of malnutrition within sector between intervention (Nuwara Eliya and Moneragala) and control (Badulla and Ratnapura) districts. Only the rural (Figure 30) and estate (Figure 31) sectors were considered as only the Badulla district had children from the urban sector.
There were no significant differences in the prevalences of malnutrition between intervention and control districts in either the rural or estate sectors. The prevalences of underweight and stunting were higher in the estate sector compared to the rural sector.
As there were differences in the distribution of children with regard to sector, and age group between the intervention and control districts, further analysis was done to investigate the effect of the intervention in the rural sector by comparing the prevalences of underweight and stunting in the two groups of districts between the surveys conducted in 2009 and 2012 (Figure 32). The number of children in the urban and estate sectors were too small to be compared when disaggregated by age group.
The prevalences of underweight and stunting in 2009 and 2012 among rural sector children by age group and intervention group are presented in Figure 32. In general, the prevalences of underweight and stunting were higher in the control districts in both the 2009 and 2012 surveys among children <36 months of age. Among older children (>36 months), the prevalences of underweight and stunting in the intervention districts were higher than that of the control districts in both surveys. However, a decrease in the prevalences of underweight and stunting is seen in children >24 months in both the intervention and control districts.
As there was a decrease in the prevalences of underweight and stunting in different age groups of children between intervention and control districts, further analyses was done to estimate the decrease (Figure 33). There has been an increase in the prevalence of underweight (by about 4%) in 12-23 month old children in both intervention and control districts. There has been no change in the prevalence of underweight in the 24-35 and 36-47 month age groups in both intervention and control districts. In the 48-59 month age group, the prevalence of underweight decreased by over 7% from 2009 to 2012 in the intervention districts as compared to zero change in the control districts.
The prevalence of stunting has decreased in all age groups in both intervention and control districts. Except for the 24-35 month age group, the decrease in the prevalence of stunting in the
Figure 30
Prevalence of
malnutrition
indices in
2012 in the
rural sector by
intervention
and control
districts
Figure 31
Prevalence of
malnutrition
indices in 2012
in the estate
sector by
intervention
and control
districts
Figure 32
Prevalence of
underweight
and stunting in
2009 and 2012
surveys in the
rural sector by
age groups and
intervention
and control
districts
Source: Data from special surveys conducted in 2012
Source: Data from special surveys conducted in 2012 Source: Data from special surveys conducted in 2009 and 2012
Underweight Stunted Wasted Low BMI for age0
5
10
15
20
25
30
Rural Intervention
Rural
Prev
alen
ce
Underweight Stunted Wasted Low BMI0
5
10
15
20
25
30
35
40
45
Estate Intervention
Estate Contol
Prev
alen
ce
2009
und
erw
eigh
t
2012
und
erw
eigh
t
2009
stu
ntin
g
2012
stu
ntin
g
2009
und
erw
eigh
t
2012
und
erw
eigh
t
2009
stu
ntin
g
2012
stu
ntin
g
2009
und
erw
eigh
t
2012
und
erw
eigh
t
2009
stu
ntin
g
2012
stu
ntin
g
2009
und
erw
eigh
t
2012
und
erw
eigh
t
2009
stu
ntin
g
2012
stu
ntin
g
0
5
10
15
20
25
30
35
40
45
Intervention
Contol
Prev
alen
ce
12-23 months 24-35 months 36-47 months 48-60 months
46 47Combating Malnutrition Through Multisectoral Nutrition ProgrammingA Case Study from Sri Lanka
Data Analysis
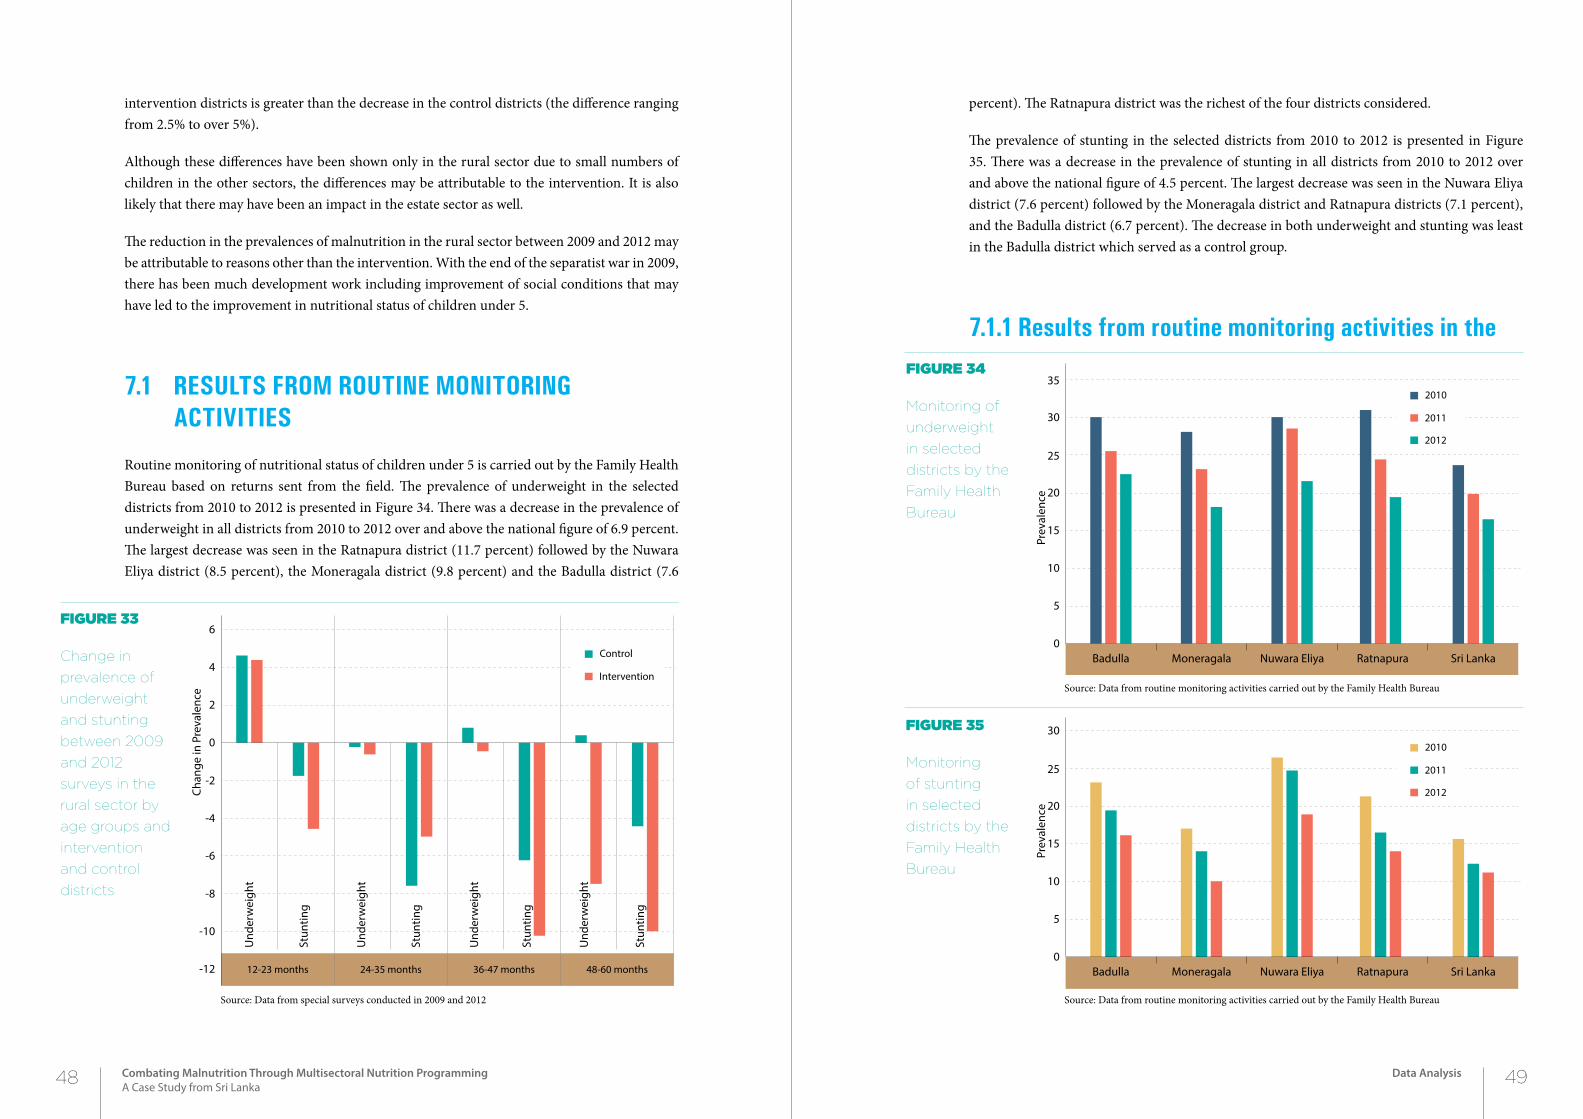
intervention districts is greater than the decrease in the control districts (the difference ranging from 2.5% to over 5%).
Although these differences have been shown only in the rural sector due to small numbers of children in the other sectors, the differences may be attributable to the intervention. It is also likely that there may have been an impact in the estate sector as well.
The reduction in the prevalences of malnutrition in the rural sector between 2009 and 2012 may be attributable to reasons other than the intervention. With the end of the separatist war in 2009, there has been much development work including improvement of social conditions that may have led to the improvement in nutritional status of children under 5.
7.1 resuLts from routine monitoring activities
Routine monitoring of nutritional status of children under 5 is carried out by the Family Health Bureau based on returns sent from the field. The prevalence of underweight in the selected districts from 2010 to 2012 is presented in Figure 34. There was a decrease in the prevalence of underweight in all districts from 2010 to 2012 over and above the national figure of 6.9 percent. The largest decrease was seen in the Ratnapura district (11.7 percent) followed by the Nuwara Eliya district (8.5 percent), the Moneragala district (9.8 percent) and the Badulla district (7.6
percent). The Ratnapura district was the richest of the four districts considered.
The prevalence of stunting in the selected districts from 2010 to 2012 is presented in Figure 35. There was a decrease in the prevalence of stunting in all districts from 2010 to 2012 over and above the national figure of 4.5 percent. The largest decrease was seen in the Nuwara Eliya district (7.6 percent) followed by the Moneragala district and Ratnapura districts (7.1 percent), and the Badulla district (6.7 percent). The decrease in both underweight and stunting was least in the Badulla district which served as a control group.
7.1.1 results from routine monitoring activities in the
Figure 33
Change in
prevalence of
underweight
and stunting
between 2009
and 2012
surveys in the
rural sector by
age groups and
intervention
and control
districts
Source: Data from special surveys conducted in 2009 and 2012
Figure 34
Monitoring of
underweight
in selected
districts by the
Family Health
Bureau
Figure 35
Monitoring
of stunting
in selected
districts by the
Family Health
Bureau
Source: Data from routine monitoring activities carried out by the Family Health Bureau
Source: Data from routine monitoring activities carried out by the Family Health Bureau
0
2
4
-4
-6
-8
-10
-12
-2
6
Intervention
Control
Chan
ge in
Pre
vale
nce
Und
erw
eigh
t
Stun
ting
Und
erw
eigh
t
Stun
ting
Und
erw
eigh
t
Stun
ting
Und
erw
eigh
t
Stun
ting
12-23 months 24-35 months 36-47 months 48-60 months
0
5
10
15
20
25
30
35
2012
2011
2010
Prev
alen
ce
Badulla Moneragala Nuwara Eliya Ratnapura Sri Lanka
0
5
10
15
20
25
30
2012
2011
2010
Prev
alen
ce
Badulla Moneragala Nuwara Eliya Ratnapura Sri Lanka
48 49Combating Malnutrition Through Multisectoral Nutrition ProgrammingA Case Study from Sri Lanka
Data Analysis
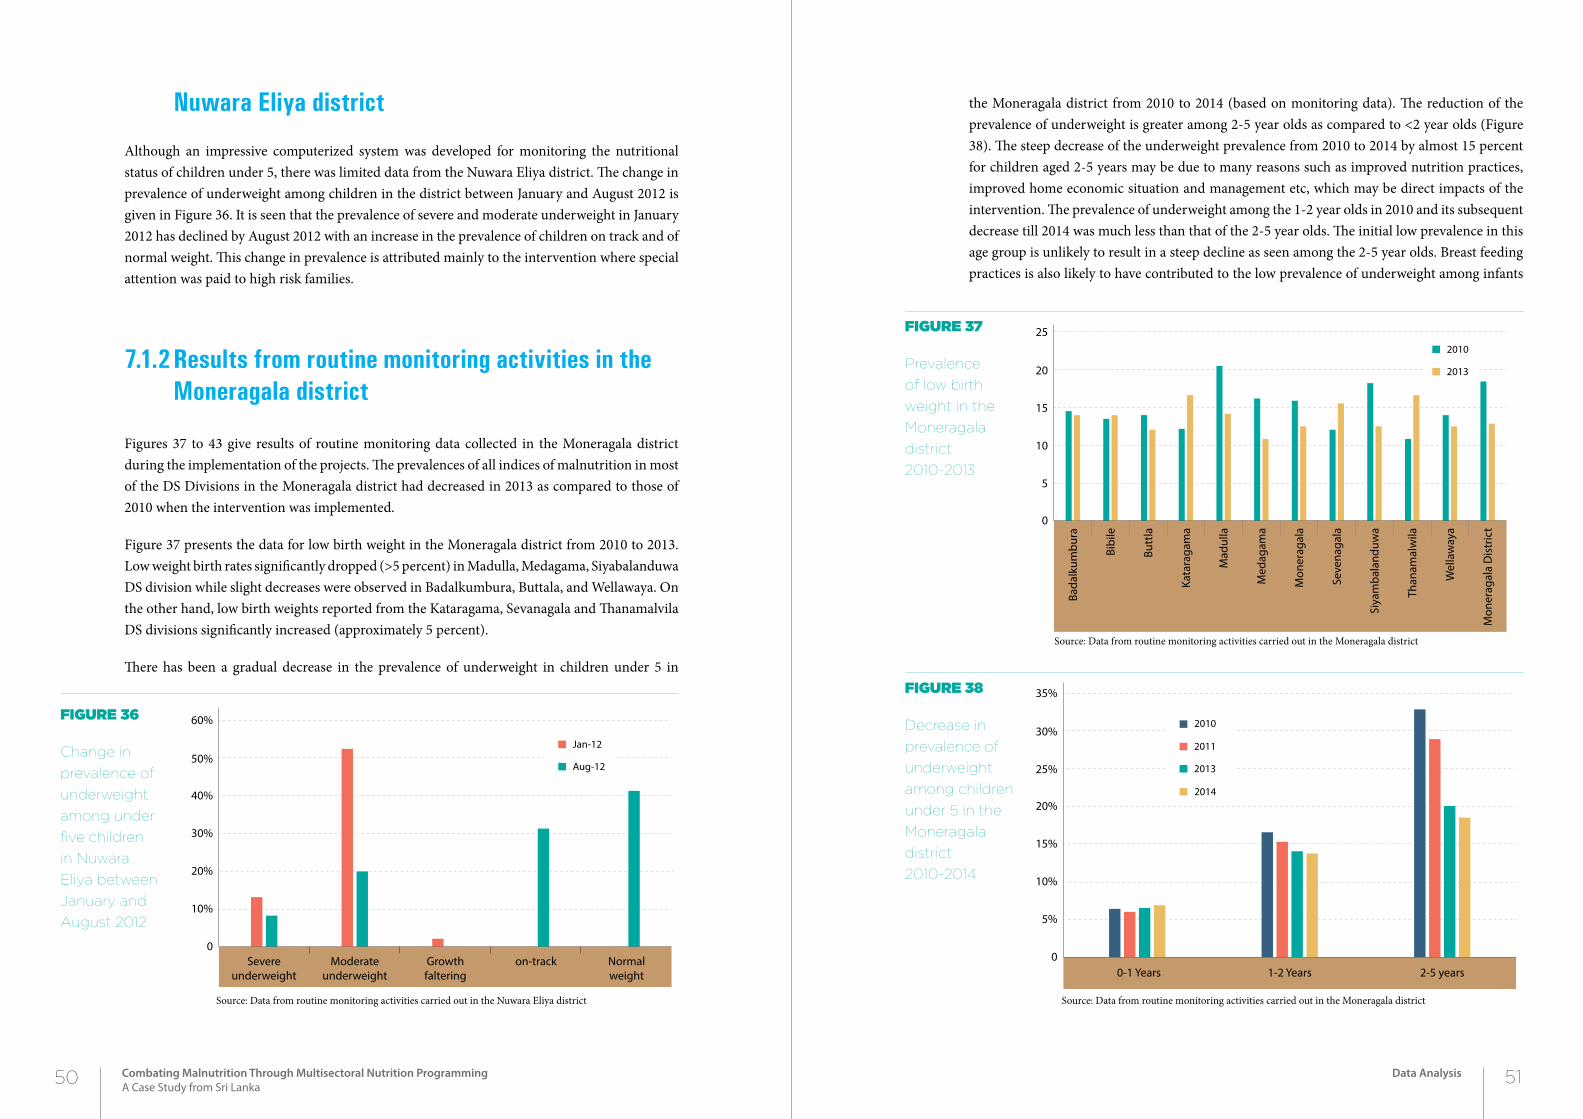
nuwara eliya district
Although an impressive computerized system was developed for monitoring the nutritional status of children under 5, there was limited data from the Nuwara Eliya district. The change in prevalence of underweight among children in the district between January and August 2012 is given in Figure 36. It is seen that the prevalence of severe and moderate underweight in January 2012 has declined by August 2012 with an increase in the prevalence of children on track and of normal weight. This change in prevalence is attributed mainly to the intervention where special attention was paid to high risk families.
7.1.2 results from routine monitoring activities in the moneragala district
Figures 37 to 43 give results of routine monitoring data collected in the Moneragala district during the implementation of the projects. The prevalences of all indices of malnutrition in most of the DS Divisions in the Moneragala district had decreased in 2013 as compared to those of 2010 when the intervention was implemented.
Figure 37 presents the data for low birth weight in the Moneragala district from 2010 to 2013. Low weight birth rates significantly dropped (>5 percent) in Madulla, Medagama, Siyabalanduwa DS division while slight decreases were observed in Badalkumbura, Buttala, and Wellawaya. On the other hand, low birth weights reported from the Kataragama, Sevanagala and Thanamalvila DS divisions significantly increased (approximately 5 percent).
There has been a gradual decrease in the prevalence of underweight in children under 5 in
the Moneragala district from 2010 to 2014 (based on monitoring data). The reduction of the prevalence of underweight is greater among 2-5 year olds as compared to <2 year olds (Figure 38). The steep decrease of the underweight prevalence from 2010 to 2014 by almost 15 percent for children aged 2-5 years may be due to many reasons such as improved nutrition practices, improved home economic situation and management etc, which may be direct impacts of the intervention. The prevalence of underweight among the 1-2 year olds in 2010 and its subsequent decrease till 2014 was much less than that of the 2-5 year olds. The initial low prevalence in this age group is unlikely to result in a steep decline as seen among the 2-5 year olds. Breast feeding practices is also likely to have contributed to the low prevalence of underweight among infants
Figure 36
Change in
prevalence of
underweight
among under
five children
in Nuwara
Eliya between
January and
August 2012
Figure 37
Prevalence
of low birth
weight in the
Moneragala
district
2010-2013
Source: Data from routine monitoring activities carried out in the Nuwara Eliya district
Figure 38
Decrease in
prevalence of
underweight
among children
under 5 in the
Moneragala
district
2010-2014
Source: Data from routine monitoring activities carried out in the Moneragala district
Source: Data from routine monitoring activities carried out in the Moneragala district
0
10%
20%
30%
40%
50%
60%
Aug-12
Jan-12
Severeunderweight
Moderateunderweight
Growthfaltering
on-track Normalweight
Bada
lkum
bura
Bibi
le
Butt
la
Kata
raga
ma
Mad
ulla
Med
agam
a
Mon
erag
ala
Seve
naga
la
Than
amal
wila
Wel
law
aya
Mon
erag
ala
Dis
tric
t
Siya
mba
land
uwa
0
5
10
15
20
25
2013
2010
0-1 Years 1-2 Years 2-5 years0
5%
10%
15%
20%
25%
30%
35%
2014
2013
2011
2010
50 51Combating Malnutrition Through Multisectoral Nutrition ProgrammingA Case Study from Sri Lanka
Data Analysis
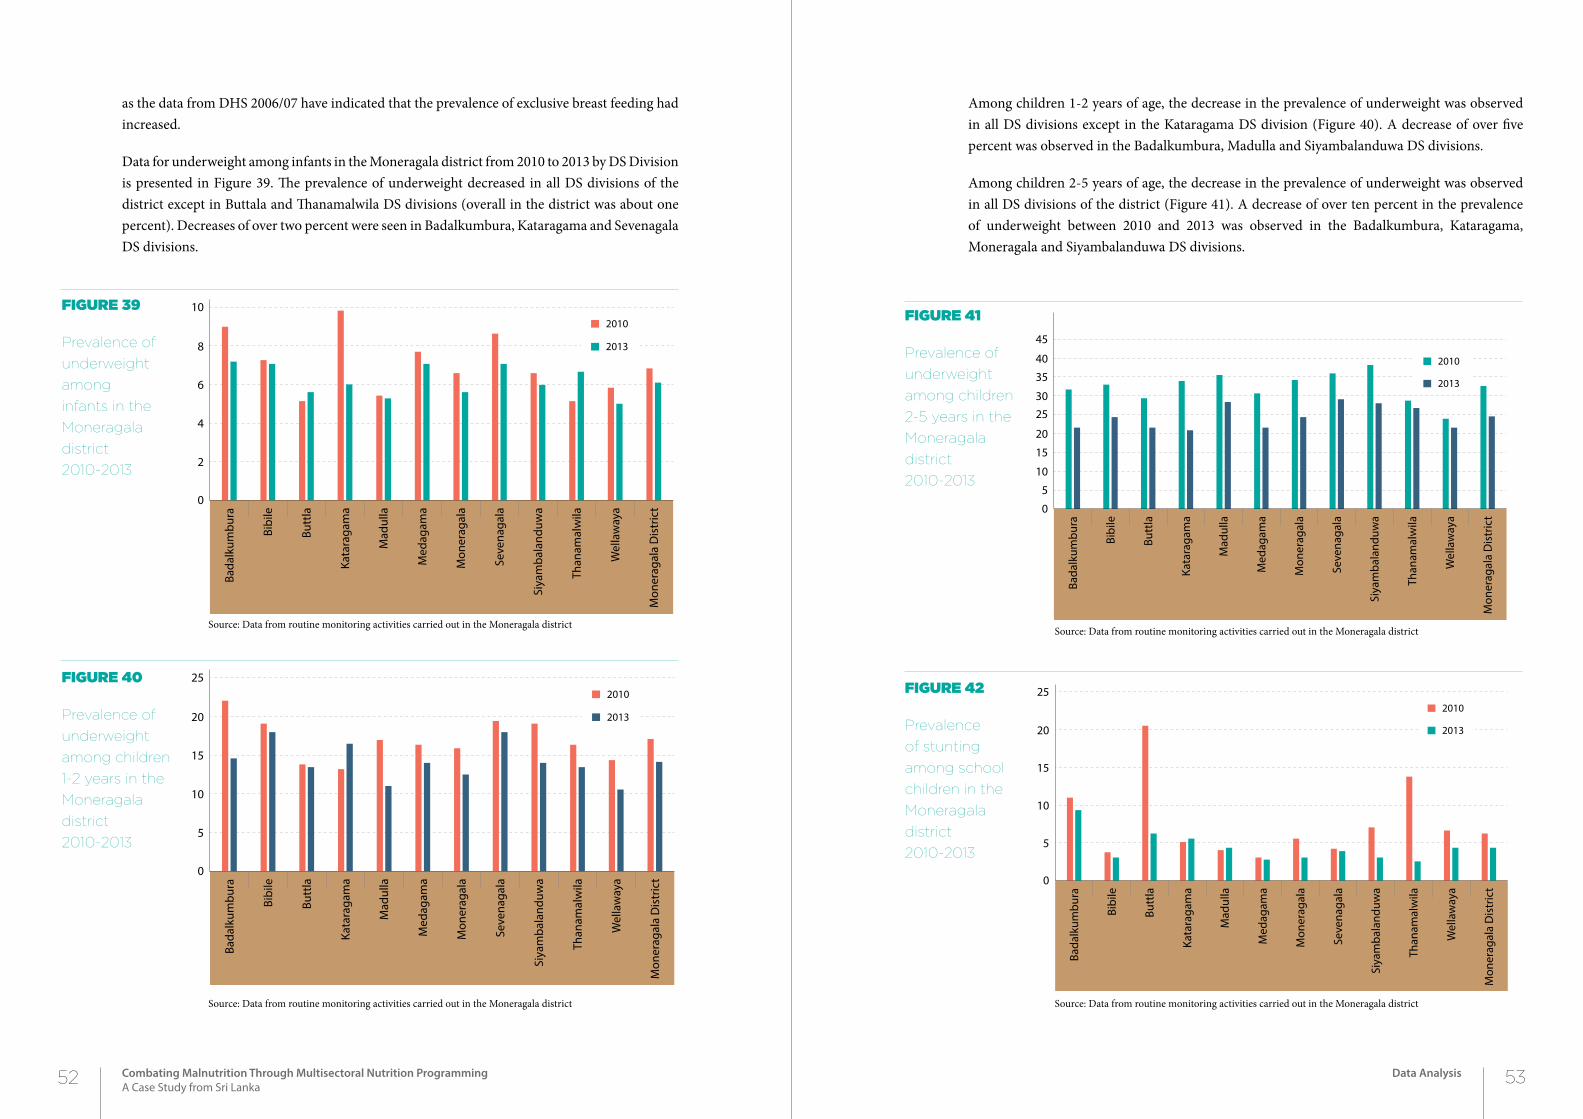
as the data from DHS 2006/07 have indicated that the prevalence of exclusive breast feeding had increased.
Data for underweight among infants in the Moneragala district from 2010 to 2013 by DS Division is presented in Figure 39. The prevalence of underweight decreased in all DS divisions of the district except in Buttala and Thanamalwila DS divisions (overall in the district was about one percent). Decreases of over two percent were seen in Badalkumbura, Kataragama and Sevenagala DS divisions.
Among children 1-2 years of age, the decrease in the prevalence of underweight was observed in all DS divisions except in the Kataragama DS division (Figure 40). A decrease of over five percent was observed in the Badalkumbura, Madulla and Siyambalanduwa DS divisions.
Among children 2-5 years of age, the decrease in the prevalence of underweight was observed in all DS divisions of the district (Figure 41). A decrease of over ten percent in the prevalence of underweight between 2010 and 2013 was observed in the Badalkumbura, Kataragama, Moneragala and Siyambalanduwa DS divisions.
Figure 39
Prevalence of
underweight
among
infants in the
Moneragala
district
2010-2013
Figure 40
Prevalence of
underweight
among children
1-2 years in the
Moneragala
district
2010-2013
Source: Data from routine monitoring activities carried out in the Moneragala district
Figure 41
Prevalence of
underweight
among children
2-5 years in the
Moneragala
district
2010-2013
Source: Data from routine monitoring activities carried out in the Moneragala district
Source: Data from routine monitoring activities carried out in the Moneragala district
Figure 42
Prevalence
of stunting
among school
children in the
Moneragala
district
2010-2013
Source: Data from routine monitoring activities carried out in the Moneragala district
Bada
lkum
bura
Bibi
le
Butt
la
Kata
raga
ma
Mad
ulla
Med
agam
a
Mon
erag
ala
Seve
naga
la
Than
amal
wila
Wel
law
aya
Mon
erag
ala
Dis
tric
t
Siya
mba
land
uwa
0
2
4
6
8
10
2013
2010
Bada
lkum
bura
Bibi
le
Butt
la
Kata
raga
ma
Mad
ulla
Med
agam
a
Mon
erag
ala
Seve
naga
la
Than
amal
wila
Wel
law
aya
Mon
erag
ala
Dis
tric
t
Siya
mba
land
uwa
0
5
10
15
20
25
2013
2010
Bada
lkum
bura
Bibi
le
Butt
la
Kata
raga
ma
Mad
ulla
Med
agam
a
Mon
erag
ala
Seve
naga
la
Than
amal
wila
Wel
law
aya
Mon
erag
ala
Dis
tric
t
Siya
mba
land
uwa
0
10
5
20
15
30
35
25
40
45
2013
2010
Bada
lkum
bura
Bibi
le
Butt
la
Kata
raga
ma
Mad
ulla
Med
agam
a
Mon
erag
ala
Seve
naga
la
Than
amal
wila
Wel
law
aya
Mon
erag
ala
Dis
tric
t
Siya
mba
land
uwa
0
5
10
15
20
25
2013
2010
52 53Combating Malnutrition Through Multisectoral Nutrition ProgrammingA Case Study from Sri Lanka
Data Analysis
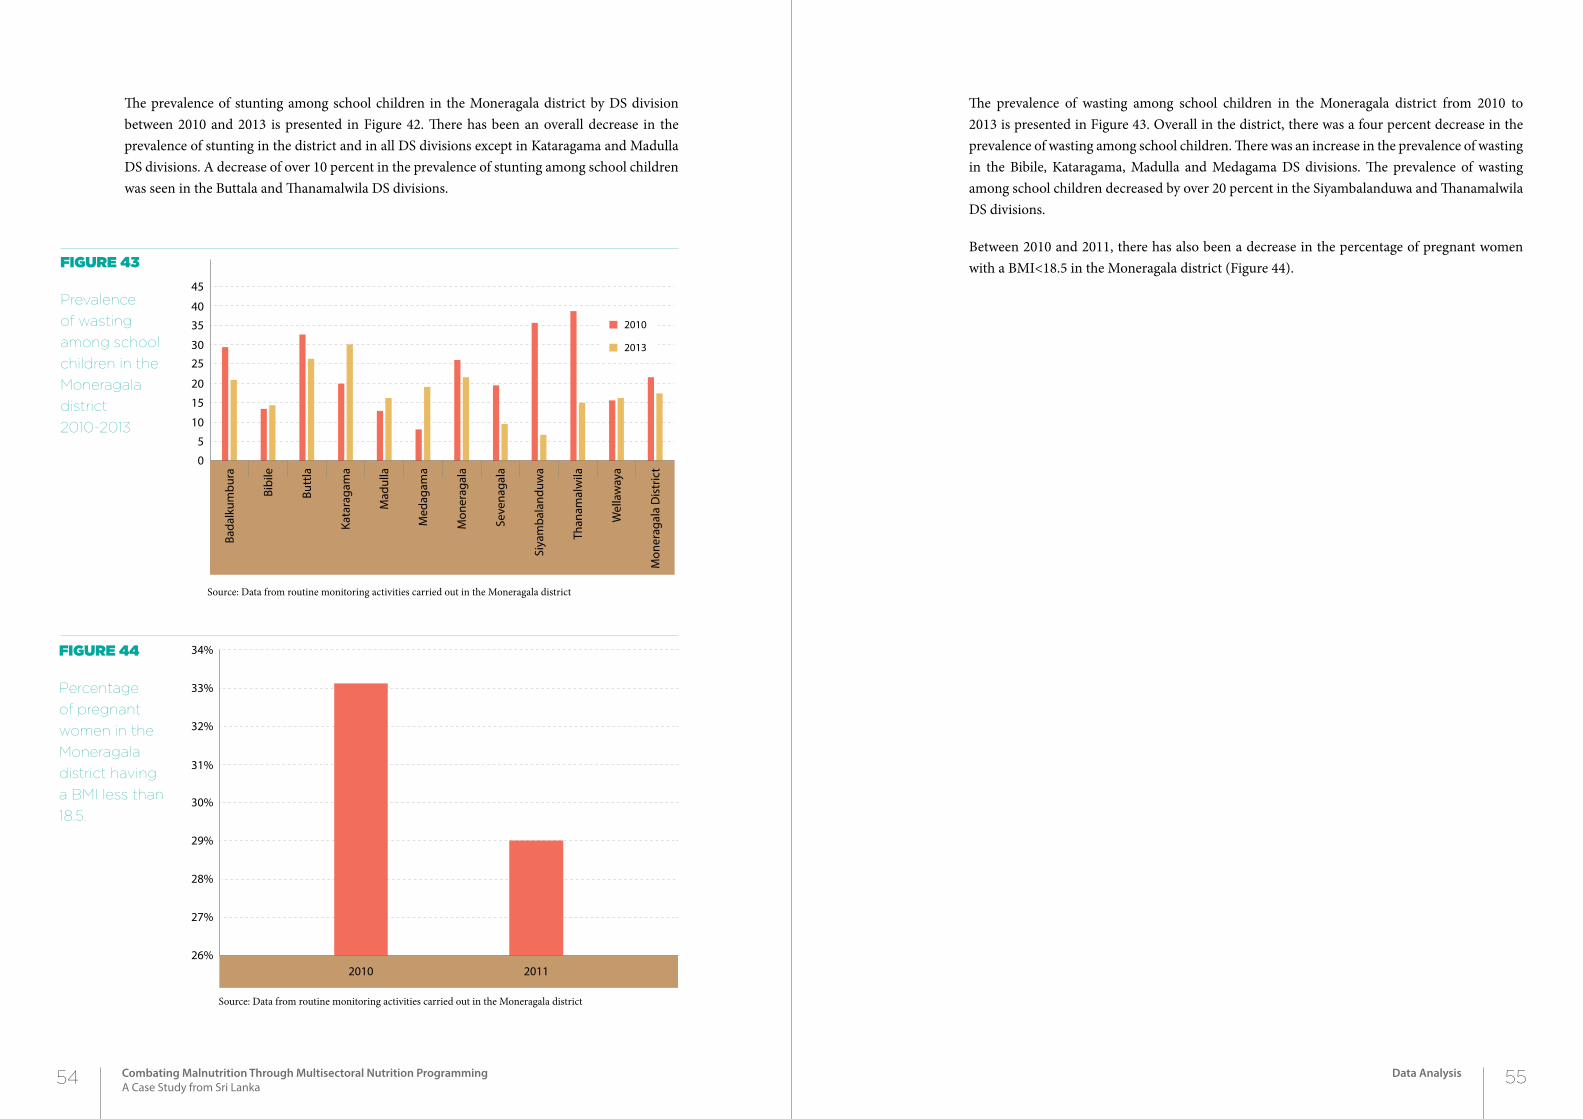
The prevalence of wasting among school children in the Moneragala district from 2010 to 2013 is presented in Figure 43. Overall in the district, there was a four percent decrease in the prevalence of wasting among school children. There was an increase in the prevalence of wasting in the Bibile, Kataragama, Madulla and Medagama DS divisions. The prevalence of wasting among school children decreased by over 20 percent in the Siyambalanduwa and Thanamalwila DS divisions.
Between 2010 and 2011, there has also been a decrease in the percentage of pregnant women with a BMI<18.5 in the Moneragala district (Figure 44). Figure 43
Prevalence
of wasting
among school
children in the
Moneragala
district
2010-2013
Figure 44
Percentage
of pregnant
women in the
Moneragala
district having
a BMI less than
18.5.
Source: Data from routine monitoring activities carried out in the Moneragala district
Source: Data from routine monitoring activities carried out in the Moneragala district
The prevalence of stunting among school children in the Moneragala district by DS division between 2010 and 2013 is presented in Figure 42. There has been an overall decrease in the prevalence of stunting in the district and in all DS divisions except in Kataragama and Madulla DS divisions. A decrease of over 10 percent in the prevalence of stunting among school children was seen in the Buttala and Thanamalwila DS divisions.
Bada
lkum
bura
Bibi
le
Butt
la
Kata
raga
ma
Mad
ulla
Med
agam
a
Mon
erag
ala
Seve
naga
la
Than
amal
wila
Wel
law
aya
Mon
erag
ala
Dis
tric
t
Siya
mba
land
uwa
0
10
5
20
15
30
35
25
40
45
2013
2010
2010 201126%
27%
28%
29%
30%
31%
32%
33%
34%
54 55Combating Malnutrition Through Multisectoral Nutrition ProgrammingA Case Study from Sri Lanka
Data Analysis

8.1 impact
Given the short period between the intervention and the post intervention assessments, it is difficult to assess the impact of the intervention. The decrease in the prevalences of malnutrition in children under 5 is likely to improve health status, educational attainment, and potential achievement of individuals in the future. As there was a general decrease in the prevalences of malnutrition in children under 5 in the entire country, the impact of this particular intervention needs to be carefully assessed.
8.2 reLevance
Unlike other interventions which are targeted at the community in general, the interventions carried out in this project were tailor-made for families based on their needs. At risk families were selected based on well defined criteria and the needs of the families were assessed. Specific interventions were selected for different families. These included interventions carried out by the health sector and other non-health sectors as is necessary for improving nutritional status of a community. The interventions included advice to families on improving health and nutritional status, providing various forms of assistance both in cash and in kind, and regular follow up and monitoring of progress.
56 57Combating Malnutrition Through Multisectoral Nutrition ProgrammingA Case Study from Sri Lanka
Discussion
2Chapter
DiSCuSSion
8
The life cycle approach used targeting pregnant women and children took into account the broader vision of the national maternal and child health programme. A spin off of the multi-sector approach in implementing the intervention was the understanding of the roles of officers of different sectors in improving nutritional status of communities. This by itself will be useful for successful implementation of future nutrition programmes.
8.3 effectiveness
Based on routine monitoring data, there was a general decline in the prevalence of malnutrition indices in the districts where the intervention was carried out as well as in the rest of the country. With the end of the separatist war in 2009, many social and infrastructure development projects were initiated which may also have contributed to this decline. This intervention was piloted just after the end of the separatist war. It is likely that some spill over of this would have assisted the implementation of this project.
Based on the special surveys done in 2009 and 2012, it can be concluded that the intervention per was effective in reducing the prevalence of stunting in the rural sector among children in the 3-5 year age group and underweight among children in the urban sector. Definite conclusions cannot be made for other indices of malnutrition or age groups as the number of children in the urban and estate sectors varied widely between the two surveys and the numbers were small.
The effectiveness of the programme was not uniform within the district. There were differences between DS divisions within the districts. This may be attributable to a number factors including motivation of public health field staff to availability of facilities available in other sectors. Some of the staff engaged in the initial planning of activities had retired or been transferred during the project and social conditions in certain DS divisions may have contributed to the disproportionate effectiveness of the project.
8.4 efficiency
The intervention per say may be considered as being efficient as no additional resources were made available but only the existing resources were made use of. The efficiency was brought into the project with political commitment at the highest level and monitoring activities being carried out at regular intervals at least in the initial stages. The monitoring of the targeted families also contributed to the efficiency of the implementation of the project.
The efficiency of the programme was also affected by the motivation of the staff and the waning enthusiasm and motivation of all concerned officers after the initial planning activities as evidenced by the lack of supervision towards the latter stages which included failure to conduct
routine meetings to monitor and review progress and lack of an external review process during implementation. Data also suggests that there were wide variations in reporting formats and lack of a uniform data collection, monitoring and evaluation system. Even the political commitment had waned during the latter stages of the project which may have been the reason for the poor progress of the intervention in terms of sustainability.
8.5 Lessons Learnt
• Locally designed, planned and acceptable interventions are required to combat malnutrition in the country.
• Health and the non-heath sector can make significant contributions to improving nutrition-al status of communities.
• Targeted and customized interventions, both health and non-health sector, assists in im-provement of nutritional status of families.
• Interventions that are currently available to assist disadvantaged families are not been opti-mally utilized.
• The intervention has improved nutritional status of older children (especially in reducing the prevalence of stunting in children >12 months of age). No impact on undernutrition and wasting was seen.
• Inputs focusing on pregnant females and infants should be strengthened.
• Leadership at the highest level, though important, is by itself not sufficient for the successful implementation of nutritional projects.
• A formal structure needs to be developed for motivation of staff and sustaining the project.
• A formal monitoring and evaluation system including external evaluation is needed to en-sure that the intervention is applied to meet the targets.
58 59Combating Malnutrition Through Multisectoral Nutrition ProgrammingA Case Study from Sri Lanka
Discussion
Ministry of Health (2012) Annual Health Bulletin, Ministry of Health, Colombo.
Institute for Health Metrics and Evaluation (IHME). GBD Arrow Diagram. Seattle, WA: IHME, University of Washington, 2013. Available from http://vizhub.healthdata.org/irank/arrow.php. (Accessed March 1st, 2015)
Department of Census and Statistics (1993). DHS Survey. Department of Census and Statistics, Colombo.
Department of Census and Statistics (2000). DHS Survey. Department of Census and Statistics, Colombo.
Department of Census and Statistics (2006). DHS Survey. Department of Census and Statistics, Colombo.
referenCeS
60 61Combating Malnutrition Through Multisectoral Nutrition ProgrammingA Case Study from Sri Lanka
References
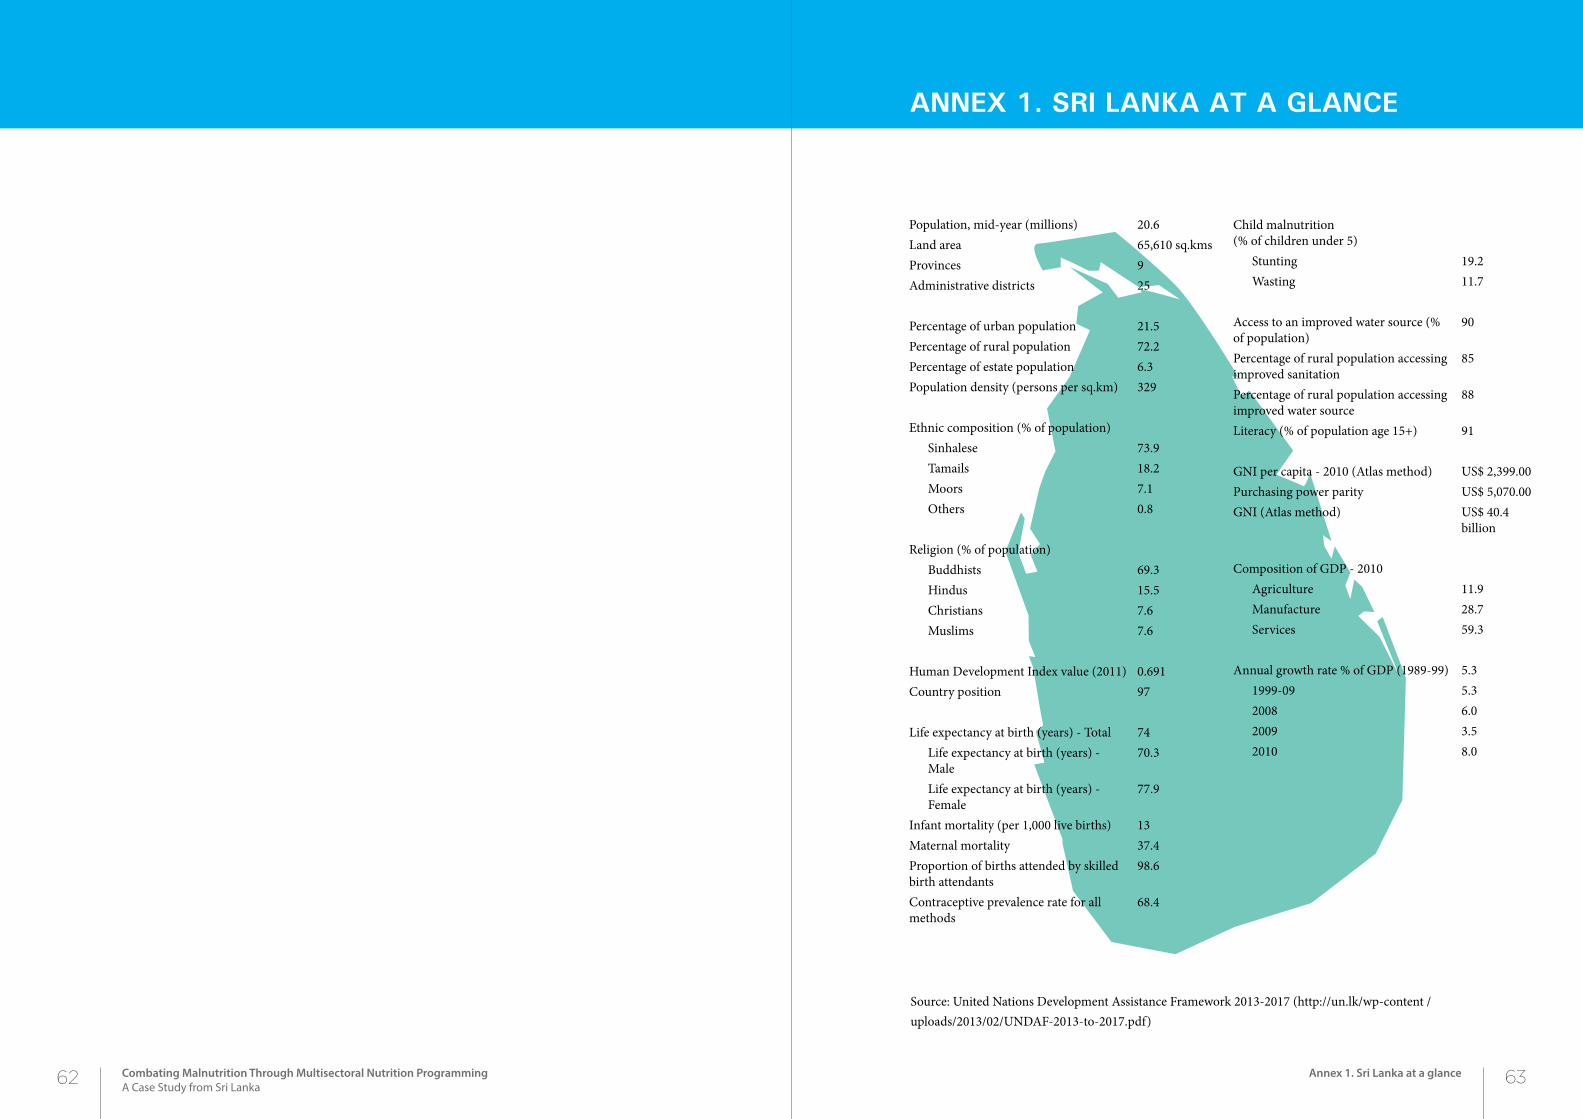
AnneX 1. Sri LAnkA At A gLAnCe
Source: United Nations Development Assistance Framework 2013-2017 (http://un.lk/wp-content /uploads/2013/02/UNDAF-2013-to-2017.pdf)
Population, mid-year (millions) 20.6Land area 65,610 sq.kmsProvinces 9Administrative districts 25
Percentage of urban population 21.5Percentage of rural population 72.2Percentage of estate population 6.3Population density (persons per sq.km) 329
Ethnic composition (% of population) Sinhalese 73.9Tamails 18.2Moors 7.1Others 0.8
Religion (% of population)Buddhists 69.3Hindus 15.5Christians 7.6Muslims 7.6
Human Development Index value (2011) 0.691Country position 97
Life expectancy at birth (years) - Total 74Life expectancy at birth (years) - Male
70.3
Life expectancy at birth (years) - Female
77.9
Infant mortality (per 1,000 live births) 13Maternal mortality 37.4Proportion of births attended by skilled birth attendants
98.6
Contraceptive prevalence rate for all methods
68.4
Child malnutrition (% of children under 5)
Stunting 19.2Wasting 11.7
Access to an improved water source (% of population)
90
Percentage of rural population accessing improved sanitation
85
Percentage of rural population accessing improved water source
88
Literacy (% of population age 15+) 91
GNI per capita - 2010 (Atlas method) US$ 2,399.00Purchasing power parity US$ 5,070.00GNI (Atlas method) US$ 40.4
billion
Composition of GDP - 2010Agriculture 11.9Manufacture 28.7Services 59.3
Annual growth rate % of GDP (1989-99) 5.31999-09 5.32008 6.02009 3.52010 8.0
62 63Combating Malnutrition Through Multisectoral Nutrition ProgrammingA Case Study from Sri Lanka
Annex 1. Sri Lanka at a glance
CombAting mALnutrition through muLtiSeCtorAL nutrition progrAmming
A Case Study from Sri Lanka
unite forchildren
Ministry of HealthNutrition coordination unit