
A Case Study FORMULATION & LYOPHILIZATION CYCLE ...
7
Antibody Drug Conjugates (ADCs) are complex molecules consisting of a monoclonal antibody (mAb), linker, and cytotoxic drug. Formulation development must focus on maintaining the stability and potency of the mAb, while maintaining the integrity of the linker. The case study that fol- lows describes product development for phase 1 clinical manufacturing of an ADC for an external customer. The customer had performed a pre- formulation study of the naked mAb, establishing histidine as a suitable buffer and evaluating the addition of sodium chloride or sorbitol to create an isotonic solution. However, they had not performed extensive stability or pre-formulation studies using the conjugated molecule. The goal of the study was to develop a solution formulation with an option of developing a lyophilized formulation if early stability studies indicated it was needed. The ADC Analytical Toolbox ADC product development requires a more extensive analytical tool box than other biologic products to understand the impact of formulation and process on stability (Figure 1). A Case Study FORMULATION & LYOPHILIZATION CYCLE DEVELOPMENT OF AN ADC 1 Figure 1: Analytical methods for ADC development Wendy Saffell-Clemmer Director, R&D Baxter BioPharma Solutions
Transcript of A Case Study FORMULATION & LYOPHILIZATION CYCLE ...

Antibody Drug Conjugates (ADCs) are complex molecules consisting of a monoclonal antibody (mAb), linker, and cytotoxic drug. Formulation development must focus on maintaining the stability and potency of the mAb, while maintaining the integrity of the linker. The case study that fol-lows describes product development for phase 1 clinical manufacturing of an ADC for an external customer. The customer had performed a pre-formulation study of the naked mAb, establishing histidine as a suitable buffer and evaluating the addition of sodium chloride or sorbitol to create an isotonic solution. However, they had not performed extensive stability or pre-formulation studies using the conjugated molecule. The goal of the study was to develop a solution formulation with an option of developing a lyophilized formulation if early stability studies indicated it was needed.
The ADC Analytical ToolboxADC product development requires a more extensive analytical tool box than other biologic products to understand the impact of formulation and process on stability (Figure 1).
A Case StudyFORMULATION & LYOPHILIZATION CYCLE DEVELOPMENT OF AN ADC
1
Figure 1: Analytical methods for ADC development
Wendy Saffell-ClemmerDirector, R&D
Baxter BioPharma Solutions

While the methods in Figure 1 are a stan-dard toolbox, not all ADCs behave the same, and method optimization is required. In particular, Imaging Capillary Electrophoresis (iCE), Drug Anti-body Ratio (DAR) and Free-Drug methods require development and optimization for each ADC. Reverse-phase HPLC is commonly utilized to monitor for free-drug to ensure integrity of the linkage during formulation development and sta-bility studies, though mass spectrometry may be used when additional sensitivity is required. The criticality of monitoring for free-drug throughout the development program will differ depending on the method of conjugation utilized. In the case study, free drug was not detected throughout development even under stressed conditions. iCE (Figure 2) is used to monitor for chang-es in isoform profile and is a valuable tool for the detection of charge variants, particularly deamida-tion. DAR, a measurement of the number of cytotoxic drugs linked to each mAb, is commonly determined by hydrophobic interaction chroma-tography (HIC). The DAR profile differs depend-ing on the conjugation method used. In the case study, changes in DAR (Figure 3) were not ob-served, even under stressed conditions. Size Exclusion Chromatography (SEC) is used to monitor for soluble aggregates. Aggrega-tion is a common mode of degradation for ADCs, and SEC (Figure 4) was used throughout the case study. SDS-PAGE (Figure 5) and CE-PAGE (Figure 6) are utilized to monitor fragmentation. Appearance of non-reduced samples will differ depending on the method of conjugation used.
In the case study, changes in fragmentation pat-tern were not observed, even in stressed samples.
2
Figure 3: DAR-HIC profile for a lyophilized sample at T0
Figure 2: iCE Electropherograms at T0 and after storage at 1 week at 50°C
Figure 4: SEC Chromatograms at T0 and after storage as a liquid for 1 week at 50°C
Figure 5: SDS-PAGE of non-reduced and reduced ADC
Figure 6: CE-PAGE of non-reduced and reduced ADC
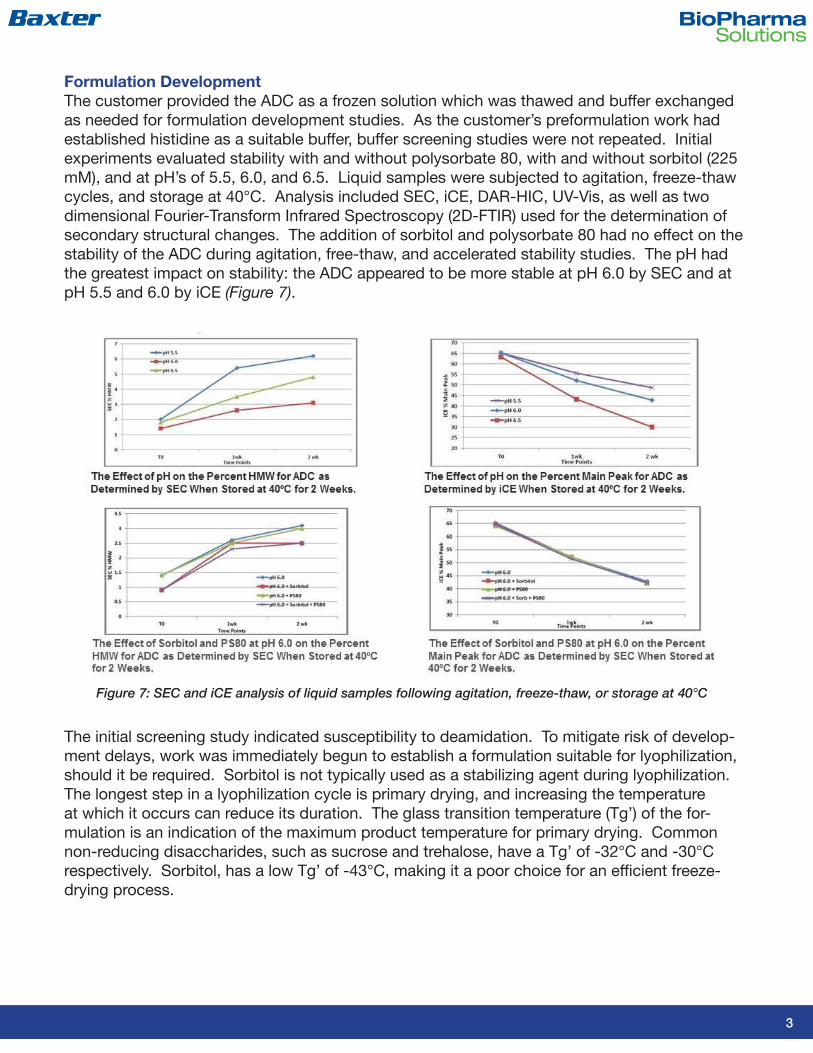
Formulation DevelopmentThe customer provided the ADC as a frozen solution which was thawed and buffer exchanged as needed for formulation development studies. As the customer’s preformulation work had established histidine as a suitable buffer, buffer screening studies were not repeated. Initial experiments evaluated stability with and without polysorbate 80, with and without sorbitol (225 mM), and at pH’s of 5.5, 6.0, and 6.5. Liquid samples were subjected to agitation, freeze-thaw cycles, and storage at 40°C. Analysis included SEC, iCE, DAR-HIC, UV-Vis, as well as two dimensional Fourier-Transform Infrared Spectroscopy (2D-FTIR) used for the determination of secondary structural changes. The addition of sorbitol and polysorbate 80 had no effect on the stability of the ADC during agitation, free-thaw, and accelerated stability studies. The pH had the greatest impact on stability: the ADC appeared to be more stable at pH 6.0 by SEC and at pH 5.5 and 6.0 by iCE (Figure 7).
3
Figure 7: SEC and iCE analysis of liquid samples following agitation, freeze-thaw, or storage at 40°C
The initial screening study indicated susceptibility to deamidation. To mitigate risk of develop-ment delays, work was immediately begun to establish a formulation suitable for lyophilization, should it be required. Sorbitol is not typically used as a stabilizing agent during lyophilization. The longest step in a lyophilization cycle is primary drying, and increasing the temperature at which it occurs can reduce its duration. The glass transition temperature (Tg’) of the for-mulation is an indication of the maximum product temperature for primary drying. Common non-reducing disaccharides, such as sucrose and trehalose, have a Tg’ of -32°C and -30°C respectively. Sorbitol, has a low Tg’ of -43°C, making it a poor choice for an efficient freeze-drying process.
4
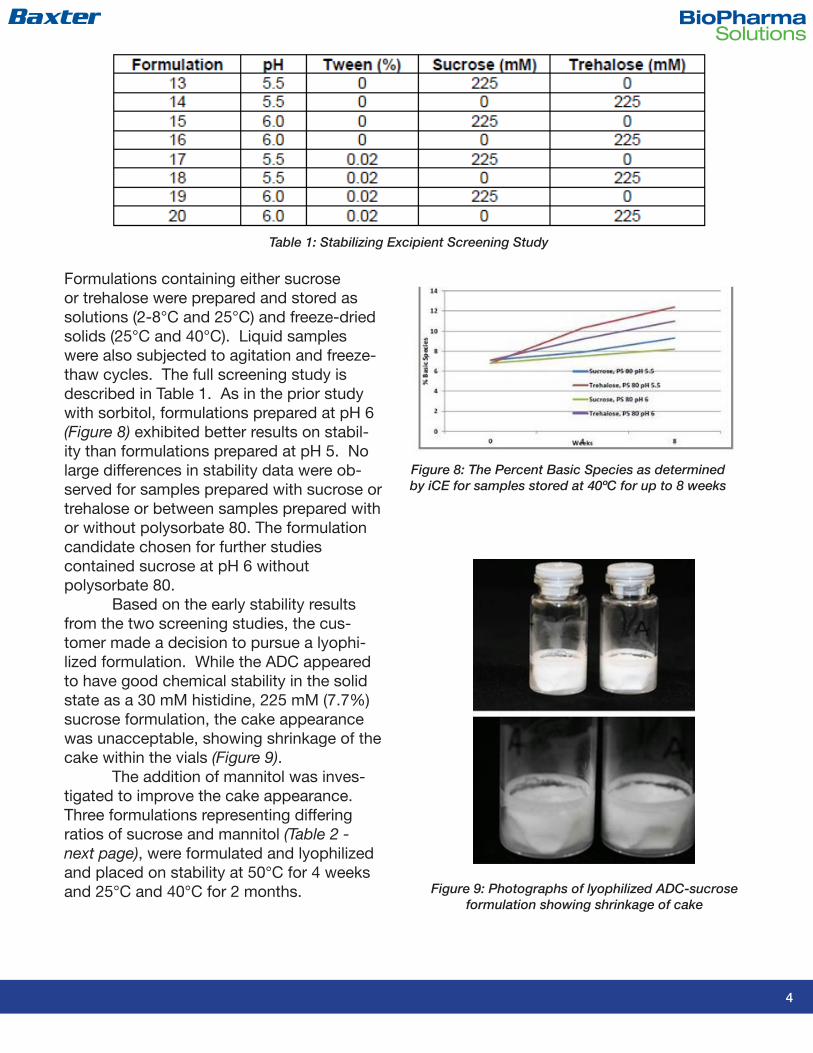
Formulations containing either sucrose or trehalose were prepared and stored as solutions (2-8°C and 25°C) and freeze-dried solids (25°C and 40°C). Liquid samples were also subjected to agitation and freeze-thaw cycles. The full screening study is described in Table 1. As in the prior study with sorbitol, formulations prepared at pH 6 (Figure 8) exhibited better results on stabil-ity than formulations prepared at pH 5. No large differences in stability data were ob-served for samples prepared with sucrose or trehalose or between samples prepared with or without polysorbate 80. The formulation candidate chosen for further studies contained sucrose at pH 6 without polysorbate 80. Based on the early stability results from the two screening studies, the cus-tomer made a decision to pursue a lyophi-lized formulation. While the ADC appeared to have good chemical stability in the solid state as a 30 mM histidine, 225 mM (7.7%) sucrose formulation, the cake appearance was unacceptable, showing shrinkage of the cake within the vials (Figure 9). The addition of mannitol was inves-tigated to improve the cake appearance. Three formulations representing differing ratios of sucrose and mannitol (Table 2 - next page), were formulated and lyophilized and placed on stability at 50°C for 4 weeks and 25°C and 40°C for 2 months.
Table 1: Stabilizing Excipient Screening Study
Figure 8: The Percent Basic Species as determined by iCE for samples stored at 40ºC for up to 8 weeks
Figure 9: Photographs of lyophilized ADC-sucrose formulation showing shrinkage of cake

5
Significant differences were observed (Figure 10) by both iCE and SEC: both test methods dem-onstrated that the 3% sucrose – 3% mannitol combination offered the greatest stability.
Table 2: Sucrose-Mannitol Screening Studies
Figure 10: SEC and iCE results from Sucrose-Mannitol studies
Lyophilization DevelopmentDevelopment of a lyophilization cycle was conducted with the 30 mM histidine, 88 mM su-crose (3%), 165 mM mannitol (3%) pH 6.0 formulation. Lyophilization cycles typically consist of three steps (Figure 11), freezing, primary drying, and secondary drying. During the freezing step, the shelf temperature is reduced and ice nucleation occurs. The primary drying step is the longest step in the process. The shelf temperature is increased and a vacuum is applied, resulting in ice sublimation and the removal of approximately 90% of the water in the vial. During the secondary drying step, the shelf temperature is increased further and the more tightly-bound water is removed. Typically, the length of the secondary drying step controls the final moisture content of the product.
Figure 11: The three-step lyophilization process
6
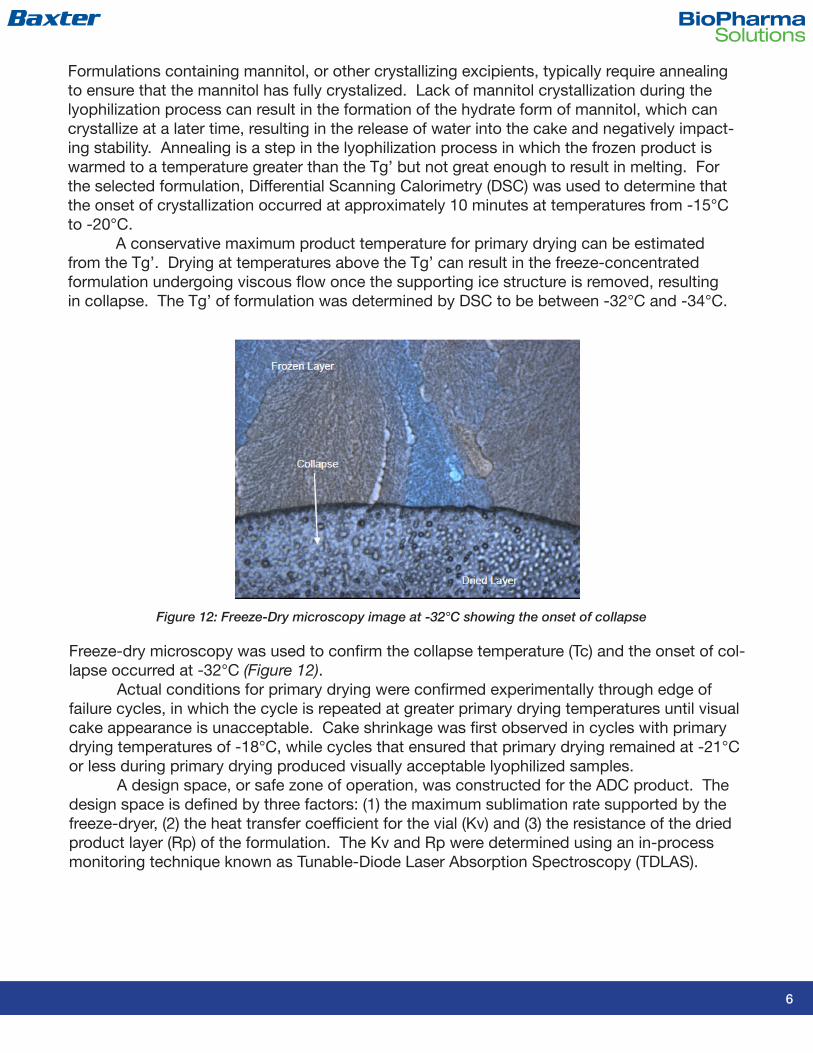
Formulations containing mannitol, or other crystallizing excipients, typically require annealing to ensure that the mannitol has fully crystalized. Lack of mannitol crystallization during the lyophilization process can result in the formation of the hydrate form of mannitol, which can crystallize at a later time, resulting in the release of water into the cake and negatively impact-ing stability. Annealing is a step in the lyophilization process in which the frozen product is warmed to a temperature greater than the Tg’ but not great enough to result in melting. For the selected formulation, Differential Scanning Calorimetry (DSC) was used to determine that the onset of crystallization occurred at approximately 10 minutes at temperatures from -15°C to -20°C. A conservative maximum product temperature for primary drying can be estimated from the Tg’. Drying at temperatures above the Tg’ can result in the freeze-concentrated formulation undergoing viscous flow once the supporting ice structure is removed, resulting in collapse. The Tg’ of formulation was determined by DSC to be between -32°C and -34°C.
Figure 12: Freeze-Dry microscopy image at -32°C showing the onset of collapse
Freeze-dry microscopy was used to confirm the collapse temperature (Tc) and the onset of col-lapse occurred at -32°C (Figure 12). Actual conditions for primary drying were confirmed experimentally through edge of failure cycles, in which the cycle is repeated at greater primary drying temperatures until visual cake appearance is unacceptable. Cake shrinkage was first observed in cycles with primary drying temperatures of -18°C, while cycles that ensured that primary drying remained at -21°C or less during primary drying produced visually acceptable lyophilized samples. A design space, or safe zone of operation, was constructed for the ADC product. The design space is defined by three factors: (1) the maximum sublimation rate supported by the freeze-dryer, (2) the heat transfer coefficient for the vial (Kv) and (3) the resistance of the dried product layer (Rp) of the formulation. The Kv and Rp were determined using an in-process monitoring technique known as Tunable-Diode Laser Absorption Spectroscopy (TDLAS).

7
Equipment capability varies between lyophilizers and can be experimentally determined using ice-slab testing. The laboratory Lyostar freeze-dryers have lower capability than produc-tion dryers, and as a conservative approach, the capability line for the laboratory dryers was used for construction of the design space.
In the design space (Figure 13), the equipment capability line is blue, the shelf tem-perature (Ts) isotherms are black and the product temperature isotherms (Tb) are dashed red lines. The experimentally determined maximum product temperature of -21°C is marked with a solid red line. The most efficient cycle is represented by conditions in the upper left corner of the green zone and would require 23 hours. These conditions were utilized in a laboratory challenge run, utilizing an IgG in place of the ADC, and were successful in main-taining the product temperature less than -21°C during primary drying and of producing cakes of expected acceptable appearance. The condition marked with a white circle was used for the demonstration batch and represents a cycle time of 40 hours. The demonstra-tion batch was placed on long term stability for 18 months at 5°C and 25°C as well as for 6 months at 40°C. By all test methods, the lyophilized product remained stable.
SummaryEarly stability studies indicated that the ADC was not stable in a liquid formulation, but development activities were rapidly transitioned to focus on a lyophilized presentation and clinical timelines were unaffected. The use of a scientifically-sound lyophilization develop-ment process resulted in an efficient, well-defined, robust process, which resulted in a stable product. The formulation and manufacturing process utilized for the laboratory demonstra-tion batch were successfully transferred to manufacturing scale at Baxter’s Halle Germany facility for clinical manufacturing.
Figure 13: Design space for primary drying of the ADC product
Source- Podium Presentation “ADC Product Development – Analytical, Formulation, and Lyophilization cyle Development For ADCs” from AAPS Annual Meeting, Orlando, FL, October, 2015. Authored by Wendy Saffell-Clemmer, Director, R&D, Baxter BioPharma Solutions.
Baxter is a registered trademark of Baxter International Inc. 920955-00 2017


![[Thomas a. Jennings] Lyophilization Introduction (BookFi.org)](https://static.fdocuments.in/doc/165x107/55cf94c3550346f57ba4379a/thomas-a-jennings-lyophilization-introduction-bookfiorg.jpg)