A case study: A market analysis and a capability assessment
104
A case study: A market analysis and a capability assessment Master of Science Thesis in the Management and Economics of Innovation Programme ALEXANDER ERIKSSON ERIK KARLSSON Department of Technology Management and Economics Division of Innovation Engineering and Management CHALMERS UNIVERSITY OF TECHNOLOGY Gothenburg, Sweden, 2012 Report No. E 2012:057
Transcript of A case study: A market analysis and a capability assessment
A case study: A market analysis and a capability
assessment Master of Science Thesis
in the Management and Economics of Innovation Programme
ALEXANDER ERIKSSON
ERIK KARLSSON
Department of Technology Management and Economics
Division of Innovation Engineering and Management
CHALMERS UNIVERSITY OF TECHNOLOGY
Gothenburg, Sweden, 2012
Report No. E 2012:057

II

III
MASTER’S THESIS E 2012:057
A case study: A market analysis and a capability assessment
ALEXANDER ERIKSSON
ERIK KARLSSON
Tutor, Chalmers: Christian Sandström
Department of Technology Management and Economics
Division of Innovation Engineering and Management
CHALMERS UNIVERSITY OF TECHNOLOGY
Göteborg, Sweden 2012

IV
A case study: A market analysis and a capability assessment
Alexander Eriksson
Erik Karlsson
© Alexander Eriksson & Erik Karlsson, 2012
Master’s Thesis E 2012:057
Department of Technology Management and Economics
Division of Innovation Engineering and Management
Chalmers University of Technology
SE-412 96 Göteborg, Sweden
Telephone: + 46 (0)31-772 1000
Chalmers Reproservice
Göteborg, Sweden 2012

V
Abstract
The Focal Business Unit (FBU) is a specific business unit within Acme Group that
serves the focal industry with product1s and related products and services. The
FBU has identified that product1s for segment1 applications is one of the
strategically most important markets for growing future business since the
product1 market has been growing notably during the last decade. The FBU has
primarily served the product1 market with premium product1 solutions but
overtime the product1 market has become increasingly more cost focused,
which implies certain challenges for the FBU. For this reason, the FBU has
interest of gaining a better understanding of the product1 market
attractiveness and how they potentially could become more competitive within
this market.
The purpose of the thesis is to investigate the product1 market and explore the
FBU’s possibilities to expand their business within this increasingly cost driven
market. This is done by analyzing the product1 markets’ attractiveness and by
assessing how the FBU, as a premium supplier, should adapt their internal
capabilities in order to increase competitiveness by offering product1s with an
adjusted price-performance balance. The research followed a structure
containing two separate modules each with its own theoretical framework,
empirical part and analysis part. The first module evaluated the product1
market attractiveness in order to identify the focal markets that are most
interesting for Acme, while the second module focused on evaluating potential
changes of Acme’s internal capabilities to become more competitive in the
markets identified in the first module.
In the market analysis the Chinese, Indian and Western European product1
markets were identified as the most attractive ones considering the markets’
characteristics and the business unit’s market presence. The capability analysis
resulted in short term and long term recommendations proposing how the FBU
should adapt their internal capabilities to become more competitive in these
markets. In the short term the FBU is recommended to: increase the production
coordination of product1s; improve the production planning; evaluate and
reselect suppliers; employ additional application engineers and increase their
competence. In the long term the FBU is recommended to focus on: localizing
production in India; redesigning product1s to allow for greater coordination
between product1 types and application segments; developing product1s with
increased maintenance intervals.
VI
Acknowledgements
This master’s thesis has been conducted at the company Acme during the spring of 2012, and it has been written as a part of the master’s program Management and Economics of Innovation. The thesis was conducted under the supervision of Christian Sandström at the Center for Business Innovation at Chalmers University of Technology and our advisor at Acme.
We are very thankful for all the support and guidance we have been given by our supervisors during this time period. Without their insightful input and constructive criticism we would not have been able to reach this far. Furthermore, we would like to thank our interviewees at Acme in Sweden, France, Netherlands, Germany, Austria, Italy, Czech Republic, India, China and US for giving us the opportunity to conduct interviews with them and sharing their knowledge.
Last but not the least we wish to thank our friends and family who have supported us not only during this thesis but throughout all of the years at Chalmers.
Gothenburg, June, 2012
--------------------------------------------- Alexander Eriksson
--------------------------------------------- Erik Karlsson
VII
Content 1 Introduction .......................................................................................................................................... 1
1.1 Background.................................................................................................................................... 1
1.2 Purpose ......................................................................................................................................... 2
1.3 Research Questions ....................................................................................................................... 2
1.4 Disposition ..................................................................................................................................... 2
2 Method ................................................................................................................................................. 4
2.1 Research Process ........................................................................................................................... 4
2.2 Research Strategy .......................................................................................................................... 5
2.3 Research Design ............................................................................................................................ 5
2.3.1 Selection of Research Design ................................................................................................. 5
2.3.2 Research Questions and Guidance for Data Collection ......................................................... 6
2.3.3 Research Methods ................................................................................................................. 7
2.3.4 Data Analysis ........................................................................................................................ 10
2.4 Research Quality ......................................................................................................................... 11
2.4.1 Construct Validity ................................................................................................................. 11
2.4.2 Internal Validity .................................................................................................................... 11
2.4.3 External Validity ................................................................................................................... 12
2.4.4 Reliability .............................................................................................................................. 12
3 Market Attractiveness: Theoretical Framework ................................................................................ 13
3.1 Formulating Strategies ................................................................................................................ 13
3.2 Market Analysis ........................................................................................................................... 13
3.3 A Framework for Market Analysis ............................................................................................... 15
4 Market Attractiveness: Empirical Findings ......................................................................................... 17
4.1 Product1 market Structure ......................................................................................................... 17
4.2 Geographical Market Characteristics .......................................................................................... 19
4.3 Competitive Environment ........................................................................................................... 21
4.4 Entry Barriers ............................................................................................................................... 22
4.5 Key Purchasing Criteria ............................................................................................................... 24
5 Market Attractiveness: Analysis ......................................................................................................... 27
5.1 The Product1 markets’ Dependence ........................................................................................... 27
5.2 Geographical Market Characteristics .......................................................................................... 28
5.3 Competitive Environment ........................................................................................................... 30
VIII
5.4 Entry Barriers ............................................................................................................................... 32
5.5 Key Purchasing Criteria Fit .......................................................................................................... 35
5.6 Conclusion: Selection of Markets ................................................................................................ 38
6 Capability Assessment: Theoretical Framework ................................................................................ 43
6.1 The Resource Based View of the Firm ......................................................................................... 43
6.2 Resources, Competencies and Capabilities ................................................................................. 43
6.3 Resource and Capability Assessment .......................................................................................... 44
6.4 Strategies for Competitive Advantage ........................................................................................ 45
6.4.1 Drivers of Differentiation ..................................................................................................... 45
6.4.2 Drivers of Cost Advantage .................................................................................................... 46
6.5 Capability Assessment Framework ............................................................................................. 49
7 Capability Assessment: Empirical Findings ......................................................................................... 51
7.1 China: Customers ........................................................................................................................ 51
7.2 China: Competitors...................................................................................................................... 52
7.3 India: Customers ......................................................................................................................... 53
7.4 India: Competitors ....................................................................................................................... 56
7.6 Western Europe: Customers ....................................................................................................... 57
7.7 Western Europe: Competitors .................................................................................................... 58
7.8 Acme ............................................................................................................................................ 60
7.8.1 Manufacturing and Supply Chain ......................................................................................... 60
7.8.2 Research and Development ................................................................................................. 64
7.8.3 Sales and Marketing ............................................................................................................. 65
8 Capability Assessment: Analysis ......................................................................................................... 67
8.1 China: Key Purchasing Criteria Assessment ................................................................................ 67
8.2 China: Capability Assessment ...................................................................................................... 71
8.2.1 Price...................................................................................................................................... 72
8.2.2 Relationship ......................................................................................................................... 73
8.2.3 Reliability .............................................................................................................................. 73
8.3 India: Key Purchasing Criteria Assessment ................................................................................. 74
8.4 India: Capability Assessment ....................................................................................................... 76
8.4.1 Localization .......................................................................................................................... 77
8.4.2 Price...................................................................................................................................... 79
8.4.3 Relationship ......................................................................................................................... 79
8.5 Western Europe: Key Purchasing Criteria Assessment ............................................................... 80
IX
8.6 Western Europe: Capability Assessment .................................................................................... 83
8.6.1 Design ................................................................................................................................... 84
8.6.2 Price...................................................................................................................................... 85
8.6.3 Relationships ........................................................................................................................ 86
8.6.4 Quality .................................................................................................................................. 87
8.7 Conclusion: Capability Assessment ............................................................................................. 88
8.7.1 Price...................................................................................................................................... 88
8.7.2 Relationship ......................................................................................................................... 90
8.7.3 Reliability .............................................................................................................................. 90
8.7.4 Final Remark......................................................................................................................... 91
9 Conclusions ......................................................................................................................................... 92
10 References ........................................................................................................................................ 94
1
1 Introduction In this initial section the thesis’ subject will be introduced and motivated in the background
description. This discussion will lead to a presentation of the thesis’ purpose and the research
questions. In the end a brief description of the thesis’ disposition will be given.
1.1 Background Acme Group is a leading global supplier of the focal product group and related products and services
(Anonymous source-2 2011). The company’s products fulfill high quality demands and are utilized in
a diverse set of applications in various industries (Anonymous source 2010). Thus, consumers
worldwide are benefitting from using products and services that utilize the company’s product1s.
One of the industries that utilize products from the focal product group is the focal industry. The
Focal Business Unit (FBU) is a specific business unit within Acme Group that serves the focal industry
with products from the focal product group and related products and services. The focal industry
contains several component markets for a wide range of product2 types and the FBU serves many of
these markets. In the past, the FBU has mainly focused on supplying focal product group solutions for
application segments such as segment4 and segment8 but one application segment that the FBU has
identified as one of the most strategically important markets for growing future business is
segment1.
Segment1 is the market for product1s used in product2s and related services. This market can be
segmented into the market for product1s used in OEMs’ production of new product2s and the
aftermarket where the segment1 operators need replacement product1s in existing product2s as
well as related services. The product1 market has been growing notably during the last decade
(Anonymous source 2012). The FBU has traditionally been positioned as a premium component
supplier within the product1 market, which partly has its origin in Acme’s position as a
technologically leading product1 manufacturer (Respondent9 2012a). This has resulted in that the
business unit primarily is serving the product1 market with premium product1 solutions
(Respondent9 2012a).
Over time the product1 market has become increasingly more cost focused which implies certain
challenges for the FBU in order to stay competitive within this market (Respondent9 2012a). Some of
the FBU’s main competitors have market positions and strategic directions that are more suitable for
the changing customer demands within the product1 market. The FBU has expressed an interest to
expand their business within the product1 market due to the attractive market growth and the FBU’s
relatively good product portfolio fit for the market. The FBU is interested in gaining a better
understanding of the product1 market and its attractiveness for the organization (Respondent9
2012a). The market attractiveness is influenced by external factors such as competition, market size
and growth but also by customer’s preferences. The latter is related to the business unit’s offerings
and the FBU would also like to gain additional knowledge of how their offerings could become more
competitive. Here, the capabilities that are formed by the internal resources and competencies of
the company become the focal issue. Therefore, it will be relevant to investigate how the FBU could
adapt their capabilities in order to be able to deliver more competitive offerings.

2
1.2 Purpose The purpose is to explore Acme FBU’s possibilities to expand their business within the increasingly
cost driven product1 market by analyzing the market attractiveness and assess what strategic
changes the FBU, as a premium supplier, should consider in order to increase their competitiveness
by offering product1s with an adjusted price-performance balance.
1.3 Research Questions In order to fulfill the purpose of the thesis the following research questions will be addressed:
1. Which are the most attractive product1 markets for the FBU?
2. What strategic capabilities should be adjusted in order for the FBU to increase their
competitiveness within the product1 market by offering product1s with an adjusted price-
performance balance?
To answer the research questions two theoretical frameworks will be developed through a rigorous
literature study. The frameworks will guide the empirical investigation at the FBU as well as the data
analysis.
1.4 Disposition This part gives the reader an overview of how the thesis is structured and its different chapters see
figure 1.
Figure 1 – Description of the report’s disposition
After the introduction of the thesis, which provides the background to the topic and the purpose of
the thesis, the methodology of how the research was conducted will be explained. In this chapter,
the research process, strategy, design and quality will be described. After the methodology chapter
Introduction Method Market
attractiveness framework
Empirical investigation of
market attractiveness
Analysis of market attractiveness
Capability analysis framework
Empirical investigation of
internal capabilities
Analysis of internal capabilities
Discussion and conclusions
Recommendations

3
the thesis has two different parts focusing on each of the research questions. The first part focuses
on the first research question. Thus, the first part is about the product1 market attractiveness for
Acme. This is done by first having a chapter developing a framework for market attractiveness
analysis. The two following chapters then describe the empirical investigation of the product1
market attractiveness and the product1 market attractiveness analysis.
The second part instead focuses on the second research question, which is about assessing the FBU’s
capabilities that need to be adjusted in order for the business unit to achieve increased
competiveness within the product1 market. Structurally this is done in the same way as the first
research question. The outcome of the first analysis is used as input for the second part. First a
capability analysis framework is developed, based on a literature review. The following chapter then
describes the empirical findings from the second empirical investigation. Thereafter, the capability
analysis framework is applied in the next chapter to conduct the capability analysis of the empirical
findings. A discussion of the findings will be done after this and the thesis will conclude with
recommendations on how the company should pursue in the future.

4
2 Method In this part of the thesis the methodology used in this project will be presented. The chapter covers
the research process of the thesis, the research strategy, the research design and finishes with a
discussion about the quality of the study.
2.1 Research Process In order to give a more complete overview of how the study was conducted a description of the
research process and all of its different stages will be provided in this part. The research process was
set up in order to provide guidance and a good overview of the progression of the project.
Considering the timeframe of 21 weeks, during which the research was conducted, the research
process made it possible to more easily plan what needed to be done each week in the time period.
The research process consisted of nine steps that are shown in figure 2. Even though the process is
illustrated as being linear it is important to realize that the process contained a lot of iterations.
Figure 2 - Illustration of the research process applied in the report
The research began with a pre-study where the main objectives were to get a basic understanding of
the problems facing the company and to select the focal issue of the thesis. In this part of the
research process we had meetings with both our tutor at Acme, person Respondent9, and our tutor
at Chalmers, Christian Sandström, in order to select and narrow down the purpose of the thesis. A
meeting was also held where all parties were present (the researchers, the tutor at Acme and the
tutor at Chalmers) in order to align the interests and better be able to agree on the focal issue and
scope of the thesis.
The second step in the research process was the planning phase. Here a planning report was written
containing the preliminary methodology on how to conduct the research and what needed to be
done in different periods of time during the time period of the thesis.
In order to guide data collection as well as data analysis, a literature review was conducted to
identify relevant theoretical areas related to the research questions. The literature review resulted in
two frameworks, one for each data collection and data analysis phase. It was considered early on
that the research process would consist of two phases or what we would like to call “modules”. The
Pre-study Planning phase Literature review
Data collection 1 Market
attractiveness analysis
Data collection 2
Capability analysis Discussion and
conclusions Recommendations
5
reason for this is that data collection and data analysis was done in two different sets, as can be seen
in the list above. The first module was connected to the first research question and the second
module to the second research question. Thus, the first module was about assessing the market
attractiveness of the product1 market while the other module was about assessing what capabilities
Acme need to change in order to expand within the product1 market. Data collection was done
through semi-structured interviews as well as through documentation from the company. In total 15
employees within the company were interviewed during the empirical investigations.
After the two data collection and data analysis modules had been completed it was necessary to
have a discussion to arrive at the conclusions of the thesis. The research process ended with
recommendations on how Acme could adapt their capabilities in order to expand within the
product1 market.
2.2 Research Strategy According to Bryman & Bell (2011) it is useful to distinguish between research strategies that are
quantitative and qualitative, as they are associated with quite distinctive ways of doing business
research. A quantitative research strategy is very much focused on measuring a certain phenomenon
by collecting and analyzing data while a qualitative research strategy is more focused on interpreting
the reality an object of study faces. The research strategy of the thesis was mostly qualitative in
nature as data was collected and interpreted in relation to a specific case. However, some elements
of quantitative research were also applied as measurements were used to interpret some of the
issues in relation to the research questions. The research strategy of the thesis was thus two faceted.
Accordingly, inferences were done mostly following the logic of inductive reasoning. Thus, the focus
was on explaining the reality that the company faces. Yet, the research strategy was also
characterized by an abductive approach for doing inferences. The reason for this is that the
knowledge about the company cannot be regarded as complete and during the project it was
essential to do some guess working by constantly constructing explanatory hypotheses in order to
move on in the research process. As the research is practically oriented the objective of the research
strategy was to contribute to the knowledge within the company.
2.3 Research Design Here the type of research design that was used and why it was selected will be explained.
Furthermore, how we arrived at the research questions of the study, what guided the collection of
that data, how data was collected and the type of research methods used will be explained. The part
ends with a description of how the data analysis was conducted.
2.3.1 Selection of Research Design
The function of a research design is to ensure that the evidence obtained makes it possible to answer
the initial research questions as unambiguously as possible (De Vaus 2001). According to Philliber et
al. (1980) a research design can be considered as a "blueprint" for research and should cover at least
four problems: which questions to study, which data that is relevant, what data to collect, and how
to analyze the results. A research design can be defined as a framework for how to collect and
analyze data (Bryman & Bell 2011).
In order to be able to execute the research and to convincingly be able to answer the research
questions a specific research design was chosen. The design chosen was a case study design because
an in-depth empirical investigation of a single unit of analysis, Acme, was made in order to answer
6
the research questions and thus the purpose of the thesis. According to Yin (1981) a case study
design can provide a more complete understanding of an event or situation in its real life context and
it is suitable in situations where the boundaries of a phenomenon and its context is unclear.
Furthermore, Yin (2003) states that the most important application of a case study is to explain the
presumed casual links in real-life interventions that are too complex for the survey or experimental
strategies. A case study is appropriate when something unknown is to be explored and when there is
a need to probe deeper to look for explanations and comparing them against each other (Holmén
2011).Case studies are also a good choice for investigating how something really is like within a
reasonable time frame (Holmén 2011).
2.3.2 Research Questions and Guidance for Data Collection
In order for us to know what data to collect, frameworks for supporting our own thinking and
reasoning were developed. These frameworks guided our data collection phase as well as our
analysis phase and provided a certain structure for the whole process. The two frameworks that
guided our data collection were developed based partly on gaining a good understanding of the
problem facing the company and partly on a rigorous literature study. Therefore, initial interviews
were conducted to get a basic understanding of what the knowledge need was within the company
and what potential areas that were interesting to investigate in connection to the problem at hand.
From these interviews, we gained the understanding that in order to investigate the problem two
different perspectives needed to be considered, which made us arrive at two different research
questions. As stated in our research questions and purpose, an evaluation of the market
attractiveness of the product1 market was needed as well as an assessment of the capability fit of
Acme and what potential capabilities that can and need to be changed in order for Acme to expand
within the product1 market.
When we had gained the insight that the problem was two folded and had one rather externally
oriented question and one rather internally oriented, we focused on the strategic management
literature in order to guide our research. In order to identify the most relevant and actual literature
within the area, we asked our tutor as well as previous teachers at our master’s program for help.
We also screened the literature of previous courses we have had during our education to identify
articles or books that could be of interest for our study. Our third way of identifying relevant
literature was to search the Internet by using key words related to our research questions. Here, we
mostly used Google Scholar to find relevant articles and books, as it is possible to see how many
times that they had been referenced by others. This gave us a fairly good understanding of their
credibility and reliability within the academia. After a sufficient amount of literature related to our
research questions had been found, an extensive review of the literature was done. Each article and
book was given a rating in terms of how closely they matched the research subject in order for us to
focus on the most relevant literature for creating our frameworks. For example, Michael Porter’s five
forces framework and Robert M. Grant’s resource based view perspective were important
theoretical viewpoints that were integrated into our frameworks. These two theories and their
respective authors/creators have very high credibility within the strategic management literature
based on the amount of references.
The first framework that was created was in line with our first research question. Thus, this
framework is rather externally oriented and focused more on areas that were externally affecting the
7
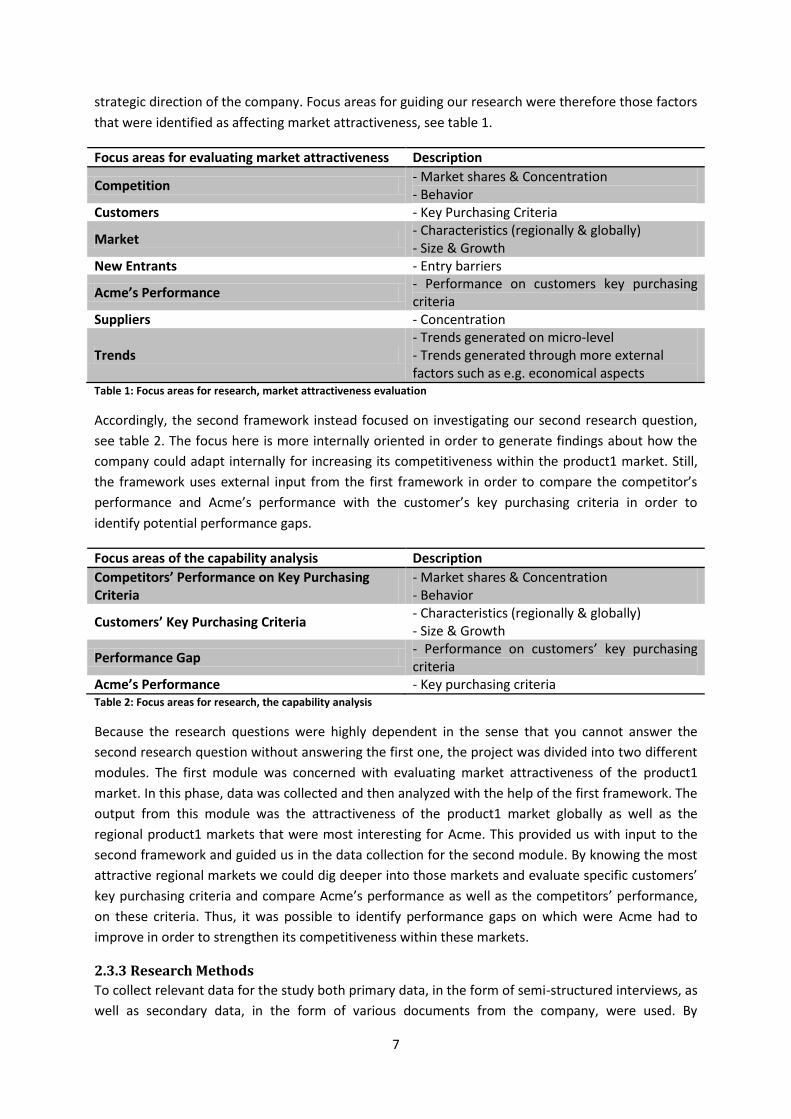
strategic direction of the company. Focus areas for guiding our research were therefore those factors
that were identified as affecting market attractiveness, see table 1.
Focus areas for evaluating market attractiveness Description
Competition - Market shares & Concentration - Behavior
Customers - Key Purchasing Criteria
Market - Characteristics (regionally & globally) - Size & Growth
New Entrants - Entry barriers
Acme’s Performance - Performance on customers key purchasing criteria
Suppliers - Concentration
Trends - Trends generated on micro-level - Trends generated through more external factors such as e.g. economical aspects
Table 1: Focus areas for research, market attractiveness evaluation
Accordingly, the second framework instead focused on investigating our second research question,
see table 2. The focus here is more internally oriented in order to generate findings about how the
company could adapt internally for increasing its competitiveness within the product1 market. Still,
the framework uses external input from the first framework in order to compare the competitor’s
performance and Acme’s performance with the customer’s key purchasing criteria in order to
identify potential performance gaps.
Focus areas of the capability analysis Description
Competitors’ Performance on Key Purchasing Criteria
- Market shares & Concentration - Behavior
Customers’ Key Purchasing Criteria - Characteristics (regionally & globally) - Size & Growth
Performance Gap - Performance on customers’ key purchasing criteria
Acme’s Performance - Key purchasing criteria Table 2: Focus areas for research, the capability analysis
Because the research questions were highly dependent in the sense that you cannot answer the
second research question without answering the first one, the project was divided into two different
modules. The first module was concerned with evaluating market attractiveness of the product1
market. In this phase, data was collected and then analyzed with the help of the first framework. The
output from this module was the attractiveness of the product1 market globally as well as the
regional product1 markets that were most interesting for Acme. This provided us with input to the
second framework and guided us in the data collection for the second module. By knowing the most
attractive regional markets we could dig deeper into those markets and evaluate specific customers’
key purchasing criteria and compare Acme’s performance as well as the competitors’ performance,
on these criteria. Thus, it was possible to identify performance gaps on which were Acme had to
improve in order to strengthen its competitiveness within these markets.
2.3.3 Research Methods
To collect relevant data for the study both primary data, in the form of semi-structured interviews, as
well as secondary data, in the form of various documents from the company, were used. By

8
collecting data with two different research methods it was possible to triangulate information for
establishing greater reliability of the data. Through triangulation, thick descriptions of certain
phenomena could be created.
2.3.3.1 Semi-structured Interviews
The interviews that were conducted were semi-structured. The reason for this is that semi-structured
interviews allow a certain level of structure while still making it possible to probe deeper and ask
follow up questions if something interesting is said during the interview. The interviews loosely
followed a certain structure with regard to our frameworks that guided us in the data collection.
Thus, structured questions on a fairly general level could be asked while still allowing us to probe
deeper if something interesting was mentioned. Semi-structured interviews were therefore very
suitable for the study.
The semi-structured interviews were conducted following a four-step process in order to establish a
consistent way of working. This made it easier to trace where we were in the data collection phase
and it also reduced the risk that the process itself would affect the outcome of our interviews.
Therefore, the risk that the variation in the process would affect the validity and reliability of our
results was mitigated. The four phases that every interview followed were the following:
investigation of potential interviewees’ areas of knowledge, selection of interviewee and writing
questions; initial contact; execution of the interview; transcription. These phases are explained more
in detail in the table 3.
Interview phase Description Activities
Phase 1: Knowledge assessment, selection of interviewees and writing questions
- Investigating the interviewee’s area of knowledge - Selection of interviewee - Writing questions in line with interviewee’s knowledge
- Looking up potential interviewee’s position within the company - Elaborating on potential areas of knowledge - Write questions and develop interview guide
Phase 2: Initial contact - Contacting interview object to inform about the project and its purpose and scheduling the interview
- Contact interviewee either by mail or by phone
Phase 3: Execution of interview - Performing the interview - Asking questions loosely following the structure according to the interview guide - Probing when needed - Recording of interviews
Phase 4: Transcription - Writing down the interviewee’s answers
- Listen to the recordings and writing down the answers - Storing the documentation
Table 3 - The four phases of the interview process
As seen in the table, the first phase of the interview process consisted of getting a good overview of
the potential interviewees’ areas of knowledge, selecting the interviewee as well as designing and
writing an interview guide from where to ask questions in line with the interviewee’s area of
knowledge. In order to assess a potential interviewee’s area of knowledge, we used organizational
charts to see an interviewee’s position within the company and we also questioned our tutor at

9
Acme to get deeper insights about a person’s knowledge area. The study focused on interviewing
people with the best insights into particular markets or particular business problems within the
client’s organization to the greatest extent possible. For example, when investigating the Chinese and
Indian markets in the market analysis, people working within the local branches of the company in
these markets were interviewed. Snowballing was a way for us to know which people within the
company to talk to. In other words, during interviews we either got referred to people who knew
more about a certain issue or we asked about it. When designing the interview guide for each of the
semi-structured interviews, the topics from our frameworks that to the greatest extent
corresponded to the interviewee’s area of knowledge were selected.
Interviewee Business function Market span Title
Respondent1 Business development India Key account manager
Respondent2 Business development Global Business manager product1 type1
Respondent3 Business development Global Business development manager
Respondent4 Business development East Europe, Middle East & Africa, Latin America, Asia Pacific
Manager competence center
Respondent5 Business development India General manager
Respondent6 Demand chain Global Demand chain manager
Respondent7 Global account management team
Global Global account manager
Respondent8 Global account management team
Global Global account manager
Respondent9 Product, process and development
Global Product, process and development manager
Respondent10 Product, process and development
Global Production manager
Respondent11 Product, process and development
Europe Six sigma black belt
Respondent12 Product, process and development
Global Project manager
Respondent13 Manager China China General manager
Respondent14 Sales North America Managing director
Respondent15 Sales Western Europe Key account manager Table 4 - The interviewees
The next step of the interview processes was to establish an initial contact with the interview object.
Here, the interview object was contacted either by phone or by mail to inform about the project and
to see if the person had any time for an interview. If the person was available for an interview an
important part was to more thoroughly explain the purpose of the project as well as informing about
what type of questions that were to be asked. This was most often done by mail. By doing this, the
interviewee had time to prepare and could thus give us more reliable answers.
The third step of the interview process was all about performing the actual interview. The interviews
were either done face-to-face or by phone or Skype, depending on the interviewee’s localization and
availability. Many of the interviewees were stationed in other places of the world than Sweden,
10
which made it necessary to conduct telephone interviews. During the interviews, questions were
asked loosely following the interview guide and follow up questions were asked when something
interesting was found. Every interview was recorded in order to allow for transcription in the last
phase of the interview process. The interviewees and their respective positions within the company
are shown in table 4.By interviewing people from all of the different functions within the firm,
answers could be compared, thus allowing for triangulation of the answers. Even though most of the
information gained from the interviews was qualitative in nature some of the qualitative data could
be quantified. In some interviews the interviewees were given excel sheets where they were
supposed to express and qualitatively rank Acme’s and the competitors’ performance on customers’
key purchasing criteria in different regional markets on a numerical scale. These qualitative
assessments and rankings were then used to make quantitative assessments in the data analysis.
In the last part of the interview process the recorded interview material was transcribed. This was
done by listening to the recordings and writing down the answers to the interview questions. The
documentation was then stored in a data collection folder to easily be found.
2.3.3.2 Documentation
Secondary data from the company was also collected. This documentation from the company was an
important source of information in order to get a better overview of the overall business strategy of
the FBU, the organizational structure of the FBU as well as the general product1 market situation
facing the focal industry. Organizational charts, business strategy documentation for the FBU as well
as market research documentation about the focal industry and product1 market were collected and
analyzed carefully. Thus, data from all of the documentation were collected and categorized
according to the different parts of the frameworks.
2.3.4 Data Analysis
As the study was done in two modules, analysis of data was done in two different parts. The first one
was a market attractiveness analysis and the other one a capability analysis. The market
attractiveness analysis was done by first structuring the data from the interviews by using the
categories within the framework. Thus, information was grouped into the categories: market,
customers, competition, suppliers, new entrants, trends and Acme’s performance on key purchasing
criteria on a market basis. When information had been grouped it was possible to get a better
overview of the characteristics and trends of the global product1 market as well as of each regional
market. The product1 market was then analyzed both qualitatively and quantitatively. In order to
understand the product1 market a qualitative analysis of the empirical data under each category
within the market attractiveness framework was done. After this the interrelationships between
categories and how they were expected to change due to market trends were analyzed.
Quantitatively, a number of measures were used in order to assess the attractiveness of each of the
regional markets. For example, the growth of each regional market was used as an indicator of their
respective attractiveness.
When the most attractive markets had been identified, phase two of the research process began.
After internal data regarding the FBU was collected this data could be analyzed with our second
framework of analysis. Here the FBU’s performance on customer’s key purchasing criteria was
assessed and then compared to competitors’ performance on the same criteria. Thus, it was possible
to evaluate the FBU and the competitors’ relative performance on customers’ key purchasing

11
criteria. Performance gaps in relation to competitors could be identified which then could be linked
to functional capabilities within the firm. Therefore it was possible to identify areas of improvement
within functional capabilities. By assessing the impact on the cost structure of the product it was
possible to estimate which capability improvements that would result in the greatest cost reduction.
By doing this it was possible to identify which capability improvements the company were
recommended to improve and how the FBU should pursue strategically.
2.4 Research Quality In this part the quality of the study will be discussed. According to Yin (2003) the quality of a case
study can be assessed with the following criteria: construct validity, internal validity, external validity
and reliability.
2.4.1 Construct Validity
Construct validity is concerned with whether the measure devised for a concept reflects that concept
(Cepeda & Martin, 2005). In other words, construct validity is to the extent what was supposed to be
measured actually was measured. Yin (2003) states that using multiple sources of evidence,
establishing a chain of evidence and having informants review the report are all strategies for
increasing construct validity in a case study. All of these strategies were employed to increase the
construct validity of the thesis.
By interviewing a diverse set of people within the company, measures for concepts could be linked
from multiple sources, thus increasing the construct validity. By using the two different research
methods semi-structured interviews and documentation, greater construct validity could also be
established as data collected with respective method could be compared against each other. Our
tutors from both Acme and Chalmers reviewed the report, which generated constructive feedback
that positively affected the study’s construct validity.
2.4.2 Internal Validity
Internal validity is concerned with the causality of inferences in a study (Bryman & Bell 2011). Thus, it
is concerned with whether if A causes B and is not only a spurious correlation. Typically, internal
validity is one of the strengths with qualitative research (Bryman & Bell 2011). Triangulating data
with both the use of multiple methods and by comparing interview answers with each other
positively affected the thickness of the descriptions of the phenomena. The thickness of the
descriptions was also assured by noticing that answers on questions about different concepts
became more and more saturated as more people were interviewed in the interview process. Hence,
the internal validity was strengthened. However, it is important to mention that a rather few number
of interviews were conducted at the company which could affect the internal reliability negatively.
Identifying true reasons for a particular problem, i.e. casual links, could thus be seen as quite
problematic. Another issue that negatively could affect the internal validity of the study is the fact
that the interviews only were conducted with internal managers at the company. From one point of
view it would have been beneficial to talk to customers in order to assess e.g. their key purchasing
criteria as they are the ones making the buying decision. However, the same problem would arise by
interviewing people in the customers’ organizations as these organizations are very big and people
within them are not likely to share the same opinion on certain matters. In order to deal with
sampling related internal validity problems, the study focused on interviewing people with the best
insights into certain matters, as mentioned in the section about semi-structured interviews. As the
12
interviewers let the interviewees quantify market shares and estimate performance on key
purchasing criteria through the use of excel sheets during the interviews, this reduced problems with
interpreting qualitative information which also strengthened the internal validity.
The scope of the thesis is also something that was quite problematic to deal with in terms of internal
validity, as it is quite broad. By having a more specific scope and purpose it would have been easier
to be more specific and precise in measuring different variables as well as being able to be more
specific in the findings. It is also likely that it would have allowed for being more creative in the
analysis and conclusions. On the other hand, this is an obvious trade-off and it is very hard to be all-
embracing while still providing great detail. Therefore, this perspective was considered from the
beginning of the research process and was a matter of pure choice.
2.4.3 External Validity
External validity is instead concerned with to the extent the findings of a study can be generalized
(Bryman & Bell, 2011). The external validity of the study is very low. However, as the purpose of this
thesis was not to generalize the findings, the external validity quality criterion was irrelevant. The
reason for this is that the study is practical in nature and about solving a specific business case and
not about generating theories or hypotheses that could be applied to other business cases.
2.4.4 Reliability
Reliability is concerned with how consistent a study is. According to Bryman & Bell (2011) there are
two measures of reliability in qualitative research. These two measures are denoted internal and
external reliability.
Internal reliability is concerned with whether two observers agree on the content of the data that
has been gathered (Bryman & Bell 2011). The internal reliability of the study is considered to be fairly
good. Both interviewers were present at every interview and information was therefore conveyed in
the same manner to each researcher. After each interview a discussion was held to make sure that
information had been perceived in a consistent way. The fact that all interviews were recorded and
transcribed did also contribute to increase the internal reliability of the study.
External reliability is instead concerned with the degree to which a study can be replicated (Bryman
& Bell 2011). The external reliability of the study is considered to be quite low. The main reason for
this is the sampling of interviewees as well as the settings for the interviews, which all are hard to
replicate. As brought up in the text about internal validity, the empirical results could be largely
influenced in terms of who you talk to and the width of the thesis’ scope and this also affects the
external reliability of the findings. If another sample would have been chosen it is likely other results
would have emerged. Consequently, it would be hard to replicate the results of this particular study.
It is also likely that if the purpose and scope of the thesis would have been more specific the
concepts and variables used could have been more specifically defined and possibly easier to be able
to replicate in another study. However, the methodology of the study has been explained in greatest
detail possible in this chapter, which mitigates the problem with external reliability to some extent.

13
3 Market Attractiveness: Theoretical Framework This section is the first under the market attractiveness part of the report. It will present the
theoretical perspectives taken into consideration during the market investigation. The presented
theories will be recombined in a way that will allow for the market related question to be answered.
Therefore a market analysis framework will be presented in the final section of this chapter.
3.1 Formulating Strategies In strategy formulation there are two basic views, the external view and the internal view. From the
external view, it is argued that external factors are what matters most in successful strategy
formulation (Johnson et al 2008). From the internal view instead, it is argued that an organization’s
resources and capabilities are what matters most in strategy formulation (Johnson et al 2008).
According to Johnson et al. (2008) it is important to not take a too unified view and that both of
these perspectives matter in creating successful strategies. In combination with simple consistent
long-term goals and the appropriate structure and systems in the firm for implementing the strategy,
Grant (2008) also emphasize that both of these perspectives are important in defining successful
strategies. Both of the views are considered important to strategy formulation because the
performance of a company depends not only on its environment but also on its position within that
environment, which largely depends on the company’s resources and capabilities. The following
section only covers the external perspective while the internal perspective will be brought up later in
the thesis.
3.2 Market Analysis A major field within strategic management is to understand sources of sustained competitive
advantages (Porter 1985). Porter (1985) stresses that the core of formulating competitive strategies
is to relate a firm to its surrounding business environment, which relates to the external perspective
of strategy formulation. The business environment is a broad term and can be defined as the
different kinds of external influences that affect a firm’s decisions and performance (Grant 2008).
The business environment can be viewed from different levels of detail depending on the purpose
and thoroughness of the analysis.
According to Grant (2008) the business environment can be viewed from either a macro-level or
micro-level point of view. From a macro-level point of view, analyzing the business environment is
about scanning wider external influences. These wider influences can be classified by using the
PESTEL framework, which considers political, economic, social, technological, environmental and
legal factors that can influence a business. These external influences affect almost all organizations
independent of what industry they belong to (Johnson et al 2008). By using the PESTEL framework it
is possible to identify key drivers of change in the business environment. These drivers are
interesting to consider as they might affect how strategies in a certain company needs to be changed
in order for the company to stay competitive (Johnson et al 2008).
On the micro-level on the other hand, analyzing the business environment is about analyzing the
closest related variables that affect an industry’s profitability and thus the attractiveness of a
particular industry for a firm. To assess an industry’s profitability an industry analysis can be done by
using the famous Five Forces framework by Porter (1980). The Five Forces framework focuses on
determining industry profitability by analyzing the rivalry between competitors, the bargaining
power of suppliers and buyers, as well as the threat of new entrants and substitute products to an
14
industry (Grant, 2008). According to Grant (2008) another force that could be important to take into
consideration is also complements. All of these factors will now be explained more in detail.
Rivalry between competitors is usually the major factor determining industry profitability. How
intense the rivalry is depends on the concentration of competitors, the diversity of competitors,
product differentiation, excess capacity and exit barriers as well as the cost conditions in the industry
(Grant 2008). Concentration of competitors refers to how many competitors that are competing
within an industry and their respective market share, which will affect pricing decisions and thus the
profitability. In a monopoly situation pricing is likely to be restrained while in a situation with fierce
competition prices would be lower. The most common way of measuring competitive concentration
is by the concentration ratio which is calculated by simply adding the leading producers’ market
shares (Grant 2008). It is also important to consider the diversity of competitors, which is about the
similarity of competitors in terms of e.g. strategy and objectives. If competitors are similar they are
less likely to be in strong price competition. Product differentiation instead refers to the offerings
among the competitors. The more similar the offerings are, the more likely customers are to buy
competitors’ offerings and the more important it is for firms to have low prices.
Excess capacity and exit barriers explain that industry profitability can be affected by the economic
cycles because there could be a misbalance between capacity and demand. During recessions there
might be an overcapacity, forcing companies to cut their prices to increase profitability. Cost
conditions also affect the level of competition as e.g. cost structures of firms determine how low
prices will go in a recession. Bargaining power of buyers and suppliers refers to the economic power
of actors and depends on two factors according to Grant (2008): buyer’s price sensitivity and relative
bargaining power. Complements also affect bargaining power and refers to that the value of many
products depends on other complementary products. For example, the value of a printer by itself is
little without having ink cartridges. Price sensitivity can be affected by e.g. the level of product
differentiation. If products are commoditized the more likely it is that buyers will switch to another
supplier’s offer.
Relative bargaining power is about how the balance of power between the sellers and the buyers is
distributed. To illustrate, if there are few buyers, the more important the potential business with a
buyer is for a supplier; or if buyers are well aware of the costs and prices of suppliers they are in a
better position to negotiate. Furthermore, the threat of new entrants refers to how likely it is that
new firms will enter the industry. A profitable industry will attract new potential competitors.
However, there might be barriers for entering an industry. Potential entry barriers could e.g. be high
capital requirements, strongly differentiated products through branding and legal barriers. Lastly, the
threat of substitutes is important for understanding industry profitability. If there exist many
products in other markets that fulfill customer needs in the same way, sellers would have to reduce
their prices in order not to lose business.
However, an industry perspective might be of a too high level in order to provide a good
understanding of the particular competition and customer situation facing a firm (Johnson et al
2008). This is because different competitors might be positioned differently in an industry and thus
facing forces of varying magnitude of strength in the Porter’s Five Forces framework. Porter (1980)
emphasize that industries can be divided into different groups of competitors roughly following the
same strategies. These so called strategic groups face forces of equal strength and have the same
15
customers. For this reason, Johnson et al (2008) goes one step further and divides the business
environment into a third layer, competitors and markets, which is the closest layer surrounding
organizations. The third layer considers the fact that industries may have many different kinds of
organizations competing on different bases as well as in different market segments. This type of
analysis is about identifying the market the firm wishes to serve, the firm’s direct competitors and
gaining understanding of the customers’ needs (Johnson et al 2010). In essence, it can be referred to
as a market analysis (Johnson et al 2008; Aaker 2010).
Analyzing the business environment on a market basis is about assessing the market attractiveness of
a particular market for a firm in an industry (Aaker 2010). Aaker (2010) provides a way for assessing
market analysis and highlight the following dimensions to be of importance: market size and growth
rate, market profitability, industry cost structure, distribution channels, market trends and key
success factors in the market. The market size can be estimated by using present sales as well as
potential sales while the market growth rate instead can be estimated by extrapolating historical
growth data into the future. Assessing market profitability can be done by using the Five Forces
framework on a market basis instead of looking at it from the perspective of an entire industry
supplying an aggregated market (Aaker 2010). According to Aaker (2010) cost structure in an industry
is important for understanding where value is added. Distribution channels are also important in a
market analysis as it gives information about the current existing distribution channels that are used
and their characteristics. The market trends are also important for a market analysis as they give
information about potential opportunities and threats that arise when changes in the market occur.
Lastly, the key success factors are the customers’ needs that need to be fulfilled in order for a
company to be successful in the market place (Johnson et al 2008).
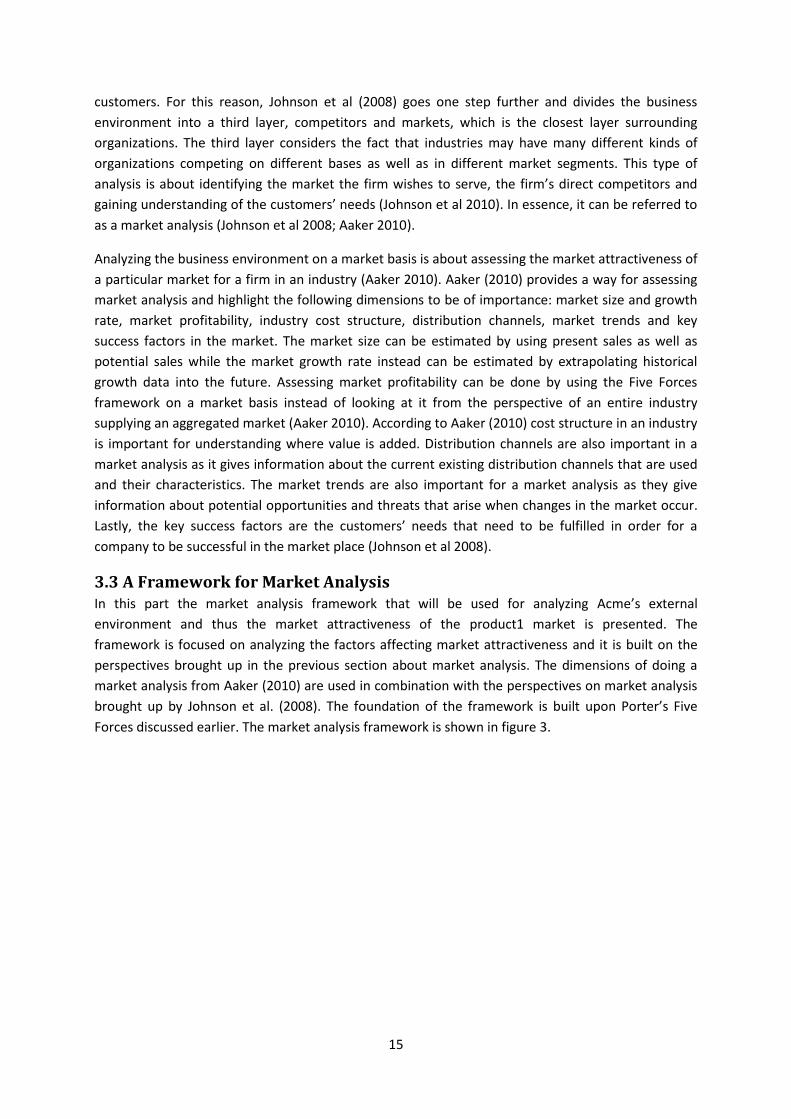
3.3 A Framework for Market Analysis In this part the market analysis framework that will be used for analyzing Acme’s external
environment and thus the market attractiveness of the product1 market is presented. The
framework is focused on analyzing the factors affecting market attractiveness and it is built on the
perspectives brought up in the previous section about market analysis. The dimensions of doing a
market analysis from Aaker (2010) are used in combination with the perspectives on market analysis
brought up by Johnson et al. (2008). The foundation of the framework is built upon Porter’s Five
Forces discussed earlier. The market analysis framework is shown in figure 3.
16
Figure 3 - Market analysis framework
As seen in figure 3, the focus on the framework is on a particular market, the product1 market. The
market has certain characteristics in terms of size and growth, which is illustrated in figure 3. To bring
in a dynamic perspective in the framework, market trends as well as more general external trends
from the PESTEL framework are taken into account.
The market profitability is assessed in the model through the use of the Five Forces plus the extra
sixth force, complements. In the market, exchanges occur between competitors in the product1
industry and the customers. The power balance between these two actors is illustrated by the
bargaining power-arrow in the middle of figure 3. As discussed earlier, this power balance could be
affected by e.g. the relative size and number of sellers and customers as well as how informed they
are about each others’ prices or costs. The bargaining power of suppliers is also taken into
consideration in the framework. The suppliers are placed outside the product1 market as they belong
to another market. Complements as well as substitutes are seen as products belonging to other
markets. Both complements and substitutes influence the bargaining power and thus the market
profitability. New entrants are standing outside the market and are affected by barriers for entering
the industry.
As Aaker (2010), Johnson et al. (2008 as well as Grant (2008) stresses that key purchasing criteria, or
key success factors, are important in order to assess market attractiveness these are incorporated
into the framework. These criteria are specific market needs that need to be fulfilled by competitors
in order to be successful in the market.
Customers
Competition
New Entrants
Key purchasing criteria
Market trends
Size Growth Product1 market
Entry Barriers
Suppliers Bargaining
Power
Complements Substitutes
Regulatory trends
Economic trends
Social trends
Technological trends
Environmental trends
Bargaining Power

17
4 Market Attractiveness: Empirical Findings In this part of the thesis, findings regarding the product1 industry and related actors from interviews
with various interview objects at the FBU will be presented. First, the structure of the OEM product1
market and the aftermarket and the markets’ dependence will be discussed. Thereafter, the
geographical markets’ characteristics with focus on turnover and growth will be explained. The
competitive environment within the market and the barriers that is restricting actors to enter the
product1 market will be discussed. Finally, the key purchasing criteria emphasized by the OEMs on
some geographical markets will be presented.
4.1 Product1 market Structure The market for product1s can be segmented into an OEM market and an aftermarket for product1s
(Acme Complement product1 strategy 2011). The product1s sold on the markets are the same but
the customers’ preferences differ widely (Respondent9 2012d). The OEM market for product1s is the
market for product1s used in the production of new product2s by OEMs, while the aftermarket is the
market for replacement product1s where the operators of the segment1 systems are the customers
(Respondent8 2012a). The segment1 OEMs are primarily the product1 suppliers’ customers for other
application segments as well but the segment1 operators are often only operating the product2s and
no other segment applications (Respondent4 2012b). There exist two drivers of product1s for new
product2s: new product2s that operate new segment1 lines when a segment1 system expands and
product2s operating existing lines that are being replaced by new product2s (Respondent9 2012j).
The aftermarket consists of the product1s that are being replaced in the operating product2s, the
installed base of product2s, after in
approximately 12 years (Respondent9
2012j).
The two product1 markets are part of the
same value system: the product1
manufacturers supply the OEMs with
product1s which constitute a strategic
component in their product2s that are sold
to the segment1 operators (Respondent8
2012a; Respondent15 2012). However, the
product1 value system can be setup in two
different ways (Respondent15 2012). In the
traditional design of a segment1 system,
the segment1 OEMs manufacture the
product2s and deliver these to the
segment1 operators, which operate the
product2s and conduct the maintenance,
see figure 4 (Respondent8 2012a). In the
alternative setup, OEM integrated flow, the
product2s are both manufactured and
operated by the OEM, see figure 4
(Respondent15 2012).
Traditional flow
OEM integrated flow
Product1 supplier
OEM
Segment1 operator
Product1 supplier
OEM
Segment1 operator
Replacement product1s for aftermarket
Product1s for new vehicles
Figure 4 - Two types of product1 value system (created based on discussions with Respondent15 2012)
18
The customers’ purchasing characteristics differs on the OEM product1 market and the aftermarket
for product1s, where for example the aftermarket customers value delivery speed since their
demand is instant but these customers are not as price sensitive as the OEMs (Respondent8 2012a;
Respondent9 2012d). Furthermore, the technical product1 solutions are customer unique and they
must be adapted to the local circumstances of the segment1 system which the product2s will
operate in, such as the condition of the segment1 system’s tracks and climate conditions
(Respondent9 2012f). However, the product1 suppliers strive to utilize homologated product1
solutions to the highest possible extent because changing the product1 design is costly (Respondent9
2012f). A cheap way of changing the product1 characteristics and thereby the specification is to use a
different component5. Component5s utilized in product1 solutions is the exception regarding unique
customer solutions. Segment1 operators most often would like to use the same type of component5
in their depots due to standardization (Respondent9 2012f). Delivering product1 solutions aimed to
be used in segment1 systems that already utilize certain component5 can be challenging due to that
the combination of component5 and component3 is critical and component5 leakages can arise
(Respondent9 2012d).
The product1 market customers’ focus on standardization of the product1s implies that the nature of
the product1 demand for a specific segment1 system is exponential up to some level (Respondent9
2012c). Segment1 systems are often expanded by the operators who establish a few segment1 lines
which later on are expanded, hereof a growth in the segment1 system size (Respondent9 2012c). The
first deal the OEM announces for a segment1 system is important since the choice of product1s
affects the OEMs’ future choice of a product1 supplier when new segment1 lines are established
(Respondent9 2012a). The OEMs procure their product1s by using tender offerings and the product1
suppliers have an opportunity to present offers which later on are evaluated by the specific OEM’s
key purchasing criteria (Respondent8 2012a; Respondent9 2012a). Once product1 suppliers have
been awarded the delivery of product1s for the construction of product2s for a segment1 line,
competitors are unable to sell product1s to the project in case the complement product1s have been
uniquely designed (Respondent9 2012a).
The OEMs’ key purchasing criteria are of two types; technical requirements and commercial criteria
(Respondent8 2012a). The technical requirements are very much regulated and product1 suppliers
must fulfill a certain level of the demands in order to be considered as a product1 supplier
(Respondent8 2012a). The minimum requirements the product1 suppliers must fulfill are the
technical requirements of certain standards (Respondent8 2012a). Another reason to the frequent
usage of the technical requirements is that the segment1 operators favor these since they allow the
operators to functionally specify their demands, which lowers their overall product responsibility and
risk (Respondent9 2012c). The technical standards require extensive product tests where the
product1s must be operated in test rigs for between 600 000 to 800 000 km for new solutions and
between 100 000 to 200 000 km for any minor changes in the design (Respondent9 2012d).
Technically, beyond fulfilling the technical standards the product1 suppliers are being evaluated on
similar product1s’ track-record in other systems (Respondent8 2012a).
Similar standards do also apply for the product1 related component, the complement product1
(Respondent9 2012d). This component is a strategic component since it can be designed in a way
that competitors’ product1s do not fit the complement product1 dimensionally (Rosengen 2012c).
Product1 suppliers that wins the complement product1 tender can therefore charge a high margin
19
for their product1s from the OEM and segment1 operators since these actors are forced to use the
supplier’s product1s specifically (Respondent8 2012a). However, strong engineering capabilities are
needed in order to develop complement product1s and the market for complement product1s has
historically been dominated by a few technologically leading product1s suppliers (Respondent8
2012a). Since five years ago the most prominent OEMs have begun developing their own
complement product1s due to the components strategic importance (Respondent8 2012a;
Respondent15 2012).
The segment1 operators have also taken action in order to homologate additional suppliers’
product1s in excess to the product1s already approved by the OEMs in order to gain better
bargaining power (Respondent9 2012b). This process is done by that a segment1 operator force the
current product1 suppliers to have so called design alignment meetings with potential product1
suppliers in order to exchange dimensional information that can serve as a restriction to deliver
(Respondent9 2012b). This is related to the trend that the customers to an increasingly degree are
procuring product1s using dual and multiple sourcing strategies (Respondent9 2012c). The segment1
operators are especially interested in using multiple sourcing strategies such as dual sourcing since
single sourcing strategies gives the product1 supplier substantial purchasing power and possibility to
charge high prices (Respondent9 2012b). However, the segment1 operators usually purchase
product1 according to how the initial OEM product1 order was distributed between the product1
suppliers (Respondent9 2012b). Product1 suppliers are therefore often given a certain share of the
aftermarket business despite that multiple actors have the possibility to deliver product1s, as long as
the product1 suppliers delivers according to the segment1 operators instant needs and have no
quality problems (Respondent9 2012b).
4.2 Geographical Market Characteristics The focal industry and investments in segment1 systems and related subcomponents like product1s
are long-term investments and the industry is conservative (Respondent12 2012). The two markets
that have been leading the product1 market historically are North America and Western Europe
(Respondent4 2012b). The two markets have substantial installed base demands for replacement
product1s, which is a long-term and very stable need since product1s continuously have to be
replaced as long as the system is in operation (Respondent9 2012j). The market growth estimations
for North America and Western Europe are lower than the Asian where the OEM product1 market
growth is expected to be high continuously due to China’s and India’s authorities’ investments and
positive attitudes towards segment1 systems, see table 5 (Respondent9 2012j). The managing
director of the most influential segment1 organization in India stresses that it will be mandatory to
establish segment1 systems in all cities with more than 3 million inhabitants (Anonymous source-2
2011). Based on institutional promises the Indian segment1 systems are expected to be expanded
widely within the upcoming years (Respondent3 2011-03-23). However, an expansion is not only
expected in India but also in other Asian countries such as South Korea, which has very high
utilization of their current segment1 systems (Respondent4 2012a).
The segment1 OEM market has traditionally been dominated by the three larger focal industry
competitors: OEM1, OEM2 and OEM3 (Respondent8 2012a). However, the market trend is that the
Chinese OEMs OEM6 and OEM7-1, OEM7-2 and OEM7-3 are increasing their market shares, see
figure 5 (Respondent8 2012a). These actors have a willingness to become more technology advanced

20
in their market offerings and are therefore creating collaborations with OEM1, OEM2 and OEM3 on
the Chinese product2 market (Respondent8 2012a).
Another upcoming OEM related trend is that the actors to an increasingly extent manufacture the
product2s locally at the market where these will be operated (Respondent3 2012). OEM1, OEM2,
OEM5 and OEM3 have traditionally manufactured product2s within the Western European market
that have been exported to other geographical markets (Respondent3 2012). The export of
product2s to China has already been reduced and this is currently occurring for India as well where
the OEMs are locating manufacturing capacity (Respondent3 2012). However, the OEMs are still
exporting product2s to the South and North American product2 markets (Respondent3 2012).
Domestically, some markets are solely supplied by product2s through exporting such as the South
Korean market. Another factor that differs between the OEM product1 markets is the driver of the
demand whereas well established markets are driven by replacement of product2s and expanding
product1 markets by the product2s that expand the installed base (Respondent9 2012j). For
example, the Korean OEM product1 market mainly is driven by the replacements of product2s
whereas the Indian by the expansion of the installed base (Respondent9 2012j).
Figure 5 - Ranking of the segment1 OEMs based on delivered product2s 2006-2010 (Respondent9 2012j)
Africa/ Middle East
Asia CIS Eastern Europe
North America
South America
Western Europe
OEM product1 market 2010
5.4 64.7 3.3 4.1 15.3 9.4 21.8
Product1 aftermarket 2010
3.7 51.9 16.0 5.9 36.5 7.4 39.5
New product2 growth for 2010-2015
7.5% 6.2% 0.0% -1.6% -3.8% 8.1% -3.7%
Installed base growth for 2010-2015
9.0% 7.4% 0.2% 2.8% 1.0% 7.6% 1.6%
Table 5- Product1 market sizes for the various geographical markets and new product2 and installed base growths for each geographical market (Respondent9 2012j)
Am
ou
nt
of
del
iver
ed p
rod
uct
2s
20
06
-20
10
CIS
Eastern Europe
Africa/Middle East
South America
Western Europe
North America
Asia
Hig
h
Low
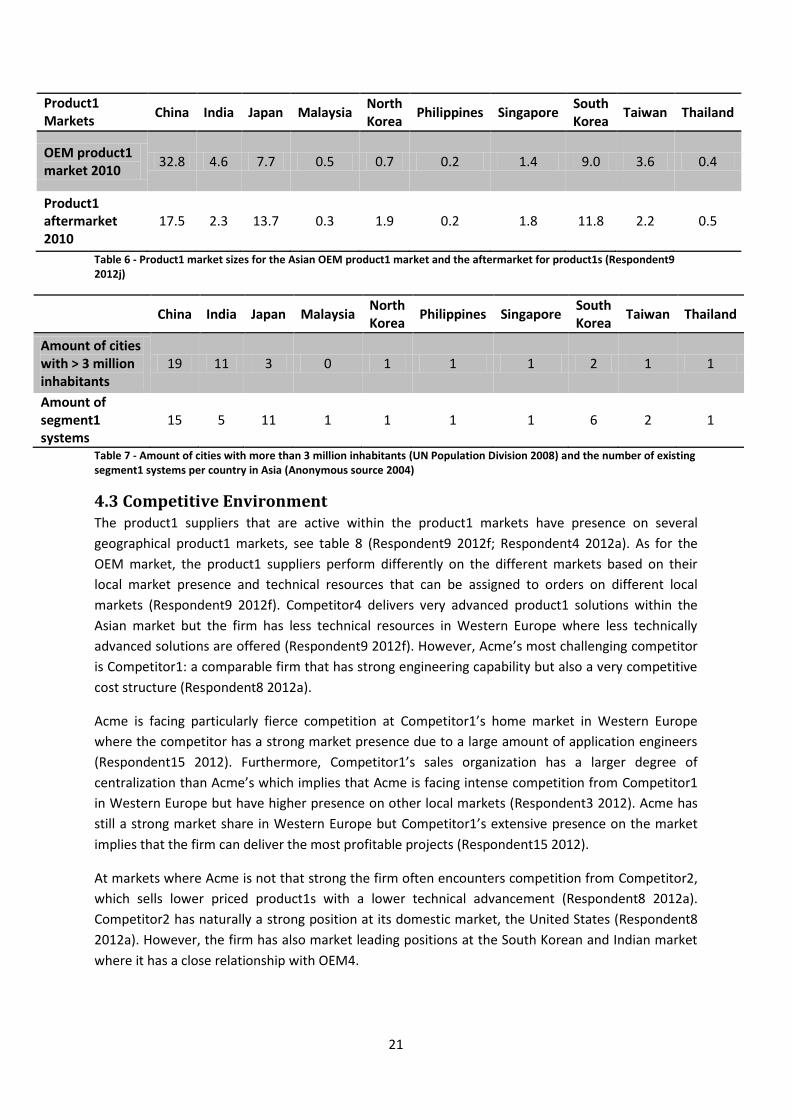
21
Product1 Markets
China India Japan Malaysia North Korea
Philippines Singapore South Korea
Taiwan Thailand
OEM product1 market 2010
32.8 4.6 7.7 0.5 0.7 0.2 1.4 9.0 3.6 0.4
Product1 aftermarket 2010
17.5 2.3 13.7 0.3 1.9 0.2 1.8 11.8 2.2 0.5
Table 6 - Product1 market sizes for the Asian OEM product1 market and the aftermarket for product1s (Respondent9 2012j)
China India Japan Malaysia
North Korea
Philippines Singapore South Korea
Taiwan Thailand
Amount of cities with > 3 million inhabitants
19 11 3 0 1 1 1 2 1 1
Amount of segment1 systems
15 5 11 1 1 1 1 6 2 1
Table 7 - Amount of cities with more than 3 million inhabitants (UN Population Division 2008) and the number of existing segment1 systems per country in Asia (Anonymous source 2004)
4.3 Competitive Environment The product1 suppliers that are active within the product1 markets have presence on several
geographical product1 markets, see table 8 (Respondent9 2012f; Respondent4 2012a). As for the
OEM market, the product1 suppliers perform differently on the different markets based on their
local market presence and technical resources that can be assigned to orders on different local
markets (Respondent9 2012f). Competitor4 delivers very advanced product1 solutions within the
Asian market but the firm has less technical resources in Western Europe where less technically
advanced solutions are offered (Respondent9 2012f). However, Acme’s most challenging competitor
is Competitor1: a comparable firm that has strong engineering capability but also a very competitive
cost structure (Respondent8 2012a).
Acme is facing particularly fierce competition at Competitor1’s home market in Western Europe
where the competitor has a strong market presence due to a large amount of application engineers
(Respondent15 2012). Furthermore, Competitor1’s sales organization has a larger degree of
centralization than Acme’s which implies that Acme is facing intense competition from Competitor1
in Western Europe but have higher presence on other local markets (Respondent3 2012). Acme has
still a strong market share in Western Europe but Competitor1’s extensive presence on the market
implies that the firm can deliver the most profitable projects (Respondent15 2012).
At markets where Acme is not that strong the firm often encounters competition from Competitor2,
which sells lower priced product1s with a lower technical advancement (Respondent8 2012a).
Competitor2 has naturally a strong position at its domestic market, the United States (Respondent8
2012a). However, the firm has also market leading positions at the South Korean and Indian market
where it has a close relationship with OEM4.

22
Product1 suppliers Africa/
Middle East Asia CIS
Eastern Europe
North America
South America
Western Europe
Acme 10% 11% 0% 8% 7% 15% 30% Competitor1 8% 10% 0% 5% 6% 10% 25% Competitor2 35% 15% 0% 3% 40% 10% 10% Competitor4 20% 20% 0% 3% 10% 10% 8% Competitor3 15% 20% 0% 2% 10% 10% 5% Competitor5 2% 1% 1% 35% 1% 2% 2% Others 10% 23% 99% 44% 26% 43% 20%
Total 100% 100% 100% 100% 100% 100% 100% Table 8 - Product1 manufacturers’ market shares per geographical product1 market for both the OEM and the aftermarket (Respondent4 2012a)
Product1 suppliers China India Japan South Korea
Acme 30% 9% A few percent 10%
Competitor1 30% 47% A few percent 40%
Competitor2 - 44% A few percent -
Competitor3 30% - Relatively
consolidated
10-15%
Competitor6 - - 10-15%
Other 10% - 15-30%
Total 100% 100% 100% 100% Table 9 - Market leading product1 manufacturers’ market shares for the Chinese, Indian, Japanese and South Korean product1 markets based on order-in-take (Respondent5 2012 ; Respondent4 2012a; Respondent9 2012c; Respondent13 2012a; Respondent4 2012c)
4.4 Entry Barriers The requirement a product1 supplier must fulfill in order to deliver product1s to potential customers
is the technical standards (Respondent9 2012c). The technical standards differ between markets but
some standards like the European Standard (EN) is applicable for several markets (ibid). There is no
existence of any legal requirement that force product1 suppliers to comply with the standards such
as the EN standard since the segment1 velocities are relatively low compared to other application
segments (Respondent9 2012d). However, the segment1 operators utilize the standards in almost all
product2 procurements since it is a convenient way for the operator to ensure that product2s are
manufactured in a technically reliable way (Respondent9 2012d).
Despite that the technical standards ensure a certain technical advancement the emphasis on safety
differs between the geographical markets (Respondent8 2012a). In Asia, specifically in China and
India, safety and reliability are some of the most important purchasing criteria (Respondent5 2012;
Respondent13 2012a). On these markets, the safety and reliability is evaluated by investigating
similar product1 solutions’ track-record (ibid). As in Asia product1 solutions with a high reliability is
demanded in the South American market, where product quality is one of the key criteria in the
segment1 OEMs’ product1 purchases (Respondent4 2012a). However, in the North American market
the segment1 operators have high request for safe product1s solutions, despite that product1s are
considered a commodity (Respondent8 2012a). The reason for this is that North American operators
have a relatively higher product responsibility (Respondent8 2012a).
The focus on product1 safety in Western Europe is very high due to the level of technical
advancement in the product1s solutions, which is considered as a sub-system not a pure product
(Respondent8 2012a). In contrast, the emphasis within the CIS market is much on price and technical
23
advancements are not the main focus, which is illustrated by that product1s are considered as a
commodity here (Respondent8 2012a). Safety is not the main priority at the Eastern Europe product1
market despite there is an understanding of the criterion’s importance (Respondent4 2012b). This is
in contrast to Africa/Middle East where safety is formally expressed as a demand due that the hired
European consultancies stress the criterion (Respondent4 2012b).
The possibility to establish relationships with the customers within a geographical market can also
serve as an entry barrier where it for example almost is impossible in Japan to win an OEM product1
order for a foreign product1 supplier like Acme (Respondent9 2012c; Respondent4 2012b). The
Japanese customers are very nationalistic and relationship between the main Japanese product1
suppliers and the customers are strong (Respondent4 2012b). In the second largest Asian product1
market, China, relationship is highly emphasized since it is a way for the OEM to ensure that they
deliver reliable and proven products (Respondent13 2012a). The situation is the same in the Indian
market where established relationships with OEMs is important to be considered a credible product1
supplier (Respondent5 2012). Furthermore, the Indian and Chinese product1 market is populated by
a number of OEMs (Respondent5 2012; Respondent13 2012a) in comparison to the South Korean
product1 market which is mainly dominated by OEM4 and Operator1 (Respondent4 2012a).
Similar situations appear at the CIS and North American markets, which also are very concentrated
and dominated by a few powerful OEMs (Respondent9 2012j). Additionally, the relationships on the
North American OEM market are relatively strong where for example Competitor2 has a close
relationship with among others’ OEM2 (Respondent8 2012a). In Eastern Europe the relationship
between the OEMs and product1s suppliers are also quite strong due to that the OEMs serve both as
supplier of the product2s and operator of the segment1 systems (ibid). Furthermore, the Eastern
European OEM market is relatively consolidated (Anonymous source-1 2012). In South America
several OEMs are present and the market is characterized by many small segment1 systems
(Respondent4 2012a; Respondent9 2012j). Moreover, the South American market is possible to
access without having strong relationships with the local customers since some of the product2s are
procured through other geographical markets (Respondent9 2012c). However, the market is
becoming increasingly localized (Respondent4 2012a).
The Western European OEM market is quite fragmented but the relationships between product1s
suppliers and OEMs are growing stronger since product1 suppliers become increasingly involved
during the conception phase in the OEMs’ design of their product2s (Respondent8 2012a;
Respondent9 2012j). Furthermore, Western Europe is the home market for some of the world
leading product1 suppliers, which have well-developed relationships with the largest customers
especially in this market (Respondent7 2012b). Despite that there are very few OEMs’ that have
production in Africa/Middle East and the vast majority of the product2s are exported to the market,
relationships are very important because of cultural reasons (Respondent4 2012b)
Another barrier to enter a certain domestic product1 market is the need for established local
production (Respondent8 2012b) and this barrier can be both strictly formal but also implicit by
being informal (Respondent7 2012b). In India, there are no governmental regulations requiring
localized manufacturing but the high import tariffs in combination with the local OEMs’ preference
for local actors imply that this become an implicit demand (Respondent7 2012b). Furthermore,
establishment of local production is conditional to be able to produce products positioned within the

24
required cost range in India (Respondent5 2012). The Chinese market has similar characteristics but
the development has been rather opposite where global product1s producers have been able to
export initially but the government increasingly stresses the demand for local production over time
(Respondent4 2012b). In Japan, which has the largest installed base of product1s in Asia
(Respondent9 2012j), there is no formal requirement of local manufacturing (Respondent4 2012b).
However, the competitive situation is very challenging due to that local actors compete intensively
(Respondent4 2012b). In contrast, none of the product1 suppliers in South Korea have local
manufacturing (Respondent4 2012a).
In the Eastern European region the situation is similar where the existence of cost-competitive
production, due to commercial reasons, motivates a local production (Respondent4 2012b).
Additionally, local customers have a tendency to favor the local producers (Respondent4 2012b). In
the CIS region, localization of production is a formal governmental demand in order to be able to
establish market presence (Respondent7 2012b). The situation in the North American market is
similar where the “buy American act” demands that a certain percent of public funded segment1
systems should be sourced with domestically produced products for the product1 market in the US,
which has the largest installed base in the world (Respondent8 2012a). In contrast, the product2s
delivered to the markets in Africa/Middle East and South America are often produced in other
regions and then exported to these regions (Respondent3 2012). However, relationship with local
actors in Africa/Middle East is very important since the business relationships are long-term
(Respondent4 2012b).
Despite that all of the market leading OEMs in South America, OEM5, OEM1 and OEM6, have
established local manufacturing, the purchasing criteria for product1s are still similar to the ones in
the Western European market (Respondent4 2012a; Respondent9 2012j). There is an absence of any
local manufacturing demand on the Western Europe product1 market and the market trend is rather
the opposite, to manufacture in best-cost countries (Respondent4 2012b). However, the trend to
manufacture in best-cost countries is more prominent for other OEM suppliers that deliver other
components than product1s (Respondent4 2012b). The possibility to establish relationships with
local suppliers is related to the demand of local manufacturing and in general product1 suppliers
prefer to establish local sourcing within a couple of years for the market where they localize their
manufacturing (Respondent9 2012d). The local sourcing options are often not present when Acme
chooses to establish manufacturing within a local market, but this is a solvable activity since it is
possible to establish a local supplier base in one to two years (Respondent9 2012d).
4.5 Key Purchasing Criteria Overall the average product2 manufacturers’ focus is to produce a “good enough” product but there
are differences between customers within different regions (Respondent8 2012a). The typical
Western European customer has a relative high technological focus but is also commercially
demanding. The commercial focus is not on the product1 price but the lifetime cost of usage (ibid).
The trend that OEMs evaluate product1 suppliers using specific tools reduces the emphasis on price
(Respondent15 2012). The key purchasing criteria the Western European customers emphasize are
design, price, references and experience, reliability and safety, risk as well as quality performance,
see table 10 (Respondent8 2012a). However, the trend that the OEMs become more involved during
the conception phase affects how a supplier is perceived on the key purchasing parameters since the
product1 supplier affects the OEM’s technical demands (Respondent15 2012).
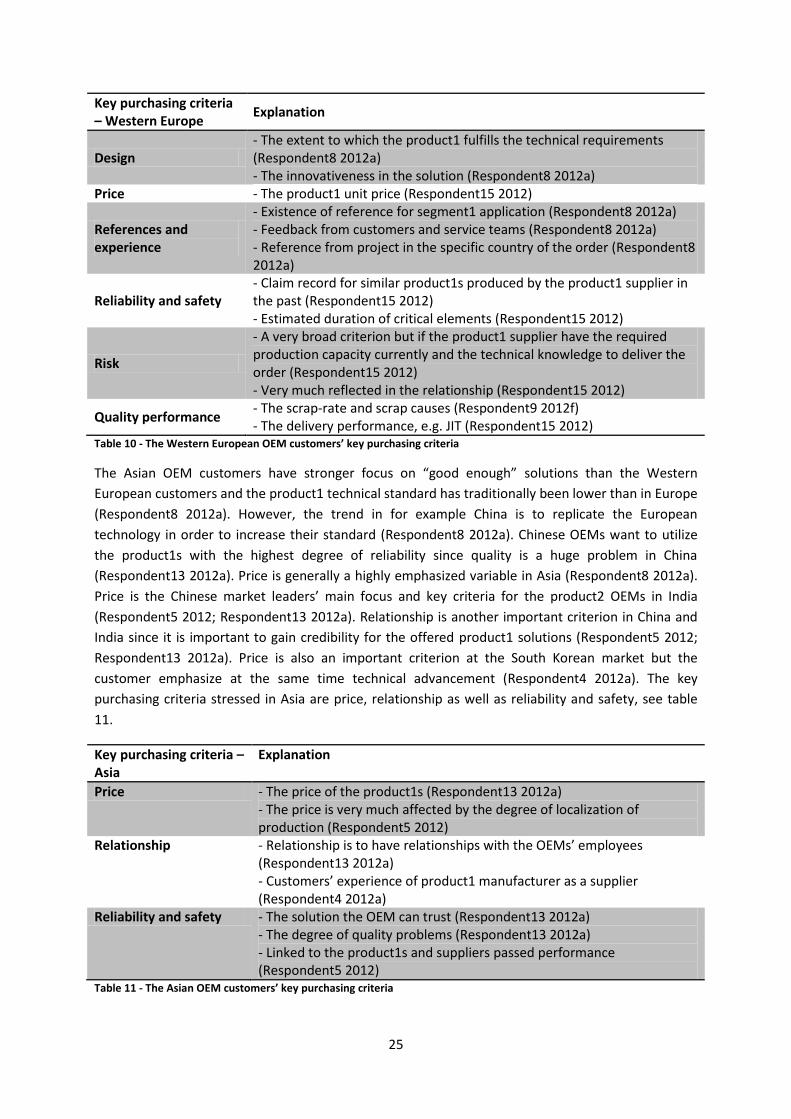
25
Key purchasing criteria – Western Europe
Explanation
Design - The extent to which the product1 fulfills the technical requirements (Respondent8 2012a) - The innovativeness in the solution (Respondent8 2012a)
Price - The product1 unit price (Respondent15 2012)
References and experience
- Existence of reference for segment1 application (Respondent8 2012a) - Feedback from customers and service teams (Respondent8 2012a) - Reference from project in the specific country of the order (Respondent8 2012a)
Reliability and safety - Claim record for similar product1s produced by the product1 supplier in the past (Respondent15 2012) - Estimated duration of critical elements (Respondent15 2012)
Risk
- A very broad criterion but if the product1 supplier have the required production capacity currently and the technical knowledge to deliver the order (Respondent15 2012) - Very much reflected in the relationship (Respondent15 2012)
Quality performance - The scrap-rate and scrap causes (Respondent9 2012f) - The delivery performance, e.g. JIT (Respondent15 2012)
Table 10 - The Western European OEM customers’ key purchasing criteria
The Asian OEM customers have stronger focus on “good enough” solutions than the Western
European customers and the product1 technical standard has traditionally been lower than in Europe
(Respondent8 2012a). However, the trend in for example China is to replicate the European
technology in order to increase their standard (Respondent8 2012a). Chinese OEMs want to utilize
the product1s with the highest degree of reliability since quality is a huge problem in China
(Respondent13 2012a). Price is generally a highly emphasized variable in Asia (Respondent8 2012a).
Price is the Chinese market leaders’ main focus and key criteria for the product2 OEMs in India
(Respondent5 2012; Respondent13 2012a). Relationship is another important criterion in China and
India since it is important to gain credibility for the offered product1 solutions (Respondent5 2012;
Respondent13 2012a). Price is also an important criterion at the South Korean market but the
customer emphasize at the same time technical advancement (Respondent4 2012a). The key
purchasing criteria stressed in Asia are price, relationship as well as reliability and safety, see table
11.
Key purchasing criteria – Asia
Explanation
Price - The price of the product1s (Respondent13 2012a) - The price is very much affected by the degree of localization of production (Respondent5 2012)
Relationship - Relationship is to have relationships with the OEMs’ employees (Respondent13 2012a) - Customers’ experience of product1 manufacturer as a supplier (Respondent4 2012a)
Reliability and safety - The solution the OEM can trust (Respondent13 2012a) - The degree of quality problems (Respondent13 2012a) - Linked to the product1s and suppliers passed performance (Respondent5 2012)
Table 11 - The Asian OEM customers’ key purchasing criteria
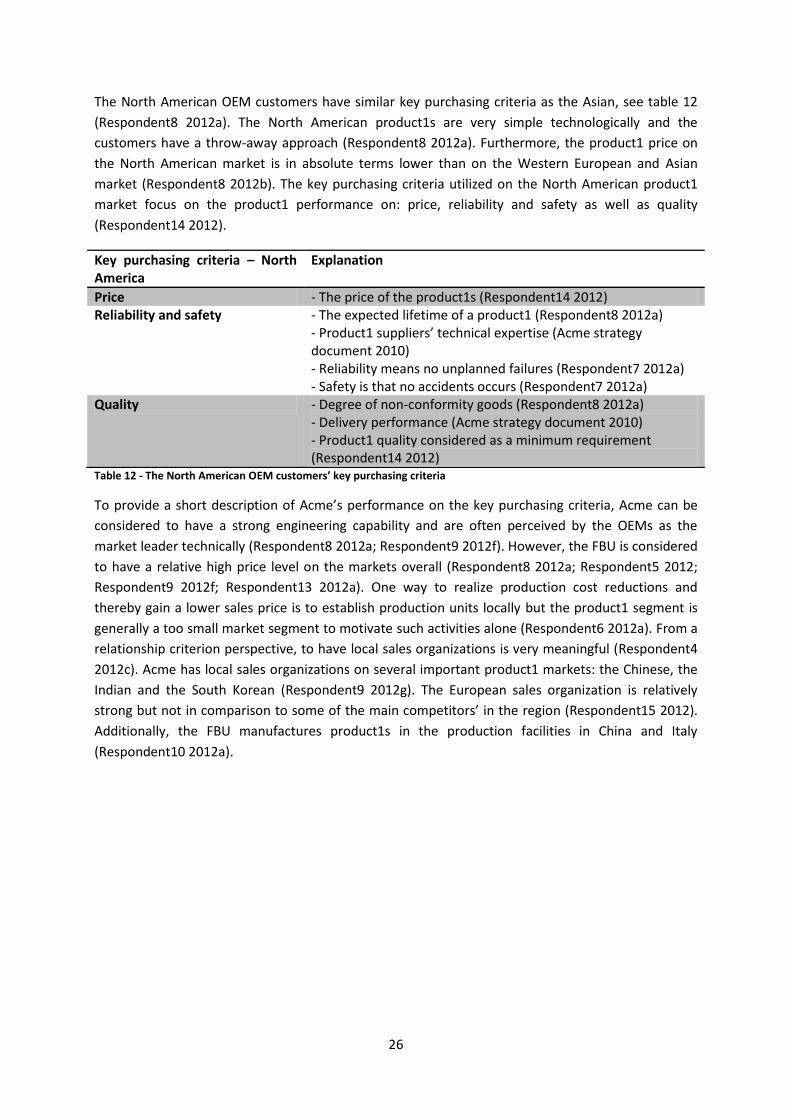
26
The North American OEM customers have similar key purchasing criteria as the Asian, see table 12
(Respondent8 2012a). The North American product1s are very simple technologically and the
customers have a throw-away approach (Respondent8 2012a). Furthermore, the product1 price on
the North American market is in absolute terms lower than on the Western European and Asian
market (Respondent8 2012b). The key purchasing criteria utilized on the North American product1
market focus on the product1 performance on: price, reliability and safety as well as quality
(Respondent14 2012).
Key purchasing criteria – North America
Explanation
Price - The price of the product1s (Respondent14 2012) Reliability and safety - The expected lifetime of a product1 (Respondent8 2012a)
- Product1 suppliers’ technical expertise (Acme strategy document 2010) - Reliability means no unplanned failures (Respondent7 2012a) - Safety is that no accidents occurs (Respondent7 2012a)
Quality - Degree of non-conformity goods (Respondent8 2012a) - Delivery performance (Acme strategy document 2010) - Product1 quality considered as a minimum requirement (Respondent14 2012)
Table 12 - The North American OEM customers’ key purchasing criteria
To provide a short description of Acme’s performance on the key purchasing criteria, Acme can be
considered to have a strong engineering capability and are often perceived by the OEMs as the
market leader technically (Respondent8 2012a; Respondent9 2012f). However, the FBU is considered
to have a relative high price level on the markets overall (Respondent8 2012a; Respondent5 2012;
Respondent9 2012f; Respondent13 2012a). One way to realize production cost reductions and
thereby gain a lower sales price is to establish production units locally but the product1 segment is
generally a too small market segment to motivate such activities alone (Respondent6 2012a). From a
relationship criterion perspective, to have local sales organizations is very meaningful (Respondent4
2012c). Acme has local sales organizations on several important product1 markets: the Chinese, the
Indian and the South Korean (Respondent9 2012g). The European sales organization is relatively
strong but not in comparison to some of the main competitors’ in the region (Respondent15 2012).
Additionally, the FBU manufactures product1s in the production facilities in China and Italy
(Respondent10 2012a).
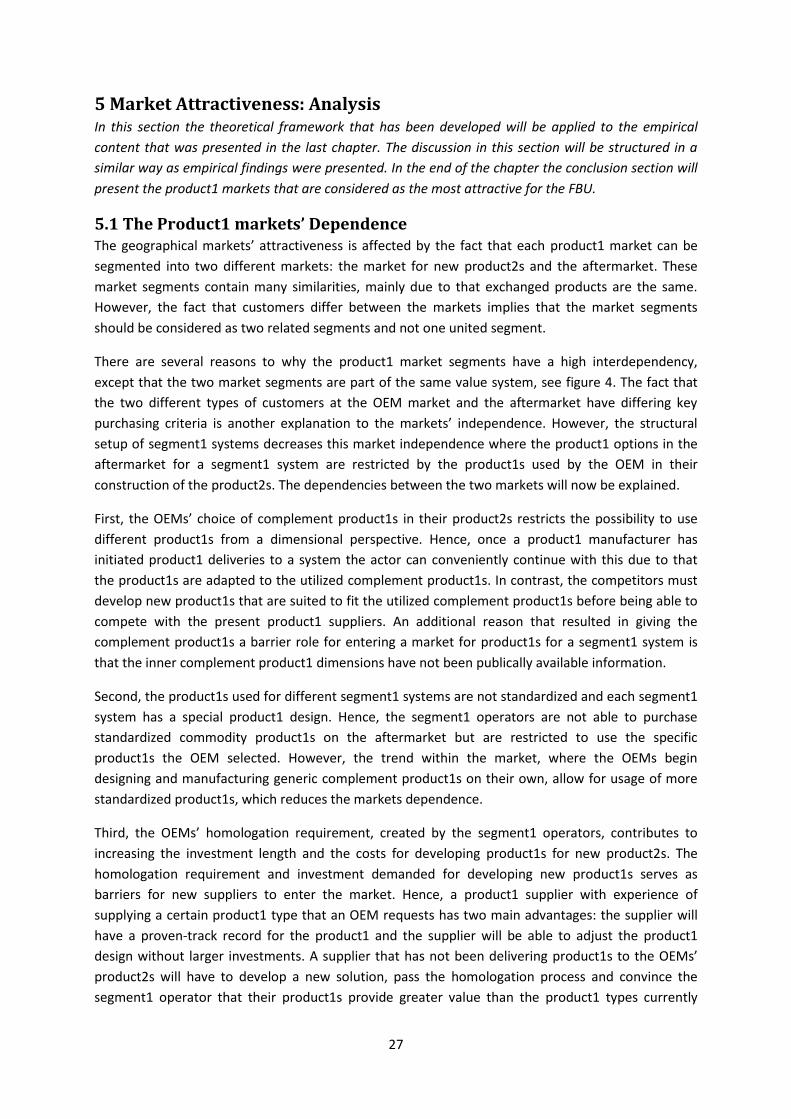
27
5 Market Attractiveness: Analysis In this section the theoretical framework that has been developed will be applied to the empirical
content that was presented in the last chapter. The discussion in this section will be structured in a
similar way as empirical findings were presented. In the end of the chapter the conclusion section will
present the product1 markets that are considered as the most attractive for the FBU.
5.1 The Product1 markets’ Dependence The geographical markets’ attractiveness is affected by the fact that each product1 market can be
segmented into two different markets: the market for new product2s and the aftermarket. These
market segments contain many similarities, mainly due to that exchanged products are the same.
However, the fact that customers differ between the markets implies that the market segments
should be considered as two related segments and not one united segment.
There are several reasons to why the product1 market segments have a high interdependency,
except that the two market segments are part of the same value system, see figure 4. The fact that
the two different types of customers at the OEM market and the aftermarket have differing key
purchasing criteria is another explanation to the markets’ independence. However, the structural
setup of segment1 systems decreases this market independence where the product1 options in the
aftermarket for a segment1 system are restricted by the product1s used by the OEM in their
construction of the product2s. The dependencies between the two markets will now be explained.
First, the OEMs’ choice of complement product1s in their product2s restricts the possibility to use
different product1s from a dimensional perspective. Hence, once a product1 manufacturer has
initiated product1 deliveries to a system the actor can conveniently continue with this due to that
the product1s are adapted to the utilized complement product1s. In contrast, the competitors must
develop new product1s that are suited to fit the utilized complement product1s before being able to
compete with the present product1 suppliers. An additional reason that resulted in giving the
complement product1s a barrier role for entering a market for product1s for a segment1 system is
that the inner complement product1 dimensions have not been publically available information.
Second, the product1s used for different segment1 systems are not standardized and each segment1
system has a special product1 design. Hence, the segment1 operators are not able to purchase
standardized commodity product1s on the aftermarket but are restricted to use the specific
product1s the OEM selected. However, the trend within the market, where the OEMs begin
designing and manufacturing generic complement product1s on their own, allow for usage of more
standardized product1s, which reduces the markets dependence.
Third, the OEMs’ homologation requirement, created by the segment1 operators, contributes to
increasing the investment length and the costs for developing product1s for new product2s. The
homologation requirement and investment demanded for developing new product1s serves as
barriers for new suppliers to enter the market. Hence, a product1 supplier with experience of
supplying a certain product1 type that an OEM requests has two main advantages: the supplier will
have a proven-track record for the product1 and the supplier will be able to adjust the product1
design without larger investments. A supplier that has not been delivering product1s to the OEMs’
product2s will have to develop a new solution, pass the homologation process and convince the
segment1 operator that their product1s provide greater value than the product1 types currently

28
utilized in the product2s. The trend on the market where the OEMs purchase product1s from several
suppliers reduces the winner-takes-it-all characteristic on the aftermarket since the segment1
operator will have an option to procure product1s from two suppliers. However, the entry barriers
for other product1 suppliers remain and the fact that the existing suppliers of product1s to the OEM
often maintain similar market share within the aftermarket proves that the aftermarket still is
dependent on the OEM market.
Four, the segment1 operators are adjusting their relubing operations after the type of component5
utilized in the product1s. Since the segment1 operators are unwilling to have several component5
types on stock in their service depots, due to for example inventory costs, new potential product1
aftermarket suppliers are challenged by the product1 design already in use. This creates two barriers
for entrants: to gain access to the information about the component5 used and to design a solution
where the component5 can be applied, which could be demanding since the component5 must be
synchronized with other design features of the product1s, such as the component3.
The fact that the market for product1s sold to OEMs has a high influence on the product1 solutions
utilized in the aftermarket, in combination with that product1 replacement interval for product2s is
quite long, makes it critical for Acme to gain shares at the OEM market. By ensuring this the product1
supplier will be in a great position to gain high shares in the aftermarkets since there are various
entry barriers that keep other product1 suppliers out of local product1 markets.
5.2 Geographical Market Characteristics A first analysis for identifying attractive market segments is to understand the size and the growth of
the various geographical market segments. In order to capture the full potential of the geographical
product1 markets the size of each OEM product1 market has been compared with its aftermarket for
product1s, see figure 6.
Figure 6 - The geographical product1 markets for OEM product1s and aftermarket product1s 2010 (Respondent9 2012j)
It is possible to see that the largest product1 market can be found in the Asian region. This region has
the largest aftermarket but above all its OEM product1 market is substantially larger than the second
Pro
du
ct1
aft
erm
arke
t si
ze 2
01
0
OEM product1 market size 2010
Africa/Middle East
Asia
CIS
Eastern Europe
North America
South America
Western Europe
Low High
Low
H
igh

29
largest market, Western Europe. This market together with the North American product1 market
have considerably larger aftermarkets than the remaining four product1 markets, which is a result of
that these markets have been leading product1 markets historically (Respondent4 2012b).
Furthermore, the North American and the Western European OEM markets are also greater than the
four smallest aftermarket regions. However, the absolute size differences of the two regional groups
are smaller for the OEM market than for the aftermarket.
Figure 7 - OEM market growth indicator and the aftermarket growth indicator per geographical product1 market (Respondent9 2012)
In order to determine the geographical markets’ attractiveness it is important to assess the markets’
growth. The growths of the OEM product1 markets have been estimated by the indicator: new
product2 growth, see table 5. The indicator is estimated to be valid since the amount of product1s is
proportional to the amount of new product2s. Additionally, since the indicator focuses on the growth
in new product2s it encapsulates product1s utilized in new product2s that both expands the installed
base and replaces existing worn down product2s. The aftermarket growths have been estimated by
the growth in the installed base since the market is proportionate to the amount of existing
product2s. Due to that the average replacement interval on the aftermarket for product1s is
approximately 12 years the effect of the current expansion on the aftermarket will be delayed.
However, since the constructions of segment1 systems are long-term projects due to governmental
influence the indicator can be considered as fair estimator of the aftermarket growth.
The geographical product1 markets can be clustered into two groups regarding the growths on the
OEM market and aftermarket. Africa/Middle East, Asia and South America have high growth for both
product1 markets whereas CIS, Eastern Europe, North America and Western Europe are expected to
have negative growth on the OEM market and low growth on the aftermarket, see figure 7. The
geographical markets’ growths should be valued in the assessment of the product1 markets,
however the market size is a more important factor due to that the markets’ turnovers differs widely.
Hence, it’s rather the absolute growth that is important rather than the growth in percent.
Inst
alle
d b
ase
gro
wth
(2
01
0-2
01
5)
New product2 growth (2010-2015)
Africa/Middle East
Asia
CIS
Eastern Europe
North America
South America
Western Europe
Negative Positive
Low
H
igh
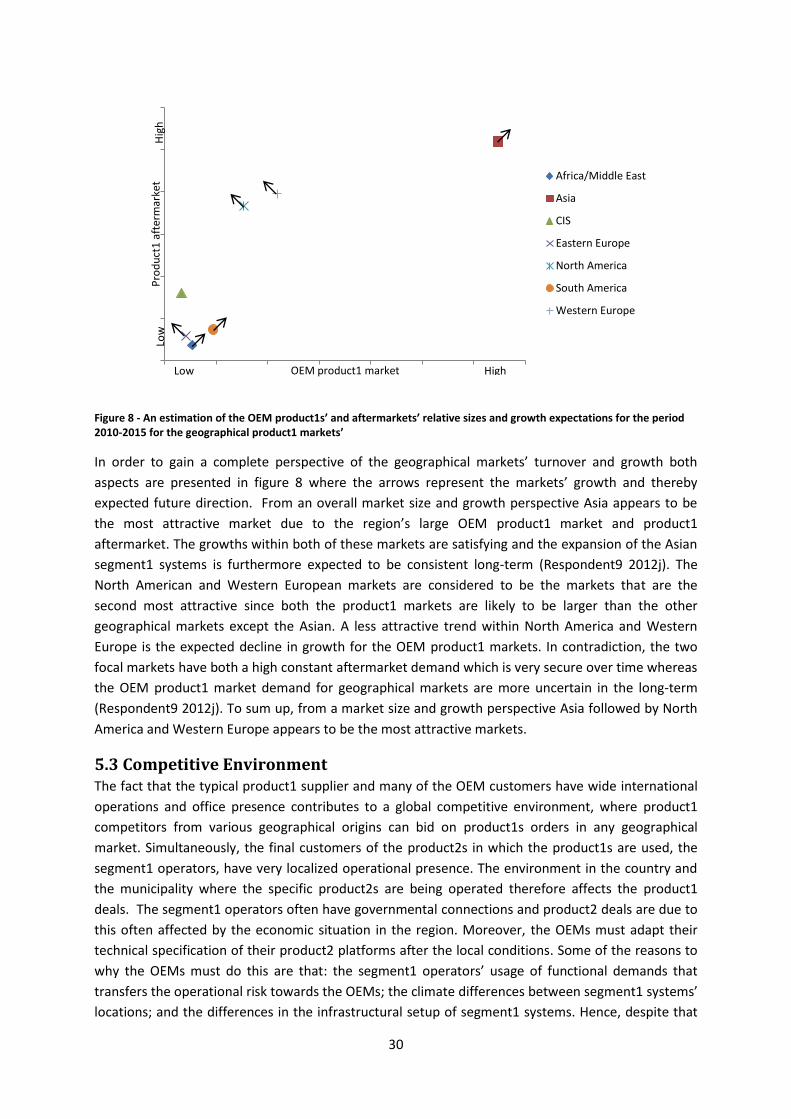
30
Figure 8 - An estimation of the OEM product1s’ and aftermarkets’ relative sizes and growth expectations for the period 2010-2015 for the geographical product1 markets’
In order to gain a complete perspective of the geographical markets’ turnover and growth both
aspects are presented in figure 8 where the arrows represent the markets’ growth and thereby
expected future direction. From an overall market size and growth perspective Asia appears to be
the most attractive market due to the region’s large OEM product1 market and product1
aftermarket. The growths within both of these markets are satisfying and the expansion of the Asian
segment1 systems is furthermore expected to be consistent long-term (Respondent9 2012j). The
North American and Western European markets are considered to be the markets that are the
second most attractive since both the product1 markets are likely to be larger than the other
geographical markets except the Asian. A less attractive trend within North America and Western
Europe is the expected decline in growth for the OEM product1 markets. In contradiction, the two
focal markets have both a high constant aftermarket demand which is very secure over time whereas
the OEM product1 market demand for geographical markets are more uncertain in the long-term
(Respondent9 2012j). To sum up, from a market size and growth perspective Asia followed by North
America and Western Europe appears to be the most attractive markets.
5.3 Competitive Environment The fact that the typical product1 supplier and many of the OEM customers have wide international
operations and office presence contributes to a global competitive environment, where product1
competitors from various geographical origins can bid on product1s orders in any geographical
market. Simultaneously, the final customers of the product2s in which the product1s are used, the
segment1 operators, have very localized operational presence. The environment in the country and
the municipality where the specific product2s are being operated therefore affects the product1
deals. The segment1 operators often have governmental connections and product2 deals are due to
this often affected by the economic situation in the region. Moreover, the OEMs must adapt their
technical specification of their product2 platforms after the local conditions. Some of the reasons to
why the OEMs must do this are that: the segment1 operators’ usage of functional demands that
transfers the operational risk towards the OEMs; the climate differences between segment1 systems’
locations; and the differences in the infrastructural setup of segment1 systems. Hence, despite that
Pro
du
ct1
aft
erm
arke
t
OEM product1 market
Africa/Middle East
Asia
CIS
Eastern Europe
North America
South America
Western Europe
Low High
Low
H
igh
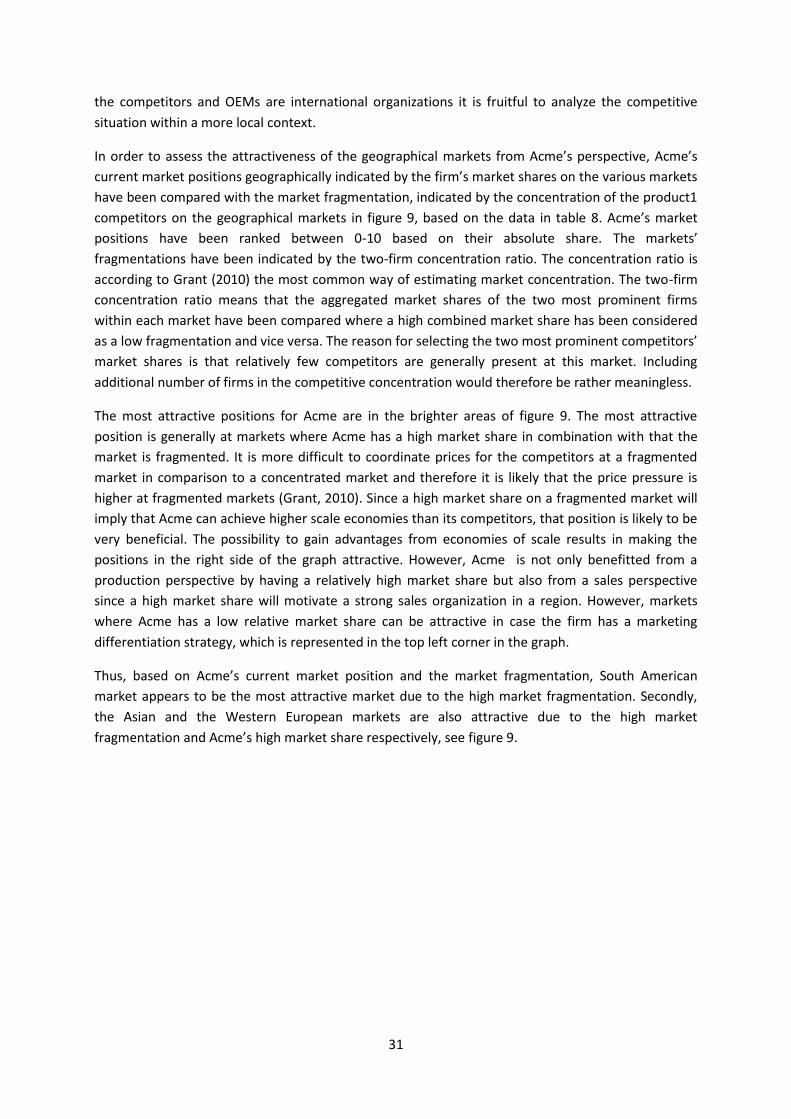
31
the competitors and OEMs are international organizations it is fruitful to analyze the competitive
situation within a more local context.
In order to assess the attractiveness of the geographical markets from Acme’s perspective, Acme’s
current market positions geographically indicated by the firm’s market shares on the various markets
have been compared with the market fragmentation, indicated by the concentration of the product1
competitors on the geographical markets in figure 9, based on the data in table 8. Acme’s market
positions have been ranked between 0-10 based on their absolute share. The markets’
fragmentations have been indicated by the two-firm concentration ratio. The concentration ratio is
according to Grant (2010) the most common way of estimating market concentration. The two-firm
concentration ratio means that the aggregated market shares of the two most prominent firms
within each market have been compared where a high combined market share has been considered
as a low fragmentation and vice versa. The reason for selecting the two most prominent competitors’
market shares is that relatively few competitors are generally present at this market. Including
additional number of firms in the competitive concentration would therefore be rather meaningless.
The most attractive positions for Acme are in the brighter areas of figure 9. The most attractive
position is generally at markets where Acme has a high market share in combination with that the
market is fragmented. It is more difficult to coordinate prices for the competitors at a fragmented
market in comparison to a concentrated market and therefore it is likely that the price pressure is
higher at fragmented markets (Grant, 2010). Since a high market share on a fragmented market will
imply that Acme can achieve higher scale economies than its competitors, that position is likely to be
very beneficial. The possibility to gain advantages from economies of scale results in making the
positions in the right side of the graph attractive. However, Acme is not only benefitted from a
production perspective by having a relatively high market share but also from a sales perspective
since a high market share will motivate a strong sales organization in a region. However, markets
where Acme has a low relative market share can be attractive in case the firm has a marketing
differentiation strategy, which is represented in the top left corner in the graph.
Thus, based on Acme’s current market position and the market fragmentation, South American
market appears to be the most attractive market due to the high market fragmentation. Secondly,
the Asian and the Western European markets are also attractive due to the high market
fragmentation and Acme’s high market share respectively, see figure 9.

32
Figure 9 - Acme’s product1 market share relative the product1 market fragmentation (Based on data provided by Respondent4 2012)
5.4 Entry Barriers The various markets’ attractiveness are also dependent on the barriers to entry. To have
homologated product1s and to possess certain quality certificates is as explained a barrier to enter
the global product1 market. However, having overcome this barrier there are still barriers that
product1 suppliers must conquer in order to enter a new geographical market. These barriers must
be mastered in order for a firm to establish a competitive position within a geographical market. That
is, an existing product1 supplier could possibly utilize its global organization to win a few orders in
an, for the supplier, unexplored geographical market but in order to gain a competitive position the
entry barriers must be overcome. Thus, the entry barriers are in the form of expansion barriers for
existing product1 suppliers to enter into new geographical markets. Three such barriers have been
identified within the geographical product1 markets: the strength of the local safety emphasis; the
demand of existing relationships with regional customers; the need for local manufacturing setup.
Africa/ Middle East
Asia CIS Eastern Europe
North America
South America
Western Europe
Product1 safety 2 4 2 3 4 4 5 Customer relationship 4 4 5 4 5 2 4 Local manufacturing requirement
1 4 5 4 4 2 1
Entry barrier strength 2.3 4.0 4.0 3.7 4.3 2.7 3.3 Table 13 - Ranking of the different entry barriers strength within the geographical product1 markets. Ranking 1-5 where 5 is the highest score.
The product1 safety parameter captures the strength of the OEMs’ and segment1 operators’
preference to procure product1s that are perceived as having a high reliability and safety. The
parameter contains mainly two aspects: the existence of product1 references with a proven track-
record and the demand for advanced product1 solutions. The geographical markets have each been
classified on the product1 safety parameter on a scale from 1 to 5 in table 13 where Western Europe
scores the highest on this parameter due to high safety focus and high technical advancement in the
0
1
2
3
4
5
6
7
8
9
10
0 1 2 3 4 5 6 7 8 9 10
Met
ro m
arke
t fr
agm
enta
tio
n
Acme's market share
Africa/Middle East
Asia
CIS
Eastern Europe
North America
South America
Western Europe
33
product1 solutions. The Asian customers are also stressing the vitality of safety in their product1
purchases but emphasis on product1 advancement is not perceived as high as in Western Europe,
therefore Asia scores a 4.
The same situation holds for the South American market where safety also is a key purchasing
criterion. Furthermore, despite that product1s are considered as a commodity in the North American
market the importance of safety is high due to the OEMs’ and segment1 operators’ extensive
product responsibility. Thus, the North American market is given a 4 on the safety parameter in table
13. In contrast, the CIS market is only given a 2 on the safety factor due to that the customers within
the market focus on price and that product1s are regarded as a pure commodity. The Eastern
European market is considered to have an understanding but not a main focus on safety and is
therefore given a 3 on this parameter. The lack of understanding for safety in Africa/Middle East but
that safety still is a demand implies that the region has been rewarded the score 2.
The possibility to build customer relationships is also considered to be a barrier to enter and expand
within a geographical market. More specifically the parameter relates to the possibility to establish
relationships with the customers that allows for the entrant to be accepted as a product1 supplier.
The possibility to initiate relationships with the customers is affected by the strength and width of
the current relationships between the established product1 suppliers and customers, as well as of
the amount of potential customers present at the market. This barrier is especially strong in the CIS
and North American markets since the potential OEM customers are few and the customer
relationships are relatively solid and long-term. This holds especially for the North American market.
Hence, these markets are given a 5 on the customer relationship parameter in table 13.
The customer relationship factor is clearly a barrier in the Asian market as well, where the Japanese
product1 market is the extreme. The fierce competition on the Japanese product1 market implies
that an existing relationship is a must to supply product1s. However, despite that the Chinese and
Indian product1 customers value relationships, the fact that many OEMs are active on the markets
reduce the barrier in Asia, which scores 4 on the parameter. The Eastern European market is ranked
similarly due to that many of the segment1 systems within the region are OEM operated which
implies that the product1 suppliers are likely to strengthen the relationships with the OEMs since
these also are the aftermarket customers. Additionally, the Eastern European OEM market is
relatively consolidated. Relationship as an entry barrier is also considered to be of strength 4 in
Western Europe. Even though the OEM product1 market is rather fragmented the relationship
barrier is relatively strong due to that Western Europe is the home market for several of the leading
product1 suppliers. Additionally, the fact that product1 suppliers are involved during the OEMs’ early
design phases implies that the OEMs most likely will purchase the involved product1 supplier’s
solution since the product2 design has been adapted to the product1 supplier’s offer.
The requirement of relationship with the local customers is judged to be less of an issue for new
entrants in the South American market since many of the product2 orders are exported to South
America. Furthermore, the market is relatively fragmented and many of the segment1 systems are
not especially large. Considering this information the market scores a 2 on the relational factor in
table 13. As for the South American market, the African/Middle Eastern market is also supplied by
product2s from exporting OEMs to a relatively high degree. Despite this characteristic which reduce
the importance of local relationships the segment1 operators and municipalities have a great
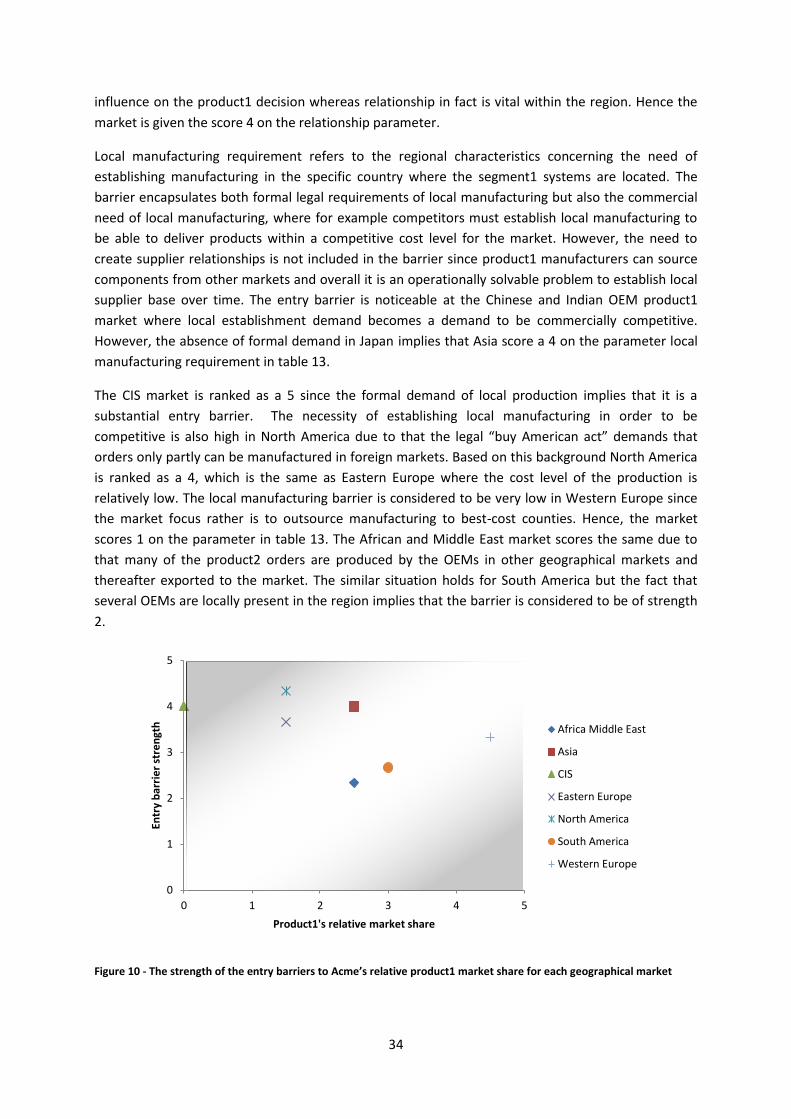
34
influence on the product1 decision whereas relationship in fact is vital within the region. Hence the
market is given the score 4 on the relationship parameter.
Local manufacturing requirement refers to the regional characteristics concerning the need of
establishing manufacturing in the specific country where the segment1 systems are located. The
barrier encapsulates both formal legal requirements of local manufacturing but also the commercial
need of local manufacturing, where for example competitors must establish local manufacturing to
be able to deliver products within a competitive cost level for the market. However, the need to
create supplier relationships is not included in the barrier since product1 manufacturers can source
components from other markets and overall it is an operationally solvable problem to establish local
supplier base over time. The entry barrier is noticeable at the Chinese and Indian OEM product1
market where local establishment demand becomes a demand to be commercially competitive.
However, the absence of formal demand in Japan implies that Asia score a 4 on the parameter local
manufacturing requirement in table 13.
The CIS market is ranked as a 5 since the formal demand of local production implies that it is a
substantial entry barrier. The necessity of establishing local manufacturing in order to be
competitive is also high in North America due to that the legal “buy American act” demands that
orders only partly can be manufactured in foreign markets. Based on this background North America
is ranked as a 4, which is the same as Eastern Europe where the cost level of the production is
relatively low. The local manufacturing barrier is considered to be very low in Western Europe since
the market focus rather is to outsource manufacturing to best-cost counties. Hence, the market
scores 1 on the parameter in table 13. The African and Middle East market scores the same due to
that many of the product2 orders are produced by the OEMs in other geographical markets and
thereafter exported to the market. The similar situation holds for South America but the fact that
several OEMs are locally present in the region implies that the barrier is considered to be of strength
2.
Figure 10 - The strength of the entry barriers to Acme’s relative product1 market share for each geographical market
0
1
2
3
4
5
0 1 2 3 4 5
Entr
y b
arri
er
stre
ngt
h
Product1's relative market share
Africa Middle East
Asia
CIS
Eastern Europe
North America
South America
Western Europe
35
After scoring the entry barriers on the geographical product1 markets, North America can be
identified as the market where the barriers to enter is the strongest, see table 13. The market is
followed by the entry barriers in Asia and CIS which are the second strongest. South America is the
market where the entry barriers are the weakest. However, from Acme’s perspective the value of the
strength of the entry barriers on a market is dependent on the firm’s market position. Therefore, the
strength of the entry barriers on the geographical markets have been compared with Acme’s market
positions indicated by Acme’s relative market shares based on the data in table 8. The comparison
can be seen in figure 10, where the bright areas represent the attractive positions for Acme. Hence,
in markets where Acme has a strong position the entry barriers serve as protection to increased
competition, the top-right corner in figure 10, whereas weak entry barriers are positive for markets
where Acme have weak positions, indicated in the low-left corner of figure 10. From this perspective
the South American market appears to be the most attractive followed by the Asian and Western
European market. Furthermore, based on the perspective presented in figure 10, Acme would
benefit from strengthened entry barriers in Western Europe, which is in contrast to Asia where the
entry barriers restrict Acme’s abilities to compete.
In order to focus the analysis on the markets which appear to be the most attractive, a screening will
be conducted based on the perspectives discussed. From a market turnover and growth approach
the Asian market followed by the North American and Western European market seem to be the
most attractive, mainly since these market are substantially larger than the other markets, see figure
9. From a market position view, presented in figure 9, Western Europe followed by Asia are the
markets where Acme has a competitive position. From this aspect Acme appears to have an
unfavorable position for the remaining markets. That holds for the previously discussed North
American market as well, but taking the opposite approach Acme can be considered to have quite
high market share potential on the North American market since the firm has a relatively weak
position. However, entering the market could be difficult based on the insight given in figure 10,
where the North American market has the strongest entry barriers. The South American market
appears to be attractive based on Acme’s current market positions. Furthermore, the Asian and
Western European markets are the second most attractive markets from this view given in figure 10.
To sum up, the Asian and Western European market are the geographical markets that are the most
interesting from the presented assessments since these are ranked among the top three
geographical regions for all assessments. Additionally, the North American market will also be
evaluated further due to Acme’s large potential. Hence, the geographical markets that will be
investigated henceforth are the Asian, Western European and North American markets.
5.5 Key Purchasing Criteria Fit In order to assess the market attractiveness it is important to consider the customers’ demands
which can be conducted more specifically by evaluating the customers’ prioritization of their
purchasing criteria. Based on the previous discussion about the OEM markets and aftermarkets
dependence and that the OEM market has a high influence on the product1 choices on the
aftermarkets, the OEMs’ key purchasing criteria will be assessed. It is also worth noting that the OEM
customers are active on several markets but rather it is the geographical regions characteristics that
determine what purchasing criteria that are emphasized.
36
Key purchasing criteria Explanation
Product1 design The solution’s technical advancement Price The product1 unit price Relationship The strength and interrelatedness of the relationship
with the customers, e.g. strength of personal contracts The technical knowledge within the product1 suppliers’
organization Quality The delivered product1s’ conformance to the technical
specifications, expressed by e.g. scrape rate The delivery performance of the product1 orders
Table 14 - Overall key purchasing criteria
The product2 OEMs in the different geographical markets stress different key purchasing criteria, see
table 10-12. However, from our perspective the OEMs’ in the different geographical markets
emphasize the similar underlying factors despite these are referred to differently. Based on this and
in order to be able to compare the key purchasing criteria stressed in the different geographical
markets four generic key purchasing criteria have been identified, see table 14. The product1 design
criterion encapsulates the advancement in the technical design and it is related to the Western
European parameters design, experience and references as well as reliability and safety. The
parameter describes what the product1 is aimed to achieve and experiences and references are
therefore only considered to be an indicator of the parameter.
At the Asian and North American market the parameter is connected to the reliability and safety
parameter. The price parameter is simply the product1s’ unit price. The relationship parameter, in
table 14, includes; the Western European perspective of references and experience as well as risk;
the Asian relationship parameter; and the North American reliability and safety parameter. The key
purchasing criterion quality is very much as the European quality performance parameter but it also
includes quality performance references which are expressed in the Western European parameter
references and experiences. The quality parameter is connected to the Asian key purchasing criteria
reliability and safety since this key purchasing criterion focuses on product1 solutions which are safe
and have low degree of quality problems. In North America quality is related to both the key
purchasing criteria quality and reliability and safety since the generic quality parameter includes both
unplanned failures and non-conformance goods.
Geographical customers' requirements Acme's performance
Asia North America Western Europe Asia North America Western Europe
Product1 design
3 2 4 4
Price 4 5 3 2
Relationship 4 3 3 3 1 3
Quality 4 4 5 3
Table 15 – The strength of the key purchasing demands on the further investigated markets: Asia, North America and Western Europe
In order to compare the regional OEMs’ requirements on the four generic key purchasing criteria
each of these parameters’ relative importance have been ranked between the geographical markets
on a scale from 1 to 5, see table 15. Hence, an understanding of how vital the key purchasing criteria
are on the different markets is gained. This have thereafter been compared with Acme’s

37
performance on the generic key purchasing criteria in order to understand how well Acme’s overall
offer matches with the markets’ demands.
The generic key purchasing criteria product1 design is estimated to be a 4 in Western Europe due to
the technical advancement focus. The OEM’s technical demands in Asia is lower but the region score
3 on the parameter since the emphasis on advancement in technical solutions is increasing. The fact
that product1s are considered as a commodity with relative low demands on lifetime, results in that
North America is ranked as a 2 on product1 design. Acme is estimated to score a 4 on the parameter
since the product1s’ technical advancement is one of Acme’s competitive advantages.
The North American OEMs have a strong price focus and the fact that the price level is in absolute
terms the lowest among the compared geographical regions implies that the market is ranked as a 5
on the parameter price. The strong price emphasis among the OEMs active in India and China implies
that Asia have been ranked as a 4. The Western European OEMs are perceived to focus slightly less
on price and the usage of customer evaluation matrixes reduces this focus even more, hence they
are ranked as a 3. Since Acme is perceived to have a relatively high product1 price on the markets the
firm is given a performance of 2 on price.
The Asian OEMs are the customers that are perceived to have the highest emphasis on relationship,
ranked as a 4, since it is an important factor in order to be accepted as a product1 supplier. In
Western Europe, customer relationships become more important due to product1 suppliers early
involvement in the conception phase, and therefore it is ranked as a 3. The North American
relationship focus is not as strong as the Asian and it is estimated to be similar to the European. The
FBU’s performance on the relationship parameter is affected by the sales organizations strength on
the different regional markets. In Asia, Acme scores a 3 on relationship since the organization has a
wide presence but that the sales organizations is built around a few experienced employees. The
European sales organization is stronger but compared to the competitors’ strong sales organizations
Acme’s performance is judged as average, therefore given a 3. Acme’s relatively low market presence
in North America implies that Acme scores a 1 on relationship in the region.
Quality is a key purchasing criterion that is highly stressed overall and the Asian and North American
markets are ranked as 4 since product1 reliability and safety is emphasized and quality issues
important to avoid. However, the Western European market is ranked higher, as a 5, due to the
OEMs’ technological emphasis. Acme’s performance is ranked as a 3 due to that the product1
manufacturers have had a number of quality cases during the latest years but above all that Acme’s
responsiveness in product1 deliveries is criticized.

38
Figure 11 - Acme’s residual performance on the customers’ key purchasing criteria on the different geographical markets
Acme has based on this analysis the best offer fit with the Western European market where the firm
has a lower performance on price and quality, see figure 11. The performance gap on the key
purchasing criterion quality reflects to a large extent the Western European OEMs’ high demand of
timely deliveries. In contrast, Acme has the poorest fit with the North American customers where
Acme overperform on product1 design since the North American OEMs are unlikely to fully
appreciate Acme’s technical solutions. As a result of this it is likely that Acme underperforms on the
price criterion. The weak sales organization in comparison to its competitors in North America and
the fact that Acme has had some quality cases implies that the firm underperforms on relationship
and quality as well. Acme’s offer fit with the Asian OEMs’ demands is quite similar to the fit with the
North American OEMs’ demands. However, the higher emphasis on advancement in product1
solutions, an overall higher price level and Acme’s stronger market presence in the Asian region
compared to the North American market are the main reasons to why Acme has a closer offer fit
with the Asian OEMs compared to the North American peers.
5.6 Conclusion: Selection of Markets The Asian and European product1 markets followed by the North American product1 market were
the markets that were identified as the most attractive for Acme from a market characteristic,
competitive position and entry barrier perceptive. From the customer perspective, based on the
segment1 OEMs’ key purchasing criteria, the European followed by the Asian product1 market are
identified to be the most interesting.
The North American product1 market is considered to be the least attractive among the three largest
geographical product1 markets discussed. The size and growth of the product1 markets aftermarket
are appealing but not in comparison with the European and Asian aftermarkets’. Furthermore,
Acme’s relatively low market share implies that there is an existence of expansion potential but the
competitive concentration, the strong entry barriers and the firm’s unfavorable offer fit undermine
this potential. Above all, the lack of close connections with few OEMs in combination with that Acme
deliver unappreciated technological advanced solutions at a too high price results in that Acme
Alpha design Price Relationship Quality
Asia
North America
Western Europe
39
seems to have other “low hanging fruits” that rather can be picked before focusing on the North
American market.
The Western European market is the geographical market where Acme have the absolute closest
offer fit with OEMs’ demands. This is not surprising since the Western European market is the market
where Acme have the undeniably strongest market position, with an estimated market share of 30%,
see table 8. From a market attractiveness perspective it is possible to question Acme’s market
potential since it is likely to be challenging to gain additional market shares, especially considering
that the OEMs utilize multiple sourcing strategies more frequently. Hence, although Acme will have
the possibility to deliver product1s to a larger amount of segment1 systems, the firm’s market share
in the received product1 orders are likely to be reduced. This change would probably benefit
product1 suppliers with powerful sales organizations since product1 suppliers will have to conduct
additional product1 projects simultaneously. This is not especially positive based on the market
potential possibilities it provides for Acme. However, Acme is considered to have a relatively close fit
to Western European OEMs’ purchasing criteria and that the market is attractive from a market
characteristic and entry barrier perspective. Additionally, the Western European market is a strategic
market from the perspective that many product2 orders that are exported are manufactured and
occasionally procured from Western Europe. Despite the trend that the geographical markets
becomes increasingly local and that the amount of export orders are expected to decrease. This
market is especially interesting in the short-medium perspective when the export business still is
active.
Based on the complete view of the perspectives from the theoretical framework, discussed in this
section, the Asian product1 market is regarded as the most attractive for Acme. First, the OEM
product1 market and aftermarket are the indisputably largest and the markets’ growths are relatively
high. Acme does neither have a strong nor weak position on the Asian market and is perceived to
have possibilities to gain market shares based on that the competition is relatively fragmented.
Furthermore, the fact that Acme already is present on many of the national markets in the Asian
region implies that the market’s strong entry barrier does not compose any major hinder for
prioritizing the Asian product1 market. Acme has a certain key purchasing criteria gap on the Asian
market and the firm’s offer is not fully aligned with the Asian OEMs’ key purchasing criteria.
However, this gap can be managed by accomplishing internal changes that is a more appropriate fit
to the OEMs’ key purchasing criteria.
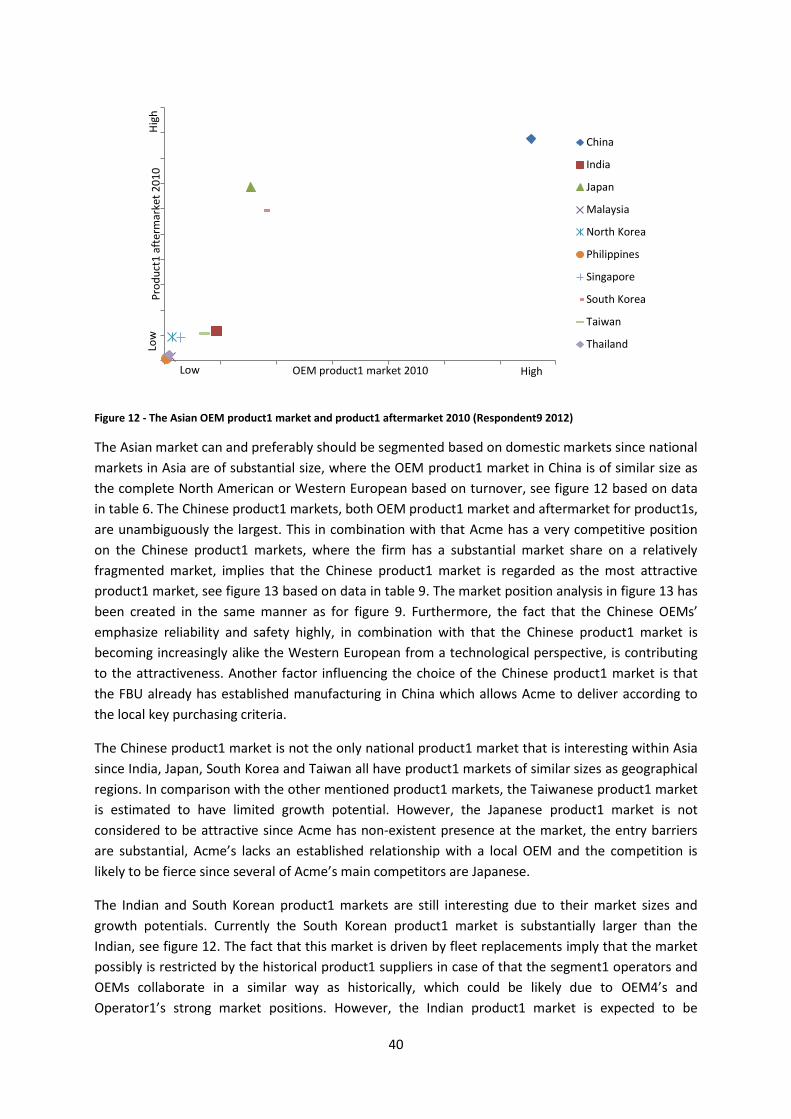
40
Figure 12 - The Asian OEM product1 market and product1 aftermarket 2010 (Respondent9 2012)
The Asian market can and preferably should be segmented based on domestic markets since national
markets in Asia are of substantial size, where the OEM product1 market in China is of similar size as
the complete North American or Western European based on turnover, see figure 12 based on data
in table 6. The Chinese product1 markets, both OEM product1 market and aftermarket for product1s,
are unambiguously the largest. This in combination with that Acme has a very competitive position
on the Chinese product1 markets, where the firm has a substantial market share on a relatively
fragmented market, implies that the Chinese product1 market is regarded as the most attractive
product1 market, see figure 13 based on data in table 9. The market position analysis in figure 13 has
been created in the same manner as for figure 9. Furthermore, the fact that the Chinese OEMs’
emphasize reliability and safety highly, in combination with that the Chinese product1 market is
becoming increasingly alike the Western European from a technological perspective, is contributing
to the attractiveness. Another factor influencing the choice of the Chinese product1 market is that
the FBU already has established manufacturing in China which allows Acme to deliver according to
the local key purchasing criteria.
The Chinese product1 market is not the only national product1 market that is interesting within Asia
since India, Japan, South Korea and Taiwan all have product1 markets of similar sizes as geographical
regions. In comparison with the other mentioned product1 markets, the Taiwanese product1 market
is estimated to have limited growth potential. However, the Japanese product1 market is not
considered to be attractive since Acme has non-existent presence at the market, the entry barriers
are substantial, Acme’s lacks an established relationship with a local OEM and the competition is
likely to be fierce since several of Acme’s main competitors are Japanese.
The Indian and South Korean product1 markets are still interesting due to their market sizes and
growth potentials. Currently the South Korean product1 market is substantially larger than the
Indian, see figure 12. The fact that this market is driven by fleet replacements imply that the market
possibly is restricted by the historical product1 suppliers in case of that the segment1 operators and
OEMs collaborate in a similar way as historically, which could be likely due to OEM4’s and
Operator1’s strong market positions. However, the Indian product1 market is expected to be
Pro
du
ct1
aft
erm
arke
t 2
01
0
OEM product1 market 2010
China
India
Japan
Malaysia
North Korea
Philippines
Singapore
South Korea
Taiwan
Thailand
Low High
Low
H
igh
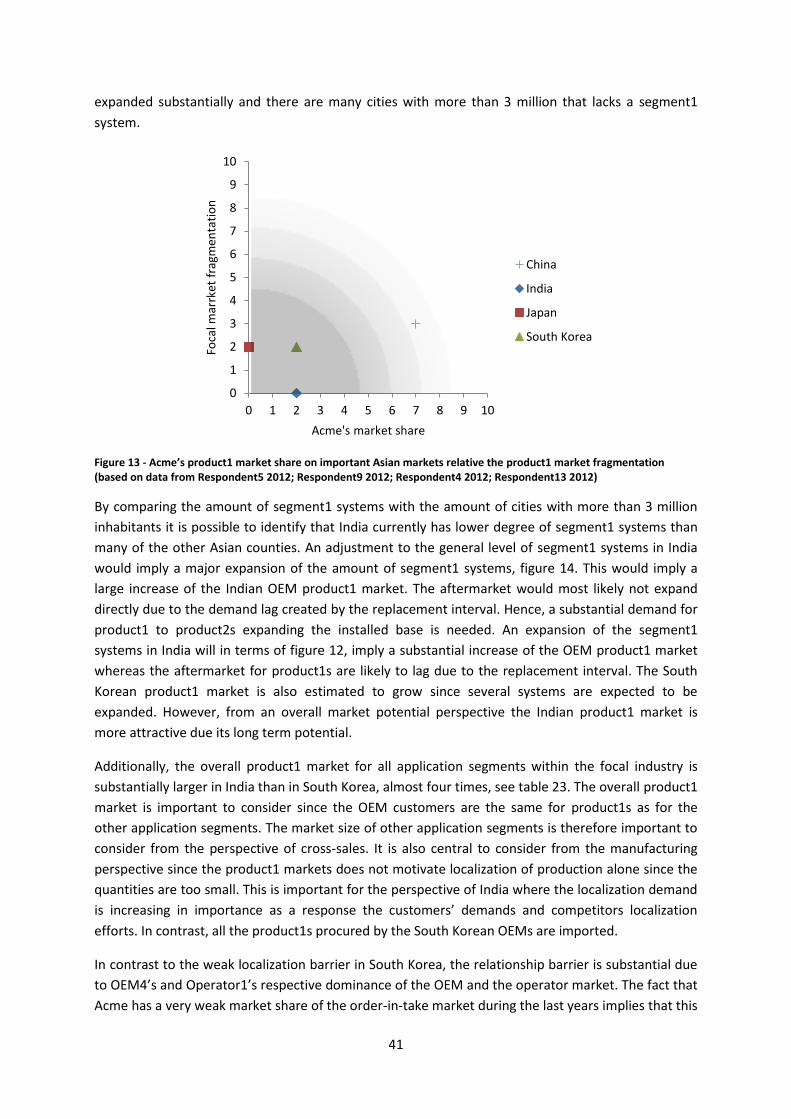
41
expanded substantially and there are many cities with more than 3 million that lacks a segment1
system.
Figure 13 - Acme’s product1 market share on important Asian markets relative the product1 market fragmentation (based on data from Respondent5 2012; Respondent9 2012; Respondent4 2012; Respondent13 2012)
By comparing the amount of segment1 systems with the amount of cities with more than 3 million
inhabitants it is possible to identify that India currently has lower degree of segment1 systems than
many of the other Asian counties. An adjustment to the general level of segment1 systems in India
would imply a major expansion of the amount of segment1 systems, figure 14. This would imply a
large increase of the Indian OEM product1 market. The aftermarket would most likely not expand
directly due to the demand lag created by the replacement interval. Hence, a substantial demand for
product1 to product2s expanding the installed base is needed. An expansion of the segment1
systems in India will in terms of figure 12, imply a substantial increase of the OEM product1 market
whereas the aftermarket for product1s are likely to lag due to the replacement interval. The South
Korean product1 market is also estimated to grow since several systems are expected to be
expanded. However, from an overall market potential perspective the Indian product1 market is
more attractive due its long term potential.
Additionally, the overall product1 market for all application segments within the focal industry is
substantially larger in India than in South Korea, almost four times, see table 23. The overall product1
market is important to consider since the OEM customers are the same for product1s as for the
other application segments. The market size of other application segments is therefore important to
consider from the perspective of cross-sales. It is also central to consider from the manufacturing
perspective since the product1 markets does not motivate localization of production alone since the
quantities are too small. This is important for the perspective of India where the localization demand
is increasing in importance as a response the customers’ demands and competitors localization
efforts. In contrast, all the product1s procured by the South Korean OEMs are imported.
In contrast to the weak localization barrier in South Korea, the relationship barrier is substantial due
to OEM4’s and Operator1’s respective dominance of the OEM and the operator market. The fact that
Acme has a very weak market share of the order-in-take market during the last years implies that this
0
1
2
3
4
5
6
7
8
9
10
0 1 2 3 4 5 6 7 8 9 10
Foca
l mar
rket
fra
gmen
tati
on
Acme's market share
China
India
Japan
South Korea

42
is a major barrier. Acme’s position at the Indian OEM product1 market is not either especially strong
however; Acme has relationship with several of the main OEMs. Acme’s competitors have a relatively
strong position at both of the markets. From a market position perspective the Indian OEM product1
market does also appear as the most attractive among the two. However, Acme’s value proposition
fit with the OEM’s key purchasing criteria is closer at the South Korean market where the customers
demand relatively technically advanced solutions despite the price pressure. The Indian market is
very much dominated by the price criterion.
Figure 14 - Amount of cities in Asia per country with over 3 million inhabitants (UN Population
Division 2008) compared with the number of segment1 systems (Anonymous source 2004). The solid
line is a linear regression.
Overall, the Indian product1 market is considered to be more attractive than the South Korean
product1 market. Despite that the South Korean product1 market currently are larger in absolute
terms the expected expansion of segment1 systems in India implies that it is more appealing from a
market potential perspective. Additionally, Acme market position on the markets favor India even
though the firm has a closer key purchasing criteria fit with the South Korean customers. Based on
this, India is considered to be the secondly most attractive product1 market after the Chinese.
All in all, the three markets that are considered to be the most attractive for the FBU are China, India
and Western Europe. The main reasons for selecting China is that it is a very large market with great
expected growth in combination with that the FBU currently has an attractive competitive position.
India is mainly selected due to the high growth expectations but also due to that the competitive
space is under current establishment. Western Europe is essentially interesting from a market size
perspective but also due to that the FBU has relatively good fit with the customers’ key purchasing
criteria on this market. Additionally, the importance as the number one exporting market contributes
to the Western European market’s attractiveness.
Am
ou
nt
of
segm
ent1
sys
yem
Amount of cities over 3 milion inhabitants
China
India
Japan
Malaysia
North Korea
Philippines
Singapore
South Korea
Taiwan
Thailand
Low High
Hig
h
Low

43
6 Capability Assessment: Theoretical Framework This chapter presents the theoretical base for the capability assessment. It initially explains how firms’
competitive advantages are gained from their resources and capabilities. Additionally, it gives insight
to how these resources and capabilities can be adapted in order for firms to increase their
competitiveness. Based on the perspectives explained a capability framework is finally presented.
6.1 The Resource Based View of the Firm A perspective of how firms gain sustainable competitive advantages is given by the resource-based
view of the firm (RBV) which focuses on firms’ internal strengths and weaknesses (Barney 1991;
Grant 1991; Penrose 1959). The RBV considers two important perspectives that are simplified in the
competitive environment explanation: that firms within an industry are homogenous in their control
of strategically important resources and that potential temporary heterogeneities among such
resources between firms are short lived due to the high mobility of the resources (Barney 1986;
Porter 1981). From the perspective of the RBV, strategic resources are heterogeneous and therefore
a source of competitive advantage (Barney 1991). Additionally, Grant (1991) highlights that the RBV
provides a better base for firms to formulate their long-term strategies since firm’s resources and
capabilities may be more stable than the firm’s external environment.
6.2 Resources, Competencies and Capabilities A key concept in the RBV is the firm’s resources which here are defined according to Grant (2008, p.
130) as “the productive assets owned by the firm”. Furthermore, Grant (2008) stresses that a firm’s
resources are far more than the ones stated on the balance sheet. In order to capture a complete
view of the firm’s resource position the resources can be divided into three principle types: tangible,
intangible and human resources. The tangible resources are the most transparent since they typically
consist of financial and physical assets considered in the firm’s balance sheet. According to Grant
(2008), the intangible resources are generally more valuable than the tangible resources. Examples of
intangible resources are patents which are technology related assets but also brand names and
valuable relationships which are denoted as reputational assets. These resources can be difficult to
identify and appraise due to their non-physical characteristics. The same holds for human resources,
such as skills and know-how.
Grant (2008) emphasizes that resources are not productive on their own and it is the competencies
that enables the resources to be deployed in order to create value in the organization. The term
competencies will be defined in accordance with Johnson’s et al. (2008) definition as a firm’s skills
and abilities which resources are deployed efficiently through an organization’s activities and
processes. It is the firm’s capabilities, defined accordingly to Helfat and Lieberman (2002, p. 725) as
“a firm’s capacity to deploy resources for a desired end result”, that create competitive advantage.
Firm’s capabilities are not as transparent as their resources and Grant (2008) present two
approaches for classifying and disaggregating activities: function analysis and value chain analysis. A
functional analysis identifies the capabilities within each of the firm’s organization’s functions
whereas a value chain analysis maps the capabilities based on Porter’s value chain model and its
various primary and supportive activities (Grant 2008).
44
6.3 Resource and Capability Assessment The purpose of a firm is according to Schilling (2010) to create value. Prahalad (1993) gives insight in
to that value creation is a process that is guided by the strategic intent of the firm. The strategic
intent is the top managers’ expression of their aspirational level that will increase the firm’s
competitiveness either within the existing or new markets. Schilling (2010) envisions that a firm has a
certain current resource and capability position and that a gap will be created once the strategic
intent has been expressed. The resources and capability gap appears because that the resources and
capabilities needed in order to reach the firm’s future desired position differs from the current
position (Schilling 2010).
A firm’s strategic intent is a forward-looking perspective that in order to be realized should be
captured in the formulation of the actual strategy (Grant 2008). Furthermore, Grant (2008) expresses
that a strategy must have a consistence between the firm’s internal position and its industry
environment in order to be successful. Grant (2008) complements Schilling’s (2010) description of a
firm’s current position by, in addition to the strategic intent, resources and capabilities, also
highlighting the importance of organizational structure and management system. These factors
influence the possibilities to implement the created strategies and have therefore an effect on the
possibilities to create value from the organization’s resources and capabilities (Grant 2008). A firm’s
surrounding industry environment is generally defined by the firm’s relationship to its customers,
competitors and suppliers (Grant 2008).
The possibilities to create value and earn excess profits in the external environment depend
according to Grant (1991) on two factors: the attractiveness of the industry and the establishment of
sustainable competitive advantages. It may be beneficial to analyze the industry attractiveness
broadly in an initial phase, however in order to understand the competitive environment the industry
could be segmented into different markets (Grant 2008). After having segmented the market and
detected the segments with the highest perceived attractiveness it is possible to identify the factors
that give a firm sustainable competitive advantage. These factors are denoted key success factors
and they are the factors that the customers’ particularly value among their purchasing criteria. It is
on these factors that a firm must outperform its competitors in order to achieve competitive
advantages (Grant 2008; Johnson et al 2008). This analysis should be conducted on a market
segment level since the customers’ preferences and thereby the competitors’ performance on the
purchasing criteria varies between market segments (Grant 2008).
How firms gain competitive advantages by for example performing better than the competitors on
the customers’ vital purchasing criteria has traditionally been explained by their strategic market
position and Porter’s (1980) generic strategies: overall cost leadership, differentiation and focus
strategy (Grant 1991). However, Grant (1991) stresses it is a firm’s resources and capabilities that
allows a firm to reach these market positions as well as it is the firm’s capabilities that is the ultimate
source of a firm’s competitive advantage.
The firm’s current competitive position and thereby their capability position will also according to
Grant (1991) affect the direction of the current strategy. The author stresses that the firm must
adapt their resources and capabilities in order to increase the competitiveness. This can be explained
by that resources and capabilities are heterogeneous in their profit-earning potential (Grant 2008).
The ability for resources and capabilities to earn profits are affected by three factors; their possibility
45
to create competitive advantage; to sustain that competitive advantage and to appropriate the
returns of the competitive advantage (Grant 2008). This perspective, highlighted in Grant (1991),
gives insight for how a firm could adapt their resources and capabilities in order to reach a more
desirable future position. Such a position is from the aspect of Schilling (2010) one where the firm is
able to create excess value.
6.4 Strategies for Competitive Advantage The initial step for firms to earn profits from the employed resources and capabilities is to establish
strategies that allow for the firms to gain competitive advantages and then sustain their advantages
for long enough to reap the rewards (Grant 2008). Porter (1985) presents three generic strategies for
achieving competitive advantages within a certain competitive environment: cost leadership,
differentiation and focus. The cost leadership strategy is basically about setting a strategic direction
to be the low-cost producer in the focal industry whereas employing a differentiation strategy
implies that a firm seeks to be unique in its industry along some dimension that are highly valued by
the customers (Porter 1985). Pursuing a focus strategy means to optimize the strategy for it to fit the
customers within a narrow market segment (Porter 1985).
Porter (1985) emphasize that establishing and sustaining competitive advantage is all about choosing
a generic strategic direction and applying it consistently. However, there are according to Porter
(1985) conditions under which cost leadership and differentiation can be applied simultaneously.
One such condition is when cost is strongly affected by market share or interrelationships between
industries. Here, the cost is widely affected by market share rather by activities such as product
design, technological level and service provided. Furthermore, unmatched interrelationships can
lower or at least offset the higher costs of differentiation (Porter 1985). Finally, to gain competitive
advantages that are sustainable, a firm must often undertake further investments in order to
continuously improve their strategic position (Porter 1985). Hence, it will be important for a firm to
understand the drivers of the employed strategy both in order to create and sustain their
competitive advantages.
6.4.1 Drivers of Differentiation
A firm can differentiate itself from its competitors by being unique at some factor that is valuable for
the customers (Porter 1985). Porter (1985) denotes the underlying factors to why activities are
unique as drivers of uniqueness. However, since these drivers are basis of the differentiation, these
will be named drivers of differentiation in this section. The drivers of differentiation discussed by
Porter (1985) and further discussed by Grant (2008) and Schilling (2010) are presented in table 16.

46
Drivers of differentiation Description
Product features and performance
- Simply the performance and quality of the products and service delivered
Complementary products and services
- Complementary products and service that enhance the usability and desirability of a good - Can be delivery, repair, claim related services etc.
Intensity of marketing activity - The marketing efforts undertaken, both in terms of investments but also the rigorousness in the performance of the activities
Technology embedded in design and manufacture
- The extent to which new technologies are utilized in the value activities
Quality of purchased inputs - Excellent quality performance can be a uniqueness feature Procedures influencing the rigorousness in the performance of activities
- How carefully activities are undertaken - Example: accuracy in quality control, service procedures, frequency of customer sales visits etc.
The skill and experience of employees
- The employees’ education and attitude are underlying factors - Affected by the culture within the organization
Location - Uniqueness that stem from the localization such as the access to skilled employees and other resources, but also the distribution chain length
The degree of vertical integration
- The extent to which the firm is interrelated with its suppliers and customers - Example of benefits: can reduce development times of new products, can lead to high responsiveness by having an integrated supply chain etc.
Table 16 – Summary of drivers of differentiation (Grant 2008; Porter 1985; Schilling 2010)
6.4.2 Drivers of Cost Advantage
A firm’s cost position derives from the cost behavior of the value activities (Porter 1985). There are a
number of principal determinants that affects a firm’s relative unit costs named cost drivers (Grant
2008). Porter (1985) also discusses cost drivers and a combination of the authors’ perspectives is
presented in table 17.
Economies of scale arise for the ability to perform activities more efficiently at large volumes or the
ability to amortize the fixed cost over greater sales volumes (Porter 1985). Grant (2008) emphasizes
several sources of economies of scale. First, technical input-output relationships do not need to be
proportionate, where increased output does not need to infer proportionate increases in input.
Second, some resources’ and activities’ natural indivisibility imply that some investments are lumpy
and firm can, by amortizing the investments over greater sales volumes, gain economies of scale
advantages. Third, increased sales volumes give greater division of a labor (Grant 2008). Porter
(1985) stresses that the scale sensitivity for different activities varies extensively and highlights
furthermore that manufacturing and product development generally are more scale sensitive than
sales operations. However, it is not only the technological setup that determine what gains for
economics of scale that are obtained but also how the activities actually are operated (Porter 1985).
The rationale behind economies of learning is that the cost of undertaking an activity is reduced over
time due to learning, which increases its efficiency (Porter 1985). Repetition of activities develops
both individual skills and organizational routines (Grant 2008). The improvement factors that
generate economies of learning are numerous. However some examples of such factor
improvements are layout changes, improved scheduling, labor efficiency improvements, product
47
design modifications that facilitate manufacturing, yield improvements, procedures that increase
utilization of assets as well as more efficient usage of raw materials (Porter 1985). Cost reductions
that originate from learning tend to appear gradually and the learning based improvements gained
alter with the degree of management attention devoted to the focal area of interest (Porter 1985).
Drivers of cost advantage Sources of the drivers
Economies of scale
- Technical input-output relationships - Indivisibilities - Specialization - Manufacturing setup
Economies of learning - Increased individual skills - Improved organizational routines
Production techniques - Process innovations - Reengineering of business processes
Production design - Standardization of design and components - Design for manufacture
Capacity utilization - Ratio of variable to fixed cost - Fast an flexible capacity adjustment
Input costs - Locational differences in input costs - Bargaining power
Localization - Operational costs such as labor costs, energy costs - Logistics cost
Residual efficiency - Motivation and organizational culture - Management effectiveness
Linkages - Coordination between value chain activities - Linkages with suppliers - Collaborations with customers
Timing
- Access to scarce resources - Marketing costs - Research and development costs - Supply and distribution chain readiness - Certainty of customers’ requirements
Table 17 – Summary of cost drivers (Grant 2008; Porter 1985; Schilling 2010)
Production techniques have also an influence on cost and new process technologies, like new
machinery, may radically reduce the costs (Grant 2008). However, the greatest productivity gains
from process innovations are generally obtained from organizational improvements rather than from
technological innovations. To completely rethink the logic of business processes has historically also
proven to be a technique that can result in major cost reductions (Grant 2008). Despite this, Grant
(2008) stresses that firms should evaluate such projects carefully since there is a risk of destroying
organizational capabilities that have been built up over a long time.
An additional driver of the unit cost is the product design (Grant 2008). By standardizing the design
of products and components, firms can realize economies of scale and learning in the production
(Porter 1985). More generally, by emphasizing the production perspective in the design of products
and increase the integration between the production and designing function great advantages such
as cost reductions can be gained (Grant 2008).
A value activity that has a considerable proportion of fixed costs will be affected by underutilization,
which raises its cost because the fixed cost must be spread over fewer units (Grant 2008; Porter

48
1985). The ratio of fixed to variable cost indicates a value activity’s utilization sensitivity (Porter
1985). The profitability of businesses with very high level of fixed costs is highly sensible to drops in
demand (Grant 2008). Hence, competitors’ ways of configuring their value activities will affect their
sensitivity to demand changes (Porter 1985). Notably, firms should consider their capacity utilization
over an entire business cycle since the utilization level can vary momentarily (Porter 1985).
Input cost is another cost driver and it is not likely that all competitors pay the same price for
identical inputs (Grant 2008). This can both derive from locational differences between input prices
as well as varying bargaining power positions (Grant 2008). Input costs are closely related to the
localization driver since the input costs to some extent are affected by the localization decisions
(Porter 1985). However, the localization does also affect other cost such as wages, energy, logistics
and taxes (Porter 1985). Additionally, Porter (1985) stresses that changing location often involves
trade-offs: it lowers some costs but raises others.
Residual efficiency means that firms should reach their full potential and reduce any “organizational
slack”, such as surplus costs that restrict the firm from reaching its full efficiency potential (Grant
2008). These costs, which relate to the employees motivation and cultural behaviors, are often very
difficult to eliminate (Grant 2008). However, they can be reduced by a management style that has a
strict focus of lowering the residual efficiency (Grant 2008).
Furthermore, the interconnections between a firm’s value chain activities as well as the linkages with
the suppliers’ and customers’ activities affect firms’ unit costs (Porter 1985). In excess to the
connection between the research and development activities and the operational activities, the
coordination of the material flow in the purchasing, inbound logistics and operational activities have
an influence on the unit cost (Porter 1985). However, a firm’s linkages with the suppliers’ activities
such as timeliness of supplier deliveries and the focal firm’s raw material inventory have also an
impact on the unit costs (Porter 1985). Also, the collaboration with the firms’ customers such as the
linkage between the firm’s research and development activities, application engineering and the
customers’ research and development department has an effect on the unit cost (Porter 1985).
The cost of an activity is often affected by timing and firms can receive advantages by being the first
mover (Porter 1985). An organization’s position as a technology leader can shape the customers’
expectations about the firm’s solution and thereby lower the marketing costs over time (Schilling
2010). Early movers can also ensure access to scarce resources such as government permits, access
to distribution channels and relationship with strategic suppliers that can be costly to develop for a
follower (Schilling 2010). Despite this, being an early mover can imply disadvantages whereas
followers can gain access to technology and thereby avoid high development cost. Other cost drivers
that challenges early movers are undeveloped supply and distribution chains as well as uncertainty in
the customers’ demands (Shilling 2010).

49
6.5 Capability Assessment Framework In the upcoming section the capability framework utilized in this report will be presented. This
framework is built upon the different perspectives of capabilities and resources that have been
presented in the previous sections. These perspectives have been integrated in order for the
framework to be adjusted to the particular purpose of this report.
The capability model is a continuation of the market framework presented in the theoretical section
of the market attractiveness part of this report, see figure 15. The capability model is market specific
and before the model is being applied for a firm, the attractiveness of the company’s market
segments should be assessed. This approach is in accordance with the perspective presented by
Grant (1991).
The capability analysis has its origin in the customers’ key purchasing criteria since these criteria form
the basis for the customers’ evaluations of the offers on the market. These criteria are basically what
Grant (2008) and Johnson et al (2008) denote as key success factors. The key purchasing criteria can
vary between markets and this is one of the reasons to why it is important to first identify the most
attractive markets. Furthermore, the key purchasing criteria can also differ between the various
customers within a market. This variation can be managed differently depending on the particular
organization’s managers’ strategic intent. If the strategic intent is to gain a broad market position
various customers’ key purchasing criteria can be weighted based on the customers’ market share or
any other appropriate factor that captures the different customers’ importance. This approach will
create requirements, weighted key purchasing criteria, which are important criteria to be successful
on the market in general. The alternative approach, suitable for managers with the strategic intent to
serve a certain customer, is to utilize that customer’s key purchasing criteria as the key success
factors.
Figure 25 – The capability framework
Competitor’s value proposition
Competitor’s value proposition
Customer’s key purchasing criteria
Focal firm’s value proposition
Capability gap
Key purcahsing criteria gap
Organization Key resoruces Key competencies
Key capabilities

50
The focal firm’s value proposition and its fit with the customers’ key purchasing criteria will have an
influence on its profit potential on the specific market. It is not only how the actual value proposition
fits with the customers’ key purchasing criteria that determine the focal firm’s key purchasing criteria
gap. In fact it is the relative performance of the competitors’ value proposition on the customers’ key
purchasing criteria that matters. This is in accordance with Grant (2008) and Johnson et al (2008)
who emphasize that the focal firm must also outperform its competitors in order to realize the full
profit potential within the market segment. To do so, the focal firm must perform better than the
competitors on the key purchasing criteria and thereby have smaller positive gaps.
In order for the focal firm to increase its competitiveness within a market segment, the firm must
improve their relative performance on the customers’ key purchasing criteria in comparison with its
competitors’. A firm’s performance on the key purchasing criteria are delivered by the firms value
proposition which according to Grant (1991) are built by the firm’s capabilities, that in turn depends
on the firm’s resources and competencies.
Therefore, if the focal firm has an intention to reach a more competitive position, the firm should
adapt their capabilities, and thus their resources and/or competencies, in order to adjust their value
proposition. An adaption of the capabilities means to change these from a current state to a future
more desirable state. Hence, a certain capability gap arises and in order close this gap by adjusting
the firm’s capabilities a more competitive position can be reached. However, an organization has
various capabilities and all are not critical components of their value proposition. Therefore, the key
capabilities that are the critical components in order for the firm to reach its new value proposition
must be identified. As discussed, this identification can be conducted in several ways but in this
report the capabilities will be mapped based on the value chain.

51
7 Capability Assessment: Empirical Findings In this chapter the empirical findings that the capability analysis is built on are presented. First, the
customer and competitive situation in the Chinese, Indian and Western European market are
explained respectively. In the end of the chapter Acme is presented from a value activity perspective.
7.1 China: Customers The most prominent OEM from the perspective of installed base is OEM6, while OEM7-1 is the leader
in terms of order intake. OEM7-1 is gaining market share rapidly due to their competitive prices, see
figure 16 (Respondent13 2012a).
Figure 16 –Order in-take market share at the Chinese OEM product1 market 2011 (Respondent13 2012)
In China the OEMs’ key purchasing criteria are price, reliability and relationship (Respondent13
2012a). The price criterion is the unit price of the product1 (Respondent13 2012a). Reliability is
emphasized due to that quality problems are huge issues in China; hence customers want to utilize
the most reliable and safest solutions (Respondent13 2012a). The reason for this can partly be
explained by the existence of safety regulations from the Chinese authorities (Respondent13 2102-
02-24) and it is important that quality standards are followed (Respondent9 2012c). However, these
quality standards are for now not that well developed for the product1 segment (Respondent9
2012c). The large emphasis on the reliability criterion also is explained by the strong influence of
Western European technology in China which the OEMs want to imitate (Respondent8 2012a).
The relationship criterion is about having personal relationships with the OEMs’ employees
(Respondent13 2012a) but it is also about the customers’ experience of a product1 manufacturer as
a supplier (Respondent4 2012a). Localization of production is per se not a requirement by the OEMs,
however it is important in order for the product1 suppliers to achieve competitive prices on the
product1s (Respondent13 2012a). Nevertheless, the trend is that the Chinese Ministry for the focal
industry to a greater extent demands local production to strengthen the Chinese economy and
competence (Respondent3 2012). This affects both foreign OEMs, such as OEM1, OEM2 and OEM3,
and foreign product1 suppliers, such as Acme and Competitor1. For foreign OEMs and product1
suppliers this often means that the Chinese Ministry for the focal industry emphasizes collaboration
20%
60%
10%
5% 5%
Chinese OEM product1 market:
OME6
OEM7-1
OEM7-2
OEM7-3
Other
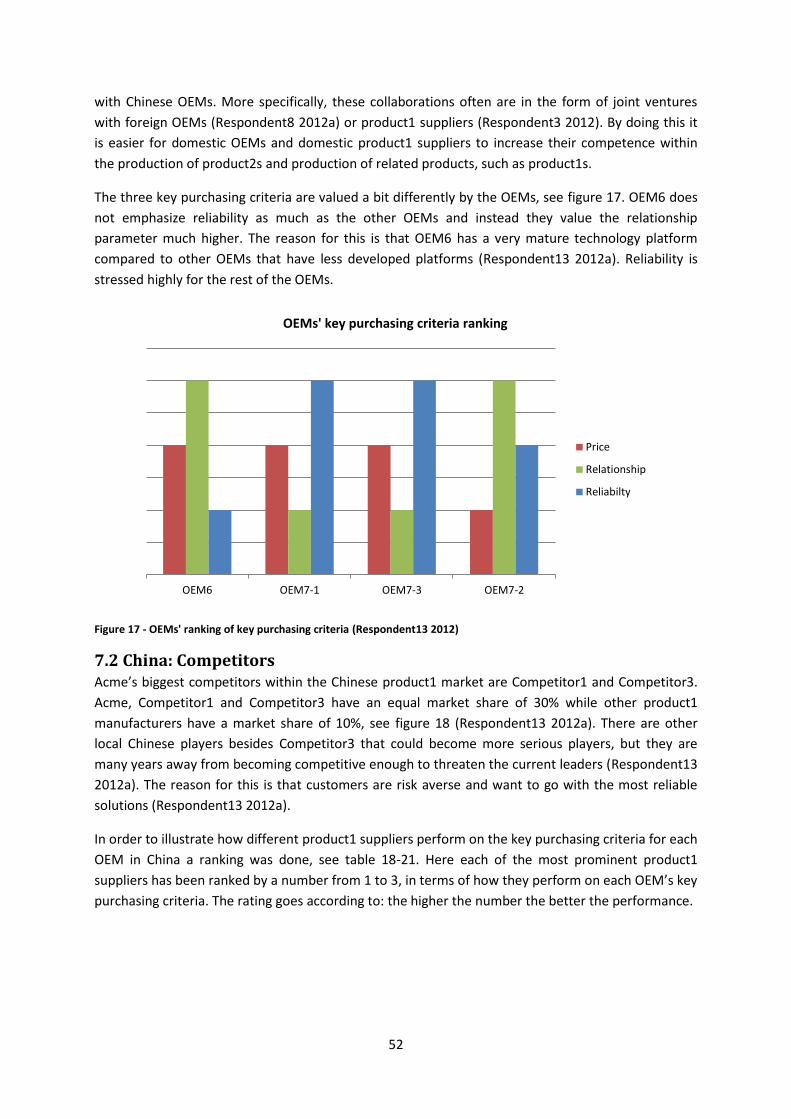
52
with Chinese OEMs. More specifically, these collaborations often are in the form of joint ventures
with foreign OEMs (Respondent8 2012a) or product1 suppliers (Respondent3 2012). By doing this it
is easier for domestic OEMs and domestic product1 suppliers to increase their competence within
the production of product2s and production of related products, such as product1s.
The three key purchasing criteria are valued a bit differently by the OEMs, see figure 17. OEM6 does
not emphasize reliability as much as the other OEMs and instead they value the relationship
parameter much higher. The reason for this is that OEM6 has a very mature technology platform
compared to other OEMs that have less developed platforms (Respondent13 2012a). Reliability is
stressed highly for the rest of the OEMs.
Figure 17 - OEMs' ranking of key purchasing criteria (Respondent13 2012)
7.2 China: Competitors Acme’s biggest competitors within the Chinese product1 market are Competitor1 and Competitor3.
Acme, Competitor1 and Competitor3 have an equal market share of 30% while other product1
manufacturers have a market share of 10%, see figure 18 (Respondent13 2012a). There are other
local Chinese players besides Competitor3 that could become more serious players, but they are
many years away from becoming competitive enough to threaten the current leaders (Respondent13
2012a). The reason for this is that customers are risk averse and want to go with the most reliable
solutions (Respondent13 2012a).
In order to illustrate how different product1 suppliers perform on the key purchasing criteria for each
OEM in China a ranking was done, see table 18-21. Here each of the most prominent product1
suppliers has been ranked by a number from 1 to 3, in terms of how they perform on each OEM’s key
purchasing criteria. The rating goes according to: the higher the number the better the performance.
OEM6 OEM7-1 OEM7-3 OEM7-2
OEMs' key purchasing criteria ranking
Price
Relationship
Reliabilty
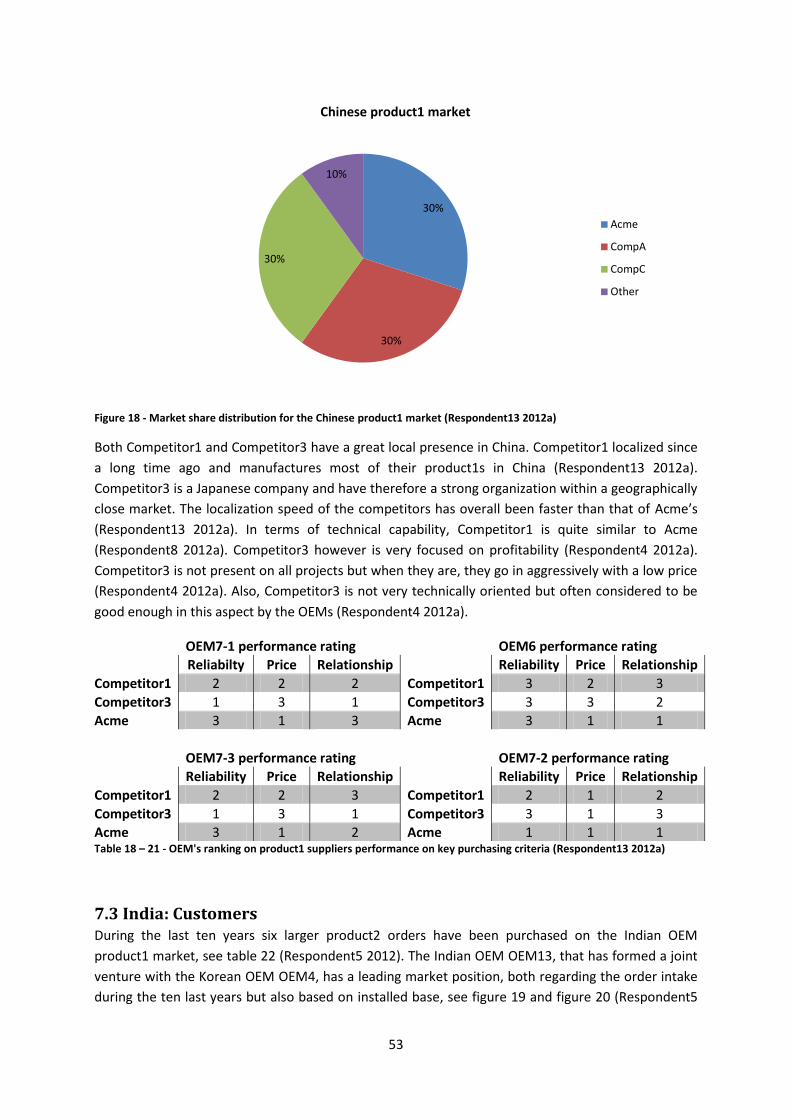
53
Figure 18 - Market share distribution for the Chinese product1 market (Respondent13 2012a)
Both Competitor1 and Competitor3 have a great local presence in China. Competitor1 localized since
a long time ago and manufactures most of their product1s in China (Respondent13 2012a).
Competitor3 is a Japanese company and have therefore a strong organization within a geographically
close market. The localization speed of the competitors has overall been faster than that of Acme’s
(Respondent13 2012a). In terms of technical capability, Competitor1 is quite similar to Acme
(Respondent8 2012a). Competitor3 however is very focused on profitability (Respondent4 2012a).
Competitor3 is not present on all projects but when they are, they go in aggressively with a low price
(Respondent4 2012a). Also, Competitor3 is not very technically oriented but often considered to be
good enough in this aspect by the OEMs (Respondent4 2012a).
OEM7-1 performance rating
OEM6 performance rating
Reliabilty Price Relationship Reliability Price Relationship
Competitor1 2 2 2 Competitor1 3 2 3
Competitor3 1 3 1 Competitor3 3 3 2
Acme 3 1 3 Acme 3 1 1
OEM7-3 performance rating
OEM7-2 performance rating
Reliability Price Relationship Reliability Price Relationship
Competitor1 2 2 3 Competitor1 2 1 2
Competitor3 1 3 1 Competitor3 3 1 3
Acme 3 1 2 Acme 1 1 1 Table 18 – 21 - OEM's ranking on product1 suppliers performance on key purchasing criteria (Respondent13 2012a)
7.3 India: Customers During the last ten years six larger product2 orders have been purchased on the Indian OEM
product1 market, see table 22 (Respondent5 2012). The Indian OEM OEM13, that has formed a joint
venture with the Korean OEM OEM4, has a leading market position, both regarding the order intake
during the ten last years but also based on installed base, see figure 19 and figure 20 (Respondent5
30%
30%
30%
10%
Chinese product1 market
Acme
CompA
CompC
Other
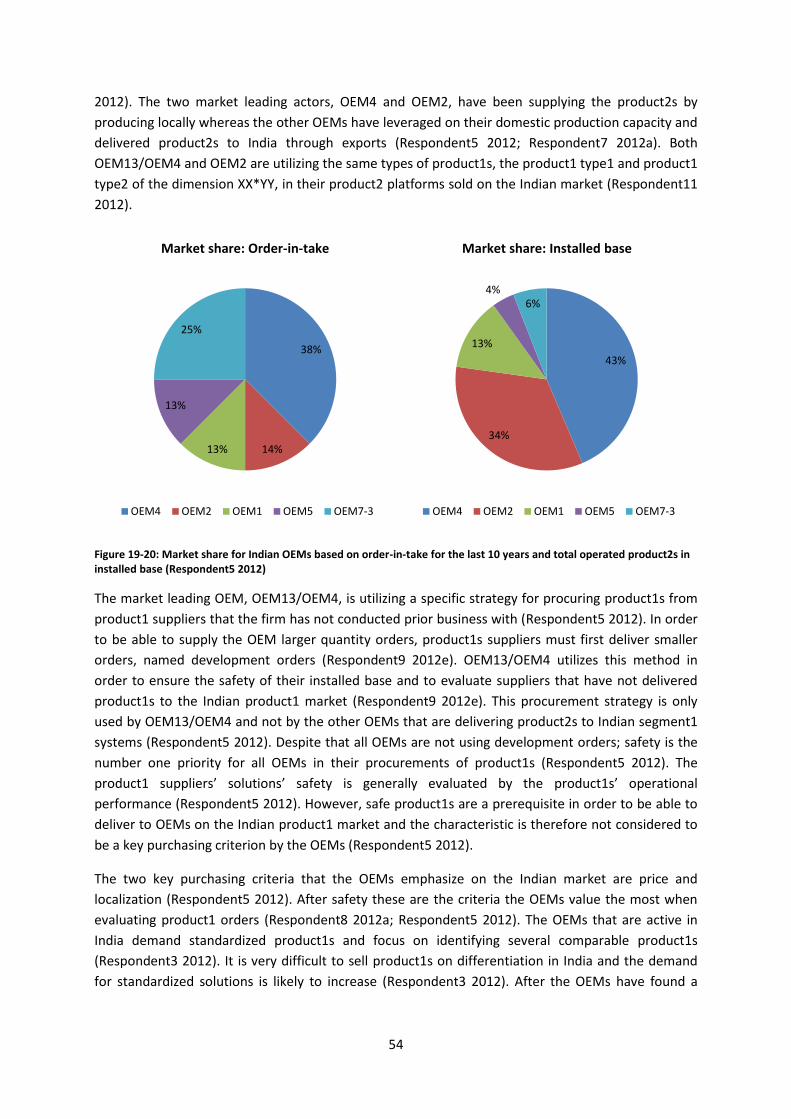
54
2012). The two market leading actors, OEM4 and OEM2, have been supplying the product2s by
producing locally whereas the other OEMs have leveraged on their domestic production capacity and
delivered product2s to India through exports (Respondent5 2012; Respondent7 2012a). Both
OEM13/OEM4 and OEM2 are utilizing the same types of product1s, the product1 type1 and product1
type2 of the dimension XX*YY, in their product2 platforms sold on the Indian market (Respondent11
2012).
Figure 19-20: Market share for Indian OEMs based on order-in-take for the last 10 years and total operated product2s in installed base (Respondent5 2012)
The market leading OEM, OEM13/OEM4, is utilizing a specific strategy for procuring product1s from
product1 suppliers that the firm has not conducted prior business with (Respondent5 2012). In order
to be able to supply the OEM larger quantity orders, product1s suppliers must first deliver smaller
orders, named development orders (Respondent9 2012e). OEM13/OEM4 utilizes this method in
order to ensure the safety of their installed base and to evaluate suppliers that have not delivered
product1s to the Indian product1 market (Respondent9 2012e). This procurement strategy is only
used by OEM13/OEM4 and not by the other OEMs that are delivering product2s to Indian segment1
systems (Respondent5 2012). Despite that all OEMs are not using development orders; safety is the
number one priority for all OEMs in their procurements of product1s (Respondent5 2012). The
product1 suppliers’ solutions’ safety is generally evaluated by the product1s’ operational
performance (Respondent5 2012). However, safe product1s are a prerequisite in order to be able to
deliver to OEMs on the Indian product1 market and the characteristic is therefore not considered to
be a key purchasing criterion by the OEMs (Respondent5 2012).
The two key purchasing criteria that the OEMs emphasize on the Indian market are price and
localization (Respondent5 2012). After safety these are the criteria the OEMs value the most when
evaluating product1 orders (Respondent8 2012a; Respondent5 2012). The OEMs that are active in
India demand standardized product1s and focus on identifying several comparable product1s
(Respondent3 2012). It is very difficult to sell product1s on differentiation in India and the demand
for standardized solutions is likely to increase (Respondent3 2012). After the OEMs have found a
38%
14% 13%
13%
25%
Market share: Order-in-take
OEM4 OEM2 OEM1 OEM5 OEM7-3
43%
34%
13%
4% 6%
Market share: Installed base
OEM4 OEM2 OEM1 OEM5 OEM7-3
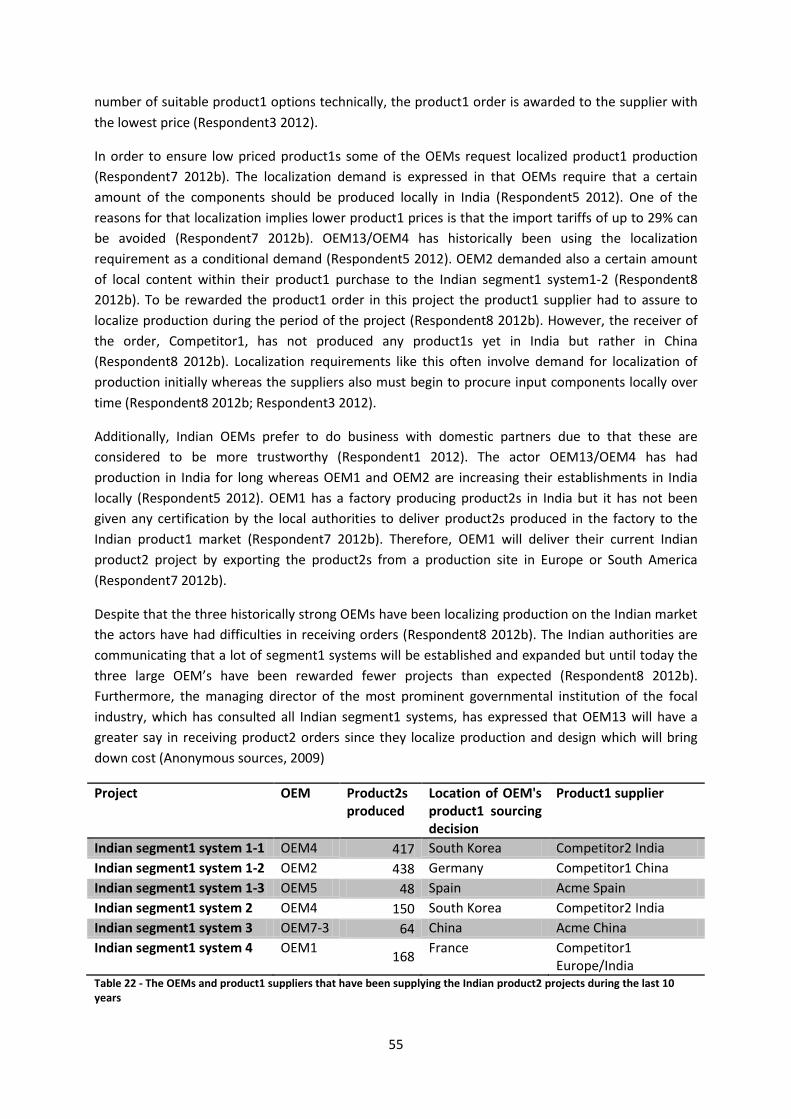
55
number of suitable product1 options technically, the product1 order is awarded to the supplier with
the lowest price (Respondent3 2012).
In order to ensure low priced product1s some of the OEMs request localized product1 production
(Respondent7 2012b). The localization demand is expressed in that OEMs require that a certain
amount of the components should be produced locally in India (Respondent5 2012). One of the
reasons for that localization implies lower product1 prices is that the import tariffs of up to 29% can
be avoided (Respondent7 2012b). OEM13/OEM4 has historically been using the localization
requirement as a conditional demand (Respondent5 2012). OEM2 demanded also a certain amount
of local content within their product1 purchase to the Indian segment1 system1-2 (Respondent8
2012b). To be rewarded the product1 order in this project the product1 supplier had to assure to
localize production during the period of the project (Respondent8 2012b). However, the receiver of
the order, Competitor1, has not produced any product1s yet in India but rather in China
(Respondent8 2012b). Localization requirements like this often involve demand for localization of
production initially whereas the suppliers also must begin to procure input components locally over
time (Respondent8 2012b; Respondent3 2012).
Additionally, Indian OEMs prefer to do business with domestic partners due to that these are
considered to be more trustworthy (Respondent1 2012). The actor OEM13/OEM4 has had
production in India for long whereas OEM1 and OEM2 are increasing their establishments in India
locally (Respondent5 2012). OEM1 has a factory producing product2s in India but it has not been
given any certification by the local authorities to deliver product2s produced in the factory to the
Indian product1 market (Respondent7 2012b). Therefore, OEM1 will deliver their current Indian
product2 project by exporting the product2s from a production site in Europe or South America
(Respondent7 2012b).
Despite that the three historically strong OEMs have been localizing production on the Indian market
the actors have had difficulties in receiving orders (Respondent8 2012b). The Indian authorities are
communicating that a lot of segment1 systems will be established and expanded but until today the
three large OEM’s have been rewarded fewer projects than expected (Respondent8 2012b).
Furthermore, the managing director of the most prominent governmental institution of the focal
industry, which has consulted all Indian segment1 systems, has expressed that OEM13 will have a
greater say in receiving product2 orders since they localize production and design which will bring
down cost (Anonymous sources, 2009)
Project OEM Product2s produced
Location of OEM's product1 sourcing decision
Product1 supplier
Indian segment1 system 1-1 OEM4 417 South Korea Competitor2 India
Indian segment1 system 1-2 OEM2 438 Germany Competitor1 China
Indian segment1 system 1-3 OEM5 48 Spain Acme Spain
Indian segment1 system 2 OEM4 150 South Korea Competitor2 India
Indian segment1 system 3 OEM7-3 64 China Acme China
Indian segment1 system 4 OEM1 168
France Competitor1 Europe/India
Table 22 - The OEMs and product1 suppliers that have been supplying the Indian product2 projects during the last 10 years

56
Application segments China India Japan South Korea
Segment2 - 1 000 5 000 -
Segment3 1 000 10 000 39 000 2 000
Segment8 289 000 179 000 3 000 3 000
Segment4 15 000 - 10 000 1 000
Segment5 25 000 9 000 1 000 1 000
Segment6 16 000 6 000 1 000 -
Segment7 2 000 4 000 1 000 -
Segment1 17 000 2 000 7 000 7 000
Segment9 47 000 51 000 - 1 000
Total 411 000 263 000 68 000 16 000
Table 23 - The product1 amounts per application segment for the four largest domestic focal industry markets in Asia. Yellow and green cells are markets consisting of product1s over 7 500 respective 15 000 product1s per year (Respondent9 2012j)
7.4 India: Competitors Competitor1 is the order intake market leading product1 supplier in the Indian product1 market, see
figure 21 (Respondent5 2012). Competitor1 has reached this position since it has been rewarded
substantial orders by OEM1 and OEM2, see table 22 (Respondent5 2012). Competitor1 has not had
local manufacturing in India previously but is currently establishing a manufacturing unit that will be
able to produce product1 type1s (Respondent5 2012). In contrast, the actor with the second largest
market share Competitor2 has had local production in India for over 10 years, see figure 21
(Respondent5 2012). Competitor2 has supplied all of OEM13/OEM4s larger product2 projects with
product1s during the last 10 years, see table 22 (Respondent5 2012).
OEMs that have found a product1 solution that they are satisfied with would often like to use the
supplier repeatedly (Respondent3 2012). When partnerships between OEMs and product1 suppliers
have been established on the Indian market with several successful deliveries of product1s, it is
challenging for a new actor to displace the current supplier (Respondent5 2012). The rationality for
locating production in India is that local product1 production is less expensive than exporting
product1s (Respondent10 2012b). The reason for this is that the product1 manufacturer avoids
import tariffs, transportation costs and inventory costs during this transport (Respondent10 2012b).
Figure 21 - Market share for product1 suppliers on the India OEM product1 market based on order-in-take for the last 10 years (Respondent5 2012)
9%
47%
44%
Market share: Order-in-take
Acme
CompA
Comp B

57
Acme has supplied product1s to Indian product2 projects conducted by OEM5 and OEM7-1, OEM7-2
and OEM7-3 (Respondent5 2012). These product1 projects have not been sold by the FBU’s Indian
sales organization but the local organizations in Spain and China respectively, where the product2s
have been produced (Respondent5 2012). In contrast, Acme quoted for product1s delivered in the
OEM2’ Indian segment1 system1-2 but the proposed produced product1s from the City2 factory was
substantially more expensive than the quote from Competitor1 (Respondent8 2012a). Competitor1
which was awarded the order quoted based on production of their product1s in China (Respondent8
2012a). Despite that OEM2 has a local supply manager in India the product1 supplier was selected
from the OEM’s organization in Germany (Respondent8 2012b). This was also the case for OEM1’s
Indian segment1 system 4 order (Respondent7 2012b).
7.6 Western Europe: Customers The market leading OEMs of product2s presented in figure 22 has all production units locally in
Western Europe (Respondent7 2012a). The strength of the OEMs’ market positions within the
regional markets in Western Europe differs and is related to the firms’ origin whereas OEM5 for
example has a strong position in Spain (Respondent7 2012a). OEM1 with an origin in France has a
strong position within this local market whereas OEM3 is prominent within Germany (Respondent7
2012a). OEM2 has production of product2s in both countries but the main production is in Germany
(Respondent8 2012b). The leading domestic product1 markets within Western Europe are the ones
in Germany, France, Spain and United Kingdom (Respondent7 2012a). However, the Western
European market serves also as an exporting market whereas the OEMs manufacture product2s
within their factories delivered to other geographical markets (Respondent3 2012). OEM5 is for
example exporting to the American markets from their Spanish sites (Respondent2 2012b). The
export orders from Europe are declining as other markets are becoming increasingly localized but
despite this the characteristic makes the product1 market strategically important (Respondent3
2012).
Figure 22 - - Market share for product1 OEMs at the Western European product1 market based on delivered product2s 2006-2010 (Respondent9 2012)
The segment1 systems within Western Europe are not especially technically standardized which
historically have been beneficial for Acme since the firm have been able to utilize its technological
16%
14%
21%
30%
14%
5%
Market share: Delivered product2s 2006-2010
OEM1
OEM8
OEM2
OEM5
OEM3
Others

58
knowledge (Respondent8 2012a). The OEMs and segment1 operators within Western Europe has a
high emphasize on safety and value quality product1 but are becoming focused on cost, especially
total cost of ownership (Respondent8 2012a). The Western European OEMs with OEM2 as the leader
has recently improved their purchasing method for input components where these actors have
begun utilizing an evaluation matrix where the suppliers performance are ranked based on various
factors (Respondent8 2012a). By weighting the factors after importance the OEM can identify the
supplier which performance has the overall most satisfying performance (Respondent8 2012a). The
evaluation factors the OEMs prioritize the highest are presented in in table 24.
Most prioritized evaluation factors Description
Design The degree to which the functional demands are met The product1 solutions’ innovativeness
Quality performance The product1s' performance in the field Evaluated on similar product1s’ performance in operations Delivery performance of orders
Reliability and safety Overall evaluation of the product1 design Duration of critical elements Life-time calculations
References and experience Amount of and quality of references for similar product1 types
Risk The results of risk evaluations such as FMEA Delivery possibilities of order
Price Product1 unit price
Table 24 - The evaluation criteria the Western European OEMs weight as the most important in their evaluation of product1 suppliers’ proposals (Respondent8 2012a; Respondent15 2012)
7.7 Western Europe: Competitors Several product1 suppliers are present at the OEM product1 market in Western Europe but the
market is mainly dominated by two actors: Competitor1 and Acme, see figure 23 (Respondent9
2012j).
Figure 23 - The product1 manufacturers respective market shares on the Western European OEM product1 market (Respondent4 2012)
30%
25% 10%
8%
5%
2%
20%
OEM product1 market share in Western Europe
Acme
CompA
Comp B
Comp D
Comp C
CompE
Acme

59
One of the most prominent OEM’s ranking of the Western European leading product1 suppliers’
performance on some competitive dimensions has been presented in table 25 (Respondent8 2012a).
However, the OEM’s perception of the product1 is believed to be shared by the market leading OEMs
and can therefore be considered as representative for the market (Respondent8 2012a).
Competitive dimensions Acme Competitor1 Competitor2 Competitor4
Product range 10 12 3 3
Delivery performance 10 6 8 12
Price 3 5 10 7
Innovation 13 12 9 11
Image 9 12 3 12
Manufacturing capability 12 4 4 10
Customer service 7 7 8 10
Quality 10 9 6 8
Table 25 - The OEMs’ perception of the leading product1 suppliers’ performance on competitive dimensions (Respondent8 2012a)
The two leading suppliers, Competitor1 and Acme, have a fairly similar performance in Western
Europe and both firms have strong engineering capabilities (Respondent8 2012a). Acme can be
considered to have slightly more technically advanced solutions than Competitor1 but the advantage
is not enough in order for the OEMs to identify a benefit from purchasing Acme’s product1s, which is
the case for example Acme’s product1s’ maintenance intervals (Respondent15 2012). Competitor2
has overall less technically advanced solutions in comparison to Acme whereas Competitor4’s
product1s’ advancements are high for product1s that are produced in Japan but lower for product1s
produced in Europe (Respondent9 2012g).
Quality, technically, is how much the product1 performance deviates from the predetermined
specifications (Respondent9 2012d). Top quality is demanded by the OEMs and this is therefore a
minimum requirement for the product1 suppliers in order to be competitive (Respondent9 2012d).
However, all product1 suppliers have some quality claims (Respondent9 2012h). Acme has generally
fewer quality related problems than Competitor1 (Respondent9 2012f). From a delivery performance
perspective, Acme is considered to lag behind its competitors since the firm has low responsiveness
in timely deliveries and response to customer inquiries (Respondent3 2012).
Acme has the highest price on the Western European OEM product1 market, which is negative since
the criterion is important for the OEMs (Respondent8 2012a). However, the price difference between
Competitor1’s and Acme’s offers differs between OEMs but overall the difference is not huge but
clearly notable (Respondent7 2012a; Respondent8 2012b). The price level is vital which can be
indicated by that the difference in product1 price is most likely the main reason for that Acme lost
the majority of their market share for OEM2’s product2 factory in Europe to Competitor1 a couple of
years ago (Respondent8 2012b). Competitor4 is trying to expand within the product1 segment but it
is not price competitive due to that the supplier lacks the proper sales volumes in Europe
(Respondent7 2012a). A market trend is that Western European customers is focusing more on life-
time cost than only on the product1 unit price (Respondent8 2012a). Furthermore, the price pressure
on the exporting orders is increasing due to that the product1 requirements are becoming more
standardized (Respondent2 2012b). The product1s utilized for product2s that are exported from
Western Europe have generally more standardized characteristics than the product1s that are used
60
in Western European applications (Respondent4 2012b). The standardization and price pressure is
challenging for Acme which has lost some export orders due to their price level (Respondent2
2012b).
An additional factor that is important for product1 suppliers in gaining orders from the OEMs, which
has an influence on several of the OEMs’ evaluation criteria, is the strength of the relationships with
the OEMs (Respondent8 2012a). The trend for Western European OEMs is that they involve the
product1 suppliers more frequently in the conception phase of the product2 design which means
that the technical requirement of the product1s are affected by the influenced product1 supplier
(Respondent8 2012a). Moreover, both Competitor1 and Acme have good relationships with OEM1,
OEM2, OEM5 and OEM3 within the Western European product1 market (Respondent8 2012a;
Respondent8 2012b). However, Acme’s relationship with OEM2 and OEM5 is challenged by that
Competitor1 is increasing their market share among these customers (Respondent8 2011-05-11;
Respondent4 2012a). Acme’s relationship with OEM1 is satisfying due to their substantial market
share for the OEM (Respondent8 2012b). Competitor4 as a French supplier has also a strong
relationship with OEM1 but has a weak position in Germany (Respondent7 2012a). Competitor1 has
overall a very strong market presence in Germany (Respondent15 2012). Competitor2 has a low
activeness in general at the Western European product1 market (Respondent8 2012b).
7.8 Acme Acme’s product1 related business will be analyzed from the value chain activities: research and
development, supply chain, manufacturing as well as marketing and sales. The value chain activity
supply chain is a combination of the activities that commonly are included in procurement as well as
inbound and outbound logistics. The FBU’s business has been characterized in this way since it
reflects the business’ setup.
7.8.1 Manufacturing and Supply Chain
The FBU has four factories that it controls and utilizes for its production of focal industry product1s
(Respondent10 2012a). The product1s the FBU manufactures are produced in the factories in City2,
Italy, and in City1, China (Respondent10 2012a). The procurement of input material is conducted at a
factory level (Respondent9 2012d). However, a few components such as steel are purchased in a
synchronized way on an Acme group level (Respondent9 2012d). The manufacturing in Acme’s
factories is organized into production channels where such a channel accomplishes a number of
value adding processes (Respondent10 2012a). The production channels within the FBU are very
machine intensive and the vast majority of the production costs are therefore fixed (Respondent10
2012b). The FBU has conducted a project where similar machines with high flexibility and low setup
time have been installed in all factories (Respondent10 2012a). This will allow the FBU to produce all
product1 types in each factory (Respondent10 2012a).
The FBU has a production strategy to manufacture the product1s in a standardized way with low
variety in the beginning of the production process and to be able to create a great variety of different
product1s in the final production channel by having the possibility to vary input components such as
component3, component4 and component6 (Respondent10 2012a). The mentioned input
components have a relative low cost in comparison to component1 and component2 and are
therefore not that relatively costly to have in inventory (Respondent10 2012a). The procurement
costs of component1 and component2 have the largest share in the cost break-down structure of

61
product1s and due to this the FBU wants to avoid inventory of these input costs (Respondent10
2012a). However, the component2 are strategic input components based on that the production is
based on much of Acme’s know-how and core technological competence whereas Acme wants to
have the component2 production in-house (Respondent9 2012d). The FBU is currently conducting a
project to evaluate, reselect and develop the component1 and component2 suppliers with the focus
to decrease price levels and lead times etc (Respondent6 2012b).
An option to reduce cost of product1s in the City2 factory could be to use component1 made from
ready-made steel pipes (Respondent10 2012b). This would imply that ready-made steel pipes and
the related value-adding activities are bought externally for the supply of component1, as the City2
factory does not have the necessary manufacturing setup to produce the component1
(Respondent10 2012b). However, when doing it in this way the component1 need to be soft-turned
and hardened and after these operations the material structure of the outer component1 is
unknown (Respondent9 2012h). An important aspect is also that this option implies that there will be
a certain point where the production of component1 from ready-made steel bars is as economically
feasible as the production of regular component1s. The reason for this is that soft turning of
component1 from this material could be less economically beneficial for the supplier than continue
to produce regular component1 if the machines are in use (Respondent9 2012h).
7.8.1.1 The City1 Factory
The FBU’s production facility in City1 is a joint venture together with the Chinese OEM OEM6, which
in turn is owned by the Chinese Ministry for the focal industry (Acme City1, China, 2006;
Respondent9 2012j). Acme holds a 51% stake in the joint venture and thus has management
responsibility of the venture (Acme City1, China, 2006). The production of product1s for the
segment8 segment was the main reason Acme chose to establish the City1 plant in China
(Respondent3 2012). Today the City1 facility produces product1s not only for segment8, but also for
segment4, segment5, segment9 and segment1 applications (Acme City1, China, 2006). Currently
most segment8 product1s are produced at the City1 site (Respondent10 2012c). Compared to the
competitors, Acme has however been a bit late at establishing local production and localizing
suppliers in China (Respondent6 2012a). Competitors have thus been faster at localizing here
(Respondent6 2012a). Local production is very important in order for Acme to improve the cost
levels and this could be done further to decrease costs (Respondent13 2012a). For now, Acme both
export certain product1s to the Chinese market and produce product1s locally that are sold in China
(Respondent10 2012b). As the Chinese Ministry for the focal industry is demanding more local
production, local production is becoming more and more important compared to exporting
(Respondent3 2012). However, increasing localization also has some risks because of that joint
venturing is emphasized by the government, who in turn gets access to knowledge and processes
that they easily can copy (Respondent3 2012). Acme are careful in choosing the product1 types
produced in City1 since the joint venture setup implies that Acme inevitably shares IPRs and know-
how with their Chinese partner (Respondent3 2012).
The City1 facility is a large factory with low product variability and produce bigger batches compared
to the factory in City2 (Respondent6 2012a). As of now, the City1 plant almost only produces
product1s for the Chinese market, but a goal is to increase the assortment and get certificates to
supply other Asian markets (Respondent6 2012a). The plant runs with a high efficiency
(Respondent10 2012a; Respondent6 2012a). However, capacity utilization varies a lot from year to
62
year depending on the orders they receive (Respondent3 2012). About 220 000 product1s are
produced here each year but it could be increased to around 250 000 product1s per year
(Respondent6 2012a).
Even though the City1 facility has good capacity and good quality (Respondent10 2012b), there are
problems with production scheduling and planning (Respondent6 2012a). The reason for this is that
people are not as well educated as in Europe and do not have the same experience in production
scheduling and planning (Respondent6 2012a). The problem can be derived from a different mindset
that is more traditional, where it is not about balancing the production, but rather about always
running the machines in high speed even when it is not needed (Respondent6 2012a; Respondent10
2012b). This problem can be exemplified with the current large storage capital in the City1 plant
(Respondent10 2012b).
Compared to the City2 factory, the City1 facility is more vertically integrated in their supply chain
(Respondent9 2012d). Regarding the production of component1 for the product1s, instead of
purchasing input component1 in various sizes, like the City2 factory, the City1 plant purchase steel
bars that they forge themselves (Respondent9 2012d). In the production process the steel bars are
first heated and cut off in steel chunks (Respondent9 2012h). Thereafter, the steel chunks are forged
into rough steel component1 (Respondent9 2012h). After this process the component1 are soft
turned, giving them the basic dimensions that will resemble the final product, and also hardened
(Respondent9 2012h). After the hardening is done you cannot soft turn the steel to change the
dimensions, instead you have to hard turn or grind the component1 (Respondent9 2012h).Because
the operations get more expensive the further you get you want to coordinate the production of
component1 for various application segments as much as possible before they are hardened
(Respondent9 2012h).
Acme coordinate the production between various segments (Respondent9 2012h), but as of today
the production of product1s for segment1 applications are not coordinated with the production of
product1s for other application segments at the City1 site (Respondent13 2012b). In the City1
facility, the component cost is approximately half of the total unit costs as the value added is more
than in City2 facility (Respondent10 2012b). For this reason the effect of volume changes in
production has a larger impact on cost than at the City2 site (Respondent10 2012b). Regarding input
components for the production, they are all sourced locally (Respondent10 2012b). Suppliers in
China are however less flexible than the European ones because they are less mature (Respondent6
2012a).
The City1 production facility mainly produces product1 type1 and product1 type2 of the dimensions
XX mm (inner component1) x YY mm (outer component1) x ZZ mm (outer component1 width) and
XX*YY*ZZ. The product1 type1 and product1 type2 XX*YY*ZZ is two types of product1 produced in
the City1 factory for segment1 applications in China, where the product1 type2 XX*YY*ZZ is the most
common product1 for segment1 applications that is produced (Respondent13 2012b). The product1
type1 XX*YY*ZZ was a common product1 dimension historically for Chinese segment8 applications,
but as the Chinese increased the load size of segment8 they changed to the product1 type2
XX*YY*ZZ (Respondent2 2012a). However, there is still an aftermarket in segment8 for the old
segment8 design (Respondent2 2012a). The product1 type2 XX*YY*ZZ is also a common product1
type for the application segments segment2, segment3 and segment9 (Respondent2 2012a). Acme

63
has previously conducted projects to investigate the possibilities to coordinate the production of
common product1 types (Respondent10 2012b). However, the production of product1s in the City1
plant is currently not coordinated with other application segments (Respondent13 2012b)
7.8.1.2 The City2 Factory
The factory in City2 has a production set up that allows for a flexible production, which is a result of
that input component1s are procured and the volume demanding forging process is therefore not
conducted in-house (Respondent10 2012a). The input component1s are purchased from local
suppliers externally and the component2s are procured from an internal component2 channel
located in Europe (Respondent10 2012a). The production costs of component2s in Acme’s Chinese
factories are substantially lower due to the component2s channels’ higher utilization (Respondent10
2012a).
Despite the flexible production, the utilization of the factory is very low (Respondent10 2012a;
Respondent10 2012b). One reason for this is that the factory currently has two production channels
since the FBU wants to exchange the old production channel setup (Respondent10 2012a).
Theoretically, one production channel would be sufficient to supply the demand (Respondent10
2012a). The reason to why the FBU has two channels in operation is that there is an organizational
resistance to begin utilizing the new channel (Respondent10 2012a). However, there are several
other factors that contribute to the low utilization of the production capacity such as suppliers’
delivery performance, the production planning and the internal material flow (Respondent10 2012a;
Respondent6 2012a).
Only a small number of suppliers have a satisfying delivery performance and problems as late
deliveries, unplanned part shipments and quality problems are frequently occurring (Respondent6
2012a). The FBU is currently undertaking a project to update the planning parameters that aims to
improve the accuracy of the production planning (Respondent6 2012b). Additionally, a
reorganization of the planning of the production is conducted since the planning team has had the
responsibility for the procurement and overall production planning but the planning of the final
product1 variety setting operations have been in control of the manufacturing teams (Respondent6
2012b). Hence, the FBU will initiate a project that will result in giving the planning team the full
responsibility (Respondent6 2012b). The production is designed to have a pull-based flow but due to
the current planning issues this system is not utilized (Respondent10 2012c).
7.8.1.3 Potential Localization in India
Acme group has several factories in India but these are not controlled nor adjusted to the FBU’s
operations (Respondent9 2012g). The majority of the Indian factories have another production setup
than the one utilized within the FBU’s factories (Respondent9 2012g). The Indian factories have a
more standardized and volume based manufacturing layout (Respondent9 2012g). However, Acme’s
Indian factory in City3 has a more flexible production system and there is furthermore a possibility to
expand the capacity within the factory (Respondent9 2012g). This factory is fully owned by Acme but
the fact that another business unit within Acme has the majority of the production within the plant
delimits the FBU’s possibilities to coordinate and control the production (Respondent9 2012f;
Respondent9 2012g). Currently, no product1s are produced in Acme’s Indian factories (Respondent9
2012i). The ownership of the factory is a factor that is important to consider from the aspect of
intellectual property rights (Respondent3 2012). When co-locating with another actor, such as in
64
China, one has always to be aware of the risks that other actors may exploit your intellectual
property rights and know-how (Respondent3 2012).
The FBU can establish production in another country by for example producing focal industry
product1s in another business unit’s factory, setting up a complete factory, establishing a single
production line and/or form a joint venture with a local competitor (Respondent8 2012b;
Respondent10 2012b). Establishing a complete factory is a huge investment but will also generate
substantial production capacity (Respondent10 2012b). The investment needed for setting up an
assembly line is radically lower but such an alternative only generates additional production capacity
of approximately 25 000 product1s per year (Respondent10 2012b). In this case, the FBU needs to
source the input components from existing suppliers which will lower the potential profit margin
(Respondent10 2012b).
The assembly line option is in contrast to establishing a complete plant a low risk option, due to the
lower investment need (Respondent10 2012b). In comparison to establishing a factory, it is less
difficult to localize an assembly channel from a technology transfer perspective (Respondent10
2012b). A potential joint venture investment is very dependent on the partner and their
manufacturing capability (Respondent8 2012b). In order to realize such an alternative in India the
FBU is likely to need to undertake substantial development of their potential partners in order to be
able to produce product1s of the required quality in a reliable way (Respondent8 2012b). Except the
investment costs, the factors determining the profitability of the investment are the price level on
the market and the volumes awarded on the market which affect the utilization of the production
investment (Respondent10 2012b).
7.8.2 Research and Development
An important point from a design perspective is that in order to reduce cost, the design of product1s
for other application segments is more important than the design of the product1s on their own
(Respondent10 2012b). The reason for this is that the product1 volumes are so small compared to
other application segments in the City1 facility (Respondent10 2012b). As coordination of production
for various application segments is important in order to reduce cost, it would be interesting to
investigate how the design of other applications could be utilized for the product1 segment
(Respondent10 2012b). For example, if the production of product1s could be joined with the
production of the old type of Chinese segment8 product1s (product1 type1/product1 type2
XX*YY*ZZ) costs could be reduced (Respondent10 2012b).
An ongoing project within Acme is to enlarge the product1 type1s and product1 type2s outer
component1 width from XXX1 mm to XXX2 mm at the City1 site in order to include other application
segments in China, but also to make it interchangeable with the standard product1 type1 and
product1 type2 produced at the City2 site, which is XXX1 mm in outer component1 width
(Respondent2 2012a). By doing this substantial cost reductions could probably be achieved
(Respondent2 2012a).
From a design and production perspective the FBU has no specific “product1s” rather product types
as the product1 type1 in some dimension with certain features that are commonly sold to product1
customers (Respondent10 2012a). The FBU has never conducted any efforts to adjust the most
frequently purchased product1s within the product1 segment to the specific demands of the
product1 customers (Respondent9 2012f). The vibration levels are relatively high for segment1
65
systems, which wear the cage in the product1s and affect the component5 negatively and thereby
reduce the product1s’ maintenance intervals (Respondent9 2012f). By changing the product1
component5 in order to increase its lifetime the maintenance interval can possibly be extended
(Respondent9 2012f). Acme could also conduct technical investigations like design-of-experiments,
which optimizes the technical performance base on the required demands (Respondent9 2012f).
Such technical investigations are not especially costly but take long time to accomplish (Respondent9
2012f).
7.8.3 Sales and Marketing
Acme has relatively decentralized sales and marketing organizations in comparison to its suppliers
(Respondent3 2012). The local sales and marketing organizations within the focal markets will be
discussed in the following sections.
7.8.3.1 China
Acme has established a local sales unit in China (Respondent12 2012). The sales offices are spread
out geographically and Acme are represented in areas where a lot of product2s are produced
(Respondent3 2012). In 2008 Acme had 2-3 people working within the sales department in China but
since then they have increased the capacity to 20-25 employees (Respondent3 2012). However,
there is still a surge for more resources in this area and Acme need to increase their capacity with the
growing Chinese market (Respondent3 2012).
Concerning Acme’s relationships with OEMs in the Chinese market, this is a key area in order to
increase the business activity (Respondent13 2012a). Some competitors do have better relationships
than Acme (Respondent13 2012a). Here it is important to improve the sales and application
engineering capability in order to speed up the response time to customers (Respondent13 2012a).
Acme has a relatively weak relationship with OEM6 due to the fact that OEM6 is strongly interlinked
with Competitor3 (Respondent9 2012g). Acme’s relationship with OEM7-2 is also rather weak. This is
because they recently shifted to the use of an OEM9 installed base design, which calls for
Competitor3 or Competitor4 product1s (Respondent8 2012a). Furthermore, Acme’s relationship with
OEM7-3 is also quite weak and the reason for this is that Acme has had quality issues where they lost
some credibility (Respondent8 2012a). OEM7-3 is now more strongly interlinked with Competitor1
instead (Respondent8 2012a). It is however possible to regain credibility in a relationship if the
product1 supplier responds fast to customer claims or requests and correct the problems
(Respondent3 2012). Acme is today a leading product1 supplier with OEM7-1 based on good
performance (Respondent13 2012a).
7.8.3.2 India
The FBU has a local sales organization in India and the capacity of this has been expanded during the
last couple of years by recruiting staff in India locally and educating these (Respondent9 2012g).
Despite this, Acme’s product1s have low credibility at the Indian market (Respondent5 2012). In
order to increase this, the local sales organization should increase their promotion of Acme’s
capabilities by visiting the customers’ factories (Respondent5 2012).
7.8.3.3 Western Europe
The factor that determine to what extent Acme will be able to influence the OEMs’ product2 design
during the conception phase is the frequency of their customer visits and how active the Acme
employees are during these meetings (Respondent15 2012). Acme has both sales personnel and

66
application engineers that visits the OEMs where the application engineers are especially important
in the conception phase as the discussions are mainly technical (Respondent15 2012). Acme are
lacking application engineering capacity especially in central Europe, where Competitor1 has a lot
more application engineers (Respondent15 2012). For example, in Germany Acme’s application
engineers are in front of the customers a couple of times per year whereas Competitor1’s application
engineers are in-front of the customer every second week (Respondent15 2012). In fact, Competitor1
has overtaken some of Acme’s customers within the product1 segment (Respondent8 2012b).
Competitor1 began for example to deliver product1s to OEM2s product2 production in Germany a
couple of years ago which was mainly due to that their price levels was 10-20% lower than Acme’s. In
addition, to increase the amount of application engineers the cooperation with the OEMs could
possibly be improved by locating an application engineer at each customer, such as in the
automotive industry (Respondent3 2012). This will hopefully imply more product1 orders but also
improve Acme’s responsiveness in filing documentation required by the customers (Respondent15
2012).
The FBU has previously had low interaction with the segment1 operators due to that the aftermarket
was another Acme division’s responsibility (Respondent8 2012a). However, the new organizational
structure implemented in the beginning of 2012 will enable the FBU to communicate with
aftermarket customers such as segment1 operators (Respondent8 2012a). This will create
possibilities to strengthen the FBU’s aftermarket position (Respondent8 2012a).
67
8 Capability Assessment: Analysis In this chapter an assessment of Acme’s capabilities on three strategic markets: China, India and
Western Europe will be presented. For each of the markets an assessment of Acme’s relative
performance on the OEMs’ key purchasing criteria is conducted. Thereafter, Acme’s performance on
the key purchasing criteria on the markets will be related to internal functions that influences the
firm’s performance.
8.1 China: Key Purchasing Criteria Assessment The Chinese OEMs’ most important key purchasing criteria have been identified as price, relationship
and reliability. The price criterion could be defined either as the initial deal unit price for the OEM or
the price by also considering the life cycle cost of the product1. However, since the Chinese OEMs
mainly emphasize product1 unit price, the price criterion is taken to mainly consider this aspect. The
relationship criterion is the strength of the relationship between an OEM and a product1 supplier
and is reflected in the product1 supplier´s personal relationships with a certain OEM. The reliability
criterion is about having a trustworthy solution for the OEM. Here, safety is particularly emphasized
as quality problems are considered big issues in China and therefore the OEMs want to utilize the
most reliable solutions.
The three aforementioned purchasing criteria are considered key because they are regarded as the
most likely criteria the Chinese OEMs use when evaluating a product1 supplier based on the data.
They are also considered as key because it would be very hard for a product1 supplier to gain orders
by completely lacking in one aspect while overperforming in another one. For example, while a
solution might be considered to have high reliability by a Chinese OEM, it also has to have a
satisfactory price level in order for the OEM to consider it interesting. The relationship criterion will
also influence the decision as a supplier and an OEM might have established integrated processes
and systems and that the supplier might have a good previous track record with the OEM. Thus, an
OEM makes an overall assessment of the company and its solution before the deal. It should also be
mentioned that these purchasing criteria cannot be regarded as completely mutually exclusive due
to their quite unspecific nature, which means that they could affect each other. For this reason it is
sometimes hard to treat these variables as completely separate entities. However, the analysis will
focus on them individually for illustrative and explanatory purposes but do collective assessments
when needed.
In order to illustrate how the most prominent OEMs perceive Acme and its main competitors, in
terms of how they perform on the different key purchasing criteria in the Chinese product1 market,
the data in table 18-21 was used to calculate weighted averages of the product1 suppliers’
performance on the different key purchasing criteria, see figure 24. A bar that is below the base line
represents underperformance on a certain criteria compared to the competition while a bar above
the base line accordingly represents overperformance on a certain criteria compared to the
competition. In order to gain a complete understanding of the OEM’s performance the perspectives
given in figure 24 should be complemented by a qualitative analysis.

68
Figure 24- Product1 suppliers’ relative performance at OEM's key purchasing criteria
As seen in figure 24 regarding the key purchasing criteria, Acme performs worst relative to the
competition on the price criterion in the Chinese market. The competitors have a price level that is
more in line with the OEMs requirements. Partly, this can be explained by the fact that both
Competitor3 and Competitor1 have a local presence that is greater than that of Acme’s. This can be
explained by the competitors’ higher localization speed. More specifically, the competition has been
faster than Acme at establishing both local production and local suppliers in China.
As Competitor1 produce most of their product1s that are sold to the Chinese market in China, it is
likely they have certain production related learning advantages in China, which would give them a
lower cost position. Because they possibly also have been able to develop their local suppliers to a
greater extent, this might give them additional cost advantages. As Competitor3 is price leader and
use an aggressive low-cost pricing strategy for the projects for which they are present, this gives
them a strong advantage on the price criterion. Even though Acme is quite localized in China as of
now, they have lagged behind the competition.
Localization cannot purely be viewed as physically placing productive resources in another country or
region but should perhaps rather be viewed as being able to place and also put the productive
resources into use so they can work independently. Therefore, an aspect such as learning effects by
training or learning by doing of local resources/employees is important to increase localization, and
thus cost. This is perhaps the biggest reason why Acme has lagged behind the competition in China.
This also has been stressed in interviews in the form of education and training of personnel in order
to provide them with a mindset that is more in line with Acme’s supply chain. The root of this
challenge seems to be culturally related, whereas in China manufacturing is all about producing all
the time without considering supply chain issues. Having a rather inflexible plant like the City1 plant
where mostly segment8 product1s are produced, is however much easier from a cultural point of
view than a flexible plant that requires more competence from the personnel. Yet, this may imply
that expanding within a smaller segment like product1 in the City1 facility means that supply chain
related issues become even more important in order to have an efficient production. All in all, this
creates a negative gap performance wise on the price criterion for Acme compared to competitors.
Price Relationship Reliability
Acme
CompA
CompC
69
The reliability criterion is however a criterion that Acme performs quite well on in China. All of the
OEMs except OEM7-2 rate Acme the highest on this criterion. OEM7-2 is a bit indifferent regarding
reliability, which is explained by their technical platform shift to the OEM9 design. As the reliability
criterion is in general highly valued in China, due to both safety regulations and influences of
Western European technology, this makes it an important criterion to perform well on. As
technological competence is an important aspect here, it will be important for Acme to maintain the
perception of being technologically advanced, as it is something that work as a differentiator that the
Chinese OEMs value. In the long run however, this could prove to be problematic depending on how
Acme pursue strategically. As expanding in China also means increased collaboration with the
Chinese government through joint venturing etc., the threat from local competition will become
fiercer through learning from how Acme work as well as by deteriorating Acme’s IPR portfolio. Thus,
there is a trade-off between the degree of localization and OEMs’ perception of technological
competence.
Expanding the product1 production in the City1 facility is therefore a good choice since Acme already
produces product1s here and could possibly coordinate this production with the manufacturing of
product1s for e.g. segment9 and product1s used for Chinese segment8 applications on the
aftermarket. The main problem for Acme is that their performance on the reliability criterion does
not motivate the much higher price of Acme’s product1s compared to the competitors’. Even though
the reliability is perceived as slightly better than Competitor1’s, Competitor1 is “good enough” and
performs much better on the price criterion which then makes it more attractive for OEMs to go with
Competitor1’s product1s.
Coordination with other segments such as segment9 might however hold the reliability criteria intact
while reducing the cost for Acme and thus opening up for price reduction. Since Competitor1 is more
localized than Acme it is likely that they might perform better in terms of delivery times on the
reliability criterion. This is because it is very reasonable that they to a greater extent have been able
to develop local suppliers as well as transferring knowledge and competence to local employees.
Acme’s performance on the relationship criterion is very dependent on the individual supplier-OEM
relationship. The strong relationship Acme has with OEM7-1 is of course very positive, as the OEM
currently is the most prominent customer in the Chinese OEM product1 market due to their price
level. Thus, Acme has the strongest relationship with the OEM that is most likely to be the selected
supplier for new segment1 systems in China, which is advantageous considering that China has the
greatest growth in the world in terms of new segment1 systems. If OEM7-1 also in the future
continues to be the largest customer in this market this could facilitate Acme’s efforts to expand
within the Chinese product1 market. As the trend is that OEM7-1’s market share actually is
increasing, this indicates that this might actually be the case on a longer time horizon. Leveraging the
relationship with OEM7-1 could therefore be important for Acme in order to expand within the
Chinese product1 market.
In general, Acme has few close relationships in the Chinese product1 market. The relationships Acme
has with OEM6, OEM7-3 and OEM7-2 are weaker and that shows that Acme is quite narrow in their
performance on the relational key purchasing criteria. Thus, Acme’s relationships are not very
diversified in the Chinese product1 market. However, it is possible that if Acme increases their
business for segment1 applications with OEM7-1 this could increase their business within the same
70
application segment with the other subsidiaries of OEM7-1, OEM7-2 and OEM7-3. The rather weak
relationship Acme has with OEM6, as indicated in the data in tables 16-19, can be explained by the
fact that OEM6 emphasizes the relational aspect very much compared to reliability, as seen in figure
17, and Acme overperform on the reliability criterion but not on the relational criterion.
Acme perform very well on the reliability criteria in general but as it is less valued by OEM6 than for
the other OEMs this could perhaps have made it hard to develop the relationship with OEM6 in the
first place. OEM6 seems to also have a preference for Japanese suppliers but as they are not big in
product1 this should not stop Acme’s ability to increase the business in this segment. For these
reasons, Acme might lose some potential to reach the current product1 aftermarket as OEM6 has
the greatest installed base of product2s. However, this relationship could perhaps be easily
strengthened considering the fact that Acme already has a close connection to the OEM6 group, as
they own the City1 facility together.
By comparing Acme to the competition on the same key purchasing criteria, Competitor1 is a bit
more diversified and has a strong relationship with both OEM6 and OEM7-3 while Competitor3 has a
particularly strong relationship with OEM7-2. Competitor1’s greater local presence has of course
positively influenced the relational criteria. Since Competitor1 entered the Chinese market early and
established a local sales organization they have probably to a greater extent been able to increase
the competence level of local sales people and application engineers than Acme. Even though Acme
has increased the resources in sales and application engineering they appear to still be some steps
behind Competitor1 in this area. Competitor1’s stronger local presence has thus facilitated their
efforts to build and develop customer relationships. Competitor1 can be considered to be stronger
than Acme on the relational criteria performance wise, as indicated in figure 24 but when considering
the types of OEMs Acme might have an advantage because of OEM7-1’s product1 OEM market
prominence.
Concerning Competitor3, they perform approximately the same as Acme on the relationship
criterion. This could be explained by Competitor3’s performance on the reliability criterion, which in
general is highly valued in China that in turn negatively influences their ability to develop
relationships. However, Competitor3 do have a good relationship with OEM7-2 but this is explained
by their technical platform shift, which matches Competitor3 product1s quite well.
Overall, Acme has a slightly negative gap performance wise on the OEMs key purchasing criteria as
they may be a bit too focused on a single customer within the product1 segment and lacks resources
and competence within sales and application engineering. Table 26 below summarizes the analysis
and shows the most important performance gaps on the OEMs key purchasing criteria that has been
identified.

71
Acme’s key purchasing criteria
Acme’s performance Acme’s competitors’ performance
Performance gap
Price
- All important OEMs judge Acme worst on the price level
- The competition has a price level that is more in line with OEMs requirements - Competitor3 is price leader - Both Competitor1 and Competitor3 have very high local presence
- Price is the largest negative performance gap for Acme in this market -Competitors have higher localization speed -Acme lacks a coordinated production of product1s
Relationship
- Acme has strong relationship with OEM7-1 - Weaker relationship with OEM6 OEM7-2 and OEM7-3
- Competitor1 localized early and has built strong relationships with OEM7-3 and OEM6 - Competitor3 has close relationship with OEM7-2.
-Acme has strong relationship with the currently strongest actor within the OEM product1 market - Acme has few close relationships, thus not very diversified - Acme might miss out on current product1 aftermarket deals - Competitor1 has a strong local sales organization
Reliability
- Acme is market leader based on OEMs’ perceptions - Acme might perform worse than competition on delivery times due to less developed supplier base and local competence
- Competitor1 is perceived as performing slightly below Acme on this criterion - Competitor3 well below Acme, but is often considered good enough
- A positive gap, Acme has good performance - Ensure quality in order to stay ahead - Product performance does not motivate the higher price -Competitor1 has faster customer response because of early localization
Table 26- Acme's key purchasing criteria performance gaps at the Chinese product1 market
8.2 China: Capability Assessment In this part a capability analysis is presented where all of Acme’s performance gaps on the OEMs key
purchasing criteria are linked to their respective implications on a capability level from a value chain
activity perspective of the firm. Figure 25 below shows all of the identified implications for the firm’s
capabilities. All of the different implications will now be discussed more in detail.

72
Key purchasing
criteria Proposed capability adaptations
The FBU’s value
activities
Price
Investigate possibility to synchronize product1 design of product1 type1 and product1 type2
Research and development
Develop suppliers’ delivery and quality performance
Supply Chain
Reliability
Improve the production planning in the City1 factory
Manufacturing Investigate possibility to coordinate product1 manufacturing with other application segments
Relationship
Increase the number of application engineers and improve their competence
Sales and Marketing
Figure 25 - Acme's capability implications in terms of key purchasing criteria and value activity within the Chinese product1 market
8.2.1 Price
In order to achieve a more competitive price for product1s produced at the City1 site the cost
reducing activities the FBU is recommended to investigate are 1) to find a design that is suitable for
product1 that could be coordinated in the production with other application segments to reach cost
efficient volumes 2) to increase the competence within production planning and scheduling among
employees to increase flexibility and reduce the cost of inventory capital 3) to actually start
coordinating manufacturing of product1s with other application segments which currently is not
done today.
From a design perspective, the Acme product1s are perceived to be slightly better than the
competition and more than good enough. However, from a price aspect they perform poorly. The
potential to improve the cost, and thus the price, is to develop a product1 design that could span
across many application segments and where the product1 segment would be included. This could
be done by investigating the possibilities to coordinate the production of product1s with segments
that use the same dimensions, e.g. segment9 and the old design of Chinese segment8 product1s.
However, for this to be feasible the aggregated volumes must be enough to achieve cost efficiency.
The main focus should be to coordinate the production of product1 type1 and product1 type2
XX*YY*ZZ as they are used for product1 and is common in other application segments. To further
increase manufacturing coordination the FBU should investigate the possibility to synchronize the
product1 design of product1 type1 and product1 type2 XX*YY*ZZ. It will also be important to
develop the product1 type1 and product1 type2 XX*YY*ZZ by increasing the width of the outer
component1 to XXX1 mm. By doing this it will be possible to include other application segments in
China, which would open up for the possibility to coordinate a design that suits segment1
applications with other application segments. The product1 type1s and product1 type2s would thus
be interchangeable with those manufactured in the City2 facility and production batches that

73
currently are produced in the City2 factory could be moved to the City1 facility in order to scale up
the production and thus reduce cost.
Managing the supply chain in City1 facility is something that Acme is challenged by today, which
affects the costs and thus the price. The competence among employees within Acme’s supply chain
has been identified as a big issue for achieving a more cost efficient production. Education and
training of employees on how to work better with production planning and scheduling will thus be
important aspects irrespectively if Acme choose to expand within the production of product1s or not
in the City1 facility. However, expanding the product range and increase volumes of smaller
segments like product1 would put even more pressure on achieving better supply chain competence.
Increasing the competence in production planning and scheduling, in order to achieve the wanted
coordination with other application segments, would be very important to achieve a more cost
efficient production. Furthermore, the risk that unwanted inventory increase with the amount of
product variations also stresses the importance of increasing the supply chain competence. If
coordination would be achieved in the production of component1s and component2s, this would be
particularly true for the end of the process where the final variant would be set. The increase of input
components that will be needed in the end of the process in order to set the final variant would need
to be coordinated. Not only will the internal supply chain competence be needed to increase, but
also the external supply chain competence. Here, it will be important to continue to collaborate and
develop local suppliers in order to increase their level of flexibility.
8.2.2 Relationship
Regarding the relationship key purchasing criteria Acme is not diversified relationship wise in the
Chinese market. As discussed, Competitor1 seems to perform better in this aspect as they have
localized earlier and has a strong local sales organization. For Acme it will be important to increase
both the amount and competence of the application engineers. Even though Acme has done this in
the past, it will be necessary to continue doing this to accommodate for the huge, and rapidly
growing, Chinese market. By doing this it will be possible to be speed up the responsiveness to
customers’ requests and strengthening the portfolio of relationships, thus making it more diversified.
The relationship could then perhaps also be leveraged with OEM7-1 on the product1 side, opening
up for access to a substantial part of the Chinese OEM product1 market. The rather weak
relationship Acme has with OEM6 could perhaps also be strengthened on the product1 side and thus
increasing Acme’s access to the current Chinese product1 aftermarket. All in all, Acme has a rather
risky position regarding the relational criterion. If another OEM would grow notably within the
product2 segment or if the relationship with OEM7-1 would be weakened in for example a case of an
upcoming quality case, Acme would likely suffer from their rather focused portfolio of relationships.
8.2.3 Reliability
As mentioned, there is potential for Acme to increase their competence within production planning
and scheduling as well as to develop their local supplier base at the City1 facility. This is aligned with
how Acme could decrease their costs, but it would also give Acme more timely deliveries and better
response time to customer requests. Developing local competence within production planning and
scheduling as well as increasing competence about Acme’s supply chain is thus essential in order to
close in on the competition. Further on, although the City1 factory has complete local sourcing it will
be important to develop the current local supplier base in order to achieve more timely deliveries.
74
8.3 India: Key Purchasing Criteria Assessment The fact that price and localization are the only key purchasing criteria expressed by the OEMs
according to the Indian sales organization is not fully compatible with that the order intake market
leader Competitor1 has not been manufacturing product1 in India historically. In such a scenario
Competitor2, the only leading product1s supplier with local production in India, literally would have
had a monopoly. However, this is the situation for the product1 order purchased by OEM13/OEM4.
The fact that OEM13/OEM4 is the only OEM that utilizes the system of development orders
differentiates the customer. It also highlights that price and localization are not the only key
purchasing criteria and that it is also vital to develop relationships with OEMs.
Relationships appear to be a key purchasing criterion for other OEMs that do not use development
orders too. This is indicated by that Competitor1 has been awarded the export orders from OEM1
and OEM2 in cases where the OEMs’ product1 procurement decisions were taken in central parts of
Western Europe, where Competitor1 has high market activeness. The fact that CSR Purzhen chose
the FBU as the product1 supplier for their product2s delivered to Indian segment1 system5 can also
serve as evidence for this since the relationship between the actors are close.
A related aspect to relationship is product1 safety. These factors are related since the OEMs,
especially BEML/OEM4, evaluate product1 suppliers’ solutions’ safety on their product1s operational
track-record. By not having an established relationship with an OEM and product1s in the operating
installed base, the OEMs will likely question the product1s’ safety in the evaluation of product1 for
their product2s. However, despite that safety is ranked as the most important characteristics of
product1 suppliers’ offers the parameter does not differentiate suppliers since it is a prerequisite in
order to be accepted as a supplier to the OEMs.
Price appears to be a very important key purchasing criterion based on the fact that this is the
criterion after safety the OEMs rank the highest. The localization demand is absolute for the
product1 orders where it is applied; despite that price is the underlying reason for using the
requirement. The fact that Indian authorities have no formal demand on local content does not
matter for the orders with localization requirements: unless the product1 supplier does not have or
intend to establish local production they will be disregarded.
The fact that the OEM13/OEM4 is the only OEM that has procured product1s locally indicates that
this is the only actor applying the localization requirement. However, the fact that OEM2 has applied
the requirement in combination with that the OEMs are increasing their localization of production
capacity in India indicate that localization will become a more frequently used requirement in the
future. Another motive for this is that the OEMs benefit from localized product1 production, which
can result in lower product1 prices and higher flexibility in deliveries, imply that localization can be
considered to be a key purchasing criterion, at least for some of the leading OEMs.
The localization criterion is also related to the relationship criterion since OEMs prefer to conduct
business with domestically located firms. This can be captured in the criterion relationship since a
local establishment for a product1 manufacturer is likely to imply strengthened relations with OEMs
due to that personal relationships between the firms are created locally. Based on the
aforementioned perspectives, the key purchasing criteria the OEM appears to emphasize in India are
localization, price and relationships, see table 27. The localization criterion is defined as to have local
manufacturing and potentially local souring of input components. The relationship criterion involves
75
having personal relationships with key employees within the OEMs’ organizations both within India
and within the main Indian exporting product2 markets.
Key purchasing criteria
Acme’s performance
Acme’s competitors’ performance
Performance gap
Localization
- The FBU has currently no local production - Other Acme division has a several factories in India
- Competitor2 has a local product1 production well established production - Competitor1 is establishing production of product1 type1
- The gap is binary, the FBU has no production in India in contrast to their competitors
Price
- The OEMs rate Acme worst on price level - Acme has lost orders due to their price level
- Competitor2 is estimated to provide product1s with low price due to local setup - Competitor1 offered low price quotes on product1s on OEM2 orders. Their price was much lower than Acme’s
- Acme is clearly lagging behind for this factor - Competitor1’s OEM2 quote which wasn’t produced in India was under Acme production price. Hence, Acme’s manufacturing setup should be investigated
Relationship
- Acme has weak relationship in India: no previous orders with OEM13/OEM4 - Previous projects have been supplied by the FBU sales organizations in other counties - Relatively good relationship with OEM at markets exporting to India
- Competitor2 has a well-established relationship with OEM13/OEM4 and is the installed base market leader - Competitor1 has strong relationship with leading OEMs in Western Europe - Competitor1 has not supplied any product1s to OEM13/Competitor2
- Acme has a challenging position in strengthening the relationships with OEM13/OEM4 since Competitor2 has a strong position and Acme a low installed base market share, which implies little track-records - Acme has possibly a weaker relationship with the leading OEMs which are supplying the Indian market from Western Europe
Table 27 - The Indian OEMs’ key purchasing criteria and Acme’s relative performance in comparison
Acme can be considered to face fierce competition from Competitor1 and Competitor2 which
perform better than Acme on the OEMs’ key purchasing criteria. This can be verified by the OEM
product1 market share split, see figure 21 where Acme has significantly lower share than the
competitors. Moreover, Acme can be considered to have negative performance gaps for all there key
purchasing criteria, see table 27.
Acme’s lack of local manufacturing in combination with the firm’s relatively weak brand awareness at
the Indian product1 market are the most probable explanations to why Acme has not received any
development orders from OEM13/OEM4. An additional explaining factor could be Acme product1s’
price level. Nevertheless, it is positive that Acme has leverage on their sales organizations in other
markets in order to deliver product1s used in Indian segment1 systems. The fact that Acme has
delivered product1s which are used in Indian product2s will likely increase the firm’s possibility to
76
receive development orders from OEM13/OEM4 since their product1s have been tested
operationally. This is positive from the perspective that the Indian product1 market is becoming
increasingly localized both from the aspect that OEM13/OEM4 is expected to gain market share and
from the aspect that OEM1 and OEM2 recently have localized manufacturing in India. However, the
fact that non-Indian OEMs receive relatively few product2 orders from system operators is also
challenging from Acme’s perspective due to the lack of delivered developing orders from
OEM13/OEM4. However, Competitor1 will also be challenged of such a scenario since the firm has
not supplied any larger OEM13/OEM4 order. The firm’s possibilities to receive development orders
are likely improved by that Competitor1 currently is establishing a factory in India. It is also
worrisome for Acme that the firm has not been awarded any exporting product1 orders from OEM1
and OEM2 since these orders can ensure that their product1s becomes accepted on the Indian
market.
Hence, to establish and nurture relationships with the OEMs will still be central in the future but the
Indian product1 market’s main emphasis appears to be on the key purchasing criterion price. This is
indicated by that the OEM only procure standardized product1s and thereby aims to find comparable
product1 that finally compete for the order on price. Additionally, the official request by the leading
segment1 consultancy to reward local product2 manufactures additional orders in order to reduce
the cost for segment1 systems will most certainly increase the overall cost focus. Therefore, it will be
critical to close the price performance gap. The product1 order supplied for the product2s operating
the Indian segment1 system2 indicates that it will be challenging for Acme to compete on price levels
on the Indian market when the product1s are produced in the City2 facility. Furthermore, the fact
that the vast majority of the product1s supplied to the Indian product1 market have been
manufactured in Asia also indicates that Acme will have a challenge to compete on price by supplying
product1s from the City2 factory.
8.4 India: Capability Assessment The succeeding capability analysis is based on the discussions about Acme’s performance gaps and
specifically on the challenge of serving the Indian market with production from the City2 factory.
Within this section, the manufacturing and supply chain activities will mainly be focusing on
capability adaptations related to the City1 factory and to a potential establishment of local
production in India. The proposed capability adaptations that are considered to have the largest
impact on the key purchasing criteria on the Western Europe are presented in figure 26.
77
Key purchasing
criteria Proposed capability adaptations
The FBU’s value activity
Localization
Synchronize the most frequently produced product1 types and dimensions with similar solutions on other markets
Research and Development
Coordination of input component procurements
Supply Chain
Improve the current suppliers’ delivery performance
Establish assembly line in India
Price
Establish joint venture with local product1 manufacturer
Manufacturing
Manufacture frequently sold product1s at the City1 site
Intensify sales activities in order to generate order volumes
Investigate the possibility to allocate volume to other domestic markets
Sales
Relationship
Focus on obtaining orders from OEM1 and OEM2
Focus on gaining a development order from OEM13/OEM4
Figure 26 - An overview of the suggested capability adaptations within the FBU’s value activities for the Indian market mapped against the key purchasing criteria
8.4.1 Localization
The localization gap can per se only be filled if the FBU establish production of product1s within the
Indian market. That is an activity that requires large investments and thereby risks. One of the more
obvious risks is that the FBU will be unable to ensure the required sales orders to gain a high
utilization of the proposed established production facility. OEM13/OEM4’s development order
strategy will be a hindering factor in receiving larger orders directly. Therefore it is important to
receive orders from other OEMs, such as OEM1 and OEM2, which do not require localized
production to the same extent. Since these OEMs’ have a strong focus on price for the Indian
product1 orders, Acme must first of all offer orders within a price competitive range from their
existing production setup.

78
Furthermore, a possible localization could be realized in several ways and these affect the probability
to succeed as the risk level differs. An alternative is to establish a local production by setting up an
assembly line in the City3 factory. The fact that the assembly line alternative involves relatively low
risks and that it is not as complex to implement as a full complete factory results in that this clearly is
more attractive option than establishing a complete factory. The lower capacity of this option is also
appealing since the Indian product1 and the focal industry markets’ development is a bit uncertain.
Additionally, the fact that the City3 factory is fully owned implies that the FBU eliminates the risk of
that production know-hows are distributed or intellectual property rights shared externally. By only
establishing an assembly line in India the input components must be sourced. The FBU should try to
leverage on the existing City3 factory’s suppliers to the extent it is possible. Otherwise, input
components should be tried to be sourced from the City1 or City2 suppliers based on the overall cost
and the deliver flexibility the options implies. Supplying an assembly channel in India with input
components from the FBU’s existing factories’ suppliers imply high demands of supply chain
coordination. Furthermore, it requires that the general delivery performance among these suppliers
become improved.
The current product1 market is far from large enough to ensure for a satisfying utilization of an
assembly line establishment. Therefore it will be important for the FBU to gain orders of product1s to
other application segments within India as well. From the perspective of table 24, the application
segments within which the FBU will be most likely to gain volume orders are segment8 and
segment9. The segment3 and segment5 application segments are also fairly large. Based on this, it
will be vital to have a high activeness on the Indian product1 market before realizing a localization in
order to ensure a sufficient market share that can motivate a market establishment. The Indian sales
organization should quote intensively and aggressively on orders beforehand but also increase the
sales activities such as customer meetings before such an establishment in order to increase the
possibility to gain orders. Additionally, the FBU should investigate which other domestic product1
markets that will be possible to serve with product1s from a potential production channel in India.
The absolute market sizes of the surrounding markets will therefore be interesting to investigate, see
table 24 for the largest domestic product1 markets in Asia per application segment. However, in such
an investigation Acme’s market position and the strength of their product1 offer should also be
considered as well as the implication of import tariffs and delivery times from India to the
surrounding markets’ customers.
Another alternative for an establishment is to form a joint venture with an Indian product1 producer.
The main advantage with establishing a joint venture is that Acme most likely will be rewarded with
additional product1 orders from Indian OEMs. The disadvantage of a joint venture is that Acme
probably have to develop their local partners’ operations in order to ensure a sufficient delivery
performance and product1 quality. The risk of sharing intellectual property rights and production
related know-how must also be taken into consideration.
All in all, an establishment of a joint venture with a local Indian product1 manufacturer is generally
the option to prefer since global OEMs have difficulties of gaining ground in the Indian market. By
collaborating with a local manufacturer the FBU will have to share the profits but will have a position
where it is more likely to receive orders from Indian OEMs. The risks of sharing property rights must
however be weighted towards the gains of a potentially stronger market position within the Indian
market. Sharing technology is not that risky in the longer perspective since the Indian product1

79
supplier most likely will gain access to the sophisticated product1s technology anyway in potential
collaboration with other actors. In a scenario where the international OEMs begin to receive market
orders, the preferable option for the FBU is to establish an assembly channel. This option is favorable
in many ways, such as that it allows for increased control and faster establishment. However, the
FBU will have a more difficult time to receive orders from the Indian OEMs by establishing an
assembly line since the firm will act as a foreign actor. The preferred choice of localization depends
on which types of potential customers that will be awarded the product2 projects. For now a joint
venture appears to be the most attractive option.
8.4.2 Price
The key purchasing criterion price is highly interrelated with localization. This is due to that local
production often implies low product1 prices as a fact of that the high import tariffs costs,
transportation costs to India and inventory cost during the transportation can be avoided. In the
assembly channel establishment scenario, where the input components are sourced from other
countries than India, these cost will still be existent but since the product1s will be assembled in India
the FBU will avoid to be taxed for the value add during this process.
Despite the costs product1 exports to India imply, the FBU should investigate the possibility to supply
the most frequent product1 types and dimensions that can be coordinated with the Chinese and
other markets’ demand from the City1 factory. The fact that both the leading OEMs on the Indian
product1 market, OEM13/OEM4 and OEM2 are utilizing product1 type1’s and product1 type2’s of
the most frequently applied product1 dimension XX*YY*ZZ create an opportunity to quote product1
orders based on synchronized production. This has potential to imply significant price reductions for
these product1 types. However, in order to establish such coordination with other domestic markets,
an investigation of the product1 designs’ offered on the Indian product1 market should be conducted
where these product1 designs are compared to similar product1s offered at other markets. The
possibility to receive low cost product1s by synchronizing production of the XX*YY*ZZ product1
type1 at the City1 site should be evaluated before any localization decision is taken.
8.4.3 Relationship
The FBU should actively improve their relationship with the customers active on the Indian market
but the specific direction of these activities will depend on the localization strategy that is chosen. A
generally strategic activity will be to ensure deliveries of development orders to OEM13/OEM4,
considering their market position and its expected development. However, their localization
requirement is not compatible with Acme’s current position. Therefore it will be vital to be rewarded
development orders that possibly lack this requirement. If such an opportunity appears Acme could
potentially apply a penetration price strategy, just in order for OEM13/OEM4 to gain experience of
Acme’s product1s and in order to increase the credibility at the Indian market. Noteworthy, a
penetration price strategy may be risky due to that OEM13/OEM4 expects Acme to deliver at a
similar price in the future as well. Additionally, some credibility can be aimed to be gained by visiting
the customer but the real qualifier in order to gain large product1 orders is ultimately to deliver
product1s for operational activities.
The fact that OEM1’s and OEM2’s product1 orders are negotiated on the Western European market
gives Acme better possibilities to receive product1 orders. However, Competitor1’s strong market
presence in Germany and France is apparently paying off. That Competitor1 was rewarded the OEM2

80
order was not entirely surprising but in order for Acme to gain future Indian business with OEM2 the
product1 price should be reduced. However, it was more alarming that Competitor1 also gained the
OEM1’s product1 order for the Indian segment1 system4 since Acme has a close relationship with
the OEM. Moreover, Acme’s Indian sales organization should focus on intensifying the conversation
with the global OEMs’ local strategic personnel. Additionally, it will be important for the Indian sales
organization to have a frequent communication with sales organizations in other markets in order to
be reactive for upcoming product1 orders.
8.5 Western Europe: Key Purchasing Criteria Assessment The most highly emphasized evaluation factors by the Western European OEMs give a strong
indication of what factors that are the key purchasing criteria on the market. However, these factors
are several which imply that it is difficult to gain an overall perspective of the product1 suppliers’
performance on the product1 market. Furthermore, all of the evaluations factors presented in table
24 are not mutually exclusive as well as these do not capture the importance of having close
relationships with OEMs on the market, which has been stressed as an increasingly meaningful
variable of gaining product1 orders. Therefore, highly emphasized evaluation factors has been
combined and reorganized into four key purchasing criteria: design, price, relationship and quality,
presented in the first three columns in table 28. Noteworthy is that the key purchasing criterion
relationship does not relate to the evaluation factors in table 24 but has been added since it
influences the product1 suppliers possibilities to receive important information about future
product1 orders as well as it can affect the OEMs’ functional criteria.
In order to compare the product1 suppliers’ performance on the key purchasing criteria these have
been related to the OEMs’ ranking of the product1 suppliers’ performance, see column 4 in table 28.
Design has mainly been related to the firm’s innovation ability but also to product range since firms
with large product ranges are likely to have product1s that suits the demand. The price key
purchasing criterion was already given. The aspects of relationship cannot be entirely described by
the competitive dimension since these do not capture such intangible aspects but can be indicated
by the image on the market and the firms’ service abilities. The key purchasing criterion quality
includes both technical and delivery aspects and has therefore been related to the competitive
dimensions delivery performance and quality.
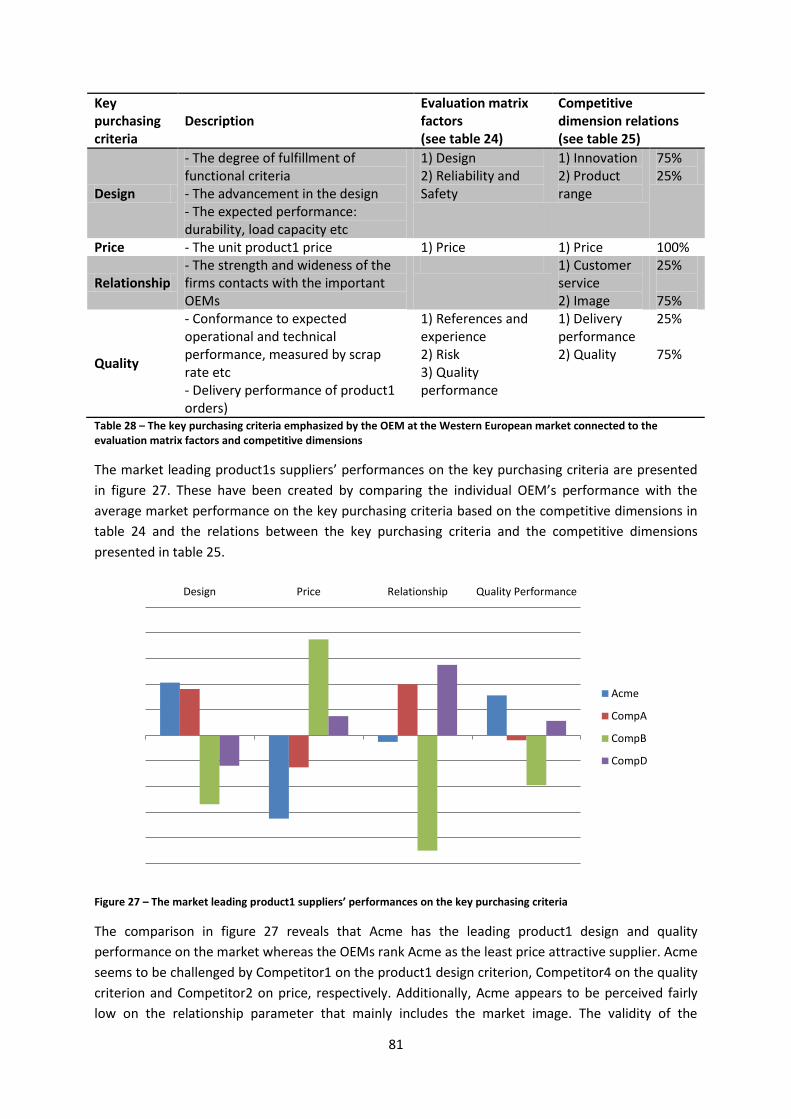
81
Key purchasing criteria
Description Evaluation matrix factors (see table 24)
Competitive dimension relations (see table 25)
Design
- The degree of fulfillment of functional criteria - The advancement in the design - The expected performance: durability, load capacity etc
1) Design 2) Reliability and Safety
1) Innovation 2) Product range
75% 25%
Price - The unit product1 price 1) Price 1) Price 100%
Relationship - The strength and wideness of the firms contacts with the important OEMs
1) Customer service 2) Image
25% 75%
Quality
- Conformance to expected operational and technical performance, measured by scrap rate etc - Delivery performance of product1 orders)
1) References and experience 2) Risk 3) Quality performance
1) Delivery performance 2) Quality
25% 75%
Table 28 – The key purchasing criteria emphasized by the OEM at the Western European market connected to the evaluation matrix factors and competitive dimensions
The market leading product1s suppliers’ performances on the key purchasing criteria are presented
in figure 27. These have been created by comparing the individual OEM’s performance with the
average market performance on the key purchasing criteria based on the competitive dimensions in
table 24 and the relations between the key purchasing criteria and the competitive dimensions
presented in table 25.
Figure 27 – The market leading product1 suppliers’ performances on the key purchasing criteria
The comparison in figure 27 reveals that Acme has the leading product1 design and quality
performance on the market whereas the OEMs rank Acme as the least price attractive supplier. Acme
seems to be challenged by Competitor1 on the product1 design criterion, Competitor4 on the quality
criterion and Competitor2 on price, respectively. Additionally, Acme appears to be perceived fairly
low on the relationship parameter that mainly includes the market image. The validity of the
Design Price Relationship Quality Performance
Acme
CompA
CompB
CompD
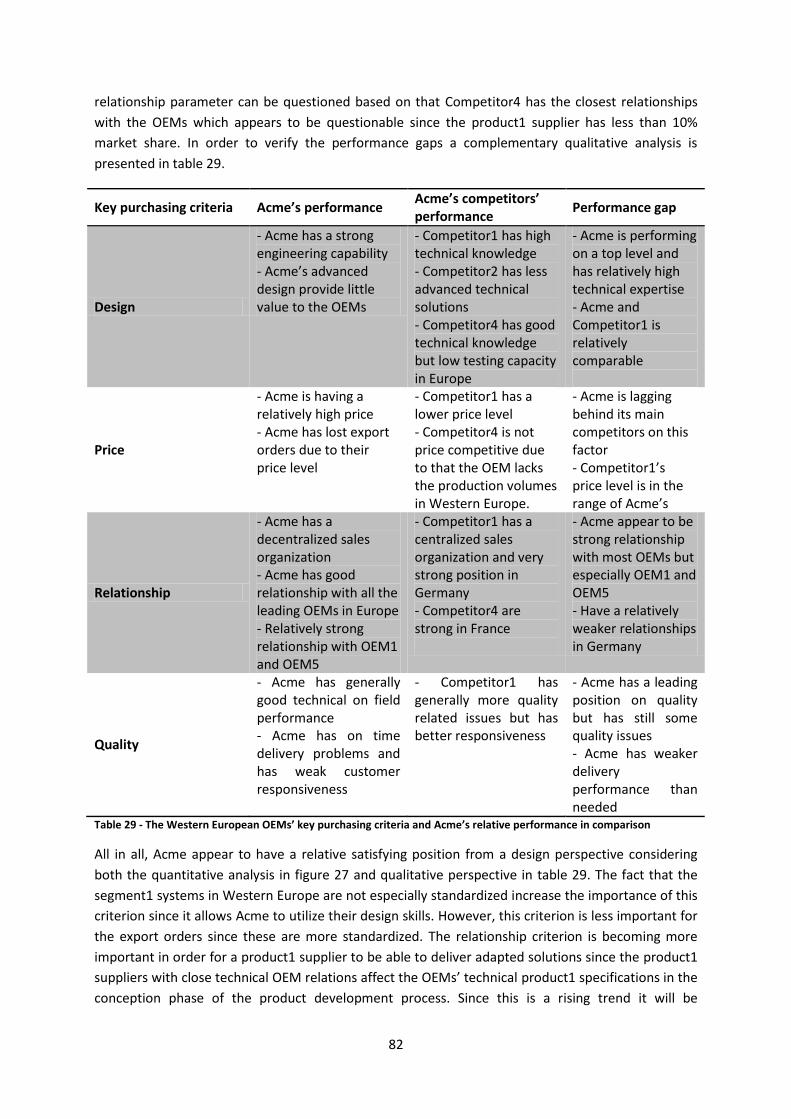
82
relationship parameter can be questioned based on that Competitor4 has the closest relationships
with the OEMs which appears to be questionable since the product1 supplier has less than 10%
market share. In order to verify the performance gaps a complementary qualitative analysis is
presented in table 29.
Key purchasing criteria Acme’s performance Acme’s competitors’ performance
Performance gap
Design
- Acme has a strong engineering capability - Acme’s advanced design provide little value to the OEMs
- Competitor1 has high technical knowledge - Competitor2 has less advanced technical solutions - Competitor4 has good technical knowledge but low testing capacity in Europe
- Acme is performing on a top level and has relatively high technical expertise - Acme and Competitor1 is relatively comparable
Price
- Acme is having a relatively high price - Acme has lost export orders due to their price level
- Competitor1 has a lower price level - Competitor4 is not price competitive due to that the OEM lacks the production volumes in Western Europe.
- Acme is lagging behind its main competitors on this factor - Competitor1’s price level is in the range of Acme’s
Relationship
- Acme has a decentralized sales organization - Acme has good relationship with all the leading OEMs in Europe - Relatively strong relationship with OEM1 and OEM5
- Competitor1 has a centralized sales organization and very strong position in Germany - Competitor4 are strong in France
- Acme appear to be strong relationship with most OEMs but especially OEM1 and OEM5 - Have a relatively weaker relationships in Germany
Quality
- Acme has generally good technical on field performance - Acme has on time delivery problems and has weak customer responsiveness
- Competitor1 has generally more quality related issues but has better responsiveness
- Acme has a leading position on quality but has still some quality issues - Acme has weaker delivery performance than needed
Table 29 - The Western European OEMs’ key purchasing criteria and Acme’s relative performance in comparison
All in all, Acme appear to have a relative satisfying position from a design perspective considering
both the quantitative analysis in figure 27 and qualitative perspective in table 29. The fact that the
segment1 systems in Western Europe are not especially standardized increase the importance of this
criterion since it allows Acme to utilize their design skills. However, this criterion is less important for
the export orders since these are more standardized. The relationship criterion is becoming more
important in order for a product1 supplier to be able to deliver adapted solutions since the product1
suppliers with close technical OEM relations affect the OEMs’ technical product1 specifications in the
conception phase of the product development process. Since this is a rising trend it will be

83
increasingly important for Acme to strengthen their technical relationships with the OEMs in
Western Europe.
The perspective given for the relationship criterion in figure 27 is slightly misleading since the
relational aspect is more difficult to measure on a central level for Europe and the insights provided
in table 29 are more valuable. Acme appear to have relatively strong relationship with all leading
OEMs. However, this is dependent on the previous product1 orders the product1 supplier delivered
and in the case of that Competitor1 is a main supplier of product1s to OEM2 in Germany and that the
OEMs prefer to utilize the same product1 suppliers for several orders repeatedly, Acme’s position
has weakened over the years. Hence, Acme should focus on improving relationships with OEM2 and
OEM3 but at the same time develop and nurture their relationship with OEM1 and OEM5 in Europe.
The relationships are to large extent built up during collaborations so it is therefore important to
offer attractive solutions and thereafter be very active in the relationships.
Furthermore, Acme has the weakest position among the competitors at the key purchasing criterion
price. This is worrisome due to that this is the factor that the OEM’s value the most. However, the
usage of design evaluation matrixes reduces the criterion’s importance. From the perspective of
quality, Acme is reckoned to have a leading position. Despite this there exist an opportunity to
differentiate further since Western European OEMs to an increasingly extent demand flexible
deliveries whereas Acme is perceived to have a relatively weak delivery performance.
8.6 Western Europe: Capability Assessment The suggestions presented in the following capability analysis is affected by that the Western
European segment1 systems generally have low degree of standardization. On the basis of this
perspective, the market has been believed to best be served by Acme’s local factory in City2 since
this factory has a flexible production setup. However, some of the product1 orders exported from
Western Europe are of more standardized product1 dimensions and can therefore be suitable to be
produced in City1 factory. Since this only regards a few product1 types the following section will
focus on the supply chain and manufacturing from the perspective of the FBU’s City2 factory. The
proposed capability adaptations that are considered to have the largest impact at the FBU’s
performance on the Western European key purchasing criteria are presented in figure 28. In the
figure, the connections to the value chain activities have also been presented.
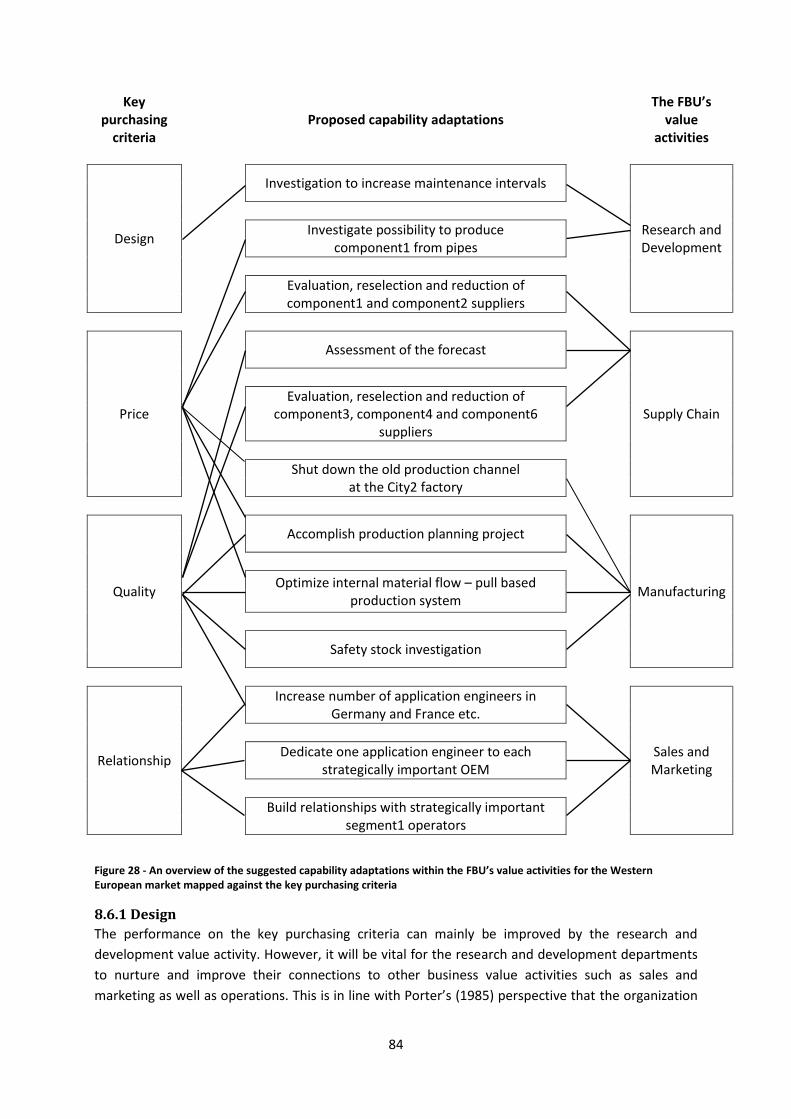
84
Key purchasing
criteria Proposed capability adaptations
The FBU’s value
activities
Design
Investigation to increase maintenance intervals
Research and Development
Investigate possibility to produce component1 from pipes
Evaluation, reselection and reduction of component1 and component2 suppliers
Price
Assessment of the forecast
Supply Chain
Evaluation, reselection and reduction of component3, component4 and component6
suppliers
Shut down the old production channel at the City2 factory
Quality
Accomplish production planning project
Manufacturing
Optimize internal material flow – pull based production system
Safety stock investigation
Relationship
Increase number of application engineers in Germany and France etc.
Sales and Marketing
Dedicate one application engineer to each strategically important OEM
Build relationships with strategically important segment1 operators
Figure 28 - An overview of the suggested capability adaptations within the FBU’s value activities for the Western European market mapped against the key purchasing criteria
8.6.1 Design
The performance on the key purchasing criteria can mainly be improved by the research and
development value activity. However, it will be vital for the research and development departments
to nurture and improve their connections to other business value activities such as sales and
marketing as well as operations. This is in line with Porter’s (1985) perspective that the organization
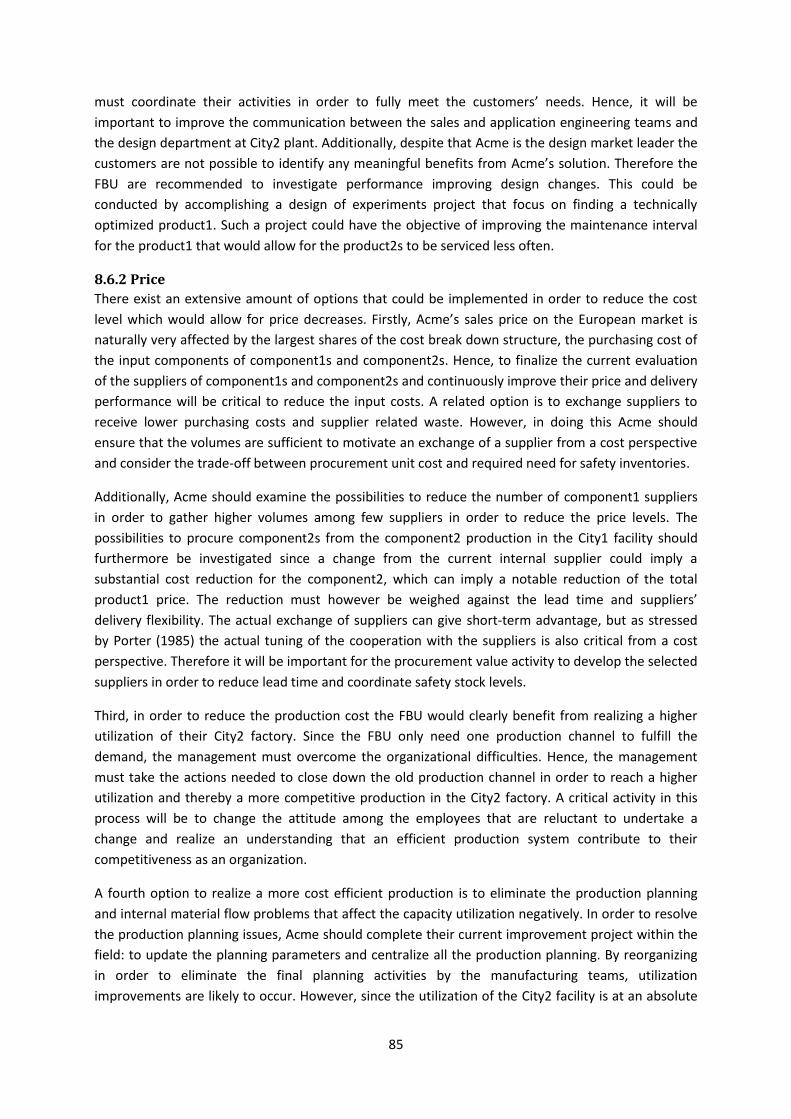
85
must coordinate their activities in order to fully meet the customers’ needs. Hence, it will be
important to improve the communication between the sales and application engineering teams and
the design department at City2 plant. Additionally, despite that Acme is the design market leader the
customers are not possible to identify any meaningful benefits from Acme’s solution. Therefore the
FBU are recommended to investigate performance improving design changes. This could be
conducted by accomplishing a design of experiments project that focus on finding a technically
optimized product1. Such a project could have the objective of improving the maintenance interval
for the product1 that would allow for the product2s to be serviced less often.
8.6.2 Price
There exist an extensive amount of options that could be implemented in order to reduce the cost
level which would allow for price decreases. Firstly, Acme’s sales price on the European market is
naturally very affected by the largest shares of the cost break down structure, the purchasing cost of
the input components of component1s and component2s. Hence, to finalize the current evaluation
of the suppliers of component1s and component2s and continuously improve their price and delivery
performance will be critical to reduce the input costs. A related option is to exchange suppliers to
receive lower purchasing costs and supplier related waste. However, in doing this Acme should
ensure that the volumes are sufficient to motivate an exchange of a supplier from a cost perspective
and consider the trade-off between procurement unit cost and required need for safety inventories.
Additionally, Acme should examine the possibilities to reduce the number of component1 suppliers
in order to gather higher volumes among few suppliers in order to reduce the price levels. The
possibilities to procure component2s from the component2 production in the City1 facility should
furthermore be investigated since a change from the current internal supplier could imply a
substantial cost reduction for the component2, which can imply a notable reduction of the total
product1 price. The reduction must however be weighed against the lead time and suppliers’
delivery flexibility. The actual exchange of suppliers can give short-term advantage, but as stressed
by Porter (1985) the actual tuning of the cooperation with the suppliers is also critical from a cost
perspective. Therefore it will be important for the procurement value activity to develop the selected
suppliers in order to reduce lead time and coordinate safety stock levels.
Third, in order to reduce the production cost the FBU would clearly benefit from realizing a higher
utilization of their City2 factory. Since the FBU only need one production channel to fulfill the
demand, the management must overcome the organizational difficulties. Hence, the management
must take the actions needed to close down the old production channel in order to reach a higher
utilization and thereby a more competitive production in the City2 factory. A critical activity in this
process will be to change the attitude among the employees that are reluctant to undertake a
change and realize an understanding that an efficient production system contribute to their
competitiveness as an organization.
A fourth option to realize a more cost efficient production is to eliminate the production planning
and internal material flow problems that affect the capacity utilization negatively. In order to resolve
the production planning issues, Acme should complete their current improvement project within the
field: to update the planning parameters and centralize all the production planning. By reorganizing
in order to eliminate the final planning activities by the manufacturing teams, utilization
improvements are likely to occur. However, since the utilization of the City2 facility is at an absolute

86
very low level the new production planning related challenges are likely to occur when the existing
issues have been managed. Therefore it will be important to manage arising challenges as the
utilization level and factories’ performance improves. One such improvement will be to continuously
evaluate the safety stock level.
Fifth, an action that possibly could reduce the cost within the longer term is to analyze and improve
the internal material flow. There is a possibility to further improve the utilization by exploiting the
potential of the pull based material flow which currently is not utilized due to the planning problems.
However, the FBU should tune the pull based system as the production planning improves in order to
seize the potential gains.
Sixth, in order to reduce cost for the production of product1s, the option to purchase component1s
made from steel pipes is appealing. From a design perspective this would imply that certain
investigations would be needed in order to assess whether or not this would be suitable for the
product1 segment. As mentioned, the material structure could for example be an issue.
Furthermore, the FBU need to consider that the solutions must be re-homologated in case the
production process changes. An important consideration is that the supplier of component1 made
from ready-made steel pipes could have some production related factors that influence the choice
whether or not this would be economically feasible for Acme. The potential benefit of producing
component1 from pipes is that method would allow for cost efficient low volume production.
However, since producing component1 from ready-made steel pipes in higher volumes could be
costly for the supplier. Furthermore, Acme should make the new homologated solutions based on
steel pipes as easy as possible to manufacture with the current resources and capabilities. From a
design approach it will therefore be necessary to employ a design for manufacturing approach
(Porter 1985).
8.6.3 Relationships
The capability adaptations that are suggested in order to improve the FBU’s relationship with the
customers are to large extent related to the marketing and sales capabilities. There are several
actions that the FBU could undertake in order improve their relationships with their customers.
First, the product1 suppliers’ influence and activeness during the OEMs’ conception phases demand
more technical customer interaction and it is therefore increasingly important to strengthen the
application engineering presence in Western Europe. Since all the three globally important OEMs as
well as OEM1, OEM2, OEM5 and OEM3 have manufacturing in the region it is vital to have a high
presence of technical personnel here, especially in Germany, France and Spain. Also, the fact that the
product1s for many export orders are procured in Western Europe contributes to the region’s
strategic importance. Furthermore, Competitor1’s highly competitive position in central Europe is
worrying. However, from a relational perspective it will be crucial to continue to communicate with
the non-current customers in order to be able to receive updated information about upcoming
projects. This is also vital in order to have the possibility to receive future orders from these
customers. Hence, it will not only be important to increase the amount of application engineers but
doing this strategically by focusing on certain local markets where the OEM’s procurement
organizations are located. Overall, a sales perspective that has longer term focus is requested which
would allow for the sales organizations to higher extent invest in relationships that may not be
profitable in the short term.

87
Second, a closely related proposal to the prior concerns the idea to dedicate an application engineer
to each of the most strategic OEMs by letting these employees physically being located at the OEMs’
facilities. The proposal is dependent on that the OEMs approve such localization. However, if such an
option is achievable it most likely will improve the communication between the organizations,
especially on a technical level.
Third, in order to receive business in the longer perspective Acme is suggested to initiate
relationships with segment1 operators. The product1 operators are the actors that benefit from
improved product1 performance whereas for example design that implies longer maintenance
interval implies a higher availability of the product2s. By establishing relationships with segment1
operators, Acme can both improve their understanding of the actors’ operational challenges as well
as potentially influence their technical demands in new product2 orders to be more adapted to the
solutions offered by Acme.
8.6.4 Quality
The majority of the capabilities that the FBU can improve in order to ensure an increased
performance on the key purchasing criterion quality are ones that affect the firm’s delivery
performance. There are several ways for the FBU to improve their performance on the OEMs’
quality criterion. First, it will be interesting to evaluate and develop the suppliers of component3 and
component4. This is due to that the varieties of these components are numerous in combination
with that the inventory levels are relatively low. Hence, poor delivery performance of these suppliers
affects the utilization level negatively. Therefore it will be important to investigate the reliability of
the suppliers’ production process, the quality of their components and the extent to which they use
safety stocks.
Second, it will not only be critical to investigate the suppliers’ delivery performance but also to
ensure that these have the proper information about the City2’s production’s demand. Therefore,
the forecasting process should be assessed in order to ensure that needed planning information is
communicated to the suppliers.
Third, the relatively low inventory levels should be investigated. Inventory is generally not
appreciated but in the case increased inventory levels of component3 and component4 can reduce
the work-in-process inventory it can be favored to raise the increased inventory levels of these
components. The inventory levels of these variety components should be evaluated and possibly
increased, also by considering the current suppliers’ delivery performance. Increasing safety levels
are especially important in order to win orders on the aftermarket.
Fourth and fifth, the production planning improvement project as well as continuously enhancing the
internal material flow will in addition to reducing the production cost also be beneficial to be able to
ensure more reliable deliveries.
Sixth, employing additional application engineers can also imply that the FBU perform better on the
quality criterion since it will increase the capacity to respond to orders. This would allow the FBU to
be able to respond to requests in a timelier manner. Losing potential deals due to low responsiveness
is very unnecessary.
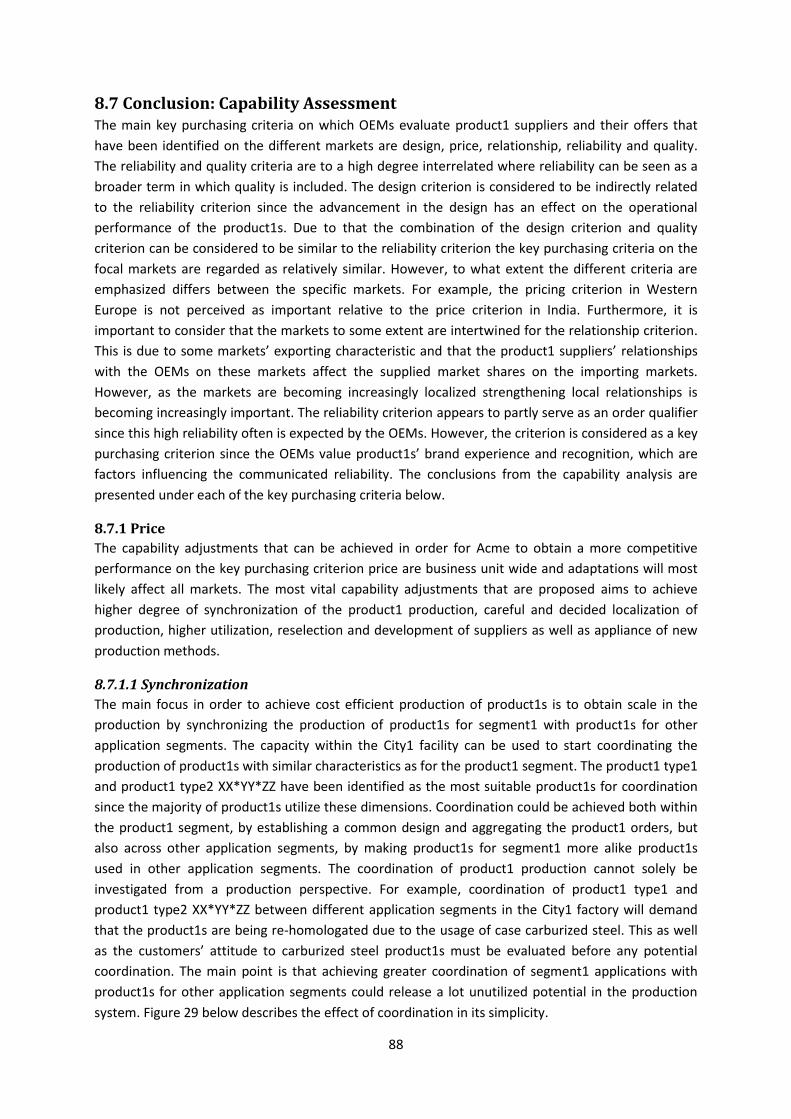
88
8.7 Conclusion: Capability Assessment The main key purchasing criteria on which OEMs evaluate product1 suppliers and their offers that
have been identified on the different markets are design, price, relationship, reliability and quality.
The reliability and quality criteria are to a high degree interrelated where reliability can be seen as a
broader term in which quality is included. The design criterion is considered to be indirectly related
to the reliability criterion since the advancement in the design has an effect on the operational
performance of the product1s. Due to that the combination of the design criterion and quality
criterion can be considered to be similar to the reliability criterion the key purchasing criteria on the
focal markets are regarded as relatively similar. However, to what extent the different criteria are
emphasized differs between the specific markets. For example, the pricing criterion in Western
Europe is not perceived as important relative to the price criterion in India. Furthermore, it is
important to consider that the markets to some extent are intertwined for the relationship criterion.
This is due to some markets’ exporting characteristic and that the product1 suppliers’ relationships
with the OEMs on these markets affect the supplied market shares on the importing markets.
However, as the markets are becoming increasingly localized strengthening local relationships is
becoming increasingly important. The reliability criterion appears to partly serve as an order qualifier
since this high reliability often is expected by the OEMs. However, the criterion is considered as a key
purchasing criterion since the OEMs value product1s’ brand experience and recognition, which are
factors influencing the communicated reliability. The conclusions from the capability analysis are
presented under each of the key purchasing criteria below.
8.7.1 Price
The capability adjustments that can be achieved in order for Acme to obtain a more competitive
performance on the key purchasing criterion price are business unit wide and adaptations will most
likely affect all markets. The most vital capability adjustments that are proposed aims to achieve
higher degree of synchronization of the product1 production, careful and decided localization of
production, higher utilization, reselection and development of suppliers as well as appliance of new
production methods.
8.7.1.1 Synchronization
The main focus in order to achieve cost efficient production of product1s is to obtain scale in the
production by synchronizing the production of product1s for segment1 with product1s for other
application segments. The capacity within the City1 facility can be used to start coordinating the
production of product1s with similar characteristics as for the product1 segment. The product1 type1
and product1 type2 XX*YY*ZZ have been identified as the most suitable product1s for coordination
since the majority of product1s utilize these dimensions. Coordination could be achieved both within
the product1 segment, by establishing a common design and aggregating the product1 orders, but
also across other application segments, by making product1s for segment1 more alike product1s
used in other application segments. The coordination of product1 production cannot solely be
investigated from a production perspective. For example, coordination of product1 type1 and
product1 type2 XX*YY*ZZ between different application segments in the City1 factory will demand
that the product1s are being re-homologated due to the usage of case carburized steel. This as well
as the customers’ attitude to carburized steel product1s must be evaluated before any potential
coordination. The main point is that achieving greater coordination of segment1 applications with
product1s for other application segments could release a lot unutilized potential in the production
system. Figure 29 below describes the effect of coordination in its simplicity.
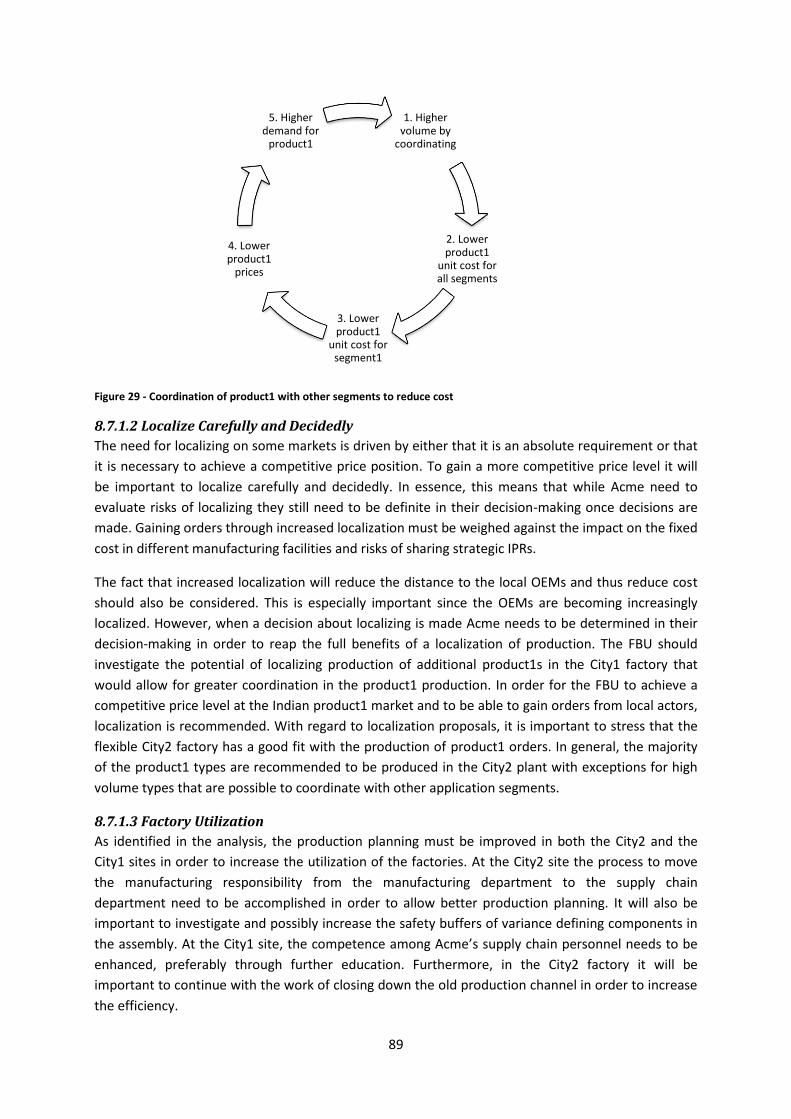
89
Figure 29 - Coordination of product1 with other segments to reduce cost
8.7.1.2 Localize Carefully and Decidedly
The need for localizing on some markets is driven by either that it is an absolute requirement or that
it is necessary to achieve a competitive price position. To gain a more competitive price level it will
be important to localize carefully and decidedly. In essence, this means that while Acme need to
evaluate risks of localizing they still need to be definite in their decision-making once decisions are
made. Gaining orders through increased localization must be weighed against the impact on the fixed
cost in different manufacturing facilities and risks of sharing strategic IPRs.
The fact that increased localization will reduce the distance to the local OEMs and thus reduce cost
should also be considered. This is especially important since the OEMs are becoming increasingly
localized. However, when a decision about localizing is made Acme needs to be determined in their
decision-making in order to reap the full benefits of a localization of production. The FBU should
investigate the potential of localizing production of additional product1s in the City1 factory that
would allow for greater coordination in the product1 production. In order for the FBU to achieve a
competitive price level at the Indian product1 market and to be able to gain orders from local actors,
localization is recommended. With regard to localization proposals, it is important to stress that the
flexible City2 factory has a good fit with the production of product1 orders. In general, the majority
of the product1 types are recommended to be produced in the City2 plant with exceptions for high
volume types that are possible to coordinate with other application segments.
8.7.1.3 Factory Utilization
As identified in the analysis, the production planning must be improved in both the City2 and the
City1 sites in order to increase the utilization of the factories. At the City2 site the process to move
the manufacturing responsibility from the manufacturing department to the supply chain
department need to be accomplished in order to allow better production planning. It will also be
important to investigate and possibly increase the safety buffers of variance defining components in
the assembly. At the City1 site, the competence among Acme’s supply chain personnel needs to be
enhanced, preferably through further education. Furthermore, in the City2 factory it will be
important to continue with the work of closing down the old production channel in order to increase
the efficiency.
1. Higher volume by
coordinating
2. Lower product1
unit cost for all segments
3. Lower product1
unit cost for segment1
4. Lower product1
prices
5. Higher demand for
product1

90
8.7.1.4 Supplier Selection and Development
To reduce cost it will be important to work with the supplier base in both the City2 and the City1
factories. The main focus will be to work with the supplier base of component1s and component2s in
the City2 plant and the supplier base of steel for component1s and component2s in the City1 facility.
The reason for this is that component1 and component2 have the largest impact on the product1
price. In City2 it will be important to work with renewing the supplier base for component1s and
component2s and investigate the possibilities to reduce the number of suppliers to reduce cost. For
the City1 factory, it is more important to develop the current supplier base and their supply chain
and manufacturing capabilities.
8.7.1.5 Using Component1 from Steel Pipes
In order to reduce cost for the production of product1s, an option that should be explored is to
purchase component1s made from steel pipes at the City2 site. This option could be suitable for
product1 orders since the production method is likely to be cost efficient for production of small
quantity orders. However, the fact that the new solutions would need to be homologated could be
costly. This could however payoff in the long run because of the lower cost.
8.7.2 Relationship
Focusing and being decisive about specific strategic efforts will be necessary in order for the FBU to
strengthen relationships with OEMs. It will be important to improve the application engineering
capability in order to strengthen relationships in markets where the purchasing decisions are being
made. In China it will be important to increase both the amount and competence of application
engineers in order for Acme to become more diversified in their relationships and also to be able to
take advantage of the growth opportunities in the product1 segment. Increasing the competence of
the application engineers in China will be important for transferring the knowledge of the FBU’s
products and technology to China.
In Western Europe increasing the amount of application engineers will be important in order to
become more proactive in responding to orders. Here, the FBU should strive to have dedicated
application engineers placed at the OEMs’ main sites. In general it will be important for the
application engineers to communicate both with the OEMs and the operators. The FBU has not had
any communication with the operators in the past and by increasing the communication with these
actors the FBU could increase their aftermarket presence and also possibly induce demand from the
operators’ side in the OEM market.
In India, the FBU should focus on obtaining development orders from the local OEMs. However, the
Indian sales organization should also focus on establishing relationships with international OEMs that
localize in India. Simultaneously, the sales organizations at the exporting markets should be
responsive in case the international OEMs receive Indian product1 orders. Overall, the FBU’s sales
organizations’ focus should be more long-term. Non-current customers should be given higher
emphasis. The focus should initially be to obtain smaller orders in order to establish an active
relationship that could result in larger orders and long-term customers.
8.7.3 Reliability
The two capability adaptations that are considered to be most important for improving the FBU’s
reliability performance are to ensure more trustworthy deliveries and a product1 design that would
91
allow the product1 customers to perceive that the Acme product1s provide valuable operational
benefits.
8.7.3.1 Delivery Performance
The main focus for the FBU in order to improve their performance on the reliability key purchasing
criterion is to improve the delivery performance. Improving production planning, renewing the
supplier base as well as developing suppliers for component3 and component4, as mentioned earlier
for reducing cost, will also be important for achieving a more reliable production system.
Additionally, it will be necessary for the FBU to fully implement the production strategy at the City2
factory to deal with delivery performance issues.
8.7.3.2 Redesign of Product1s
The FBU should consider adapting the product1s’ design in order for the products to better fit the
product1 customers’ wants and needs. This could be done by conducting a design of experiment
project. Since an important feature is to prolong the maintenance intervals for segment1 operators,
designing a product1 that improves on this aspect should be done.
8.7.4 Final Remark
To conclude, the FBU does not have a natural strategic fit with the increasingly price driven product1
market since such a market preferably is served by a cost advantage rather than a differentiation
strategy. Hence the FBU must improve on the price criterion in order to increase their
competitiveness within the market. However, the FBU has an opportunity to undertake capability
adaptations that would allow for the organization to realize a more cost competitive market position.
However, the FBU should not strive to become the price leader but the focus should rather be to
achieve a “good enough” price level. This is also more realistic and in line with the current strategic
position. The FBU should focus on improving on the relational criteria by nurturing the current
relationships as well as developing new ones that will be important for sustaining and increasing
growth. In order to be perceived as an attractive partner it will also be vital to be perceived as a
reliable product1 supplier by continuously providing excellent product1 solutions in a timely manner.
Finally, in order to sustain and improve current Acme’s position within the product1 markets the firm
is recommended to undertake and investigate the proposal presented in this chapter.
92
9 Conclusions This thesis investigates how Acme, as a premium supplier, can enhance their competitiveness in the
product1 market by adjusting the price-performance balance in their offers. To gain an
understanding of how the business unit could increase their competitiveness, two research questions
were constructed around the following areas: First, the report focused on identifying the product1
markets for segment1 that were the most attractive from the FBU’s perspective. Secondly, the
strategic capabilities that needed to be adjusted in order for the FBU to increase their
competitiveness within the attractive product1 markets were identified.
The three product1 markets for segment1 that are considered to be the most attractive for the FBU
are presented below.
1. The Chinese product1 market
2. The Indian product1 market
3. The Western European product1 market
The product1 market for segment1 in China is considered to be the most attractive product1 market
since it is relatively large and has an appealing growth in combination with that the FBU has an
established local factory and supplies product1s that fits the customers’ key purchasing criteria fairly
well. The Indian product1 market for segment1 is considered to be the second most attractive since
it has great growth potential and it is in an early development phase. The Western European
product1 market for segment1 is attractive due to the market’s substantial size, Acme’s strong
position at the market and the fact that many of the product1 orders for product2s sold for export
are negotiated there.
In order for the FBU to gain improved market positions and enhanced competiveness at the focal
markets, the business unit must improve their relative performance on the OEM’s key purchasing
criteria. The key purchasing criteria are market dependent but it is possible to conclude that the
following three key purchasing criteria capture the OEMs’ demands on the focal markets:
1. Product1 price
2. Relationships with the OEMs
3. Reliability
The FBU has a weak performance on the price criterion on all of the focal markets, especially in India.
Furthermore, the FBU perform medium to good on the relationship criteria for the Chinese and
Western European product1 market. This is favorable for the product1s sold for India product2
orders as well, since several of the product2 orders are being supplied by export from these regions.
However, the FBU has relatively weak relationships with the OEMs in India locally. The performance
on the reliability criterion is good from a quality perspective but the customers’ overall perception is
negatively affected by the FBU’s weak delivery performance of product1 orders and technical
documentation.
The capabilities that relate to the FBU’s performance on the criteria price and reliability are to a large
extent business unit specific since these mainly are affected by the FBU’s value activities within
manufacturing and supply chain. Capability adaptations that improve the FBU’s performance on
these criteria will therefore benefit most of the markets. The capabilities that are related to the

93
relationship criterion are to a higher degree market specific. However, from a relationship
perspective there is still a notable degree of market interdependence due to the frequent occurrence
of export orders. Hence, to what degree capability adaptations of related to the relationship criterion
depend on the export characteristic of the market where the changes are conducted.
Based on this discussion the most critical adjustments that should be conducted within the FBU’s
business within a short term perspective1 are presented below2.
Coordinate the production of product1 type1 XX*YY*ZZ between the application segments
and factories [Price]
Improve the production planning in the City1 facility but especially at the City2 site [Price;
Reliability]
Evaluate and reselect suppliers of the input components component1 and component2
[Price] as well as of the input components component3 and component4 [Reliability]
Employ additional, and provide further education of, application engineers as well as locating
these close to the key OEMs’ production units [Relationships]
In the longer term perspective3 the FBU is recommended to realize projects that focus on the fields
presented underneath.
Localize production in India [Price; Relationship]
Redesign other product1s than the product1 type1 XX*YY*ZZ to allow for further
coordination of production [Price]
Improve the product1 design in order to increase the product1 maintenance interval
[Reliability]
The currently changing product1 market characteristic, where price to an increasingly extent is
emphasized, challenges the FBU as a premium supplier. Therefore it will be vital to undertake
actions, as the ones recommended, in order to reach a competitive price level. This is especially
important as the customers cannot obtain any substantial benefits from the FBU’s higher priced
product1s than their competitors. Simultaneously, the FBU needs to ensure timely deliveries and
should in the longer term utilize their engineering capabilities to develop features that actually
provide additional customer value. The FBU must improve their local presence of technical personnel
in the regions where the OEM procure their product1s. Also, the FBU should be more long-term
focused in their customer contacts and expand their sales organizations in order to have the capacity
to communicate the excess value FBU’s solutions actually provide.
The product1 market is developing and growing globally, especially in Asia. Acme has the
technological competence to follow the development on the market. However, the customers do not
benefit sufficiently from the firm’s products’ technical advancement for Acme’s premium price to be
motivated. Hence, Acme has a great challenge in tapping the market potential. However, by realizing
the proposed recommendations the firm will be in a better position to defend their current market
shares and seize the great market potential.
1 Short term is defined as within a two year period
2 The key purchasing criteria that relates to the capability adaption proposals are presented in brackets
3 Long term is defined as longer than two years but shorter than five years

94
10 References Aaker, D. & McLoughlin, D. (2010). Strategic market management: global perspectives. 1. ed.
Hoboken, N.J.: Wiley
Barney, J.B. (1986). Strategic Factor Markets: Expectations, Luck, and Business Strategy.
Management Science, vol. 32(10), pp. 1231-1241.
Barney, J.B. (1991). Firm Resources and Sustained Competitive Advantage. Journal of Management,
vol. 17(1), pp. 99-120.
Bryman, A. & Bell, E. (2011). Business research methods. 3. ed. Oxford: Oxford University Press
De Vaus, D. (2001). Research design in social research. London: SAGE
Cepeda, G. & Martin, D. (2005). A review of case studies publishing in Management Decision: Guides
and criteria for achieving quality in qualitative research. Management Decision, Vol. 43 Iss: 6, pp.851
– 876
Grant, R.M., (1991). The Resource-Based Theory of Competitive Advantage: Implications for Strategy
Formulation. California Management Review, vol. 33(3), pp. 114-135.
Grant, R.M. (2008). Contemporary strategy analysis. 6. ed. Oxford: Blackwell
Helfat, C.E. and Lieberman, M.B. (2002). The birth of capabilities: market entry and the importance of
pre-history. Industrial and Corporate Change, Vol. 11(4), pp. 725-760
Johnson, G., Scholes, K. and Whittington, R. (2008). Exploring corporate strategy. 8. ed. Harlow:
Financial Times Prentice Hall
Penrose, E.T. (1959). The theory of the growth of the firm. Oxford: Basil Blackwell
Philliber, S.G, Schwab, M. R. and Sam Sloss, G. (1980). Social Research: Guides to a Decision-Making
Process. Peacock Publishing.
Porter, M. E. (1980). Competitive strategy: techniques for analyzing industries and competitors. New
York: Free Press
Porter, M.E. (1981). The Contributions of Industrial Organization to Strategic Management. The
Academy of Management Review, Vol. 6(4), pp. 609-620.
Porter, M.E. (1985). Competitive advantage: creating and sustaining superior performance. New
York: Free Press
Prahalad, C.K. 1993. The role of core competencies in the corporation. Research Technology
Management, 36(6): 40-47.
Schilling, M. A. (2010). Strategic management of technological innovation. 3rd ed. Boston: McGraw-
Hill/Irwin
UN Population Division (2008) Panel 2: Urban agglomerations [online] Available at:
http://esa.un.org/unup/index.asp?panel=2 [Accessed: 2012-05-20]

95
Yin, R. K. (1981). The Case Study Crisis: Some Answers. Administrative Science Quarterly, Vol. 26 Iss.
1, pp. 58-65
Yin, R. K. (2003). Case study research: design and methods. 3 ed. Thousand Oaks: Sage Publications