
A Capacity Planning Process for Performance Assurance of Component-Based Distributed Systems
12
A Capacity Planning Process for Performance Assurance of Component-Based Distributed Systems * Nilabja Roy, Abhishek Dubey, Aniruddha Gokhale, Larry Dowdy Dept. of EECS, Vanderbilt University, Nashville, TN 37235, USA Contact: [email protected] ABSTRACT For service providers of multi-tiered component-based appli- cations, such as web portals, assuring high performance and availability to their customers without impacting revenue requires effective and careful capacity planning that aims at minimizing the number of resources, and utilizing them ef- ficiently while simultaneously supporting a large customer base and meeting their service level agreements. This paper presents a novel, hybrid capacity planning process that re- sults from a systematic blending of 1) analytical modeling, where traditional modeling techniques are enhanced to over- come their limitations in providing accurate performance estimates; 2) profile-based techniques, which determine per- formance profiles of individual software components for use in resource allocation and balancing resource usage; and 3) allocation heuristics that determine minimum number of re- sources to allocate software components. Our results illustrate that using our technique, perfor- mance (i.e., bounded response time) can be assured while reducing operating costs by using 25% less resources and in- creasing revenues by handling 20% more clients compared to traditional approaches. Categories and Subject Descriptors H.4 [Information Systems Applications]: Miscellaneous; D.2.8 [Software Engineering]: Metrics—complexity mea- sures, performance measures General Terms Theory, Algorithms, Performance * This work has been supported in part by NSF SHF/CNS Award #0915976. Any opinions, findings, and conclusions or recommendations expressed in this material are those of the author(s) and do not necessarily reflect the views of the National Science Foundation. Permission to make digital or hard copies of all or part of this work for personal or classroom use is granted without fee provided that copies are not made or distributed for profit or commercial advantage and that copies bear this notice and the full citation on the first page. To copy otherwise, to republish, to post on servers or to redistribute to lists, requires prior specific permission and/or a fee. ICPE’11, March 14–16, 2011, Karlsruhe, Germany. Copyright 2011 ACM 978-1-4503-0519-8/11/03 ...$10.00. Keywords Multi-tier applications, performance estimation, service de- ployment 1. INTRODUCTION A common requirement for large enterprise software sys- tems such as (e.g., eBay, Priceline, Amazon and Facebook), is high assurance of performance (e.g., response time) and service availability to their users. Without such assurances, service providers of these applications stand to lose their user base, and hence their revenues. High assurance of performance and availability to users in return for fees are typically specified as service level agree- ments (SLAs) between the user and the service provider. A straightforward approach to addressing the high assur- ance challenge is to over-provision resources which should be avoided due to increased costs. Addressing the high as- surance problem without unduly affecting revenues reduces to addressing the capacity planning problem that can honor the SLAs across the user base (which often is on the rise in case of social networking portals). Effective capacity planning requires an accurate under- standing of application behavior. One approach is to de- velop analytical models of the application that can estimate the resource requirements and performance of the applica- tion. It is important, however, that the analytical model be reflective of real system behavior since it dictates the per- formance assurance of the multi-tiered application. For example, if the model is optimistic, (i.e., it estimates the average response time lower than the actual), then the capacity planning will result in lesser resources causing re- source overloads and a violation of assurance of performance and availability. On the other hand if the model is pes- simistic (i.e., it estimates response times as higher than the actual), then the users will have assured performance but the system will use up more resources than actually needed, which is detrimental to the service provider. Prior work based on analytical techniques and profiling to build models of multi-tiered web portals [15,19,21,23,24] ex- ists but these efforts have not accounted for increased system activity, such as page-faults which occur with increased load, which is a frequent phenomenon. Moreover, the emerging trend towards multiple processors/cores has also not been considered by most of these works. Finally, resource allo- cation [6, 7], which is a key issue in capacity planning, has previously been investigated at the granularity of an entire tier-level. However most of modern multi-tiered systems are made up of finer-grained software components using com-
Transcript of A Capacity Planning Process for Performance Assurance of Component-Based Distributed Systems

A Capacity Planning Process for Performance Assuranceof Component-Based Distributed Systems ∗
Nilabja Roy, Abhishek Dubey, Aniruddha Gokhale, Larry DowdyDept. of EECS, Vanderbilt University, Nashville, TN 37235, USA
Contact: [email protected]
ABSTRACTFor service providers of multi-tiered component-based appli-cations, such as web portals, assuring high performance andavailability to their customers without impacting revenuerequires effective and careful capacity planning that aims atminimizing the number of resources, and utilizing them ef-ficiently while simultaneously supporting a large customerbase and meeting their service level agreements. This paperpresents a novel, hybrid capacity planning process that re-sults from a systematic blending of 1) analytical modeling,where traditional modeling techniques are enhanced to over-come their limitations in providing accurate performanceestimates; 2) profile-based techniques, which determine per-formance profiles of individual software components for usein resource allocation and balancing resource usage; and 3)allocation heuristics that determine minimum number of re-sources to allocate software components.
Our results illustrate that using our technique, perfor-mance (i.e., bounded response time) can be assured whilereducing operating costs by using 25% less resources and in-creasing revenues by handling 20% more clients comparedto traditional approaches.
Categories and Subject DescriptorsH.4 [Information Systems Applications]: Miscellaneous;D.2.8 [Software Engineering]: Metrics—complexity mea-sures, performance measures
General TermsTheory, Algorithms, Performance
∗This work has been supported in part by NSF SHF/CNSAward #0915976. Any opinions, findings, and conclusionsor recommendations expressed in this material are those ofthe author(s) and do not necessarily reflect the views of theNational Science Foundation.
Permission to make digital or hard copies of all or part of this work forpersonal or classroom use is granted without fee provided that copies arenot made or distributed for profit or commercial advantage and that copiesbear this notice and the full citation on the first page. To copy otherwise, torepublish, to post on servers or to redistribute to lists, requires prior specificpermission and/or a fee.ICPE’11, March 14–16, 2011, Karlsruhe, Germany.Copyright 2011 ACM 978-1-4503-0519-8/11/03 ...$10.00.
KeywordsMulti-tier applications, performance estimation, service de-ployment
1. INTRODUCTIONA common requirement for large enterprise software sys-
tems such as (e.g., eBay, Priceline, Amazon and Facebook),is high assurance of performance (e.g., response time) andservice availability to their users. Without such assurances,service providers of these applications stand to lose theiruser base, and hence their revenues.
High assurance of performance and availability to users inreturn for fees are typically specified as service level agree-ments (SLAs) between the user and the service provider.A straightforward approach to addressing the high assur-ance challenge is to over-provision resources which shouldbe avoided due to increased costs. Addressing the high as-surance problem without unduly affecting revenues reducesto addressing the capacity planning problem that can honorthe SLAs across the user base (which often is on the rise incase of social networking portals).
Effective capacity planning requires an accurate under-standing of application behavior. One approach is to de-velop analytical models of the application that can estimatethe resource requirements and performance of the applica-tion. It is important, however, that the analytical model bereflective of real system behavior since it dictates the per-formance assurance of the multi-tiered application.
For example, if the model is optimistic, (i.e., it estimatesthe average response time lower than the actual), then thecapacity planning will result in lesser resources causing re-source overloads and a violation of assurance of performanceand availability. On the other hand if the model is pes-simistic (i.e., it estimates response times as higher than theactual), then the users will have assured performance butthe system will use up more resources than actually needed,which is detrimental to the service provider.
Prior work based on analytical techniques and profiling tobuild models of multi-tiered web portals [15,19,21,23,24] ex-ists but these efforts have not accounted for increased systemactivity, such as page-faults which occur with increased load,which is a frequent phenomenon. Moreover, the emergingtrend towards multiple processors/cores has also not beenconsidered by most of these works. Finally, resource allo-cation [6, 7], which is a key issue in capacity planning, haspreviously been investigated at the granularity of an entiretier-level. However most of modern multi-tiered systems aremade up of finer-grained software components using com-
ponent based technology such as .NET, J2EE etc. Thusresource allocation using these finer grained components ispossible and might provide better results in minimizing thenumber of resources used.
This paper develops and presents a two-stage, design-time, hybrid capacity planning process that systematicallycombines the strengths of analytical modeling, profiling, andallocation heuristics in a novel framework called Modelingand Analysis using Queuing, Placement and Replication Opt-imizations (MAQ-PRO). The MAQ-PRO process hinges ona component-based structure of multi-tiered applications.
In the first stage, a profile-driven analytical model of thesystem is developed that can accurately estimate system per-formance even at high loads (which is a key factor that mustbe considered). The second stage uses this model as inputto a replication and allocation algorithm that computes adeployment plan for the software components, which mini-mizes and efficiently utilizes resources.
To showcase our approach, we use a running example ofa real-world, representative, multi-tiered component-basedsystem called Rice University Bidding System (RUBiS) [1].It is a prototype of an auction site that mimics eBay.
The rest of the paper is organized as follows: Section 2presents the two-stage process provided by the MAQ-PROframework; Section 3 presents an empirical validation of thereplication and placement algorithm for the RUBis web por-tal case study; Section 4 compares our work with relatedwork; and Section 5 presents concluding remarks.
2. MAQ-PRO PROCESSThis section details the MAQ-PRO process starting with
the problem description. Formally, we state the capacityplanning problem as follows: Suppose the multi-tiered ap-plication consists of a set of k services {S1, S2, ...Sk}. Eachservice is composed of software components, where a compo-nent Cij is the jth component in the ith service. The targetworkload is given by either the arrival rate, λ, for each ser-vice {λ1.....λk}, or the concurrent number, M , of customers{M1,M2, ....Mk}. The SLA gives an upper bound on theresponse times of each of the k services {RTsla,1...RTsla,k}.The objective is to find the minimum number of nodes todeploy the application on such that the SLA requirementsof users are honored (thereby providing high assurance ofperformance and availability) while ensuring that resourceusage is balanced.
We have developed a two stage framework called MAQ-PRO shown in Figure 1 to solve the capacity planning prob-lem. Two stages were deemed necessary since deploymentof components belonging to the services comprises of nodeallocation and balancing resource usage, which in turn de-pends on obtaining an estimate on the performance boundsof individual components. This dependency led us to sep-arate the process of performance estimation from that ofdeployment planning.
We envision capacity planners using the techniques de-veloped for Stage 1 to profile individual components anddetermining their resource requirements. Thereafter, differ-ent application scenarios can be analyzed, and using a baseperformance model, an application-specific analytical modelcan be developed that can accurately estimate the perfor-mance requirements of the system. In Stage 2, planners willuse this analytical model as input to a component placementheuristic we developed that will result in a deployment plan
Step 2:
Analyze
Application
Scenario
Step 3:
Base
Performance
Model
Step 4:
Component
Placement
Heuristic
Application
Specific Analytical
Model
Deployment
Plan
SLA
Bound
Target
Workload
Step 1:
Component
Profiles
Figure 1: The MAQ-PRO Process
which ensures minimum use of resources, which in turn pro-vides assurances of performance and availability to the users.
We will now describe the two stage MAQ-PRO processusing RUBiS as the guiding example. We consider threetypes of user sessions (visitor, buyer, and seller) providedby RUBiS, and a client-browser emulator for user behavior.
2.1 Stage 1: Estimating System Performance viaAnalytical Modeling
Component placement searches for the optimal/best com-bination of the components in the given nodes. Each partic-ular combination will influence the application performancesuch as response time. Thus the combination with the bestperformance and the least resource used should be chosen.However for a large system, finding out the performance ofevery component combination is hard. There needs to be ananalytical model which can accurately predict the applica-tion performance given any combination of the componentsin the machines.
Queuing theory enables the development of such perfor-mance models. The advantage of a queuing model is thatarmed with minimal profile data, it can estimate the perfor-mance characteristic of the application given any particu-lar combination of the components in the various machines.These estimates can then be used to select the best compo-nent placement. However, the performance estimation needto be very accurate. Otherwise, when the application is de-ployed and if there are errors in the performance estimationthen SLA bounds will be violated at production time.
2.1.1 Problem: Accuracy Of Performance Estima-tion Under Varying Hardware ConfigurationAnd Application Behavior
In,our previous work [10] we showed how a queuing modelused in related research [19, 21, 23, 24] does not provide ac-curate response time estimates when the client populationincreases.
To validate our claim, a multi-class closed queuing modelis developed for RUBiS as shown in Figure 2 for a scenariocomprising two machines. One machine acts as the jointweb server and business tier server while the other operatesas the database server.
A queue is modeled for each of the resources in the ma-chines, i.e., CPU and disk. Each service r provided by theapplication is mapped as a separate job class. The termsservice and class will be used interchangeably in the rest of

.
.
.
Client
Terminals
CPU
Disk Disk
Web Server/
Business TierDB Server
CPU
Figure 2: Queuing Model of RUBiS Scenario
Configuration Configuration DetailsConfiguration 1 Four 2.8 GHz Xeon CPUs, 1GB ram, 40GB HDDConfiguration 2 Quad Core 2.4 GHz Xeon CPUs, 4GB ram
Table 1: Machine Configurations Used
the paper. The main parameter to this model is the servicedemand of each component which is the resource time takento complete a single job. The basic function of a compo-nent comprising each service can be profiled to measure theservice demand of the component. Once the component isplaced in a given machine, the service demand of the com-ponent will be imposed on the devices of the machine.
The above queuing model is used to predict the responsetimes of various services of RUBiS under two different hard-ware configurations. The hardware configurations are givenin the Table 1:
Two sets of experiments are run in each machine config-uration, one when a single service is run another in whichmultiple services(class) are run. The former exhibits the per-formance of each component running in isolation while thelatter gives an idea of the effect of collocation of components.In both cases, we use the above queuing model to predictthe response time. The parameters (service demand) of thequeuing model depend upon the machines on which the ap-plication runs. The service demands are thus computed byprofiling each single component on the different machinesby running with a single client in the system. In previouswork[14], it was seen that CPU activity of RUBiS increaseswith load compared to memory and bandwidth which re-main fairly constant. Thus CPU is mainly considered here.
Figure 3a shows the response time when a single service ofRUBiS is run with Configuration 1. Similar behavior is alsoseen when multiple services are run, as shown in Figure 3.Here we reproduce two of the services “SearchByCategory”and“SearchByRegion”which have higher response times. Inthis experiment around 12 services are running each servicehaving 3 components. The other services also incur similarestimation errors.
Figures 4a, 4b, 4c show the response time of the sameabove services when multiple services are running togetherin Configuration 2. The model prediction is also shown.Strange behavior is seen in this experiment, as shown inFigure 4c where the CPU is only loaded till around 30%.After this point, as load increases the response time shootsup even though the CPU is underloaded. The memory andbandwidth also remains much below its capacity(not shownhere for lack of space). It is evident that there is some otherbottleneck in the system which causes the response time toshoot up. It could be due to software contention. The queu-ing model understandably cannot predict this behavior since
the ”invisible bottleneck” is not modeled. Thus it estimatesthe CPU utilization to increase with load while in reality itsaturates around 30% as shown in Figure 4c.
Finding the root cause of this bottleneck is hard since itmight require investigating immense amount of code and an-alyzing various scenarios. In a real world scenario it couldalso be caused by third-party libraries, the code for whichmay not be available. Stewart et. al. [16] discuss such ascenario where anomalies in an environment affect perfor-mance. In such a scenario, a basic queuing model becomesincreasingly erroneous and cannot be relied upon for properprediction.
A remedy would be to profile the system with differentworkload and create statistical regression models. But suchan approach will not help us in predicting the performancewhen components are arbitrarily placed in different combi-nations in the machines since this will require us to profilethe application using every combination of the componentswhich is clearly not possible. The next section details thesolution approach followed in this work.
2.2 Solution: Profile driven Regression based Ex-tended Closed Queuing Network
This section discusses the details of the modeling tech-niques developed by enriching basic closed queuing modelswith statistical regression models to come up with increasedaccuracy in estimating application performance.
In our approach we come up with the following steps toproduce better models: (a) Profile individual components,(b) Create regression models, and (c) Extend queuing mod-els with regression models
This helps us in estimating the performance of multiplecomponents running together in the same machine usingprofile data of individual components. On one hand it lever-ages the strength of regression models where unique scenar-ios or environmental effects are captured through profilingand on the other hand uses the strength of queuing modelswhich enables the performance estimation of multiple classes(or collocated components). The above approach ensuresthat the profiling is kept to no more than what is abso-lutely required and also leverage existing queuing models toestimate multi-component behavior which can be used forcomponent placement decisions.
2.2.1 Modeling Increased System Activity
The Figures 3a, 3b and 3c show that there is increased er-ror in model prediction at high load. This section discussesthe probable reasons for such error and comes up with solu-tions to address them.
Queuing models can be efficiently solved using approxi-mate Mean-Value Analysis (MVA) algorithm [9]. The mainequation that is used to compute response time is given by
R = Dir + ni ×Dir (1)
where Dir is the service demand of service r on device i andni is the number of waiting jobs on device i. The servicedemand gives the actual resource time used by a componentwhile processing the job. At high load, additional activity inthe machine due to system work including context switches,paging, swapping etc also adds to the response time. Thisexcess system activity is not accounted by Equation 1.
To further investigate this intuition we measure the num-ber of context switches that occur per second as client popu-

4000
6000
8000
10000
12000
Tim
e (
ms)
Actual
Model
0
2000
250 500 750 1000
Re
sp
on
se
Clients
(a) Single Service
200
300
400
500
600
700
800
onse
Tim
e (msec)
Actual
Model
0
100
200
250 400 650 750 900
Respo
Client
(b) Multi Service: SearchByRegion
200
300
400
500
600
700
nse
Tim
e (msecs)
Actual
Model
0
100
200
250 400 650 750 900
Respo
Clients
(c) Multi Service: SearchByCategory
Figure 3: Comparison of Analytical vs Empirical Data
1000
1500
2000
2500
onse
Tim
e (msec)
Actual
Model
0
500
250 500 750 900 1000
Respo
Clients
(a) Multi Service: SearchByRegion
600
800
1000
1200
1400
1600
1800onse
Tim
e (msec)
Actual
Model
0
200
400
250 500 750 900 1000
Respo
Client
(b) Multi Service: SearchByCategory
10
15
20
25
30
35
40
CPU
Util
Actual
Model
0
5
10
250 500 750 900 1000
Clients
ctua
(c) CPU Utilization
Figure 4: Comparison of Analytical vs Empirical Data In Configuration 2
lation is increased (measured using Configuration 1 as givenin Table 1). This data is plotted in Figure 5. It can be seenthat the number of context switches per second steadily in-creases with increase in client population. Since contextswitch is one type of system activity, it clearly shows thatthe amount of system activity increases with clients. Thechallenge now is to capture and quantify this increased sys-tem activity in terms of resource usage so that it can beadded to the MVA analysis which will then produce betterestimation of performance parameters.
Next we measure the total CPU utilization per job aswe increase client population. This measurement is doneby capturing the total CPU utilization for the lifetime ofthe experiment and dividing it by the total number of jobscompleted in the same interval. The observed total CPUutilization per job is shown in Figure 5 along with the con-text switches per sec. It is seen that the CPU utilizationper job steadily increases along with the number of contextswitches per sec and becomes steady after some time. Ini-tially, at very low load (single client) there is nearly zerocontext switch/sec. The CPU utilization/job is also veryless and matches with the service demand value. Conse-quently it can be deduced that as system activity increasesthe excess CPU utilization per job is due to additional sys-tem activity. Obviously such effect must be accounted for ina performance model. However, traditional queuing modelsdo not account for this behavior.
To overcome this limitation we define a term ”Overall Ser-vice Demand” (OSD) which is defined as the total resourcetime required to complete a single transaction. Thus theCPU utilization shown in Figure 5 is actually the OSD for
the concerned service. As shown in Figure 5 the OSD hasthe potential to vary with load since it is the sum of theservice demand and resource usage due to system activity.
Overall service demand (OSD) can be measured using theservice demand law [9]. The service demand law is given asDi = Ui/X whereDi is the service demand on the ith device,Ui is the utilization of the ith device, and X is the totalnumber of transactions/sec or throughput of the system.When the service demand law is used at high load it returnsthe OSD which is a sum of the service demand and theresource time spent due to system activity. The OSD canthus be obtained for different client population by measuringthe device utilization and the throughput of the serviceswhile client size is varied. The measured values are thenused with the above law to obtain the OSD.
We empirically profiled each service hosted by the RU-BiS web portal by varying the client size from an initialsmall value to a large value. Here we assume that indi-vidual components (services) of a large, multi-tiered systemare available for unit testing and profiling. We measured theprocessor usage and the number of successful calls for eachclient population size. The service demand law is then usedto compute the overall service demand for each client size.
As seen in Figure 5, the overall service demand remainssteady at low utilization (≤ 10) and then follows a near lin-ear increase till around 80% utilization or 350 clients. Thelinear rise can be attributed to the increase in system activ-ity as clients increase. Since each client represents a threadin RUBiS, consequently, an increase in the number of clientsincreases the number of threads.
This behavior is better understood from the number of

0
1000
2000
3000
4000
5000
6000
7000
8000
9000
0
10
20
30
40
50
60
70
80
90
ontext Switch/Sec
Job
(msec)
Overall Service
Demand
Context
Switches/sec
00
Co
CPU
Tim
e Per J
Clients
Figure 5: Overall Service Demand
context switches as utilization and clients increases. Thereis negligible context switching for low number of clients butincreases linearly with clients until 350 clients when it be-comes steady. At 350 clients, the service demand also stabi-lizes because the device (e.g., CPU) utilizations are close tosaturation (greater than 90%) and there is not much scopefor any increase in system activity. We have observed similarbehavior in the other services of RUBiS.
Based on these insights, the overall service demand ismodeled as a load-dependent function of processor utiliza-tion which is piecewise linear. To empirically obtain accu-rate demand functions, the Polyfit tool provided in the Mat-lab Curve Fitting Toolkit is used. The resulting functionwhich represents the overall service demand for the Search-ByRegion service is given by:
OSDsr(U) =
48 for U < 8
0.4264 × U + 45.1062 for 8 <= U <= 85
81.62 for U > 85
(2)and the function representing the service demand for theSearchByCategory service is given by:
OSDsc(U) =
28 for U ≤ 5
0.0457 × U + 24.94 for 5 <= U <= 84
52.06 for U ≥ 84
(3)The coefficient of determination, R2, value for the lin-
ear fit is 0.99 for both equations indicating very good fits.Capacity planners using MAQ-PRO should adopt a similarapproach to obtain accurate functions for overall service de-mands of individual services belonging to their applications.
The MVA algorithm used is now modified to include usageof the overall service demand instead of the original servicedemand which represents the actual resource time used bya transaction. Thus Equation 1 is replaced by the following:
R = OSDir(U) + ni ×OSDir(U) (4)
where OSDir is the overall service demand for the rth classon the ith device. So the single constant value of servicedemand is replaced by overall service demand which takesinto account the system activity in the machine. As the
2000
3000
4000
5000
6000
7000
one
Tim
e (msec)
Actual
Model
0
1000
2000
50 100 150 200 250 300 350 500
Respo
Clients
Figure 6: Response Time in Single Processor Ma-chine
200
300
400
500
600
700
onse
Tim
e (msec)
Model
0
100
200
250 400 650 750 900
Respo
Clients
Actual
Figure 7: Response Time in Multiple Processor Ma-chine
overall service demand increases with utilization, the num-ber on the device(ni) also increases and both controbute tothe response time to increase.
Using the above version of MVA, we validate the responsetime prediction of the model against actual measured re-sponse time under a single processor machine and is shownin Figure 6. It can be seen that for single processor ma-chines, our extended MVA can nicely approximate the re-sponse time.
2.2.2 Modeling Multiprocessor Effects
Due to the increasing availability and use of multi-processorsand multi-cores for large scale applications, such as web por-tals, existing closed queuing network models must modelmulti-processor effects on performance. We use the extendedversion of MVA explained in Section 2.2.1 to validate theprediction under hardware Configuration 1 as given in Ta-ble 1. Figure 7 compares the model estimation with empir-ical measurement and shows that there is still some gap inthe estimation which is investigated in this next section.
Typically multiple-server queuing models are solved byconsidering each multiple server as a load dependent server [9]and computing the probability mass function of the queuesizes for each server. The mass function can then be usedwithin MVA to calculate the total expected waiting timethat a customer experiences on a server. This approach,however, significantly increases the complexity of the MVAsolution. There have been attempts in recent research [17]in which a simple approximate method is presented that ex-tends MVA to analyze multiple-servers. In [17], the authorsintroduce the notion of a correction factor, which estimatesthe waiting time. When a transaction is executed on multi-processor machines, the waiting time for each transaction on

the processor is taken to be the product of a constant fac-tor, the service demand, and the average number of waitingclients as captured by the following formula:
R(N) = SD + c× SD × n (5)
where R(N) is the response time of a transaction when thereare a total of N customers in the system, SD is the servicedemand of the job, n is the average number of customerswaiting on the device, and c is the correction factor to com-pute the waiting time. In their work they theoretically com-pute the value of the correction factor. [17] also consid-ers a constant service demand and thus Equation 5 needto be adjusted by using Overall Service Demand instead ofservice demand to incorporate increased system activity athigh load. Equation 6 shows the revised version includingoverall service demand (OSD).
R(N) = OSD(U) + c×OSD(U) × n (6)
We surmise that such a correction factor will depend on anumber of factors, such as the domain of the operation, andthe service time characteristics for the underlying hardware,the cache hit ratio, memory usage levels, memory sharingetc. Therefore, the correction factor will vary with eachdifferent scenario and need to be profiled on the particularhardware. We now describe how we found the correctionfactor for the RUBiS example.
Capacity planners using the MAQ-PRO process shouldadopt a similar approach for their applications. The dataneeded to compute the correction factor can be extractedfrom the same experiments done to estimate the OSD asmentioned in Section 2.2.1. Thus there is no need to con-duct additional experiments and a single experiment willsuffice for both the OSD and the correction factor. Our ap-proach again is to profile individual components and thenestimate the expected performance when any combinationof the components are placed in the machines.
Referring to Equation 6, the value of the overall servicedemand OSD(U) can be found using the profile-based curvefitting approach explained in Section 2.2.1. The averagenumber of customers waiting on the CPU, n, is obtainedby using standard system monitoring tools. The responsetime for each transaction, R(N), can be obtained from theapplication logs or by time-stamping client calls. The onlyunknown in Equation 6 is the correction factor, c, which canbe obtained by solving the equation.
We ran a number of experiments for different classes of ser-vices supported by RUBiS with different client populationsizes and the variable n was monitored. R(N) was obtainedfrom the RUBiS logs. The load-dependent service demands,OSD(U), were obtained from Equations 2 and 3. The cor-rection factor was then computed using Equation 6, which ispresented in Table 2 for two different services in RUBiS for a4 processor machine. Figure 8 shows the comparison of theempirically obtained correction factor to the one proposedby Suri. It clearly shows that the actual correction factor ismuch different and depends upon the specific scenario.
Table 2 presents the experimental values and the compu-tation for the correction factor with different client popu-lation for the two main services in RUBiS. The inverse ofthe correction factor is given in the rightmost column of thetable. It is termed as CI . It can be seen that the correctionfactor varies with clients or processor utilization.
0.1
0.15
0.2
0.25
0.3
orrection
Factor
Empirical Correction
Factor Suri Correction
Factor
0
0.05Co
Utilization
Figure 8: Comparison of Empirical Correction Fac-tor with Suri Proposed
Service Clients Service Avg Response Corr. CIName Demand (msec) Waiting Time Factor CI
Search 100 51.71 2.00 54 0.022 45.16ItemsByReg 150 57.12 2 62 0.043 23.40
200 64.29 3 77 0.066 15.17250 71.4 5 103 0.089 11.29300 78.3 10 222 0.183 5.45350 80.78 40 909 0.256 3.90400 81.12 86 1968 0.27 3.69500 81.62 185 4232 0.275 3.64
Search 100 51 2 54 0.029 34.00ItemsByCat 150 31.25 2 34 0.044 22.73
200 33.45 2 37 0.053 18.85250 35.6 2 40 0.062 16.18300 38.38 3 47 0.075 13.36350 41.28 4 58 0.101 9.88400 43.16 5 73 0.138 7.23450 46.14 8 116 0.189 5.28500 50.88 34 513 0.267 3.74
Table 2: Correction Factors for Various Services
Since the correction factor actually represents the multi-processor effects on performance, it should be dependanton the number of processors in the machine. To validateour hypothesis, we configured the machine to use differentnumber of processors and repeated the experiment with 1and 2 processors, respectively. Figure 9 shows the value ofCI with clients for the service ”SearchByCategory”. Similarresults were obtained for other services but are not showndue to space constraints.
The value of CI is interesting. It has a very high valuewith less load but slowly converges to a steady value at highload. The steady value appears to converge to the numberof processors in the system. It can also be seen that thevariation in the factor increases with increase in processors.Higher values of CI (i.e., lower value of the correction factor)improves the response time as seen from Equation 6. Thisobservation indicates that the correction factor could alsobe indicative of the inherent optimizations such as cachingthat occur in the system.
This hypothesis needs further investigations and will be-come part of our future work. It also tells us that at highload there may not be much scope of optimization and thesystem behaves like a straightforward fluid flow system andcan be modeled using variations of fluid flow modeling tech-niques as done by many recent work. [3,8,12]
The value of CI for each client population is averagedover all the services. It is then approximated against pro-cessor utilization. A piecewise linear function is developedto express CI as a function of utilization which is calculatedusing polyfit function in Matlab and is given by

15
20
25
30
35
40
45
50
CI Value
4 Processor
2 Processor
1
0
5
10
50 100 150 200 250 300 350 400
Clients
Processor
Figure 9: Inverse of Correction Factor (CI)Algorithm 1: Modified Mean Value Analysis
Input:R Number of Job ClassesK Number of DevicesDi,r Service Demand for rth job class on ith device
Nr Number of clients for rth classUr Utilization of the rth deviceXr Throughput of the rth device
Output:Response Time R← vector containing response time for allclasses of jobs
1 begin
2 // Run initial MVA with lowest service demand3 while Error > ε do
4 // Initialization ....5 for r ← 1 to R do
6 for i← 1 to K do
7 Di,r = OSDi,r(Ur) // Call function for ServiceDemand with device utilization as parameter
8 Ri,r = Di,r × (1 + CI(Ur)× nr)
9 Xr = Nr
Zr+∑K
i=1Ri,r
10 // Error = Maximum Difference in Utilization betweensuccessive iterations
CI(U) =
−0.5632 × U + 38.75 for U <= 58
−0.1434 × U + 15.71 for 58 < U < 85
3.69 for U ≥ 85
(7)
Equation 7 is then used from within MVA algorithm tocompute the response time in each iteration.
2.2.3 Modifying Mean Value Analysis Algorithm
As described in Section 2.2.1, we develop a multi-classclosed queuing model for RUBiS as shown in Figure 2. Anapproximate MVA algorithm based on the Schweitzer [9]assumption can be used to solve this model and calculateperformance values, such as response time, number of jobs inthe system, and device utilizations for closed systems [9]. Wedeveloped an approximation to the original MVA algorithmas shown in Algorithm 1. Initialization details are not showndue to space constraints.
The algorithm starts by assuming that the clients areevenly balanced across all the devices and then adjusts theclients in the devices iteratively. In each iteration, the al-gorithm computes the number of clients on each device, re-sponse time, utilization and throughput of each job type.It continues this iteration until the error in the number ofclients in each device reduces below a given minimum.
30
40
50
60
70
80
U U
tilizati
on
DB_SRV
0
10
20
250 500 750 1000 1250
% C
PU
Clients
BT_SRV
Figure 10: CPU Utilization
The boldface parts shown are the places where the origi-nal MVA algorithm is modified to include the functions foroverall service demand and refined correction factor. Thefunction OSDi,r represents the service demand function forrth job class in the ith device while function CI(Ur) is theEquation 7. Both of these functions need device utilizationswhich is computed on every loop. They also need an utiliza-tion value which needs to be provided for the first iteration.For this reason, initially the first iteration is run using thelowest value of overall service demand for each service asgiven by Equations 2, 3 and the value of CI equal to thenumber of processors in the system.
2.3 Stage 2: Minimizing Resource Usage in Com-ponent Placement
Having developed accurate analytical models for the multi-tiered applications in Stage 1, the next task is to determinethe number of resources needed to host the components ofthe different services with a goal towards minimizing thenumber of resources.
To address the next problem, it is important to under-stand the client behavior. For example, different kinds ofclient actions and the services they use will determine theoverall workload on the multi-tiered application. Some ser-vices may impose more load compared to the others depend-ing on which ones are heavily used by the user population.Accordingly it may become necessary to deploy multipleinstances of the software components that implement thehighly loaded services so that the total load can be bal-anced between different instances. An important questionstems from determining which components need to be repli-cated for load balancing. This question must be accountedfor while minimizing the total number of resources neededfor all the components.
To highlight the need for load balancing, we reproduceFigure 10 from our earlier work [14] in which processor uti-lizations of two servers in RUBiS are shown. In the machineDB_SRV, only one component called SearchItemsByCat takesup 70% of processor time when the number of clients reachesaround 1,300. At the same time, the other machine shownby Line BT_SRV is loaded only upto 40%. Thus, there is animbalance in resource usage.
Resource allocation algorithms developed in prior research[6, 7, 14] cannot improve this situation since the single in-stance of component SearchItemsByCat takes up significantCPU. To overcome this limitation, a promising solution isto add a new instance of SearchItemsByCat component anddistribute the load between the two machines. Consequently,one of the components could then be placed onto BT_SRV so

Item Size % Slack0 - 5 5 - 10 10 - 15 15 - 20
0 - 30 34.84 97.96 99.97 1000 - 50 10.57 65.49 96.14 99.670 - 70 26.44 65.68 93.02 99.140 - 100 100 94.93 99.34 99.64
Table 3: Success Rate of Heuristics on SolvableProblems:Courtesy [13]
that the overall earlier load of 70+40 = 110 can be balancedacross the two servers (55 each). Such allocation makes itpossible to handle more clients since now the utilization ofboth servers can be increased to around 70.
This evidence suggests that by replicating individual com-ponents and controlling the distribution of load on a com-ponent, we can balance the resource requirement of compo-nents in various nodes and thus minimize use of resources.In the remainder of this section, we will refer to the per-centage resource required by a component as the size of thecomponent. The challenge now is to determine the size ofeach component that will help in balancing the load andminimizing resources, which is a non-trivial problem [20].
The problem becomes more acute when trying to deter-mine component placement at design-time, which requiremodels that can accurately estimate the component size aswell as performance of the overall application for a particularplacement. We leverage Stage 1 of the MAQ-PRO processto obtain accurate estimates for each component.
We present our technique for determining the replicationrequirements and placement decisions for software compo-nents in the context of the different services offered by RU-BiS. Capacity planners using MAQ-PRO should adopt sim-ilar stategy for their applications.
The lower bound on the total number of machines requiredfor a web portal like RUBiS can be calculated from the ex-pected processing power required in the following way:
#ofmachines = dLd/me <= OPT, (8)
where Ld is the total processing power required (sum ofthe CPU requirement of all the components) and m is thecapacity of a single machine. OPT is the optimal numberof bins required to fit the given items.
The problem of allocating the different components ontothe nodes is similar to a bin-packing problem [5]. The ma-chines are assumed to be bins while the components areitems, where the items need to be placed onto the bins. Itis well-known that the bin-packing problem is NP hard [20].Thus, popular heuristics like first-fit, best-fit or worst-fit [5]packing strategies must be employed to determine the al-location. It has been shown that these heuristics providesolutions which require (1.22 ∗OPT + 1) bins [5].
Our previous work [13] did an extensive study on the effec-tiveness of the different bin-packing heuristics under variousconditions. We found that the size of items used in packingmade a significant difference to the results generated by theheuristics as shown in Table 3. Here all quantities are men-tioned in terms of percentages, i.e., percentage of a singlebin size. So an item size of 20% means that the resourcerequirement of a component is 20% of the total CPU time.The table shows the probability of finding an allocation ofthe given items onto the bins with different values of slack(difference between total bin capacity and total of all packeditem sizes) and for different item size ranges.
For example, the entry of the third column and first row
is 97.96%. This means that if there are items sized between0 and 30% (row value) of bin size and slack between 5 to10% (column) of bin size, then the chance of finding an allo-cation is 97.96%. This also means that if the item sizes arekept between 0% and 30%, then the heuristics can find anallocation using up to around 10% more space than the totalitem sizes. Thus, the expected number of machines requiredwould be d1.1×Ld/me which is less than (1.22 ∗OPT + 1)as per Equation 8.
The above insights are used in the component replicationand allocation algorithm developed for this paper. Our al-gorithm requires that component sizes be kept within 30%which means the component resource requirement is keptwithin 30% of total processor time. We satisfy this require-ment by figuring out the number of clients that drive theutilization of the processor to 30% due to that componentand allowing only these many clients to make calls on a sin-gle component instance. Such an approach can easily beimplemented by a sentry at the server level that monitorsthe incoming user requests. Algorithm 2 describes the com-ponent replication and placement algorithm. It performs anumber of functions as follows:
• Capacity Planning: It computes the number of nodesrequired for a target number of customers while mini-mizing the number required.
• Load Balancing via Replication: It computes thenumber of replicas of each component needed to dis-tributed loads on the components and achieve balancedresource usage.
• Component Placement: It computes the mappingof the different components onto the nodes.
Algorithm 2 uses two subroutines, Placement and MVA.Placement places the components onto the machines by us-ing the worst-case bin packing heuristic since it is knownto balance load. MVA is the Mean Value Analysis algo-rithm that uses the enhanced analytical models developedin Stage 1 to accurately estimate performance characteristicsof a closed queuing network. It returns the response time ofthe different transaction classes along with the utilization ofeach component and each machine.
Initially, the algorithm starts with a default set of com-ponents needed for each service, uses a tiered deployment,and assumes a low number of clients, say, 100 (Line 7). A3-tiered deployment typically uses one machine per tier butAlgorithm 2 starts with 2 machines to attempt to fit the ap-plication in lesser machines. The components of each typeare placed in the respective machines. The algorithm startsby estimating the performance characteristics of the appli-cation and placing the different components onto the givenmachines (Lines 8 & 9).
Next, the algorithm enters an iterative loop (Line 11) in-creasing the number of clients with each iteration until thetarget number of clients is reached. At every iteration MVAis used to estimate the performance requirement (Line 12).If any component reaches 30% utilization (Line 13), thenanother instance of the component is created and initiallyplaced in the same machine as the original. Then MVA isinvoked to estimate performance and the components areagain placed onto the nodes. Similarly, if at any point theresponse time of any transaction reaches the SLA bound(Line 19), then another machine is added to the requirednode set and the placement heuristic is invoked. This iter-

Algorithm 2: Replication & Allocation
begin
// Initially, use 2 machines in a tiered deployment1
2 // All business logic components in first machine3
4 // Database in second machine, Default Deployment Plan DP5
6 P = 2 // Initially 2 machines7 N = init clients8 (RT,SU,U) = MVA (DP, N) // Compute Initial
Component Utilizations9 (DP) = Placement (SU, P) // Find a placement of the
components10
11 while N < Target do
12 (RT,SU,U) = MVA (DP, N)13 if ∃i : SUi > 30 then
14 Replicate (i); // Create New instance ofComponent i
15
16 // Place new component on same machine as i17 (RT, SU, U) = MVA (DP, N) // Calculate new
response time18 (DP) = Placement (SU, P) // Update
Deployment Plan
19 if ∃i : RTi > RTSLA then
20 // add new machine21 P = P + 122 (DP) = Placement (SU, P) // find new
placement
23 N += incr // Increase Clients for next iteration
ative process continues until the target number of clients isreached. Since the heuristic is one of the popular bin packingheuristics and the components are kept within a maximumof 30% resource utilization, it is ensured that near-minimumnumber of resources will be used.
3. EVALUATIONThis section presents results that evaluate the two stage
MAQ-PRO framework. The results are presented in the con-text of the RUBiS example along two dimensions: the accu-racy of the analytical models to estimate performance, andthe effectiveness of the resource allocation algorithm to mini-mize the resources required while supporting increased num-ber of clients, as well as balancing the utilization – which col-lectively are an indirect measure of high assurance in termsof performance and service availability to users.
3.1 Stage I Model Validation
Our analytical model have been enhanced by using equa-tions 2, 3 and 6. The training data used to develop theseequations is found by profiling each of the components sep-arately. While validating our model, we use performancedata when multiple components run together in the system.This will help us in understanding the prediction power ofour models given an arbitrary set of components running inthe same machine.
RUBiS has 10 service types for a typical browsing scenarioconsisting of item searches, user searches, viewing user com-ments, viewing bid history etc. Our objective is to check howwell our model predicts the response time of each of the ser-vice types and the processor utilization of the machine whenall such services are running. Each service is implementedusing multiple components thus our training data greatlydiffers from the validation data. Our training data consistsof performance measures when each single component runs
2
3
4
5
6
7
er
of
No
des
0
1
Nu
mb
ClientsMAQ 3-Tier
Figure 13: Node Usage in Tiered and MAQ-PRODeployments
while our validation data consists of performance measureswhen multiple components run together.
Figure 11a shows the response time estimated by our modelfor the service, ”SearchByRegion” using machine Configura-tion 1 as given in Table 1. The estimation of the otherservices are also similar. It can be seen that our enhancedmodel is in close agreement with the empirical measurementstill the number of clients equal to 900. Beyond that number,the error in our model increases slightly but still is close tothe actual result. The error in estimation at such high loadwill not effect the overall capacity planning process since thesystem is saturated at this stage with CPU utilization near-ing 90% and the operating region of the application need tobe below this value to ensure SLA compliance. Figure 11bcompares the CPU utilization predicted by the model ver-sus the empirically measured CPU utilization. It can beseen that the model is in agreement with the empirical datafor all client population size.
Figures 12a, 12b, 12c shows model estimation of the per-formance data in Configuration 2 using the extended mod-els. It can be seen that the performance predictions are quiteclose and there is very little error.
3.2 Effectiveness of the Stage II Placement Algo-rithm
We now present results measuring the effectiveness of theMAQ-PRO Stage 2 placement algorithm. The evaluationtests the merits as follows:1. Minimizing and Efficiently Utilizing Resources:
In a traditional tiered deployment, each tier is consideredatomic and hence all its functionality must be deployed to-gether. In contrast, for a component-based system whereservices are implemented by assembling and deploying soft-ware components, it is possible to replicate and distributeindividual components over the available resources. We ar-gue that this flexibility can make better usage of resourcescompared to a traditional tiered architecture.
Figure 13 presents a number of scenarios in which the al-gorithm was evaluated. It compares the number of machinesrequired to support a given number of clients for a range ofclient populations. Each client has a think time of mean7 seconds with exponential distribution. The service timesof the requests are also distributed exponentially. Even ifthe service times are non-exponential in the real world, theabove models will produce good results due to the robust-ness of closed non-product-form queuing networks. By ro-bustness, we imply that a major change in system parame-ters will bring about tolerable changes in computed param-eters [2].

1000
1500
2000
2500
onse
Tim
e (msec)
Actual
Model
0
500
250 400 650 750 900 1000
Respo
Clients
(a) SearchByRegion Response Time
30
40
50
60
70
80
90
100
ization
in
Percent
Model
Actual
0
10
20
250 400 650 750 900 1000
CPU
Util
Clients
Actual
(b) CPU Utilization
Figure 11: Model Validation for Configuration 1
600
800
1000
1200
1400
1600
1800
me
(m
sec)
Actual
0
200
400
250 500 750 900 1000
Response
Tim
Clients
Extended Model
(a) SearchByCategory Response Time
1000
1500
2000
2500
me
(msec)
Model
0
500
250 500 750 900 1000
Response
Ti
Clients
Actual
(b) SearchByRegion Response Time
10
15
20
25
30
35
ercent Util
Model
Actual
0
5
10
250 500 750 900 1000
CPU
Pe
Clients
(c) CPU Utilization
Figure 12: Model Validation for Configuration 2
Node UtilizationDeployment Response Time (msec) Node 1 Node 2 Node 3 Node 4
Tiered 270 51.06 79.08 17.47 78.86MAQ-PRO 353.5 87.32 57.41 65.04
Table 4: Response Time and Utilization
For every value of client population considered, the re-sponse time of the client requests remained within the SLA-prescribed bound of 1 second. It can be seen that for amajority of the cases our algorithm finds an allocation ofthe components that uses a reduced number of machinescompared to the traditional tiered deployment.
Table 4 shows the response times and the utilizations ofthe different processors for one such scenario with a totalclient population of 2, 000. A tiered deployment requires 4machines to serve 2, 000 clients, while MAQ-PRO requiresonly 3 machines – an improvement of 25%. The table clearlyshows that in the tiered deployment, Node 3 is mostly idle(17.47%utilized). MAQ-PRO identifies idle resources andintelligently places components resulting in a minimum ofidle resources.
Figure 14 shows the resulting allocation of the differentcomponents in the deployment of RUBis web portal usingMAQ-PRO Stage II. Using multiple instances of componentsand distributing them in an intelligent way helps in effectiveutilization of available resources.
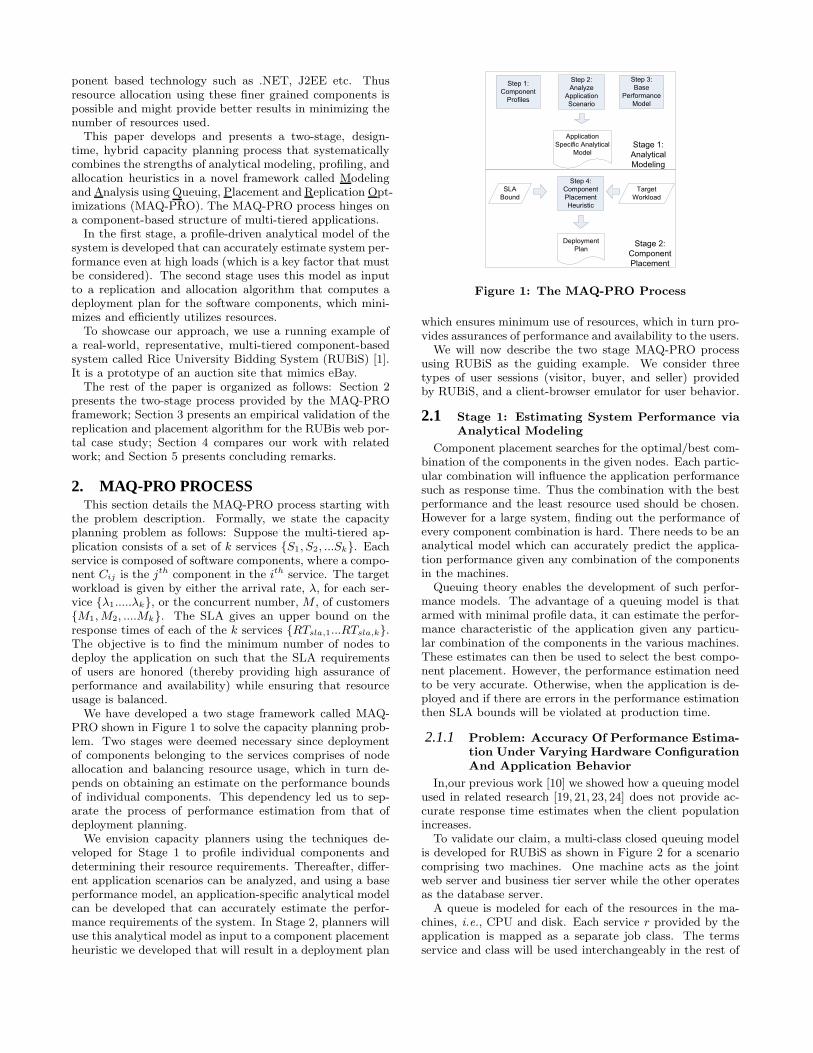
Figure 15 presents the coefficient of variance (CV) of theCPU usages for the three machines used in this experiment.It can be seen that the CV for the tiered deployment is
Search By
Category
Other
Components
Search By Region
Node 1 Node 2 Node 3
Figure 14: Component Placement : 2,000 Clients
much higher than the MAQ-PRO deployment. This signi-fies that the MAQ-PRO deployment uses the processors in amore balanced manner than the tiered deployment reinforc-ing our claim that MAQ-PRO effectively utilizes resources.The outcome is the ability of MAQ-PRO to handle moreincoming load while preventing a single node to become thebottleneck as long as possible.2. Handling Increasing Number of Clients:
OurMAQ-PRO algorithm also enables increasing the num-ber of clients handled using the same fixed number of ma-chines compared to a tiered architecture. This result can beachieved with a slight variation of Algorithm 2 where thenumber of nodes are fixed initially to some value. The algo-rithm terminates as soon as the response time reaches theSLA bound (which means that performance is assured).
Using the result of three nodes obtained in the previousresult, we conducted additional experiments. The allocationdecisions made by MAQ-PRO are used to place the compo-nents on the machines and the number of clients is gradually
0 1
0.15
0.2
0.25
0.3
0.35
0.4
0.45
ffic
ien
t o
f a
tio
n -
CP
U
iliz
ati
on
0
0.05
0.1
500 1000 1500 2000
Co
eV
ari
aU
t
ClientsTiered MAQ
Figure 15: Coefficent of Variation of Node Usage
increased till their response times reach a SLA bound of 1sec. In comparison, the tiered deployment is also used tohost the same number of clients.
Figure 16 shows the response time for both the tiereddeployment and the MAQ-PRO deployment. It can be seenthat the tiered deployment reaches a response time of 1 secat around 1,800 clients while the MAQ-PRO deploymentreaches a response time of 1 sec at around 2,150 clients.This result shows an improvement of 350 clients or around20% thereby providing an opportunity for service providersto increase their revenues.
400600800
100012001400160018002000
Resp
on
se
Tim
e(m
se
c)
Tiered
MAQ PRO
0200400
500 1000 1500 2000 2300
T
Clients
Figure 16: Response Time Comparison
4. RELATED WORKThis section compares MAQ-PRO against related work
along two dimensions.Analytical and Profile based Techniques: A large bodyof work on analytical techniques to model and estimate theperformance of multi-tiered internet applications exists. Forexample, [11, 19, 21, 23, 24] use closed queuing networks tomodel multi-tiered internet applications. These efforts typ-ically model an entire tier as a queue. Such models are alsousually service-aware, which allows system management de-cisions involving components and services to be executed.
In contrast, MAQ-PRO models the applications at thegranularity of a software component. The finer granularityhelps our heuristics to place components onto nodes so thatresource wastage is minimized. In addition, load dependentservice demands are used to model increased system activ-ity at high utilization levels. MAQ-PRO also presents amethod to model blocking effects due to database optimiza-tions [10]. This method ensures that the queuing modelsremain tractable while simultaneously improving the accu-racy of performance predictions.
Stewart et. al. [15] propose a profile-driven performancemodel for cluster based multi-component services. They usetheir model to perform system management and implementcomponent placement across nodes in the cluster. MAQ-PRO complements this work by modeling system activity,multiple processors/cores, and database optimizations. Italso uses a formalized queuing model to predict performance.
Application Placement Techniques: Karve et al. [6] andKimbrel et. al. [7] present a framework for dynamic place-ment of clustered web applications. Their approach con-siders multiple resources, some being load-dependent whileothers are load-independent. An optimization problem issolved which attempts to alter the component placement atrun-time when some external event occurs. Components aremigrated to respond to external demands.
Carrera et al. [4] design a similar system but they also pro-vide utility functions of applications mapping CPU resourceallocation to the performance of an application relative toits objective. Tang et al. [18] propose a placement algorithmwhich can be used with the MAQ-PRO performance modelsfrom Stage 1. Urgaonkar et. al. [22] identify resource needsof application capsules (components) by profiling them.Theyalso propose an algorithm for mapping the application cap-sules onto the platforms (nodes).
MAQ-PRO differs from these approaches in terms of itsworkload and performance models, and also in terms ofthe replication management strategy. MAQ-PRO defines aqueuing model and enhances it to consider application- andhardware-specific factors which influence the performance ofthe applications. The queuing model captures the interfer-ence due to multiple components being co-located together.Since MAQ-PRO is a strategizable framework, the place-ment algorithms in [6,7,18,22] can be plugged in.
None of the prior works above (except [19]) enforces ex-plicit performance bounds. MAQ-PRO maintains perfor-mance bounds through the use of SLAs. The placementof the components is thus attempted to maximize capacitywhile ensuring that the performance remains within speci-fied SLA bounds.
5. CONCLUDING REMARKSThis paper presented the MAQ-PRO process which is
a two stage framework comprising techniques to developprofile-based analytical models, and an algorithm for compo-nent replication and allocation for multi-tiered, component-based applications. The goal of the MAQ-PRO process ishigh assurance of performance and service availability tousers, while minimizing operating costs and potentially im-proving revenues to the service provider.
MAQ-PRO advocates a profiling method by which tra-ditional queuing models can be enhanced and made moreaccurate. The novel ideas include the use of load-dependentservice demands of individual services on the processor andcorrection factor for easily estimating multi-processor activ-ity. MAQ-PRO also provides a component replication andallocation algorithm which makes use of the above analyti-cal model in minimizing the number of resources used andbalancing their usage while meeting the target number ofclients and their SLA bounds. It is shown that by keepingthe resource utilization of each component within a certainthreshold such as 30% of CPU time, the resources can beutilized better.
We have used a running example of the RUBiS web por-tal to discuss the two stages of MAQ-PRO and discussed thesteps any capacity planner should undertake when applyingMAQ-PRO to their applications. In the context of RUBiS,MAQ-PRO was shown to have saved 25% resources whilesupporting 20% more load when compared to using tradi-tional modeling techniques all while providing high perfor-mance and availability assurances to users.

Our results indicate that the process to enhance tradi-tional queuing models with profiling based measurementshelped us to derive more accurate models. Since our ap-proach is profile-based, the empirical results depend uponthe software design, business logic, and underlying hard-ware. Thus the models developed for RUBis may not applydirectly to other projects. On the other hand such soft-ware behavior is common across many applications and ourprofiling techniques can be repeated on the concerned plat-form/projects to measure the required variables, and deriveenhanced analytical models.
Our future work will investigate the impact of resourcefailures and include fault tolerance. The MAQ-PRO dataand algorithm is available at http://www.dre.vanderbilt.edu/~nilabjar/MAQ-PRO.
6. REFERENCES[1] C. Amza, A. Ch, A. Cox, S. Elnikety, R. Gil,
K. Rajamani, and W. Zwaenepoel. Specification andImplementation of Dynamic Web Site Benchmarks. In5th IEEE Workshop on Workload Characterization,pages 3–13, 2002.
[2] G. Bolch, S. Greiner, H. de Meer, and K. Trivedi.Queueing networks and Markov chains: modeling andperformance evaluation with computer scienceapplications. Wiley-Interscience, NY, USA, 1998.
[3] A. Budhiraja and A. Ghosh. A large deviationsapproach to asymptotically optimal control ofcrisscross network in heavy traffic. Annals of AppliedProbability, 15(3):1887–1935, 2005.
[4] D. Carrera, M. Steinder, I. Whalley, J. Torres, andE. Ayguade. Utility-based placement of dynamic webapplications with fairness goals. In NetworkOperations and Management Symposium, 2008.NOMS 2008. IEEE, pages 9–16, April 2008.
[5] E. Coffman Jr, M. Garey, and D. Johnson.Approximation algos for bin packing: a survey. 1996.
[6] A. Karve, T. Kimbrel, G. Pacifici, M. Spreitzer,M. Steinder, M. Sviridenko, and A. Tantawi. Dynamicplacement for clustered web applications. InProceedings of the 15th international conference onWorld Wide Web, pages 595–604. ACM New York,NY, USA, 2006.
[7] T. Kimbrel, M. Steinder, M. Sviridenko, andA. Tantawi. Dynamic Application Placement UnderService and Memory Constraints. In Experimental AndEfficient Algorithms: 4th International Workshop,WEA 2005, Greece, May 10-13, 2005, Springer, 2005.
[8] S. Kumar and P. Kumar. Closed Queueing Networksin Heavy Traffic: Fluid Limits and Efficiency.Stochastic networks: stability and rare events, 1996.
[9] D. A. Menasce, L. W. Dowdy, and V. A. F. Almeida.Performance by Design: Computer Capacity PlanningBy Example. Prentice Hall PTR, Upper Saddle River,NJ, USA, 2004.
[10] A. G. Nilabja Roy and L. Dowdy. A Novel CapacityPlanning Process for Performance Assurance ofMulti-Tiered Web Applications. In Proceedings ofMASCOTS 2010, Miami Beach, FL, USA, Aug. 2010.
[11] G. Pacifici, W. Segmuller, M. Spreitzer, M. Steinder,A. Tantawi, and A. Youssef. Managing the responsetime for multi-tiered web applications. IBM TJ
Watson Research Center, Yorktown, NY, Tech. Rep.RC23651, 2005.
[12] E. Pekoz and J. Blanchet. Heavy Traffic Limits ViaBrownian Embeddings. Probability in the Engineeringand Informational Sciences, 20(04):595–598, 2006.
[13] N. Roy, J. S. Kinnebrew, N. Shankaran, G. Biswas,and D. C. Schmidt. Toward Effective Multi-capacityResource Allocation in Distributed Real-time andEmbedded Systems. In Proceedings of the 11thISORC), Orlando, Florida, May 2008. IEEE.
[14] N. Roy, Y. Xue, A. Gokhale, L. Dowdy, and D. C.Schmidt. A Component Assignment Framework forImproved Capacity and Assured Performance in WebPortals. In Proceedings of the DOA 2009, pages671–689, Nov. 2009.
[15] C. Stewart and K. Shen. Performance modeling andsystem management for multi-component onlineservices. In Proceedings of the 2nd conference onSymposium on Networked Systems Design &Implementation-Volume 2 table of contents, pages71–84. USENIX Association Berkeley, CA, USA, 2005.
[16] C. Stewart, K. Shen, A. Iyengar and J. Yin.EntomoModel: Understanding and AvoidingPerformance Anomaly Manifestations. In Proceedingsof International Symposium of Modeling, Analysis,and Simulation of Computer Systems, pages 3–13.IEEE Computer Soc, Los Alamitos, CA, USA, 2010.
[17] R. Suri, S. Sahu, and M. Vernon. Approximate MeanValue Analysis for Closed Queuing Networks withMultiple-Server Stations. In Proceedings of the 2007Industrial Engineering Research Conference. 2007.
[18] C. Tang, M. Steinder, M. Spreitzer, and G. Pacifici. Ascalable application placement controller for enterprisedata centers. In Proceedings of the 16th internationalconference on World Wide Web, page 340. ACM, 2007.
[19] B. Urgaonkar, G. Pacifici, P. Shenoy, M. Spreitzer,and A. Tantawi. An Analytical Model for Multi-tierInternet Services and its Applications. SIGMETRICSPerform. Eval. Rev., 33(1):291–302, 2005.
[20] B. Urgaonkar, A. Rosenberg, P. Shenoy, andA. Zomaya. Application Placement on a Cluster ofServers. International Journal of Foundations ofComputer Science, 18(5):1023–1041, 2007.
[21] B. Urgaonkar, P. Shenoy, A. Chandra, and P. Goyal.Dynamic provisioning of multi-tier internetapplications. In Autonomic Computing, 2005.International Conference on, pages 217–228, 2005.
[22] B. Urgaonkar, P. Shenoy, and T. Roscoe. Resourceoverbooking and application profiling in a sharedInternet hosting platform. ACM Transactions onInternet Technologies (TOIT), 9(1):1–45, 2009.
[23] Q. Zhang, L. Cherkasova, G. Mathews, W. Greene,and E. Smirni. R-capriccio: a capacity planning andanomaly detection tool for enterprise services with liveworkloads. In Middleware ’07: ACM/IFIP/USENIX2007 International Conference on Middleware, pages244–265, New York, NY, USA, 2007. Springer-VerlagNew York, Inc.
[24] Q. Zhang, L. Cherkasova, N. Mi, and E. Smirni. Aregression-based analytic model for capacity planningof multi-tier applications. Cluster Computing,11(3):197–211, 2008.


![[MS-DCOM]: Distributed Component Object Model (DCOM ... · Distributed Component Object Model (DCOM) Remote Protocol Intellectual Property Rights Notice for Open Specifications Documentation](https://static.fdocuments.in/doc/165x107/5fdba3cd05dc383f48384267/ms-dcom-distributed-component-object-model-dcom-distributed-component-object.jpg)


