A Capability Maturity Model to Assess Supply Chain Performamce
190
Florida International University FIU Digital Commons FIU Electronic eses and Dissertations University Graduate School 10-29-2008 A Capability Maturity Model to Assess Supply Chain Performamce Heriberto Garcia Florida International University, hgarc007@fiu.edu Follow this and additional works at: hp://digitalcommons.fiu.edu/etd Part of the Operations Research, Systems Engineering and Industrial Engineering Commons is work is brought to you for free and open access by the University Graduate School at FIU Digital Commons. It has been accepted for inclusion in FIU Electronic eses and Dissertations by an authorized administrator of FIU Digital Commons. For more information, please contact dcc@fiu.edu. Recommended Citation Garcia, Heriberto, "A Capability Maturity Model to Assess Supply Chain Performamce" (2008). FIU Electronic eses and Dissertations. Paper 191. hp://digitalcommons.fiu.edu/etd/191
Transcript of A Capability Maturity Model to Assess Supply Chain Performamce

Florida International UniversityFIU Digital Commons
FIU Electronic Theses and Dissertations University Graduate School
10-29-2008
A Capability Maturity Model to Assess SupplyChain PerformamceHeriberto GarciaFlorida International University, [email protected]
Follow this and additional works at: http://digitalcommons.fiu.edu/etd
Part of the Operations Research, Systems Engineering and Industrial Engineering Commons
This work is brought to you for free and open access by the University Graduate School at FIU Digital Commons. It has been accepted for inclusion inFIU Electronic Theses and Dissertations by an authorized administrator of FIU Digital Commons. For more information, please contact [email protected].
Recommended CitationGarcia, Heriberto, "A Capability Maturity Model to Assess Supply Chain Performamce" (2008). FIU Electronic Theses and Dissertations.Paper 191.http://digitalcommons.fiu.edu/etd/191

FLORIDA INTERNATIONAL UNIVERSITY
Miami, Florida
A CAPABILITY MATURITY MODEL TO ASSESS
SUPPLY CHAIN PERFORMANCE
A dissertation submitted in partial fulfillment of the
requirements for the degree of
DOCTOR OF PHILOSOPHY
in
INDUSTRIAL AND SYSTEMS ENGINEERING
by
Heriberto Garcia
2009

ii
To: Dean Amir Mirmiran College of Engineering and Computing
This dissertation, written by Heriberto Garcia, and entitled A Capability Maturity Model to Assess Supply Chain Performance, having been approved in respect to style and intellectual content, is referred to you for judgment. We have read this dissertation and recommend that it be approved.
____________________________________________ Syed M. Ahmed
____________________________________________
Shih-Ming Lee
____________________________________________ Martha A. Centeno
_____________________________________________
Ronald E. Giachetti, Major Professor Date of Defense: October 29, 2008 The dissertation of Heriberto Garcia is approved.
____________________________________________ Dean Amir Mirmiran
College of Engineering and Computing
____________________________________________ Dean George Walker
University Graduate School
Florida International University, 2009
iii
© Copyright 2009 by Heriberto Garcia
All rights reserved.

iv
DEDICATION
To God, whom I serve and love.
To my family, source of love and inspiration. Thanks for your love and support
through this endeavor. Thanks for helping me to be a better spouse, father and friend for
you.
To my parents, who gave me the education required to be successful in the life.
To my brothers and sisters, for all your love and support during all these years.
v
ACKNOWLEDGMENTS
Thanks to the members of my dissertation committee. Dr. Ronald E. Giachetti, Major
Professor, thanks for all your support, advice, patience, and help through this work. I
learned from you how to conduct a PhD research. Dr. Martha A. Centeno, thanks for
introducing me into the world of research. I enjoyed your lectures and all the talks we had
prior to defining my dissertation topic. Dr. Shih-Ming Lee, thanks for believing in me
since the first day we met. I enjoyed the opportunity of teaching for a couple of
semesters. Dr. Syed M. Ahmed, thanks for all your contributions as a member of my
committee during this dissertation work.
My everlasting gratitude to my brothers and sisters in Miami, thanks for giving me so
much help during my years as a PhD student. Thank you for sharing your lives with me
and my family, and always being there for me.

vi
ABSTRACT OF THE DISSERTATION
A CAPABILITY MATURITY MODEL TO ASSESS
SUPPLY CHAIN PERFORMANCE
by
Heriberto Garcia
Florida International University, 2009
Miami, Florida
Professor Ronald E. Giachetti, Major Professor
In an overcapacity world, where the customers can choose from many similar
products to satisfy their needs, enterprises are looking for new approaches and tools that
can help them not only to maintain, but also to increase their competitive edge.
Innovation, flexibility, quality, and service excellence are required to, at the very least,
survive the on-going transition that industry is experiencing from mass production to
mass customization.
In order to help these enterprises, this research develops a Supply Chain Capability
Maturity Model named S(CM)2. The Supply Chain Capability Maturity Model is
intended to model, analyze, and improve the supply chain management operations of an
enterprise. The Supply Chain Capability Maturity Model provides a clear roadmap for
enterprise improvement, covering multiple views and abstraction levels of the supply
chain, and provides tools to aid the firm in making improvements. The principal research
tool applied is the Delphi method, which systematically gathered the knowledge and
experience of eighty eight experts in Mexico. The model is validated using a case study
and interviews with experts in supply chain management. The resulting contribution is a
vii
holistic model of the supply chain integrating multiple perspectives, and providing a
systematic procedure for the improvement of a company’s supply chain operations.
viii
TABLE OF CONTENTS
CHAPTER PAGE I. INTRODUCTION ..................................................................................................... 1
1.1 Pivotal Improvement Tools, Techniques and Methodologies .................... 5 1.2 Problem Statement ...................................................................................... 8 1.2.1 Problem 1: Modeling of the supply chain ............................................. 10 1.2.2 Problem 2: Selecting System Improvement Strategies ......................... 12 1.2.3 Problem 3: Integrating the SCM and the core business orientation ...... 14 1.2.4 Problem 4: Problem Summary .............................................................. 16
1.3 Goal and Specific Objectives .................................................................... 16 1.4 Research Methodology ............................................................................. 18
II. LITERATURE REVIEW ........................................................................................ 20
2.1 Enterprise Modeling Frameworks and Architectures. .................................... 21 2.1.1 The IDEF Language .............................................................................. 22 2.1.2 The GRAI Integration Methodology (GIM) ......................................... 23 2.1.3 The Zachman’s framework ................................................................... 24 2.1.4 The Purdue Enterprise Reference Architecture (PERA) ...................... 25 2.1.5 The CIMOSA Framework .................................................................... 27 2.1.6 The GERAM Framework ..................................................................... 29 2.1.7 Conclusions About the Enterprise Reference Architectures ................. 30
2.2 Supply Chain Models and Architectures. ....................................................... 32 2.2.1 Stevens’ Model ..................................................................................... 32 2.2.2 An Integrated Supply Chain Management Architecture ....................... 34 2.2.3 Enterprise Architecture for Supply Chain Integration .......................... 35 2.2.4 Architecture for Supply Chain Integration ........................................... 38
2.3 The Supply Chain Operations Reference (SCOR) .......................................... 42 2.4 A Supply Chain Maturity Model .................................................................... 45 2.5 Measuring the supply chain ............................................................................ 46 2.6 Best Practices from other disciplines applied to Supply Chain ...................... 49
III. RESEARCH METHODOLOGY ............................................................................ 53
3.1 The Delphi Method as a research tool ...................................................... 55 3.2 Methodology used to get the Meta-Model Conceptualization .................. 58 3.3 Detailed Description of Stage I ................................................................. 59 3.4 Detailed Description of Stage II ............................................................... 64 3.5 Detailed Description of Stage III .............................................................. 68
IV. STAGES RESULTS ................................................................................................ 72
4.1 Qualification of the Experts for Stage I .................................................... 72 4.2 Summary of the Results for Stage I ......................................................... 73 4.2.1 Characterization of each Maturity Level .............................................. 74 4.2.2 Prioritization of the Key Improvement Factor in a Supply Chain ........ 76
4.3 Qualification of the Experts for Stage II ................................................... 78

ix
4.4 Summary of the Results for Stage II ......................................................... 80 4.4.1 Validation of the Maturity Level: Undefined ....................................... 81 4.4.2 Set of Useful Improvement Tools for the Undefined Level ................. 82 4.4.3 Validation of the Maturity Level: Defined ........................................... 83 4.4.4 Set of Useful Improvement Tools for the Defined Level ..................... 84 4.4.5 Validation of the Maturity Level: Manageable ..................................... 84 4.4.6 Set of Useful Improvement Tools for the Manageable Level ............... 85 4.4.7 Validation of the Maturity Level: Collaborative .................................. 86 4.4.8 Set of Useful Improvement Tools for the Collaborative Level ............ 87 4.4.9 Validation of the Maturity Level: Leading ........................................... 88 4.4.10 Set of Useful Improvement Tools for the Leading Level ..................... 89
V. THE SUPPLY CHAIN CAPABILITY MATURITY MODEL .............................. 90
5.1 Definition of the Views and Abstraction Levels in the S(CM)2 ............... 90 5.2 The Integration of the S(CM)2 .................................................................. 94 5.2.1 The S(CM)2 in a Tableau Form ............................................................ 95 5.2.2 The S(CM)2 in a graphical Form .......................................................... 98
5.3 Verification of the S(CM)2 ........................................................................ 99 5.4 Validation of the S(CM)2 ........................................................................ 104 5.4.1 Experts’ Validation of the S(CM)2 ..................................................... 104 5.4.2 Case Study Results .............................................................................. 107
5.5 The Pilot Test of the S(CM)2 .................................................................. 111
VI. THE ASSESSMENT METHODOLOGY OF THE S(CM)2 ................................ 128 6.1 The Generalization of the Supply Chain Classification .......................... 128 6.2 The Supply Chain Assessment Process .................................................. 130
VII. CONCLUSIONS AND FUTURE WORK ............................................................ 133
7.1 Research Contribution ............................................................................ 134 7.2 Extension to this Work ............................................................................ 136
REFERENCES ............................................................................................................... 137
APPENDICES ................................................................................................................ 146
VITA ............................................................................................................................... 176

x
LIST OF TABLES
TABLE PAGE
Table 1: Comparison among Supply Chain Architectures. .............................................. 41
Table 2: Type of Business Represented in the Stage I ...................................................... 73
Table 3: Positions Represented in the Stage I ................................................................... 73
Table 4. Principal Findings of the Stage I......................................................................... 74
Table 5: Characterization of each Maturity Level ............................................................ 74
Table 6: List of Key Improvement Factors ....................................................................... 76
Table 7: Prioritization of Improvement Factors for Maturity Level ................................. 77
Table 8: Key Improvement Factor for each Maturity Level ............................................. 78
Table 9: Experts’ Years of Experience ............................................................................. 79
Table 10: Type of Business Represented in the Stage II .................................................. 79
Table 11: Positions Represented in Stage II ..................................................................... 80
Table 12: Comparison of Reference Models .................................................................... 99
Table 13: Comparison Between Porter’s Model and the S(CM)2 ................................... 102
Table 14: Information of the Experts consulted to Validate the S(CM)2 ....................... 105
Table 15: Answers Obtained Through the Validation Sheet .......................................... 106
Table 16: Expected Answers for the Case Study ............................................................ 108
Table 17: Results of the Case Study ............................................................................... 110
Table 18: Distribution of the Case Study Answers ......................................................... 111
Table 19: Assessment Questionnaire for the view Suppliers .......................................... 113
Table 20: Assessment Questionnaire for the view Production ....................................... 116
Table 21: Assessment Questionnaire for the view Inventory Systems ........................... 118

xi
Table 22: Assessment Questionnaire for the view Customers ........................................ 120
Table 23: Assessment Questionnaire for the view Human Resources ........................... 122
Table 24: Assessment Questionnaire for the view Info. Sys. & Technology ................. 123
Table 25: Assessment Questionnaire for the view Performance Measurement ............. 125

xii
LIST OF FIGURES
FIGURE PAGE
Figure 1: Supply Chain Macro-Level Representation ........................................................ 4
Figure 2: Linear Supply Chain Conceptualization ............................................................ 11
Figure 3: Example of an IDEF0 Model ............................................................................ 22
Figure 4: GIM Modeling Framework and Conceptual Model .......................................... 23
Figure 5: Zachman’s Framework for Enterprise Architecture .......................................... 25
Figure 6: Models and tools involved in the PERA Life-cycle .......................................... 26
Figure 7: Definition of the Concepts for the Manufacturing Case ................................... 27
Figure 8: CIMOSA Modeling Framework ....................................................................... 28
Figure 9: GERA, the Reference Architecture of GERAM ............................................... 30
Figure 10: Stevens’ model of Supply Chain Integration .................................................. 33
Figure 11: Integrating and Managing Business Processes across the Supply Chain ........ 35
Figure 12: Member Enterprise Value Analysis (Chandra and Kumar, 2001) .................. 36
Figure 13: A Collaborative Supply Chain Member Architecture ..................................... 37
Figure 14: Architecture for an Integrated Supply Chain Enabling IT .............................. 39
Figure 15: The SCOR Model-Based Supply Chain Infrastructure ................................... 42
Figure 16: The Business Process Orientation Maturity Model ......................................... 46
Figure 17: Research Methodology Diagram ..................................................................... 59
Figure 18: Diagram Flow for Stage I ................................................................................ 60
Figure 19: Diagram Flow for the Stage II ......................................................................... 65
Figure 20: Diagram flow for stage III ............................................................................... 69
Figure 21: Acceptance of the Definition for the Undefined Level ................................... 82

xiii
Figure 22: Acceptance of the Definition for the Defined Level ....................................... 84
Figure 23: Acceptance of the Definition for the Manageable Level ................................ 85
Figure 24: Acceptance of the Definition for the Collaborative Level .............................. 87
Figure 25: Acceptance of the Definition for the Leading Level ....................................... 88
Figure 26: Views and Abstraction Levels for the S(CM)2 ................................................ 94
Figure 27: The Supply Chain Capability Maturity Model Framework ............................ 95
Figure 28: Example of a Maturity Level of S(CM)2 in Tabular Form .............................. 96
Figure 29: Example of a Maturity Level of S(CM)2 in Tabular Form (b) ........................ 97
Figure 30: The Graphical Representation of the S(CM)2 ................................................. 98
Figure 31: The Porter’s Chain Value .............................................................................. 102
Figure 32: View Customer, Level Manageable .............................................................. 108
Figure 33: Radar Graph for the View Suppliers ............................................................. 115
Figure 34: Maturity Levels for each view Assessed ....................................................... 127
Figure 35: Supply Chain Assessment Report ................................................................. 129
Figure 36: The S(CM)2 Assessment Methodology ......................................................... 130
Figure 37: Assessment Sheet for the S(CM)2 ................................................................. 132

1
CHAPTER I
INTRODUCTION
In an overcapacity world, where customers have many similar products to satisfy
their needs, enterprises are looking for new approaches and tools that can help them not
only to maintain, but also to increase their competitive edge. Companies like Wal-Mart,
Dell, Toyota, and Southwest Airlines are constantly seeking new methods and tools to
allow their processes to be faster, cheaper and better than those of their competitors
(Hammer, 2002). ERP systems, Supply Chain Management (SCM), Logistic, Value-
based Management, Lean Manufacturing, Six Sigma, and Balance Scorecard are among
the strategic concepts that have been frequently used to improve competitiveness
(Hammer, 2002b). However, these concepts have not provided a comprehensive
perspective of the enterprise; they rather tend to focus on a single perspective or portion
of the enterprise.
These partial views are not unexpected, given the fact that solutions to company’s
problems are frequently initiated at the department level. Not until the 1990’s did many
companies have the technological means to develop methods and tools with a more
holistic view. Now, companies need to rethink their vision about their principal market
strategy. Customers have become more demanding, and they seek the “latest” product or
service at a low price, at the right place, at the right time, and with the highest quality in
the market (Chin et al. 2004). Thus, innovation, flexibility, quality, and service
excellence are required to, at the very least, survive the on-going transition that industry
is experiencing from mass production to mass customization (Caputo et al. 2003).

2
Engaging in holistic enterprise modeling and analysis requires great investment,
cultural change, and a very deep commitment from the improvement project owner.
Moreover, the amount of information needed for a holistic view must be considered
carefully because, if it is not controlled, it may drown the vision itself. Thus, it is
important to develop methodologies and tools that enable enterprise modeling by
capturing the relationships that exist among subsystems.
Previous efforts have mostly been partial views, and the very few that tried a more
integrated approach have failed because they needed a lot of time to model the system,
validate the model, and analyze the results obtained (Chan et al. 2002). Nevertheless, the
need for holistic modeling and analysis is real and critical. There is a need to move the
approaches, which use partial views, toward holistic methodologies using cross-
disciplinary integrated views (Svensson, 2003). This research contributes to satisfying
the need of a holistic enterprise modeling methodology, which is an enterprise
representation useful to analyze, improve, and document the enterprise processes through
several views, decomposition levels and disciplines.
This research develops a Supply Chain Capability Maturity Model, hereafter
abbreviated S(CM)2. The S(CM)2 is intended to model, analyze, and improve supply
chain management operations for an enterprise, which is part of one or several supply
chains. Regarding the definition of a supply chain, so far, there is no unique definition
supply chain. A supply chain may be defined in terms of management processes,
operations, functions or a management philosophy (Tyndall et al. 1998).

3
Depending on functions, organizations, and industries, the complexity of a supply
chain leads to different points of analysis and definitions of what supply chain
management (SCM) is. This situation creates a lack of standard terminology and
improvement opportunities in terms of which the key performance indicators within a
supply chain system are (Kasi, 2005). At the same time, this lack of a standard definition
creates a dangerous ambiguity when a supply chain is analyzed. Excluding important
supply chain processes in the definition may create a bias in the analysis and modeling of
the system, and in how the implementation of improvement approaches may influence
enterprise strategy and performance (Mentzer et al. 2001).
One of the many Supply Chain Management definitions is the one provided by La
Londe and Masters (2004), “A Supply Chain is a set of independent firms of retailers,
transportation companies, suppliers, and wholesalers passing materials forward by
manufacturing a product and placing it in the hands of a customer.” In other words, SCM
is an integrating function, which links major business functions and business processes
within and across an enterprise to achieve a higher performance for all involved parties.
At a macro level, a supply chain can be represented as shown in Figure 1, in which it is
easy to see that a supply chain is an integrated economic and operational system, with
bidirectional links to corporate strategies. Additionally, an enterprise might be part of
many supply chains generating a logistic network.
Even though, the existing definitions of SCM call for an integration of the supply
chain, this has not yet been widely achieved. The exceptions are the companies with
huge negotiation power or world-wide trademarks, such Wal-Mart or Dell, which have
attained sophisticated supply chain integration. While these larger companies have good

4
integration, most of their immediate suppliers are not integrated with the second tier
suppliers (NIST,1999).
Figure 1: Supply Chain Macro-Level Representation
Supplier 1
Supplier 2
Supplier 3
●
●
●
●
Supplier m
Supplier
Distributor 1
Distributor 2
Distributor 3
●
●
●
●
Distributor j
Distributor
Retailer 1
Retailer 2
Retailer 3
●
●
●
●
Retailer k
Retailer Customers
Strategic decisions
Enterprise 1
Enterprise 2
Enterprise 3
Enterprise n
Manufacturing
Sales
Logistics
Third Party Logistics
Market Research Suppliers
Financial Support

5
For those enterprises looking to improve their supply chain, there is much advice
available. Unfortunately, the abundance of existing improvement methods could create
confusion in regards to prioritizing what to analyze and improve first: the processes, the
tools, the model or the methodology. These facts make the supply chain improvement
process more difficult. This research does not have the objective to develop a universal
definition of Supply Chain, but it provides a meta-model, that is a model of models,
useful for the improvement of an enterprise performance vis-à-vis the supply chain(s) of
which it is a member.
The remainder of this chapter provides definitions of pivotal concepts used in this
research. It also describes the problem being addressed, its importance, and what part of
the problem this research has addressed. Chapter 2 presents a review of previous efforts
regarding the evaluation, diagnosis, modeling and analysis of supply chain operations.
Chapter 3 explains the methodology used to generate the S(CM)2 conceptualization,
which includes the Delphi Method as a pivotal tool to model the supply chain elements.
Chapter 4 presents the results obtained from the Delphi Method. Chapter 5 explains the
S(CM)2 model and its verification and validation results. Chapter 6 provides an
assessment tool and an example of how to use the meta-model to assess a supply chain.
Finally, Chapter 7 includes the research conclusions and recommendations for future
research.
1.1 PIVOTAL IMPROVEMENT TOOLS, TECHNIQUES AND METHODOLOGIES
There are many improvement tools, techniques and methodologies claimed by
enterprises to be best practices. Improving a system in an enterprise may involve the use

6
of best practices to reach some performance level. A “Best Practice” is a specific process
or group of processes, which has been recognized as the best method for conducting an
action by the leaders in the field (Lawes, 2006). These best practices in some cases are
not well-documented or defined because they consider only a partial picture of the
problem or do not present a solid, scientific basis to confirm they are widely applicable
(Davies and Kochhan, 2002). An important challenge for any enterprise is to customize
the best practice to fit its organization and environment. Three widely accepted
improvement processes which integrate several best practices are the Capability Maturity
Model Integration (CMMI), Lean Thinking, and the Supply Chain Operation Reference
(SCOR) model.
The Capability Maturity Model Integration (CMMI) is a product of the Carnegie
Mellon Software Engineering Institute. The model defines six maturity levels based on
Crosby´s maturity grid (Gack and Robinson, 2003). The CMMI defines the best practices
related to the development and maintenance activities in a software or system product
lifecycle. The six capability levels are named Incomplete, Performed, Managed, Defined,
Quantitatively Managed, and Optimizing. The great success and wide adoption of CMMI
have motivated and increased the development of similar frameworks in different
disciplines, such as supply chain (Bunting et al. 2002).
Similar to the CMMI, there are models and frameworks designed to evaluate and
improve the enterprise-wide supply chain performance and management; most of them
highlight distribution logistics and inventory management processes (Huang et al. 2005).
A recent process reference model is the Supply Chain Operations Reference Model
(SCOR), which may eventually become an industry standard (Huang et al. 2004). SCOR

7
is a framework for modeling, evaluating and improving enterprise-wide supply-chain
performance and management processes (Stewart, 1997). The SCOR framework was
developed by the Supply Chain Council (www.supply-chain.org). The SCOR model
groups all the management processes related to the supply chain in five abstract processes
called Plan, Source, Make, Deliver, and Return and each of these processes is
decomposed into four levels of detail: Top Level, Configuration Level, Process Element
Level and Implementation Level.
The SCOR model provides a framework to describe, measure, and evaluate supply
chain configuration by considering the key processes, but SCOR does not define how to
improve the supply chain performance. Therefore, enterprises need to implement tools
and measurement systems, not provided by the SCOR model, to reach a specific
performance level in enterprise collaboration, decision making, and project team
development (Lockamy III and McCormack, 2004b).
Additionally, for successful implementation, the enterprises should have good
information systems, which are not defined by the SCOR model (Stewart 1997). Thus, it
is necessary to develop a parallel model to complement the SCOR model, especially to
define the improvement path according to the enterprise's maturity level. A more in-
depth analysis of the SCOR model is presented in chapter 2.
Lean Thinking is a philosophy oriented to minimize the non-value added activities as
perceived by customers (Vitasek et al. 2005). Lean Thinking is implemented through
several tools and techniques such as Kaizen, Just in Time, 5S, and modeling tools like
value stream mapping among others. Recently, Six Sigma concepts have been

8
incorporated into the Lean Sigma approach looking to improve the process flow with the
lean concepts and reduce process variations with Six Sigma tools (Ferrin et al. 2005).
These lean tools might be part of the S(CM)2 model due to their orientation to improve
process performance, such as lead time, through waste elimination.
Similar to these improvement processes, the Supply Chain Capability Maturity Model
S(CM)2 may help to make strategic decisions to improve the performance of an enterprise
from a supply chain perspective, considering key business processes to improve the
enterprise supply chain(s). Depending on the “maturity level” of each company, the
S(CM)2 provides a toolbox with several best practices oriented to increase the
performance of an enterprise regardless of its size. With the contents of the toolbox, an
enterprise may measure, design and improve its processes with respect to the overall
supply chain. As a consequence, the logistic networks are optimized, enabling cost
reduction in transport and storage. Also, some other key variables respond faster, leading
to higher customer satisfaction (Lummus et al., 2001; Stank and Goldsby, 2000).
1.2 PROBLEM STATEMENT
One of the most important problems in supply chain management is the uncertainty
inside the processes and systems. Uncertainty in demand, pricing, quality, inventory
levels, and lead time among others, causes inefficient processes and non-value added
activities. The more uncertainty throughout a process, the more inefficiencies and waste
there will be in the process (Van der Vorst and Beulens, 2002). Reducing uncertainty is
difficult due to the complexity of the supply chain.

9
The complexity of the supply chain is determined by the size of a supply chain and
the nonlinear relationships among the supply chain decision variables. For instance, lead
times, inventory levels, and demand are nonlinear supply chain elements because they are
directly affected by erratic human behavior and the quality of market information
(Chatfield et al. 2004). One of the most studied effects of these nonlinear relationships is
the bullwhip effect, which is a demand distortion in the supply chain. This effect causes
big inventories, poor service, customers loss, and a bad utilization of the distribution and
production capacities (Lee et al. 1997).
Nowadays, there are several tools intended to help users to understand and improve
the supply chain processes and functions considering these nonlinear relationships; for
example, modeling and improvement of supply chain processes using simulation (Van
der Zee and Van der Vorst, 2005), regression analysis (Chen et al. 2000), and system
dynamics (Angerhofer and Angelides, 2000), among others.
Even though these efforts prove the usefulness of these tools, they only seek to solve
a particular problem in one section of the supply chain, rather than in the whole system.
Considering the large scope of supply chain management, the next paragraphs briefly
describe some of the problems enterprises encounter when they attempt to diagnose,
model, analyze, and improve a supply chain. These problems are:
1. Modeling of the Supply Chain
2. Selecting system improvement strategies
3. Integrating the SCM and the core business orientation

10
1.2.1 Problem 1: Modeling of the supply chain
One of the main objectives of a supply chain model is to understand the whole system
performance by decomposing the supply chain into more simple elements. The
decomposition or simplification process generates manageable system pieces which
allow an easier evaluation and improvement of the complex system (Kosanke and Zelm,
1999). However, due to the complexity and nonlinear relationships within the supply
chain processes, it is a challenge to include important elements such as synergy, process
alignment and market dynamics in an enterprise model because their behavior could
change dramatically over time (Li et al. 2002). These supply chain modeling challenges
related to the inclusion of qualitative, dynamic and nonlinear elements in a model,
highlight the relevance of integrates several supply chain models in a meta-model with a
cross-disciplinary perspective.
The supply chain must be managed using effective modeling tools that enable
analysis of multiple and interdependent production processes. However, because of the
modeling complexity of a supply chain, the analyses have been done from one point of
view at a time, such as the information technology (Shapiro, 2001), Business Process
Orientation (Lockamy III and McCormack, 2004) or inventory management (Lee et al.
1997).
Making decisions about supply chain improvements without adequate cross-
disciplinary-view analyses may lead to regrettable decisions, resulting in waste of time,
money, and market position. Furthermore, the word “chain” is somewhat misleading

11
because it conveys an image of a set of links with interrelated functions and a simple
process flow, as shown in Figure 2.
Figure 2: Linear Supply Chain Conceptualization
This visualization is clear and simple, but it is not a good one, because an enterprise
has more than one supplier and more than one customer. Moreover, an enterprise can be
part of many supply chains. Nowadays, companies need to rethink their vision about a
supply chain from a linear series of functional activities that add value to their products,
to a network of links where the links can interact in a variety of modes, as needed for
their own process, (peer-to-peer, hierarchical, parent-to children, etc.) (Sengupta, 2004).
Even though there are many enterprise reference models in the literature able to
provide a comprehensive enterprise perspective, it is difficult to define a single model or
modeling technique capable of satisfying the supply chain modeling needs for all relevant
elements of an enterprise. Examples of these enterprise reference models are CIM Open
System Architecture (CIMOSA) (Kosanke et al. 1999), Zachman’s framework for
Enterprise Architecture (Zachman, 1999), and the Generic Enterprise Reference
Supplier
Supplier Relationship Management
Customer Relationship Management
Enterprise Resource Planning Customer

12
Architecture and Methodology (GERAM) (Bernus and Nemes, 1997). Even though these
models and tools are widely accepted, they were not developed considering the supply
chain systems needs but information systems or computer integrated manufacturing needs
among others; later evolving in enterprise architectures or frameworks (Noran, 2003).
One advantage of these architectures is that they provide a common language for all the
stakeholders (Whitman et al. 2001). In contrast, since supply chains use different
terminologies, it is complex to implement one using these kinds of models. Moreover,
these models represent a snapshot of an enterprise excluding important supply chain
elements such as dynamic modeling, strategic decision process, or change management
(Yu et al. 2000b).
Even though general enterprise models were not developed to meet the supply chain
needs, it is possible to use their modeling concepts to design a supply chain model for the
design of business systems (Rollins et al. 2003). These modeling opportunities have
been exploited by the S(CM)2 to provide a meta-model with a cross-disciplinary scope
and using common supply chain terminology. Thus, it was possible to analyze particular
supply chain problems, such as product distribution, inventory management or
collaboration from different perspectives.
1.2.2 Problem 2: Selecting System Improvement Strategies
Nowadays, there are many different candidate solutions to supply chain problems.
Information systems solutions (Motwani et al. 2000; Markus et al. 2000; Davenport and
Brooks, 2004); Lean thinking solutions including value stream mapping, just-in-time, or
lean manufacturing (Phelps et al. 2004; Vitasek et al. 2005); Operations research tools

13
such as simulation (Chan et al. 2002; Van der Zee and Van der Vorst, 2005); and so on.
The abundance of possible solutions complicates the decision making process. Which
tool or set of them would provide the best solution to a specific supply chain problem?
How will the tool be implemented? In a set of tools, which will be implemented first?
How are they going to interact? The selection and implementation of any given tool does
not guarantee an improvement in the supply chain cost or lead time.
For example, a common information system solution is to implement Enterprise
Resource Planning (ERP). Even though ERP systems may provide software
standardization improvements, from a supply chain perspective, ERP rarely provides
significant benefits in information integration (Braganza, 2002). For this reason, many
enterprises stop ERP projects on account of the few benefits obtained for the
management time and the financial costs invested. Moreover, most of the ERP solutions
have a Material Resource Planning System (MRPII) as their core module. MRPII, on its
own, is not necessary for the best planning and scheduling solutions in any enterprise
(Rollins et al. 2003). The companies that reach best investment returns after
implementing ERP solutions are those that had implemented, previously or in parallel,
strong continuous improvement programs like Total Quality Management (TQM) or Six
Sigma (Miller, 2004).
The latter highlights the necessity of implementing a set of solutions in a particular
progression to improve a supply chain instead of a single solution tool. In an attempt to
overcome these challenges, the S(CM)2 provides guidance about how to select the
required tool, through suggestion of a set of tools for supply chain processes according to
the maturity level and a specific view.

14
1.2.3 Problem 3: Integrating the SCM and the core business orientation
Enterprises constantly are making decisions about make or buy from an outside
enterprise or a sister business unit. Some considerations influencing the decision are the
prevention of possible speculations on price and the impact on company profits, or the
prevention of knowledge outflow to their competitors (Argyres, 1996). In the 1980’s,
enterprises were concerned about how far, upstream or downstream, they should integrate
vertical activities into a supply chain for a good or service. This vertical integration
enabled them to control the quality and performance of all the value-added processes
within the enterprise’s productive system, from the end of the chain to the customer
delivery (Harrigan, 1986).
However, vertical integration has been strongly questioned in regards to the actual
benefits in global competition. Open markets pressure companies to adopt better market
disciplines implying a reduction of their product catalogs and the breaking of vertical
links (Kakabadse and Kakabadse, 2000). Vertical integration motivation was difficult to
maintain, which lead to criticism about why an enterprise should maintain or develop
vertical integration instead of comprehensive contracting agreements with outsider
providers (Argyres, 1996). While the 1980’s were dominated by enterprise acquisitions
and fusions, in the 1990’s a change started to take a perpendicular direction. The
horizontal integration was motivated by the reorientation to the enterprise core business
(Timm, 1993).
Organizations redirect their skills and capabilities to high value-added activities and
trust their non-value activities to outsourcing enterprises (Harland et al. 2005). Scholars

15
and practitioners argue that the core business should stay in-house while non-core
activities may be outsourced. The outsourcing debate has changed from whether to
outsource to what and how to outsource (Kakabadse and Kakabadse, 2000). Therefore,
enterprises need to concentrate their efforts only in their strengths or core competences
and outsource all those activities which a partner can do better. Consequently, companies
should search for and use third-party alliances with the best in the market of all the
outsourced processes (Sengupta 2004).
This paradigm change implies some challenges in the supply chain integration,
among them the tendency to outsource information systems such that an enterprise may
obtain capabilities not available or feasible in-house (Kole, 1983). Even though
information systems by themselves have some problems as discussed in the last point,
outsourcing it generates a new problem related with the supplier development. As more
outsourcing providers emerge, service quality and the nature of the relationship customer-
provider become more and more important (Grover et al. 1996).
Regarding this problem, S(CM)2 provides a road map to improve the supply chain
processes. This road map considers both the benefits of the vertical integration into the
three initial levels, related to internal enterprise processes, and the benefits of the
horizontal integration into the last two levels, related to develop collaboration and
integration within supply chain members. In other words, the S(CM)2 suggests tools to
improve and integrate internal supply chain processes at low maturity levels and
integration between enterprises processes or external collaboration at the advanced
maturity levels for each model view.
16
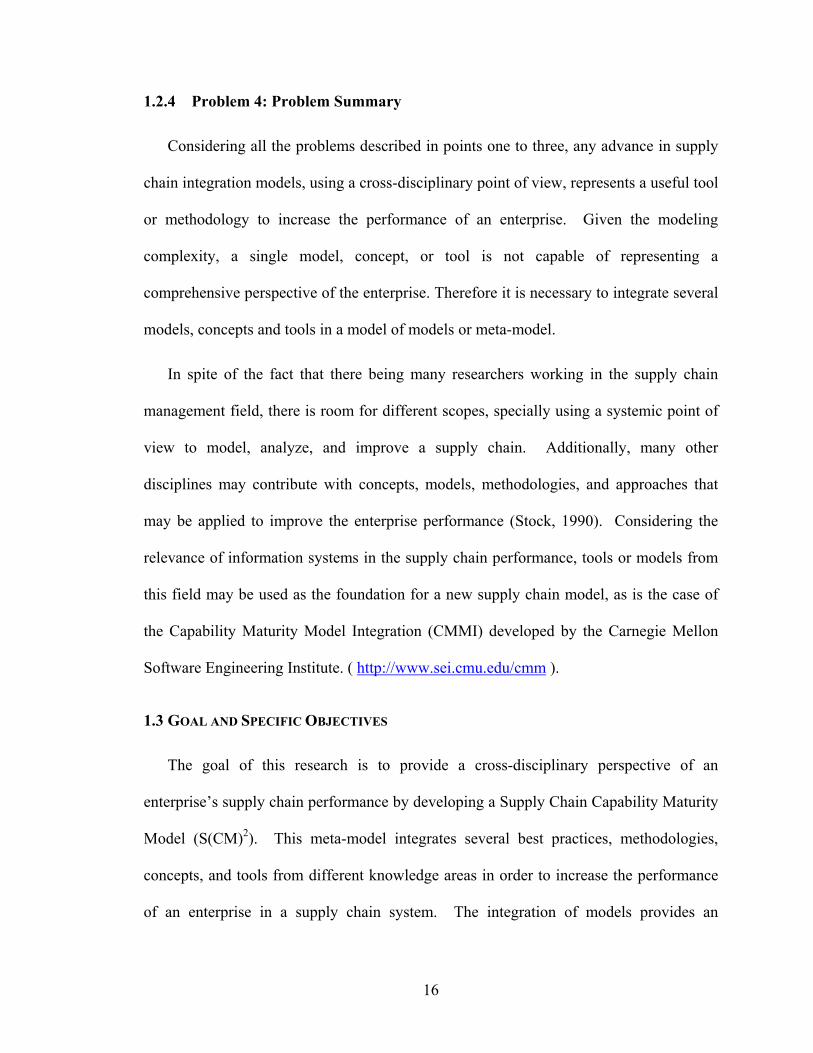
1.2.4 Problem 4: Problem Summary
Considering all the problems described in points one to three, any advance in supply
chain integration models, using a cross-disciplinary point of view, represents a useful tool
or methodology to increase the performance of an enterprise. Given the modeling
complexity, a single model, concept, or tool is not capable of representing a
comprehensive perspective of the enterprise. Therefore it is necessary to integrate several
models, concepts and tools in a model of models or meta-model.
In spite of the fact that there being many researchers working in the supply chain
management field, there is room for different scopes, specially using a systemic point of
view to model, analyze, and improve a supply chain. Additionally, many other
disciplines may contribute with concepts, models, methodologies, and approaches that
may be applied to improve the enterprise performance (Stock, 1990). Considering the
relevance of information systems in the supply chain performance, tools or models from
this field may be used as the foundation for a new supply chain model, as is the case of
the Capability Maturity Model Integration (CMMI) developed by the Carnegie Mellon
Software Engineering Institute. ( http://www.sei.cmu.edu/cmm ).
1.3 GOAL AND SPECIFIC OBJECTIVES
The goal of this research is to provide a cross-disciplinary perspective of an
enterprise’s supply chain performance by developing a Supply Chain Capability Maturity
Model (S(CM)2). This meta-model integrates several best practices, methodologies,
concepts, and tools from different knowledge areas in order to increase the performance
of an enterprise in a supply chain system. The integration of models provides an

17
improvement road map in several maturity levels for the enterprise supply chain
processes, proving modeling tools useful to analyze the processes from a holistic point of
view. This goal has the following objectives.
1. To Identify of key factors that affect supply chain processes through literature
review and practitioner’s experience applying the Delphi method. This helps
define each maturity level and its particular scopes.
2. To Identify of the best practices available to improve the key factors
(objective 1), clarifying how to find opportunity areas and how to reach the
next maturity level from a holistic point of view. This provides enterprises
with a toolbox according to each maturity level and the starting point to
improve its “as-is” business process.
3. To Define of key views to model supply chain processes for evaluating the
improvement reached through the implementation of the best practices. Once
an improvement project starts, it is necessary to evaluate its benefits in the
supply chain.
4. To Develop of an assessment tool to determine if a company adheres to the
best practices. Considering not only a “yes or no” evaluation, but a more
detailed and documented way to identify matches and discrepancies.
Thus, to meet these objectives, the S(CM)2 is a meta-model which includes:
An improvement road map describing five maturity levels for the enterprise
supply chain processes, proving modeling tools useful to analyze the processes
from a cross-disciplinary point of view, and to improve the enterprise

18
performance vertically within the company processes and horizontally within
enterprises in the supply chain.
A diagnostic tool to evaluate the “as-is” state of the enterprise and assign the
enterprise a maturity level. For example, the SCOR model uses a scorecard gap
analysis for this diagnostic purpose (Huang et al. 2005).
A continuous improvement system. The diagnostic tool is used as a continuous
improvement guide for the enterprise. This tool considers the impact of the
suppliers and customers in the enterprise profits and offers some possible
solutions to several of the problems related to them.
1.4 RESEARCH METHODOLOGY
The research has been conducted in three stages: Review of literature, Integration of
models, and Development of the S(CM)2. The first stage was a thorough literature
review about supply chain key factors and supply chain models. The literature review
enabled designing the survey of the Delphi Method applied in a first round. The
objective of this stage was to reach a consensus about what a supply chain is and the
taxonomy of the S(CM)2 regarding each maturity level. The second stage included the
integration of models, tools, and concepts available to improve the enterprise supply
chain in a draft meta-model, and the improvement and validation process through the
Delphi method. Finally, the third stage developed the S(CM)2 and an assessment tool
based on it, such that an enterprise may use this tool as a level of classification, useful as
a starting improvement point.

19
The Delphi method has been used as a modeling tool, because it is a research tool
oriented to obtaining a consensus from a group of experts with anonymous interactions
between them, avoiding thus confrontations and eliminating influences (Okoli and
Pawlowski, 2004). The panel of experts required for the Delphi method was composed
of academicians and practitioners in supply chain processes from different knowledge
areas. Chapter 3 explains in depth how the Delphi method is used to build the S(CM)2
and the sequence of activities required to do so.

20
CHAPTER II
LITERATURE REVIEW
In the last decades, a lot of research related to enterprise modeling frameworks and
supply chain improvement tools has been published. Recent publications present supply
chain problems and how to solve them by recognizing the importance of the multiple
stakeholder perceptions (Sengupta, 2004), implementing operation research tools such as
simulation (Hicks, 1999), or using frameworks for modeling the supply chain (Appelquist
et al. 2004). These concepts, tools, and frameworks include modeling, analysis, or
attempts to explain the complexity behind the enterprise systems, which are not similarly
defined by each knowledge area.
Likewise, several frameworks have been developed to provide an open architecture
for general enterprise modeling. Frameworks such as Zachman’s, IDEF, GIM, CIMOSA,
PERA and GERAM are commonly reported in research related to enterprise modeling
(Whitman et al. 2001, Dewhurst et al. 2002, Barber et al. 2003). These models represent
an enterprise through different views explaining, describing, and dealing with the
complex activities of an enterprise (Yu et al. 2000). In spite of the variety of modeling
scopes, the inherent complexity and dynamic behavior of the supply chain problems do
not to allow identify a unique tool, model, methodology, or philosophy able to improve
any supply chain process.
These general models were not necessarily developed in a supply chain context, and
they are typically static representations of a process found in the supply chain. GERAM,

21
for instance, does not make statements about how a process should be done. On the other
hand, supply chain models, which were developed within a supply chain context, do not
provide a clear road map to improve the supply chain or to react in front of market or
customer behavior changes. The following pages present a literature review of some
concepts, tools, strategies, and frameworks used to improve the supply chain and
modeling enterprise processes. Also, several contemporary best practices, which can be
merged and integrated to define a meta-model to assess the processes and performance of
enterprises in the supply chain have been included.
2.1 ENTERPRISE MODELING FRAMEWORKS AND ARCHITECTURES.
Enterprise modeling frameworks and architectures provide a better understanding of
the enterprise’s complexity. The partitioning and simplifying enterprise processes can be
studied through a common modeling language and methodology (Kosanke and Zelm,
1999). These frameworks and architectures represent a system at a particular point of
time or describe the life of the systems according to developmental phases or
improvements such as definition, development, operation and maintenance (Noran,
2003). Also, they provide systematic methods to capture business objectives and to
display the structure of how the information and material flow are related to the
enterprise’s organization (Yu et al. 2000); and the knowledge any enterprise requires to
do reliability analysis easier and more accurate (Yu et al. 2000b). Following are several
widely accepted modeling frameworks and architectures.
22
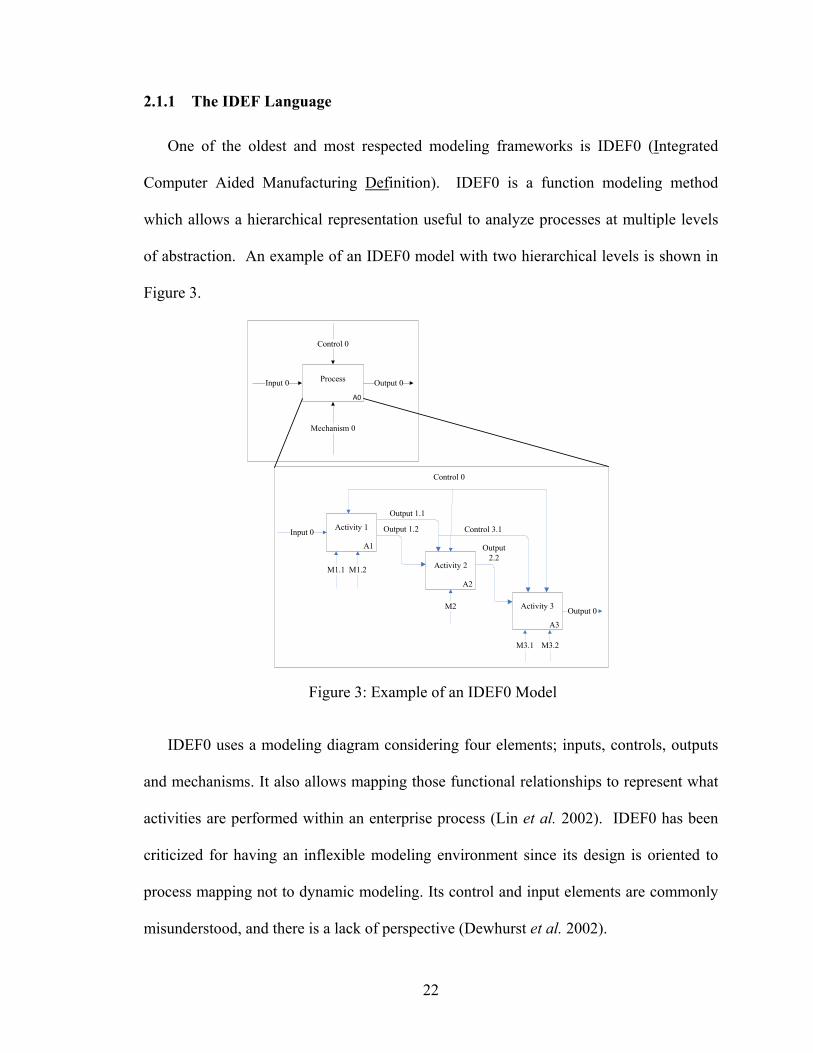
2.1.1 The IDEF Language
One of the oldest and most respected modeling frameworks is IDEF0 (Integrated
Computer Aided Manufacturing Definition). IDEF0 is a function modeling method
which allows a hierarchical representation useful to analyze processes at multiple levels
of abstraction. An example of an IDEF0 model with two hierarchical levels is shown in
Figure 3.
A0
ProcessInput 0 Output 0
Control 0
Mechanism 0
A1
Activity 1Input 0
M1.1 M1.2
A2
Activity 2
Output 1.2
M2
A3
Activity 3
Output 2.2
M3.2
Output 0
Control 0
Output 1.1
Control 3.1
M3.1
Figure 3: Example of an IDEF0 Model
IDEF0 uses a modeling diagram considering four elements; inputs, controls, outputs
and mechanisms. It also allows mapping those functional relationships to represent what
activities are performed within an enterprise process (Lin et al. 2002). IDEF0 has been
criticized for having an inflexible modeling environment since its design is oriented to
process mapping not to dynamic modeling. Its control and input elements are commonly
misunderstood, and there is a lack of perspective (Dewhurst et al. 2002).

23
2.1.2 The GRAI Integration Methodology (GIM)
The GIM emphasizes the organizational structure of an enterprise and the associated
decisional system of production systems. The general objective of this integration
methodology is the analysis of the current production systems in order to detect the weak
points of the system. This diagnosis allows to design alternative system conceptions and
to support their comprehension (Zülch et al. 2001).
GIM builds on several static business mapping techniques like entity relationship
diagrams and IDEF0, and it also focuses on decision system analysis of the enterprise
(Mertins and Jochem, 2005). The GIM views are informational, decisional, physical, and
functional. The GIM life-cycle consists on analysis, design, and implementation (Bernus
and Nemes, 1997). Even though GIM adds an important decision perspective, the
weaknesses of IDEF0 in terms of operational modeling are sustained (Dewhurst et al.
2002). Figure 4 shows the Modeling Framework and Conceptual Model of GIM (Zülch
et al. 2001, Bernus and Nemes, 1997).
Modeling Framework Conceptual Model
Figure 4: GIM Modeling Framework and Conceptual Model

24
2.1.3 The Zachman’s framework
This framework was developed by John Zachman and published in 1987. It was
initially designed to develop information systems, and later evolved in some extensions
and formalizations to a framework for enterprise architecture (Noran, 2003). Zachman’s
framework provides a common language for the enterprise; useful to develop any project
and solve any problem in a methodological road map. Zachman’s framework also
provides essential distinction to areas ignored by conventional system design such as
strategy, design, or documentation (Whitman et al. 2001).
A factor of acceptance of this framework resides in the logical structure for modeling
the enterprise from different perspectives such as the planner’s perspective, the owner’s
perspective or the designer’s perspective, in such ways that these perspectives can be
analyzed, observed, and mapped form different views or dimensions considering data,
functions, or people. As a result a matrix of explicitly differentiable elements is obtained
(Zachman, 1999).
The complete perspectives of the framework are: Scope (Planner’s Perspective),
Enterprise Model (Owner’s Perspective), System Model (Designer’s Perspective),
Technology Model (Builder’s Perspective), and Detailed Representation (Subcontractor’s
Perspective). Each of these perspectives is analyzed from different views or dimensions
which answer basic modeling questions. These dimensions are: Data (What?), Function
(How?), Network (Where?), People (Who?), Time (When?), and Motivation (Why?).
Analyzing an enterprise through this framework provides a methodology to help
enterprises to manage change, and to guarantee integration and process alignment with

25
dependency, coherence and traceability (Pereira and Sousa, 2004). Figure 5 shows
Zachman’s modeling framework for enterprise architecture (Noran, 2003).
Views
What How Where Who When Why
Pers
pect
ives
Scope (Planner’s)
Enterprise Model (Owner’s)
System Model (Designer’s)
Technology Model
(Builder’s)
Detailed Representation
(Subcontractor’s)
Functioning Enterprise
Data Function Network People Time Motivation
Figure 5: Zachman’s Framework for Enterprise Architecture
Even though Zachman’s framework does not apparently include a life-cycle
definition, the view “When” may be used to define it. This view is related to the
functioning enterprise “Time”, implying temporality and succession (Noran, 2003).
2.1.4 The Purdue Enterprise Reference Architecture (PERA)
The PERA architecture recognizes the relevance of human judgment and decision
making to merge special management requirements, such as innovation and creativity,
with design. PERA helps to define a hierarchy arrangement in such way that dependency
on human understanding, judgment, and decision making required for a successful
implementation is minimized (Li and Williams, 2002). PERA includes the bases for the

26
representation of human tasks on information systems, distinguishing between those
performed by humans and those performed by the system. This is achieved by defining a
level of automation such that elements as mission, vision, and values are human tasks in
systems which are not automated (Whitman et al. 2001). The PERA views are
manufacturing, human and organizational, and information. The PERA life-cycle
involves identification, concept, definition, functional design, detailed design,
construction, operation and maintenance, renovation or disposal, and legal dissolution
(Saenz and Chen, 2004). Figure 6 shows the PERA life-cycle according to Li and
Williams (2002).
Figure 6: Models and tools involved in the PERA Life-cycle

27
Figure 7 shows a definition for the manufacturing case for the concept, definition and
specific design layers (Williams, 1998). A challenge in the application of this
architecture is the bottom-up construction focus, which starts defining the basic
elementary tasks, in order to group them into activities that meet the strategic objectives
(Chalmeta et al. 2001).
Identification of Enterprise Business Entity
Mission, Vision, and Values
Present or Proposed (Concept)Production Entity including
Product and operational Policies
Business Process. Personnel and Information Policies, etc.(POLICIES)
Physical Production Requirements (Operations)
Planning, Scheduling, Control and Data Management Requirements
Manufacturing Functional (Unit Operations) Modules, etc.
Task and Functional Modules
Manufacturing (Unit Operations) Functional Network
Information Functional Network
Manufacturing Architecture Information Architecture
Manufacturing Equipment
Architecture
Human and Organizational Architecture
Information System
Architecture
Hum
an C
ompo
nent
of
the M
anuf
actu
ring
Arc
hite
ctur
e
Hum
an C
ompo
nent
of
the I
nfor
mat
ion
Arc
hite
ctur
e(REQUIREMENTS)
(BUILDING BLOCKS
MODULES)
(NETWORKS)
CONCEPT LAYER
DE
FINIT
ION
LAY
ER
FUN
CT
ION
AL D
ESIG
N
OR
SPEC
IFICA
TION
L
AYE
R
Figure 7: Definition of the Concepts for the Manufacturing Case
2.1.5 The CIMOSA Framework
The Computer Integrated Manufacturing Open System Architecture (CIMOSA) was
developed by the ESPIRT consortium AMICE. In essence, CIMOSA takes the best

28
concepts of IDEF and GIM among other frameworks (Barber et al. 2003). CIMOSA is
based on a process-oriented modeling approach providing an architecture, which
facilitates the descriptive modeling of an enterprise operation. CIMOSA represents an
enterprise’s system from a general to a particular model passing through a partial model
for every view (ESPIRT Consortium AMICE, 1993). Figure 8 shows the CIMOSA
modeling framework (Saenz and Chen, 2004).
Implemantation stages
Genara
tion
of vie
ws
Life Cycle
OrganizationResouce
Information
Function
Gen
eral
M
odel
Parti
al
Mod
el
Parti
cula
r M
odel
Analysis
Design
Implementation
Figure 8: CIMOSA Modeling Framework
Initially, CIMOSA does not populate a life-cycle with unique processes, but defines
basic phases independently from the modeling methodology in use; these basic phases
consist on requirement definition or analysis design, design specification, and

29
implementation or detailed design (Chalmeta et al. 2001), which are the same as GIM’s.
CIMOSA’s views are developed according to the CIM’s manufacturers’ requirements
(Whitman et al. 2001). A couple of examples of views are function, information,
resource, and organization (Saenz and Chen, 2004) or decision, function, resource, and
information (Chalmeta et al. 2001).
However, CIMOSA includes neither a method to solve possible modeling
inconsistencies among views nor a method to build a dynamic integrated model
(Chalmeta et al. 2001). Since CIMOSA is a static model, it is insensitive to changes in
business objectives; thus, just a partial model has been done when the market conditions
change. Even though this partial model may be useful for a while, market changes
invalidate it quickly, requiring to start again the modeling activities (Yu et al. 2000).
Moreover, CIMOSA does not clearly represent strategic decisions and operational rules
(Yu et al. 2000b).
2.1.6 The GERAM Framework
The Generalized Enterprise Reference Architecture and Methodology (GERAM)
builds on several architectures, generalizing and integrating the best elements. GERAM
provides a methodology for enterprise engineering from PERA and GIM, a system life-
cycle from PERA, and modeling tools from CIMOSA (Mertins and Jochem, 2005).
GERAM life-cycle is found in one component of the architecture called GERA, the life-
cycle phases are: Identification, concept, requirements, preliminary design, design,
detailed design, implementation, operation, and decommission (Noran, 2003). The
GERAM methodology focuses more on the implementation process than in the model

30
structure. For instance, integration of the models for the strategic, tactical, and
operational decision levels are not clearly explained (Barber et al. 2003). Figure 9 shows
the reference architecture of GERAM, called GERA.
Identification of Enterprise Business Entity
Mission, Vision, and Values
Present or Proposed (Concept)Production Entity including
Product and operational Policies
Business Process. Personnel and Information Policies, etc.(POLICIES)
Physical Production Requirements (Operations)
Planning, Scheduling, Control and Data Management Requirements
Manufacturing Functional (Unit Operations) Modules, etc.
Task and Functional Modules
Manufacturing (Unit Operations) Functional Network
Information Functional Network
Manufacturing Architecture Information Architecture
Manufacturing Equipment
Architecture
Human and Organizational Architecture
Information System
Architecture
Hum
an C
ompo
nent
of
the M
anuf
actu
ring
Arc
hite
ctur
e
Hum
an C
ompo
nent
of
the I
nfor
mat
ion
Arc
hite
ctur
e
(REQUIREMENTS)
(BUILDING BLOCKS
MODULES)
(NETWORKS)
CONCEPT LAYER
DE
FINIT
ION
LAY
ER
FUN
CT
ION
AL D
ESIG
N
OR
SPEC
IFICA
TION
L
AYE
R
Figure 9: GERA, the Reference Architecture of GERAM
2.1.7 Conclusions About the Enterprise Reference Architectures
From the literature review it is possible to summarize conclusions and common
characteristics of these frameworks and architectures, as follows:
1. Models provide a detailed taxonomy of the concepts related to enterprise
activities, systems and stakeholders, not only by identifying them, but also by
defining how to document them. The models accomplish this in a common
language for all the users of the framework or architecture, making it easier to
have a comprehensive understanding of the enterprise activities, processes and
systems.

31
2. Models provide a clear differentiation among their views, perspectives, and
modeling elements; therefore, it is possible to build partial models of the
enterprise processes and then integrate the views in a complete framework or
architecture.
3. Models consider the time variable as a dimension for analysis, IDEF0 and
Zachman frameworks considering a snapshot of the modeled system. GIM,
CIMOSA, PERA, and GERAM provide, at least, basic considerations for
modeling the life of a system through a life-cycle implementation.
4. Each model has been developed and designed according to the needs of a specific
knowledge area such as computer integrated manufacturing or information
systems and then evolved to general models.
5. None of the frameworks specifically reviewed address any dynamic modeling
requirements. Because these frameworks use static models for enterprise
representation, they may be insensitive to market or strategic changes.
6. Users should understand enterprise architectures and frameworks. Therefore, a
common modeling language for the stakeholders should be used or developed as
part of the implementation methodology.
Similar to the enterprise frameworks discussed here, there are frameworks and
architectures specifically developed to supply chain modeling, analysis and integration.
The next section describes some of these supply chain frameworks and architectures.

32
2.2 SUPPLY CHAIN MODELS AND ARCHITECTURES.
Chapter 1 discussed several problems related to supply chain, advantages and
disadvantages of vertical and horizontal integration; modeling and visualization of a
supply chain; and the impact of information systems on the supply chain. Whether an
enterprise belongs to a unique supply chain or to many, the enterprise should take
advantage of the possible vertical and horizontal integrations for its operations. In order
to obtain the greatest benefit, enterprises need to know how the processes work or should
be designed; to do this, a modeling framework or tool is required. This framework could
provide structure to facilitate the integration of the supply chain components, detailing a
methodology for structural and systems integration for several supply chain levels
(Samaranayake, 2005). The following are some modeling tools, frameworks and
architectures developed to fit these needs.
2.2.1 Stevens’ Model
Stevens (1989) developed a stage-based model for supply chain integration. He
argues that an integrated supply chain will be able to deal with dynamic market issues
such as mass customization, short lead-time, agility and leanness. His model highlights
technology and infrastructural development as critical factors to achieve supply chain
integration, which takes place in stages. These stages are Baseline, Functional
Integration, Internal Integration, and External Integration. The stages are focused on first
integrating the internal enterprise processes, in the three initial stages, before integrating
the external supply chain processes in the last stage.

33
The model looks similar to a waterfall development model that is used in systems
information projects. It starts from a baseline of processes integrated through technology
efforts. Once the technology integration is achieved, the second stage of integration is
concerned with the functions. This integration is based on enterprise organization. The
third stage aims at internal integration to the enterprise’s function, based on attitude
concepts; that is, a focus on human capital. Finally, stage four is concerned with an
external integration of suppliers, enterprise, and customers (Stevens, 1989). Figure 10
shows Stevens’ model. Even though Stevens’ model does not define a life-cycle, such as
the enterprise architectures discussed previously did, the four stages may be considered
as the time line or history of the integration process.
Materials Management
Purchasing Material Control
SalesProduction Distribution
Stage 1: Baseline
Material Flow Customer Service
Technology BasedStage 2: Functional Integration
Material Flow Customer Service
Organization Based
Manufacturing Management
Distribution
Materials Management
Stage 3: Internal Integration
Material Flow Customer Service
Attitud Based
Manufacturing Management
Distribution
Suppliers
Stage 4: External Integration
Material Flow Customer Service
Internal Supply Chain
Customers
Materials Management
Materials Management
PurchasingPurchasing Material ControlMaterial Control
SalesSalesProductionProduction DistributionDistribution
Stage 1: Baseline
Material Flow Customer Service
Technology BasedStage 2: Functional Integration
Material Flow Customer Service
Organization Based
Manufacturing Management
Manufacturing Management
DistributionDistribution
Materials Management
Materials Management
Stage 3: Internal Integration
Material Flow Customer Service
Attitud Based
Manufacturing Management
Manufacturing Management
DistributionDistribution
Suppliers
Stage 4: External Integration
Material Flow Customer Service
Internal Supply Chain
Internal Supply Chain
CustomersCustomers
Figure 10: Stevens’ model of Supply Chain Integration

34
2.2.2 An Integrated Supply Chain Management Architecture
In the last years, a significant market change took place in the industry. Enterprises,
rather than isolated companies, competed as a supply chain against other supply chains.
Nowadays; the success of an enterprise frequently depends on how well-integrated the
enterprise is within a network of partner relationships. This market change has caused an
evolution and strengthening of the enterprise relationships, passing from a relationship
based on key business processes linked within enterprises, to becoming supply chain
business processes linked across the intra-company and inter-companies boundaries
(Lambert et al. 1998).
A model which includes these relationships is the architecture of supply chain
management presented by Cooper et al. (1997), which includes key supply chain business
processes; and flows of information and product, over a supply chain network structure.
This architecture highlights six key processes within an enterprise: Purchasing; Logistics;
Marketing and Sales; Production, Research and Development; and Finance. Processes
are integrated within several tier suppliers and several customers or end customers
through the key supply chain processes of Customer Relationship Managements, Demand
Management, Procurement and Returns, among others (Cooper et al. 1997). This
architecture is shown in Figure 11. Similar to the enterprise architectures, this model is
static since it does not explicitly include a time line or development history. Moreover
there is no clear interaction and division among the key enterprise processes and the
supply chain business processes. Thus, it is difficult to identify a matrix of differentiable
elements such as those used by enterprise architectures.

35
Customer Consumer / End-Customer
Product Flow
Purchasing
Logistics
Marketing & Sales
Production
R&D
Finance
Customer Relationship Management
Customer Service Management
Demand Management
Order Fulfillment
Manufacturing Flow Management
Procurement
Product Development and Comercialization
Returns
Tier 2Supplier
Tier 1Supplier
Supp
ly C
hain
Bus
ines
s Pro
cess
es
Information Flow
Manufacturer
Figure 11: Integrating and Managing Business Processes across the Supply Chain
2.2.3 Enterprise Architecture for Supply Chain Integration
Based on an enterprise value analysis, Chandra and Kumar (2001) identified five key
perspectives and four views to represent the interactions between the members of a
supply chain. The perspectives defined are Marketing and Sales, Inbound Logistics (i.e.,
receiving and warehousing), Plant Operations (i.e., manufacturing, product assembly, and
inspection), Outbound Logistics (i.e., warehousing and shipping), and Service (i.e.,
organization and management). The views defined are Procurement, Technology
Development, Information Management, and Others. Figure 12 shows the resulting
matrix after the value analysis.

36
Procurement Technology Development
Information Management
Others
Marketing and Sales Buy advertising Campaigns Buy sales promotions
Consumer market research Incorporate market needs in the product
Forecast demand and sales Sales analysis Track product performance
Coordinate order processing
Inbound Logistics (Receiving, warehousing, inventory control, production planning)
Procure end-products Procure raw materials for assembly and packaging
Receive and track raw materials and end-products
Manage store of raw materials and end-products
Plant Operations (Manufacturing, inspection, product assembly, product packaging)
Quality Inspection of finished products Assemble end-products Package end-products
Outbound Logistics (Warehousing, inventory control, shipping)
Procure shipment modes
Inventory control of finished product Track and report shipments
Select shipment and routing modes Consolidate order for a carrier
Service (Organization and management)
Manage inventory carrying, quality, back order, and opportunity cost Analyze cost variance
Guarantee shipment schedules
Figure 12: Member Enterprise Value Analysis (Chandra and Kumar, 2001)
The intersection of perspectives and views represents a set of relevant actions for the
enterprise supply chain. Even though this matrix does not show the relevant actions for
all the intersections among perspectives and views may be used as a quick reference to
assess the supply chain integration of an enterprise. Based on this matrix, they developed
the architecture of a cooperative supply chain member enterprise. They recognize that
the design, modeling, and implementation of a supply chain system is a complex
endeavor. The more cohesively tied the business processes of the members in the supply
chain are, the more coordination they will have. Greater coordination makes it possible
to have easier development of the supply chain elements, such as information

37
management, plant operation, and logistics, through a set of principles, strategies,
policies, and performance metrics included in decision making models.
Figure 13 defines the collaborative supply chain architecture for a supply chain
member. This architecture shows a decomposition model for a supply chain member
with the following relationships. A member enterprise jEM has 1 to “n” business “B”, a
business block )(BE
jj
M has 1 to “n” processes “P”, and a process block has 1 to “n”
activities “A”. The transformation from material to final product takes place at the
activity level, while the order life-cycle occurs at the business level, involving business
processes required to process the order such as marketing, sales, product design,
production planning, and so on. The control sequence occurs at both inter and intra
levels to implement independent organizational goals, policies, and objectives (Chandra
and Kumar, 2001).
Upstream DownstreamProcess
Perf
orm
ance
MaterialFlow
)A,P,(BE
111
1M )A,P,(B
E211
1M )A,P,(B
En11
1M
)P,(BE
11
1M )P,(B
E21
1M )P,(B
En1
1M
)(BE
1
1M )(B
E2
1M )(B
En
1M
Order-Life Cycle
Control Sequence
1EMInformation Flow
Control Sequence
Decision Making Models
Member Enterprise
Member Business Flow
Member Process Flow
Member Activity Flow
Upstream DownstreamProcess
Perf
orm
ance
MaterialFlow
)A,P,(BE
111
1M )A,P,(B
E111
1M )A,P,(B
E211
1M )A,P,(B
En11
1M
)P,(BE
11
1M )P,(B
E21
1M )P,(B
En1
1M
)(BE
1
1M )(B
E2
1M )(B
En
1M
Order-Life Cycle
Control Sequence
1EMInformation Flow
Control Sequence
Decision Making Models
Member Enterprise
Member Business Flow
Member Process Flow
Member Activity Flow
Figure 13: A Collaborative Supply Chain Member Architecture
38
Even though this member architecture includes an order life-cycle, it is not defined as
an enterprise life-cycle. Additionally, the architecture requires a value analysis as a
starting point, which changes from the customer’s point of view and over the time.
Finally, for the decomposition levels, it is not clear how to represent a whole system,
where an activity can belong to more than one process, or one process which belongs to
many business blocks.
2.2.4 Architecture for Supply Chain Integration
Siau and Tian (2004) argue that an integrated supply chain must include
completeness, security, flexibility, scalability, and interoperatibility. Considering these
elements, they analyzed how Information Technology (IT), based on eXtensible Markup
Language (XML), Common Object Request Broker Application (COBRA), .NET, and
Semantic Web among others, can be used as enabling technology in order to fulfill the
information requirements for integration (Siau and Tian, 2004).
Based on the simplified architecture for supply chain the architecture of an integrated
supply chain was developed as is shown in Figure 14. The architecture includes internal
and external communication with the supply chain enterprises, and emphasizes the
relevance of the design and information system capable of interacting with different
technologies, platforms, and decision support systems.
Finally, they define five critical elements which an integrated supply chain must have
from the Information Technology point of view:
The IT system covers all the supply chain as a whole.
The IT subsystems may be independent among them.

39
The IT may provide strategic, analytical and decision support functions, not only
operational management functions.
The IT may be interoperable and may be able to integrate systems within the
company and within companies.
The IT may to provide a dynamic integration.
Supplier R&D Operations ServiceMarketing and Sales
Logistics Customer
Products and Service Flow
Fonds Flow
Information Flow
Supp
lier
Rel
atio
nshi
p M
anag
emen
t Custom
er R
elationship M
anagement
Supplier’s Supply Chain
System
B2BApplications
B2CApplications
Other Supply Chain Applications
Database and operation
management applications
Customer’s Supply Chain
System
Individual Customer
Enterprise’s Supply Chain System
Parts, Services Information Products, Services
Figure 14: Architecture for an Integrated Supply Chain Enabling IT
From these examples of supply chain integration models and architectures,
opportunities, conclusions and common characteristics are summarized as follows:
1. Models and architectures cover not only an enterprise system but also the
integration of some companies in a supply chain.

40
2. Models attempt to understand the relationship among supply chain elements
through various kinds of analyses and points of view such as Business Processes,
Value Analysis or Information Technology.
3. Models provide a categorization of the key supply chain concepts although they
are not as clearly defined as was done in the enterprise models. For example, they
do not separate the supply chain into views, perspectives, and dimensions the way
enterprise models do.
4. Models use common terminology in the supply chain area, making it easier to
have a comprehensive understanding of the supply chain activities, processes and
systems.
5. The Supply chain models analyzed do not include life-cycle development as the
enterprise models reviewed.
6. Models include several flows; some of them are similar, such as information,
materials, services and funds across a supply chain system.
7. Supply chain models show different decomposition levels; some of them are high
architectures but do not provide a clear road map for system improvement.
8. Supply chain models differentiate among enterprise elements such as logistics,
research and development, sales, purchasing, and service; and supply chain
business processes such as customer relationship management and supplier
relationship management.
Table 1 shows a comparison among the architectures in terms of enterprise elements,
supply chain business processes, enabling elements and flows. The column of Enterprise

41
Business Process contains the processes represented in the model as internal processes,
while the second column contains the supply chain business process, which implies the
interaction among enterprises processes.
Table 1: Comparison among Supply Chain Architectures.
Model Enterprise Business Processes
Supply Chain Business Processes Enabling Elements Flows
Stevens (1989)
Purchasing, Material Control, Production,
Sales, and Distribution
Materials Management and Distribution
Technology, Organization, and
Attitude
Materials and Customer Service
Copper et al. (1997)
Purchasing, Logistics, Marketing and Sales, Finance, R&D, and
Production
CRM, Customer Service Management, Demand
Management, Order Fulfillment,
Procurement, Product Development and
Commercialization, and Returns
Physical & Technical
Management Components and
Managerial & Behavioral
Management Components
Information, Manufacturing
Management, and Product
Chandra & Kumar
(2001)
Marketing and Sales, Inbound Logistics, Plant Operations,
Outbound Logistics, and Service (Member)
Marketing and Sales, Inbound Logistics, Plant Operations, Outbound Logistics, and Service
(Group)
Procurement, Technology
Development, Information
Management, and Others
Material (Activity),
Process, order life-cycle
(Business) and Information
Siau & Tian
(2004)
R&D, Logistics, Operations,
Marketing and Sales, and Service
Customer and Supplier Relationship Management
B2B and B2C systems, Database and Operational
Management applications
Parts, Products, information, and
services
Almost all the reviewed models use different processes in each column, except
Chandra and Kumar’s model, which considers the same business process but at two
different levels, as internal and external process. The last two columns show the enabling
elements and flows represented in every model. Even though there are many more
similar frameworks and architectures, one of them has been growing in acceptance and
implementation. This is the SCOR, analyzed in the following section.

42
2.3 THE SUPPLY CHAIN OPERATIONS REFERENCE (SCOR)
The SCOR model is a cross-functional framework, which integrates the concepts of
business process reengineering, benchmarking, and process measurements. The SCOR
model offers a structured process to improve the supply chain (Holmberg, 2000). This
initiative of the Supply-Chain Council has grown in popularity and reported successful
implementations and contributions from the Supply-Chain Council members,
practitioners, and consultants. The SCOR model was developed to improve the supply
chain effectiveness of enterprises, providing a common process oriented language on its
five decision areas Plan, Source, Make, Deliver, and Return (Lockamy III and
McCormack, 2004b). The supply chain structure based on the SCOR model is shown in
Figure 15 (adapted from Huang et al., 2004).
Plan
Plan
ManufacturingFacility I
ManufacturingFacility II
Source Make Deliver
Return Return
Source Make DeliverReturn
Intra Supply Chain
Inter Supply Chain
Return
Supplier CustomerPlan
Plan
ManufacturingFacility I
ManufacturingFacility II
Source Make Deliver
Return Return
Source Make DeliverReturn
Intra Supply Chain
Inter Supply Chain
Return
Supplier Customer
Figure 15: The SCOR Model-Based Supply Chain Infrastructure

43
The SCOR model is deployed in three levels of process details (Lockamy III and
McCormack, 2004b).
Level one, the top level, is related to process types and defines the scope and contents
of the model, implying the definition of the core management processes for the decision
areas Plan, Source, Make, Deliver, and Return. At this level is the set of competition
performance targets.
Level two, the configuration level, is related to process categories and provides a
set of core process categories. This level describes the characteristics linked to
the process types deployed within the core processes previously defined in level
one. Also, this level defines process categories because of the relationship
between a core management process and a process type.
Level three, the process element level, is related to the enterprise fine tuning. It
defines the ability of a company to compete successfully in a specific market.
This level consists of process element definitions; process element information,
input, and output; process performance metrics, best practices, systems
capabilities to support best practices; and general systems and tools.
Level four is the implementation. This level is not included in the model scope.
Even though the SCOR model has been used as a framework for integrated supply
chain management by Supply-Chain Council members like Nabisco, Procter & Gamble,
and UPS logistics, it is important to highlight that the model does not provide a unique
solution for the improvement of the supply chain. The SCOR model does not offer a
step-by-step procedure to improve the supply chain management and must be supported

44
by efficient systems and information technology, not defined by the model (Stewart,
1997). Moreover, According to the Supply Chain Council, SCOR does not include the
processes involved in sales administration, technology development, product and process
design and development, and some post-delivery technical support. Also SCOR assumes,
but does not explicitly address several processes such as: training, quality, and
information technology (IT) administration (non-SCM).
In spite of SCOR is widely accepted, some research is making up the SCOR model
shortcomings. There is a lack of change management considerations through improving
market analysis, processes synchronization, and the use of network modeling tools to
support change management decisions (Huang et al. 2004). Other disciplines like Soft
Systems methodology and Systems Thinking have been used to improve the model,
which is strong on technical dimensions, but weak on social dimensions (Holmberg,
2000). These two disciplines can strengthen the modeling process and define a clear
process vision before starting reengineering efforts. In other words, there must be
understanding of the problem, the interaction between stakeholders, and understanding
how they could respond if a process is changed (Kasi, 2005).
On the other hand, one of the strengths of the general enterprise modeling
frameworks, like CIMOSA, PERA, and GERAM, is that it includes an implementation
element on its life-cycle. GERAM, for example, focuses on the implementation process
rather than the model structure (Barber et al. 2003). Although every model may be
improved, the SCOR model exclusion of an implementation phase may allows being
confused by a complex definition of the model. Moreover, the implementation process
requires some metrics in order to evaluate the benefits achieved. SCOR does not define

45
clearly whether an enterprise performance metric is outstanding or not. Even though the
model provides performance metrics, it is not clear how a company can use those metrics
to obtain a supply chain performance measure able to evaluate a continuous improvement
process or benchmark with other enterprises (Huang et al. 2004). Considering these
improvement opportunities in the SCOR model, the next section reviews a couple of
models developed to provide a supply chain maturity path for enterprises.
2.4 A SUPPLY CHAIN MATURITY MODEL
Regarding the improvements on supply chain modeling mentioned in the last section,
McCormack et al. (2002) published the Supply Chain Management Maturity Model
based on Business Process Orientation. After that, Lockamy III and McCormack (2004)
published a research paper with the same scope. This model conceptualizes how to
include the SCOR model in their maturity model. However, based the maturity model
only in the SCOR and Business Process Orientation induce a lack of competition,
consideration, and innovation. Moreover, the research study was validated over a
member list of the Supply Chain Council, the creators and promoters of the SCOR
model; thus, the results could be biased.
On the other hand, one interesting concept included in the model is the relationship
shown between the enterprise process capability and the maturity level of the enterprise
processes. The assumption behind this relationship implies that the more maturity level
the enterprise process has, the more capable it is (Lockamy III and McCormack, 2004).
This relationship also implies that the maturity taxonomy is directly related to the

46
enterprise process performance. The proposed model has five maturity levels shown in
Figure 16 (Lockamy III and McCormack, 2004).
Extended
Integrated
Linked
Defined
Ad Hoc
Proc
ess M
atur
ity
Competition is based upon multi-firm networks
The company, its vendors and suppliers, take cooperation to the process level.
The breakthrough level. Managers employ process management with strategic intent.
Basic Process are defined and documented.
Processes are unstructured and ill-defined
Figure 16: The Business Process Orientation Maturity Model
2.5 MEASURING THE SUPPLY CHAIN
One important problem related to the supply chain improvement process is the
development of measurement systems. These systems should evaluate the benefits
obtained from an improvement or make a comparison with some defined performance
level. For instance, it should show the demand management capability, the process and
product standardization, the cross-enterprise collaboration (Vitasek et al. 2005) as well as
work in process inventories and lead time (Phelps et al. 2004).
47
Due to the supply chain modeling complexity, it is difficult to define a performance
measurement system in a way that such system integrates the whole performance of the
supply chain. However, there are enterprise models and references widely accepted
which provide indicators and metrics like CIMOSA (Kosanke et al. 1999), IDEF0 (Lin et
al. 2002), GERAM (Bernus and Nemes, 1997), or SCOR (Huang et al. 2004). An
inappropriate metric for the supply chain performance will result in failure to meet the
customer’s expectations due to the gap between the enterprise metrics and the customer
value perception (Lambert and Pohlen, 2001).
In the literature, there are many attempts oriented to address the performance
measurement system problem. Gunasekaran (2001) defines two reasons to improve the
measuring systems in a supply chain; first, the lack of a balanced approach, and second,
the lack in a clear distinction between measures at the operational, tactical, and strategic
levels (Gunasekaran et al. 2001).
Holmberg (2000) applied the system thinking approach to model the supply chain in
order to define a measuring system. The System Thinking approaches are oriented to
define a system considering quantitative and qualitative criteria. They help to conclude
that the system performance is more than the sum of all its processes performance. His
research proposed linking the SCOR model to the Balance Scorecard to define integral
metrics for the supply chain performance measure (Holmberg, 2000). Holmberg
identifies several typical measurement problems: Strategy and measurements are not
connected; a biased focus on financial metrics; too many isolated and incompatible
measures; and the lack of supply chain context. Once again, the relevance of defining a
model or at least the common boundaries for a supply chain in order to establish the

48
metrics is emphasized by this author. In spite of, the fact that a company has an SRM or
a CRM, there is no guarantee they will be compatible in measures or information storage
within the systems of the other companies in the supply chain (Motwani et al. 2000).
A similar attempt to develop supply chain modeling and metrics in an integral way is
proposed by Lambert and Pohlen (2001). They propose a framework to capture the
performance across the whole supply chain considering the interaction between the
corporate supply chain performance and the need to differentiate the supply chain in an
enterprise in order to obtain a competitive advantage among others key factors. The
framework provides a seven-step methodology, as follow:
Map the supply chain
Analyze each link mapped
Develop profit and loss statements
Realign supply chain process to achieve performance objectives
Establish non-financial performance measures
Compare across firms and
Replicate these steps at each link in the supply chain
Apparently the framework proposed by Lambert and Pohlen (2001) is a generic
framework, but they use a Customer Relationship Management and a Supplier
Relationship Management as a link between the whole supply chain. However, not all
the enterprises in a supply chain have this kind of systems.

49
2.6 BEST PRACTICES FROM OTHER DISCIPLINES APPLIED TO SUPPLY CHAIN
There are many possible approaches to be used to improve the performance of an
enterprise in the supply chain. Because of the complexity of the supply chain, it is
possible to develop improvement procedures with different scopes, views, or impacts,
both inside and within companies. Compared to other academic disciplines such as
sociology or philosophy, logistics and supply chain are younger and with limited heritage
of empirical research and theory development. Moreover, much of the recent research
has its origins in theories from older disciplines, mainly from marketing, management,
and engineering (Stock, 1997). The following are examples of recent research about the
best practices of other disciplines applied to logistics and supply chain.
The contemporary best practices such as Lean Thinking and Six Sigma have
contributed to improve the enterprise performance in the supply chain and the logistics
process. A lean production system synchronizes demand and replenishment, which are
very important inputs for a good supply chain performance measuring system. Supply
chain waste activities may be inventories and overproduction (Kerr, 2002). Tools like the
Value Stream mapping might be used for mapping an enterprise’s supply chain process
as a whole, by first mapping all the “as-is” enterprise supply chain processes involved
directly with lead time. After that, it will be necessary to use a set of mapping and
modeling tools in order to obtain the “to-be” enterprise supply chain process in a way that
it describes the process in an comprehensive and universal form (Phelps et al. 2004). The
benefits obtained from lean adoption in the sample enterprise used by Phelps (2004) were
20% of reduction on WIP inventory and 45% of reduction in lead time. Similarly,
Vitasek et al. (2005) define six core characteristics for a lean supply chain: demand

50
management capability; waste and cost reduction; process and product standardization;
industry standards adoption; cultural change competency; and cross-enterprise
collaboration.
Similar to the lean thinking approaches, there are Six Sigma principles which can be
used for assessing the supply chain performance. Two principal issues related with
supply chain improvements are the business process synchronization and the process
variability reduction in key areas like distribution cost, stock levels, information
management or demand forecast. These issues might be controlled and improved using
six sigma concepts through controlling those decision making processes which impact in
the enterprise’s performance such as purchasing, pricing fluctuations and inventory
management; thus developing continuous improvement through a Six Sigma Supply
Chain (Garg et al. 2004).
On the other hand, since supply chain performance is directly linked to information
systems performance, much of the research focuses on Six Sigma approaches applied to
software development. The supply chain software has been challenged due to the fast
increase of customers’ requirements of information management oriented to making
decision processes related with inventory, delivery or production. Even though many
other approaches have been tried out such as the ISO9001 and ISO12204, the failure rate
of projects is high. Therefore, among others, Six Sigma for software and the CMMI
approaches emerge as a good opportunity to improve software implementation and
performance (Gack and Robinson, 2003).

51
There have been other attempts in regards to software development. For instance,
Gack and Robinson (2003) integrates Six Sigma for software, CMMI, Personal Software
Process, and Team Software Process as a set of complementary tools overlapping
concepts and providing better results than a single implementation of one of them.
Additionally, there are several combinations of CMM with other methodologies or tools.
For instance, McGuire and McKeown (2001) provide a 5 step methodology for adopting
CMM in an ISO environment. One of these steps is a gap analysis considered in the
SCOR model; another step establishes a metrics program such that a scorecard from the
Balanced Scorecard conceptualization or the SCOR model may be used. Similarly,
Murugappan and Kenni (2003) use CMM and Six Sigma in order to meet business goals.
They argue that Six Sigma and the CMM levels 4 and 5 are synergistic since CMM
provides a good infrastructure to apply the Six Sigma techniques.
Therefore, other methodologies or concepts from different fields might be used to
improve this process capability in a supply chain, such that the Six Sigma concepts of
variability reduction and control can be used in order to improve lead time and delivery
processes capability in a supply chain (Grag et al. 2004). In the same way, Lean
concepts can be used to provide effectiveness and efficiency to the process by eliminating
waste activities and all non-value-added tasks in the process through demand
management capabilities, waste and cost reduction, process and product standardizations,
industry standard adoption, cultural change competency and cross enterprise
collaboration (Vitasek et al. 2005).
Considering all these different improvement scopes, it is possible to conclude there is
a trend to integrate several techniques, tools, models and methodologies in order to assess

52
the processes of enterprises in the supply chain. However, which tool, technique,
methodology or set of them must be implemented first? Is some supply chain system
preferred for improvement initiatives? Is there some improvement route for the supply
chain assessment? Which supply chain improvement is first required? All these questions
have no unique answer. Moreover, depending on the current state of the supply chain
system, the possible actions might be different.
Therefore, the improvement road map provided by the S(CM)2 may help to define the
best improvement process for an enterprise interested in assessing its processes in the
supply chain. The following chapter shows the methodology applied in the S(CM)2
conceptualization.

53
CHAPTER III
RESEARCH METHODOLOGY
The previous chapters discussed several challenges related to building a supply chain
model. Considering these challenges of modeling the supply chain and based on the
literature review, it was concluded that a good meta-model would adhere to the following
general characteristics:
1. Provide a clear description about the model foundations. The S(CM)2 should
describe how it was developed and how it is different from other models. Thus,
the S(CM)2 requires a supply chain management definition obtained from
practitioners and academicians. This definition is used as a starting point to
generate the model.
2. Categorize the different areas of analysis that the model needs to address in a
supply chain. The S(CM)2 requires the input of practitioners and academicians to
define several views or dimensions, abstraction levels or perspectives; and a
defined life-cycle to represent the complexity of the system, similarly to the
representation used by the enterprise architectures discussed in the literature
review.
3. Provide a clear description regarding the supply chain process assessment tool of
the model. The general enterprise architectures reviewed describe how to
improve the enterprise’s processes after the enterprise model is done. Thus, the

54
S(CM)2 should provide a list of key supply chain factors for each life-cycle stage,
useful to assess a supply chain process through the model life-cycle.
4. Provide a clear description regarding the definition of an improvement road map.
Generally, a model of an enterprise process is used to represent, analyze, and
improve this process. Similarly, the S(CM)2 should provide a set of tools,
techniques, and methodologies for an enterprise to define an improvement path
based on the relevance of the factor at each stage.
Considering these characteristics, it was necessary to use a methodology that enabled
the inclusion of different points of view; and quantitative and qualitative elements in a
supply chain model. The quantitative elements should include inventory, products, raw
material, and all the tools, techniques, and models useful to analyze, control, and improve
the benefits for the enterprise. The qualitative elements include market and customer
behavior, human capital, and information systems among others. Regarding the supply
chain processes, the quantitative and qualitative elements are mixed. For instance, in the
literature, there are some works about how to improve the sales process through a single
tool like forecasting or a combination of tools from other methodologies like Value
Stream Mapping and Business Process Reengineering over the critical process activities
(Vitasek et al. 2005).
Similarly, there are other works about how to measure and control a supply chain
process. There are some frameworks adapted from other tools like the Balance Scorecard
or SCOR, which have been proposed to measure the enterprise performance in a supply
chain (Brewer and Shep, 2000). However, neither the SCOR nor the Balanced Scorecard
55
models are comprehensive for a supply chain; actually, they fail to model important
questions: What are the competitors doing? and How is it going to impact my metrics?
(Neely et al. 1997). Thus, improving the supply chain processes depends on the scope of
who is in charge of this project. Different people use different approaches based on their
experience and knowledge. Therefore, it is necessary to include and consider in the
meta-model conceptualization the point of view and experience of several people, who
are directly and indirectly linked to a supply chain process, either academically or
practically.
This chapter describes the methodology used in the development of the supply chain
capability maturity meta-model and how these requirements are met in the model
conceptualization and development. Furthermore, it describes how the meta-model was
analyzed, improved and validated by academicians and practitioners of the supply chain
field. The next section presents the Delphi Method, which is the research tool used as
data collection and conceptualization of the S(CM)2.
3.1 THE DELPHI METHOD AS A RESEARCH TOOL
The Delphi Method was developed by the Rand Corporation in the 1950’s with the
objective to provide a technique to achieve the most reliable consensus of a group of
experts (Okoli and Pawlowski, 2004). Delphi provides a method oriented to structuring a
group communication process so that the process is effective in allowing individuals to
deal, as a whole, with a complex problem (Linstone and Turoff, 1975). This technique is
favorable to consider new and future trends in complex systems over an interdisciplinary
environment (Akkermans et al. 2003). According to Kengpol and Touminen (2006), the

56
Delphi Method is composed by three principal processes: Achieve the opinion of a group
of experts, collate and statistically summarize these opinions, and provide feedback to the
participants seeking for a revision in their judgments, if any.
1. Obtain the opinion of a group of experts. The Delphi Method usually involves
sending a questionnaire to an expert panel in each of a number of rounds. The design of
the questionnaire used in the first round must include a set of questions oriented to
obtaining the opinion of a group of experts. Generally the questionnaire includes open,
ranking or classification questions about the objective of the study. Some examples are
questions to determine trends (Hayes, 2007); identify key constraints in a new process
implementation (Akkermans et al. 2003); evaluate information technology proposals
(Kengpol and Touminen, 2006), validate frameworks (Holsapple and Joshi, 2000), or
forecast based on subjective judgment (Hong-Minh et al. 2001), among others.
The number of rounds should be sufficiently large to reach consensus in the experts’
responses; at least, as many to reach marginal improvements or stability regarding
previous rounds. However, too many rounds may fatigue the panelist, such that the
quality on the responses and the number of responses decrease. In practice, most of the
studies use only two or three rounds (Mullen, 2003).
2. Collate and statistically summarize these opinions. The analysis of the responses
from the Delphi survey is generally quantitative and qualitative. The quantitative
statistical analysis may include means and standard deviation, median, range, minima and
maxima, quartiles, inter-quartile range, and frequency distribution, among others
(Mullen, 2003). These are obtained from the numerical results of the questions, for

57
example using a five-point Likert scale (from totally agree to totally disagree) or
“yes/no/do not know” answer format (Verhagen et al. 1998).
The questionnaire may include statements divided on several questions, which are
looking for consensus by question. The qualitative analysis is obtained from the
collection, classification, and summary of all the comments or arguments provided by the
experts. These comments or arguments may be generated through the inclusion of open-
end questions in the questionnaire (Holsapple and Joshi, 2000). All the information
obtained from the analysis is used to modify the questionnaire for the next round in order
to get consensus.
3. Provide necessary feedback to the participants. The information obtained from the
analysis is included in a document and sent back to the panel of experts either in the
questionnaire or in a separated document. Typically, the participants have the opportunity
to modify their answers every new round, always keeping anonymity (Mullen, 2003).
Additionally, a very important decision on the application of the Delphi Method is the
number of experts to be included in the study. In the literature, the size of the set of
experts is reported in a wide range, depending on the purpose of the research. According
to Turoff (1970) the most recommended values are between 10 and 50 (Holsapple and
Joshi, 31; Akkermans et al. 23, Okoli and Pawlowski, 18; Haynes, 20).
Regarding the supply chain, there are several applications reported in the literature.
For example, the evaluation of information technology in logistics firms (Kengpol and
Touminen, 2006), the identification of supply chain solution in a building sector (Hong-

58
Minh et al. 2001), or the impact of the ERP on supply chain management (Akkermans et
al. 2003).
3.2 METHODOLOGY USED TO GET THE META-MODEL CONCEPTUALIZATION
Based on the information obtained from the literature review shown in Chapter 2, it
was decided to design a sequential and progressive conceptualization method to generate
the meta-model. Thus, the methodology used in this research includes three stages.
Every stage adds more information to the model and validates the results achieved in the
previous step. Finally, once the meta-model was validated, the final step was to design an
assessment tool, which allowed passing from one maturity level to the next one.
The objective of stage one was to generate a draft characterization of the maturity
levels in supply chain and obtain consensus of the key elements found in a supply chain
definition. The objectives of the second stage were to improve and validate the supply
chain definition, to improve the characterization of the maturity levels and to generate a
definition for each one of them. Moreover, it was necessary to include tools, techniques
and methodologies for each level in order to pass from one maturity level to the next one.
At the end of this stage, a draft of the S(CM)2 was obtained. The objective of the final
stage was to validate the S(CM)2 draft obtained in the second stage.
The first two stages of the methodology included a Delphi method as a research tool,
running two rounds at each stage. The third stage included a comparison among the
S(CM)2 and other models, a case study and a pilot improvement process. Figure 17,
summarizes the methodology described.

59
Figure 17: Research Methodology Diagram
The detailed methodology for each one of these stages is described in the next
paragraphs.
3.3 DETAILED DESCRIPTION OF STAGE I
Figure 18 shows a detailed diagram flow for this stage. The next paragraphs describe
steps one through fourteen.

60
Figure 18: Diagram Flow for Stage I
1. Review supply chain definitions. There are many supply chain definitions in the
literature. Selecting one of them as a starting point may bias the experts’ answers
about the supply chain related questions. Even though this research does not have the

61
objective of finding a universal supply chain definition, this stage asked to a set of
experts for a definition of supply chain in order to provide a common ground.
2. Define the number of maturity levels in the model. The literature shows that there are
frameworks and models which use different numbers of maturity levels. The CMM
uses five levels (Murugappan and Kenni, 2003). The CMM evolved into CMMI,
which uses five levels in the representation of stages and six levels in the continuous
representation (Yoo et al. 2004). Similarly, regarding the supply chain management,
the business process orientation maturity model for supply chain uses five levels
(Lockamy III and McCormack, 2004), whereas the Stevens’ model uses 4 levels
(Stevens, 1989). Considering these models, the S(CM)2 is integrated by 5 maturity
levels named Initial, Defined, Integrated, Collaborative, and Leading. These maturity
levels are considered as the model life-cycle.
3. Define the draft taxonomy for each maturity level. The CMM levels were derived
from and analogous to the Crosby’s Quality Maturity Grid (Gack and Robinson,
2003). Crosby, in his maturity grid, includes five successive stages of quality
maturity as follows: uncertainty, awakening, enlightenment, wisdom, and certainty.
The first stages imply a poor knowledge about quality. The intermediate stages are
focused on transforming the attitude and understanding of quality as a management
tool. The final stage implies the understanding and recognition of Total Quality
Management (TQM) as an essential part of the company system (Calingo, 1996).
The Lockamy III and McCormack model define five levels as: “ad hoc”, defined,
linked, integrated, and extended. At this point, and to avoid a possible bias in the
answer of the experts, only the first and the last maturity levels were defined. The

62
first level was defined as poor supply chain development and the last one was defined
as leading in supply chain.
4. Design the Delphi questionnaire. In order to accomplish the objective of this stage,
the initial questionnaire includes only two open ended questions.
1) What is your personal definition of supply chain?
2) What characteristics define each maturity level?
5. Select a set of experts. This first group of experts provided their judgments about the
key elements what a definition of supply chain should include and the
characterization of each maturity level. Taking into account that the exploratory
nature of the first stage, a group size of between ten and twenty was set. A frequent
assumption is that an expert should be professionally or scientifically qualified and/or
own recognition on the study field (Mullen, 2003). For the purpose of this research,
an expert is defined as anyone with five or more years of experience in supply chain
or related fields as logistics, procurement, or sales.
6. Run the first round of the Delphi survey. Once the experts were selected, the next
step was to send an invitation letter requesting their participation in the research. The
letter included the objective of the research, a brief explanation of how participants
were expected to answer, and the two open ended questions mentioned in step four.
This Delphi study was run in Mexico; thus, most of the experts received the
information personally or by e-mail in Spanish. A translation of the invitation letter
used is shown in APPENDIX 1.
63
7. Data compilation. Once surveys were answered, the data obtained were stored in a
database for future analysis.
8. Data Analysis. The analysis was done using statistical tools and affinity diagrams.
Results are shown and discussed in the next chapter.
9. Integrate a draft supply chain definition and improve the taxonomy. This step
integrates a draft definition of supply chain. This definition summarizes the answers
provided by the experts in the first round of this stage, regarding what they
understood by Supply Chain. The supply chain definition generated is the following:
“Supply chain is a network of enterprises, which integrates all processes from the
supply and procurement of raw materials to delivering a finished good. The supply
chain involves all processes oriented to improve logistics and productivity.”
Even though providing a supply definition is not an objective of this research, this
one was used to define a context for the experts. The definition was improved
through stages I and II.
10. Design the second round of the Delphi survey. The second questionnaire included the
draft definition shown in the last step and the list of key factors identified from the
experts answers. The definition was improved and validated through two different
types of questions. The first one ranks the definition agreement using the Likert scale
and a second one was an open ended question about what elements were missing in
the definition. A different section requests ranking the relevance of the key factors in
each maturity level and an open ended question about the characterization of the
level. A translation of this second survey is shown in Appendix 2.

64
11. Run the second round of the Delphi survey. The surveys were sent personally or by
email to the experts. The surveys were sent to the same set of experts of the first
round even though some of them had not returned the first survey.
12. Data compilation: Once surveys were answered, the data obtained were stored in a
database for future analysis.
13. Data Analysis. This analysis was done using statistical tools and affinity diagrams.
The results from this round are shown and discussed in the next chapter.
14. Survey Conclusion. Once the analysis is done, it is possible to conclude about the
findings reached in the stage. These are deeply discussed in the next chapter.
3.4 DETAILED DESCRIPTION OF STAGE II
This stage has several objectives. The first one is to validate the definition and
characteristics of each maturity level. The second one is to identify the tools, techniques,
and methodologies available to pass from one level to the next one. Finally, the last
objective is to improve the supply chain definition, which is only a contextual reference
in the model. Figure 19 shows a detailed diagram flow for stage II.
The numbering continues from the last step number in stage one, in a way that this
stage includes steps fifteen to twenty eight. Notice that the darker boxes imply post
analysis and improvement activities based on the Delphi results. The lighter boxes belong
to the Delphi method such that they are the same as the used in the previous stage.

65
Figure 19: Diagram Flow for the Stage II
15. Improving the supply chain definition. Based on the answers provided by the experts
in the first stage of the methodology, the supply chain definition shown in step 9 was
improved. In the first stage the experts were asked about what was missing in the
first supply chain definition. The following supply chain definition summarizes the
feedback provided by the experts in the second round of the stage I.

66
“Supply Chain is a system which manages and controls the use of facilities, processes,
resources, and supplies in order to improve the logistic productivity in the enterprise. All
the processes of the supply chain system have the objective of promoting products and/or
services with value to their customers. This goal is achieved through the coordination
among all the supply chain stakeholders. All supply chain processes are based on the
knowledge and satisfaction of the customer requirements regarding quality, time
response, cost, flexibility, and innovation”.
16. Compilation of a list of characteristics for each level. These characteristics were
obtained by summarizing the results from stage I regarding the elements which define
each taxonomy level.
17. Define each maturity level. Based on the characteristics found in the last point, it
generates a draft definition for each maturity level.
18. Design the first Delphi survey for the second stage. Considering the objectives of the
stage, the survey should include open ended questions oriented to identify the tools,
techniques and methodologies available to improve the supply chain, further
validation of the questions using the Likert scale oriented to ask for acceptance of the
maturity levels and a definition of supply chain. The final design includes three
questions related to the supply chain definition, five questions related to the maturity
levels, one for each level, and five open ended questions related to the possible
improvement solutions, one for each level. The survey is shown in Appendix 3.
19. Select the set of experts. Since one of the objectives of this stage is to validate the
maturity level taxonomy, it was convenient increased the set of experts, including a

67
larger spectrum of scopes and interests, which implies considering a larger number of
candidates to participate in the process. In this step a target of at least sixty
invitations were sent, expecting a rate of answer of at least seventy percent.
20. Run the first round of the Delphi survey. Once the potential participants were
selected, the next step was to sent an invitation letter requesting their participation in
the research. The letter included the objective of the research, a brief explanation of
how the participants were expected to answer, and the open ended questions
mentioned in step eighteen. Appendix 3 shows a translation of this invitation letter.
21. Data compilation: Once surveys were answered, the data obtained were stored in a
database for future analysis.
22. Data Analysis. This analysis was done using statistical tools and affinity diagrams.
The results from this round are shown and discussed in Chapter 5.
23. Create a list of possible solutions to improve the supply chain. After analyzing the
results from the first round in this stage, it is necessary to compile a list of all the
possible solutions provided by the experts to improve the supply chain at each level.
This list will be validated and improved in the second round by the same experts.
24. Design the second round Delphi survey. Considering the information obtained in the
first round, the original questionnaire was modified including the additions to the
draft definition of each maturity level, generated from the first round of answers.
Once the modifications were made, the experts were consulted again using the second
Delphi survey. The number of questions used in this round increased, due to the need
of validating some discrepancies obtained from the affinity diagrams regarding the
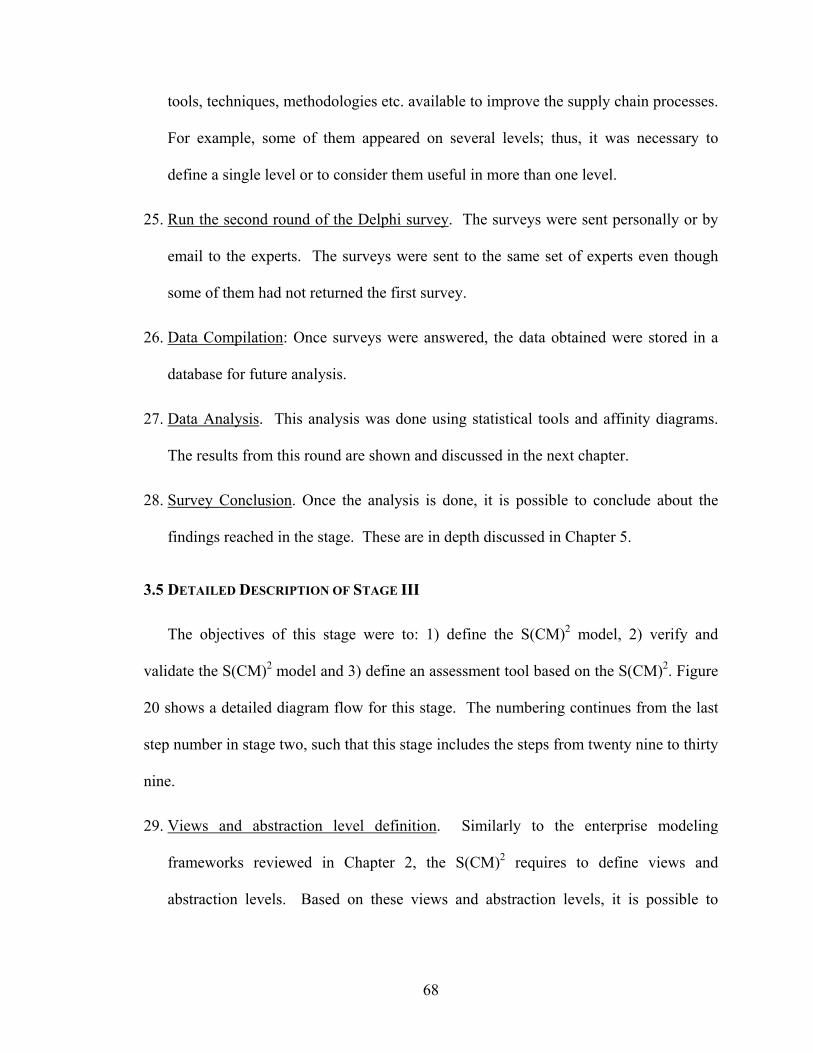
68
tools, techniques, methodologies etc. available to improve the supply chain processes.
For example, some of them appeared on several levels; thus, it was necessary to
define a single level or to consider them useful in more than one level.
25. Run the second round of the Delphi survey. The surveys were sent personally or by
email to the experts. The surveys were sent to the same set of experts even though
some of them had not returned the first survey.
26. Data Compilation: Once surveys were answered, the data obtained were stored in a
database for future analysis.
27. Data Analysis. This analysis was done using statistical tools and affinity diagrams.
The results from this round are shown and discussed in the next chapter.
28. Survey Conclusion. Once the analysis is done, it is possible to conclude about the
findings reached in the stage. These are in depth discussed in Chapter 5.
3.5 DETAILED DESCRIPTION OF STAGE III
The objectives of this stage were to: 1) define the S(CM)2 model, 2) verify and
validate the S(CM)2 model and 3) define an assessment tool based on the S(CM)2. Figure
20 shows a detailed diagram flow for this stage. The numbering continues from the last
step number in stage two, such that this stage includes the steps from twenty nine to thirty
nine.
29. Views and abstraction level definition. Similarly to the enterprise modeling
frameworks reviewed in Chapter 2, the S(CM)2 requires to define views and
abstraction levels. Based on these views and abstraction levels, it is possible to

69
represent the model as a matrix of explicitly differentiable elements over the model
life-cycle.
Figure 20: Diagram flow for stage III
30. Include the key improvement factors per level. Since the model has the objective to
improve a supply chain, it requires a prioritized list of key improvement elements in
each maturity level. This prioritized list came from the experts’ responses obtained
after applying the Delphi survey in the second stage.

70
31. Include tools to pass through levels. Identifying key improvement elements is not
good enough to achieve improvement. The model requires a set of tools, techniques,
and methodologies useful to pass from one maturity level to the next one. These
tools, techniques, and methodologies came from the experts’ responses obtained after
applying the Delphi survey.
32. Define the S(CM)2. Having completed the two previous steps, the model was built.
The maturity levels as the model life-cycle, the views, the abstraction levels, the key
improvement factor, and the tools compose the whole S(CM)2 meta-model.
33. Verify the Model. Once the model was built, the following step was to verify its
conceptualization through a comparison with the models reviewed in Chapter 2.
34. Run a case study to validate the Model. After the verification, the model was
validated as a diagnostic tool through the application of a case study. This case study
describes a couple of enterprises, so that the participants in the study identify the
maturity level of the enterprise.
35. Validate the model through interviews with experts. A different validation process
was run in parallel to increasing the confidence in the model. This validation was
done through interviews with experts in the supply chain field. Their comments, and
responses were analyzed to define strengths, weaknesses, and future research related
to the model.
36. Compile validation results. After running both validation processes the final
documentation of the model was done.

71
37. Future work and possible improvements. This step implies documenting the findings
obtained from steps 34 and 35.
38. Define an assessment tool. Once the S(CM)2 was finished, this step defines and
designs an assessment tool, which is useful to create an improvement path for the
enterprise.
39. Model generalization. Finally, the model should have a universal way to be defined.
The last step proposes a general supply chain performance classification, useful to
provide a common language for future works related to this model. This classification
is similar to the one used to classify waiting lines in the queue theory analysis.
The following chapters describe the results obtained after applying the methodology
discussed in this chapter.

72
CHAPTER IV
STAGES RESULTS
This chapter summarizes the findings obtained from the Delphi method during stages
one and two of the research methodology. These results are the foundation of the S(CM)2
since they provide the taxonomy of the model, the key improvement factors in a supply
chain, and a set of tools required to reach the next maturity level in the model. The
results are presented in chronological order; thus, the information about the qualifications
of the experts is shown before the main results for each stage are stated.
4.1 QUALIFICATION OF THE EXPERTS FOR STAGE I
Eighteen experts were invited to participate in the research process. The participants
were selected from a list of personal contacts previously obtained. All the experts had at
least five years of experience in supply chains or a related area such as logistics, sales, or
procurement. Since a supply chain may be defined in several ways depending on the type
of business, this set of experts represents different types of businesses. This assortment
covers a wide kind of input about what a supply chain should be. The participants were
in the industries listed in Table 2:
Regarding their academic qualifications, all the experts hold at least a BA or a BS
degree, six of them hold a master’s degree and one hold a PhD. The experts are related to
the supply chain from different positions, such as logistics, processes engineering or
production planning. Table 3 shows the position of the experts consulted.

73
Table 2: Type of Business Represented in the Stage I
Food packing (1) Construction materials (1)
Construction equipment (1) Glass industry (1)
Home improvements (1) Air Conditioning products (1)
Domestic motors (1) Chemistry industry (1)
Frozen food products (1) Medical devices (2)
Consultancy services (3) Beauty supplies (1)
Academy (3)
Table 3: Positions Represented in the Stage I
Logistics Manager (3) Process Engineering (1)
Project Manager (2) Sales Manager (3)
Professor (3) Consultant (3)
Planning Manager (1) Operations Manager (1)
Procurement Manager (1)
4.2 SUMMARY OF THE RESULTS FOR STAGE I
After defining the sample of experts to be consulted in this stage, the experts received
an invitation letter either by email or personally, which explained the research and the
role they played. The eighteen participants answered the first and second rounds of the
Delphi survey shown in Appendices 1 and 2. The first round allowed setting a basic
supply chain definition and a list of characteristics which defined each maturity level.
Additionally, the experts listed a set of key improvement factors related to the supply
chain. The second round was focused on improving the supply chain reference
definition, and to prioritizing the set of key improvement factors obtained in the first
round. Also, the experts added any other key factors missing from the first round. Table
4 summarizes the main findings in this stage.

74
Table 4. Principal Findings of the Stage I
Round One Round Two
Elements of a supply chain definition used as a starting point during the research
Main characteristics of each maturity level. The taxonomy defines five maturity levels. Level one describes an enterprise with poor supply chain development and the level five describes a leading enterprise in the market
A list of Key Improvement Factors through the maturity levels
Consensus about the elements of a supply chain definition.
A draft definition of each maturity level based on the answers received in round one.
A prioritized list of Key Improvement Factor through the maturity levels.
4.2.1 Characterization of each Maturity Level
The experts were asked about the characteristics a supply chain should have
according to the following taxonomy. Level one: This is an enterprise with poor supply
chain development, Level five: This is a leading enterprise in the market. The
intermediate levels were set free to be defined by the answers of the experts. The
characteristics collected were used to create a definition for each maturity level. This
final result was used in the stage II as the starting definitions for each maturity level.
Table 5 shows some of the results obtained for each maturity level.
Table 5: Characterization of each Maturity Level
Maturity Level Characteristics
One
There is lack of performance indicators and communication between departments. There is unpredictable process performance. There are no procedures defined in the enterprise. Success is based on meeting the customer requirements without concerns about cost. There are no information systems. There is lack of inventory management and supplier selection policies. Employees’ training is deficient or non-existing.
Two
There are basic information systems, forecast methods, and performance indicators. Beginning efforts to document and standardize processes, policies, and procedures. There is weak coordination between departments and processes. There is no certainty about inventory levels, how much and where the products and raw materials are physically. The first attempts to increase the quality in the products and services, to develop customers’ loyalty appears.

75
Maturity Level Characteristics
Three
There is a formal project to integrate processes, information systems, departments, activities, and other related procedures to organize the enterprise internally. The first attempts to optimize processes appear, logistics is recognized as a key competitive issue in the whole enterprise. The first cross-disciplinary improvement tools such as ISO, Lean Manufacturing, or Six Sigma start to be implemented. The KPIs are defined and its documentation is in process. A customer service department emerges. A department oriented to optimize the supply of raw materials and product distribution emerges.
Four
There is strict control of the supplier deliveries related to order completeness, quality assurance, and delivery time. There is deep knowledge of the internal enterprise processes. There are improvement processes oriented to the implementation of technological solutions. Employees receive training oriented to get better results in their positions. Customers trust the products and services offered by the enterprise. The enterprise tries to have influence in the customer’s perception of value. The enterprise starts to explore the possibility to make alliances or partnerships with other enterprises.
Five
Customers appreciate customer service. The work culture is well-defined and established in the enterprise. The product distribution and supplies procurement are constantly optimized. Relevant information is easily reachable and shown with a high usability level. The enterprise invests on research and product development. The enterprise has several certifications of its products and processes. The enterprise has strong alliances and partnerships with other enterprises. The enterprise is focused on its core business tending to outsource the remaining processes. The enterprise has a big influence over customers requirements and suppliers processes. The enterprise is a benchmark for other enterprises.
These results highlight an enterprise’s internal integration processes from levels one
to three. Level four starts with the collaboration with other enterprises and the growth of
partnerships and alliances. Finally, level five describes a leading enterprise in the market,
with a strong focus on product development, innovation, research, customer satisfaction,
integration of suppliers, and a very attractive working environment. Considering these
descriptions, the maturity levels are labeled as: Undefined, Defined, Manageable,
Collaborative, and Leading.

76
4.2.2 Prioritization of the Key Improvement Factor in a Supply Chain
A very interesting result was the list of supply chain improvement factors. These
were mentioned by the experts as key factors to attain the level proper of an outstanding
supply chain. The first round of this stage collected twenty seven factors. These factors
are shown in Table 6.
Table 6: List of Key Improvement Factors
1. Company Objectives, vision and mission
2. Cost
3. Customer requirements
4. Customer Service
5. Defects/reworks/scrap
6. Demand Forecasting
7. Demand Management
8. Enterprise Policies
9. Inventory Management
10. ISO
11. KPI
12. Lead Time
13. Logistics
14. Optimization processes
15. Organization structure
16. Procedures
17. Process Capability
18. Processes Synchronization
19. Product
20. Product Distribution
21. Production
22. Quality
23. Raw materials procurement
24. Change Response Time
25. Shipping
26. Suppliers
27. Warehousing
Even though some of these factors could be similar, or overlap functions or processes,
none were eliminated. The reason was to discriminate or specify as much as possible a
prioritized list of improvement factors. In order to determine the relevance of each factor
in each maturity level, the second round of the Delphi survey asked to select from the list
shown in Table 6 the most important factors for each level. Table 7 shows the percentage
times each factor was mentioned. The shaded cells are the three largest percentages for
each level.
These percentages represent the number of times that a particular improvement factor
was recognized as relevant in every maturity level. For example, the answers of the

77
experts included at most eighteen mentions; fifteen of them remarked the product as key
improvement factor for this maturity level. Thus, the final list was obtained considering
those factors, which received at least the fifty percent of approval. Intending to provide a
more clear description for these factors, some additional information was added to them.
Table 8 shows the key factor for each maturity level.
Table 7: Prioritization of Improvement Factors for Maturity Level Improvement Factor Level 1 Level 2 Level 3 Level 4 Level 5
Company Objectives, vision and mission 17% 22% 50% 17% 11% Cost 56% 44% 44% 39% 50% Customer requirements 67% 50% 67% 78% 56% Customer Service 6% 28% 56% 6% Defects/reworks/scrap 50% 67% 44% 6% 6% Demand Forecasting 11% 11% 6% Demand Management 33% 28% 6% 17% Enterprise Policies 11% 50% 11% 39% Inventory Management 44% 89% 39% 17% 50% ISO 44% KPI 39% 61% 17% 33% 39% Lead Time 39% 6% 6% Logistics 39% 22% 56% 67% 67% Optimization processes 33% 6% 6% Organization structure 39% 6% Procedures 33% 44% 78% 33% 33% Process Capability 50% 17% 39% 61% Processes Synchronization 6% 22% 67% Product 78% 39% 17% 11% 22% Product Distribution 11% 50% 6% Production 83% 44% 33% 61% 28% Quality 44% 67% 72% 78% 67% Raw materials procurement 33% Response Time 17% 17% 17% 56% 44% Shipping 28% 28% 39% 17% Suppliers 28% 56% 28% 6% Warehousing 28% 11% 22% 44% 33%

78
Table 8: Key Improvement Factor for each Maturity Level
Maturity Level Prioritized Key Improvement Factors
Undefined 1. Document Production processes; 2. Review the Catalog of Products; 3. Focus on Customer requirements; 4. Focus on cost reduction; 5. Reduce defects / reworks / scrap.
Defined
1. Define Inventory management rules; 2. Reduce defects / reworks / scrap; 3. Focus on Quality improvements; 4. Enterprise KPI's Definition; 5. Development and Certification of suppliers; 6. Focus on Customer requirements; 7. Improve process capability.
Manageable
1. Development of procedures and control rules over all the enterprise processes; 2. Focus on Quality improvements; 3. Focus on Customer requirements; 4. Optimization of inbound and outbound logistics processes; 5. Evaluation and actualization of the enterprise objectives, vision, mission; 6. Evaluation and actualization of the enterprise policies.
Collaborative
1. Focus on Customer requirements; 2. Focus on Quality improvements; 3. Optimization of inbound and outbound logistics processes; 4. Analyze and improve Production processes; 5. Focus on offering an outstanding customer service; 6. Lead time and Response time reduction; 7. Product distribution optimization.
Leading
1. Optimization of inbound and outbound logistics processes; 2. Process synchronization (production, sales, procurement etc); 3. Focus on Quality improvements; 4. Improvement of the production process capability; 5. Focus on Customer requirements; 6. Focus on cost reduction; 7. Review and Improve Inventory management rules.
These findings were considered to design the second stage of the research. The main
results obtained from this second stage are presented in the next two sections.
4.3 QUALIFICATION OF THE EXPERTS FOR STAGE II
Eighty experts were invited to participate in this research process. The sample size
was increased in this stage due to the need to validate the maturity levels. Unfortunately,
only seventy experts participated in the study. Similar to stage one, the seventy
participants were selected from a list of personal contact information. All the experts had
at least five years of experience on supply chain or a related area such as logistics, sales,

79
or procurement. The average experience of the experts consulted was of twelve years.
Table 9 shows the distribution of the years of experience of the participants in stage II.
Table 9: Experts’ Years of Experience
Years of Experience Number of Experts Percentage
5 to 9 29 41%
10 to 14 18 26%
15 to 20 10 14%
20 to 25 7 10%
More than 25 6 9%
Total 70 100%
The increase in the size of the set of experts consulted allowed to include more types
of businesses than in stage one. Since the S(CM)2 is a supply chain reference model, the
more types of business represented, the more representative the sample was. Table 10
shows the type of businesses included in the Delphi study.
Table 10: Type of Business Represented in the Stage II
Academy (4) Construction (2) Glass Industry (1)
Air Condition Equipments (3) Consultancy services (8) Imports and Sales (1)
Air Conditioning suppliers (2) Customs (1) Logistics Services (2)
Automotive (3) Electric Industry (2) Newspapers (1)
Beverages (9) Electronic Equipments (1) Pharmaceutical Research (1)
Cement Industry (3) Food Packing (1) Plastic Products (2)
Chemistry industry (1) Food Products (6) Purified Water (2)
Clothes (1) Footwear Industry (1) Software Development (2)
Computers (1) Furniture (3) Steel Industry (6)
Regarding their academic qualifications, all the experts hold at least a BA or a BS
degree. The experts were related to the supply chain from different positions, such as

80
logistics, processes engineering or production planning. Table 11 shows the position of
the experts consulted.
Table 11: Positions Represented in Stage II
CEO (13) Production Manager (4)
Consultant (7) Professor (4)
Distribution Manager (6) Project Manager (2)
Industrial Engineering Manager (1) Quality Manager (1)
Logistics Manager (9) Regional Manager (3)
Operations Manager (4) Sales Manager (8)
Planner Manager (1) Service Manager (1)
Procurement Manager (4) Supply Chain Manager (1)
Product Development (1)
Observe that, the 64% of the positions represented (45/70) are managers, who are the
most probably users of this mete-model.
4.4 SUMMARY OF THE RESULTS FOR STAGE II
After defining the sample of experts to be consulted in the second stage, the experts
received an invitation letter either by email or personally, which contained the
explanation about the research and the role they played. The seventy participants
answered the first and second rounds of the Delphi survey in this stage. The first round
was focused on validating the definition of each maturity level and the supply chain
definition used as a starting point for this second stage.
The supply chain maturity level definitions were built considering the characteristics
described in Table 5, the improvement models proposed by Crosby in his Quality
Maturity Grid, and Stevens in his Supply Chain Integration Model. Thus, the first
maturity levels imply a poor knowledge about supply chain (undefined & defined). The

81
intermediate level is focused on transforming the attitude and understanding of the supply
chain, such that the enterprise reaches an internal integration (Manageable). The final
stages imply the understanding and recognition of management about the supply chain
processes as an essential part of the company’s systems. Consequently, level four
(Collaborative) represents the start of the external integration among suppliers, enterprise,
and customers. Finally, level five (Leading) represents an enterprise, leader in the
market, which is commonly used as benchmarking by its supply chain processes.
Regarding the supply chain definition, it is not a main objective of this work, so only the
relevant results regarding the maturity levels are reported in this document.
The second round of this stage was focused on collecting a set of tools, techniques,
methodologies, or work philosophies useful to improve the supply chain processes from
one level to the next one. The maturity level definitions, their respective validation
results, and the set of tools collected for each level are shown together in the following
subsections.
4.4.1 Validation of the Maturity Level: Undefined
The following definition for the Undefined level was sent to the experts:
Maturity Level: Undefined. This is an enterprise with no process documentation or
standardization; there is lack of knowledge about the enterprise’s processes, activities,
and tasks; the enterprise primarily reacts to the environment instead of planning; the
enterprise remains in the market by a small advantage on sale price, location, or customer
relationship in comparison with the competition; there is no continuous improvement
plan defined; all the improvements are reached by individual and isolated efforts; the

82
productive processes are focused on completing the customer orders; however, they may
experience frequent problems in meeting customers’ expectations; the enterprise does not
have a defined vision or mission.
The experts indicated their agreement level through a Likert scale, which was defined
as: Strongly agree, moderately agree, neutral, moderately disagree, and strongly disagree.
Due to the wide conceptualization of a supply chain discussed previously, the eighty
percent of agreement is considered a minimum boundary for validation purposes.
According to the Likert scale, the Strongly Agree and Moderately Agree options should
accumulate at least 80% of the answers. Figure 21 shows the validation results for this
level. Analyzing the results, the 47% of the answers were Strongly Agree and 40 % of
the answers were Moderately Agree, which implied an 87% of acceptance.
3328
72 0
05
10152025303540
Strongly Agree
Moderately Agree
Neutral Moderately disagree
Strongly disagree
Ans
wer
Fre
quen
cy
Agreement level
Undefined Level
Figure 21: Acceptance of the Definition for the Undefined Level
4.4.2 Set of Useful Improvement Tools for the Undefined Level
Regarding the second round of results, the set of tools, methodologies, work
philosophies, etc. recommended by the experts to improve processes from this maturity
level to the Defined level were as follows: do Strategic Planning (mission, vision,

83
company values…); do SWOT analysis; do flow, process, and operation diagrams;
implement basic office tools (worksheets, text files etc…) useful to generate reports, store
data, get information etc.; do customer interviews; deploy strategies to define KPI's:
research in the literature and previous models, do Delphi benchmarking, focus groups
etc.; document and standardize enterprise’s models; apply 5's concepts; and use Internal
logistics tools.
4.4.3 Validation of the Maturity Level: Defined
The following definition for the Defined level was sent to the experts:
Maturity Level: Defined. This is an enterprise which recognizes the value of defining
its vision and mission; at this level the enterprise starts to consider the strategic market
elements such as price fluctuations, new products, tendencies, etc; there is lack of
documentation at all the enterprise levels; the enterprise has not defined a target market to
which offer a wide catalog of products, even though many of the products imply losing
money; the first attempts to develop customer loyalty and suppliers appear; the enterprise
has basic and generic office software without specialized software for the industry or
functions; the enterprise starts to collect data and use them to generate information useful
to making decisions; there are no performance measurement systems; and the
improvement efforts are still unorganized.
Figure 22 shows the validation results for this level. Analyzing the results, 39% of
the answers were Strongly Agree and 46 % of the answers were Moderately Agree,
which implies an 84% of acceptance.

84
2732
9
2 005
10152025303540
Strongly Agree
Moderately Agree
Neutral Moderately disagree
Strongly disagree
Ans
wer
Fre
quen
cy
Agreement level
Defined Level
Figure 22: Acceptance of the Definition for the Defined Level
4.4.4 Set of Useful Improvement Tools for the Defined Level
Regarding the second round of results, the set of tools, methodologies, work
philosophies, etc. recommended by the experts to improve processes form this maturity
level to the Manageable level were as follows: define a target market; research on
customer requirements; integrate internal processes; training personnel; do cost analysis;
implement seven administrative tools; implement process control tools; optimize
processes; improve the MRP technical support; improve basic technology systems;
document the positions profile; implement warehouse management systems; and audit
processes.
4.4.5 Validation of the Maturity Level: Manageable
The following definition for the Manageable level was sent to the experts:
Maturity Level: Manageable. The enterprise is searching a target market, the first
attempt to integrate processes is made; the enterprise starts to deploy continuous

85
improvement plans with special focus on process documentation and standardization; the
personnel is induced to an organizational culture oriented to customer satisfaction and
personal development; there are closer negotiations with suppliers regarding policies,
times and costs; the improvement process applied a set of tools or techniques instead of a
single one; there are isolated information systems useful to measure, control, and make
decisions oriented to processes improvement.
Figure 23 shows the validation results for this level. Analyzing the results, 56% of
the answers were Strongly Agree and 33 % of the answers were Moderately Agree,
which implies 89% of acceptance.
39
23
71 0
05
1015202530354045
Strongly Agree
Moderately Agree
Neutral Moderately disagree
Strongly disagree
Ans
wer
Fre
quen
cy
Agreement level
Manageable Level
Figure 23: Acceptance of the Definition for the Manageable Level
4.4.6 Set of Useful Improvement Tools for the Manageable Level
Regarding the second round of results, the set of tools, methodologies, work
philosophies, etc. recommended by the experts to improve processes form this maturity
level to the Collaborative level were as follows: implement internal logistic tools such as

86
Kanban, JIT concepts, Lean tools; Statistical Process Control, Statistical Analysis;
classify source and outsource processes; use specialized software i.e. MRP, ERP, etc.;
use process standardization tools such as flow diagrams, process documentation,
auditing, etc.; obtain quality certifications and awards; make strategic alliances with
suppliers and other enterprises; analyze customer satisfaction periodically; optimize tools
such as Linear and Integer Programming; Analyze tools such as Simulation, Design of
Experiments; deploy continuous improvement programs; implement Decision Support
Systems; and provide training based on functions and skills required.
4.4.7 Validation of the Maturity Level: Collaborative
The following definition for the Collaborative level was sent to the experts:
Maturity Level: Collaborative. An enterprise at this level has defined collaboration
strategies oriented to integrate customers and suppliers; there is clear orientation to
satisfy the customer’s expectations; there are several improvement processes related to
the knowledge of customers’ needs; there are integrated information systems, which
provide a technological platform for data exchange among suppliers, company, and
customers, generating key information about the market and the competence; there are
several measurements and evaluation related to the supplier’s performance; there is a
better selection of suppliers; the enterprise uses more complex improvement processes
due to the holistic project focus; there is in depth knowledge of all the enterprise’s
processes. Figure 24 shows the validation results for this level. Analyzing the results,
57% of the answers were Strongly Agree and 34 % of the answers were Moderately
Agree, which implies 91% of acceptance.

87
40
24
51 0
05
1015202530354045
Strongly Agree
Moderately Agree
Neutral Moderately disagree
Strongly disagree
Ans
wer
Fre
quen
cy
Agreement level
Collaborative Level
Figure 24: Acceptance of the Definition for the Collaborative Level
4.4.8 Set of Useful Improvement Tools for the Collaborative Level
Regarding the second round of results, the set of tools, methodologies, work
philosophies, etc. recommended by the experts to improve processes form this maturity
level to the Leading level were as follows: use Total Quality Management concepts;
implement Supplier Relationship Management and Customer Relationship Management
systems; integrate internal processes; provide personnel training and encourage
commitment; optimize processes; Improve technological tools, automate processes;
implement Warehousing Management Systems; obtain quality certifications and awards;
manage daily work; use Hoshin Kanri method; implement lean thinking tools; implement
decision support systems; use technology management strategies; use modeling tools
such as systems thinking, relationship diagrams, dynamic modeling; implement
concurrent engineering processes; optimize routing systems; and do value analysis.

88
4.4.9 Validation of the Maturity Level: Leading
The following definition for the Leading level was sent to the experts:
Maturity Level: Leading: An enterprise in this maturity level will be able to innovate,
develop, and transfer the best practices; this type of enterprises has a strong influence
over suppliers and customers regarding their work culture and methods, information
systems, continuous improvement processes etc; key processes and functions are aligned
to the enterprise’s mission and corporative strategy; the personnel is aware about the
value that they add to the product with their activities, such that they are looking for more
efficient and effective ways to do them. Information systems integrate suppliers,
company, and customers’ key information, which is available to everyone who needs it;
there is a strong dependence of technological solutions.
Figure 25 shows the validation results for this level. Analyzing the results, 61% of
the answers were Strongly Agree and 33 % of the answers were Moderately Agree,
which implies 94% of acceptance.
43
23
40 0
05
1015202530354045
Strongly Agree
Moderately Agree
Neutral Moderately disagree
Strongly disagree
Ans
wer
Fre
quen
cy
Agreement level
Leadership Level
Figure 25: Acceptance of the Definition for the Leading Level

89
4.4.10 Set of Useful Improvement Tools for the Leading Level
Regarding the second round of results, the set of tools, methodologies, work
philosophies, etc. recommended by the experts to keep processes in this maturity level
were as follows: share systems information in real time; optimize Processes; integrate
internal processes; provide personnel training and encourage commitment; implement
Warehousing Management Systems; integrate stakeholders; do focus groups with
customers; implement TQM systems; apply innovation methodologies in the enterprise
processes such as TRIZ, implement Design for Six Sigma, and QFD; use Hoshin Kanri
method; implement Decision Support Systems; use rapid prototyping; implement
computer integrated manufacturing and flexible manufacturing systems; and implement
value engineering tools.
Summarizing the results the five maturity levels have at least 80% of acceptance to its
definition. Thus it is possible to conclude that they have been are validated by the
experts participating in the Delphi survey.
The following chapter describes how these results are used to integrate the final
Supply Chain Capability Maturity Model. It also presents the verification and validation
processes for this S(CM)2.

90
CHAPTER V
THE SUPPLY CHAIN CAPABILITY MATURITY MODEL
The previous chapter described how the Delphi method was used to assess a supply
chain from different perspectives in regards the maturity level taxonomy. Also, the
answers obtained from the Delphi method allowed to collect a set of reference actions
performed by enterprises to improve the supply chain, which described the characteristics
of several supply chain elements from different points of view. The maturity level
taxonomy and these reference actions are related among them, jointly represent a
snapshot of a supply chain process through two different scopes. Additionally, a third
element was the set of prioritized Key Improvement Factors for each maturity level,
which provided information about key supply chain elements for each maturity level.
Thus, this chapter describes how to integrate these three elements in a meta-model, the
S(CM)2.
5.1 DEFINITION OF THE VIEWS AND ABSTRACTION LEVELS IN THE S(CM)2
Considering the findings obtained from the Delphi survey and based on the models
described in Chapter 2, the information is integrated through a set of views and
abstraction levels. The views collectively describe and clarify the complex activities of a
supply chain system. The abstraction levels are the time perspectives for each view,
which are used to determine the supply chain business activities through time, to meet the
maturity level requirements. As a result of this arrangement, views and abstraction levels
integrate a matrix of clearly differentiable supply chain elements.

91
The views were defined through an analysis of the results obtained from the previous
two stages. From the first stage, the whole set of characteristics provided by the experts
to define a supply chain, and from the second stage, the maturity level definitions
validated by the experts. After combining these two results in a database, the
characteristic were grouped defining seven views.
1. Suppliers
2. Production Systems
3. Inventory
4. Customers
5. Human Resources
6. Information Systems & Technology
7. Performance Measurement Systems
The definition of each view is the following:
1. Suppliers: This view contains functions, processes, activities, and tasks related to
the integration, collaboration, and development of the suppliers. The reference
actions include defining policies to select and develop suppliers; defining
collaboration strategies with the suppliers; implementing quality assurance in the
transportation and delivery of raw materials; making commercial agreements such
as incoterms etc.
2. Production Systems: This view includes the functions, processes, activities, and
tasks regarding the transformation of the product or service. In other words, the
92
reference actions, which add value to the product or service, such as reduction of
defects, scrap, and reworks; documentation and standardization of functions and
processes; internal logistics issues; deployment of projects to reduce the lead
time; implementation of production planning strategies etc.
3. Inventory: This view encloses all the reference actions related to the inventory
management and control. Therefore, reference actions related the management
and control of all kinds of inventories such as raw materials, finished goods, work
in process, scrap, spare parts, etc. are included in this view.
4. Customers: The customers view includes all the reference actions in regards to
meeting the customer’s expectations. Consequently, some of the actions enclosed
in this view are identifying the customer needs; attending the customers’
complains; developing customers’ loyalty to the company products and services;
following up the sale after delivery; implementing projects to increase the
perception of value in the products and services provided by the enterprise etc.
5. Human Resources: The Human Resources view contains the reference actions
related to the enterprise’s employees, their integration in the company and the
work environment. Therefore, in this view are reference actions such as training;
development of a work culture; implementing actions to reduce the employees’
turnover; implementing projects to improve the enterprise’s work conditions;
development of rewarding strategies etc.
6. Information Systems & Technology: This view encloses the reference actions
directly linked to the development and implementation of information systems,
93
and the technology management processes. Some of the actions included in the
view are evaluating and implementing technological solutions such as ERP
systems, RFID solutions, Warehousing Management Systems; automated
equipments and so on; documenting and standardization of the data collection
process; implementing projects to reduce the down times in the information
systems and equipments of the enterprise etc.
7. Performance Measurement Systems: This view comprises the reference actions
oriented to measure the enterprise’s performance regarding processes, functions,
and employees. Thus, some of the reference actions enclosed in this view are
defining the enterprise KPI’s; defining the periodicity of the information analysis
concerning the performance of a process, function or employee; communicating
to the employees the meaning of each performance indicator, and how to calculate
it; standardize the use and presentation of the performance indicators and so on.
Regarding the abstraction levels, there are three common perspectives used to plan
and analyze the supply chain business activities, these perspectives are namely
operational, tactical, and strategic. According to several supply chain experts, these
perspectives are required to develop the integration of a marketing channel, which is one
of the main goals of this model (Svensson, 2002). The operational perspective considers
those activities that should be done in a long time period, generally during more than one
year. The tactical perspective considers an intermediate time horizon; generally less than
one year. Finally, the operational perspective considers short-range activities, which
should be done in hours or days (Ballou, 2004). The resulting matrix of integrated views
and abstraction levels is shown in Figure 26.

94
Abstraction Levels
Operational Tactical Strategic
Vie
ws
Suppliers
Production Systems
Inventories
Customers
Human Resources
Information Systems & Technology
Performance Measurement Systems
Figure 26: Views and Abstraction Levels for the S(CM)2 The next section describes how this matrix is integrated in the other supply chain
models obtained in this research.
5.2 THE INTEGRATION OF THE S(CM)2
The matrix shown in Figure 26 encloses a set of reference actions in a supply chain.
This set is grouped regarding seven views and three abstraction levels. These views and
abstraction levels are independent of the maturity level description obtained in the
research. However, each maturity level may include a matrix of supply chain reference
actions. Thus, the S(CM)2 includes five supply chain reference action matrixes, one for
each maturity level. Moreover, there are a set of improvement factors and a set of useful
tools for each maturity level. Therefore, the models previously developed may be
integrated in the meta-model. Figure 27 shows the final S(CM)2 framework. This
framework includes the definition of the maturity level, the key improvement factors

95
sorted by priority, the matrix of supply chain reference actions, and a set of useful tools to
improve the supply chain, for the next maturity level to be reached.
Operational Tactical StrategicSuppliers
Human Resources
Production Systems
Inventory
Customers
Information Systems /
Technology
Performance Measurement
System
Maturity Level
Key Improvement Factor View
Abstraction Level Useful Tools
Level name
Definition
Figure 27: The Supply Chain Capability Maturity Model Framework
5.2.1 The S(CM)2 in a Tableau Form
Populating this framework with the supply chain reference actions implies
considering all the comments, answers, and feedback provided by the experts involved in
the first and second stages. Even though this information is useful, it is not enough to fill
out the whole meta-model. Therefore, some of the matrix cells should be completed with
supply chain reference actions, according to the view, abstraction level, and maturity
level which define the unfilled cells. An example of one maturity level of the S(CM)2 is
shown in Figure 28, which shows the operative and tactical abstraction levels and Figure
29, which shows the strategic abstraction level and the useful tools. The complete meta-
model is shown in Appendix 5.

96
Ope
ratio
nal
Tac
tical
Supp
liers
Iden
tifyi
ng p
robl
ems r
elat
ed to
raw
mat
eria
ls
proc
urem
ent
Iden
tifyi
ng k
ey e
lem
ents
to d
efin
e th
e po
licie
s to
sele
ct su
pplie
rs
Iden
tifyi
ng th
e he
art o
f the
mat
ter a
bout
the
high
le
vels
of d
efec
ts, s
crap
, and
rew
ork
in th
e pr
oduc
ts
Iden
tifyi
ng d
ownt
ime
prob
lem
s, m
aint
enan
ce
requ
irem
ents
, and
tool
s req
uire
d
Star
ting
the
proc
ess a
nd p
rodu
ct d
ocum
enta
tion
thro
ugh
diag
ram
s and
met
hods
U
nify
ing
the
defin
ition
of p
roce
sses
co
mpa
nyw
ide
Iden
tifyi
ng k
ey fa
ctor
s to
defin
e th
e w
ork
assi
gnm
ent r
ules
inst
ead
of d
oing
it b
y fe
elin
g or
ex
perti
se
Setti
ng u
p th
e m
etho
ds to
def
ine
the
prod
uctio
n ra
te in
stea
d of
doi
ng it
by
the
num
ber o
f ord
ers
plac
ed
Impl
emen
ting
proj
ects
to g
et c
erta
inty
rega
rdin
g w
hen,
how
, whe
re a
nd h
ow m
any
raw
mat
eria
ls
are
requ
ired
to sa
tisfy
pro
duct
ion
need
s
Def
inin
g lo
gist
ics p
roce
sses
such
as r
eord
er
poin
ts, m
ater
ials
loca
tion,
raw
mat
eria
ls
proc
edur
es to
rece
ive
and
deliv
er, e
tc.
Iden
tifyi
ng k
ey fa
ctor
s to
fore
cast
the
dem
and
of
raw
mat
eria
ls, b
ased
on
futu
re re
quire
men
ts
inst
ead
of th
e cu
rren
t one
s.
Doc
umen
ting
and
defin
ing
the
bill
of m
ater
ials
fo
r the
pro
duct
cat
alog
Iden
tifyi
ng th
e cu
stom
er's
need
s and
mee
ting
them
with
out c
once
rn o
f cos
tId
entif
ying
key
ele
men
ts to
pro
vide
cus
tom
er
serv
ice
afte
r the
ord
er is
pla
ced
Impl
emen
ting
met
hods
to sa
tisfy
cus
tom
er's
need
s thr
ough
tem
pora
l and
mar
gina
l ben
efits
su
ch a
s loc
atio
n, p
rice,
or r
elat
ions
hip
Iden
tifyi
ng th
e m
ost c
omm
on p
robl
ems r
egar
ding
du
e da
te a
nd p
rodu
ct d
eliv
ery
Hum
an R
esou
rces
Def
inin
g ac
tions
to re
duce
the
empl
oyee
tu
rnov
er, s
uch
as im
prov
ing
the
wor
k co
nditi
ons
and
hum
an re
sour
ce m
anag
emen
t
Impr
ovem
ent r
esul
ts a
re re
ache
d by
indi
vidu
al
effo
rts
Iden
tifyi
ng p
robl
ems r
elat
ed to
info
rmat
ion
syst
ems w
hich
are
not
use
d, n
ot a
vaila
ble
or
inco
mpa
tible
Def
inin
g da
ta re
quire
men
ts a
t all
ente
rpris
e le
vels
to
gen
erat
e in
form
atio
n us
eful
for m
akin
g de
cisi
ons
Eval
uatin
g th
e ut
iliza
tion
of te
chno
logi
cal
reso
urce
s and
iden
tifyi
ng im
prov
emen
t are
as
conc
erni
ng u
nder
utili
zatio
n or
inco
rrec
t use
.
Iden
tifyi
ng te
chno
logi
cal i
mpr
ovem
ents
in th
e en
terp
rise
proc
esse
s, an
alyz
ing
the
feas
ibili
ty o
f th
ese
impr
ovem
ents
.
Def
inin
g th
e pr
oced
ure
to e
nsur
e a
cons
iste
nt d
ata
colle
ctio
n to
obt
ain
perf
orm
ance
indi
cato
rs
Def
inin
g lo
cal a
nd g
loba
l per
form
ance
indi
cato
rs
Col
lect
ing
data
in b
asic
syst
ems s
uch
as
wor
kshe
ets,
but t
he d
ata
are
not p
roce
ssed
or
anal
yzed
Def
inin
g pr
oces
ses t
o an
alyz
e da
ta a
nd g
ener
ate
info
rmat
ion
usef
ul to
iden
tify
impr
ovem
ent
oppo
rtuni
ties
5. R
educ
e de
fect
s /
rew
orks
/ sc
rap
Info
rmat
ion
Syst
ems /
T
echn
olog
y
Perf
orm
ance
M
easu
rem
ent
Syst
em
2. R
evie
w th
e C
atal
og o
f Pro
duct
s
3. F
ocus
on
Cus
tom
er
requ
irem
ents
Inve
ntor
y
4. F
ocus
on
cost
re
duct
ion
Cus
tom
ers
Mat
urity
Lev
elK
ey
Impr
ovem
ent
Fact
orV
iew
Abs
trac
tion
Lev
el
U n d e f i n e d
This
is a
n en
terp
rise
with
no
proc
ess d
ocum
enta
tion
or
stan
dard
izat
ion;
ther
e is
a la
ck o
f kn
owle
dge
abou
t the
ent
erpr
ise
proc
esse
s, ac
tiviti
es, a
nd ta
sks;
the
ente
rpris
e pr
imar
ily re
acts
to th
e en
viro
nmen
t ins
tead
of p
lann
ing;
th
e en
terp
rise
rem
ains
in th
e m
arke
t by
a sm
all a
dvan
tage
on
sale
pric
e, lo
catio
n, o
r cus
tom
er
rela
tions
hip
in c
ompa
rison
with
th
e co
mpe
titio
n; th
ere
is n
o co
ntin
uous
impr
ovem
ent p
lan
defin
ed; a
ll th
e im
prov
emen
ts a
re
reac
hed
by in
divi
dual
and
isol
ated
ef
forts
; the
pro
duct
ive
proc
esse
s ar
e fo
cuse
d on
com
plet
ing
the
cust
omer
ord
ers;
how
ever
, the
y m
ay e
xper
ienc
e fr
eque
nt p
robl
ems
in m
eetin
g cu
stom
er's
expe
ctat
ions
; the
ent
erpr
ise
does
no
t hav
e a
defin
ed v
isio
n or
m
issi
on.
1. D
ocum
ent
Prod
uctio
n
Proc
esse
s
Prod
uctio
n
Figure 28: Example of a Maturity Level of S(CM)2 in Tabular Form

97
Abs
trac
tion
Lev
el
Stra
tegi
c
Supp
liers
Iden
tifyi
ng a
nd a
naly
zing
the
impa
ct o
f sup
plie
r se
lect
ion
base
d on
ly o
n pr
ice
or p
roxi
mity
Bas
ic o
ffic
e to
ols t
o ge
nera
te re
ports
, sto
re d
ata
etc.
; Stra
tegi
es to
def
ine
KPI
's; F
ishb
one
diag
ram
, Ben
chm
ark
supp
liers
pol
icie
s
Iden
tifyi
ng k
ey fa
ctor
s for
cos
t red
uctio
n
Esta
blis
hing
com
mun
icat
ion
met
hods
bet
wee
n de
partm
ents
and
pro
cess
es
Iden
tifyi
ng k
ey o
bsta
cles
to g
ener
ate
a m
aste
r pr
oduc
tion
plan
Iden
tifyi
ng k
ey o
bsta
cles
to g
ener
ate
a m
aste
r sc
hedu
ling
plan
Def
inin
g pr
ojec
ts to
intro
duce
con
cept
s of
inve
ntor
y m
anag
emen
t
Def
inin
g th
e ca
talo
g of
pro
duct
s, th
us p
rovi
ding
w
ide
flexi
bilit
y to
cus
tom
er's
requ
irem
ents
Impl
emen
ting
stra
tegi
es to
incr
ease
the
data
base
of
cus
tom
ers w
ithou
t con
cern
s abo
ut lo
yalty
Hum
an R
esou
rces
Def
inin
g th
e tra
inin
g re
quire
men
ts fo
r em
ploy
ees
rega
rdin
g th
eir p
ositi
ons a
nd fu
nctio
ns in
the
ente
rpris
e
Stra
tegi
c Pl
anni
ng (m
issi
on, v
isio
n, c
ompa
ny
valu
es),
stra
tegi
es to
def
ine
KPI
's; d
efin
e an
d do
cum
ent e
nter
pris
e po
sitio
ns
Def
inin
g ke
y el
emen
ts to
mak
e hi
stor
ical
in
form
atio
n a
sign
ifica
nt fa
ctor
in th
e de
cisi
on-
mak
ing
proc
esse
sC
hang
ing
the
visi
on th
at te
chno
logy
is n
ot a
w
aste
of m
oney
but
an
avai
labl
e im
prov
emen
t to
ol.
Def
inin
g th
e fr
eque
ncy
for r
evie
win
g th
e pe
rfor
man
ce in
dica
tor
Def
inin
g K
PI's,
avo
idin
g th
e us
e of
sing
le
indi
cato
rs to
mak
e de
cisi
ons e
.g. p
rofit
indi
cato
rs
only
5. R
educ
e de
fect
s /
rew
orks
/ sc
rap
Info
rmat
ion
Syst
ems /
T
echn
olog
y
Bas
ic o
ffic
e to
ols;
def
initi
on o
f inf
orm
atio
n re
quire
men
ts; d
ocum
enta
tion
and
stan
dard
izat
ion
of in
form
atio
n; d
efin
ition
of t
he d
ata
colle
ctio
n
and
man
agem
ent p
roce
sses
.
Perf
orm
ance
M
easu
rem
ent
Syst
em
Bas
ic o
ffic
e to
ols t
o ge
nera
te re
ports
, sto
re d
ata
etc.
; stra
tegi
es to
def
ine
KPI
's; i
nter
nal
cust
omer
s int
ervi
ews
2. R
evie
w th
e C
atal
og o
f Pro
duct
s
3. F
ocus
on
Cus
tom
er
requ
irem
ents
Inve
ntor
y
Inve
ntor
y sy
stem
s stra
tegi
es su
ch a
s lay
out b
y de
man
d, b
y pr
oduc
t typ
e an
d so
on;
Bas
ic o
ffic
e to
ols t
o an
alyz
e da
ta re
late
d to
dem
and,
del
iver
y of
supp
lies e
tc; 5
S c
once
pts;
doc
umen
tatio
n an
d st
anda
rdiz
atio
n of
inve
ntor
y pr
oces
ses;
Inte
rnal
Lo
gist
ics C
once
pts.
4. F
ocus
on
cost
re
duct
ion
Cus
tom
ers
Cus
tom
er in
terv
iew
s; fo
cus g
roup
s; S
WO
T an
alys
is; s
torin
g cu
stom
er p
refe
renc
es in
a d
ata
base
; mar
ketin
g an
alys
is
Mat
urity
Lev
elK
ey
Impr
ovem
ent
Fact
orV
iew
Use
ful T
ools
U n d e f i n e d
This
is a
n en
terp
rise
with
no
proc
ess d
ocum
enta
tion
or
stan
dard
izat
ion;
ther
e is
a la
ck o
f kn
owle
dge
abou
t the
ent
erpr
ise
proc
esse
s, ac
tiviti
es, a
nd ta
sks;
the
ente
rpris
e pr
imar
ily re
acts
to th
e en
viro
nmen
t ins
tead
of p
lann
ing;
th
e en
terp
rise
rem
ains
in th
e m
arke
t by
a sm
all a
dvan
tage
on
sale
pric
e, lo
catio
n, o
r cus
tom
er
rela
tions
hip
in c
ompa
rison
with
th
e co
mpe
titio
n; th
ere
is n
o co
ntin
uous
impr
ovem
ent p
lan
defin
ed; a
ll th
e im
prov
emen
ts a
re
reac
hed
by in
divi
dual
and
isol
ated
ef
forts
; the
pro
duct
ive
proc
esse
s ar
e fo
cuse
d on
com
plet
ing
the
cust
omer
ord
ers;
how
ever
, the
y m
ay e
xper
ienc
e fr
eque
nt p
robl
ems
in m
eetin
g cu
stom
er's
expe
ctat
ions
; the
ent
erpr
ise
does
no
t hav
e a
defin
ed v
isio
n or
m
issi
on.
1. D
ocum
ent
Prod
uctio
n
Proc
esse
s
Prod
uctio
n
Proc
essi
ng d
ocum
enta
tion
and
stan
dard
izat
ion;
Fi
shbo
ne d
iagr
am; F
low
, pro
cess
and
ope
ratio
n di
agra
ms;
Bas
ic o
ffic
e to
ols (
wor
kshe
ets,
text
fil
es e
tc…
) use
ful t
o ge
nera
te re
ports
, sto
re d
ata,
ge
t inf
orm
atio
n et
c; 5
S c
once
pts.
Inte
rnal
Lo
gist
ics T
ools
Figure 29: Example of a Maturity Level of S(CM)2 in Tabular Form (b)
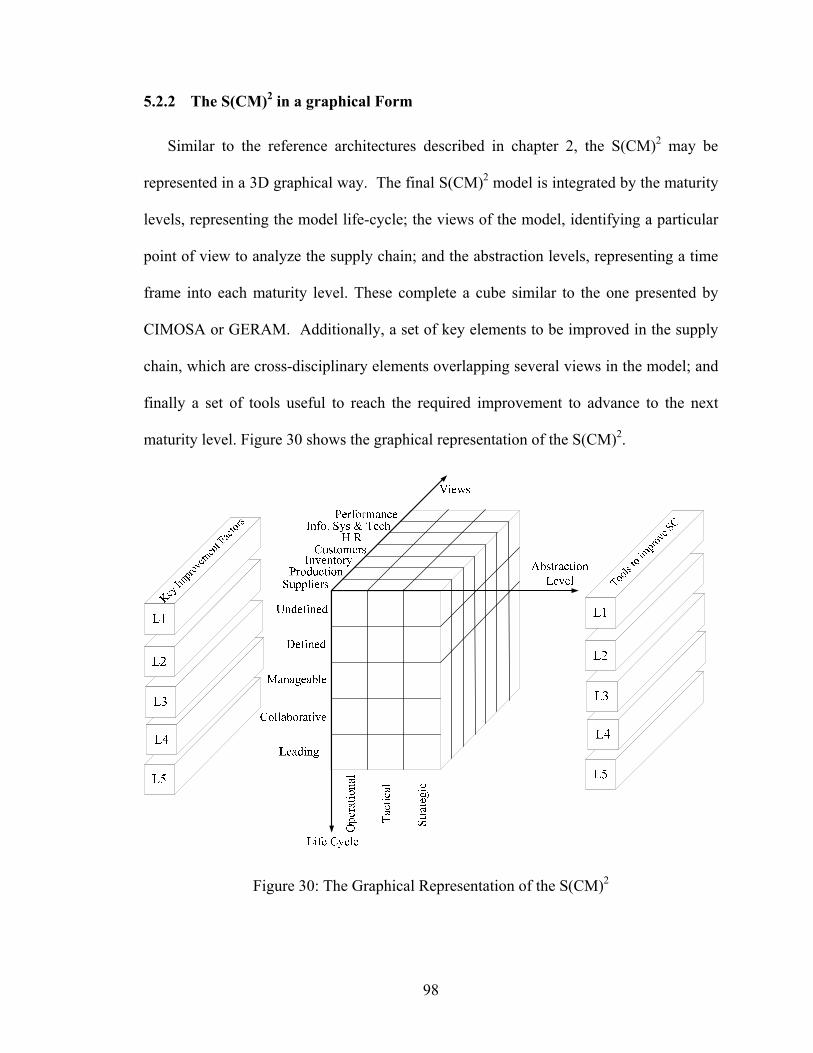
98
5.2.2 The S(CM)2 in a graphical Form
Similar to the reference architectures described in chapter 2, the S(CM)2 may be
represented in a 3D graphical way. The final S(CM)2 model is integrated by the maturity
levels, representing the model life-cycle; the views of the model, identifying a particular
point of view to analyze the supply chain; and the abstraction levels, representing a time
frame into each maturity level. These complete a cube similar to the one presented by
CIMOSA or GERAM. Additionally, a set of key elements to be improved in the supply
chain, which are cross-disciplinary elements overlapping several views in the model; and
finally a set of tools useful to reach the required improvement to advance to the next
maturity level. Figure 30 shows the graphical representation of the S(CM)2.
Figure 30: The Graphical Representation of the S(CM)2

99
5.3 VERIFICATION OF THE S(CM)2
The information shown in the last two sections presents the final meta-model, which
mainly contains the results verified and validated by experts through the Delphi Method.
Some of the reference actions were not verified or validated since the information
collected from the experts was not enough to fill out all the cells in the model. Thus, it is
necessary to verify and validate the final model. This section shows the verification
process made by comparison with other reference models. The next section describes the
final validation process.
Since the S(CM)2 intends to be a supply chain reference model, it is necessary to
make a comparison with other reference models. In order to verify the final model, it has
been compared with the GIM, CIMOSA and PERA models, which were previously
discussed in Chapter 2. These three reference models have similar characteristics, which
define the enterprise architecture such as objective, focus, views, abstraction levels or
perspectives, and life-cycle. Table 12 shows a comparison among GIM, CIMOSA,
PERA and S(CM)2.
Table 12: Comparison of Reference Models
Element GIM CIMOSA PERA S(CM)2
Objective
Analyzes the current production
systems. This diagnosis allows to design alternative
system conceptions and to support their
understanding
Represents an enterprise system
from a general to a particular model passing through
partial models for every view
Defines a hierarchical
arrangement, such that the
dependency on the human
understanding, judgment, and
decision making required for a
success implementation is
minimized
Provides a cross-disciplinary
perspective of an enterprise’s supply chain performance

100
Element GIM CIMOSA PERA S(CM)2
Focus
Emphasizes the organizational structure of an
enterprise and the associated
decisional system of production
systems
Facilitates the description
modeling of an enterprise operation based on a process-oriented modeling
approach
Recognizes the relevance of the human judgment
and decision making to merge
special management
requirements, such as innovation and
creativity into design
Identifies assessment
opportunities in supply chain
processes, and provides the tools required to define
an enterprise’s improvement road
map
Views
Informational, decisional,
physical, and functional
Function, Information,
Resource, and Organization
Manufacturing, Human and
Organizational, and Information
Suppliers, Production
Systems, Inventory, Customers, Human
Resources, Information Systems and
Technology, and Performance Measurement
Systems
Abstraction Levels
Conceptual, Structural, and Realizational
General Model, Partial Model, and Particular Model
Not Specified Operational, Tactical, and
Strategic
Life-cycle Analysis, Design,
and Implementation
Analysis, Design, and
Implementation
Identification, Concept,
Definition, Functional Design, Detailed Design,
Construction, Operation and Maintenance, Renovation or
Disposal, and Legal Dissolution
Undefined, Defined,
Manageable, Collaborative, and
Leading
Considering this table, the S(CM)2 meets the characteristics used for these reference
models to describe an enterprise system or process. Even though GIM, CIMOSA, and
PERA are reference models for other study fields, it is possible to conclude by similarity
that the verification of the S(CM)2 is done regarding a reference model framework.
On the other hand, due to the particular application of the S(CM)2, it is necessary to
make a comparison with some supply chain models or other models from a supply chain

101
related field. Considering the supply chain models reviewed in Chapter 2, only the
SCOR model is useful to make the comparison, since it is the only one defined as supply
chain reference model.
However, SCOR does not offer a step-by-step procedure to improve the supply chain
as the one presented in the S(CM)2 model. Also, according to the Supply Chain Council,
SCOR does not include: Sales administration processes, technology development
processes, product and process design and development processes, and some post-
delivery technical support processes. Besides, SCOR assumes but does not explicitly
address: training, quality, and information technology (IT) administration (non-SCM).
These elements are explicitly included in the S(CM)2 model. Moreover, the S(CM)2
includes the human resource element as a view, which is not considered as a key element
in the SCOR model. Regarding similarities, SCOR defines five decision areas named
Plan, Source, Make, Deliver, and Return, while the S(CM)2 represents these decision
areas through the key improvement factors, views and the supply chain reference actions.
The S(CM)2 explicitly includes reference actions concerning planning elements through
the model (Plan); procurement and supplier collaboration (Source); production actions
(Make); and inbound and outbound logistics optimization (Delivery and Return).
Searching for a model from a related supply chain field, there is a model from the
value chain field. The value chain is defined as the enterprise's value system, which
means the value system that creates the product’s value to the customer (White and
Pearson, 2001). Thus, the value chain definition overlaps with the supply chain of a
company. A classic model from this field was developed by Porter (1985); he defined

102
two kinds of activities in the value chain, primary activities (Inbound Logistics,
Operations, Outbound Logistics, Marketing and Sales, and Service) and support activities
(Procurement, Technology Development, Human Resource Management, and Firm
Infrastructure). Figure 31 shows the model graphically.
OperationsInboundLogistics
OutboundLogistics
Marketing and Sales Service
Firm’s Infrastructure
Human Resources Management
Technology Development
Procurement
Figure 31: The Porter’s Chain Value
Considering this model, Table 13 shows a comparison between Porter’s chain value
model and the S(CM)2. Considering this comparison, it is possible to argue that the
verification process is complete, since the meta-model has the same elements than the
reference models, and the activities defined by the SCOR and Porter’s value chain
models enclosed, at least partially or implicitly.
Table 13: Comparison Between Porter’s Model and the S(CM)2
Activity Porter’s Model S(CM)2
Inbound Logistics
Includes receiving, storing, inventory control, and transportation scheduling.
Covered in the views of suppliers and Inventory. Implicitly included in the key
improvement factors Optimization of Inbound and Outbound Logistics
Processes

103
Activity Porter’s Model S(CM)2
Operations
Includes machining, packaging, assembly, equipment maintenance, testing and all other value-creating
activities that transform the inputs into the final product.
Contained in the view Production
Outbound Logistics
The activities required to get the finished product to the customers: warehousing,
order fulfillment, transportation, distribution management.
Covered in the view inventory, and the key improvement factors of
Optimization of Inbound and Outbound Logistics Processes
Marketing and Sales
The activities associated with getting buyers to purchase the product including
channel selection, advertising, promotion, selling, pricing, retailing, etc.
Covered in the view Customers
Service
The activities that maintain and enhance the product's value, including customer’s
support, repair services, installation, training, spare parts management,
upgrading, etc.
Contained in the view Customers
Firm Infrastructure
Includes general management, planning management, legal, finance, accounting, public affairs, quality management, etc.
Implicitly enclosed in the view Performance Measurement Systems
Human Resources Management
The activities associated with recruiting, development (education), retention and
compensation of employees and managers.
Enclosed in the view Human Resources
Technology Development
Includes technology development to support the value chain activities, such as Research and Development, Process
automation, design, redesign.
Contained in the view Information Systems & Technology
Procurement Procurement of raw materials, servicing, spare parts, buildings, machines, etc. Contained in the view Suppliers

104
5.4 VALIDATION OF THE S(CM)2
Concerning the validation of the S(CM)2, it is necessary to document that the S(CM)2
is suited for its intended use. Therefore, the validation process should to document that
the S(CM)2 is useful to assess the enterprise’s supply chain processes and to help the
development process by to provide an improvement road map. This goal was meeting
through two different validation processes. The first one includes a survey and a case
study. The second one was a pilot test of the model in a real enterprise.
The survey had the objectives to validate the usefulness of the meta-model to assess
the supply chain processes and to define an improvement road map. The case study has
the objective to demonstrate the ability of the meta-model to help managers assess the
supply chain processes of an enterprise by identifying the maturity level for each view.
Finally, the pilot test provides a real try out for the S(CM)2, documenting the assess of the
enterprise’s supply chain and the road map obtained from the meta-model. The next two
sections describe each one of these validations and show the results obtained.
5.4.1 Experts’ Validation of the S(CM)2
The main objective of the meta-model proposed in this research is to provide a cross-
disciplinary perspective of an enterprise’s supply chain performance. Consequently, an
enterprise may identify the assessment opportunities in supply chain processes, and may
define an enterprise improvement road map. In order to validate this objective, a small
group of experts was invited to validate the model. These experts were selected by their
experience in the supply chain. For this case, the experts had at least ten years of
experience in supply chain or a related field.

105
The invitation was made to ten experts; each of them received an email containing
three files. The first file was a Powerpoint presentation containing the invitation and the
explanation of the model, the second file was the model itself, and the third file was a
survey shown as a verification sheet, which included three questions to validate the
model. Appendix 6 shows the validation sheet sent to the experts. Until the publishing
time of this research four of them had answered the validation sheet. Table 14 shows the
information related to the credentials of these four participants.
Table 14: Information of the Experts consulted to Validate the S(CM)2
Participant Years of Experience Position Business Type Academic
Credentials
1 15
President and CEO of a consultancy group in
International Trade and Transportation
Consultancy Master in
International Law
2 14 Director of a Consultancy group in Supply Chain and Logistics Consultancy
PhD in Industrial
Engineering
3 11 Associate Professor and
Researcher in Supply Chain and Logistics
Academic PhD in
Industrial Engineering
4 10 Planning Manager in an automotive enterprise Automotive
BSc in Industrial
Engineering
Concerning the questions included in the verification sheet, these were as follows:
Q.1 What advantages can you identify in the model?
Q.2 What improvement opportunities can you identify in the model?
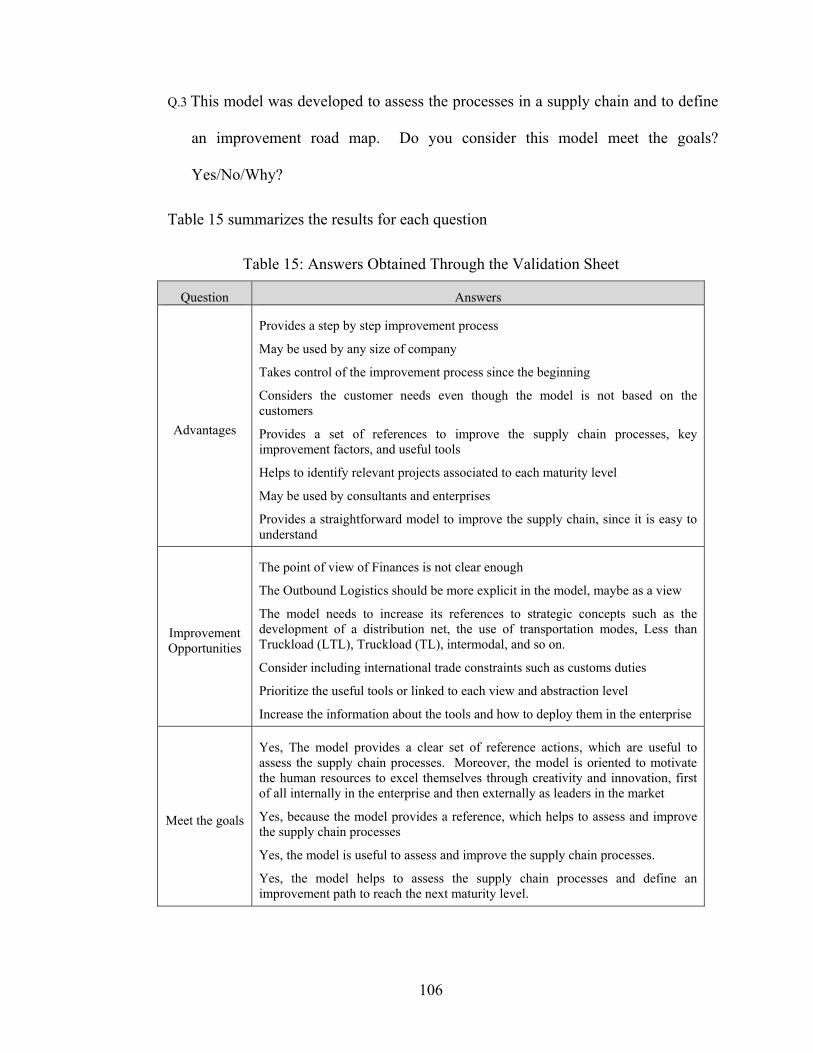
106
Q.3 This model was developed to assess the processes in a supply chain and to define
an improvement road map. Do you consider this model meet the goals?
Yes/No/Why?
Table 15 summarizes the results for each question
Table 15: Answers Obtained Through the Validation Sheet
Question Answers
Advantages
Provides a step by step improvement process
May be used by any size of company
Takes control of the improvement process since the beginning
Considers the customer needs even though the model is not based on the customers
Provides a set of references to improve the supply chain processes, key improvement factors, and useful tools
Helps to identify relevant projects associated to each maturity level
May be used by consultants and enterprises
Provides a straightforward model to improve the supply chain, since it is easy to understand
Improvement Opportunities
The point of view of Finances is not clear enough
The Outbound Logistics should be more explicit in the model, maybe as a view
The model needs to increase its references to strategic concepts such as the development of a distribution net, the use of transportation modes, Less than Truckload (LTL), Truckload (TL), intermodal, and so on.
Consider including international trade constraints such as customs duties
Prioritize the useful tools or linked to each view and abstraction level
Increase the information about the tools and how to deploy them in the enterprise
Meet the goals
Yes, The model provides a clear set of reference actions, which are useful to assess the supply chain processes. Moreover, the model is oriented to motivate the human resources to excel themselves through creativity and innovation, first of all internally in the enterprise and then externally as leaders in the market
Yes, because the model provides a reference, which helps to assess and improve the supply chain processes
Yes, the model is useful to assess and improve the supply chain processes.
Yes, the model helps to assess the supply chain processes and define an improvement path to reach the next maturity level.

107
Even though the model shows some improvement opportunities, the four experts
agree that the S(CM)2 meets both goals, to assess the enterprise’s supply chain processes
and to define an improvement road map. Moreover, some of the advantages mentioned
by the experts are key design objectives for the S(CM)2. For instance, provides a step by
step improvement process and a model easy to understand, both characteristics allows to
conclude the S(CM)2 contributes to the state of the art of supply chain modeling since
other models do not offer a step by step improvement process or the models do not use an
appropriate language for the supply chain. Regarding to the improvement opportunities,
it was actually expected being this is the first version of the S(CM)2, these improvement
can be explored with greater detail in future work.
5.4.2 Case Study Results
The case study was done to demonstrate the easiness of the S(CM)2 used as an
assessment tool. To accomplish this goal, the validation instrument selected was a case
study. The case study contains a brief explanation about the views and maturity levels of
the model, the definition of the maturity levels, a set of instructions to answer the case
study, the descriptions of the “as-is” states of two different fictitious enterprises named X
and Y, and a table of results.
The “as-is” state of each enterprise was built using randomly the reference actions
defined in the S(CM)2 for each view. For example the description of the “as-is” state of
enterprise X includes the following paragraph:
“The management has remarked the need to improve the customer service activities;
thus, some improvements have been made to reach this objective, such that, it has

108
established a customer service department to document the processes of the department,
and to assign responsibilities to all the employees of the department”
Thus, it is possible to define an expected answer of the maturity level at each view,
based on the maturity model. For instance Figure 32 shows the reference actions shown
in the maturity level manageable at the customer view. The case study description is
based on these reference actions, such that the expected answer in the customer view is
manageable.
Identifying the functions of a customer service department or, at least, someone responsible for customer relationships
Defining the functions of a customer service department or, at least, someone responsible for customer relationships
Establishing a customer service department or, at least, making someone responsible for customer relationships
Deploying cross departmental efforts to reduce costs and to assure quality
Deploying actions to integrate the enterprise's internal processes and to share information about customer's behavior within the enterprise's functions
Collaborating in the implementation of technological solutions to integrate information, mainly in CRM solutions.
Applying basic tools to improve the customer's perception of value such as the fishbone diagram, histograms, Pareto charts etc.
Applying tools to improve customer product and service satisfaction such as FMEA, Kaizen, focus groups, etc
Defining project to implement holistic methodologies to increase the customers' perception of value such as QFD, TQM, etc.
Customers
Figure 32: View Customer, Level Manageable
The tables of results collected from the participants have the classification they
provided for each view, according to the maturity level description. Appendix 7 shows
the format used in the case study and Table 16 shows the expected answer for each view
for both, Enterprise X and Enterprise Y.
Table 16: Expected Answers for the Case Study
View Enterprise X Enterprise Y Suppliers Defined Collaborative
Production Manageable Defined Inventories Undefined Manageable Customers Manageable Defined
Human Resources Undefined Collaborative Information Systems and Technology Defined Collaborative Performance Measurement Systems Defined Manageable

109
The participants did not require having experience in supply chain or to know the
model, since the meta-model may be used by anyone interested in assess and improve the
processes in a supply chain. Thus, the case study was sent by email to twenty-five
possible participants. Regarding their activities, they are professors, master degree
students, PhD students, bachelor in science students, and alumni. The number of
responses received was fourteen.
In order to analyze the resulting data easily, each level was assigned a number as
follows: Undefined-1, Defined-2, Manageable-3, Collaborative-4, and Leading-5. This
arrangement allowed running statistical analysis such as mean hypothesis test. The
hypotheses were defined as follows
Ho: The mean of the answers is equal to the expected answer value
Ha: The mean of the answers is different to the expected answer value
Assuming the answers come from a normal distribution with a mean equal to the
reference number, the sample size equals n, and because there are less than thirty
answers, the statistical estimator is a t-test for the mean as is shown in equation [1].
n
)( - t s
xEx= [1]
Regarding the statistical significance of the test (α), it was set to 5% such that Ho
cannot be rejected if
0.975,130.025,13 t
n
)( - t ≤≤ sxEx [2]

110
Thus, Table 17 shows the results obtained from the fourteen participants
Table 17: Results of the Case Study
Participant S P I C HR IS&T MS S P I C HR IS&T MS1 2 3 1 3 1 2 1 5 2 4 1 5 5 32 2 3 1 2 1 3 2 5 1 4 1 5 3 43 4 4 2 2 2 2 2 4 3 3 3 5 4 34 2 3 1 4 1 1 2 5 1 5 1 4 5 25 2 3 1 2 1 2 2 3 2 3 2 4 3 26 2 3 1 2 1 2 1 4 1 2 1 5 4 27 2 3 1 2 1 2 2 4 2 4 2 4 4 28 2 4 1 3 1 3 2 4 2 3 2 5 5 29 2 2 1 3 1 2 1 4 2 3 1 3 4 310 2 3 1 2 1 2 2 3 2 3 1 4 3 211 2 4 1 2 1 2 2 5 2 3 2 4 4 312 2 3 1 3 1 3 2 3 2 3 2 4 4 213 3 4 1 2 1 3 2 4 1 4 2 4 5 414 2 4 1 4 1 2 2 5 2 3 2 4 5 4
Avg 2.21 3.29 1.07 2.57 1.07 2.21 1.79 4.14 1.79 3.36 1.64 4.29 4.14 2.71std dev 0.58 0.61 0.27 0.76 0.27 0.58 0.43 0.77 0.58 0.74 0.63 0.61 0.77 0.83
µ0 2 3 1 3 1 2 2 4 2 3 2 4 4 3t = 1.38 1.75 1.00 -2.12 1.00 1.38 -1.88 0.69 -1.38 1.79 -2.11 1.75 0.69 -1.30
t0.025,13 = 2.16 2.16 2.16 2.16 2.16 2.16 2.16 2.16 2.16 2.16 2.16 2.16 2.16 2.16Result OK OK OK OK OK OK OK OK OK OK OK OK OK OK
Enterprise X Enterprise Y
Considering the results, it is possible to argue that the easiness of classifying the
model views and reference actions was validated, since the average of the answers
obtained is statistically equal to the expected average value µ0. Moreover, there is a key
finding from this validation process related to the relevance of providing an assessment
methodology, which shows step by step how to use the S(CM)2 to assess and improve the
supply chain processes in the enterprise. This argument comes from the distribution of
answers obtained from the case study, which showed how many answers were the same
as the reference values. Table 18 shows these distributions.

111
Table 18: Distribution of the Case Study Answers
Level S P I C HR IS&T MS S P I C HR IS&T MS1 93% 93% 7% 21% 29% 43%2 86% 7% 7% 57% 7% 64% 79% 64% 7% 50% 50%3 7% 57% 29% 29% 21% 7% 57% 7% 7% 21% 29%4 7% 36% 14% 43% 29% 57% 43% 21%5 36% 7% 36% 36%
Ref 2 3 1 3 1 2 2 4 2 3 2 4 4 3
Enterprise X Enterprise Y
Analyzing Table 18, it is possible to see that only the view customer of Enterprise X
has a mode different from the reference value. This fact is minimized since the mode of
the customers view is the immediate lower level, implying an improvement road map
starting from a lower point, and eventually, enclosing improvement processes until the
third maturity level.
On the other hand, for the Production and the Information Systems & Technology
views in the Enterprise X description, and for the all the views, except Customers, in the
Enterprise Y description, at least four participants classified the view in a higher maturity
level. A possible explanation for these results was lack of information and training
received by the participants before answering the case study. The case study only
considered the definitions of the maturity levels, and some of the reference actions
instead of the whole set of reference actions, which helped to classify the views more
accurately.
5.5 THE PILOT TEST OF THE S(CM)2
The final validation process was assessing a real enterprise’s supply chain. The
assessment process requires completing a questionnaire shown from Table 19 to 25. This
questionnaire helps managers to obtain the maturity level classification for each view in

112
the S(CM)2, since the questions was developed based in the reference actions of the
model. Thus, the questionnaire has seven sets of questions; one set by view, this
arrangement was based on the assessment tool used by the CMMI. Also, each question
was numbered according to the maturity level for each view. The possible answers for
each question are “yes” or “no”. In case the answer will be yes the enterprise should
document the evidence which support the affirmative answer. A negative answer in one
of the level questions implies an improvement opportunity such that the expected level
characteristics are not meet. Thus, the enterprise receives a maturity classification of the
last level completed. This classification allows to define an improvement road map
based in the reference actions and the tools recommended in the model. Once the level is
complete the enterprise may continue improving its processes from this maturity level to
the next level up to reach the leading maturity level.
In order to perform the assessment, an enterprise’s manager was selected from a
contact list. Regarding the enterprise’s information, it is as follows.
Business type: Metallic Stamping and Sheet Metal
Contact position: Operations Manager
Number of years in the current position: 5 years
Number of years in the enterprise: 9 years
The following set of questions shown in Table 19 was used to assess the enterprise’s
supply chain processes according to the suppliers view. By confidential purposes, the
name of the enterprise and the evidences documented were omitted.

113
Table 19: Assessment Questionnaire for the view Suppliers
Level Questions Answer (Yes/No) Evidence
Undefined
S.1 The main problems related to the supply of raw materials and consumables are identified and documented.
S.2 There are improvement projects oriented to solve the problems identified in the last question.
Yes
Yes
Defined
S.3 There are processes documented and implemented to assess the quality of the raw materials and consumables.
S.4 There are policies documented and implemented to add a new supplier to the enterprise’s suppliers catalog.
S.5 There are meetings periodically with the suppliers to evaluate and to provide feedback related to their service level.
Yes
Yes
Yes
Manageable
S.6 There are processes documented and implemented to assess the suppliers’ service level.
S.7 There are processes which collect data and provide statistical information related to the delivery time and order completion of every supplier.
S.8 There are projects jointly with the supplier to develop and to integrate them in the enterprise’s supply chain processes.
S.9 There are policies documented and implemented to select and to hire outsource services (3rd Party Logistics, 4th Party Logistics).
Yes
Yes
No
No
Collaborative
S.10 There are procedures documented and implemented to determine the level of collaboration and integration among the suppliers and the enterprise’s processes.
S.11 There are procedures documented and implemented to determine if it is worth to invest in developing a supplier.
S.12 There are procedures documented and implemented to develop the suppliers’ service level and the collaboration.
S.13 There are procedures documented and implemented to certify new suppliers and to renew the certification to current suppliers.
No
No
No
Yes
Leading
S.14 There are procedures documented and implemented to deploy projects jointly with the suppliers to develop new products.
S.15 There are procedures documented and implemented to aware the suppliers in advance about any change in the raw materials and consumables for the new or current products.
S.16 There are documented and implemented best practices related to collaboration and selection of suppliers.
S.17 There had been Benchmarks studies about the collaboration and supplier selection processes developed by the enterprise.
No
Yes
Yes
No

114
Based in the results obtained, the maturity level of this enterprise for the view
supplier is Defined. Thus, this enterprise should take the reference actions described for
the view suppliers in the level manageable as starting point to define its improvement
path. The improvement projects should be focus in those questions with negative
answers. In this case, this enterprise should work jointly with the supplier to develop and
to integrate their processes to the enterprise’s supply chain processes, also to develop,
document and implement policies to select and to hire outsource services. Considering
the useful tools suggested by the S(CM)2, some possible solutions implies integrates the
suppliers processes through a MRP system and to define collaboration agreements with
other enterprises, in this case outsourcing enterprises.
Even though the maturity level classification obtained was defined, there is evidence,
according to the answers obtained from the questionnaire that the enterprise shows
advance in the next maturity levels. This advance may be represented by a color
convention implying the improvement urgency, due to an enterprise process which has
not complete at least the defined level represent a poor development levels one and two
are identified by a red color. Similarly the intermediate levels Manageable and
Collaborative by a yellow color and the Leading maturity level by a green color. Thus,
the negative answers are identified using these color convention. For instance, the
questions S.8, S.9, S.10, S.11, and S.12 will be marked using the color yellow because
they assess the levels manageable and collaborative, while the questions S.14 and S.17
will be marked using the color green because they assess the maturity level leading.

115
Thus, Figure 33 shows the resulting graph for the suppliers view. Each axis
represents the result of the assessment using the following abbreviation.
S: Suppliers P: Production
I: Inventories C: Customer
H: Human Resources T: Info. Systems & Technology
M: Performance Measurement Systems
0
1
2
3
4
5S
P
I
CH
T
M
Figure 33: Radar Graph for the View Suppliers
Tables 20 to 25 show the results for the other views assessment. Also after each table
there is an example of improvement roadmap for each view.
8,9
10,11,12
14,17

116
Table 20: Assessment Questionnaire for the view Production
Level Questions Answer (Yes/No) Evidence
Undefined
P.1 The main problems related to scrap, defect and reworks are documented and identified.
P.2 There are documents and diagrams which describe in detail the enterprise’s productive processes such as flow diagrams, product flow diagram, operation diagram, assembly diagrams and so on.
P.3 The documents and diagrams provided as evidence in the last question are known and used by anyone who needs them.
P.4 The main problems related to the processes downtimes and failures due to the lack of maintenance are identified and documented.
P.5 There are documented and implemented joint projects with other departments inside the enterprise.
P.6 The productive operations and the procedure to assign tasks are standardized.
Yes
Yes
Yes
Yes
Yes
Yes
Defined
P.7 There are documented and implemented improvement programs focusing on the reduction of scrap, defects and reworks in the enterprise’s productive processes.
P.8 There are documented and implemented processes to determine the delivery time for the products and services offered by the enterprise.
P.9 There are cross-disciplinary improvement programs oriented to reduce the delivery time of the product and services offered by the enterprise.
P.10 There is a documented and implemented procedure to make a master production plan.
P.11 There are documented and implemented procedures to assign tasks to the employees.
P.12 There is a defined maintenance program in the enterprise.
Yes
Yes
Yes
Yes
Yes
Yes
Manageable
P.13 There are documented and implemented quality assurance processes for all the products and services offered by the enterprise.
P.14 There are periodical meetings with other departments to work jointly in the improvement of the enterprise's production processes.
P.15 There are taskforces oriented to the implementation of modern production techniques and methodologies, such as MRPII, JIT, manufacturing flex systems, lean manufacturing, etc.
P.16 The quality standards for the products and services offered by the enterprise are constantly documented and updated.
P.17 The productive processes are optimized by the use of tools and methodologies.
P.18 The enterprise's key logistics processes are identified and documented.
Yes
Yes
Yes
Yes
Yes
Yes

117
Level Questions Answer (Yes/No) Evidence
Collaborative
P.19 The enterprise has received certifications related to its process standardization and quality, such as ISO, QS14000, Six Sigma, etc.
P.20 There have been improvement efforts based on contemporary improvement models, methodologies, and tools such as lean manufacturing, just-in-time, SCOR, concurring engineering, etc.
P.21 There is documentation in regards to operation and results required to submit for the application in a quality, production or standardization process award.
P.22 There are defined strategies to make alliances with other enterprises to have more productive systems within the enterprise.
P.23 There are strategies oriented to the innovation in process improvement and to the development of new products.
P.24 The life-cycle of the enterprises' products and/or services is clearly defined.
Yes
No
No
No
No
No
Leading
P.25 The continuous improvement processes in the product's logistics, quality, productivity and value for the client are documented and implemented.
P.26 There are development and research programs to improve the enterprises' key processes.
P.27 There is a defined procedure to determine if a process or an activity can be outsourced.
P.28 There are alliances and agreements with other enterprises that allow the enterprise to make its processes more productive.
P.29 There are integral production strategies such as computer-integrated manufacturing, process automation, quality function deployment, etc which are giving positive results.
P.30 There are follow-up and traceability processes for the products and raw materials, which in the event of quality problems in the products would allow to identify and recover at a minimum cost.
Yes
No
No
No
No
Yes
Based in the results obtained, the maturity level of this enterprise for the view
Production is Manageable. Thus, this enterprise should improve its supply chain
processes starting by the opportunities detected by the questions P.20 through P.24.
Some recommended actions and tool are the integration of internal production processes
through technological solutions such as RFID, Lean Thinking tools such as value stream

118
mapping, concurrent engineering, strengthening of value engineering projects such as
QFD, ISO, and TQM etc.
Table 21: Assessment Questionnaire for the view Inventory Systems
Level Questions Answer (Yes/No) Evidence
Undefined
I.1 The areas for inventories in process, and material and finished product warehouses are clearly identified.
I.2 There is a visual organization system in the material and finished product warehouses.
I.3 There is a defined and implemented procedure for incoming and outgoing raw material or product to and from the warehouse.
I.4 There is a defined and implemented procedure to manage the inventory levels and the inventory physical location in the warehouses.
I.5 There is a documented catalog of materials and finished products in stock in the warehouses.
Yes
No
Yes
No
Yes
Defined
I.6 There are replenishing methods and strategies, such as forecasting, future demand, reordering levels, master production plan, etc.
I.7 There are clearly defined, documented and implemented policies for all inventory management and control (parts, consumables, finished products, material in process, etc.)
I.8 There are projects to integrate technological solutions in the inventory control processes and management, such as MRP, bar codes, product identification, etc.
I.9 There are clearly defined, documented and implemented work procedures done jointly with other departments in regards to delivery time, raw material availability, finished products and required materials.
Yes
Yes
No
Yes
Manageable
I.10 There are projects to automate inventory control with ERP systems, warehouses management or similar systems.
I.11 There are support systems for management and inventory control decision making.
I.12 There is project deployment to optimize the levels of inventories in process, materials and finished products.
I.13 There is project deployment to integrate inventory management and control with the rest of the enterprise's inventories.
I.14 The inventory information is reliable. It adds value to the enterprise by generating more reliable master production programs.
No
Yes
Yes
Yes
Yes

119
Level Questions Answer (Yes/No) Evidence
Collaborative
I.15 There are documented and implemented processes that speed up inventory management and control such as kanban, cross docking and inventory consolidation, etc.
I.16 There are documented and implemented technological solutions for inventory management and control such as RFID, vendor management systems, inventory automation, distribution centers, etc.
I.17 There is a catalog of reliable enterprises to sublet the transportation of raw material and finished products.
I.18 There are documented and implemented policies about the level of compliance of the enterprises supplying raw material, service and distributing product in terms of compliance, service level, delivery time, etc.
I.19 There is participation with other departments in the enterprise to develop suppliers' certification and certification renewal policies.
Yes
No
Yes
Yes
Yes
Leading
I.20 The warehouses are orderly, clean, clearly identified; and the information of inventory levels is highly reliable.
I.21 Comparative studies about how the enterprise's inventories are managed and controlled are frequently done.
I.22 Concurrent engineering teams participate in providing information about the replenishing of the raw material required for the enterprise’s new products and/or services.
I.23 There are documented and implemented processes to assure the quality of the raw material, starting from the suppliers' plants.
No
No
No
No
Based in the results obtained, the maturity level of this enterprise for the view
Inventory Systems is Level 0, which means the enterprise has not complete at least the
level Undefined. Thus, this enterprise should improve its supply chain processes starting
by the opportunities detected by the questions I.2 and I.4. Some recommended actions
and tool are Inventory systems strategies such as layout by demand, by product type and
so on, basic office tools to analyze data related to demand, delivery of supplies, 5 S
concepts, documentation and standardization of inventory processes etc.
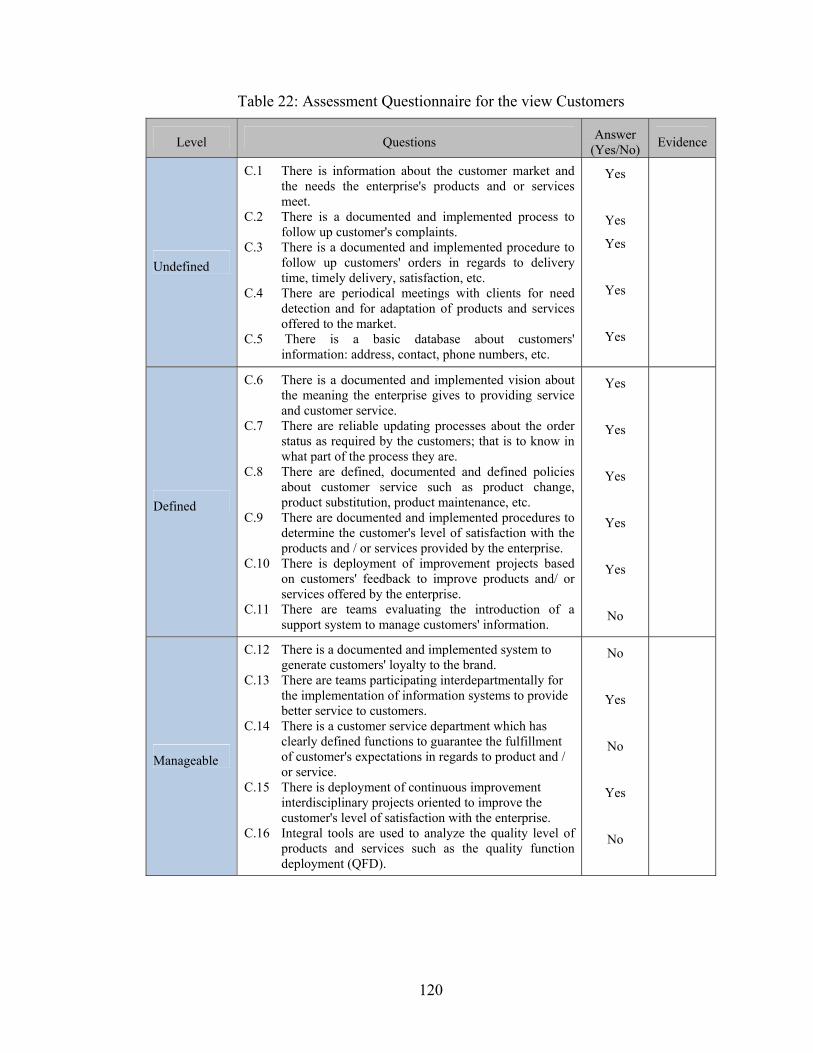
120
Table 22: Assessment Questionnaire for the view Customers
Level Questions Answer (Yes/No) Evidence
Undefined
C.1 There is information about the customer market and the needs the enterprise's products and or services meet.
C.2 There is a documented and implemented process to follow up customer's complaints.
C.3 There is a documented and implemented procedure to follow up customers' orders in regards to delivery time, timely delivery, satisfaction, etc.
C.4 There are periodical meetings with clients for need detection and for adaptation of products and services offered to the market.
C.5 There is a basic database about customers' information: address, contact, phone numbers, etc.
Yes
Yes
Yes
Yes
Yes
Defined
C.6 There is a documented and implemented vision about the meaning the enterprise gives to providing service and customer service.
C.7 There are reliable updating processes about the order status as required by the customers; that is to know in what part of the process they are.
C.8 There are defined, documented and defined policies about customer service such as product change, product substitution, product maintenance, etc.
C.9 There are documented and implemented procedures to determine the customer's level of satisfaction with the products and / or services provided by the enterprise.
C.10 There is deployment of improvement projects based on customers' feedback to improve products and/ or services offered by the enterprise.
C.11 There are teams evaluating the introduction of a support system to manage customers' information.
Yes
Yes
Yes
Yes
Yes
No
Manageable
C.12 There is a documented and implemented system to generate customers' loyalty to the brand.
C.13 There are teams participating interdepartmentally for the implementation of information systems to provide better service to customers.
C.14 There is a customer service department which has clearly defined functions to guarantee the fulfillment of customer's expectations in regards to product and / or service.
C.15 There is deployment of continuous improvement interdisciplinary projects oriented to improve the customer's level of satisfaction with the enterprise.
C.16 Integral tools are used to analyze the quality level of products and services such as the quality function deployment (QFD).
No
Yes
No
Yes
No
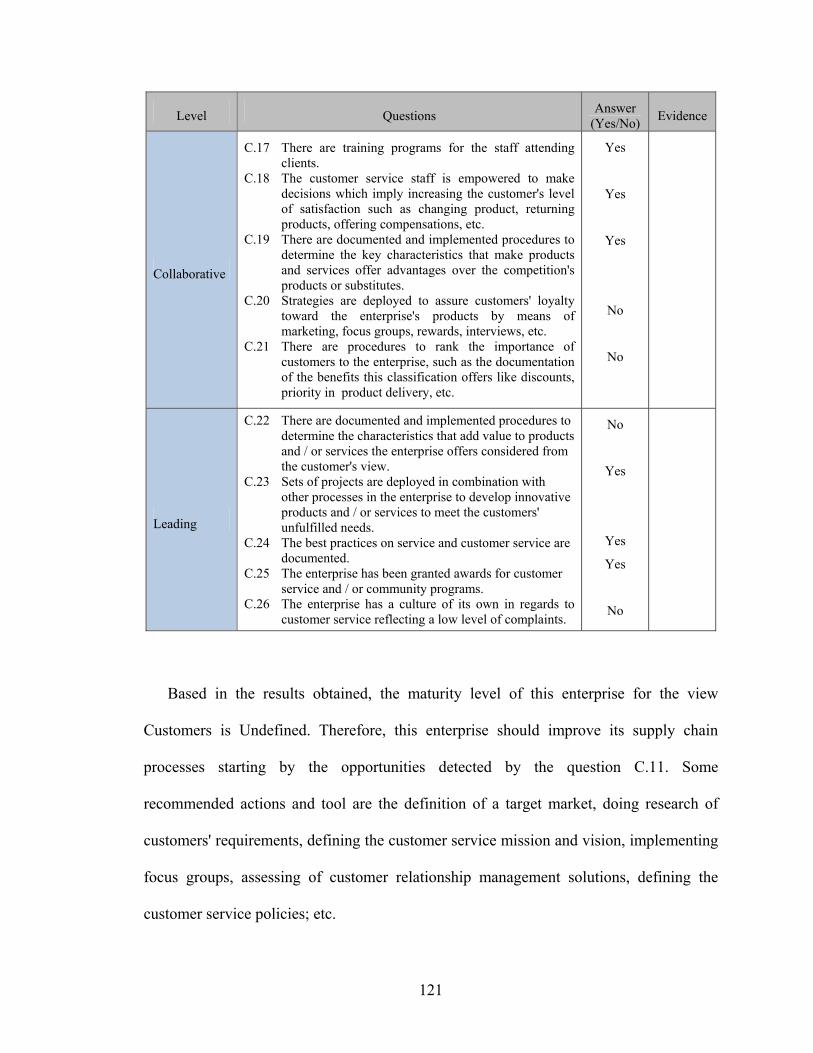
121
Level Questions Answer (Yes/No) Evidence
Collaborative
C.17 There are training programs for the staff attending clients.
C.18 The customer service staff is empowered to make decisions which imply increasing the customer's level of satisfaction such as changing product, returning products, offering compensations, etc.
C.19 There are documented and implemented procedures to determine the key characteristics that make products and services offer advantages over the competition's products or substitutes.
C.20 Strategies are deployed to assure customers' loyalty toward the enterprise's products by means of marketing, focus groups, rewards, interviews, etc.
C.21 There are procedures to rank the importance of customers to the enterprise, such as the documentation of the benefits this classification offers like discounts, priority in product delivery, etc.
Yes
Yes
Yes
No
No
Leading
C.22 There are documented and implemented procedures to determine the characteristics that add value to products and / or services the enterprise offers considered from the customer's view.
C.23 Sets of projects are deployed in combination with other processes in the enterprise to develop innovative products and / or services to meet the customers' unfulfilled needs.
C.24 The best practices on service and customer service are documented.
C.25 The enterprise has been granted awards for customer service and / or community programs.
C.26 The enterprise has a culture of its own in regards to customer service reflecting a low level of complaints.
No
Yes
Yes
Yes
No
Based in the results obtained, the maturity level of this enterprise for the view
Customers is Undefined. Therefore, this enterprise should improve its supply chain
processes starting by the opportunities detected by the question C.11. Some
recommended actions and tool are the definition of a target market, doing research of
customers' requirements, defining the customer service mission and vision, implementing
focus groups, assessing of customer relationship management solutions, defining the
customer service policies; etc.

122
Table 23: Assessment Questionnaire for the view Human Resources
Level Questions Answer (Yes/No) Evidence
Undefined
H.1 Strategies to avoid personnel absenteeism and turn over are deployed.
H.2 The basic required training for each position in the enterprise is defined.
Yes
Yes
Defined
H.3 There is a corporate identity enterprise wide. H.4 There is a definition of the profile and functions for
every position in the enterprise. H.5 Strategies are deployed to identify, preserve and
develop the outstanding human capital. H.6 There are reward systems for employees' performance.
Yes Yes
No
No
Manageable
H.7 Strategies are deployed to guarantee that employees make the enterprise's mission, vision and objectives their own.
H.8 There is a personal development program for employees.
H.9 There is a continuous training program for employees. H.10 There are established programs to acknowledge and
reward outstanding employees. H.11 There are continuous improvement programs for the
work area and climate in the enterprise.
Yes
No
Yes No
Yes
Collaborative
H.12 There are employee development and promotion programs which offer a career plan appropriate for each post in the enterprise.
H.13 Strategies are deployed to generate a collaborative and teamwork environment among employees.
H.14 There are clear mechanisms to listen to employees' requests and proposals.
H.15 The Human Resources staff is trained to attend the rest of its coworkers in the enterprise.
H.16 There are commercial agreements that provide employees advantages, discounts in the purchase of goods and services.
No
Yes
Yes
Yes
Yes
Leading
H.17 There are yearly evaluations of the enterprise's climate and the results indicate that employees perceive a good climate.
H.18 Strategies are deployed to develop in employees a culture of leadership, creativity and innovation.
H.19 There are personal development programs for employees and their families.
H.20 There are integral development programs for employees (health care, education, training, culture, etc.)
Yes
No
No
No

123
Based in the results obtained, the maturity level of this enterprise for the view Human
Resources is Undefined. Therefore, this enterprise should improve its supply chain
processes starting by the opportunities detected by the questions H.5 and H.6. Some
recommended actions and tool are the definition of training requirements, deployment of
strategies to create an enterprise work culture, definition of reward policies and
communication of reward program, definition of career plans for employees and
enterprise's position etc.
Table 24: Assessment Questionnaire for the view Info. Sys. & Technology
Level Questions Answer (Yes/No) Evidence
Undefined
T.1 The information is documented without using a computing system.
T.2 There are basic information systems like spreadsheets or basic databases.
T.3 There are compatibility problems with the enterprise's information systems.
T.4 The enterprise's processes depend greatly on the employees' experience and have little or no technological support.
Yes
Yes
Yes
Yes
Defined
T.5 Data collection systems and information management in word processors, spreadsheets and databases have been developed, but the systems have little or no interface between them
T.6 There are evaluation programs to determine possible improvements in processes based on technological support.
T.7 Projects are deployed to assure compatibility between technology and information systems used in the enterprise.
T.8 There is a trained staff to give maintenance and make the enterprise's technology and information systems more efficient.
T.9 There is a staff in charge of evaluating possible technological solutions and information systems for the enterprise.
Yes
Yes
No
No
Yes

124
Level Questions Answer (Yes/No) Evidence
Manageable
T.10 There are improvement teams in charge of training personnel when new technology or information systems such as ERO; CRM, SRM, etc., are introduced.
T.11 There is a documented and implemented standardized process to manage and generate data.
T.12 There are defined and documented strategies to update and replace technology.
T.13 Projects are deployed to define strategies to integrate suppliers and customers in the enterprise's information systems.
T.14 There are improvement processes for ease of access to information and way in which it is presented to users.
Yes
Yes
No
No
No
Collaborative
T.15 There are interdisciplinary teams to optimize use and management of technology.
T.16 Projects are deployed to integrate suppliers and customers in the enterprise's information systems.
T.17 Stabilization in the implementation of information systems in the enterprise has been fulfilled.
T.18 There are defined policies to manage technology and to make technological alliances.
T.19 There are technology development projects oriented to improve the enterprise's processes.
Yes
No
No
No
Yes
Leading
T.20 There is high dependence on technology and information systems to achieve good performance in the enterprise's processes.
T.21 There are defined policies to share developed technology with other enterprises.
T.22 There are technological alliances with other enterprises.
T.23 The enterprise's best practices are documented and shared with technological partners.
No
No
No
No
Based in the results obtained, the maturity level of this enterprise for the view
Information Systems and Technology is Undefined. Therefore, this enterprise should
improve its supply chain processes starting by the opportunities detected by the questions
T.7 and T.8. Some recommended actions and tool are the definition of technology
requirements to ensure the product flow and the availability of information, the

125
development of policies to justify technology acquisitions and the definition of training
requirements to keep information systems and technology tuned on.
Table 25: Assessment Questionnaire for the view Performance Measurement
Level Questions Answer (Yes/No) Evidence
Undefined
M.1 There are documented and implemented procedures to assure the integrity of the collected data about process performance.
M.2 Key performance indicators are defined and documented
M.3 The behavior of indicators is analyzed to define improvement projects in the enterprise.
Yes
Yes
Yes
Defined
M.4 There are documented procedures to store the enterprise’s historic information.
M.5 There are defined and implemented information report formats appropriate for each position.
M.6 There are projects to use the information in the design and implementation of support systems for decision making processes.
M.7 Employee performance and key processes in the enterprise are evaluated periodically
Yes
Yes
Yes
Yes
Manageable
M.8 There is a documented and implemented procedure to calculate the key performance indicators in the enterprise.
M.9 The performance indicators are constantly updated and are accessible to all decision makers who require them.
M.10 There are defined processes to generate indicators and information useful to undertake the enterprise's strategic planning.
M.11 It is defined what indicators should be presented to each level within the enterprise.
Yes
Yes
No
No
Collaborative
M.12 Projects to improve the enterprise's accessibility to and presentation of key indicators are done.
M.13 There are processes to periodically compare the enterprise's key indicators with those of the competition or another leading enterprise in the market.
M.14 There is access to the database of performance indicators of the leading enterprises in the market.
M.15 There is deployment of improvement projects about the forecasting accuracy of the enterprise's key indicators
M.16 There is a documented and implemented system of performance measurement for outsourced activities and processes.
No
No
No
No
Yes

126
Level Questions Answer (Yes/No) Evidence
Leading
M.17 There are documented and implemented policies to share the enterprise's information of key indicators with other enterprises.
M.18 There are support systems to make decisions that ease carrying out the needed improvements in the enterprise's processes.
M.19 The performance indicators developed by the enterprise are used as benchmarking by other enterprises.
M.20 There are improvement processes to optimize data collection, their analysis and presentation as performance indicators.
M.21 There are available systems to generate and monitor performance indicators in real time.
No
Yes
Yes
Yes
No
Based in the results obtained, the maturity level of this enterprise for the view
Performance Measurement Systems is Defined. Therefore, this enterprise should improve
its supply chain processes starting by the opportunities detected by the questions M.10
and M.11. Some recommended actions and tool are the definition of requirements for the
decision making processes at all management levels, assessment of KPIs accuracy,
benchmarking of the KPIs generation process, information systems working together to
ensure accessibility to performance indicators.
Integrating the results obtained from the assessment of all the views, the complete
radar graph of the enterprise’s supply chain system may be represented graphically as is
shown in Figure 34. According to the results obtained from the assessment of the
enterprise’s supply chain processes, this enterprise should to improve inventories as
priority one; human resources, information systems and technology, and customers as
priority two; and suppliers, production, and performance measurement systems as priority

127
three. In order to standardize the assessment process the following chapter describes the
assessment methodology, which comes together with the S(CM)2.
0
1
2
3
4
5S
P
I
CH
T
M
Figure 34: Maturity Levels for each view Assessed
8,9
10,11,12
14,17
20,21,22, 23,24
26,27,28,29
2,4 8
11
10 16
20,21,22,23
12,14,16
20,21
22,26
5,6
8,10
12
18,19,20
7,812,13,14
16,17,1820,21,22,23
10,1112,13,14,15
17,21

128
CHAPTER VI
THE ASSESSMENT METHODOLOGY OF THE S(CM)2
An important component of the S(CM)2 is the assessment methodology, which
provides a standardized way to implement the meta-model to assess and improve the
supply chain processes in the enterprise. This chapter describes the assessment
methodology of the S(CM)2. Also, this chapter shows how to generalize the classification
of the “as-is” state of the supply chain processes in the enterprise.
6.1 THE GENERALIZATION OF THE SUPPLY CHAIN CLASSIFICATION
Concerning the assessment methodology, this includes the use of several forms and
documentation. In order to provide a standardized classification format for each process
assessment, the model uses a general classification similar to the Kendall & Lee
classification used in queuing theory. Thus, the generalization of the model is defined
through the following format (A / B / C / D) (E / F / G) in which each letter represents the
maturity level of one view after the assessment, such that each variable has a range from
one to five. Regarding the relationship among the letters and the views, this is as follows:
A: Suppliers
B: Production
C: Inventories
D: Customers
E: Human Resources

129
F: Information Systems & Technology
G: Performance Measurement Systems
This classification has two subsets. The first one represents the maturity level of the
views related to the product flow from the downstream to the upstream of the supply
chain; the second one represents the maturity level of the views related to controlling and
speeding up the product flow.
Therefore, a process assessment report may be as is shown in Figure 35.
( 3 / 2 / 3 / 4 ) ( 2 / 2 / 3)
Figure 35: Supply Chain Assessment Report
To remember this general classification, the following acronym is suggested,
SUPPLYS (SUpplier, Production, PLanning of inventory , and Shopper(customer)) H-
SYSTEMS (Human SYStems, TEchnology, Measurement Systems (Metrics)). After
classifying an enterprise process according to this format, the next step is define an
improvement road map based on the supply chain reference actions, Key improvement
factors, and Useful tools provided by the meta-model. The next section describes the
suggested methodology to assess and improve the supply chain processes in the
enterprise, such that an analyst may obtain the general classification shown.
View Suppliers = Manageable
View Production = Defined
View Inventories = Manageable
View Customers = Collaborative
View Human Resources = Defined
View IS&Tech = Defined
View PMS = Manageable

130
6.2 THE SUPPLY CHAIN ASSESSMENT PROCESS
The S(CM)2 is a reference model useful to assess and improve the processes in a
supply chain. However, this meta-model requires a step-by-step methodology to
standardize the assessment process. Figure 36 shows the methodology graphically.
Supply Chain Process Assessment
Assessment Questionnaire
Fill out the Assessment
Questionnaire
Analyze the Assessment
Questionnaire results
Radar Graph
Determine the Improvement Road
Map Process
General Classification
The S(CM)2 and the Assessment Sheet
Classify each View by Maturity Level
Figure 36: The S(CM)2 Assessment Methodology
The methodology starts with a general assessment of the supply chain process. This
general assessment is obtained from the results of the assessment questionnaire shown in
Appendix 8. The questionnaire results describe the “as is” state of the enterprise’s supply

131
chain under analysis. The result of this general assessment tool is analyzed and reported
in a radar graph. This radar graph, allows prioritizing the supply chain views according
to the maturity level obtained. Also this shows a gap analysis by comparison among the
“as-is” system and the “to-be” system defined by the maturity level leading.
Once this step is done, the last assessing step is to obtain the general classification of
the supply chain analyzed as was shown in Figure 35. Based on the general
classification, it is possible to define an improvement road map prioritizing the
improvement projects according the maturity level obtained, such that the lower maturity
classification has the biggest improvement priority. However, other possible rules to
prioritize the views may be also applied, for instance including strategic or economic
considerations.
In order to provide a tool in which all the improvement projects can be shown, it is
possible to define a matrix of views and improvement projects. This matrix will include
all the observations, comments, constraints and improvement strategies used to improve
the supply chain. The useful tools provided by the S(CM)2 help to select an appropriated
best improvement practice for each view in each maturity level. The final result, is an
assessment sheet, Figure 37 shows the assessment sheet provided by the meta-model.
Once the assessment information is organized in this matrix, the analyst may be able
to define an improvement road map based on the general classification as a starting point,
the maturity level definition, the supply chain reference actions for each view and
maturity level, and the sets of key improvement factors and useful tools provided for each
level.

132
Analyst name: Report Date:
Views Undefined Defined Manageable Collaborative Leadership
Suppliers
Production
Inventories
Customers
Human Resources
Information Systems & Technology
Performance Measurement
Systems
Assesment Sheet
Observations
Figure 37: Assessment Sheet for the S(CM)2

133
CHAPTER VII
CONCLUSIONS AND FUTURE WORK
Enterprises seek to have tools, models, or methodologies to help them improve their
supply chain processes. There are many tools, models and methodologies which might
be implemented to obtain the desired improvements. However, how can an enterprise
select from all of them? Can the expected results be obtained using a particular tool, or a
combination of tools? Does an enterprise have the require maturity and knowledge for
implementing some tool or methodology? Considering these questions, this research
presents a model to provide a Supply Chain Capability Maturity Model S(CM)2, such that
an enterprise may use the S(CM)2 to assess its supply chain and define a road map for its
supply chain improvement process based on the maturity level of each model view.
The S(CM)2 provides a supply chain model including a cross-disciplinary and
dynamic point of view through the model life-cycle and the abstraction levels, which
implicitly consider the time variable. Besides, the meta-model provides a supply chain
representation, which is different from previous models.
The problem related with the selection of a system improvement strategy is addressed
by the set of tools recommended by maturity level, such that an enterprise may select
from these set the improvement tool or select similar tools not included in the list.
Additionally, the supply chain reference actions may be used to select a tool or define an
improvement road map such that the reference action is reached.

134
The final problem discussed was the vertical and horizontal integration. The S(CM)2
addressed this problem integrating the enterprise’s processes vertically in the maturity
levels one, two and three; after that, the meta-model integrates the enterprise’s processes
horizontally through collaboration and innovation.
7.1 RESEARCH CONTRIBUTION
This meta-model contributes to the state of the art of enterprise modeling and supply
chain improvement process by defining a method of how companies may improve their
supply chain performance. The meta-model contributions are as follows:
1. The research defines a Capability Maturity Model to assess the processes and
performance of enterprises in the supply chain. This model helps to determine
which processes and variables must be improved or controlled in order to
improve the overall enterprise supply chain performance.
2. The S(CM)2 integrates several best practices, methodologies, concepts, and
tools from different knowledge areas in a cross-disciplinary meta-model.
3. The S(CM)2 provides a set of supply chain reference actions in each maturity
level. These reference actions are used as building blocks for each view and
abstraction level, such that an enterprise may identify its maturity level for
each view by comparing it with the model.
4. The S(CM)2 provides a set of supply chain key improvement factors, which
are prioritized by maturity level, and a set of useful tools to improve the
supply chain processes until reaching the next maturity level

135
5. This research provides a diagnostic tool for the enterprise supply chain
operations processes, oriented to help the company to identify its
improvement opportunities and offer guidance on how to reach the next
maturity level. Moreover, this initial diagnosis enables a plan for improving
its current business processes through different tools and best practices.
6. The S(CM)2 selects a set of tools and best practices to fit the requirements for
each maturity level defined in the S(CM)2. This set of tools and best practices
is a menu of possible solutions, such that an enterprise may customize the sub
set required to improve the opportunities identified by the diagnostic tool.
7. The research contributes to the current state of the art related to merging the
use and implementation of several best practices making them work together
in an improvement process.
8. It provides conclusion and future research about the constraints, advantages
and, disadvantages of the use of a CMM which integrated the successful
concepts of contemporary best practices.
9. The S(CM)2 has advantages over other general reference models because of
the languages used to build the model and the fact that it was developed
specifically to assess and improve the enterprise’s supply chain processes.
Additionally, the language is easily recognized and common in the supply
chain field.

136
7.2 EXTENSION TO THIS WORK
The S(CM)2 presented in this research is the first version; thus, the meta-model may
be improved and increased in the following years. Moreover, the present work includes a
detailed methodology, which describes how the model was built; thus, this research may
be replicated to other fields different from supply chain such as food, automotive,
electronics, and so on.
The final meta-model was built considering only Mexican experts. In order to
increase the confidence in the S(CM)2; it is recommended to consider the opinion of
international experts, such that the model may be considered useful to any supply chain
in the world.
The S(CM)2 is a first level of detailed meta-model. In order to complete the whole
documentation of the model, it is needed to decompose, describe and document each
reference into several detail levels, such that the model describes the activities and tasks,
included in each supply chain reference action.
Finally, the S(CM)2 may be extended and improved through more real
implementation in several enterprises. The results obtained from this implementation
will be helpful to increase the useful tools list and document the real benefits provided by
the improvement projects originated by the enterprises’ supply chain assessment.

137
REFERENCES
Akkermans, H. A, P. Bogerd, E. Yücesan, and L. N. Van Wassenhove (2003), “The Impact of ERP on Supply Chain Management: Exploratory Findings from a European Delphi Study,” European Journal of Operation Research, Volume 146, pp. 284-301.
Angerhofer, B. J., and M. C. Angelides (2000), “System Dynamic Modeling in Supply
Chain Management: Research Review,” Proceedings of the 2000 Winter Simulation Conference, J. A. Joines, R. R. Barton, K. Kang, and P. A. Fishwick, eds., pp. 342-351.
Appelquist, P., J. Lehtonen, and J. Kokkonen (2004), “Modeling in Product and Supply
Chain Design: Literature Survey and Case Study,” Journal of Manufacturing Technology Management, Volume 15, Number 7, pp. 675-686.
Argyres, Nicholas (1996), “Evidence on the Role of Firm Capabilities in Vertical
Integration Decision,” Strategic Management Journal, Volume 17, Number 2, pp. 129-150.
Ballou R. H. (2004), Business Logistics Management, 5th Edition, Phoenix, Arizona,
Prentice Hall Inc. Barber K. D., F. W. Dewhurst, R. L. D. H. Burns, and J. B. B. Rogers (2003), “Business-
Process Modeling and Simulation for Manufacturing Management: A Practical Way Forward,” Business Process Management Journal, Volume 9, Number 4, pp. 527-542.
Bernus, P., and L. Nemes (1997), “Requirements of the Generic Enterprise Reference
Architecture and Methodology,” A Rev. Control, Volume 21, pp. 125-136. Braganza, A. (2002), “Enterprise Integration: Creating Competitive Capabilities,”
Integrated Manufacturing Systems, Volume 13, Number 8, pp. 562-572. Brewer, P. C. and T. W. Shep (2000), “Using the Balance Scorecard to Measure Supply
Chain Performance,” Journal of Business Logistics, Volume 21, Number 1, pp. 75-93.
Bunting, R., F. Coallier, and G. Lewis (2002), “Interdisciplinary Influences in Software Engineering Practices” Proceedings of the 10th International Workshop on Software Technology and Engineering Practice, pp. 62-69.
Calingo, L. M. R. (1996), “The Evolution of Strategic Quality Management,”
International Journal of Quality and Reliability Management, Volume 13, Number 9, pp. 19-37.

138
Caputo, A. C., P. M. Pelagagge, and F. Scacchia (2003), “Integrating Transport Systems in Supply Chain Management Software Tools,” Industrial Management & Data Systems, Volume 103, Number 7, pp. 503-515.
Chalmeta, R., C. Campos, and R. Grangel (2001), “Reference Architectures for
Enterprise Integration,” The Journal of Systems and Software, Volume 57, pp. 175-191.
Chan, F. T. S., N. K. H. Tang, H. C. W. Lau, and R. W. L. Ip (2002), “A Simulation
Approach in Supply Chain Management,” Integrated Manufacturing Systems, Volume 13, Number 2, pp. 117-122.
Chandra, C. and S. Kumar (2001), “Enterprise Architecture Framework for Supply Chain
Integration,” Industrial Management & Data Systems, Volume 101, Number 6, pp. 290-303.
Chatfield, D. C., J. G. Kim, T. P. Harrison, and J. C. Hayya (2004), “The Bullwhip
Effect-Impact of Stochastic Lead Time, Information Quality, and Information Sharing: A Simulation Study,” Production and Operation Management, Volume 13, Number 4, pp. 340-353.
Chen, F., Z. Drezner, J. K. Ryan, and D. Simchi-Levi (2000), “Quantifying the Bullwhip
Effect in a Simple Supply Chain: The Impact of Forecasting, Lead Times, and Information,” Management Science, Volume 46, Number 3, pp. 436-443.
Chin, K., V. M. R. Tummala, J. P. F. Leung, and X. Tang (2004), “A Study on Supply
Chain Management Practices: The Hong Kong Manufacturing Perspective,” International Journal of Physical Distribution & Logistics Management, Volume 34, Number 6, pp. 505-524.
Cooper M. C., D. M. Lambert, and J. D. Pagh (1997), “Supply Chain Management: More
Than a New Name for Logistics,” The International Journal of Logistics Management, Volume 8, Number 1, pp. 1-13.
Dangle, K. C., P. Larsen, M. Shaw, and M. V. Zelkowitz (2005), “Software Process
Improvement in Small Organizations: A Case Study,” IEEE Software, Volume 22, Number 6, pp. 68-75.
Davenport, T. H., and J. D. Brooks (2004), “Enterprise Systems and the Supply Chain,”
Journal of Enterprise Information Management, Volume 17, Number 1, pp. 8-19. Davies, A. J., and A. K. Kochhar (2002), “Manufacturing Best Practice and Performance
Studies: A Critique,” International Journal of Operation and Production Management, Volume 22, Number 3, pp. 289-305.

139
Dewhurst, F. W., K. D. Barber, and M. C. Pritchard (2002), “In Search of a General Enterprise Model,” Management Decision, Volume 40, Number 5, pp. 418-427.
ESPIRIT Consortium AMICE (Eds) (1993), “CIMOSA: Open System Architecture for
CIM,” 2nd revised and extended edition, Research Report, ESPIRIT Project 688/5288, Sringer-Verlang.
Ferrin, D. M., M. J. Miller, and D. Muthler (2005), “Lean Sigma and Simulation, so
What’s the Correlation? V2,” Proceedings of the 2005 Winter Simulation Conference, M. E. Kuhl, N. M. Steiger, F. B. Armstrong, and J. A. Joines, eds., pp. 2011-2015.
Gack, G. A. and K. Robison (2003), “Integrating Improvement Initiatives: Connecting
Six Sigma for Software, CMMI, Personal Software Process (PSP), and Team Software Process (TSP),” Software Quality Professional, Volume 5, Number 4, pp. 5-13.
Garg, D., Y. Narahari, and N. Viswanadham (2004), “Design of Six Sigma Supply
Chains,” IEEE Transactions on Automation Science and Engineering, Volume 1, Number 1, pp. 38-57.
Grover, V., M. J. Cheon, and J. T. C. Teng (1996), “The Effect of Service Quality and
Partnership on the Outsourcing Information Systems Function,” Journal of Management Information Systems, Volume 12, Number 4, pp. 89-116.
Gunasekaran, A., C. Patel, and E. Tirtiroglu, “Performance Measures and Metrics in a
Supply Chain Environment,” International Journal of Operations and Production Management, Volume 21, Number 1/2, pp.71-87.
Hakim, S., and J. Weinblatt (1993), “The Delphi Process as a Tool for Decision Making:
The Case of Vocational Training of People with Handicaps,” Evaluation and Program Planning, Volume 16, pp. 25-38.
Hammer, M. (2002), “Forward to basics,” Fast Company, Volume 64, pp. 37-38. Hammer, M. (2002b), “Process Management and the Future of Six Sigma,” MIT Sloan
Management Review, Volume 43, Number 2, pp. 26-32. Harland, C., L. Knight, R. Lamming, and H. Walker (2005), “Outsourcing: Assessing the
Risks and Benefits for Organizations, Sectors and Nations,” International Journal of Operation and Production Management, Volume 25, Number 9, pp. 831-850.
Harrigan, K. R. (1986), “Matching Vertical Integration Strategies to Competitive
Conditions,” Strategic Management Journal, Volume 7, Number 6, pp. 535-555. Hayes, T. (2007), “Delphi Study of the Future of Marketing of Higher Education,”
Journal of Business Research, Volume 60, pp. 927-931.

140
Hicks, D. A. (1999), “A Four Step Methodology for Using Simulation and Optimization Technologies in Strategic Supply Chain Management,” Proceedings of the 1999 Winter Simulation Conference, P. A. Farrington, H. B. Nembhard, D. T. Sturrock, G. W. Evans eds., pp. 1215-1220.
Holmberg, S. (2000). “A Systems Perspective on Supply Chain Measurements,”
International Journal of Physical Distribution & Logistic Management, Volume 30, Number 10, pp. 847-868.
Holsapple, C. W. and K. D. Joshi (2000), “An Investigation of Factors that Influence the
Management of Knowledge in Organization,” Journal of Strategic Information Systems, Volume 9, pp. 235-261.
Hong-Minh, S. M., R. Barker, and M . M. Naim (2001), “Identifying Supply Chain
Solutions in the UK House Building Sector,” European Journal of Purchasing & Supply Management, Volume 7, pp 49-59.
Huang, S. H., S. K. Sheoran, and G. Wang (2004), “A Review and Analysis of Supply
Chain Operations Reference (SCOR) Model,” Supply Chain Management: An International Journal, Volume 9, Number 1, pp. 23-29.
Huang, S. H., S. K. Sheoran, and H. Keskar (2005), “Computer-Assisted Supply Chain
Configuration Based on Supply Chain Operations Reference (SCOR) Model,” Computers & Industrial Engineering, Volume 48, pp. 377-394.
Kakabadse, N., and A. Kakabadse (2000), “Critical Review – Outsourcing: A Paradigm
Shift,” The Journal of Management Development, Volume 19, Number 8, pp. 670-728.
Kasi, V. (2005), “Systematic Assessment of SCOR for Modeling Supply Chain,”
Proceedings of the 38th Hawaii International Conference on Systems Sciences, pp. 1-10.
Kengpol A. and M. Touminen (2006), “A Framework for group decision support
systems: An Application in the Evaluation of Information Technology for Logistics Firms,” International Journal of Production Economics, Volume 101, pp. 159-171.
Kerr, J. (2002), “What Does “Lean” Really Mean?,” Logistics Management, Volume 45,
Number 5, pp 29- 34. Kole, M. A. (1983), “Go Outside for MIS Implementations,” Information and
Management, Volume 6, Number 5, pp. 261-268. Kosanke, K., and M. Zelm (1999), “CIMOSA Modelling Process,” Computers in
Industry, Volume 40, pp. 141-153.

141
Kosanke, K., F. Vernadat, and M. Zelm (1999), “Enterprise Engineering and Integration,” Computers in Industry, Volume 40, pp. 83-97.
La Londe, B. J. and J. M. Masters (2004), “Emerging logistics strategies: Blueprints for
the next century,” International Journal of Physical Distribution & Logistics, Volume 24, Number 7, pp. 35-47.
Lambert, D. M., M. C. Cooper, and J. D. Pagh (1998), “Supply Chain Management:
Implementation Issues and Research Opportunities,” International Journal of Logistics Management, Volume 9, Number 2, pp. 1-19.
Lambert, D. M. and T. L. Pohlen (2001), “Supply Chain Metrics,” International Journal
of Logistics Management, Volume 12, Number 1, pp. 1-19. Lawes, Aidan (2006), “Making Best Practices Work for You,” Computer Weekly,
5/9/2006, p. 24. Lee, H. L., V. Padmanabhan and S. Whang (1997), “The Bullwhip Effect in Supply
Chains,” MIT Sloan Mangement Review, Volume 38, Number 3, pp. 93-102. Li, H., and T. J. Williams (2002), “Management of complexity in Enterprise Integration
Projects by the PERA Methodology,” Journal of Intelligent Manufacturing, Volume 13, Number 6, pp. 417-427.
Li, Z., A. Kumar, and Y. G. Lim (2002), “Supply Chain Modeling: A Coordination
Approach,” Integrated Manufacturing Systems, Volume 13, Number 8, pp. 551-561. Lin, F., M. Yang, and Y. Pai (2002), “A Generic Structure for Business Process
Modeling,” Business Process Management Journal, Volume 8, Number 1, pp. 19-41. Linstone, H. A. and M. Turoff (1975), The Delphi Method: Techniques and Applications,
Addison-Wesley, London. Lockamy III, A., and K. McCormack (2004), “The Development of a Supply Chain
Management Process Maturity Model Using Concepts of Business Process Orientation,” Supply Chain Management: An International Journal, Volume 9, Number 4, pp. 272-278.
Lockamy III, A., and K. McCormack (2004b), “Linking Score Planning Practices to
Supply Chain Performance: An Exploratory Study,” International Journal of Operations & Production Management, Volume 24, Number 12, pp. 1192-1218.
Lummus, R. R., D. W. Krumwiede, and R. J. Vokurka (2001), “The Relationship of
Logistics to Supply Chain Management: Developing a Common Industry Definition,” Industrial Management and Data Systems, Volume 101, Number 8, pp. 426-431.

142
Markus, M.L., M. Tanniru, and P. C. Van Fenema (2000), “Multisite ERP Implementations”, Communications of the ACM, Volume 43, Number 4, p. 42.
McCormack K. P., W. C. Johnson with W. T. Walker (2002), Supply Chain Networks
and Business Process Orientations, Boca Raton, Florida, The St. Lucie Press/APICS Series on Resource Management.
McGuire E. G. and K. A. McKeown (2001) “5 Critical Steps for Adopting CMM in an
ISO Environment,” International Conference on Management of Engineering and Technology, Volume 1, pp. 430-431.
Mentzer, J. T., W. DeWitt, J. S. Keebler, S. Min, N. W. Nix, C. D. Smith, and Z. G.
Zacharia (2001), “Defining Supply Chain Management,” Journal of Business Logisitcs, Volume 22, Number 2, pp. 1-25.
Mertins K., and R. Jochem (2005), “Architectures, Methods and Tools for Enterprise
Engineering,” International Journal of Production Economics, Volume 98, 2005 Miller, G. D. (2004), “Common Mistakes in Supply Chain Buying,” Frontline Solutions,
Volume 5, Number 9, pp. 42-43. Motwani, J., M. Madan, A. Gunasekaran (2000), “Information Technology in Managing
Global Supply Chains,” Logistics Information Management, Volume 13, Number 5, pp. 320-327.
Mullen, P. M. (2003), “Delphi: Myths and Reality,” Journal of Health Organization and
Management, Volume 17, Number 1, pp. 37-52. Murugappan, M. and G. Kenni (2003), “Blending CMM and Six Sigma to Meet Business
Goals,” IEEE Software, Volume 20, Number 2, pp. 42-48. National Institute of Standards and Technology (NIST) (1999), “Interoperability Cost
Analysis of the US Automotive Supply Chain,” Prepared by S. B. Brunnermeier and S. A. Martin, Research Triangle Institute, Strategic Planning and Economic Assessment office.
Neely, A., M. Gregory, and K. Platts (1997), “Performance Measurement Systems
Design a Literature Review and Research agenda,” International Journal of Operation and Production Management, Volume 15, Number 4, pp. 80-116.
Noran O. (2003), “An Analysis of the Zachman Framework for Enterprise Architecture
from the GERAM Perspective,” Annual Review in Control, Volume 27, pp. 163-183. Okoli, C., and S. D. Pawlowski (2004), “The Delphi Method as a Research Tool: An
Example, Design Considerations and Applications,” Information & Management, Volume 42, pp. 15-29.

143
Pereira C. M., and P. Sousa (2004), “A Method to Define an Enterprise Architecture
Using the Zachman Framework,” Proceedings of the 2004 ACM Symposium on Applied Computing, ACM Press New York, N. Y., pp. 1366-1371.
Phelps T., M. Smith, and T. Hoenes (2004), “Building a Lean Supply Chain,”
Manufacturing Engineering, Volume 132, Number 5, pp. 107-113. Porter, M.E. (1985), Competitive Advantage: Creating and Sustaining Superior
Performance, The Free Press, New York, NY. Rollins, R. P., K. Porter, and D. Little (2003), “Modelling the Changing Apparel Supply
Chain,” International Journal of Clothing Science and Technology, Volume 15, Number 2, pp. 140-156.
Saenz O. A., and C. Chen (2004), “A Framework for Enterprise Systems Engineering,”
Proceedings of the Second LACCEI International Latin American and Caribbean Conference for Engineering and Technology, Information Technology Track, paper number 033.
Samaranayake, P. (2005), “A Conceptual Framework for Supply Chain Management: A
Structural Integration,” Supply Chain Management: An International Journal, Volume 10, Number 1, pp. 47-59.
Sengupta, S. (2004), “The Top 10 Supply Chain Mistakes,” Supply Chain Management
Review, Volume 8, Number 5, pp. 42-49. Shapiro, J. F. (2001), “Modeling and IT Perspectives on Supply Chain Integration,”
Information Systems Frontiers, Volume 3, Number 4, pp 455-464. Siau, K. and Y. Tian (2004), “Supply Chains Integration: Architecture and Enabling
Technologies,” The Journal of Computer Information Systems, Volume 44, Number 3, pp. 67-72.
Stank, T. P., and T. J. Goldsby (2000), “A Framework for Transportation Decision
Making in an Integrated Supply Chain,” Supply Chain Management An International Journal, Volume 5, Number 2, pp. 71-77.
Stevens, G. (1989), “Integrating the Supply Chain,” International Journal of Physical
Distribution and Logistics Management, Volume 19, Number 8, pp. 3-8. Stewart, G. (1997), “Supply Chain Operations Reference (SCOR): The first Cross-
industry Framework for Integrated Supply Chain Management,” Logistic Information Management, Volume 10, Number 2, pp. 62-67.

144
Stock, J.R. (1990), “Logistics Thought and Practice: a Perspective,” International Journal of Physical Distribution & Logistics Management, Vol. 20 No. 1, p. 5.
Stock, J. R. (1997). “Applying Theories from Other Disciplines to Logistics,”
International Journal of Physical Distribution and Logistics, Volume 27, Number 9/10, pp. 515-539.
Svensson, G. (2002), “The Theoretical Foundation of Supply Chain Management: A
Functionalist Theory of Marketing,” International Journal of Physical Distribution and Logistics, Volume 32, Number 9, pp. 734-754.
Svensson, G. (2003), “Holistic and Cross-Disciplinary Deficiencies in the Theory
Generation of Supply Chain Management,” Supply Chain Management: An International Journal, Volume 8, Number 4, pp. 303-316.
Timm, R. (1993), “Outsourcing Can Be a Productivity Solution for the 90’s,” HR Focus,
Volume 70, Number 11, p. 23. Turoff, M. (1970), “The Design of a Policy Delphi,” Technological Forecasting and
Social Change, Volume 2, Number 2, pp 149-171. Tyndall, G., C. Gopal, W. Partsch, and J. Kamauff (1998), Super-charging Supply
Chains: New Ways to Increase Value through Global Operational Excellence, New York, N.Y., John Wiley & Sons.
Van der Vorst, J. G. A. J., and A. J. M. Beulens (2002), “Identifying Sources of
Uncertainty to Generate Supply Chain Redesign Strategies,” International Journal of Physical Distribution & Logistics Management, Volume 32, Number 6, pp. 409-430.
Van der Zee, D. J., and J. G. A. J. Van der Vorst (2005), “A Modeling Framework for
Supply Chain Simulation: Opportunities for Improved Decision Making,” Decision Sciences, Volume 36, Number 1, pp. 65-95.
Verhagen A. P., A. P., H. C. W. de Vet, R. A. de Bie, A. G. H. Kessels, M. Boers, L. M.
Bouter, and P. G. Knipschild (1998), “The Delphi List: A Criteria List for Quality Assessment of Randomized Clinical Trials for Conducting Systematic Reviews Developed by Delphi Consensus,” Journal of Clinic Epidemiology, Volume 51, Number 12, pp. 1235-1241.
Vitasek K., K. B. Manrodt, J. Abbott (2005), “What Makes a LEAN Supply Chain?,”
Supply Chain Management Review, Volume 9, Number 7, pp. 39-45. White R. E., and J. N. Pearson (2001), “JIT, System Integrations and Customer Service,”
International Journal of Physical Distribution and Logistics Management, Volume 31, Number 5, pp. 313-333.

145
Whitman L., K. Ramachandran, V. Ketkar (2001), “A Taxonomy of a Living Model of the Enterprise,” Proceedings of the 2001 Winter Simulation Conference, B. A. Peters, J. S. Smith, D. J. Medeiros, and M. W. Rohrer eds., pp. 848-855.
Williams, T. J. (1998), Handbook of Life-cycle Engineering: Concepts, Models, and
Technologies, Molina, A., A. Kusiak, and J. M. Sanchez eds., Dordrecht, the Netherlands, Kluwer Academic Publisher.
Yoo, C., J. Yoon, B. Lee, C. Lee, J. Lee, S. Hyun, and C. Wu (2004), “An Integrated
Model of ISO 9001:2000 and CMMI for ISO Registered Organizations,” Proceedings of the 11th Asia-Pacific Software Engineering Conference, pp. 150-157.
Yu, B., J. A. Harding, and K. Popplewell (2000), “A Reusable Enterprise Model,”
International Journal of Operations & Production Management, Volume 20, Number 1, pp. 50-69.
Yu, B., J. A. Harding, and K. Popplewell (2000b), “Supporting Enterprise Design
Through Multiple Views,” International Journal of Agile Management Systems, Volume 2, Number 1, pp. 71-82.
Zachman, J. A. (1999), “A Framework for Information Systems Architecture,” IBM
Systems Journal, Volume 38, Number 2/3, pp. 454-470. Zülch,G., A. Rinn, and O. Strate (2001), “Dynamic analysis of changes in decisional
structures of production systems,” International Journal of Production Economics, Volume 69, pp. 239-252.

146
APPENDICES
APPENDIX 1: INVITATION LETTER FOR THE FIRST ROUND AT STAGE I
Date: XXXX
To: XXXX
By this mean, I like inviting you to participate in a research project about supply
chain management. The objective of this research is to define a five levels maturity
model to assess the enterprise’s supply chain processes. The model development implies
to collect and analyze the opinion of several experts in the supply chain field. As you are
considering an expert by your experience and recognition in supply chain or related
fields, your participation is worthwhile to us. The research process involves two rounds
of questions. All the answers provided in the first round will be compiled and
summarized. After you will be receiving a second questionnaire designed to go in depth
in the findings obtained from the first round of answers. I will really appreciate your
time and cooperation.
Sincerely
XXXX

147
Name________________________________
Company _____________________________
Position___________________________________
Years of experience in the supply chain field or similar ________________
Please answer the following open-end questions.
1. What do you understand by supply chain management?
2. According to the following taxonomy:
Level one: an enterprise with poor supply chain development
Level two: ------
Level three: ------
Level four: ------
Level five: an enterprise leader on the market (benchmarking)
What characteristics have an enterprise in each one of these level?

148
APPENDIX 2: DELPHI SURVEY FOR THE SECOND ROUND AT THE STAGE I
Second Round
Date XXXX
To XXXX
I appreciate your previous participation in the first round. This time I like inviting you
to answer this second survey. The objectives of this second round are to improve and to
validate the supply chain definition generated from the first round of results and to
identify the key elements at each maturity level, according to the taxonomy defined in the
previous survey. Thanks again for your time and participation.
Sincerely
XXXX
Name________________________________
Company _____________________________
Position___________________________________
Years of experience in the supply chain field or similar________________

149
After reviewing the data obtained from the first round of results, the following
definition was established:
“Supply chain is a network of enterprises, which integrates all processes from the
supply and procurement of raw materials to delivering a finished good. The supply
chain involves all processes oriented to improve logistics and productivity”.
1. Select from the following options how much you agree with this definition.
strongly
disagree moderately
disagree neutral moderately agree strongly
agree
2. Include your comments in order to improve the definition. What is missing?
The following list of supply chain elements was generated from the data obtained in
the first round. According to you, which of them are key factors for each maturity level?
It can be selected as many as you consider relevant for each maturity level. Consider
level one as an enterprise with a poor supply chain development and level five as an
enterprise leader on the market (benchmarking).

150
1. Company Objectives, vision and mission
2. Cost
3. Customer requirements
4. Customer Service
5. Defects/reworks/scrap
6. Demand Forecasting
7. Demand Management
8. Enterprise Policies
9. Inventory Management
10. ISO
11. KPI
12. Lead Time
13. Logistics
14. Optimization processes
15. Organization structure
16. Procedures
17. Process Capability
18. Processes Synchronization
19. Product
20. Product Distribution
21. Production
22. Quality
23. Raw materials procurement
24. Change Response Time
25. Shipping
26. Suppliers
27. Warehousing
3. Include a brief explanation of any other element does not listed.

151
APPENDIX 3: INVITATION LETTER FOR THE FIRST ROUND AT STAGE II
First Round
Date: XXXX
To: XXXX
By this mean, I like inviting you to participate in a research project about supply
chain management. The objective of this research are to define a five level model of
supply chain development and identify tools, techniques, methodologies, etc. available to
improve the supply chain from one maturity level to the next one. The model
development implies to collect and analyze the opinion of several experts in the supply
chain field. As you are considering an expert by your experience and recognition in
supply chain or related fields, your participation is worthwhile to us. The research
process involves two rounds of questions. All the answers provided in the first round will
be compiled and summarized. After you will be receiving a second questionnaire
designed to go in depth in the findings obtained from the first round of answers. I will
really appreciate your time and cooperation.
Sincerely
XXXX

152
Name________________________________
Company _____________________________
Position___________________________________
Years of experience in the supply chain field or similar ________________
I. Section One: Supply Chain definition
Please read the following supply chain definition
“Supply Chain is a system which manages and controls the use of facilities,
processes, resources, and supplies in order to improve the logistic productivity in the
enterprise. All the processes of the supply chain system have the objective of promoting
products and/or services with value to their customers. This goal is achieved through the
coordination among all the supply chain stakeholders. All supply chain processes are
based on the knowledge and satisfaction of the customer requirements regarding quality,
time response, cost, flexibility, and innovation”.
Considering this definition, select how much you agree with each of the segments
using the provided scale.
1. Supply Chain is a system which manages and controls the use of facilities, processes,
resources, and supplies in order to improve the logistic productivity in the enterprise.
strongly
disagree moderately
disagree neutral moderately agree strongly
agree

153
2. All the processes of the supply chain system have the objective of promoting products
and/or services with value to their customers. This goal is achieved through the
coordination among all the supply chain stakeholders.
strongly
disagree moderately
disagree neutral moderately agree strongly
agree
3. All supply chain processes are based on the knowledge and satisfaction of the
customer requirements regarding quality, time response, cost, flexibility, and
innovation.
strongly
disagree moderately
disagree neutral moderately agree strongly
agree
II. Section Two: Maturity level definition
Please read the following enterprise’s characteristics of each maturity level.
Considering these definitions, selects form the following options your agreement level
using the provided scale.
Maturity level one (undefined). This is an enterprise with no process documentation
or standardization; there is lack of knowledge about the enterprise’s processes, activities,
and tasks; the enterprise primarily reacts to the environment instead of planning; the
enterprise remains in the market by a small advantage on sale price, location, or customer
relationship in comparison with the competition; there is no continuous improvement
plan defined; all the improvements are reached by individual and isolated efforts; the
productive processes are focused on completing the customer orders; however, they may

154
experience frequent problems in meeting customers’ expectations; the enterprise does not
have a defined vision or mission.
strongly
disagree moderately
disagree neutral moderately agree strongly
agree
Provide any comment and suggestion to improve this definition.
________________________________________________________________________
________________________________________________________________________
Maturity level two (Defined). This is an enterprise which recognizes the value of
defining its vision and mission; at this level the enterprise starts to consider the strategic
market elements such as price fluctuations, new products, tendencies, etc; there is lack of
documentation at all the enterprise levels; the enterprise has not defined a target market to
which offer a wide catalog of products, even though many of the products imply losing
money; the first attempts to develop customer loyalty and suppliers appear; the enterprise
has basic and generic office software without specialized software for the industry or
functions; the enterprise starts to collect data and use them to generate information useful
to making decisions; there are no performance measurement systems; and the
improvement efforts are still unorganized.
strongly
disagree moderately
disagree neutral moderately agree strongly
agree

155
Provide any comment and suggestion to improve this definition.
________________________________________________________________________
________________________________________________________________________
________________________________________________________________________
________________________________________________________________________
Maturity level three (Manageable). The enterprise is searching a target market, the
first attempt to integrate processes is made; the enterprise starts to deploy continuous
improvement plans with special focus on process documentation and standardization; the
personnel is induced to an organizational culture oriented to customer satisfaction and
personal development; there are closer negotiations with suppliers regarding policies,
times and costs; the improvement process applied a set of tools or techniques instead of a
single one; there are isolated information systems useful to measure, control, and make
decisions oriented to processes improvement.
strongly
disagree moderately
disagree neutral moderately agree strongly
agree
Provide any comment and suggestion to improve this definition.
________________________________________________________________________
________________________________________________________________________
________________________________________________________________________
________________________________________________________________________

156
Maturity level four (Collaborative). An enterprise at this level has defined
collaboration strategies oriented to integrate customers and suppliers; there is clear
orientation to satisfy the customer’s expectations; there are several improvement
processes related to the knowledge of customers’ needs; there are integrated information
systems, which provide a technological platform for data exchange among suppliers,
company, and customers, generating key information about the market and the
competence; there are several measurements and evaluation related to the supplier’s
performance; there is a better selection of suppliers; the enterprise uses more complex
improvement processes due to the holistic project focus; there is in depth knowledge of
all the enterprise’s processes.
strongly
disagree moderately
disagree neutral moderately agree strongly
agree
Provide any comment and suggestion to improve this definition.
________________________________________________________________________
________________________________________________________________________
________________________________________________________________________
________________________________________________________________________
Maturity level five (Leading). An enterprise in this maturity level will be able to
innovate, develop, and transfer the best practices; this type of enterprises has a strong
influence over suppliers and customers regarding their work culture and methods,
information systems, continuous improvement processes etc; key processes and functions

157
are aligned to the enterprise’s mission and corporative strategy; the personnel is aware
about the value that they add to the product with their activities, such that they are
looking for more efficient and effective ways to do them. Information systems integrate
suppliers, company, and customers’ key information, which is available to everyone who
needs it; there is a strong dependence of technological solutions.
strongly
disagree moderately
disagree neutral moderately agree strongly
agree
Provide any comment and suggestion to improve this definition.
________________________________________________________________________
________________________________________________________________________
________________________________________________________________________
________________________________________________________________________

158
APPENDIX 4: INVITATION LETTER FOR THE FIRST ROUND AT STAGE II
Second Round
Date XXXX
To XXXX
I appreciate your previous participation in the first round. This time I like inviting you
to answer this second survey. The objective of this second survey is to collect a set of
tools useful to improve a supply chain from one maturity level to the next one. The
maturity levels are defined according to the answer obtained from the first round. Thanks
again for your time and participation.
Sincerely
XXXX
Name________________________________
Company _____________________________
Position___________________________________
Years of experience in the supply chain field or similar________________

159
I. Section One: Maturity Levels definitions
Due the definitions of the maturity levels were accepted in a general sense, the final
definition for each level is as follows:
Maturity Level: Undefined
This is an enterprise with no process documentation or standardization; there is lack of
knowledge about the enterprise’s processes, activities, and tasks; the enterprise primarily
reacts to the environment instead of planning; the enterprise remains in the market by a
small advantage on sale price, location, or customer relationship in comparison with the
competition; there is no continuous improvement plan defined; all the improvements are
reached by individual and isolated efforts; the productive processes are focused on
completing the customer orders; however, they may experience frequent problems in
meeting customers’ expectations; the enterprise does not have a defined vision or
mission.
Maturity Level: Defined
This is an enterprise which recognizes the value of defining its vision and mission; at
this level the enterprise starts to consider the strategic market elements such as price
fluctuations, new products, tendencies, etc; there is lack of documentation at all the
enterprise levels; the enterprise has not defined a target market to which offer a wide
catalog of products, even though many of the products imply losing money; the first
attempts to develop customer loyalty and suppliers appear; the enterprise has basic and
generic office software without specialized software for the industry or functions; the
enterprise starts to collect data and use them to generate information useful to making
160
decisions; there are no performance measurement systems; and the improvement efforts
are still unorganized.
Maturity Level: Manageable
The enterprise is searching a target market, the first attempt to integrate processes is
made; the enterprise starts to deploy continuous improvement plans with special focus on
process documentation and standardization; the personnel is induced to an organizational
culture oriented to customer satisfaction and personal development; there are closer
negotiations with suppliers regarding policies, times and costs; the improvement process
applied a set of tools or techniques instead of a single one; there are isolated information
systems useful to measure, control, and make decisions oriented to processes
improvement.
Maturity Level: Collaborative
An enterprise at this level has defined collaboration strategies oriented to integrate
customers and suppliers; there is clear orientation to satisfy the customer’s expectations;
there are several improvement processes related to the knowledge of customers’ needs;
there are integrated information systems, which provide a technological platform for data
exchange among suppliers, company, and customers, generating key information about
the market and the competence; there are several measurements and evaluation related to
the supplier’s performance; there is a better selection of suppliers; the enterprise uses
more complex improvement processes due to the holistic project focus; there is in depth
knowledge of all the enterprise’s processes.

161
Maturity Level: Leading
An enterprise in this maturity level will be able to innovate, develop, and transfer the
best practices; this type of enterprises has a strong influence over suppliers and customers
regarding their work culture and methods, information systems, continuous improvement
processes etc; key processes and functions are aligned to the enterprise’s mission and
corporative strategy; the personnel is aware about the value that they add to the product
with their activities, such that they are looking for more efficient and effective ways to do
them. Information systems integrate suppliers, company, and customers’ key information,
which is available to everyone who needs it; there is a strong dependence of
technological solutions.
Considering these definitions provide a set of tools, techniques, work philosophies,
methodologies etc. useful to advance from one maturity level to the next one.
II. Section Two: Tools, techniques, methodologies etc.
Regarding the definition of each maturity level, list the tools, techniques,
methodologies, philosophies etc. useful to pass from one level to the next one.
From level one to level two
________________________________________________________________________
________________________________________________________________________
________________________________________________________________________
________________________________________________________________________

162
From level two to level three
________________________________________________________________________
________________________________________________________________________
________________________________________________________________________
________________________________________________________________________
From level three to level four
________________________________________________________________________
________________________________________________________________________
________________________________________________________________________
________________________________________________________________________
From level four to level five
________________________________________________________________________
________________________________________________________________________
________________________________________________________________________
________________________________________________________________________
To keep level five
________________________________________________________________________
________________________________________________________________________
________________________________________________________________________
________________________________________________________________________

163
APPENDIX 5: THE FIVE LEVELS OF THE S(CM)2
Maturity Level: Undefined
Ope
ratio
nal
Tac
tical
Supp
liers
Iden
tifyi
ng p
robl
ems r
elat
ed to
raw
mat
eria
ls
proc
urem
ent
Iden
tifyi
ng k
ey e
lem
ents
to d
efin
e th
e po
licie
s to
sele
ct su
pplie
rs
Iden
tifyi
ng th
e he
art o
f the
mat
ter a
bout
the
high
le
vels
of d
efec
ts, s
crap
, and
rew
ork
in th
e pr
oduc
ts
Iden
tifyi
ng d
ownt
ime
prob
lem
s, m
aint
enan
ce
requ
irem
ents
, and
tool
s req
uire
d
Star
ting
the
proc
ess a
nd p
rodu
ct d
ocum
enta
tion
thro
ugh
diag
ram
s and
met
hods
U
nify
ing
the
defin
ition
of p
roce
sses
co
mpa
nyw
ide
Iden
tifyi
ng k
ey fa
ctor
s to
defin
e th
e w
ork
assi
gnm
ent r
ules
inst
ead
of d
oing
it b
y fe
elin
g or
ex
perti
se
Setti
ng u
p th
e m
etho
ds to
def
ine
the
prod
uctio
n ra
te in
stea
d of
doi
ng it
by
the
num
ber o
f ord
ers
plac
ed
Impl
emen
ting
proj
ects
to g
et c
erta
inty
rega
rdin
g w
hen,
how
, whe
re a
nd h
ow m
any
raw
mat
eria
ls
are
requ
ired
to sa
tisfy
pro
duct
ion
need
s
Def
inin
g lo
gist
ics p
roce
sses
such
as r
eord
er
poin
ts, m
ater
ials
loca
tion,
raw
mat
eria
ls
proc
edur
es to
rece
ive
and
deliv
er, e
tc.
Iden
tifyi
ng k
ey fa
ctor
s to
fore
cast
the
dem
and
of
raw
mat
eria
ls, b
ased
on
futu
re re
quire
men
ts
inst
ead
of th
e cu
rren
t one
s.
Doc
umen
ting
and
defin
ing
the
bill
of m
ater
ials
fo
r the
pro
duct
cat
alog
Iden
tifyi
ng th
e cu
stom
er's
need
s and
mee
ting
them
with
out c
once
rn o
f cos
tId
entif
ying
key
ele
men
ts to
pro
vide
cus
tom
er
serv
ice
afte
r the
ord
er is
pla
ced
Impl
emen
ting
met
hods
to sa
tisfy
cus
tom
er's
need
s thr
ough
tem
pora
l and
mar
gina
l ben
efits
su
ch a
s loc
atio
n, p
rice,
or r
elat
ions
hip
Iden
tifyi
ng th
e m
ost c
omm
on p
robl
ems r
egar
ding
du
e da
te a
nd p
rodu
ct d
eliv
ery
Hum
an R
esou
rces
Def
inin
g ac
tions
to re
duce
the
empl
oyee
tu
rnov
er, s
uch
as im
prov
ing
the
wor
k co
nditi
ons
and
hum
an re
sour
ce m
anag
emen
t
Impr
ovem
ent r
esul
ts a
re re
ache
d by
indi
vidu
al
effo
rts
Iden
tifyi
ng p
robl
ems r
elat
ed to
info
rmat
ion
syst
ems w
hich
are
not
use
d, n
ot a
vaila
ble
or
inco
mpa
tible
Def
inin
g da
ta re
quire
men
ts a
t all
ente
rpris
e le
vels
to
gen
erat
e in
form
atio
n us
eful
for m
akin
g de
cisi
ons
Eval
uatin
g th
e ut
iliza
tion
of te
chno
logi
cal
reso
urce
s and
iden
tifyi
ng im
prov
emen
t are
as
conc
erni
ng u
nder
utili
zatio
n or
inco
rrec
t use
.
Iden
tifyi
ng te
chno
logi
cal i
mpr
ovem
ents
in th
e en
terp
rise
proc
esse
s, an
alyz
ing
the
feas
ibili
ty o
f th
ese
impr
ovem
ents
.
Def
inin
g th
e pr
oced
ure
to e
nsur
e a
cons
iste
nt d
ata
colle
ctio
n to
obt
ain
perf
orm
ance
indi
cato
rs
Def
inin
g lo
cal a
nd g
loba
l per
form
ance
indi
cato
rs
Col
lect
ing
data
in b
asic
syst
ems s
uch
as
wor
kshe
ets,
but t
he d
ata
are
not p
roce
ssed
or
anal
yzed
Def
inin
g pr
oces
ses t
o an
alyz
e da
ta a
nd g
ener
ate
info
rmat
ion
usef
ul to
iden
tify
impr
ovem
ent
oppo
rtuni
ties
5. R
educ
e de
fect
s /
rew
orks
/ sc
rap
Info
rmat
ion
Syst
ems /
T
echn
olog
y
Perf
orm
ance
M
easu
rem
ent
Syst
em
2. R
evie
w th
e C
atal
og o
f Pro
duct
s
3. F
ocus
on
Cus
tom
er
requ
irem
ents
Inve
ntor
y
4. F
ocus
on
cost
re
duct
ion
Cus
tom
ers
Mat
urity
Lev
elK
ey
Impr
ovem
ent
Fact
orV
iew
Abs
trac
tion
Lev
el
U n d e f i n e d
This
is a
n en
terp
rise
with
no
proc
ess d
ocum
enta
tion
or
stan
dard
izat
ion;
ther
e is
a la
ck o
f kn
owle
dge
abou
t the
ent
erpr
ise
proc
esse
s, ac
tiviti
es, a
nd ta
sks;
the
ente
rpris
e pr
imar
ily re
acts
to th
e en
viro
nmen
t ins
tead
of p
lann
ing;
th
e en
terp
rise
rem
ains
in th
e m
arke
t by
a sm
all a
dvan
tage
on
sale
pric
e, lo
catio
n, o
r cus
tom
er
rela
tions
hip
in c
ompa
rison
with
th
e co
mpe
titio
n; th
ere
is n
o co
ntin
uous
impr
ovem
ent p
lan
defin
ed; a
ll th
e im
prov
emen
ts a
re
reac
hed
by in
divi
dual
and
isol
ated
ef
forts
; the
pro
duct
ive
proc
esse
s ar
e fo
cuse
d on
com
plet
ing
the
cust
omer
ord
ers;
how
ever
, the
y m
ay e
xper
ienc
e fr
eque
nt p
robl
ems
in m
eetin
g cu
stom
er's
expe
ctat
ions
; the
ent
erpr
ise
does
no
t hav
e a
defin
ed v
isio
n or
m
issi
on.
1. D
ocum
ent
Prod
uctio
n
Proc
esse
s
Prod
uctio
n

164
Maturity Level: Undefined (continuation)
Abs
trac
tion
Lev
el
Stra
tegi
c
Supp
liers
Iden
tifyi
ng a
nd a
naly
zing
the
impa
ct o
f sup
plie
r se
lect
ion
base
d on
ly o
n pr
ice
or p
roxi
mity
Bas
ic o
ffic
e to
ols t
o ge
nera
te re
ports
, sto
re d
ata
etc.
; Stra
tegi
es to
def
ine
KPI
's; F
ishb
one
diag
ram
, Ben
chm
ark
supp
liers
pol
icie
s
Iden
tifyi
ng k
ey fa
ctor
s for
cos
t red
uctio
n
Esta
blis
hing
com
mun
icat
ion
met
hods
bet
wee
n de
partm
ents
and
pro
cess
es
Iden
tifyi
ng k
ey o
bsta
cles
to g
ener
ate
a m
aste
r pr
oduc
tion
plan
Iden
tifyi
ng k
ey o
bsta
cles
to g
ener
ate
a m
aste
r sc
hedu
ling
plan
Def
inin
g pr
ojec
ts to
intro
duce
con
cept
s of
inve
ntor
y m
anag
emen
t
Def
inin
g th
e ca
talo
g of
pro
duct
s, th
us p
rovi
ding
w
ide
flexi
bilit
y to
cus
tom
er's
requ
irem
ents
Impl
emen
ting
stra
tegi
es to
incr
ease
the
data
base
of
cus
tom
ers w
ithou
t con
cern
s abo
ut lo
yalty
Hum
an R
esou
rces
Def
inin
g th
e tra
inin
g re
quire
men
ts fo
r em
ploy
ees
rega
rdin
g th
eir p
ositi
ons a
nd fu
nctio
ns in
the
ente
rpris
e
Stra
tegi
c Pl
anni
ng (m
issi
on, v
isio
n, c
ompa
ny
valu
es),
stra
tegi
es to
def
ine
KPI
's; d
efin
e an
d do
cum
ent e
nter
pris
e po
sitio
ns
Def
inin
g ke
y el
emen
ts to
mak
e hi
stor
ical
in
form
atio
n a
sign
ifica
nt fa
ctor
in th
e de
cisi
on-
mak
ing
proc
esse
sC
hang
ing
the
visi
on th
at te
chno
logy
is n
ot a
w
aste
of m
oney
but
an
avai
labl
e im
prov
emen
t to
ol.
Def
inin
g th
e fr
eque
ncy
for r
evie
win
g th
e pe
rfor
man
ce in
dica
tor
Def
inin
g K
PI's,
avo
idin
g th
e us
e of
sing
le
indi
cato
rs to
mak
e de
cisi
ons e
.g. p
rofit
indi
cato
rs
only
5. R
educ
e de
fect
s /
rew
orks
/ sc
rap
Info
rmat
ion
Syst
ems /
T
echn
olog
y
Bas
ic o
ffic
e to
ols;
def
initi
on o
f inf
orm
atio
n re
quire
men
ts; d
ocum
enta
tion
and
stan
dard
izat
ion
of in
form
atio
n; d
efin
ition
of t
he d
ata
colle
ctio
n
and
man
agem
ent p
roce
sses
.
Perf
orm
ance
M
easu
rem
ent
Syst
em
Bas
ic o
ffic
e to
ols t
o ge
nera
te re
ports
, sto
re d
ata
etc.
; stra
tegi
es to
def
ine
KPI
's; i
nter
nal
cust
omer
s int
ervi
ews
2. R
evie
w th
e C
atal
og o
f Pro
duct
s
3. F
ocus
on
Cus
tom
er
requ
irem
ents
Inve
ntor
y
Inve
ntor
y sy
stem
s stra
tegi
es su
ch a
s lay
out b
y de
man
d, b
y pr
oduc
t typ
e an
d so
on;
Bas
ic o
ffic
e to
ols t
o an
alyz
e da
ta re
late
d to
dem
and,
del
iver
y of
supp
lies e
tc; 5
S c
once
pts;
doc
umen
tatio
n an
d st
anda
rdiz
atio
n of
inve
ntor
y pr
oces
ses;
Inte
rnal
Lo
gist
ics C
once
pts.
4. F
ocus
on
cost
re
duct
ion
Cus
tom
ers
Cus
tom
er in
terv
iew
s; fo
cus g
roup
s; S
WO
T an
alys
is; s
torin
g cu
stom
er p
refe
renc
es in
a d
ata
base
; mar
ketin
g an
alys
is
Mat
urity
Lev
elK
ey
Impr
ovem
ent
Fact
orV
iew
Use
ful T
ools
U n d e f i n e d
This
is a
n en
terp
rise
with
no
proc
ess d
ocum
enta
tion
or
stan
dard
izat
ion;
ther
e is
a la
ck o
f kn
owle
dge
abou
t the
ent
erpr
ise
proc
esse
s, ac
tiviti
es, a
nd ta
sks;
the
ente
rpris
e pr
imar
ily re
acts
to th
e en
viro
nmen
t ins
tead
of p
lann
ing;
th
e en
terp
rise
rem
ains
in th
e m
arke
t by
a sm
all a
dvan
tage
on
sale
pric
e, lo
catio
n, o
r cus
tom
er
rela
tions
hip
in c
ompa
rison
with
th
e co
mpe
titio
n; th
ere
is n
o co
ntin
uous
impr
ovem
ent p
lan
defin
ed; a
ll th
e im
prov
emen
ts a
re
reac
hed
by in
divi
dual
and
isol
ated
ef
forts
; the
pro
duct
ive
proc
esse
s ar
e fo
cuse
d on
com
plet
ing
the
cust
omer
ord
ers;
how
ever
, the
y m
ay e
xper
ienc
e fr
eque
nt p
robl
ems
in m
eetin
g cu
stom
er's
expe
ctat
ions
; the
ent
erpr
ise
does
no
t hav
e a
defin
ed v
isio
n or
m
issi
on.
1. D
ocum
ent
Prod
uctio
n
Proc
esse
s
Prod
uctio
n
Proc
essi
ng d
ocum
enta
tion
and
stan
dard
izat
ion;
Fi
shbo
ne d
iagr
am; F
low
, pro
cess
and
ope
ratio
n di
agra
ms;
Bas
ic o
ffic
e to
ols (
wor
kshe
ets,
text
fil
es e
tc…
) use
ful t
o ge
nera
te re
ports
, sto
re d
ata,
ge
t inf
orm
atio
n et
c; 5
S c
once
pts.
Inte
rnal
Lo
gist
ics T
ools

165
Maturity Level: Defined
Ope
ratio
nal
Tac
tical
Esta
blis
hing
qua
lity
assu
ranc
e pr
ogra
ms o
n ra
w
mat
eria
lsD
evel
opm
ent o
f pol
icie
s to
sele
ct su
pplie
rs
Con
tinuo
us v
erifi
catio
n of
ord
er fu
lfillm
ent
(ser
vice
leve
l) D
eter
min
ing
best
inco
term
s acc
ordi
ng to
en
terp
rise´
s req
uire
men
tsIm
plem
entin
g ac
tions
to re
duce
def
ects
, rew
ork,
an
d sc
rap
Dep
loyi
ng im
prov
emen
ts o
n pr
oduc
t qua
lity
and
mai
nten
ance
Im
plem
entin
g pr
oced
ures
orie
nted
to a
ssig
n w
ork
effic
ient
ly
Eval
uatin
g w
ork
assi
gnm
ent p
roce
dure
s
Firs
t atte
mpt
s to
coor
dina
te in
terd
epar
tmen
tal
effo
rtsSt
arts
the
docu
men
tatio
n of
crit
ical
pro
cess
es
usin
g di
agra
ms
Taki
ng in
to a
ccou
nt le
ad ti
me
as a
crit
ical
va
riabl
e Id
entif
ying
all
the
activ
ities
whi
ch d
o no
t add
va
lue
(was
te)
Impl
emen
ting
inve
ntor
y m
anag
emen
t rul
es a
nd
polic
ies
Dep
loyi
ng a
ctio
ns o
n in
vent
ory
cont
rol,
defin
ing
whe
re p
rodu
cts a
nd ra
w m
ater
ials
will
be
phys
ical
ly st
ored
Impl
emen
ting
proc
urem
ent m
etho
ds b
ased
on
basi
c fo
reca
st m
etho
ds, t
rial a
nd e
rror
, or
expe
rtise
Upd
atin
g an
d re
view
ing
the
bill
of m
ater
ials
, fu
ture
dem
ands
, and
due
dat
es
Star
ting
unor
gani
zed
effo
rts to
pro
vide
cus
tom
er
serv
ice
Star
ting
prod
uct t
rack
ing
proc
edur
es a
nd
gene
ratio
n of
feed
back
for s
take
hold
ers
Col
labo
ratin
g in
the
impl
emen
tatio
n of
pro
duct
di
strib
utio
n m
etho
ds b
ased
on
spec
ific
stra
tegi
es
(due
dat
e, c
ost,
prio
rity
etc.
)
Res
earc
hing
how
to m
eet c
usto
mer
´s n
eeds
and
ad
ding
val
ue to
pro
duct
s; c
usto
mer
s' lo
yalty
is a
m
ain
conc
ern
Def
inin
g cu
stom
er se
rvic
e po
licie
s reg
ardi
ng
prod
uct r
etur
n, re
plac
emen
t, up
date
, and
m
aint
enan
ce
Eval
uatin
g so
lutio
ns to
impl
emen
t the
cus
tom
er
serv
ice
polic
ies r
egar
ding
pro
duct
retu
rn,
repl
acem
ent,
upda
te, a
nd m
aint
enan
ce
Impl
emen
ting
proj
ects
to im
prov
e w
ork
cond
ition
s and
to d
efin
e a
corp
orat
e id
entit
y
Def
inin
g th
e co
mm
unic
atio
n m
echa
nism
s to
rece
ive
empl
oyee
s' fe
edba
ck a
nd
reco
mm
enda
tions
Iden
tifyi
ng th
e re
quire
men
ts to
pro
vide
de
velo
pmen
t pro
gram
s to
empl
oyee
s
Def
inin
g st
rate
gies
to c
reat
e se
vera
l em
ploy
ee
deve
lopm
ent p
rogr
ams s
uch
as p
erso
nal
deve
lopm
ent,
tech
nica
l upd
ates
, ent
erpr
ise
rela
tions
hips
, et
cIm
plem
entin
g ba
sic
info
rmat
ion
syst
ems a
nd
basi
c of
fice
softw
are,
but
with
littl
e or
no
inte
ract
ion
betw
een
them
Dev
elop
ing
met
hods
to im
prov
e te
chno
logi
cal
com
patib
ility
and
softw
are
inte
grat
ion
Des
igni
ng a
nd im
plem
entin
g m
etho
ds to
col
lect
da
ta fr
om c
usto
mer
s, su
pplie
rs, p
rodu
cts,
and
proc
esse
s
Def
inin
g m
etho
ds to
iden
tify
and
gene
rate
re
leva
nt in
form
atio
n ab
out c
usto
mer
s, su
pplie
rs,
prod
ucts
, and
pro
cess
esD
ocum
entin
g an
d ev
alua
ting
the
curr
ent
tech
nolo
gica
l sol
utio
ns im
plem
ente
d in
the
ente
rpris
e´s p
roce
sses
Gen
erat
ing
proj
ects
to g
et th
e be
st p
ossi
ble
perf
orm
ance
of t
he c
urre
nt te
chno
logi
cal
solu
tions
and
info
rmat
ion
syst
ems.
Def
inin
g m
etho
ds to
col
lect
and
val
idat
e da
ta
requ
ired
to g
ener
ate
rele
vant
info
rmat
ion.
D
evel
opm
ent o
f dec
isio
n m
akin
g re
port
form
ats,
KPI
s rec
ords
, fol
low
up
repo
rts, g
raph
s etc
.
Com
putin
g, st
orin
g, a
nd re
porti
ng p
roce
ss
indi
cato
rs a
t def
ined
per
iods
of t
ime
Eval
uatin
g av
aila
ble
perf
orm
ance
met
rics u
sefu
l to
dep
loy
impr
ovem
ent p
roje
cts
Perf
orm
ance
M
easu
rem
ent
Syst
em
5. D
evel
op a
nd
Cer
tify
Supp
liers
Cus
tom
ers
6. F
ocus
on
Cus
tom
ers'
requ
irem
ents
Hum
an R
esou
rces
7. Im
prov
e pr
oces
s ca
pabi
lity
Info
rmat
ion
Syst
ems /
T
echn
olog
y
2. R
educ
e de
fect
s /
rew
orks
/ sc
rap
Prod
uctio
n
3. F
ocus
on
Qua
lity
Impr
ovem
ents
4. D
efin
e En
terp
rise's
KPI
s In
vent
ory
Mat
urity
Lev
elK
ey
Impr
ovem
ent
Fact
orV
iew
Abs
trac
tion
leve
l
D e f i n e d
This
is a
n en
terp
rise
that
re
cogn
izes
the
valu
e of
def
inin
g its
vis
ion
and
mis
sion
. At t
his
leve
l, th
e en
terp
rise
star
ts to
co
nsid
er th
e st
rate
gic
mar
ket
elem
ents
such
as p
rice
fluct
uatio
ns, n
ew p
rodu
cts,
trend
s, et
c; th
ere
is a
lack
of
docu
men
tatio
n at
all
the
ente
rpris
e le
vels
; the
ent
erpr
ise
has n
ot
defin
ed a
targ
et m
arke
t; th
us, i
t of
fers
a w
ide
cata
log
of p
rodu
cts,
even
if m
any
of th
em im
ply
losi
ng
mon
ey; t
he fi
rst a
ttem
pts t
o de
velo
p cu
stom
er a
nd su
pplie
rs'
loya
lty a
ppea
r; th
e en
terp
rise
has
basi
c an
d ge
neric
off
ice
softw
are
but n
o sp
ecia
lized
softw
are
for i
ts
indu
stry
or f
unct
ions
; the
en
terp
rise
star
ts to
col
lect
dat
a an
d us
e th
em to
gen
erat
e in
form
atio
n to
mak
e de
cisi
ons;
ther
e ar
e no
pe
rfor
man
ce m
easu
rem
ent
syst
ems;
impr
ovem
ent e
ffor
ts a
re
still
dis
orga
nize
d.
1. D
efin
e In
vent
ory
Man
agem
ent r
ules
Supp
liers

166
Maturity Level: Defined (continuation)
Str
ateg
ic
Est
abli
shin
g co
mm
unic
atio
n an
d fe
edba
ck
proc
esse
s w
ith
supp
lier
sD
eter
min
ing
the
best
con
trac
t con
diti
ons
and
prac
tice
s. D
efin
ing
the
role
of
the
proc
urem
ent
depa
rtm
ent
Sta
rtin
g to
dep
loy
impr
ovem
ents
on
prod
uct
deve
lopm
ent
Def
inin
g ru
les
to g
ener
ate
a m
aste
r pr
oduc
tion
pl
an, r
evie
w o
f th
e pr
oduc
t ca
talo
g
Sta
rtin
g de
fini
tion
of
poli
cies
and
ope
rati
onal
pr
oced
ures
Def
inin
g pl
ans,
act
ivit
ies
and
task
s to
red
uce
lead
ti
me
Eva
luat
ing
the
impl
emen
ted
inve
ntor
y m
anag
emen
t rul
es a
nd s
earc
hing
tech
nolo
gica
l so
luti
ons
Def
inin
g ru
les
to g
ener
ate
a m
aste
r sc
hedu
ling
pl
an a
nd e
valu
atin
g sp
ecia
lize
d sy
stem
s ab
le to
m
eet t
hese
rul
es
Ana
lyzi
ng t
he c
usto
mer
s' f
eedb
ack
and
eval
uati
ng p
ossi
ble
solu
tion
sId
enti
fyin
g po
tent
ial t
arge
t m
arke
t for
pro
duct
s an
d se
rvic
es o
ffer
ed
Impl
emen
ting
sol
utio
ns to
obs
erve
cus
tom
er
serv
ice
poli
cies
reg
ardi
ng p
rodu
ct r
etur
n,
repl
acem
ent,
upd
ate,
and
mai
nten
ance
Def
inin
g th
e de
scri
ptio
n, r
espo
nsib
ilit
ies,
and
du
ties
for
eve
ry w
ork
posi
tion
Def
inin
g m
etho
ds to
kee
p va
luab
le e
mpl
oyee
s,
defi
ning
the
ent
erpr
ise'
s m
issi
on, v
isio
n an
d va
lues
to
be in
duce
d in
the
em
ploy
ees.
Eva
luat
ing
poss
ible
inte
gral
sol
utio
ns to
man
age
info
rmat
ion
syst
ems
and
tech
nolo
gy s
uch
as
tech
nolo
gy m
anag
emen
t co
ncep
ts a
nd E
RP
sy
stem
s.
Ana
lyzi
ng a
nd d
efin
ing
the
best
way
to s
tore
, co
ntro
l and
man
age
rele
vant
inf
orm
atio
n ab
out
cust
omer
s, s
uppl
iers
, pro
duct
s, a
nd p
roce
sses
.
Ana
lyzi
ng s
trat
egie
s to
iden
tify
key
tech
nolo
gica
l re
sour
ces
and
thei
r re
new
al, m
aint
enan
ce,
repl
acem
ent,
and
inte
grat
ion
requ
irem
ents
.
Eva
luat
ing
how
to m
anag
e, c
ontr
ol, a
nd in
tegr
ate
info
rmat
ion
requ
ired
to m
akin
g de
cisi
ons
Eva
luat
ing
the
impa
ct o
f th
e de
cisi
ons
wit
h an
d w
itho
ut t
he n
ew p
erfo
rman
ce m
easu
rem
ent
syst
em
Per
form
ance
M
easu
rem
ent
Sys
tem
Doc
umen
tati
on o
f K
PIs
; def
init
ion
of h
ow t
o sh
ow th
em t
o st
akeh
olde
rs; w
orki
ng to
geth
er
wit
h ot
her
ente
rpri
se's
fun
ctio
ns to
sys
tem
atiz
e th
e pe
rfor
man
ce m
easu
rem
ent
repo
rts
such
as
perf
orm
ance
eva
luat
ions
, ope
rati
onal
pe
rfor
man
ce a
nd s
o on
. dep
loym
ent
of a
udit
pr
oces
ses
5. D
evel
op a
nd
Cer
tify
Sup
plie
rs
Cu
stom
ers
Def
init
ion
of t
arge
t mar
ket;
res
earc
h of
cu
stom
ers'
req
uire
men
ts; d
efin
itio
n of
cus
tom
er
serv
ice
mis
sion
and
vis
ion;
foc
us g
roup
s;
asse
ssm
ent o
f c
usto
mer
rel
atio
nshi
p m
anag
emen
t sol
utio
ns;
defi
niti
on o
f cu
stom
er
serv
ice
poli
cies
; de
fini
tion
of
cust
omer
ser
vice
sa
tisf
acti
on le
vel;
doc
umen
tati
on o
f cu
stom
er
serv
ice
proc
esse
s.6.
Foc
us o
n C
usto
mer
s'
requ
irem
ents
Hu
man
Res
ourc
es
Def
init
ion
of tr
aini
ng r
equi
rem
ents
; de
ploy
men
t of
str
ateg
ies
to c
reat
e an
ent
erpr
ise
wor
k cu
ltur
e;
defi
niti
on o
f re
war
d po
lici
es a
nd c
omm
unic
atio
n of
rew
ard
prog
ram
; de
fini
tion
of
care
er p
lans
for
em
ploy
ees
and
ente
rpri
se's
pos
itio
n.7.
Im
prov
e pr
oces
s ca
pabi
lity
Info
rmat
ion
S
yste
ms
/ T
ech
nol
ogy
Mee
ting
info
rmat
ion
requ
irem
ents
thr
ough
bas
ic
info
rmat
ion
syst
ems;
eva
luat
ion
of s
ever
al
solu
tion
s to
im
plem
ent t
echn
olog
y in
the
ente
rpri
se's
sys
tem
s su
ch a
s M
RP
, bar
cod
e,
RIF
D a
nd s
o on
; def
init
ion
of te
chno
logy
re
quir
emen
ts to
ens
ure
the
prod
uct f
low
and
the
av
aila
bili
ty o
f in
form
atio
n; d
evel
opm
ent
of
poli
cies
to
just
ify
tech
nolo
gy a
cqui
siti
ons;
de
fini
tion
of
trai
ning
req
uire
men
ts t
o ke
ep
info
rmat
ion
syst
ems
and
tech
nolo
gy t
uned
on.
2. R
educ
e de
fect
s /
rew
orks
/ sc
rap
Pro
du
ctio
n
Cos
t Ana
lysi
s; 5
's t
ools
; fl
ow a
nd o
pera
tion
di
agra
ms;
sev
en a
dmin
istr
ativ
e to
ols;
Sta
tist
ical
P
roce
ss C
ontr
ol; v
alue
str
eam
map
ping
; de
fini
tion
of
pro
duct
ion
diag
ram
(m
ake
to o
rder
, m
ake
to s
tock
…):
pro
cess
ide
ntif
icat
ion
(lab
els,
ar
eas,
mac
hine
s et
c.);
qua
lity
cir
cles
; K
aize
n; b
ill
of m
ater
ials
doc
umen
tati
on3.
Foc
us o
n Q
uali
ty
Impr
ovem
ents
4. D
efin
e E
nter
pris
e's
KP
Is
Inve
nto
ry
Inte
grat
ion
of in
tern
al i
nven
tory
pro
cess
es;
empl
oyee
trai
ning
; def
init
ion
of r
equi
rem
ents
to
sele
ct a
n M
RP
sys
tem
; an
alys
is o
f ho
w t
o im
plem
ent s
ynch
roni
zati
on s
trat
egie
s su
ch a
s K
anba
n; b
asic
tech
nolo
gy im
prov
emen
ts s
uch
as
bar
code
. exp
lora
tion
of
war
ehou
se m
anag
emen
t sy
stem
s (W
MS
).
Mat
uri
ty L
evel
Key
Im
pro
vem
ent
Fac
tor
Vie
w U
sefu
l Too
ls
D e f i n e d
Thi
s is
an
ente
rpri
se t
hat
reco
gniz
es th
e va
lue
of d
efin
ing
its
visi
on a
nd m
issi
on. A
t th
is
leve
l, th
e en
terp
rise
sta
rts
to
cons
ider
the
str
ateg
ic m
arke
t el
emen
ts s
uch
as p
rice
fl
uctu
atio
ns, n
ew p
rodu
cts,
tre
nds,
et
c; t
here
is a
lack
of
docu
men
tati
on a
t all
the
ent
erpr
ise
leve
ls; t
he e
nter
pris
e ha
s no
t de
fine
d a
targ
et m
arke
t; t
hus,
it
offe
rs a
wid
e ca
talo
g of
pro
duct
s,
even
if m
any
of th
em im
ply
losi
ng
mon
ey;
the
firs
t att
empt
s to
de
velo
p cu
stom
er a
nd s
uppl
iers
' lo
yalt
y ap
pear
; th
e en
terp
rise
has
ba
sic
and
gene
ric
offi
ce s
oftw
are
but n
o sp
ecia
lize
d so
ftw
are
for
its
indu
stry
or
func
tion
s; th
e en
terp
rise
sta
rts
to c
olle
ct d
ata
and
use
them
to g
ener
ate
info
rmat
ion
to m
ake
deci
sion
s; t
here
are
no
perf
orm
ance
mea
sure
men
t sy
stem
s; i
mpr
ovem
ent
effo
rts
are
stil
l di
sorg
aniz
ed.
1. D
efin
e In
vent
ory
Man
agem
ent r
ules
Su
pp
lier
s
Sam
plin
g to
ols;
ord
er v
erif
icat
ion;
inc
oter
m
defi
niti
ons;
doc
umen
tati
on a
nd s
tand
ardi
zati
on o
f su
ppli
ers
poli
cies
; de
fini
ng a
cer
tifi
cati
on p
roce
ss
for
supp
lier
s, b
ill o
f m
ater
ials
dat
abas
e
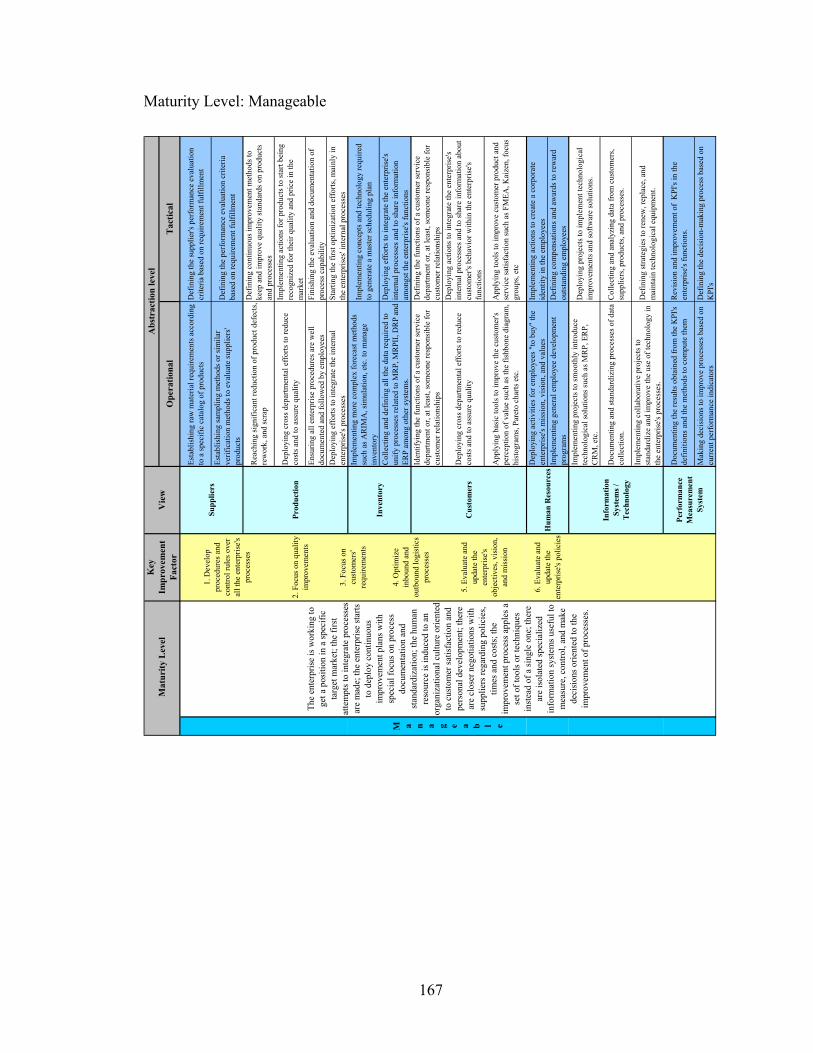
167
Maturity Level: Manageable
Ope
ratio
nal
Tac
tical
Esta
blis
hing
raw
mat
eria
l req
uire
men
ts a
ccor
ding
to
a sp
ecifi
c ca
talo
g of
pro
duct
s D
efin
ing
the
supp
lier's
per
form
ance
eva
luat
ion
crite
ria b
ased
on
requ
irem
ent f
ulfil
lmen
t
Esta
blis
hing
sam
plin
g m
etho
ds o
r sim
ilar
verif
icat
ion
met
hods
to e
valu
ate
supp
liers
' pr
oduc
ts
Def
inin
g th
e pe
rfor
man
ce e
valu
atio
n cr
iteria
ba
sed
on re
quire
men
t ful
fillm
ent
Rea
chin
g si
gnifi
cant
redu
ctio
n of
pro
duct
def
ects
, re
wor
k, a
nd sc
rap
Def
inin
g co
ntin
uous
impr
ovem
ent m
etho
ds to
ke
ep a
nd im
prov
e qu
ality
stan
dard
s on
prod
ucts
an
d pr
oces
ses
Dep
loyi
ng c
ross
dep
artm
enta
l eff
orts
to re
duce
co
sts a
nd to
ass
ure
qual
ity
Impl
emen
ting
actio
ns fo
r pro
duct
s to
star
t bei
ng
reco
gniz
ed fo
r the
ir qu
ality
and
pric
e in
the
mar
ket
Ensu
ring
all e
nter
pris
e pr
oced
ures
are
wel
l do
cum
ente
d an
d fo
llow
ed b
y em
ploy
ees
Fini
shin
g th
e ev
alua
tion
and
docu
men
tatio
n of
pr
oces
s cap
abili
tyD
eplo
ying
eff
orts
to in
tegr
ate
the
inte
rnal
en
terp
rise's
pro
cess
esSt
artin
g th
e fir
st o
ptim
izat
ion
effo
rts, m
ainl
y in
th
e en
terp
rises
' int
erna
l pro
cess
es
Impl
emen
ting
mor
e co
mpl
ex fo
reca
st m
etho
ds
such
as A
RIM
A, s
imul
atio
n, e
tc. t
o m
anag
e in
vent
ory
Impl
emen
ting
conc
epts
and
tech
nolo
gy re
quire
d to
gen
erat
e a
mas
ter s
ched
ulin
g pl
an
Col
lect
ing
and
defin
ing
all t
he d
ata
requ
ired
to
unify
pro
cess
es re
late
d to
MR
P, M
RPI
I, D
RP
and
ERP
amon
g ot
her s
yste
ms.
Dep
loyi
ng e
ffor
ts to
inte
grat
e th
e en
terp
rise's
in
tern
al p
roce
sses
and
to sh
are
info
rmat
ion
amon
gst t
he e
nter
pris
e's fu
nctio
nsId
entif
ying
the
func
tions
of a
cus
tom
er se
rvic
e de
partm
ent o
r, at
leas
t, so
meo
ne re
spon
sibl
e fo
r cu
stom
er re
latio
nshi
ps
Def
inin
g th
e fu
nctio
ns o
f a c
usto
mer
serv
ice
depa
rtmen
t or,
at le
ast,
som
eone
resp
onsi
ble
for
cust
omer
rela
tions
hips
Dep
loyi
ng c
ross
dep
artm
enta
l eff
orts
to re
duce
co
sts a
nd to
ass
ure
qual
ity
Dep
loyi
ng a
ctio
ns to
inte
grat
e th
e en
terp
rise's
in
tern
al p
roce
sses
and
to sh
are
info
rmat
ion
abou
t cu
stom
er's
beha
vior
with
in th
e en
terp
rise's
fu
nctio
ns
App
lyin
g ba
sic
tool
s to
impr
ove
the
cust
omer
's pe
rcep
tion
of v
alue
such
as t
he fi
shbo
ne d
iagr
am,
hist
ogra
ms,
Pare
to c
harts
etc
.
App
lyin
g to
ols t
o im
prov
e cu
stom
er p
rodu
ct a
nd
serv
ice
satis
fact
ion
such
as F
MEA
, Kai
zen,
focu
s gr
oups
, etc
Dep
loyi
ng a
ctiv
ities
for e
mpl
oyee
s "to
buy
" th
e en
terp
rise's
mis
sion
, vis
ion,
and
val
ues
Impl
emen
ting
actio
ns to
cre
ate
a co
rpor
ate
iden
tity
in th
e em
ploy
ees
Impl
emen
ting
gene
ral e
mpl
oyee
dev
elop
men
t pr
ogra
ms
Def
inin
g co
mpe
nsat
ions
and
aw
ards
to re
war
d ou
tsta
ndin
g em
ploy
ees
Impl
emen
ting
proj
ects
to sm
ooth
ly in
trodu
ce
tech
nolo
gica
l sol
utio
ns su
ch a
s MR
P, E
RP,
C
RM
, etc
.
Dep
loyi
ng p
roje
cts t
o im
plem
ent t
echn
olog
ical
im
prov
emen
ts a
nd so
ftwar
e so
lutio
ns.
Doc
umen
ting
and
stan
dard
izin
g pr
oces
ses o
f dat
a co
llect
ion.
Col
lect
ing
and
anal
yzin
g da
ta fr
om c
usto
mer
s, su
pplie
rs, p
rodu
cts,
and
proc
esse
s.
Impl
emen
ting
colla
bora
tive
proj
ects
to
stan
dard
ize
and
impr
ove
the
use
of te
chno
logy
in
the
ente
rpris
e's p
roce
sses
.
Def
inin
g st
rate
gies
to re
new
, rep
lace
, and
m
aint
ain
tech
nolo
gica
l equ
ipm
ent.
Doc
umen
ting
the
resu
lts o
btai
ned
from
the
KPI
's de
finiti
ons a
nd th
e m
etho
ds to
com
pute
them
Rev
isio
n an
d im
prov
emen
t of
KPI
's in
the
ente
rpris
e's fu
nctio
ns.
Mak
ing
deci
sion
s to
impr
ove
proc
esse
s bas
ed o
n cu
rren
t per
form
ance
indi
cato
rsD
efin
ing
the
deci
sion
-mak
ing
proc
ess b
ased
on
KPI
's
Info
rmat
ion
Syst
ems /
T
echn
olog
y
Perf
orm
ance
M
easu
rem
ent
Syst
em
4. O
ptim
ize
inbo
und
and
outb
ound
logi
stic
s pr
oces
ses
Cus
tom
ers
5. E
valu
ate
and
upda
te th
e en
terp
rise's
ob
ject
ives
, vis
ion,
an
d m
issi
on
6. E
valu
ate
and
upda
te th
e en
terp
rise's
pol
icie
sH
uman
Res
ourc
es
M a n a g e a b l e
The
ente
rpris
e is
wor
king
to
get a
pos
ition
in a
spec
ific
targ
et m
arke
t; th
e fir
st
atte
mpt
s to
inte
grat
e pr
oces
ses
are
mad
e; th
e en
terp
rise
star
ts
to d
eplo
y co
ntin
uous
im
prov
emen
t pla
ns w
ith
spec
ial f
ocus
on
proc
ess
docu
men
tatio
n an
d st
anda
rdiz
atio
n; th
e hu
man
re
sour
ce is
indu
ced
to a
n or
gani
zatio
nal c
ultu
re o
rient
ed
to c
usto
mer
satis
fact
ion
and
pers
onal
dev
elop
men
t; th
ere
are
clos
er n
egot
iatio
ns w
ith
supp
liers
rega
rdin
g po
licie
s, tim
es a
nd c
osts
; the
im
prov
emen
t pro
cess
app
les a
se
t of t
ools
or t
echn
ique
s in
stea
d of
a si
ngle
one
; the
re
are
isol
ated
spec
ializ
ed
info
rmat
ion
syst
ems u
sefu
l to
mea
sure
, con
trol,
and
mak
e de
cisi
ons o
rient
ed to
the
impr
ovem
ent o
f pro
cess
es.
1. D
evel
op
proc
edur
es a
nd
cont
rol r
ules
ove
r al
l the
ent
erpr
ise's
pr
oces
ses
Supp
liers
Prod
uctio
n2.
Foc
us o
n qu
ality
im
prov
emen
ts
3. F
ocus
on
cust
omer
s' re
quire
men
ts
Inve
ntor
y
Mat
urity
Lev
elK
ey
Impr
ovem
ent
Fact
orV
iew
Abs
trac
tion
leve
l

168
Maturity Level: Manageable (continuation)
Strategic
Identifying key elements to integrate and to develop suppliers
Defining the collaborative procedures among suppliers, 3PL's and the procurement department
Establishing a department to optimize the procurement of raw materials and product distribution
Starting cross-disciplinary improvement efforts such as ISO, Six Sigma, Lean, or Business Process Reengineering
Implementing methods to generate a master production plan, MRP, MRPII, ERP
Logistics issues start to be considered as key success elements
Evaluating results of master scheduling plan and improving the rules used for its generation
Implementing technological solutions to integrate information and generate a master scheduling plan such as ERP, CRM, SRM, etc.
Establishing a customer service department or, at least, making someone responsible for customer relationships
Collaborating in the implementation of technological solutions to integrate information, mainly in CRM solutions.
Defining project to implement holistic methodologies to increase the customers' perception of value such as QFD, TQM, etc.
Defining key elements to provide an outstanding work environment for the employees
Implementing acknowledgement programs to reward outstanding employees
Tuning information systems solutions such as ERP, CRM, etc. Only few legacy systems will remain because of compatibility or migration constraints
Making relevant information accessible to make decisions at all enterprise levels, implementing usability requirements
Implementing programs to renew, replace, and maintain technological equipment.
Implementing KPI's as performance metrics in the enterprise
Inducting the concepts of competitive strategy in top managers
Information Systems /
Technology
Definition of technology management strategies; definition of activities which may be outsourced; periodical meetings with the information systems and technology users to provide solutions to their problems; compatibility assessments before the
acquisition of new technology, hardware or software; definition of requirements and prevention programs for maintenance:
exploration of technological alliances and technology exchange; assessment of ERP
systems to meet the enterprise's requirements
Performance Measurement
System
Definition of requirements for the decision making processes at all management levels;
assessment of KPIs accuracy; benchmarking of the KPIs generation process; information systems
working together to ensure accessibility to performance indicators.
Implementation of a Warehouse Management System; implementation of reordering strategies
such as Kanban; optimization of reordering points; deployment of continuous improvement
projects related to inventory management; optimization of work in process.4. Optimize
inbound and outbound logistics
processes
Customers
Assessment of delivery systems completeness; implementing CRM systems; analysis of
customers' satisfaction through interviews and surveys, FMEA, focus group etc; definition of
product exchange and retrieving policies; training to employees focused on taking care of
customers relationships.
5. Evaluate and update the enterprise's
objectives, vision, and mission
6. Evaluate and update the
enterprise's policiesHuman Resources
Benchmark rewards programs; assessment of employees' career plans; continuous
implementation of training programs related to professional and personal improvement;
enhancement of work culture; deployment of strategies to reward employees' fidelity
Manageable
The enterprise is working to get a position in a specific
target market; the first attempts to integrate processes are made; the enterprise starts
to deploy continuous improvement plans with special focus on process
documentation and standardization; the human resource is induced to an
organizational culture oriented to customer satisfaction and personal development; there are closer negotiations with suppliers regarding policies,
times and costs; the improvement process apples a
set of tools or techniques instead of a single one; there
are isolated specialized information systems useful to measure, control, and make
decisions oriented to the improvement of processes.
1. Develop procedures and
control rules over all the enterprise's
processes
Suppliers
Integration through an MRP system, quality assurance concepts, definition of collaborative
agreements; definition of the expected level service for all suppliers; exploration of strategic
alliances with suppliers and other enterprises
Production
Internal logistics tools such as Kanban, JIT, Lean tools and concepts; SPC; definition of families of products; updating and improvement of process
standardization; assessment of production processes based on quality awards or process
certifications; continuous improvement programs; operation research tools to optimize
product flow, such as simulation, linear programming, heuristics and so on; projects to
include BOM into information systems; benchmark implementation of ISO, Six Sigma,
MRP and others
2. Focus on quality improvements
3. Focus on customers'
requirements
Inventory
Maturity LevelKey
Improvement Factor
View Useful Tools
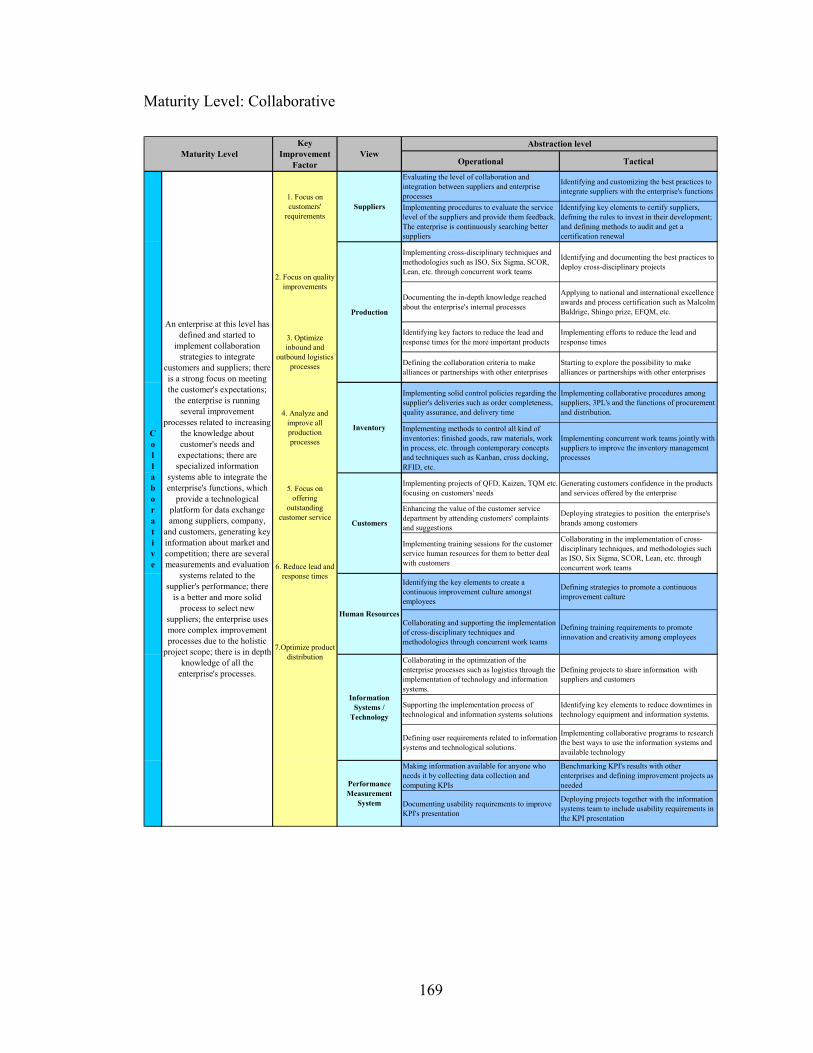
169
Maturity Level: Collaborative
Operational Tactical
Evaluating the level of collaboration and integration between suppliers and enterprise processes
Identifying and customizing the best practices to integrate suppliers with the enterprise's functions
Implementing procedures to evaluate the service level of the suppliers and provide them feedback. The enterprise is continuously searching better suppliers
Identifying key elements to certify suppliers, defining the rules to invest in their development; and defining methods to audit and get a certification renewal
Implementing cross-disciplinary techniques and methodologies such as ISO, Six Sigma, SCOR, Lean, etc. through concurrent work teams
Identifying and documenting the best practices to deploy cross-disciplinary projects
Documenting the in-depth knowledge reached about the enterprise's internal processes
Applying to national and international excellence awards and process certification such as Malcolm Baldrige, Shingo prize, EFQM, etc.
Identifying key factors to reduce the lead and response times for the more important products
Implementing efforts to reduce the lead and response times
Defining the collaboration criteria to make alliances or partnerships with other enterprises
Starting to explore the possibility to make alliances or partnerships with other enterprises
Implementing solid control policies regarding the supplier's deliveries such as order completeness, quality assurance, and delivery time
Implementing collaborative procedures among suppliers, 3PL's and the functions of procurement and distribution.
Implementing methods to control all kind of inventories: finished goods, raw materials, work in process, etc. through contemporary concepts and techniques such as Kanban, cross docking, RFID, etc.
Implementing concurrent work teams jointly with suppliers to improve the inventory management processes
Implementing projects of QFD, Kaizen, TQM etc. focusing on customers' needs
Generating customers confidence in the products and services offered by the enterprise
Enhancing the value of the customer service department by attending customers' complaints and suggestions
Deploying strategies to position the enterprise's brands among customers
Implementing training sessions for the customer service human resources for them to better deal with customers
Collaborating in the implementation of cross-disciplinary techniques, and methodologies such as ISO, Six Sigma, SCOR, Lean, etc. through concurrent work teams
Identifying the key elements to create a continuous improvement culture amongst employees
Defining strategies to promote a continuous improvement culture
Collaborating and supporting the implementation of cross-disciplinary techniques and methodologies through concurrent work teams
Defining training requirements to promote innovation and creativity among employees
Collaborating in the optimization of the enterprise processes such as logistics through the implementation of technology and information systems.
Defining projects to share information with suppliers and customers
Supporting the implementation process of technological and information systems solutions
Identifying key elements to reduce downtimes in technology equipment and information systems.
Defining user requirements related to information systems and technological solutions.
Implementing collaborative programs to research the best ways to use the information systems and available technology
Making information available for anyone who needs it by collecting data collection and computing KPIs
Benchmarking KPI's results with other enterprises and defining improvement projects as needed
Documenting usability requirements to improve KPI's presentation
Deploying projects together with the information systems team to include usability requirements in the KPI presentation
Performance Measurement
System
Inventory
5. Focus on offering
outstanding customer service
Customers
6. Reduce lead and response times
Human Resources
7.Optimize product distribution
Information Systems /
Technology
Collaborative
An enterprise at this level has defined and started to
implement collaboration strategies to integrate
customers and suppliers; there is a strong focus on meeting the customer's expectations;
the enterprise is running several improvement
processes related to increasing the knowledge about customer's needs and
expectations; there are specialized information
systems able to integrate the enterprise's functions, which
provide a technological platform for data exchange among suppliers, company,
and customers, generating key information about market and competition; there are several measurements and evaluation
systems related to the supplier's performance; there
is a better and more solid process to select new
suppliers; the enterprise uses more complex improvement processes due to the holistic
project scope; there is in depth knowledge of all the
enterprise's processes.
1. Focus on customers'
requirementsSuppliers
2. Focus on quality improvements
Production
3. Optimize inbound and
outbound logistics processes
4. Analyze and improve all production processes
Maturity LevelKey
Improvement Factor
ViewAbstraction level

170
Maturity Level: Collaborative (continuation)
Strategic
Implementing methods and procedures to integrate suppliers with the enterprise's functions
Documenting key elements to certify suppliers, implementing the rules to invest in their development; implementing methods to audit and get a certification renewal.
Establishing or enhancing teams of concurrent engineering, and product life cycle management
Defining improvement projects based on the results from process certification and award evaluation
Considering innovation and process flexibility as key elements to be competitive
Selecting possible partners or benchmark enterprises relevant to make alliances
Defining policies to align suppliers' functions and the procedures to develop them
Defining collaborative methods to warn suppliers in advance about changes on raw materials or the introduction of new products.
Identifying the key factors to exert influence in customers' perception of value through QFD results
Defining the target market for each brand or product, implementing strategic product classifications such as ABC or XYZ
Defining collaborative methods to advice customers about product modifications and marketing new products in advance.
Implementing actions to establish a continuous improvement culture at all the hierarchical levels of the enterprise.
Implementing strategies to promote innovation and creativity among employees for the enterprise processes or work environment be improved
Implementing projects to share information with suppliers and customers.
Implementing programs to reduce downtime in the technology equipment and information systems.
Defining evaluation criteria to measure the impact of the implemented information systems and technological solutions
Elaborating executive reports and generating the information required in strategic planning
Defining and implementing performance metrics required from suppliers, 3PL's and outsourcing functions
Definition of a Knowledge Management System; improvement of decision supporting systems;
documentation of technology management policies; helping other functions to automate processes; definition of a program related to
updating and replacement of supporting technology; definition of technology exchange
policies; strengthening of technological alliances; deployment of projects to increase the ERP performance and information accessibility.
Performance Measurement
System
Design together with information systems how to show KPIs, considering usability concepts; Define policies to publish KPIs in databases, reviews, reports etc; Document and communicate the procedures to obtain KPIs to external stakeholders.
Inventory
TQM concepts applied to inventory management such as quality at the source; analysis of
collaborative strategies such as cross docking, enterprise clusters and so on; information
analysis provided by the WMS; implementation of technological solutions such as RFID,
automation; implementation of strategies to eliminate non-value-adding activities in the
entry/leaving inventory processes.
5. Focus on offering
outstanding customer service
Customers
Participation in concurrent engineering efforts; value analysis; deployment of strategies to ensure customers' fidelity; analysis of customers' input
for the development of new products; QFD; ISO; improvement of CRM information to make
decisions about customers' expectations.
6. Reduce lead and response times
Human Resources
Deployment of strategies to group employees in interdepartmental work teams; making available good work conditions to employees; Increase of
training programs oriented to innovation; granting rewards to outstanding employees;
rewards to employees' fidelity; documentation of the function of human resources employees 7.Optimize product
distribution
Information Systems /
Technology
Collaborative
An enterprise at this level has defined and started to
implement collaboration strategies to integrate
customers and suppliers; there is a strong focus on meeting the customer's expectations;
the enterprise is running several improvement
processes related to increasing the knowledge about customer's needs and
expectations; there are specialized information
systems able to integrate the enterprise's functions, which
provide a technological platform for data exchange among suppliers, company,
and customers, generating key information about market and competition; there are several measurements and evaluation
systems related to the supplier's performance; there
is a better and more solid process to select new
suppliers; the enterprise uses more complex improvement processes due to the holistic
project scope; there is in depth knowledge of all the
enterprise's processes.
1. Focus on customers'
requirementsSuppliers
Supplier integration through Supplier Relationship Management solutions;
improvement of policies for collaborative alliances; definition of supplier certification criteria, optimization of suppliers networks;
value added analysis; definition of development of suppliers strategies.
2. Focus on quality improvements
Production
Integration of internal production processes; optimization of production processes using
operation research and technological solutions such as RFID; evidence collection to apply in
award and certification granting processes; management of daily work; Lean Thinking tools
such as value stream mapping; concurrent engineering; Modeling tools such as simulation,
systems dynamics, relationship diagrams; strengthening of value engineering. projects such
as QFD, ISO, and TQM; group technology.
3. Optimize inbound and
outbound logistics processes
4. Analyze and improve all production processes
Maturity LevelKey
Improvement Factor
View Useful Tools

171
Maturity Level: Leading
Operational Tactical
Implementing collaborative methods together with suppliers to avoid waste time on quality verification or other activities without value to customers
Implementing collaborative methods and procedures to develop current and future suppliers
Implementing collaborative methods to warn suppliers in advance about changes in raw materials or in the introduction of new products
Strong collaboration with suppliers to develop new products and improve the current catalog.
Deploying continuous improvement projects in quality, logistics and production
Optimizing frequently product distribution and supplies procurement
Positioning the products in a specific market segment, enhancing their quality, service level, and price -benefit relationship
The enterprise has received awards from several organizations and owns several certifications in its products and processes
Performing world class manufacturing techniques, such as JIT, simulations, six sigma, lean or knowledge management to analyze and improve the production process.
The enterprise recognizes the relevance of investing on research and product development
Increasing the level of specialization over the core enterprise functions
The enterprise is focused on its core business functions, tending to outsource the remaining processes
Doing market research to improve inventory management, demand forecasting, and meeting customer's needs
Frequent optimization of inventories of finished products and raw materials
Performing world class inventory techniques, such as JIT, Vendor Management Systems, Warehouse Management Systems etc. to analyze and improve the inventory management
Strong collaboration with suppliers to develop new products and improve the current catalog.
Generating value the customers will appreciate through the service level
The enterprise is acknowledged its processes, products or services provided
Defining the customer's service career path, including specializations, training, degrees, etc.
Defining excellence awards in customer service amongst employees
Performing world class methodologies, such as Quality Function Deployment, Total Quality Management, design for Six Sigma, TRIZ, etc. to analyze and improve customer service.
Generating corporate memory regarding all procedures, functions, innovations and achievements on customer service
Receiving from employees outstanding results in labor climate surveys
Receiving awards by the work environment in the enterprise as a whole. Employees are fully identified and involved with the enterprise's mission, vision and values
Performing a culture of leadership, innovation and creativity amongst employees
Receiving frequent proposals to share the human resources system
Exerting strong influence over the features of suppliers and customers' information systems
Implementing continuous improvement projects to meet the user requirements such as response time, usability, availability, etc.
Managing strong dependency on technology and information systems in all enterprise's processes
Defining the rules to classify and prioritize improvement projects of information systems and technological solutions
Performing world class methodologies, such as Total Production Maintenance, Data Warehouse Systems, Data Mining, CMMI, etc. to analyze and improve the technological and information systems solutions.
Collaborating strongly with the enterprise's partners and other enterprises on technological and information systems improvement systems.
Deploying projects to give access to KPI's information and other useful information to make decisions. The access is restricted according to users' requirements
Defining process to share KPI's information with the enterprise's stakeholders
Implementing projects to automate data collection and analyses.
Reviewing current KPI's and defining new ones, documenting findings for other enterprises to use
Performance Measurement
System
Inventory
5. Focus on customer's
requirements
Customers
6. Focus on cost reduction
Human Resources
7. Review and Improve inventory management rules
Information Systems /
Technology
Leading
An enterprise in this maturity level will be able to innovate, develop, and transfer its own best practices; the enterprise has a strong influence over
suppliers and customers regarding its work culture and methods, information systems,
continuous improvement processes, etc; key processes and functions are aligned to
the enterprise's mission and a corporate strategy; the human resource is aware of the value that he/she adds to the product
with his/her activities, such that looking for more efficient and effective ways to do the
work; the enterprise has improved the efficiency of
specialized Information systems able to integrate suppliers, company, and
customers' key information, the information is available to
every one who needs it to make decisions; there is strong dependence on
technological solutions.
1. Optimize inbound and
outbound logistic processes
Suppliers
2. Synchronize processes
(production, sales, procurement etc.)
Production
3. Focus on quality improvements
4. Improve production process
capability
Maturity LevelKey
Improvement Factor
ViewAbstraction level

172
Maturity Level: Leading (continuation)
Strategic
Developing and documenting the best practices required by an enterprise for it to be included in the catalog of suppliers
Defining key projects to develop suppliers in the catalog of suppliers such that their products and services add value to the product
Making strong alliances and partnerships with other enterprises
Becoming a benchmark for other enterprises in its products and production processes.
Documenting its own best practices and sharing them with its partners.
Establishing solid rules to outsource functions and to develop core functions
Doing prospective market analysis and sharing findings with its partners and internal departments.
Defining and documenting own best practices and sharing them with partners and suppliers
Creating its own culture of service for customers to recommend the enterprise's products and be willing to pay for the service provided
Making investments in research and development of more effective and efficient customer service methods
Exerting a strong influence over customers needs and suppliers processes
Investing on research and development in labor climate improvements, employee development models and rewarding systems.
Documenting and sharing the human resources systems with partners and other enterprises.
Creating a culture of continuous improvement on information systems and innovation.
Investing on research and development of information systems and technological solutions
Documenting their own best practices on technology development and information system implementation, sharing them with partners and other enterprises.
Implementing projects to share information with stakeholders regarding KPI's
Having influence over suppliers reports, requesting KPI's and formats defined by the enterprise
Implementing technology to obtain and share information in real time; defining the criteria to
assign funds to technology development and research; deploying strategies to maintain
technology working properly such as Total Productive Management; involving stakeholders to ensure compatibility and full understanding of
the information exchanged.
Performance Measurement
System
Automating generation of KPIs; exchanging KPIs with key partners; defining minimum level of KPIs for suppliers, production, inventory and
so on; defining actions to certify suppliers; auditing KPIs for stakeholders.
Inventory
Documenting best practices related to inventory management; implementing inventory tracking
systems; continuous review of raw materials and finished product catalog; implementing six sigma controls in raw materials and finished products.
5. Focus on customer's
requirements
Customers
Documenting best practices related to customer services; deploying strategies to create the need
of own brand products in customers (marketing); doing prospective studies; deploying strategies to
exceed customer's expectations regarding product, service and maintenance of the goods
acquired.
6. Focus on cost reduction
Human Resources
Defining policies to share training and reward programs with partners; publishing human
resources opportunities, benefits, and projects in internal documents such as periodical reviews; deploying personal development programs for
the employees' families.7. Review and
Improve inventory management rules
Information Systems /
Technology
Leading
An enterprise in this maturity level will be able to innovate, develop, and transfer its own best practices; the enterprise has a strong influence over
suppliers and customers regarding its work culture and methods, information systems,
continuous improvement processes, etc; key processes and functions are aligned to
the enterprise's mission and a corporate strategy; the human resource is aware of the value that he/she adds to the product
with his/her activities, such that looking for more efficient and effective ways to do the
work; the enterprise has improved the efficiency of
specialized Information systems able to integrate suppliers, company, and
customers' key information, the information is available to
every one who needs it to make decisions; there is strong dependence on
technological solutions.
1. Optimize inbound and
outbound logistic processes
Suppliers
Supplier involvement in concurrent engineering efforts; implementing supplier development and
certification programs; optimizing 3PL participation; value added analysis; providing feedback to suppliers about the service level,
joint deployment efforts to improve the service level
2. Synchronize processes
(production, sales, procurement etc.)
Production
Stakeholder involvement in concurrent engineering efforts; application of innovation
methodologies in the enterprise processes such as TRIZ; design for Six Sigma, QFD, rapid
prototyping; outsourcing activities or processes with high cost/benefit relationship; application
for grants and sponsorships to develop new products; definition of policies to share best
practices with partners; implementing product tracking strategies; process automation; computer-integrated manufacturing; flexible manufacturing
systems
3. Focus on quality improvements
4. Improve production process
capability
Maturity LevelKey
Improvement Factor
View Useful Tools

173
APPENDIX 6: S(CM)2 VALIDATION SHEET
General Information
Date:
Name:
Position:
Business Type:
Years of Experience in Supply Chain or related field:
Academic Credentials:
After reviewing the model, please answer the following open-end questions
1. What advantages can you identify in the model?
2. What improvement opportunities can you identify in the model?
3. This model was developed to assess the processes in a supply chain and defining an
improvement road map. Do you consider this model meet this goal? Yes/No/Why?

174
APPENDIX 7: CASE STUDY USED TO VALIDATION
The following case of study belongs to a research about a model useful to assess and
improve the enterprise supply chain processes. The model classifies the maturity level of
the processes according to seven views named: Suppliers, Production, Inventories,
Customers, Human Resources, Information Systems & Technology, and Performance
Measurement Systems. The maturity levels are defined as Undefined, Defined,
Manageable, Collaborative, and Leading. The definition of each maturity level is the
following:
Undefined: ……
Defined: ……
Manageable: ……
Collaborative: ……
Leading: ……
The following are two assessment reports; these reports are based on findings regarding
the supply chain processes of the Enterprise X and the Enterprise Y. Please classify the
enterprise views regarding the definitions provided by each maturity level.
Enterprise X report
Description of the supply chain processes for the enterprise X. These reports are based
directly on the reference actions included in the model.

175
View Maturity Level View Maturity Level
Suppliers Human Resources
Production Information Systems and Technology
Inventories Performance Measurement Systems
Customers
Enterprise Y report
Description of the supply chain processes for the enterprise Y. These reports are based
directly on the reference actions included in the model.
View Maturity Level View Maturity Level
Suppliers Human Resources
Production Information Systems and Technology
Inventories Performance Measurement Systems
Customers
General Information:
Date:
Name:
Position:
Business Type:
Academic Credentials:

176
VITA
HERIBERTO GARCIA
ACADEMIC DEGREES
2009 Florida International University, Miami, FL Doctoral Candidate in Industrial and Systems Engineering, Spring 2009
2007 Instituto Tecnológico y De Estudios Superiores de Monterrey, Nuevo León, Mx Master of Science in Industrial Engineering (MSIE)
1996 Instituto Tecnológico y De Estudios Superiores de Monterrey, Nuevo León, Mx Master of Science in Quality Systems (MSQS)
1993 Instituto Tecnológico y De Estudios Superiores de Monterrey, Nuevo León, Mx Bachelor of Science in Mechanical Engineering (BSME)
PUBLICATIONS AND PRESENTATIOSN
Enhancing Simulation as Improvement and Decision Support System Tool, Winter Simulation Conference, December 2008 Decision Making training tool for a Manufacturing Line using Simulation, Fifth LACCEI International Latin American and Caribbean Conference for Engineering and Technology (LACCEI’2007), May 2007 Modeling and Analysis of an Oil Platform Evacuation Logistic System using Simulation, Fifth LACCEI International Latin American and Caribbean Conference for Engineering and Technology (LACCEI’2007), May 2007 Simulation and Analysis of systems using ProModel, García Eduardo, H. García, L. E. Cárdenas, Prentice Hall, 2006
SOCIETIES AND ORGANIZATIONS Institute of Industrial Engineering
Institute for the Operations Research and Management Sciences
Omega Rho, Honor Society for Operations Research
Council of Supply Chain Management and Professionals