A California Road Map - Home | California Fuel Cell … California Road...A California Road Map: The...
28
A California Road Map: The Commercialization of Hydrogen Fuel Cell Vehicles The realization of fuel cell electric vehicles and supporting infrastructure requires a road map for investments in fuel cell electric vehicles and hydrogen fueling stations. June, 2012 California Fuel Cell Partnership 3300 Industrial Blvd, Suite 1000 West Sacramento, CA 95691 916-371-2870 www.cafcp.org
-
Upload
duongkhanh -
Category
Documents
-
view
220 -
download
4
Transcript of A California Road Map - Home | California Fuel Cell … California Road...A California Road Map: The...

A California Road Map: The Commercialization of Hydrogen
Fuel Cell Vehicles
The realization of fuel cell electric vehicles and supporting infrastructure requires a road map for investments in fuel cell electric vehicles and hydrogen fueling stations.
June, 2012
California Fuel Cell Partnership
3300 Industrial Blvd, Suite 1000
West Sacramento, CA 95691
916-371-2870
www.cafcp.org
A California Road Map: The Commercialization of Hydrogen Fuel Cell Vehicles Page 2 of 28 Technical Version
Table of Contents
Executive Summary ...................................................................................................................................... 3
Introduction .................................................................................................................................................. 5
Road Map Overview ..................................................................................................................................... 6
Locations for Hydrogen Fueling Stations ..................................................................................................... 7
Developing Pre-commercial Clusters .............................................................................................. 8
Broadening the Pre-commercial Clusters .................................................................................... 10
Building a Network ........................................................................................................................ 13
The Total Number of Hydrogen Fueling Stations ...................................................................................... 14
Timing the Rollout of Hydrogen Fueling Stations ..................................................................................... 17
The Cost of the Initial Hydrogen Fueling Station Network ....................................................................... 19
Current and Planned Investments for Hydrogen Stations ........................................................... 20
Future Funding Requirements for Hydrogen Stations ................................................................. 21
Assumptions for the Hydrogen Station Funding Analysis ........................................................... 22
Funding Requirements Estimate ................................................................................................................ 25
Conclusion & Future Analysis .................................................................................................................... 27
The California Fuel Cell Partnership is a collaboration of organizations, including auto manufacturers, energy providers,
government agencies and fuel cell technology companies, that work together to promote the commercialization of hydrogen
fuel cell vehicles. By working together, we help ensure that vehicles, stations, regulations and people are in step with each other
as the technology comes to market.
A California Road Map: The Commercialization of Hydrogen Fuel Cell Vehicles Page 3 of 28 Technical Version
A California Road Map: The Commercialization of Hydrogen Fuel Cell Vehicles
Executive Summary In 1990, the State of California launched an ambitious agenda to introduce zero-emission vehicles to
reduce pollution and improve public health. Today, it is part of a larger effort to minimize petroleum
dependence and increase energy security, while reducing green house gases that contribute to climate
change. In response to rapidly approaching milestones to reach these goals in this agenda, automakers
are preparing for the commercialization of fuel cell electric vehicles (FCEVs) in California in 2015, when
customers are expected to be able to purchase and lease FCEVs from local dealerships. Early market
consumers will need to be confident that sufficient fueling is available, whether near their home, their
work, or where they like to travel.
A California Road Map represents a collaborative and collective effort by stakeholders from industry,
academia, non-governmental organizations and government to design a pragmatic road map for
hydrogen station placement, enabling the deployment of tens of thousands of fuel cell electric vehicles
in California. This report outlines the necessary steps for the vehicle and infrastructure market as it
progresses through pre-commercial (2012-2014) and early commercialization (2015-2017). It also
incorporates the best available information from each of the stakeholders, including market-based
assessments, models, and tools as well as professional experience with launching advanced vehicles and
new infrastructure.
The infrastructure deployment strategy described in this road map relies on ten years of lessons learned
by industry and government during the initial deployment of FCEVs. This real-world experience was
complemented by significant contributions from the University of California at Davis for stakeholder and
cluster model research, and the STREET computer modeling developed by the University of California at
Irvine. This multi-pronged approach established the minimum number stations needed to provide
convenient and reliable fueling for early FCEV customers. Initial station deployments will focus on key
markets, linking these geographic clusters into regional networks, and further expanding into new
vehicle markets and targeted destinations.
Based on this strategy, including projections of the number of fuel cell vehicles and extensive marketing
assessments by automakers, five clusters were identified in California where most early adopters are
expected: Berkeley, San Francisco South Bay, Santa Monica and West Los Angeles, coastal Southern
Orange County, and Torrance with nearby coastal cities. Additional stations will connect these clusters
into a regional network and capture major destinations. In order to launch the early commercial
market, this analysis identifies 68 strategically placed stations required to be operational by the end of
2015.

A California Road Map: The Commercialization of Hydrogen Fuel Cell Vehicles Page 4 of 28 Technical Version
Incentive funding is widely acknowledged as necessary to make the business case for investing in these
early commercial stations. Early stations are not expected to be fully utilized, and therefore profitable,
even as vehicle sales increase during the early commercialization years. Two possible approaches
estimate the required incentive funding: the “capital buy-down” model and the “cash flow support”
model. Based on a mix of existing and new stations, varying station sizes, and a cumulative capacity to
support approximately 20,000 fuel cell electric vehicles, the total cost to expand to 68 stations and
support operations and maintenance for all stations is estimated at $65 million under the “cash flow
support” model. The traditional “capital buy-down” model identified a similar overall cost of $67 million.
As the number of vehicles increases, as is projected, the station network must grow in number and
capacity to keep up with the fuel demand. A California Road Map lays out the path to successfully
launch early commercial deployment of vehicles and infrastructure, an early milestone towards long-
term market success. The California Air Resources Board’s Clean Fuels Outlet (CFO) regulation supports
the next phase. CFO triggers once 20,000 fuel cell electric vehicles are deployed statewide or 10,000 are
deployed in an air basin, and will remain in place until the number of stations reaches approximately
500. In this manner, the road map launches the market and CFO ensures sufficient fueling infrastructure
is available if other approaches fail to result in adequate fueling capacity.
A California Road Map reflects the input and consensus of more than 30 partners, including auto
manufacturers, energy companies, fuel cell technology companies, government agencies, non-
governmental organizations and universities. These stakeholders strongly agree that continued
investment and preparation is necessary to realize the potential of fuel cell electric vehicles and
hydrogen infrastructure market in California. While this document establishes the initial steps of seeding
the emerging market with 68 stations, it should be seen as part of a continuous plan to reach full-market
potential.
A California Road Map: The Commercialization of Hydrogen Fuel Cell Vehicles Page 5 of 28 Technical Version
Introduction
In 1990, the California Air Resources Board (ARB) adopted an ambitious program to dramatically reduce
the environmental impact of light-duty vehicles through the gradual introduction of zero-emission
vehicles (ZEV). The State’s strong commitment to zero-emission vehicles reflects the understanding that
advanced vehicle technology is necessary to achieve public health goals, including reductions in criteria
pollutants and long-term climate change emissions. It also reflects the fact that several California
regions continue to exceed state and federal health-based air quality standards.
California’s growing population and increasing use of motor vehicles place upward pressure on
statewide emissions. State and federal laws require strategies to achieve ambient air quality standards
as quickly as feasible. More broadly, global environmental and energy challenges, including climate
change, energy security, and air quality, require alternatives to today’s fossil fuel-based transportation.
Vehicle manufacturers (automakers) have made remarkable progress in advancing vehicle technology.
With government and industry support, major automakers are developing a portfolio of advanced
technology vehicles that includes hybrid electric (HEV), plug-in hybrid (PHEV), battery electric (BEV) and
fuel cell electric vehicles (FCEV).
FCEVs offer several advantages for many vehicle-market segments, including larger-sized vehicles like
sport utility vehicles (SUVs) and transit buses. One of the major advantages of FCEVs is the fact that they
use hydrogen, a fuel that can be domestically produced from a variety of resources such as natural gas,
solar, wind and biomass. Significant quantities of hydrogen have been produced in the U.S. for decades
through natural gas reformation, an efficient and well-understood method in the petroleum refining
industry. In other words, the technology and means to produce enough hydrogen fuel to support FCEV
deployment are available now. Complementing these advantages are the minimal environmental
impacts of FCEVs generated through zero tailpipe emissions and high vehicle efficiency as well as the
potential to generate hydrogen from renewable resources.
Launching fuel cell electric vehicles and an associated hydrogen infrastructure is a significant
undertaking and requires considerable planning and coordination to ensure success. Automakers are
testing and leasing FCEVs in real-world environments. To bring FCEVs to a broader market, automakers
must begin engineering development three-to-five years in advance along with vehicle testing,
automotive supplier development, manufacturing preparation and marketing plans. To execute these
capital investments, which amount to billions of dollars, an infrastructure plan must give automakers a
high level of confidence that their customers will have access to hydrogen fuel. More broadly, for FCEVs
to become commercially available in California, automakers, equipment providers and hydrogen station
operators will assume major business risk until sufficient scale is achieved in the market.
To further encourage progress with these environmental, technology, and energy goals, Governor Jerry
Brown signed Executive Order B-16-2012 on March 23, 2012 which directs state agencies to support and

A California Road Map: The Commercialization of Hydrogen Fuel Cell Vehicles Page 6 of 28 Technical Version
facilitate the rapid commercialization of zero-emission vehicles (ZEVs). The order directs the California
Air Resources Board, California Energy Commission, Public Utilities Commission and other relevant
agencies to work with the Plug-in Electric Vehicle Collaborative and the California Fuel Cell Partnership
in working towards three major milestones:
2015 – Communities are ready for plug-in and hydrogen vehicles and infrastructure
2020 – California will have established adequate infrastructure to support 1 million ZEVs
2025 – More than 1.5 million ZEVs will be on the roads and the market is expanding
Work to implement the executive order dovetails with the milestones identified here. These include a
broad range of readiness activities from permitting streamlining and community education to private
sector investment and academic and research institution involvement.
A California Road Map characterizes the steps necessary to move from the current pre-commercial
phase of fuel cell electric vehicle deployment (2012-2014) to early commercial phase (2015-2017) by
describing gaps and how these can be bridged. This plan draws the best available information from each
of the stakeholders, including market-based assessments, models and tools as well as professional
experience with launching advanced vehicles and new infrastructure. It does not answer every question
related to executing hydrogen infrastructure; instead, it offers the fundamental steps that are necessary
to proceed to commercialization.
Road Map Overview
In 1999, the California Fuel Cell Partnership formed as a public-private collaborative to address technical
barriers to bringing fuel cell electric vehicles to the commercial market and comply with ARB’s zero-
emission vehicle regulation. Throughout multiple phases, CaFCP has identified and tackled issues that
have included vehicle standards, safety training, building codes and station design. FCEVs have evolved
from engineering test vehicles to models being leased through California dealerships. Public transit
buses running on hydrogen carry hundreds of passengers every day. Retail gas stations offer hydrogen
dispensers that are fully integrated into the site, no longer sitting behind fences as test equipment.
Building on this foundation, CaFCP members are now preparing for commercial deployment. Research
and analysis efforts, such as those by UC Davis and UC Irvine, are shaping the “station cluster” concept,
and modeling and tools are being used to identify ideal station locations. Partnership with national labs
resulted in a best-of-class training program for city planning officials and first responders. CaFCP
members have also begun working closely with independent fuel marketers to understand their role and
the steps they believe are necessary to deploy stations and vehicles together.
At the core of these commercialization efforts in California is a working group of CaFCP members which
includes active automakers as well as several California stakeholders.1 Together, they have been working
1 CaFCP automakers include Chrysler, Mercedes-Benz/Daimler, General Motors, Honda, Hyundai, Nissan, Toyota, Volkswagen.

A California Road Map: The Commercialization of Hydrogen Fuel Cell Vehicles Page 7 of 28 Technical Version
closely to determine the appropriate number of hydrogen stations required for pre-commercial
activities (now through 2014) as well as the early commercial launch of fuel cell electric vehicles
(anticipated to be in the 2015-2017 timeframe).
The results of an annual survey completed by automakers are a vital planning tool for the working group
to properly balance anticipated vehicle sales and infrastructure needs. The California Energy
Commission (CEC), California Air Resources Board (ARB) and California Fuel Cell Partnership
administered the confidential survey in three consecutive years, compiling it in a manner where no
automaker, nor any entity outside the participating government agencies, could discern an individual
automaker’s response.2 Table 1 presents data from the most recent survey completed by the CEC and
ARB.3
Table 1 - Vehicle Sales, Actual & Anticipated, 2011-2017
Survey Year 2011 2012 2013 2014 2015 – 2017
2010-2011 253 312 430 1,389 53,0004
These data support infrastructure milestones and decision making, including research and analysis
completed by the University of California, including both Davis and Irvine campuses. Furthermore, the
data offer insight into automakers’ collective assessment of the potential magnitude of initial FCEV sales
during the early commercialization phase.
Locations for Hydrogen Fueling Stations
Two guiding principles, station coverage and capacity utilization, underlie the process for determining
the number of stations necessary during the early commercialization phases. They represent the
bookends of building a new transportation infrastructure for light-duty FCEVs. Coverage improves the
customer experience, ensures confidence in the technology, increases vehicle utility and enables broad
market participation.5 In short, station coverage establishes a local network by placing adequate fueling
outlets in key markets. Capacity utilization supports technology development, minimizes risk to station
operators and builds business models to lower overall station costs. Sufficient utilization ensures station
operators have a chance to make their business profitable. These principles must be systematically
reconciled during the commercial launch to ensure automakers, infrastructure equipment providers,
station operators and government entities maximize the market’s potential and protect billions of
dollars of private and public investment.
Many technical and non-technical factors will influence the specific placement of a hydrogen station,
including footprint, station performance characteristics and complementary uses. For example, retail
2 CaFCP Progress Report. http://www.cafcp.org/sites/files/FINALProgressReport.pdf. 3 Energy Commission, Commission Report. September 2011. http://www.energy.ca.gov/2011publications/CEC-600-2011-006/CEC-600-2011-006-CMF.pdf. 4 For competitive reasons, detailed volume assessments have not been provided to date for the 2015-2017 timeframe. The survey has been designed to enter one number per key air basin region for this time period. 5 Greene, David L. (1996) "Survey Evidence on the Importance of Fuel Availability to the Choice of Alternative Fuels and Vehicles," Energy Studies Review: Vol. 8: Iss. 3, Article 2.
A California Road Map: The Commercialization of Hydrogen Fuel Cell Vehicles Page 8 of 28 Technical Version
customers will expect high-performing hydrogen stations which mirror their gasoline counterparts with
no compromises with respect to availability, throughput and ease-of-use. This also includes the ability to
fill and pay for hydrogen fuel in the same fashion as a retail gasoline or natural gas station. In addition,
active fuel cell bus programs in the identified target areas might be important enablers to bring
hydrogen to a key market by sharing station equipment. These details are not expressively discussed in
detail in A California Road Map, but are important considerations as the plan is implemented.
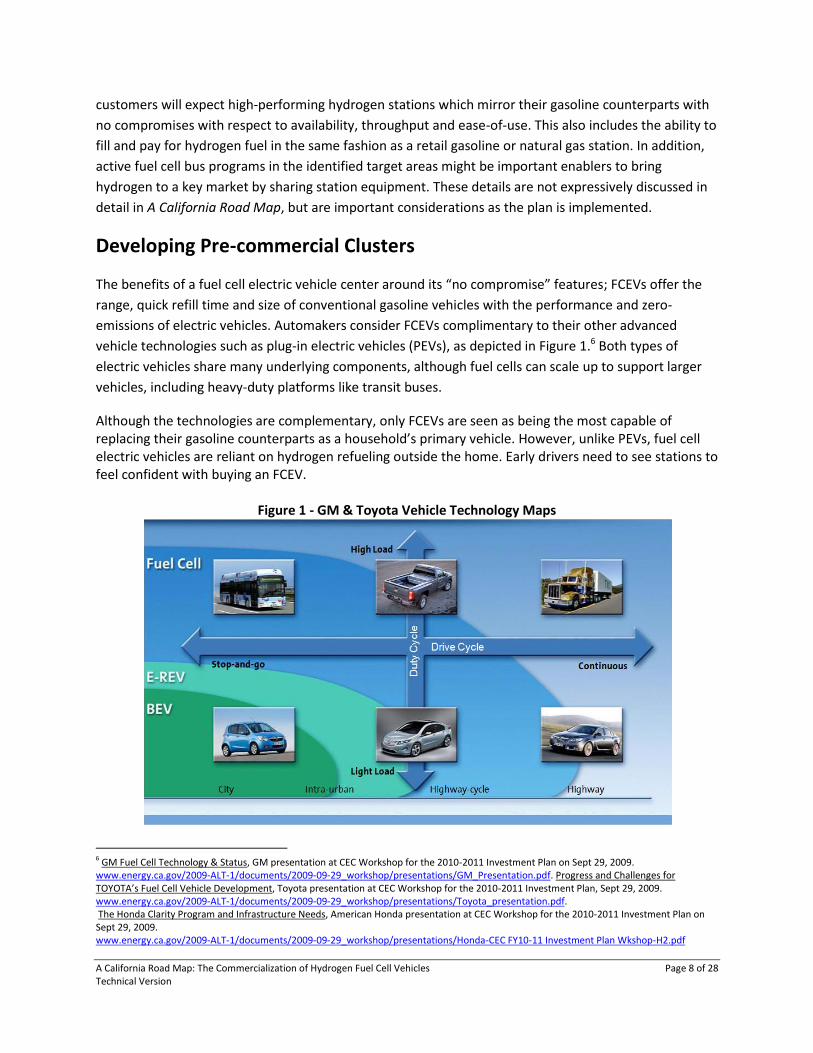
Developing Pre-commercial Clusters
The benefits of a fuel cell electric vehicle center around its “no compromise” features; FCEVs offer the
range, quick refill time and size of conventional gasoline vehicles with the performance and zero-
emissions of electric vehicles. Automakers consider FCEVs complimentary to their other advanced
vehicle technologies such as plug-in electric vehicles (PEVs), as depicted in Figure 1.6 Both types of
electric vehicles share many underlying components, although fuel cells can scale up to support larger
vehicles, including heavy-duty platforms like transit buses.
Although the technologies are complementary, only FCEVs are seen as being the most capable of replacing their gasoline counterparts as a household’s primary vehicle. However, unlike PEVs, fuel cell electric vehicles are reliant on hydrogen refueling outside the home. Early drivers need to see stations to feel confident with buying an FCEV.
Figure 1 - GM & Toyota Vehicle Technology Maps
6 GM Fuel Cell Technology & Status, GM presentation at CEC Workshop for the 2010-2011 Investment Plan on Sept 29, 2009. www.energy.ca.gov/2009-ALT-1/documents/2009-09-29_workshop/presentations/GM_Presentation.pdf. Progress and Challenges for TOYOTA’s Fuel Cell Vehicle Development, Toyota presentation at CEC Workshop for the 2010-2011 Investment Plan, Sept 29, 2009. www.energy.ca.gov/2009-ALT-1/documents/2009-09-29_workshop/presentations/Toyota_presentation.pdf. The Honda Clarity Program and Infrastructure Needs, American Honda presentation at CEC Workshop for the 2010-2011 Investment Plan on Sept 29, 2009. www.energy.ca.gov/2009-ALT-1/documents/2009-09-29_workshop/presentations/Honda-CEC FY10-11 Investment Plan Wkshop-H2.pdf

A California Road Map: The Commercialization of Hydrogen Fuel Cell Vehicles Page 9 of 28 Technical Version
Images in Figure 1 are courtesy of GM and Toyota.
In February 2009, the California Fuel Cell Partnership published an “action plan” that detailed the pre-
commercial phase roll out of hydrogen stations and vehicles in clusters.7 This cluster concept builds on
early work pioneered by the Department of Energy (DOE) through their Technology Validation Program
as well as the Five-Cities Program sponsored by the South Coast Air Quality Management District
(SCAQMD).8,9,10 By creating clusters of stations, the network itself build customer confidence, optimize
resources and create the foundation for further network expansion. Following that plan, vehicles and
stations were initially concentrated in the South Coast Air Basin, as shown in Figure 2 (see page 12),
including Santa Monica and West Los Angeles, Torrance and nearby beach cities, and Irvine and
Newport Beach. All the cluster communities have displayed a historical interest in advanced vehicle
7 Hydrogen Fuel Cell Vehicle and Station Deployment Plan: A Strategy for Meeting the Challenge Ahead http://www.cafcp.org/sites/files/Action%20Plan%20FINAL.pdf. 8 The DOE Tech-Val program partnered energy companies and automakers to co-locate FCEVs and hydrogen stations in coordinated areas across the US. These early outposts of co-located vehicles and hydrogen stations, in what we now call clusters, were deployed in select states in the US. Clusters within California continue to operate and expand beyond cities such as Burbank, Irvine, Sacramento, and Santa Monica. <http://www1.eere.energy.gov/hydrogenandfuelcells/tech_validation/fleet_demonstration.html> 9 The SCAQMD’s “Five-Cities” Program co-located hydrogen vehicles and hydrogen stations to demonstrate the technologies in a similar cluster approach. 10 Greene, D.L. et al., (2008). Analysis of the Transition to Hydrogen Fuel Cell Vehicles and the Potential Hydrogen Energy Infrastructure Requirements. Oak Ridge National Laboratory. <http://cta.ornl.gov/cta/Publications/Reports/ORNL_TM_2008_30.pdf>
A California Road Map: The Commercialization of Hydrogen Fuel Cell Vehicles Page 10 of 28 Technical Version
technologies, existing hydrogen infrastructure, and/or policies that support the further development of
the market.11,12
Ahead of the early commercial launch phase, deploying to a broader geographic area will be necessary
to ensure a sufficient number of early adopters believe the infrastructure is adequate and include a
FCEV in their purchasing consideration. Insufficient coverage, by definition, will reduce or remove FCEVs
from a customer’s purchasing consideration. Therefore, the evaluation of coverage must balance the
need to target as large a portion of early adopter market as possible while balancing station operators’
requirements, including high station utilization factors. For these reasons, it is necessary to move
beyond the initial clusters in the South Coast Air Basin.
In a similar approach to Los Angeles, additional locations target key regions to maximize the market
potential while ensuring station operators can succeed. As shown in Figure 3 (see page 12), this includes
key clusters in the San Francisco Bay Area, which include important early-adopter communities in the
South Bay and Berkeley.13 The clusters for each region are summarized in Table 2.
Table 2 - Overview of Clusters in California
Region Clusters
South Coast Air Basin
Santa Monica and West Los Angeles
Coastal and Southern Orange County
Torrance and nearby coastal cities
San Francisco Bay Area South Bay Area Berkeley
Broadening the Pre-commercial Clusters
Before 2015, the number of hydrogen stations in the early market communities will need to increase
and additional stations will be required to seed new communities. The goal is to increase the number of
stations and the geographic coverage to ensure a sufficient number of early adopters believes the
infrastructure is adequate to consider purchasing a fuel cell electric vehicle.
Starting with the pre-commercial clusters as the basis, this report used several sources of information to
identify other communities where FCEVs are likely to be adopted. The data considered include:
Demographic information, such as household income and land use considerations
11 Market data from automaker’s FCEV demonstration programs provide an initial insight and verification into future commercial strategies. Confidential information, such as hand-raiser data, vehicle lease programs, or previous advanced vehicle deployments provides insight into individual automaker decisions about the future market potential. In discussions, automakers assess the market individually and must avoid any anti-competitive discussions. 12 An important factor to also consider is the fact that existing infrastructure has already been deployed in these regions by way of previous demonstration projects. 13The Automaker Survey provides fidelity at the air basin level for the 2015-2017 timeframe. Although the largest number of vehicle deployments occur in the Los Angeles and the San Francisco Bay Area air basins, several other air basins have been identified.
A California Road Map: The Commercialization of Hydrogen Fuel Cell Vehicles Page 11 of 28 Technical Version
Individual automaker market assessments, including FCEV hand-raiser data14
California Energy Commission/Air Resources Board Vehicle Survey for battery electric vehicles and plug-in hybrid electric vehicles, as noted in the 2011-12 Investment Plan15
Hybrid vehicle, plug-in hybrid electric vehicle, battery-electric vehicle, and natural gas vehicle registrations, such as data for Toyota Prius, Honda Civic NGV, Chevrolet Volt and Nissan Leaf16
Geographic distribution of the Air Resources Board’s Clean Vehicle Rebate Program17
Table 3 summarizes the communities that stakeholders identified as necessary to broaden the early
commercial market in California.
Table 3 - Expanded Hydrogen Station Network
General Area Communities
South Coast Air Basin
Anaheim Diamond Bar Pasadena Area Long Beach Riverside Palm Springs San Fernando Valley Santa Barbara
San Francisco Bay Area
San Francisco - Downtown Hayward Napa Pleasanton Sonoma
San Diego San Diego Sacramento Sacramento – Downtown
14 As noted in Footnote 4, each automaker has access to proprietary information which is not shared due to competitive reasons. For example, GM’s Project Driveway generated over 80,000 hand-raisers, including many in California, willing to participate in the program. 15 California Energy Commission, Commission Report. September 2011. http://www.energy.ca.gov/2011publications/CEC-600-2011-006/CEC-600-2011-006-CMF.pdf 16 For competitive reasons, the automakers do not actively share these data in the working group sessions. However, these data may be available to California agencies through the Department of Motor Vehicles. 17 ARB’s Clean Vehicle Rebate Program http://www.arb.ca.gov/msprog/aqip/cvrp.htm. The specific distribution of the rebates can be found in the FY 2009-11 Final Report at http://www.arb.ca.gov/msprog/aqip/cvrp/CVRP_FinalReport_FY09-11.pdf

A California Road Map: The Commercialization of Hydrogen Fuel Cell Vehicles Page 12 of 28 Technical Version
Figure 2 - Clusters in the Greater Los Angeles Area
Figure 3 - Clusters in the San Francisco Bay Area
A California Road Map: The Commercialization of Hydrogen Fuel Cell Vehicles Page 13 of 28 Technical Version
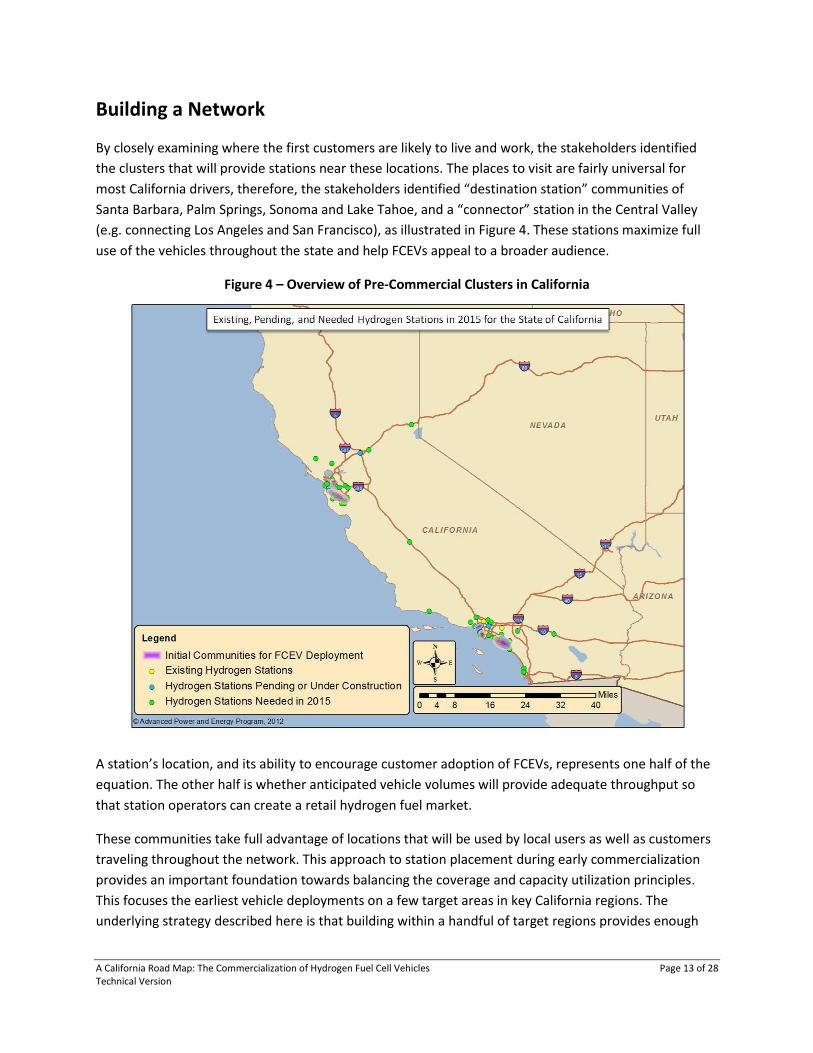
Building a Network
By closely examining where the first customers are likely to live and work, the stakeholders identified
the clusters that will provide stations near these locations. The places to visit are fairly universal for
most California drivers, therefore, the stakeholders identified “destination station” communities of
Santa Barbara, Palm Springs, Sonoma and Lake Tahoe, and a “connector” station in the Central Valley
(e.g. connecting Los Angeles and San Francisco), as illustrated in Figure 4. These stations maximize full
use of the vehicles throughout the state and help FCEVs appeal to a broader audience.
Figure 4 – Overview of Pre-Commercial Clusters in California
A station’s location, and its ability to encourage customer adoption of FCEVs, represents one half of the
equation. The other half is whether anticipated vehicle volumes will provide adequate throughput so
that station operators can create a retail hydrogen fuel market.
These communities take full advantage of locations that will be used by local users as well as customers
traveling throughout the network. This approach to station placement during early commercialization
provides an important foundation towards balancing the coverage and capacity utilization principles.
This focuses the earliest vehicle deployments on a few target areas in key California regions. The
underlying strategy described here is that building within a handful of target regions provides enough

A California Road Map: The Commercialization of Hydrogen Fuel Cell Vehicles Page 14 of 28 Technical Version
coverage to support anticipated vehicle volumes while ensuring station operators have the ability to
create the retail hydrogen fuel market. In other words, it enables all possible potential buyers to
purchase an FCEV that meet their needs while making sure the station operators are able to build a
business case.
The Total Number of Hydrogen Fueling Stations
To adequately assess the number of stations required to launch the fuel cell electric vehicle market, the
automakers engaged researchers at UC Irvine (APEP) and staff at CaFCP.18 Using APEP’s Spatially and
Temporally Resolved Energy and Environment Tool (STREET), the team initially analyzed the number of
stations that will ensure proper coverage.19
A robust network of hydrogen stations within each cluster has been defined as the number and location
of strategically located hydrogen stations that a driver can access in six minutes or less of driving, which
equates to having hydrogen outlets at 5-7 percent of the existing gasoline stations in the cluster. A six-
minute maximum travel time is based on previous optimization research, driver behavior surveys and a
need to balance network coverage with network cost.20 In comparison, current gasoline infrastructure
provides access in four minutes of driving time or less in all five cluster regions, though this is considered
overbuilt for the needs of consumers.21,22
In addition, analyses of alternative fuel stations have concluded that roughly five percent of the existing
gasoline stations network would need to offer hydrogen to allay drivers’ concerns, a metric which can be
applied to each cluster or region.23 These analyses further state that careful optimization of hydrogen
stations is equally as important as the total number of stations offering hydrogen, where optimized
locations are determined using driving time with the existing road infrastructure.24 The STREET analysis
offers such optimization while creating a sufficient network for early commercialization. Using these
criteria, this assessment determined a cumulative total of 45 stations would be required in the five
clusters in California.
To ensure infrastructure is available to customers in these markets, additional hydrogen stations are
required to merge the clusters into a regional network. These locations have been identified in an
iterative process using locations with FCEV hand-raiser and demographic data, and verifying through
direct automaker assessment and feedback on station location. Demographic data are a combination of
household income, population and cars per household, with income weighted the most important of the
18 Advanced Power and Energy Program, University of California, Irvine. 19 Stephens-Romero, Kang, Brown, Recker, Samuelsen, (2010).Systematic Planning to Optimize Investments in Hydrogen Infrastructure Deployment. International Journal of Hydrogen Energy 20 Ibid. 21 Nicholas, M. A., Handy, S. L., & Sperling, D. (2004). Using Geographic Information Systems to Evaluate Siting and Networks of Hydrogen Stations. Transportation Research Record 1880. 22 Melaina, M. and J. Bremson (2008). "Refueling Availability for Alternative Fuel Vehicle Markets: Sufficient Urban Station Coverage." Energy Policy 36(7): 3223-3231. 23 Nicholas, M. A., Handy, S. L., & Sperling, D. (2004). Using Geographic Information Systems to Evaluate Siting and Networks of Hydrogen Stations. Transportation Research Record 1880. 24Melaina, M. and J. Bremson (2008). "Refueling Availability for Alternative Fuel Vehicle Markets: Sufficient Urban Station Coverage." Energy Policy 36(7): 3223-3231.
A California Road Map: The Commercialization of Hydrogen Fuel Cell Vehicles Page 15 of 28 Technical Version
three. Additional stations within each target region are generally deployed strategically to provide
redundancy and consumer confidence where the emerging market is being established. This analysis
sought an answer from both sides of the problem by comparing the selected locations against individual
automaker market assessments.25
Finally, hydrogen stations that provide connectivity from a target region to typical destinations,
including destinations which are expected to also serve as early-adopter markets, have been identified
based on an understanding of where drivers in the target regions typically drive for vacations,
excursions, or business.26 Provision of fuel for long-distance trips is essential to meet customer
expectations.27 By providing a broad fueling network, FCEVs provide the same utility as gasoline vehicles
and distinguish themselves from other limited-range, alternative-fuel vehicles. The assessment has
determined that 23 additional stations are needed to expand the five clusters into a regional network.
Table 4 on the following page summarizes the total number of stations needed to achieve A California
Road Map’s goal of coverage and capacity. This total includes 17 stations (see Table 6 on page 20) that
are currently operating or are under contract with ARB or CEC.28
25 As noted in Footnote 4 and 7, each automaker has access to proprietary market information. Several automakers have shared confidential data with UC Irvine for STREET modeling under a Non-Disclosure Agreement (NDA). 26 Ibid. 27 Melaina, M. W. (2003). Initiating hydrogen infrastructures: preliminary analysis of a sufficient number of initial hydrogen stations in the US. International Journal of Hydrogen Energy. 28 This is the cumulative total of stations funded by the California Air Resources Board and California Energy Commission. The total number of stations funded by ARB: www.hydrogenhighway.ca.gov/update/summer09.pdf. The total number of stations funded by CEC: www.energy.ca.gov/contracts/PON-09-608_Revised_NOPA.pdf.

A California Road Map: The Commercialization of Hydrogen Fuel Cell Vehicles Page 16 of 28 Technical Version
Table 4 – Building a Station Network to Achieve Coverage
The above table summarizes the total number of stations necessary to launch the early
commercial market. It identifies the calculated number of stations in the clusters by STREET
as well as the additional network stations necessary located in key markets, connectors, and
destinations.
Cluster Locations Total Stations
Santa Monica and West LA 8
Coastal / Southern Orange County 13
Torrance and Nearby Coastal Cities 8
San Francisco South Bay Area 12
Berkeley 4
SUB-TOTAL – CLUSTERS 45
Expanded Network Locations Total Stations
Anaheim 1
Diamond Bar 1
Pasadena Area 3
Long Beach 1
Riverside 1
Palm Springs 1
San Fernando Valley 2
Santa Barbara 1
San Francisco - Downtown 2
Hayward 1
Napa 1
Pleasanton 1
Sonoma 1
San Diego 2
Sacramento – Downtown 2
Lake Tahoe 1
I-5 Corridor 1
SUBTOTAL – EXPANDED NETWORK 23
TOTAL 68

A California Road Map: The Commercialization of Hydrogen Fuel Cell Vehicles Page 17 of 28 Technical Version
With this assessment, a consensus has developed that California will be best prepared for deployment
of FCEVs on a commercial scale if 68 hydrogen stations are strategically located throughout these
regions, such that:
Each FCEV target region establishes a robust network of hydrogen stations within its clusters
Additional hydrogen stations within each target region begin to merge the clusters into a regional
network of stations
Hydrogen stations provide connectivity from a target region to typical destinations
CEC’s Hydrogen Infrastructure Program (AB 118) is expected to provide an additional $29.7 million in
hydrogen infrastructure funding in 2012 and 2013. This is expected to support an additional 15-20
stations, bringing the expected total number of planned and operational stations to 37 stations by 2014-
2015.29 Therefore, 31 additional stations are required beyond those currently planned.
Timing the Rollout of Hydrogen Fueling Stations
As the coordinated deployment of vehicles and stations occurs during pre- and early commercialization,
stakeholders generally agree that once the coverage principle is met in these regions, station fuel
demand growth should then closely follow vehicle sales growth. Slower growth might require fewer or
no additional stations, and faster growth might encourage a quicker and broader rollout of hydrogen
stations. In other words, if the current projections transpire, 68 stations would be serving thousands of
vehicles in the 2016 timeframe, estimated between 10,000-30,000 vehicles as noted in Table 5 on the
next page.30
29 Energy Commission. http://www.energy.ca.gov/contracts/transportation.html. Total CEC funding commitments include FY 2010-11 ($10.2M), FY2011-12 ($8.5M), and FY2012-12 ($11M) < http://www.energy.ca.gov/2010-ALT-1/background.html>. 30 The current estimated capacity of the 68 station network is 21,245kg/day, calculated from existing and expected future installed capacity. This is estimated to be capable of supporting approximately 20,000-25,000 vehicles.
A California Road Map: The Commercialization of Hydrogen Fuel Cell Vehicles Page 18 of 28 Technical Version
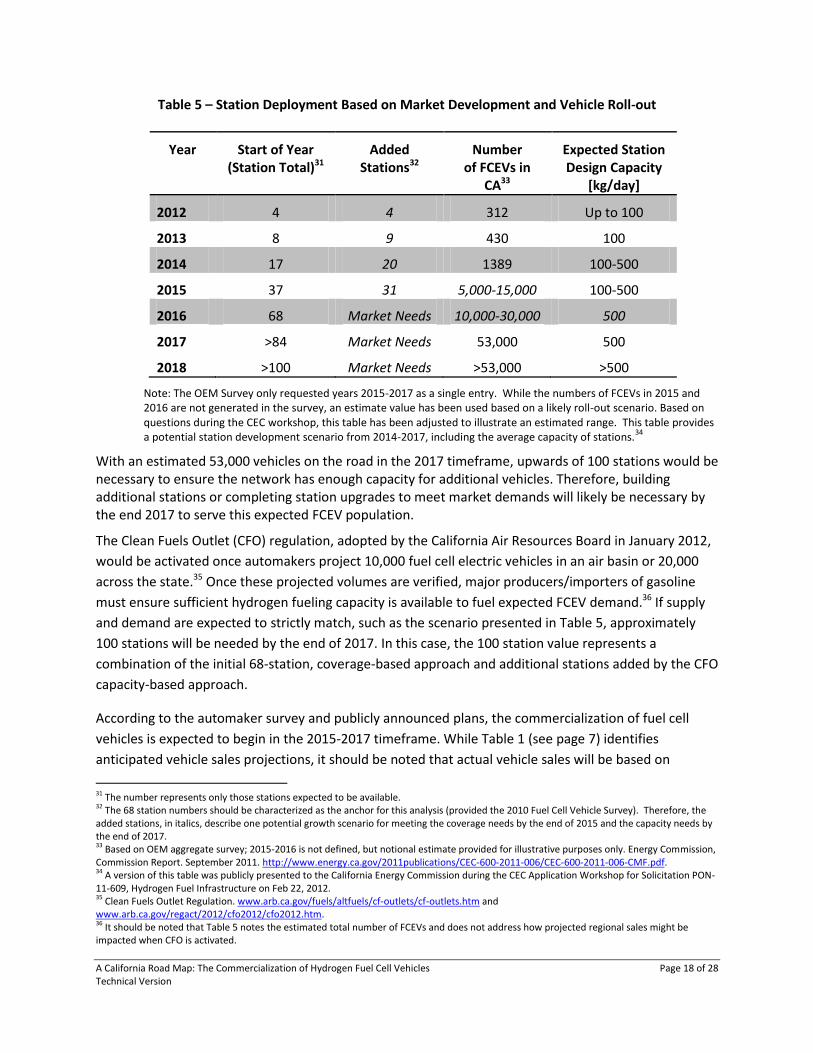
Table 5 – Station Deployment Based on Market Development and Vehicle Roll-out
Year Start of Year (Station Total)31
Added Stations32
Number of FCEVs in
CA33
Expected Station Design Capacity
[kg/day]
2012 4 4 312 Up to 100
2013 8 9 430 100
2014 17 20 1389 100-500
2015 37 31 5,000-15,000 100-500
2016 68 Market Needs 10,000-30,000 500
2017 >84 Market Needs 53,000 500
2018 >100 Market Needs >53,000 >500
Note: The OEM Survey only requested years 2015-2017 as a single entry. While the numbers of FCEVs in 2015 and 2016 are not generated in the survey, an estimate value has been used based on a likely roll-out scenario. Based on questions during the CEC workshop, this table has been adjusted to illustrate an estimated range. This table provides a potential station development scenario from 2014-2017, including the average capacity of stations.
34
With an estimated 53,000 vehicles on the road in the 2017 timeframe, upwards of 100 stations would be necessary to ensure the network has enough capacity for additional vehicles. Therefore, building additional stations or completing station upgrades to meet market demands will likely be necessary by the end 2017 to serve this expected FCEV population.
The Clean Fuels Outlet (CFO) regulation, adopted by the California Air Resources Board in January 2012,
would be activated once automakers project 10,000 fuel cell electric vehicles in an air basin or 20,000
across the state.35 Once these projected volumes are verified, major producers/importers of gasoline
must ensure sufficient hydrogen fueling capacity is available to fuel expected FCEV demand.36 If supply
and demand are expected to strictly match, such as the scenario presented in Table 5, approximately
100 stations will be needed by the end of 2017. In this case, the 100 station value represents a
combination of the initial 68-station, coverage-based approach and additional stations added by the CFO
capacity-based approach.
According to the automaker survey and publicly announced plans, the commercialization of fuel cell
vehicles is expected to begin in the 2015-2017 timeframe. While Table 1 (see page 7) identifies
anticipated vehicle sales projections, it should be noted that actual vehicle sales will be based on
31 The number represents only those stations expected to be available. 32 The 68 station numbers should be characterized as the anchor for this analysis (provided the 2010 Fuel Cell Vehicle Survey). Therefore, the added stations, in italics, describe one potential growth scenario for meeting the coverage needs by the end of 2015 and the capacity needs by the end of 2017. 33 Based on OEM aggregate survey; 2015-2016 is not defined, but notional estimate provided for illustrative purposes only. Energy Commission, Commission Report. September 2011. http://www.energy.ca.gov/2011publications/CEC-600-2011-006/CEC-600-2011-006-CMF.pdf. 34 A version of this table was publicly presented to the California Energy Commission during the CEC Application Workshop for Solicitation PON-11-609, Hydrogen Fuel Infrastructure on Feb 22, 2012. 35 Clean Fuels Outlet Regulation. www.arb.ca.gov/fuels/altfuels/cf-outlets/cf-outlets.htm and www.arb.ca.gov/regact/2012/cfo2012/cfo2012.htm. 36 It should be noted that Table 5 notes the estimated total number of FCEVs and does not address how projected regional sales might be impacted when CFO is activated.
A California Road Map: The Commercialization of Hydrogen Fuel Cell Vehicles Page 19 of 28 Technical Version
numerous market-based factors, most notably customer preferences. If customers believe that FCEV
technology is mature and fits their needs, and that the station network is sufficient and station
performance meets their expectations, then the market is sufficiently enabled so that accelerating FCEV
sales will occur. The number of stations operating in 2015-2017 will be crucial to increasing FCEV sales.
If the hydrogen station network is sufficiently robust by 2015, it provides additional certainty and
improves the chances that vehicle and station milestones will be met by 2017. On the other hand, if the
hydrogen station network is insufficient in the timeframe, FCEVs may be adopted at a slower pace than
expected or FCEVs may be adopted at different rates by different markets. This could cause vehicle
inventories to be reallocated to regions outside of California, reducing the number of vehicles in the
state for a particular calendar year.
Given the investments required to bring an advanced vehicle program to market, along with the necessary
infrastructure to adequately support those vehicles, it is critical to minimize the risks to all stakeholders to
manageable levels. These considerations also highlight the need to remain flexible during planning efforts,
such as the specific station placement. Ensuring the industry is able to adapt to new information or changes
in market dynamics will be crucial when building a confident early-adopter market that is prepared to
purchase fuel cell electric vehicles. It will require leadership and commitment from all stakeholders through
each stage of execution.
The Cost of the Initial Hydrogen Fueling Station Network
Stakeholders have determined that 68 stations in target regions in California by the end of 2015 would
provide sufficient coverage to initiate an early commercial market. The majority of these stations are to be
placed in three clusters in the greater Los Angeles area and two clusters in the San Francisco Bay area. This
strategy balances customer expectations with respect to driving distance and coverage while building
confidence in the market development of the vehicle and station technologies.
It should be noted that as station coverage needs for early commercialization are fulfilled, the build-out of
additional hydrogen infrastructure is expected to be managed through the Clean Fuels Outlet (CFO)
regulation. Building the initial coverage of 68 stations is critical to ensuring a successful market launch, since
additional mechanisms like CFO are in place to support further FCEV deployment.
As previously stated, stakeholders estimate 37 stations will be funded and operating in 2015, leaving a gap of
31 needed stations. Satisfying this gap is essential to maintaining continued confidence that California will be
ready for an early FCEV market. This section estimates the funding necessary to bridge this gap using two
proposed scenarios.
Understanding the overall cost of the network and building the business case are critical to long-term market
success. While the business case for an individual station will be defined by the factors discussed below-– the
expected station costs (including equipment and installation, operations and maintenance, and financing)
and the expected revenue (including pricing and hydrogen demand)-many factors will influence the success
of an individual station. A California Road Map does not look at how individual station operators might
maximize their potential for success; rather, it takes a broader view of the system and what macro-scale
factors may impact the funding gap.

A California Road Map: The Commercialization of Hydrogen Fuel Cell Vehicles Page 20 of 28 Technical Version
Current and Planned Investments for Hydrogen Stations
Table 6 depicts the network of hydrogen fueling stations currently funded and expected to be
operational by the end of 2015.37 In total, ARB and CEC have provided $31 million in cost-share funding
for the following stations with $29.7 million allocated for future stations.
Table 6 – Expected Availability for Currently Funded Stations by 2015
Station Current Status Capacity (kg/d)
2015 Status
Assessment
Beverly Hills (Air Products) Planned – 2013 180 Available Retail Setting
Burbank (City of Burbank) Operational 100 Available Non-commercial Setting
Diamond Bar (SCAQMD) Upgrade (2013) 180 Available Non-Commercial Setting
Emeryville (AC Transit) Operational 60 Available Non-Commercial Setting
Fountain Valley (OCSD) Operational 100 Unavailable Unavailable
Harbor City (Air Products) Planned – 2012 100 Available Retail Setting
Hawthorne (Air Products) Planned – 2013 180 Available Retail Setting
Hermosa Beach (Air Products) Planned – 2013 180 Available Retail Setting
Irvine (Air Products) Planned – 2013 180 Available Retail Setting
Irvine (UC Irvine) Upgrade (2012) 180 Available Non-commercial Setting
Laguna Niguel (Linde) Planned – 2013 240 Available Retail Setting
Los Angeles (Cal State LA) Planned – 2012 60 Available Non-commercial Setting
Newport Beach (Shell) Operational 100 Available Available
San Francisco (SFO) Planned – 2012 240 Available Non-Commercial Setting
Santa Monica (Air Products) Planned – 2013 180 Available Retail Setting
Torrance (Shell) Operational 60 Available Retail Setting
West Los Angeles (Air Products) Planned – 2013 180 Available Retail Setting
West Los Angeles (Shell) Operational 30 Unavailable Unavailable
West Sacramento (Linde) Planned – 2013 240 Available Retail Setting
ALL STATIONS TOTAL 19
2015 AVAILABLE TOTAL 17
37 Based on information from ARB and CEC on 4/20/2012.

A California Road Map: The Commercialization of Hydrogen Fuel Cell Vehicles Page 21 of 28 Technical Version
Given the existing or planned stations, the assessment in Table 6 identifies three types of station status:
Available – Commercial Setting: Stations in a commercial setting, such as those located at a
retail gasoline location, were assumed to be available in the 2015-2017 timeframe. These
hydrogen stations are located in the clusters, or might otherwise be considered anchor stations
as the market develops, since early customers are expected to be most familiar with these
locations. There is a high likelihood that each of these stations will be upgraded to meet market
needs.
Available – Non-commercial Setting: Stations in a non-commercial setting, such as a university
campus or fleet/private setting were also assumed to be available. However, it is anticipated
that customers may not be as comfortable with the non-commercial setting, so these stations
might support private fleet applications or be used as a backup to a retail location. There is less
likelihood that these stations will be upgraded in the future.
Unavailable - Demonstration stations which have been slated for closure are included. It should
be noted this assessment will probably change as station operators and early customers
determine the market needs for each location and technology.
Additional funding for hydrogen stations has been allocated by the CEC as well as a future funding
allocation from the 2012-2013 AB118 Investment Plan.38 The total funding allocation for future stations
is approximately $29.7 million.39 It is estimated that up to 20 hydrogen stations will be funded (through
the 2012-13 Investment Plan (with all stations being available by the beginning of 2015). The final
number of stations will be determined by funding availability, stations proposed, and the cost to install
each proposed retail station.
For the above stations, the current incentives from California (i.e., CEC, ARB) for station deployment
have focused on driving the cost of equipment down through cost-share grants to hydrogen station
equipment developers. Historically, the government cost-share has ranged between 50% and 70%.
While this model was successful in making stations cheaper, it did not address operations and
maintenance costs incurred by station owners, nor did it leverage the potential private financial models
from station developers who are not equipment manufacturers.
Future Funding Requirements for Hydrogen Stations
Compared to gasoline stations, hydrogen stations currently require high up-front capital costs and
maintenance expenses. These costs can ultimately be offset by potentially high margins on every
kilogram (kg)40 of hydrogen sold (compared to gasoline margins). For the early hydrogen stations,
however, when vehicles numbers are still low, fuel revenues are expected to be insufficient to offset the
38 Investment Plans can be found at: www.energy.ca.gov/2011-ALT-1/background.html. Draft CEC AB118 2012-2013 Investment Plan: www.energy.ca.gov/2012publications/CEC-600-2012-001/CEC-600-2012-001-SD-REV.pdf. 39 Energy Commission. http://www.energy.ca.gov/contracts/transportation.html. Total CEC funding commitments include FY 2010-11 ($10.2M), FY2011-12 ($8.5M), and FY2012-12 ($11M). http://www.energy.ca.gov/2010-ALT-1/background.html. 40 1 kg of hydrogen fuel has roughly the same energy content as 1 gallon of gasoline. On average, fuel cell vehicles can travel 2.5 times as far on 1 kg of hydrogen as an internal combustion engine vehicle can travel on 1 gallon of gasoline.
A California Road Map: The Commercialization of Hydrogen Fuel Cell Vehicles Page 22 of 28 Technical Version
costs for many months or years. Some incentive funding is broadly acknowledged as necessary to make
a business case in these early commercial stations.
To estimate the incentive funding required to reach 68 stations, the cost of installing new stations must
be considered, in addition to the cost of operating and maintaining all the stations. This funding
requirement is fully analyzed in the report, Incentivizing Hydrogen Infrastructure Investment and is
summarized in the following sections.41 The analysis includes a detailed breakdown of the funding
requirements for an average station under different scenarios. The funding requirements were
evaluated under two possible incentive approaches, the “capital buy-down” approach and the “cash-
flow support” approach.
The California Energy Commission uses the capital buy-down approach as the incentive structure for its
Alternative and Renewable Fuel and Vehicle Technology Program, in which it provides station
developers a grant to "cost-share” the up-front capital expense. To determine the government and
private funding necessary to reach the 68 station target, the report’s analysis adds operations and
maintenance (O&M) costs to the total capital cost for all new stations described in Table 5 (see page 16).
Funding for O&M was also included in the analysis for existing stations (i.e., operating or previously
funded). In each case, this O&M support was assumed to continue until the net retail margin for a
station exceeds its O&M costs.
The analysis also explores cash-flow support as an alternative incentive structure, aimed at attracting a
broader set of investors to hydrogen station investment. Investors pay for and finance the hydrogen
station development in full, but receive an incentive payment when the station begins operations. These
payments cover all operating expenses as well as financing payments, and continue until the net retail
margin can pay for these costs. For many stations, the need for cash flow support is expected to
continue for three-to-five years as more vehicles enter the market. For other stations, such as an
underutilized connector or destination station, this may last until the financing is paid off, assumed in
this analysis to be within 10 years. The intent is to attract fuel industry investors who are accustomed to
using a similar investment model to rapidly achieve positive cash flows from gasoline station
investments.
Assumptions for the Hydrogen Station Funding Analysis
The following assumptions have been used in the analysis to reach the 68-station goal. Generally, all
stations are expected to be operated in a retail setting and dispense hydrogen that has been centrally
produced and delivered to the station.42
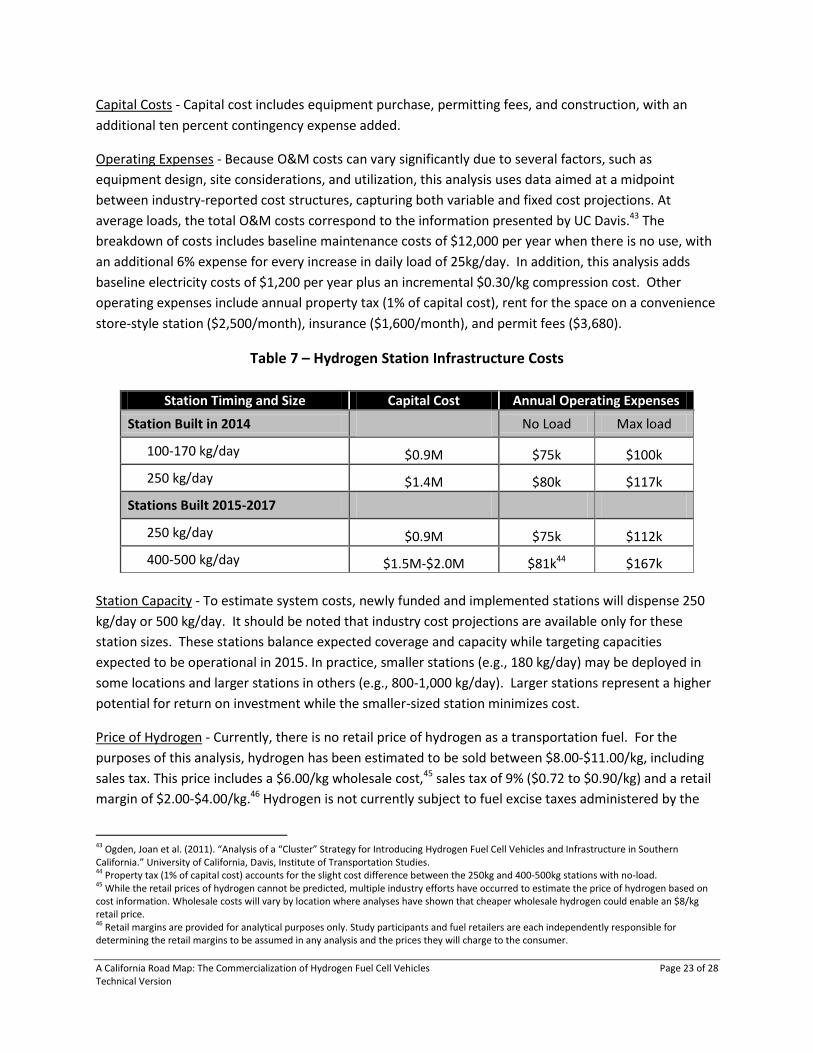
Table 7 presents the expected capital and O&M costs for a variety of stations, which include:
41 This white paper is based on analysis conducted within the context of an industry and government collaborative effort, launched in July 2011 to examine investment options for early commercial hydrogen infrastructure in California. The report can be found at: http://www.einow.org/images/stories/factsheets/ein_california_h2_infrastructure_cost.pdf. 42 In reality, some stations may generate hydrogen onsite or receive hydrogen from a pipeline.
A California Road Map: The Commercialization of Hydrogen Fuel Cell Vehicles Page 23 of 28 Technical Version
Capital Costs - Capital cost includes equipment purchase, permitting fees, and construction, with an
additional ten percent contingency expense added.
Operating Expenses - Because O&M costs can vary significantly due to several factors, such as
equipment design, site considerations, and utilization, this analysis uses data aimed at a midpoint
between industry-reported cost structures, capturing both variable and fixed cost projections. At
average loads, the total O&M costs correspond to the information presented by UC Davis.43 The
breakdown of costs includes baseline maintenance costs of $12,000 per year when there is no use, with
an additional 6% expense for every increase in daily load of 25kg/day. In addition, this analysis adds
baseline electricity costs of $1,200 per year plus an incremental $0.30/kg compression cost. Other
operating expenses include annual property tax (1% of capital cost), rent for the space on a convenience
store-style station ($2,500/month), insurance ($1,600/month), and permit fees ($3,680).
Table 7 – Hydrogen Station Infrastructure Costs
Station Capacity - To estimate system costs, newly funded and implemented stations will dispense 250
kg/day or 500 kg/day. It should be noted that industry cost projections are available only for these
station sizes. These stations balance expected coverage and capacity while targeting capacities
expected to be operational in 2015. In practice, smaller stations (e.g., 180 kg/day) may be deployed in
some locations and larger stations in others (e.g., 800-1,000 kg/day). Larger stations represent a higher
potential for return on investment while the smaller-sized station minimizes cost.
Price of Hydrogen - Currently, there is no retail price of hydrogen as a transportation fuel. For the
purposes of this analysis, hydrogen has been estimated to be sold between $8.00-$11.00/kg, including
sales tax. This price includes a $6.00/kg wholesale cost,45 sales tax of 9% ($0.72 to $0.90/kg) and a retail
margin of $2.00-$4.00/kg.46 Hydrogen is not currently subject to fuel excise taxes administered by the
43 Ogden, Joan et al. (2011). “Analysis of a “Cluster” Strategy for Introducing Hydrogen Fuel Cell Vehicles and Infrastructure in Southern California.” University of California, Davis, Institute of Transportation Studies. 44 Property tax (1% of capital cost) accounts for the slight cost difference between the 250kg and 400-500kg stations with no-load. 45 While the retail prices of hydrogen cannot be predicted, multiple industry efforts have occurred to estimate the price of hydrogen based on cost information. Wholesale costs will vary by location where analyses have shown that cheaper wholesale hydrogen could enable an $8/kg retail price. 46 Retail margins are provided for analytical purposes only. Study participants and fuel retailers are each independently responsible for determining the retail margins to be assumed in any analysis and the prices they will charge to the consumer.
Station Timing and Size Capital Cost Annual Operating Expenses
Station Built in 2014 No Load Max load
100-170 kg/day $0.9M $75k $100k
250 kg/day $1.4M $80k $117k
Stations Built 2015-2017
250 kg/day $0.9M $75k $112k
400-500 kg/day $1.5M-$2.0M $81k44 $167k
A California Road Map: The Commercialization of Hydrogen Fuel Cell Vehicles Page 24 of 28 Technical Version
State of California Board of Equalization.47 A price range of $8.00-$11.00/kg, hydrogen is comparable to
gasoline priced between $3.20 and $4.40/gallon of gasoline.48
Retail Margin: $3.00/kg - While the overall supply market and each individual hydrogen station operator
will determine this value, a $3.00/kg margin was assumed for this analysis. This margin balances cost
savings to the consumer and profits to the station owner.49 A $2.00/kg margin may generate insufficient
revenue to pay for stations at their current and projected costs, while a $4.00/kg likely makes hydrogen
too expensive to market relative to gasoline. It should be noted that the analysis has intentionally
chosen lower-cost numbers, both in terms of the cost and utilization scenarios. For example, it appears
that, in the compressed natural gas (CNG) sector, market growth and competition will quickly result in
significant capital cost reductions, lower O&M costs, and downward price pressure on wholesale
hydrogen prices.
Financing - For the purpose of this analysis, a hydrogen station developer would borrow 100 percent of
the money needed to install hydrogen-fueling equipment. Discussions with industry financiers confirm
this is current practice for gasoline stations. Furthermore, CNG stations, which represent the most
comparable equipment and station footprint, have also obtained 100 percent financing.50
Loan term: 10 years, 5.5% interest rate - Typically, fueling equipment loans are issued based on a seven-
year loan term, but can be extended with justification.51 A seven-year loan places considerable financial
pressure on an early market hydrogen station project. This analysis assumes that a strong package can
be put together to obtain a ten-year loan term. In addition, a 5.5% interest rate reflects current rates for
similar station financing, as reported by financial organizations in this industry.52
Station Utilization - As illustrated in Figure 5, the demand for hydrogen fuel at an individual station is
characterized in three deployment scenarios: fast, medium and slow growth. The medium growth curve
represents an average fuel-demand load based on the vehicle deployment projection curve provided by
the CaFCP in Progress and 2011 Actions for Bringing Fuel Cell Vehicles to Market in California.53 The slow
growth curve represents a prolonged vehicle ramp-up scenario, such as a delay in FCEV rollout or a
region where FCEVs are more slowly adopted by the market. The fast growth curve reaches full
utilization after four years of sales, representing a strong market development in a cluster region. To
remain conservative, this analysis uses the medium growth curves for the cluster markets, and the slow
growth curves for the other smaller stations. All of these growth curves also incorporate a one-year “lag
time” effect to capture the reality that financing and other costs will be incurred from the outset, before
47 “Selling Hydrogen Fuel in a Pre-Commercial Environment within California”. California Department of Food and Agriculture, Division of Measurement Standards. November 2011. www.cdfa.ca.gov/dms/. 48 One kilogram of hydrogen holds approximately the same energy content as one gallon of gasoline, and FCEVs are about 2.5 times as efficient as conventional gasoline engine vehicles (CARB Low Carbon Fuel Standard 2011 Amendments). 49 $6.00 wholesale + $3.00 retail margin + $0.81 sales tax = $9.81 retail cost. Comparable to $3.92/gallon gasoline. 50 Conversation with Patriot Capital Corporation, March 2012. http://www.patriotcapitalcorp.com/about-us. 51 Ibid. 52 It should be noted that if a hydrogen station were completely funded by private investment, we would expect the interest rate to be greater than 5.5% because hydrogen infrastructure payback potential has not yet been demonstrated. This analysis assumes that a dedicated cash flow support fund greatly increases the probability of successful loan payback, thereby decreasing risk to the lender and the requisite interest rate. 53 Published February 2011: http://cafcp.org/sites/files/CaFCPProgressand2011Actions_0.pdf.

A California Road Map: The Commercialization of Hydrogen Fuel Cell Vehicles Page 25 of 28 Technical Version
the station is open. For all stations, an average utilization of 70% has been used to calculate annual sales
and revenues.
Figure 5 – Utilization Growth Scenarios
Figure 5 illustrates individual station use shown over time, as a percentage of capacity. For
example, a 500 kg/day station owner in a “fast growth” environment could expect to sell an
average of 350 kg/day by the end of year 4.
Funding Requirements Estimate
As reported in Incentivizing Hydrogen Infrastructure Investment, the model utilized a range of capital
cost, utilization, and retail-margin assumptions.54 The baseline scenario included a mix of existing and
new stations of varying sizes, with a cumulative capacity to support the expected number of FCEVs by
the end of 2015. These stations are evaluated using the conservative medium and slow-growth curves
from Figure 5, with utilization capped at 70 percent, and a $3.00/kg retail margin. This scenario is
presented in Table 8 on the following page.
54A summary of analysis conducted within the context of an industry and government collaborative effort, launched in July 2011 to examine investment options for early commercial hydrogen infrastructure in California.
0%
10%
20%
30%
40%
50%
60%
70%
80%
90%
100%
Q1 Q2 Q3 Q4 Q1 Q2 Q3 Q4 Q1 Q2 Q3 Q4 Q1 Q2 Q3 Q4 Q1 Q2 Q3 Q4 Q1 Q2 Q3 Q4 Q1 Q2 Q3 Q4 Q1 Q2 Q3 Q4 Q1 Q2 Q3 Q4 Q1 Q2 Q3 Q4
Yr. 1 Yr. 2 Yr. 3 Yr. 4 Yr. 5 Yr. 6 Yr. 7 Yr. 8 Yr. 9 Yr. 10
Stat
ion
Uti
lizat
ion
-%
of
cap
acit
y
Utilization Growth Scenarios
Slow Growth
Medium Growth
Fast Growth
A California Road Map: The Commercialization of Hydrogen Fuel Cell Vehicles Page 26 of 28 Technical Version
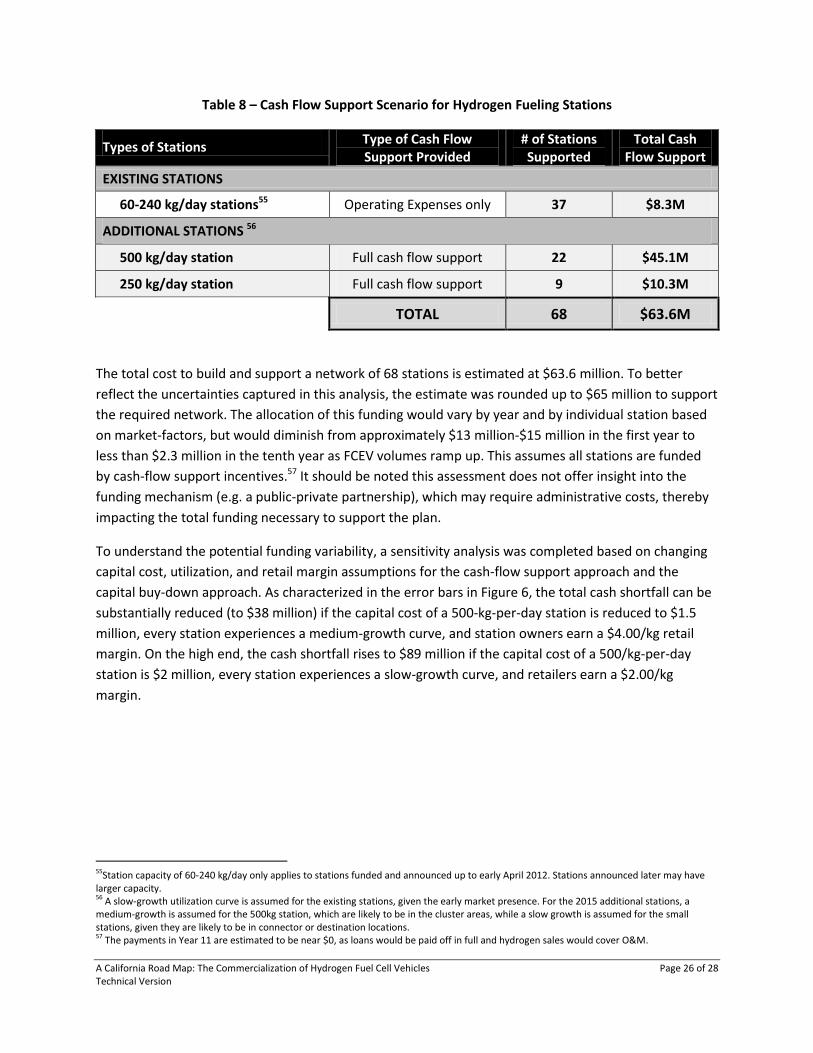
Table 8 – Cash Flow Support Scenario for Hydrogen Fueling Stations
Types of Stations Type of Cash Flow Support Provided
# of Stations Supported
Total Cash Flow Support
EXISTING STATIONS
60-240 kg/day stations55 Operating Expenses only 37 $8.3M
ADDITIONAL STATIONS 56
500 kg/day station Full cash flow support 22 $45.1M
250 kg/day station Full cash flow support 9 $10.3M
TOTAL 68 $63.6M
The total cost to build and support a network of 68 stations is estimated at $63.6 million. To better
reflect the uncertainties captured in this analysis, the estimate was rounded up to $65 million to support
the required network. The allocation of this funding would vary by year and by individual station based
on market-factors, but would diminish from approximately $13 million-$15 million in the first year to
less than $2.3 million in the tenth year as FCEV volumes ramp up. This assumes all stations are funded
by cash-flow support incentives.57 It should be noted this assessment does not offer insight into the
funding mechanism (e.g. a public-private partnership), which may require administrative costs, thereby
impacting the total funding necessary to support the plan.
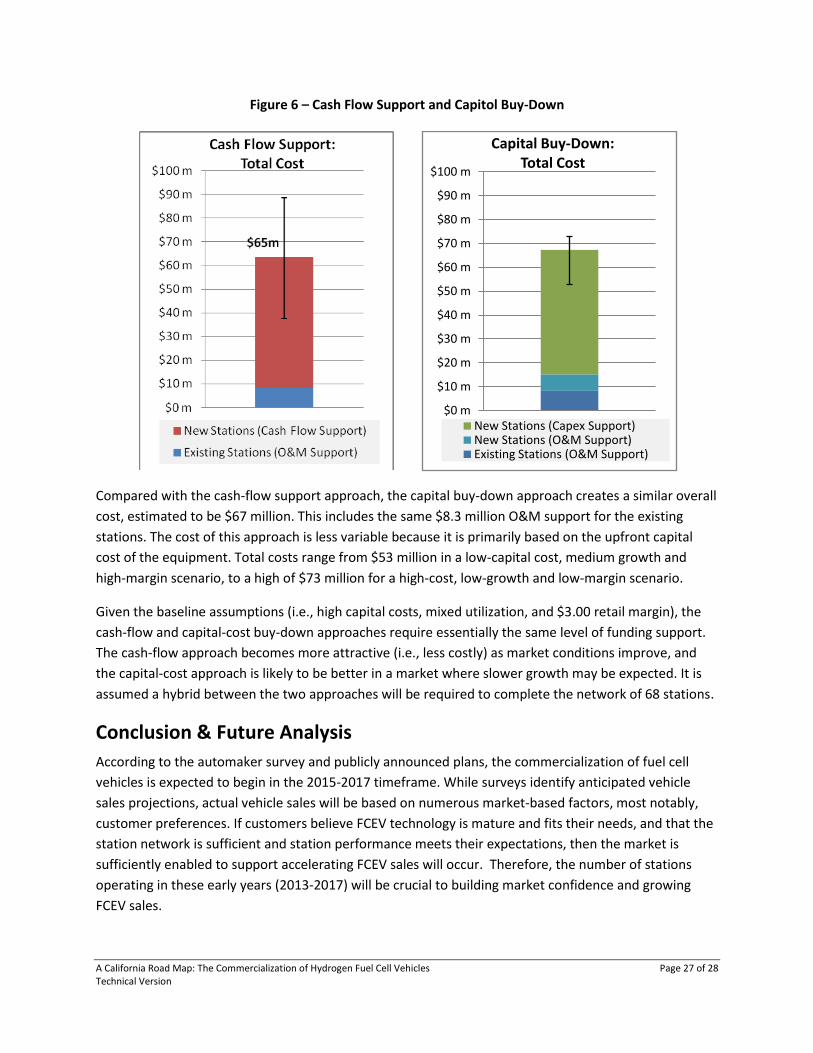
To understand the potential funding variability, a sensitivity analysis was completed based on changing
capital cost, utilization, and retail margin assumptions for the cash-flow support approach and the
capital buy-down approach. As characterized in the error bars in Figure 6, the total cash shortfall can be
substantially reduced (to $38 million) if the capital cost of a 500-kg-per-day station is reduced to $1.5
million, every station experiences a medium-growth curve, and station owners earn a $4.00/kg retail
margin. On the high end, the cash shortfall rises to $89 million if the capital cost of a 500/kg-per-day
station is $2 million, every station experiences a slow-growth curve, and retailers earn a $2.00/kg
margin.
55Station capacity of 60-240 kg/day only applies to stations funded and announced up to early April 2012. Stations announced later may have larger capacity. 56 A slow-growth utilization curve is assumed for the existing stations, given the early market presence. For the 2015 additional stations, a medium-growth is assumed for the 500kg station, which are likely to be in the cluster areas, while a slow growth is assumed for the small stations, given they are likely to be in connector or destination locations. 57 The payments in Year 11 are estimated to be near $0, as loans would be paid off in full and hydrogen sales would cover O&M.
A California Road Map: The Commercialization of Hydrogen Fuel Cell Vehicles Page 27 of 28 Technical Version
Figure 6 – Cash Flow Support and Capitol Buy-Down
Compared with the cash-flow support approach, the capital buy-down approach creates a similar overall
cost, estimated to be $67 million. This includes the same $8.3 million O&M support for the existing
stations. The cost of this approach is less variable because it is primarily based on the upfront capital
cost of the equipment. Total costs range from $53 million in a low-capital cost, medium growth and
high-margin scenario, to a high of $73 million for a high-cost, low-growth and low-margin scenario.
Given the baseline assumptions (i.e., high capital costs, mixed utilization, and $3.00 retail margin), the
cash-flow and capital-cost buy-down approaches require essentially the same level of funding support.
The cash-flow approach becomes more attractive (i.e., less costly) as market conditions improve, and
the capital-cost approach is likely to be better in a market where slower growth may be expected. It is
assumed a hybrid between the two approaches will be required to complete the network of 68 stations.
Conclusion & Future Analysis
According to the automaker survey and publicly announced plans, the commercialization of fuel cell
vehicles is expected to begin in the 2015-2017 timeframe. While surveys identify anticipated vehicle
sales projections, actual vehicle sales will be based on numerous market-based factors, most notably,
customer preferences. If customers believe FCEV technology is mature and fits their needs, and that the
station network is sufficient and station performance meets their expectations, then the market is
sufficiently enabled to support accelerating FCEV sales will occur. Therefore, the number of stations
operating in these early years (2013-2017) will be crucial to building market confidence and growing
FCEV sales.
$0 m
$10 m
$20 m
$30 m
$40 m
$50 m
$60 m
$70 m
$80 m
$90 m
$100 m
Capital Buy-Down: Total Cost
New Stations (Capex Support)New Stations (O&M Support)Existing Stations (O&M Support)
A California Road Map: The Commercialization of Hydrogen Fuel Cell Vehicles Page 28 of 28 Technical Version
If the hydrogen station network is sufficiently robust by 2015, it provides additional certainty and
improves the chances that vehicle and station milestones will be met by 2017. On the other hand, if the
hydrogen station network is insufficient in the timeframe, FCEVs may be adopted at a slower pace than
expected or FCEVs may be adopted at different rates by different markets. This could cause vehicle
inventories to be reallocated to regions outside of California, reducing the number of vehicles in the
state for a particular calendar year.
Efficient development of hydrogen infrastructure relies on two primary factors: coverage and capacity.
In the early years, coverage is the critical component, as fuel cell electric vehicles can only be
successfully marketed if fueling stations are available in locations where potential owners see them as
convenient. As described throughout this document, 68 stations are expected to provide sufficient
coverage to offer FCEV owners in key markets a fueling experience similar to gasoline in key markets.
The required funding to complete the nascent network of stations is approximately $65 million.
Many additional factors will influence the benefit of a specific fueling location, such as the performance
and reliability of the fueling equipment. As the coverage of stations in a particular cluster becomes
adequate, station usage and capacity will be a major consideration. To ensure these stations can meet
growing demand, sufficient capacity must be built into the system. Only then can the market transition
to the capacity targets defined by CFO and develop into a sustainable market for FCEVs and the
hydrogen fueling stations.
To successfully navigate this challenge, stakeholders must also understand related topics that are not
fully addressed in A California Road Map. For example, fuel cell buses are expected to play a significant
role for public transit and can share infrastructure in major metropolitan areas through dual-use station
equipment. Material handling and other similar applications can create markets benefiting the
development of hydrogen-station equipment components. The execution of this road map will have an
immediate impact on high-tech, green jobs and will set the stage for important steps in improving
California’s air quality. Perhaps, most importantly, the question of how and who will fund the additional
$65 million needed must be addressed. The stakeholders agree that continued evaluation of these items
will be crucial for identifying solutions to the challenges of bringing FCEVs and hydrogen stations to
market.
Emerging fuel cell electric vehicle and hydrogen infrastructure markets will only be realized through the
continued collaboration with a broad set of dedicated stakeholders. Significant progress has been made
and A California Road Map outlines additional steps that stakeholders must take to achieve market
success.