
A Box Full of Particles -...
12
A Box Full of Particles Revised 6/4/15 1 A Box Full of Particles Adapted from the book by C. W. Garland, J. W. Nibler, and D. P. Shoemaker. Experiments in Physical Chemistry, 7 th Edition. McGraw-Hill; Boston, 2003 (1). Quantum Dots from Cenco Physics INTRODUCTION Many compounds absorb visible light. This absorption is why compounds, and ultimately objects, appear colored to the human eye. Some compounds are even capable of absorbing more than one wavelength of light. These absorption bands correspond to the transition of an electron from the stable ground state to an excited state. The absorption of visible light is often due to loosely bound electrons in π bonds (or π molecular orbitals). A π molecular orbitals are created by the side-by-side interaction of 2 or more p atomic orbitals (Figures 1 & 2). A node (more accurately, a nodal plane) always exists along the bond (i.e., bond axis) of a π bond. For the antibonding MO shown in Figure 2 a nodal plane also exists perpendicular to the bond axis. Figure 1. In phase overlap of two p AOs (ψ a + ψ b ) to create a π bonding MO (Ψ + ). Figure 2. Out of phase overlap of two p AOs (ψ a - ψ b ) to create a π* antibonding MO (Ψ - ). When a carbon chain or ring of an organic molecule contains alternating double and single bonds, the electrons in π orbitals of the double bonds are not strongly associated with a particular atom or a covalent sigma (σ) bond. These delocalized electrons are held more loosely than localized electrons and are able to move from one bond or atom to another. This movement is + +
Transcript of A Box Full of Particles -...

A Box Full of Particles Revised 6/4/15
1
A Box Full of Particles
Adapted from the book by C. W. Garland, J. W. Nibler, and D. P. Shoemaker. Experiments in Physical Chemistry, 7th Edition. McGraw-Hill; Boston, 2003 (1).
Quantum Dots from Cenco Physics
INTRODUCTION Many compounds absorb visible light. This absorption is why compounds, and ultimately objects, appear colored to the human eye. Some compounds are even capable of absorbing more than one wavelength of light. These absorption bands correspond to the transition of an electron from the stable ground state to an excited state. The absorption of visible light is often due to loosely bound electrons in π bonds (or π molecular orbitals). A π molecular orbitals are created by the side-by-side interaction of 2 or more p atomic orbitals (Figures 1 & 2). A node (more accurately, a nodal plane) always exists along the bond (i.e., bond axis) of a π bond. For the antibonding MO shown in Figure 2 a nodal plane also exists perpendicular to the bond axis.
Figure 1. In phase overlap of two p AOs (ψa + ψb) to create a π bonding MO (Ψ+).
Figure 2. Out of phase overlap of two p AOs (ψa - ψb) to create a π* antibonding MO (Ψ-).
When a carbon chain or ring of an organic molecule contains alternating double and single bonds, the electrons in π orbitals of the double bonds are not strongly associated with a particular atom or a covalent sigma (σ) bond. These delocalized electrons are held more loosely than localized electrons and are able to move from one bond or atom to another. This movement is
+
+
A Box Full of Particles Revised 6/4/15
2
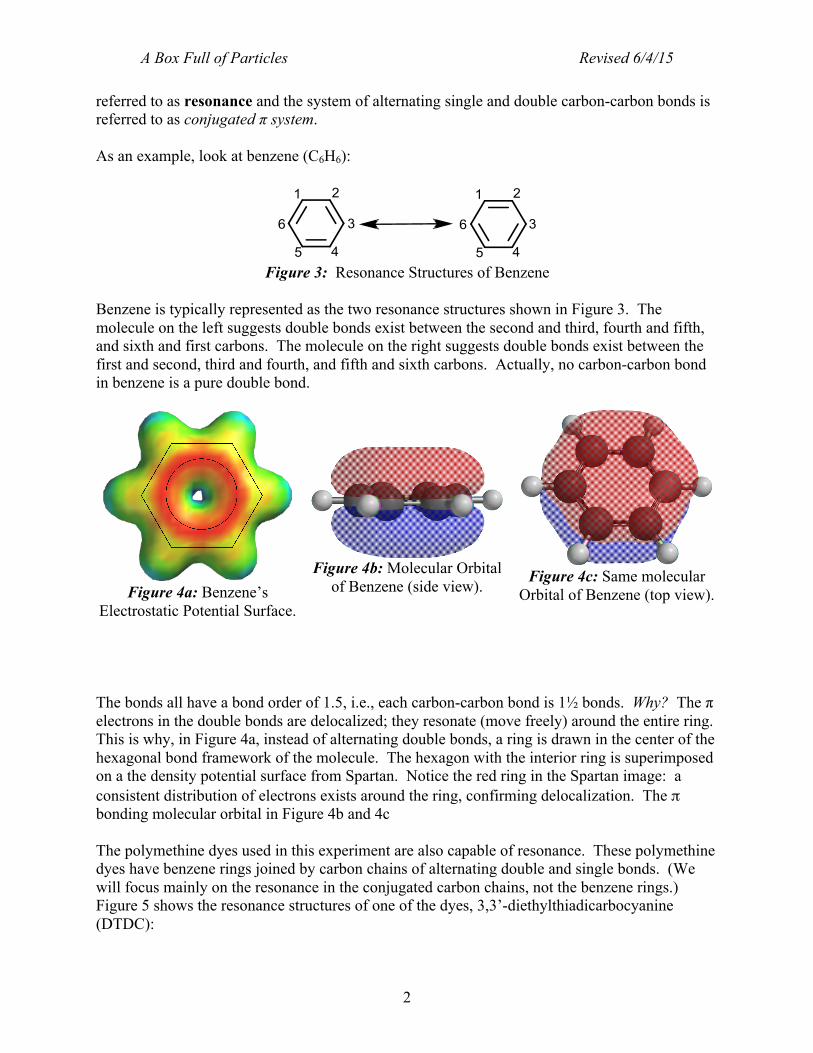
referred to as resonance and the system of alternating single and double carbon-carbon bonds is referred to as conjugated π system. As an example, look at benzene (C6H6):
Figure 3: Resonance Structures of Benzene
Benzene is typically represented as the two resonance structures shown in Figure 3. The molecule on the left suggests double bonds exist between the second and third, fourth and fifth, and sixth and first carbons. The molecule on the right suggests double bonds exist between the first and second, third and fourth, and fifth and sixth carbons. Actually, no carbon-carbon bond in benzene is a pure double bond.
Figure 4a: Benzene’s
Electrostatic Potential Surface.
Figure 4b: Molecular Orbital
of Benzene (side view).
Figure 4c: Same molecular Orbital of Benzene (top view).
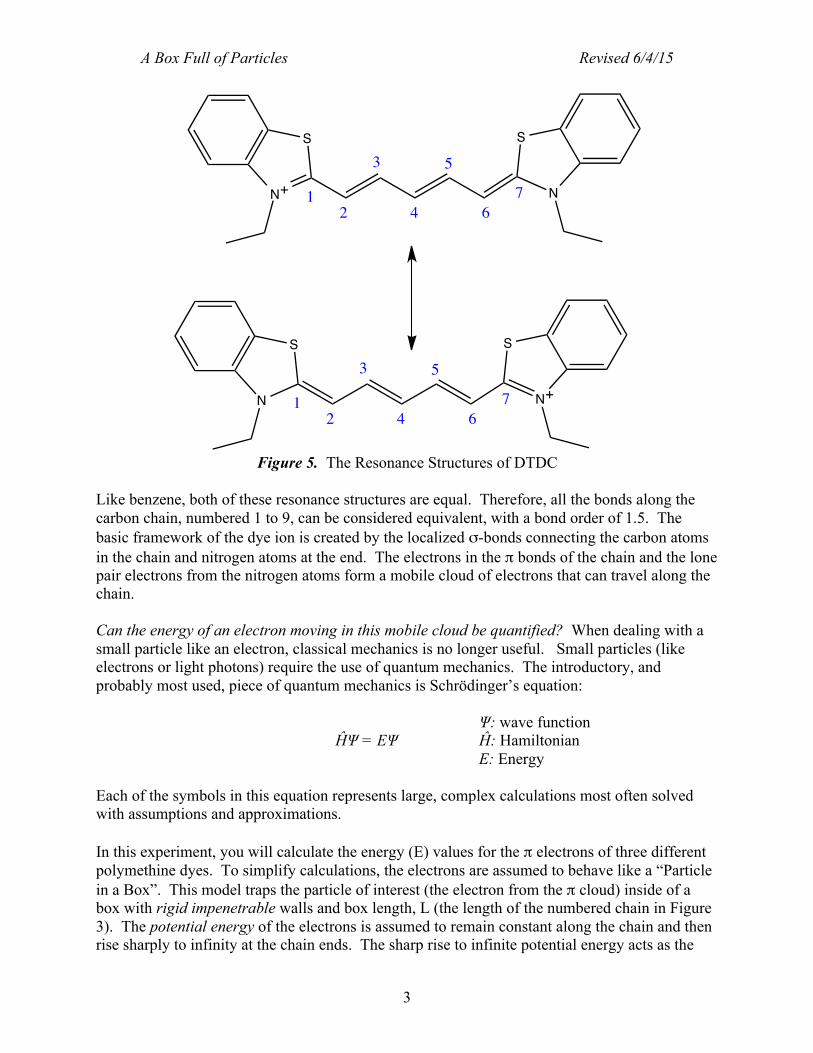
The bonds all have a bond order of 1.5, i.e., each carbon-carbon bond is 1½ bonds. Why? The π electrons in the double bonds are delocalized; they resonate (move freely) around the entire ring. This is why, in Figure 4a, instead of alternating double bonds, a ring is drawn in the center of the hexagonal bond framework of the molecule. The hexagon with the interior ring is superimposed on a the density potential surface from Spartan. Notice the red ring in the Spartan image: a consistent distribution of electrons exists around the ring, confirming delocalization. The π bonding molecular orbital in Figure 4b and 4c The polymethine dyes used in this experiment are also capable of resonance. These polymethine dyes have benzene rings joined by carbon chains of alternating double and single bonds. (We will focus mainly on the resonance in the conjugated carbon chains, not the benzene rings.) Figure 5 shows the resonance structures of one of the dyes, 3,3’-diethylthiadicarbocyanine (DTDC):
A Box Full of Particles Revised 6/4/15
3
Figure 5. The Resonance Structures of DTDC
Like benzene, both of these resonance structures are equal. Therefore, all the bonds along the carbon chain, numbered 1 to 9, can be considered equivalent, with a bond order of 1.5. The basic framework of the dye ion is created by the localized σ-bonds connecting the carbon atoms in the chain and nitrogen atoms at the end. The electrons in the π bonds of the chain and the lone pair electrons from the nitrogen atoms form a mobile cloud of electrons that can travel along the chain. Can the energy of an electron moving in this mobile cloud be quantified? When dealing with a small particle like an electron, classical mechanics is no longer useful. Small particles (like electrons or light photons) require the use of quantum mechanics. The introductory, and probably most used, piece of quantum mechanics is Schrödinger’s equation: Ψ: wave function
ĤΨ = EΨ Ĥ: Hamiltonian E: Energy
Each of the symbols in this equation represents large, complex calculations most often solved with assumptions and approximations. In this experiment, you will calculate the energy (E) values for the π electrons of three different polymethine dyes. To simplify calculations, the electrons are assumed to behave like a “Particle in a Box”. This model traps the particle of interest (the electron from the π cloud) inside of a box with rigid impenetrable walls and box length, L (the length of the numbered chain in Figure 3). The potential energy of the electrons is assumed to remain constant along the chain and then rise sharply to infinity at the chain ends. The sharp rise to infinite potential energy acts as the
N+
S
N
S
12
3
4
5
67
N
S
N+
S
12
3
4
5
67

A Box Full of Particles Revised 6/4/15
4
walls of our box, confining the electrons to just the chain. The result is that the π electron system can be thought of as free electrons moving in a one-dimensional box of length L. And, most importantly, the specific energy of the particle (e-) at different levels can be calculated using just the mass of the particle (me) and the length of the box using the following quantum mechanical solution:
En = n2h2 n = 1, 2, 3…. 8mL2 m = 9.10938188 x 10⁻³¹ kg (mass of e-)
h = 6.626068 x 10⁻³⁴ m2kg/s (Planck’s constant)
The above equation contains “n” which can only have whole number integer values and, therefore, is a principal quantum number - an indication that the energy of the electron is quantized. Because of this, only certain energy levels are available to the electron. You should be familiar with principle quantum numbers use to designate the energy values of atomic orbitals. Principle quantum numbers are also used with molecular orbitals. Electronic transitions between energy levels (molecular orbitals) with specific quantum numbers give rise to the deep color of the polymethine dyes studied in this experiment. Figure 6 shows such an electronic transition, where an electron is excited by a photon of light (symbolized by the squiggly arrow and hν) from its ground state energy at n = 1 to an excited state energy at n = 2. The energy of the light absorbed is the difference in energy (ΔE) of the electronic levels. Therefore, visible spectroscopy can provide values for ΔE, but not En (EHOMO, ELUMO, etc.).
Figure 6. Energy Level Diagram.
Highest Occupied Molecular Orbital (HOMO) Lowest Unoccupied Molecular Orbital (LUMO)
How can the equation En = n2h2/8mL2 be transformed to ΔE? The Pauli Exclusion Principle limits the number of electrons in any given energy level to two. Therefore, the ground state of a dye with N π electrons will have the N/2 lowest levels filled (if N is even) and all higher levels empty. (In other words, the number of filled orbitals is half the number of electrons.) When the dye absorbs light, an electron jumps from the highest occupied molecular orbital (nHOMO = N/2) to the lowest unoccupied molecular orbital (nLUMO = N/2+1). (Figure 7.)
Excited State Ground State
LUMO+1 LUMO
HOMO
hν
n=3
n=2
n=1

A Box Full of Particles Revised 6/4/15
5
Figure 7. Energy Level Diagram for a Particle in a Box
The energy change for this transition is
Energy on visible spectra is typically reported as wavelength (λ). To convert ΔE to λ, recall that ΔE = hν = hc/λ:
If the number of carbon atoms in a polymethine dye chain is p; then N = p + 3. The delocalized π electrons don’t stop right at the end of the chain (at the nitrogen atom) but actually move a little beyond. Therefore, L is the length of the chain between nitrogen atoms plus ½ bond length on each side (this ½ bond length is the reason for the “3” in N = p + 3). Therefore, the length of the box is L = (p + 3)l, where l is the bond length between atoms along the chain. The resulting equation allows for the calculation of λ:
Substituting in the value of l – the average of a C-C with a bond order of 1.5, 0.139 nm – simplifies the equation further:
Wavelengths calculated with the above equation are theoretical values. Recall that the potential energy is assumed to rise sharply to infinity at the ends of the chains. The presence of other atom groups (such as benzene rings) beyond the nitrogen atoms of the polymethine chain prevent the potential energy from rising as sharply as predicted. The effect is to lengthen the width (L)
( ) ( )2 22 2 2
2 22 2 21 1
8 8 2 2 8LUMO HOMOh h N N hE n n NmL mL mL
⎛ ⎞⎛ ⎞ ⎛ ⎞Δ = − = + − = +⎜ ⎟⎜ ⎟ ⎜ ⎟⎜ ⎟⎝ ⎠ ⎝ ⎠⎝ ⎠
€
λ =8mch
L2
N +1
( )( )
22 384
pmclh p
λ+
=+
( )( )
23(in ) 63.7
4p
nmp
λ+
=+
ΔE = hν
A Box Full of Particles Revised 6/4/15
6
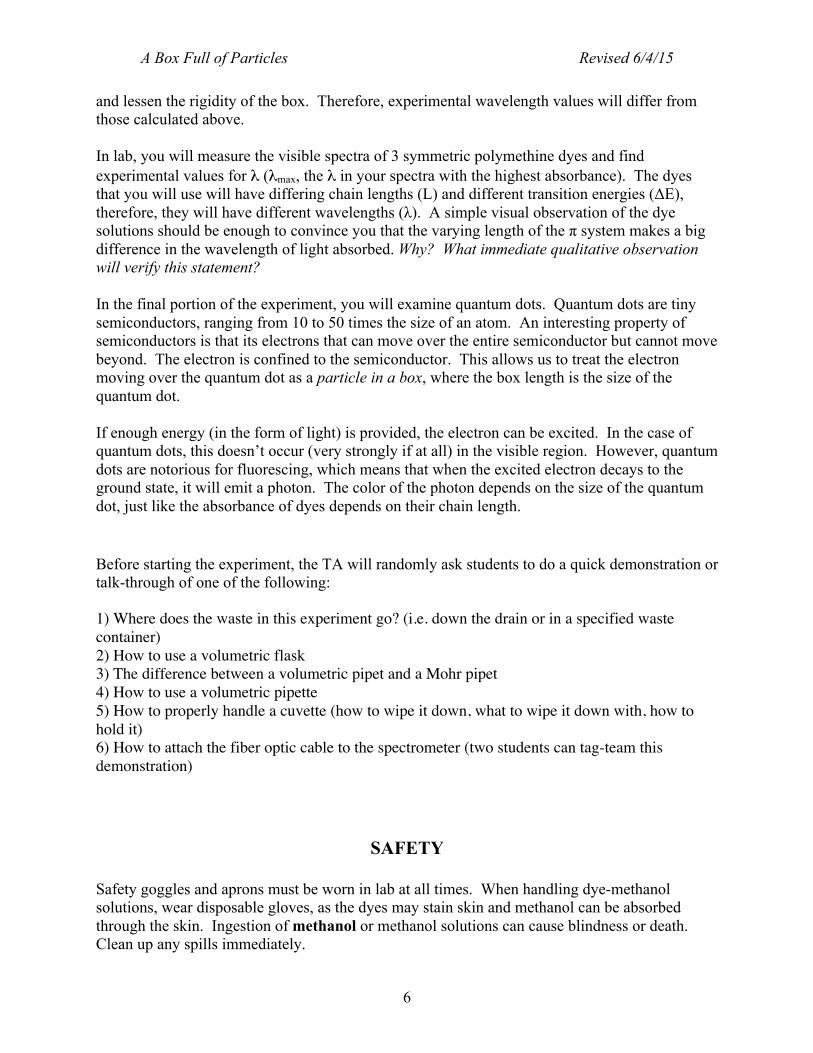
and lessen the rigidity of the box. Therefore, experimental wavelength values will differ from those calculated above. In lab, you will measure the visible spectra of 3 symmetric polymethine dyes and find experimental values for λ (λmax, the λ in your spectra with the highest absorbance). The dyes that you will use will have differing chain lengths (L) and different transition energies (ΔE), therefore, they will have different wavelengths (λ). A simple visual observation of the dye solutions should be enough to convince you that the varying length of the π system makes a big difference in the wavelength of light absorbed. Why? What immediate qualitative observation will verify this statement? In the final portion of the experiment, you will examine quantum dots. Quantum dots are tiny semiconductors, ranging from 10 to 50 times the size of an atom. An interesting property of semiconductors is that its electrons that can move over the entire semiconductor but cannot move beyond. The electron is confined to the semiconductor. This allows us to treat the electron moving over the quantum dot as a particle in a box, where the box length is the size of the quantum dot. If enough energy (in the form of light) is provided, the electron can be excited. In the case of quantum dots, this doesn’t occur (very strongly if at all) in the visible region. However, quantum dots are notorious for fluorescing, which means that when the excited electron decays to the ground state, it will emit a photon. The color of the photon depends on the size of the quantum dot, just like the absorbance of dyes depends on their chain length.
Before starting the experiment, the TA will randomly ask students to do a quick demonstration or talk-through of one of the following: 1) Where does the waste in this experiment go? (i.e. down the drain or in a specified waste container) 2) How to use a volumetric flask 3) The difference between a volumetric pipet and a Mohr pipet 4) How to use a volumetric pipette 5) How to properly handle a cuvette (how to wipe it down, what to wipe it down with, how to hold it) 6) How to attach the fiber optic cable to the spectrometer (two students can tag-team this demonstration)
SAFETY Safety goggles and aprons must be worn in lab at all times. When handling dye-methanol solutions, wear disposable gloves, as the dyes may stain skin and methanol can be absorbed through the skin. Ingestion of methanol or methanol solutions can cause blindness or death. Clean up any spills immediately.

A Box Full of Particles Revised 6/4/15
7

A Box Full of Particles Revised 6/4/15
8
PROCEDURES For this experiment, all solutions must be collected because they contain methanol. Collect all waste in a large beaker, to empty into the waste container once the experiment is finished. Part A: Solution Preparation Note: Prepare a 10-5 M solution of each of your dyes in the 50:50 mixture of methanol and water
solvent using volumetric flasks and pipettes. If you do this in one step you will waste a lot of stock solution, so do it in the two steps given below:
Dyes used in this experiment:
1. Solution #A: Check out a volumetric glassware kit from the stockroom. The
concentrations of all dye stock solutions are 2.5 x 10⁻³ M. Using a 1 mL graduated volumetric (Mohr) pipet transfer the appropriate amount (calculated before you come to lab) of stock solution to a 5 mL volumetric flask and dilute to the calibration mark with the solvent. Cap the flask and mix.
2. Solution #B: Using a volumetric pipet, place 1 mL of solution #A in a 10 mL volumetric flask
and dilute to the calibration mark with solvent. (This solution should have a concentration of 1 x 10⁻⁵ M.) Cap the flask and mix. You will record the absorbance spectrum for this solution in Part C.
3. Repeat steps 1 and 2 for each dye. Prerinse volumetric pipettes between steps to avoid
solution contamination.
N
S
N
S
+I-
DTCC3,3'-diethylthiacarbocyanine iodide
C21N2S2H21I
N
S
N
S
+I-
DTDC3,3'-diethylthiadicarbocyanine iodide
C23N2S2H23I
N
S
N
S
+I-
DTTC3,3'-diethylthiatricarbocyanine iodide
C25N2S2H25I

A Box Full of Particles Revised 6/4/15
9
Part B: Calibrate and Blank the Spectrometer 1. Obtain a visible spectrometer from the stockroom. Use the USB cable to connect the visible
spectrometer to the LabQuest2.
2. Calibrate the spectrometer by clicking . The calibration dialog box will display the message: “Waiting….seconds for lamp to warm up.” (The minimum warm up time is one minute.) Note: For best results, allow the spectrometer to warm up for at least three minutes.
3. Create a blank. (If you aren’t sure what to use as a blank, ask your TA.) Wipe the outside of
the blank with a kimwipe and insert the cuvette in the sample compartment. Click Finish Calibration and then OK.
Part C: Absorption Spectra (Finding λmax) 1. Fill a cuvette with solution #B that you made in part A. Wipe the outside of the cuvette
(Why?), place in the cuvette holder, and click . Click once the data collection is complete. Examine the graph and note the wavelength region of maximum absorbance. This will be the experimental λmax, and it should change for each dye. Examine the graph and note the wavelength region of maximum absorbance. Remove the rainbow background spectrum by double clicking the rainbow background. Click and store latest run.
2. Repeat step 1 twice more for the same dye. Take the average of the three readings. This will be the experimental λmax for each dye.
3. Repeat the above steps for each dye. Once finished, pour all waste into the appropriate waste
container in the fume hood. Part D: Quantum Dots 1. Check out a quantum dot kit from the stockroom. The solutions of quantum dots are all the
same compound and same concentration. The difference between solutions is quantum dot size.
2. Clamp the quantum dot holder to easily access the holes in the bottom of the holder. Do not remove the individual vials from the holder or open the holder. Remove the cuvette holder from the spectrometer by loosening the two screws on its side near the bottom (see the arrows in the picture below). Do not remove the screws!

A Box Full of Particles Revised 6/4/15
10
3. Attach the fiber optic cable to the spectrometer. Assemble to spectrometer and LabQuest 2 together according to the picture on the plastic bag the Red Tide spectrometer came in.
4. The default measurement for the spectrometer is absorbance. Fluorescence needs to be measured in intensity. In the screen, click on the be big red box labeled, “USB:abs” In the drop down menu select “Change Units” then “Intensity”. In the screen, click on “Graph” from the toolbar at the top of the screen, select “Graph Options…” and select the “Autoscale from 0” option. Click “Okay.” Again, select “Graph” from the toolbar at the top of the screen, select “ Show Graph” and check “Show Spectrum.”
5. Click . Shine the violet excitation source through the hole in the bottom of the holder
into the solution. Record the color observed. Click once the data collection is complete. Examine the graph and note the color of the plot background behind the peak of highest intensity. Record the wavelength of maximum intensity, this is the experimental λmax, and it should change for each quantum dot solution. Send the graph to your ELN.
6. Repeat step 5 for each quantum dot solution. 7. Shine the red excitation source at each solution through the hole in the bottom of the holder.
Note what the solutions appear like. Remove the fiber optic cable and put the cuvette holder back onto the spectrometer. Return the spectrometer to the stockroom.
Make sure to clear your email address and password of the LabQuest2 so others can’t access
your email account. Shutdown the LabQuest2 and not simply put it to sleep. To shutdown the
LabQuest2: press the home key, select System ! Shut Down ! OK.
A Box Full of Particles Revised 6/4/15
11
CALCULATIONS & DISCUSSION 1. Using the last equation given in the introduction, calculate the theoretical wavelength of
maximum absorption (λ) for each dye. (Show a sample calculation and report all data in a table.)
2. What is the relationship between chain length and the calculated theoretical λ? 3. Calculate the percent error between the theoretical λ and the experimental λmax. Why do
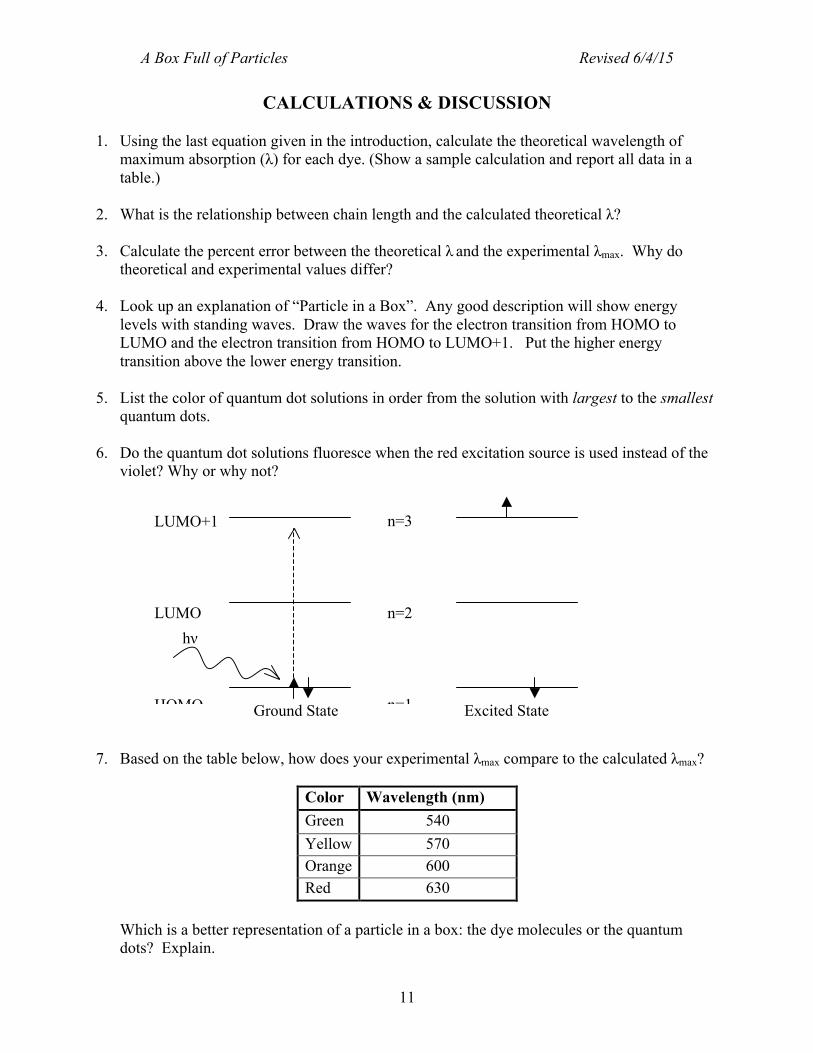
theoretical and experimental values differ? 4. Look up an explanation of “Particle in a Box”. Any good description will show energy
levels with standing waves. Draw the waves for the electron transition from HOMO to LUMO and the electron transition from HOMO to LUMO+1. Put the higher energy transition above the lower energy transition.
5. List the color of quantum dot solutions in order from the solution with largest to the smallest quantum dots.
6. Do the quantum dot solutions fluoresce when the red excitation source is used instead of the
violet? Why or why not?
7. Based on the table below, how does your experimental λmax compare to the calculated λmax?
Color Wavelength (nm) Green 540 Yellow 570 Orange 600 Red 630
Which is a better representation of a particle in a box: the dye molecules or the quantum dots? Explain.
Excited State Ground State
LUMO+1 LUMO
HOMO
hν
n=3
n=2
n=1
A Box Full of Particles Revised 6/4/15
12
ERROR ANALYSIS
1. What modifications could be made to the procedure to better account for random
(indeterminate) errors?
2. List three potential systematic (instrumental, methodological, or personal) errors that could be made in this experiment. (Note: Be specific, systematic errors are in the details. For example, losing your solution because you knocked over the cuvette is not a systematic error – it’s a gross one.)
3. Did any gross errors occur? Did you mess up? Did the equipment or instrumentation fail?