A Biodiversity Indicator for Economic Analysis: … · A Biodiversity Indicator for Economic ......
7
A Biodiversity Indicator for Economic Analysis: Assessing the Gulf of Mexico Oil Spill Yvonne Chen Shenandoah University The objective of this study is to examine the bioeconomic value of biodiversity and its potential loss stemming from species endangerment. Using a biodiversity model that highlights the importance of taxonomic distances in determining its value, the research conducts a two-step analysis to investigate the impact of Deep Horizon oil spill. First, a comparative analysis is performed to understand biodiversity richness in the Gulf of Mexico area, in contrast to the Chesapeake Bay. Next, the study estimates the impact caused by loss of species vulnerable to oil spill. The case concludes with insights into understanding biodiversity loss and a strategy on managing conservation priorities to cope with oil spills. INTRODUCTION Quantifying the economic value of any environmental resource is always a daunting task, especially one as intrinsic as biodiversity. Its definition is elusive: biodiversity could mean the full range of species on Earth, it could also be the internal, genetic variation within species, or it could be about functional variations and interactions among species. Of all these dimensions, perhaps the most relevant one for an economic assessment is the latter— biodiversity as the functional differences between species, for it is the functional variation that produces various ecological services, which in turn provide us with food, medicine, resources, entertainment, and much more. The model chosen for the task of measuring bioeconomic value of biodiversity would have to highlight the functional roles of the species as the core value of biodiversity. However, functional differences of species are observed to be a property mostly inherited from evolutionary biology. Thus, a biodiversity model based on phylogenic differences would be suitable. With over seven billion humans on this planet, we play a significant role in the vast majority of ecosystems. Our presence, from interfering with carbon and nitrogen cycles to genetic engineering, has reshaped the world and its biodiversity to the extent of threatening the resilience of our planet. With our limited economic resources and deeply entwined ecological relationships, the belief of “in wilderness is the preservation of the world” no longer is a viable conservation option. Instead, identifying and protecting biodiversity hotspots and key species has become an ever-pressing issue. In the event of an oil spill, pollution, or other disasters, the ability to promptly assess impact of potential biodiversity loss and streamline conservation priorities is critical. That is the objective of this research. The following section provides a synopsis of the biodiversity indicator. The subsequent section is dedicated to a discussion on Gulf of Mexico (GOM) oil spill and an empirical study of the two sample ecosystems: Gulf of Mexico and Chesapeake Bay. The last section concludes the research by offering additional insights from the model analysis and options for conservation biology. Journal of Applied Business and Economics vol. 14(1) 2013 49
Transcript of A Biodiversity Indicator for Economic Analysis: … · A Biodiversity Indicator for Economic ......

A Biodiversity Indicator for Economic Analysis: Assessing the Gulf of Mexico Oil Spill
Yvonne Chen
Shenandoah University
The objective of this study is to examine the bioeconomic value of biodiversity and its potential loss stemming from species endangerment. Using a biodiversity model that highlights the importance of taxonomic distances in determining its value, the research conducts a two-step analysis to investigate the impact of Deep Horizon oil spill. First, a comparative analysis is performed to understand biodiversity richness in the Gulf of Mexico area, in contrast to the Chesapeake Bay. Next, the study estimates the impact caused by loss of species vulnerable to oil spill. The case concludes with insights into understanding biodiversity loss and a strategy on managing conservation priorities to cope with oil spills. INTRODUCTION
Quantifying the economic value of any environmental resource is always a daunting task, especially one as intrinsic as biodiversity. Its definition is elusive: biodiversity could mean the full range of species on Earth, it could also be the internal, genetic variation within species, or it could be about functional variations and interactions among species.
Of all these dimensions, perhaps the most relevant one for an economic assessment is the latter—biodiversity as the functional differences between species, for it is the functional variation that produces various ecological services, which in turn provide us with food, medicine, resources, entertainment, and much more. The model chosen for the task of measuring bioeconomic value of biodiversity would have to highlight the functional roles of the species as the core value of biodiversity. However, functional differences of species are observed to be a property mostly inherited from evolutionary biology. Thus, a biodiversity model based on phylogenic differences would be suitable.
With over seven billion humans on this planet, we play a significant role in the vast majority of ecosystems. Our presence, from interfering with carbon and nitrogen cycles to genetic engineering, has reshaped the world and its biodiversity to the extent of threatening the resilience of our planet. With our limited economic resources and deeply entwined ecological relationships, the belief of “in wilderness is the preservation of the world” no longer is a viable conservation option. Instead, identifying and protecting biodiversity hotspots and key species has become an ever-pressing issue. In the event of an oil spill, pollution, or other disasters, the ability to promptly assess impact of potential biodiversity loss and streamline conservation priorities is critical. That is the objective of this research.
The following section provides a synopsis of the biodiversity indicator. The subsequent section is dedicated to a discussion on Gulf of Mexico (GOM) oil spill and an empirical study of the two sample ecosystems: Gulf of Mexico and Chesapeake Bay. The last section concludes the research by offering additional insights from the model analysis and options for conservation biology.
Journal of Applied Business and Economics vol. 14(1) 2013 49

BIODIVERSITY INDICATOR: LITERATURE REVIEW
To capture the functional-variation aspect of biodiversity, the author adopts Chen’s biodiversity index (2011). This index, inspired by Weitzman’s bead model (1995) and followed Carl Linnaeus’ taxonomic classification, uses information in taxonomic differences to quantify the bioeconomic value of biodiversity. The rationale is based on the observations that the distinction in functional role(s) of species is often the core value, both in terms of biology and economics, of biodiversity. Furthermore, the functional differences of species are consistent with the phylogenic variations. Since Linnaean taxonomy uses phylogeny (evolutionary history) in classifying organisms, it would make sense to construct a biodiversity measure based on Linnaeus’ structure. Therefore, a measurement that combines the principles of the bead model and taxonomy would fulfill the objective of this research on highlighting the functional diversity as the value of biodiversity.
To measure the diversity of an ecological community, three steps are proposed: i) locate the species on a taxonomy tree, ii) identify the distances of these species along each taxonomic ranking by assigning a specific value to each classification, and iii) sum up the squared values of these distances to quantify the value of biodiversity. The rationale of taking the squared value of a phylogenic distance is that the biological differences between two species tend to escalate as their taxonomic distance grows; i.e., a nonlinear relationship. A numerical example below provides better clarity for this process.
Refer to Figure 1. Assume there are two taxa, each containing four species. Taxon A: {species 1, 2, 3,
5 }; Taxon B: {species 4, 6, 7, 8 }. Let D be a biodiversity index for taxon i, and d be the phylogenic difference or distance between two species. The assumptions proposed in this model are: i) assigning a unit value to each distance between any two nearest taxonomic hierarchy orders, and ii) taking the squared value of taxonomic distance as a proxy for biodiversity value. For instance, the taxonomic distance (d T) and biodiversity (D) between two organisms of the same species would be zero, a d T value of one and a D value of one for those from the same genus but different species, a d T value of two and a D value of four for those of the same family but different genus. As the process continues, this computation method shows that the value of biodiversity (DA and DB) increases at an increasing rate as lesser similarities are shared between species. For details, see the computation listed below for Taxon A and B. Despite the fact that the two groups have the same number of species, Taxon B is revealed to have higher biodiversity, or bioeconomic value, than Taxon A. DA = d T (2,3) 2 + d T (1,2) 2 + d T (1,5) 2 = 49. DB = d T (7,8) 2 + d T (6,7) 2 + d T (4,6) 2 = 61.
50 Journal of Applied Business and Economics vol. 14(1) 2013
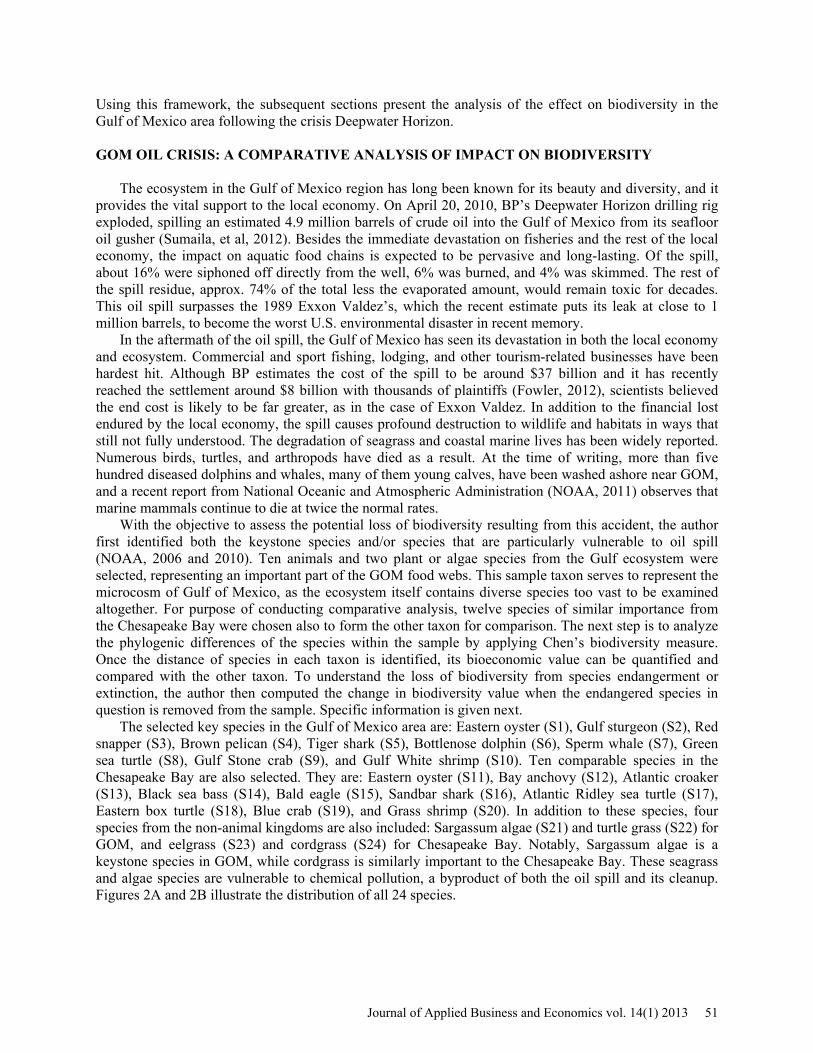
Using this framework, the subsequent sections present the analysis of the effect on biodiversity in the Gulf of Mexico area following the crisis Deepwater Horizon. GOM OIL CRISIS: A COMPARATIVE ANALYSIS OF IMPACT ON BIODIVERSITY
The ecosystem in the Gulf of Mexico region has long been known for its beauty and diversity, and it provides the vital support to the local economy. On April 20, 2010, BP’s Deepwater Horizon drilling rig exploded, spilling an estimated 4.9 million barrels of crude oil into the Gulf of Mexico from its seafloor oil gusher (Sumaila, et al, 2012). Besides the immediate devastation on fisheries and the rest of the local economy, the impact on aquatic food chains is expected to be pervasive and long-lasting. Of the spill, about 16% were siphoned off directly from the well, 6% was burned, and 4% was skimmed. The rest of the spill residue, approx. 74% of the total less the evaporated amount, would remain toxic for decades. This oil spill surpasses the 1989 Exxon Valdez’s, which the recent estimate puts its leak at close to 1 million barrels, to become the worst U.S. environmental disaster in recent memory.
In the aftermath of the oil spill, the Gulf of Mexico has seen its devastation in both the local economy and ecosystem. Commercial and sport fishing, lodging, and other tourism-related businesses have been hardest hit. Although BP estimates the cost of the spill to be around $37 billion and it has recently reached the settlement around $8 billion with thousands of plaintiffs (Fowler, 2012), scientists believed the end cost is likely to be far greater, as in the case of Exxon Valdez. In addition to the financial lost endured by the local economy, the spill causes profound destruction to wildlife and habitats in ways that still not fully understood. The degradation of seagrass and coastal marine lives has been widely reported. Numerous birds, turtles, and arthropods have died as a result. At the time of writing, more than five hundred diseased dolphins and whales, many of them young calves, have been washed ashore near GOM, and a recent report from National Oceanic and Atmospheric Administration (NOAA, 2011) observes that marine mammals continue to die at twice the normal rates.
With the objective to assess the potential loss of biodiversity resulting from this accident, the author first identified both the keystone species and/or species that are particularly vulnerable to oil spill (NOAA, 2006 and 2010). Ten animals and two plant or algae species from the Gulf ecosystem were selected, representing an important part of the GOM food webs. This sample taxon serves to represent the microcosm of Gulf of Mexico, as the ecosystem itself contains diverse species too vast to be examined altogether. For purpose of conducting comparative analysis, twelve species of similar importance from the Chesapeake Bay were chosen also to form the other taxon for comparison. The next step is to analyze the phylogenic differences of the species within the sample by applying Chen’s biodiversity measure. Once the distance of species in each taxon is identified, its bioeconomic value can be quantified and compared with the other taxon. To understand the loss of biodiversity from species endangerment or extinction, the author then computed the change in biodiversity value when the endangered species in question is removed from the sample. Specific information is given next.
The selected key species in the Gulf of Mexico area are: Eastern oyster (S1), Gulf sturgeon (S2), Red snapper (S3), Brown pelican (S4), Tiger shark (S5), Bottlenose dolphin (S6), Sperm whale (S7), Green sea turtle (S8), Gulf Stone crab (S9), and Gulf White shrimp (S10). Ten comparable species in the Chesapeake Bay are also selected. They are: Eastern oyster (S11), Bay anchovy (S12), Atlantic croaker (S13), Black sea bass (S14), Bald eagle (S15), Sandbar shark (S16), Atlantic Ridley sea turtle (S17), Eastern box turtle (S18), Blue crab (S19), and Grass shrimp (S20). In addition to these species, four species from the non-animal kingdoms are also included: Sargassum algae (S21) and turtle grass (S22) for GOM, and eelgrass (S23) and cordgrass (S24) for Chesapeake Bay. Notably, Sargassum algae is a keystone species in GOM, while cordgrass is similarly important to the Chesapeake Bay. These seagrass and algae species are vulnerable to chemical pollution, a byproduct of both the oil spill and its cleanup. Figures 2A and 2B illustrate the distribution of all 24 species.
Journal of Applied Business and Economics vol. 14(1) 2013 51

Let D stand for biodiversity or bioeconomic value of a taxon, and D ≡ 2),( jiT SSd , where
dT (Si , Sj ) is the taxonomic distance between species (S) i and j. The bioeconomic value of the GOM taxon is computed as follows:
Step 1: Based on their similarities on taxonomy, species in the taxon are put into groups. Applications: S6 and S7 are from the same order. S9 and S10 are close cousins. S2 and S3 are of the same class. Subgroup (S2, S3, S4, S5, S6, S7, and S8) are of the same phylum. All ten species (S1 to S10) belong to the same kingdom, while S21 and S22 are from different kingdoms. Step 2: Compute the distance of the species within the subgroups, starting with the ones in the lowest ranking; i.e. genus. Applications: Species S6 and S7 are cousins, and so are S9 and S10. Thus, their distances are measured first. Next to be measured are species S2 and S3, which belong to the same class.
52 Journal of Applied Business and Economics vol. 14(1) 2013
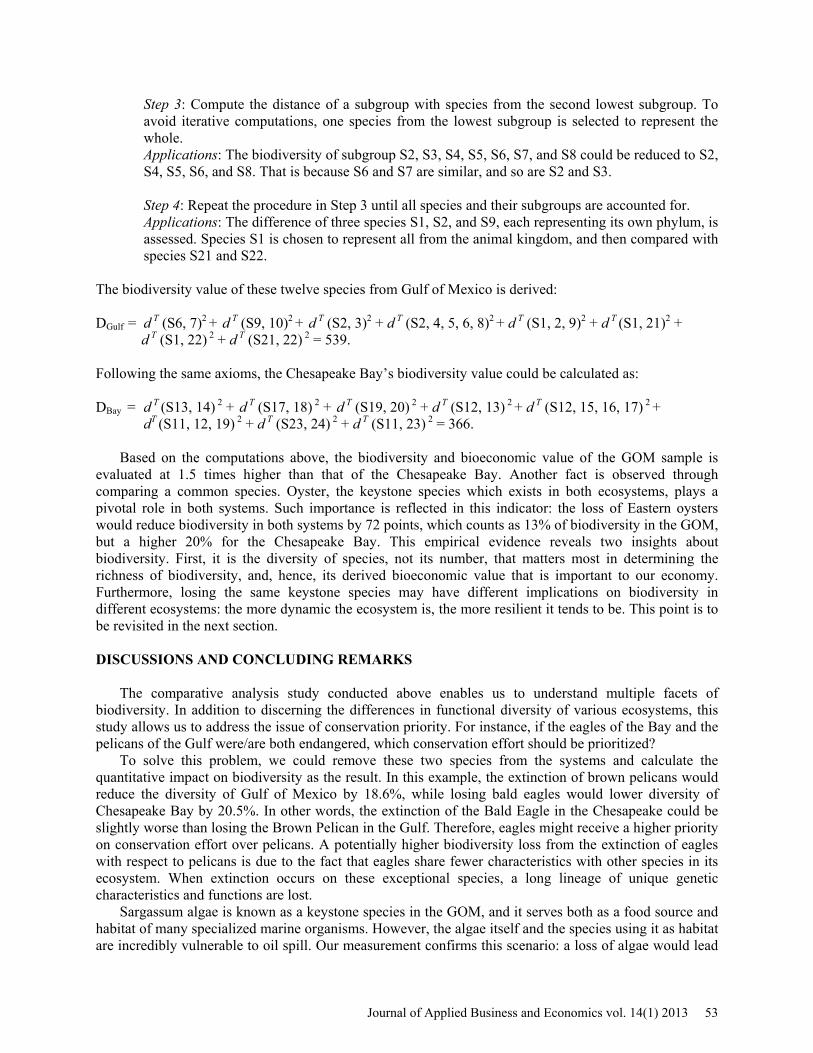
Step 3: Compute the distance of a subgroup with species from the second lowest subgroup. To avoid iterative computations, one species from the lowest subgroup is selected to represent the whole. Applications: The biodiversity of subgroup S2, S3, S4, S5, S6, S7, and S8 could be reduced to S2, S4, S5, S6, and S8. That is because S6 and S7 are similar, and so are S2 and S3. Step 4: Repeat the procedure in Step 3 until all species and their subgroups are accounted for. Applications: The difference of three species S1, S2, and S9, each representing its own phylum, is assessed. Species S1 is chosen to represent all from the animal kingdom, and then compared with species S21 and S22.
The biodiversity value of these twelve species from Gulf of Mexico is derived: DGulf = d T (S6, 7)2 + d T (S9, 10)2 + d T (S2, 3)2 + d T (S2, 4, 5, 6, 8)2 + d T (S1, 2, 9)2 + d T (S1, 21)2 +
d T (S1, 22) 2 + d T (S21, 22) 2 = 539. Following the same axioms, the Chesapeake Bay’s biodiversity value could be calculated as: DBay = d T (S13, 14) 2 + d T (S17, 18) 2 + d T (S19, 20) 2 + d T (S12, 13) 2 + d T (S12, 15, 16, 17) 2 +
dT (S11, 12, 19) 2 + d T (S23, 24) 2 + d T (S11, 23) 2 = 366. Based on the computations above, the biodiversity and bioeconomic value of the GOM sample is
evaluated at 1.5 times higher than that of the Chesapeake Bay. Another fact is observed through comparing a common species. Oyster, the keystone species which exists in both ecosystems, plays a pivotal role in both systems. Such importance is reflected in this indicator: the loss of Eastern oysters would reduce biodiversity in both systems by 72 points, which counts as 13% of biodiversity in the GOM, but a higher 20% for the Chesapeake Bay. This empirical evidence reveals two insights about biodiversity. First, it is the diversity of species, not its number, that matters most in determining the richness of biodiversity, and, hence, its derived bioeconomic value that is important to our economy. Furthermore, losing the same keystone species may have different implications on biodiversity in different ecosystems: the more dynamic the ecosystem is, the more resilient it tends to be. This point is to be revisited in the next section. DISCUSSIONS AND CONCLUDING REMARKS
The comparative analysis study conducted above enables us to understand multiple facets of biodiversity. In addition to discerning the differences in functional diversity of various ecosystems, this study allows us to address the issue of conservation priority. For instance, if the eagles of the Bay and the pelicans of the Gulf were/are both endangered, which conservation effort should be prioritized?
To solve this problem, we could remove these two species from the systems and calculate the quantitative impact on biodiversity as the result. In this example, the extinction of brown pelicans would reduce the diversity of Gulf of Mexico by 18.6%, while losing bald eagles would lower diversity of Chesapeake Bay by 20.5%. In other words, the extinction of the Bald Eagle in the Chesapeake could be slightly worse than losing the Brown Pelican in the Gulf. Therefore, eagles might receive a higher priority on conservation effort over pelicans. A potentially higher biodiversity loss from the extinction of eagles with respect to pelicans is due to the fact that eagles share fewer characteristics with other species in its ecosystem. When extinction occurs on these exceptional species, a long lineage of unique genetic characteristics and functions are lost.
Sargassum algae is known as a keystone species in the GOM, and it serves both as a food source and habitat of many specialized marine organisms. However, the algae itself and the species using it as habitat are incredibly vulnerable to oil spill. Our measurement confirms this scenario: a loss of algae would lead
Journal of Applied Business and Economics vol. 14(1) 2013 53
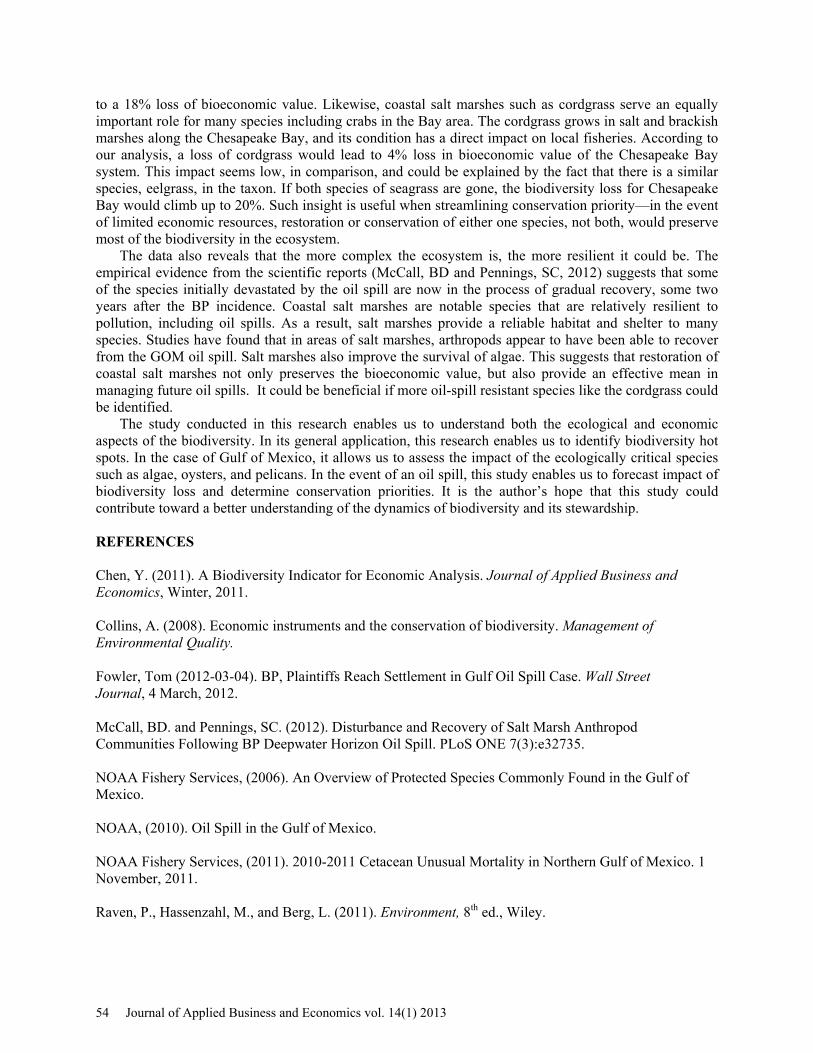
to a 18% loss of bioeconomic value. Likewise, coastal salt marshes such as cordgrass serve an equally important role for many species including crabs in the Bay area. The cordgrass grows in salt and brackish marshes along the Chesapeake Bay, and its condition has a direct impact on local fisheries. According to our analysis, a loss of cordgrass would lead to 4% loss in bioeconomic value of the Chesapeake Bay system. This impact seems low, in comparison, and could be explained by the fact that there is a similar species, eelgrass, in the taxon. If both species of seagrass are gone, the biodiversity loss for Chesapeake Bay would climb up to 20%. Such insight is useful when streamlining conservation priority—in the event of limited economic resources, restoration or conservation of either one species, not both, would preserve most of the biodiversity in the ecosystem.
The data also reveals that the more complex the ecosystem is, the more resilient it could be. The empirical evidence from the scientific reports (McCall, BD and Pennings, SC, 2012) suggests that some of the species initially devastated by the oil spill are now in the process of gradual recovery, some two years after the BP incidence. Coastal salt marshes are notable species that are relatively resilient to pollution, including oil spills. As a result, salt marshes provide a reliable habitat and shelter to many species. Studies have found that in areas of salt marshes, arthropods appear to have been able to recover from the GOM oil spill. Salt marshes also improve the survival of algae. This suggests that restoration of coastal salt marshes not only preserves the bioeconomic value, but also provide an effective mean in managing future oil spills. It could be beneficial if more oil-spill resistant species like the cordgrass could be identified.
The study conducted in this research enables us to understand both the ecological and economic aspects of the biodiversity. In its general application, this research enables us to identify biodiversity hot spots. In the case of Gulf of Mexico, it allows us to assess the impact of the ecologically critical species such as algae, oysters, and pelicans. In the event of an oil spill, this study enables us to forecast impact of biodiversity loss and determine conservation priorities. It is the author’s hope that this study could contribute toward a better understanding of the dynamics of biodiversity and its stewardship. REFERENCES Chen, Y. (2011). A Biodiversity Indicator for Economic Analysis. Journal of Applied Business and Economics, Winter, 2011. Collins, A. (2008). Economic instruments and the conservation of biodiversity. Management of Environmental Quality. Fowler, Tom (2012-03-04). BP, Plaintiffs Reach Settlement in Gulf Oil Spill Case. Wall Street Journal, 4 March, 2012. McCall, BD. and Pennings, SC. (2012). Disturbance and Recovery of Salt Marsh Anthropod Communities Following BP Deepwater Horizon Oil Spill. PLoS ONE 7(3):e32735. NOAA Fishery Services, (2006). An Overview of Protected Species Commonly Found in the Gulf of Mexico. NOAA, (2010). Oil Spill in the Gulf of Mexico. NOAA Fishery Services, (2011). 2010-2011 Cetacean Unusual Mortality in Northern Gulf of Mexico. 1 November, 2011. Raven, P., Hassenzahl, M., and Berg, L. (2011). Environment, 8th ed., Wiley.
54 Journal of Applied Business and Economics vol. 14(1) 2013

Sumaila, U. Rashid et al. (2012). Impact of the Deepwater Horizon well blowout on the economics of US Gulf fisheries. Canadian Journal of Fisheries and Aquatic Sciences, 2012, 69(3): 499-510. Weitzman, M.L. (1992). On diversity. Quarterly Journal of Economics, 57: 363-405.
Journal of Applied Business and Economics vol. 14(1) 2013 55