A Better Investment Climate for Everyone - World...
288
2005 world development report A Better Investment Climate for Everyone
Transcript of A Better Investment Climate for Everyone - World...

2005world development report
A Better Investment Climatefor Everyone
01_WDR_FM.qxd 9/3/04 11:15 AM Page i

01_WDR_FM.qxd 9/3/04 11:15 AM Page ii

A Copublication of The World Bank
and Oxford University Press
2005world development report
A Better Investment Climatefor Everyone
01_WDR_FM.qxd 9/3/04 11:15 AM Page iii

© 2004 The International Bank for Reconstruction and Development / The World Bank1818 H Street, NWWashington, DC 20433Telephone: 202-473-1000Internet: www.worldbank.orgE-mail: [email protected]
All rights reserved.
1 2 3 4 07 06 05 04
A copublication of the World Bank and Oxford University Press.Oxford University Press198 Madison AvenueNew York, NY 10016
This volume is a product of the staff of the World Bank. The findings, interpretations, and con-clusions expressed herein do not necessarily reflect the views of the Board of Executive Direc-tors of the World Bank or the governments they represent.
The World Bank does not guarantee the accuracy of the data included in this work. Theboundaries, colors, denominations, and other information shown on any map in this work donot imply any judgment on the part of the World Bank concerning the legal status of any terri-tory or the endorsement or acceptance of such boundaries.
Rights and PermissionsThe material in this work is copyrighted. Copying and/or transmitting portions or all of thiswork without permission may be a violation of applicable law. The World Bank encourages dis-semination of its work and will normally grant permission promptly.
For permission to photocopy or reprint any part of this work, please send a request withcomplete information to the Copyright Clearance Center, Inc., 222 Rosewood Drive, Danvers,MA 01923, USA, telephone 978-750-8400, fax 978-750-4470, www.copyright.com.
All other queries on rights and licenses, including subsidiary rights, should be addressed tothe Office of the Publisher, World Bank, 1818 H Street, NW, Washington, DC 20433, fax 202-522-2422, e-mail [email protected].
Cover and interior design: Susan Brown SchmidlerCover illustration commissioned by the WDR 2005 team; © Linda Frichtel
ISBN 0-8213-5724-7 (clothbound)ISBN 0-8213-5682-8 (paperback)ISSN 0163-5085
Library of Congress Cataloging-in-Publication Data has been applied for.
01_WDR_FM.qxd 9/3/04 11:15 AM Page iv

Contents
v
Foreword xiiiAcknowledgments xvAbbreviations and Data Notes xvi
Overview 1The investment climate is central to growth and poverty reduction 1
Tackling costs, risks, and barriers to competition 4
Progress requires more than changes in formal policies 5
A process, not an event 7
Focus on delivering the basics 9
Going beyond the basics involves additional challenges 12
The international community can lend a hand 14
PA RT IImproving the Investment Climate 17
1 The investment climate, growth, and poverty 19Understanding the investment climate 20
How investment climate improvements drive growth and reduce poverty 24
Sharpening the focus on poverty reduction 31
Creating a better investment climate for everyone 35
2 Confronting the underlying challenges 36The basic tension: Firm preferences or the public interest? 37
Restraining rent-seeking 40
Establishing credibility 45
Fostering public trust and legitimacy 50
Ensuring policy responses reflect a good institutional fit 53
Making progress 54
01_WDR_FM.qxd 9/3/04 11:15 AM Page v

vi CONTENTS
3 Tackling a broad agenda 56The investment climate as a package 56
Setting priorities 58
Managing individual reforms 68
Maintaining momentum 71
Strengthening capabilities 74
PA RT IIDelivering the Basics 77
4 Stability and security 79Verifying rights to land and other property 80
Facilitating contract enforcement 84
Reducing crime 89
Ending the uncompensated expropriation of property 92
5 Regulation and taxation 95Regulating firms 95
Taxing firms 106
Regulating and taxing at the border 111
6 Finance and infrastructure 115Financial markets 115
Infrastructure—connecting firms and expanding opportunities 124
7 Workers and labor markets 136Fostering a skilled and healthy workforce 137
Crafting interventions to benefit all workers 141
Helping workers cope with change 151
PA RT IIIGoing Beyond the Basics? 157
8 Selective interventions 159The allure—and traps—of selective interventions 159
Experience in specific areas 163
01_WDR_FM.qxd 9/3/04 11:15 AM Page vi

Contents vii
9 International rules and standards 175International arrangements and the investment climate 175
Enhancing credibility 176
Fostering harmonization 180
Addressing international spillovers 182
Future challenges 184
PA RT IVHow the International Community Can Help 187
10 How the international community can help 189Removing distortions in developed countries 189
Providing more, and more effective, assistance 190
Tackling the substantial knowledge agenda 195
Bibliographical note 198
Endnotes 199
References 210Background papers for the WDR 2005 241
Case studies commissioned by the U.K. Department for International Developmentfor the World Development Report 2005 242
Selected Indicators 243
Measuring the investment climate 244Challenges in measuring the investment climate 244
The World Bank’s new measures 245
Technical notes 250
Selected world development indicators 253Data sources and methodology 253
Changes in the System of National Accounts 253
Classification of economies and summary measures 254
Terminology and country coverage 254
Technical notes 265
01_WDR_FM.qxd 9/3/04 11:15 AM Page vii

viii CONTENTS
1 The investment climate perspective 2
2 How do firms in developing countries rate variousinvestment climate constraints? 5
3 Tackling a broad agenda—lessons from China, India,and Uganda 7
4 Main messages from World Development Report2005 15
1.1 What do we mean by the investment climate? 20
1.2 New sources of investment climate data from theWorld Bank 21
1.3 Geography matters, but it is not destiny 22
1.4 The environment matters for well-being andproductivity: Main messages from WDR 2003 25
1.5 Improving the investment climate and growth: thecases of China, India, and Uganda 27
1.6 Measuring productivity 28
1.7 Growth with a poor investment climate—possible,but unlikely to be sustained 29
1.8 Developing a product is a learning process—asHyundai shows 29
1.9 Firm dynamics 30
1.10 Showing potential returns to investment climateimprovements 31
1.11 How growth translates to rising incomes for poorpeople 32
1.12 Women and the investment climate 34
2.1 Governance and the investment climate 37
2.2 Firms in history 38
2.3 Firms and social responsibility 38
2.4 How do firm differences affect their policypreferences and priorities? 39
2.5 The predation of Gécamines in Mobutu’s Zaire 41
2.6 Natural resource endowments: Blessing or curse? 41
2.7 Combating corruption in Botswana and Lithuania 42
2.8 The form of intervention: How many cheers fortransparency? 44
2.9 Business associations and the investment climate 45
2.10 Reducing policy uncertainty to stimulate investment 46
2.11 Entrepreneurship and uncertainty 47
2.12 The power of credibility 49
2.13 Building credibility through persistence in Uganda 50
2.14 Shining the light on government–firm dealings innatural resources and infrastructure 52
2.15 Decentralization and the investment climate 53
2.16 E-government and the investment climate 54
3.1 Improving the investment climate, China’s way 57
3.2 India’s path 58
3.3 Do small firms play a special role in economicgrowth? 64
3.4 International integration is especially important forsmall states 65
3.5 Exporting and productivity—what is the link? 65
3.6 Trade liberalization in India—recent evidence 66
3.7 Foreign locals—the role of emigrants and diaspora 67
3.8 Expanding the zone of feasible and desirable policyimprovements 68
3.9 The Bulldozer initiative in Bosnia and Herzegovina 70
3.10 Consultative mechanisms in Latvia and Turkey 72
3.11 Shepherding investment climate improvements inVietnam 73
3.12 The evolution of a reform champion in Senegal 74
3.13 Networks of regulatory professionals in infrastructure 75
4.1 Macroeconomic stability and the investment climate 80
4.2 Property rights reform in China: Even modestprogress can ignite a strong response 80
4.3 Secure property rights and environmentalstewardship 81
4.4 The distribution of property rights 82
4.5 Thailand’s 20-year program to title rural land 83
4.6 De-monopolizing property transaction professionals 84
4.7 Intellectual property rights: The ongoing debate 85
4.8 Crime, poverty, and inequality 90
4.9 New York City’s police reforms—are they exportable? 91
4.10 Property wrongs: Is there ever a statute oflimitations? 93
5.1 Public ownership, regulation, and the investmentclimate 97
5.2 Regulating in Jamaica—from transplants to betterinstitutional fit 98
5.3 Environmental regulation and global integration 99
5.4 Easing business registration requirements in Vietnamand Uganda 101
5.5 One-stop shops—or one-more-stop shops? 101
Boxes
01_WDR_FM.qxd 9/3/04 11:15 AM Page viii

5.6 Balancing the tradeoffs between specificity anddiscretion in regulation 103
5.7 Contracting for certainty 103
5.8 Competition laws in developing countries 106
5.9 Taxation and global integration: A race to thebottom? 108
5.10 Who pays taxes levied on firms? 108
5.11 Tax receipts as lottery tickets? 110
5.12 Dealing with short-term international capital flows 113
5.13 Reducing customs delays in Singapore and Ghana 114
5.14 Contracting out customs in Mozambique 114
6.1 Governments and finance markets: A long anddifficult history 117
6.2 Expanding access to finance in rural areas—newapproaches in India 120
6.3 Commercial microfinanciers enter the market 120
6.4 Establishing a registry for movable collateral inRomania 121
6.5 Improving corporate governance in Brazil and SouthKorea 122
6.6 The political economy of electricity in India 125
6.7 Improving the investment climate for small privateproviders of infrastructure 127
6.8 Better government accounting, better governmentpolicy 128
6.9 Expanding rural access to electricity andtelecommunications 131
6.10 The power to improve productivity in Nigeria 132
6.11 Port reform in Colombia and India 134
6.12 The benefits of rural roads in Morocco and elsewhere 134
7.1 Malaria and HIV/AIDS cloud the investment climate 137
7.2 Why Intel chose Costa Rica as the site of amultimillion dollar plant 139
7.3 Tackling skill imbalances through public support fortraining and retraining programs 140
7.4 The core labor standards 141
7.5 The role and impact of unions 142
7.6 Labor regulation and global integration 146
7.7 Do firms’ perceptions square with actual laborregulations? 148
7.8 Reforming severance pay in Colombia and Chile 154
8.1 Unforeseen successes in Bangladesh and Kenya 160
8.2 Picking “winners” can be an expensive gamble—SOTEXKA in Senegal 160
8.3 Integrating informal traders in Durban 164
8.4 Rural credit in Brazil 165
8.5 Staying small in India—by design 167
8.6 China’s special economic zones 167
8.7 Export processing zones in Mauritius and theDominican Republic 168
8.8 The WTO and selective intervention 169
8.9 Rolling the dice in Indianapolis 170
8.10 Competing to attract investment within countries 171
8.11 Fixing the FDI strategy for Mexico’s computerindustry 172
8.12 Successful “linkage programs” in Singapore andIreland 172
8.13 Public-private partnerships for R&D 174
9.1 Evaluating rules and standards—compliancemechanisms and participation 176
9.2 BITs—enhancing credibility one bit at a time? 177
9.3 NEPAD and its peer review mechanism 179
9.4 The evolving system of investor-state disputesettlement 181
9.5 Harmonizing business law in Africa—OHADA 181
9.6 International cooperation to combat corruption 183
9.7 Privatizing international cooperation on corporatesocial responsibility 184
9.8 A multilateral agreement on investment? 185
10.1 Multidonor technical assistance facilities and theinvestment climate 193
10.2 Knowing when to stop: UNDP’s microfinanceactivities in Bangladesh 194
Contents ix
Figures
1 Domestic private investment dominates foreign directinvestment 2
2 Productivity accounts for a significant share ofgrowth 3
3 More competitive pressure, more innovation 3
4 Growth is closely associated with poverty reduction 3
5 How 60,000 poor people rated jobs and self-employment as paths out of poverty 4
6 The informal economy is substantial in manydeveloping countries 4
01_WDR_FM.qxd 9/3/04 11:15 AM Page ix

x CONTENTS
7 Costs vary widely in level and composition 4
8 Small and informal firms are often hit hardest byinvestment climate constraints 5
9 Constraints reported by firms—comparing Bulgaria,Georgia, and Ukraine 8
10 Firms in many developing countries lack confidencein the courts to uphold their property rights 9
11 The inadequacies of finance and infrastructure aresevere for many developing countries 11
Firms rating finance and infrastructure as a “major”or “severe” constraint 11
12 Firms often rate skill shortage and labor regulationsas serious obstacles 11
13 Manufacturing value-added in a single country can far exceed net global official development finance 14
1.1 Institutions, broadly measured, clearly matter forgrowth 21
1.2 Costs vary widely in level and composition 23
1.3 Regulatory unpredictability is a big concern for firms 23
1.4 Competitive pressure can vary significantly betweencountries 23
1.5 Investment climate conditions vary within countries 24
1.6 Investment climate conditions can affect firmsdifferently 24
1.7 Significant economic growth is a modernphenomenon 25
1.8 Fast sustained growth in East Asia—declines in Sub-Saharan Africa 26
1.9 The contribution of private investment to GDP hasgrown 26
1.10 Private investment has grown faster in countries withbetter investment climates 27
1.11 Differences in TFP account for the largest share ofdifferences in GDP growth per worker 28
1.12 More competitive pressure, more innovation 29
1.13 The contribution of net entry to productivity ishigher when barriers to entry are lower 30
1.14 Poverty reduction is closely associated with growth 31
1.15 Self-employment and wage income are the ways outof poverty 33
1.16 Growing economies generate more jobs—particularlyin developing countries 33
1.17 The informal economy is substantial in manydeveloping countries 34
1.18 Rising GDP is associated with rising tax revenues—expanding the opportunities to fund services for thepoor 35
Formal and informal firms have different perspectives 39
2.1 The main locus of bribe-taking can vary 41
2.2 More business start-up procedures increase bothdelays and corruption 42
2.3 More influential firms face fewer constraints 44
2.4 More influential firms innovate less 45
2.5 Cronyism is reduced by greater accountability—andlegislatures play an especially important role 46
2.6 Policy uncertainty dominates the investment climateconcerns of firms 46
2.7 Policy uncertainty is a concern for informal firms aswell 47
2.8 Firms are more likely to invest when the policies areperceived to be credible 48
2.9 Improving policy predictability can increase theprobability of new investment by over 30 percent 48
2.10 The power of restraint: governments with lessdiscretion present lower investment risk 49
2.11 Support for markets does not always track economicgrowth—as in Latin America 51
2.12 Strong support for international trade and business—but less confidence in corporations 52
3.1 Constraints reported by firms—comparing Bulgaria,Georgia, and Ukraine 59
3.2 Informality is a matter of degree 62
3.3 Women’s participation is concentrated in theinformal sector, among the smallest firms 62
3.4 The contribution of SMEs to GDP does not vary toomuch by income—but the relative importance ofinformal and formal firms shifts dramatically 63
3.5 Gross exports and FDI in developing economiesjumped in the 1990s 65
3.6 Gaining access to technological innovations—keysources 67
4.1 Not entitled? 81
4.2 Leasing activity is more prevalent in Tunisia than inEgypt or Lebanon, thanks to laws facilitatingrepossession 84
4.3 Many firms do not believe the courts will upholdtheir property rights 87
4.4 Reforms speed up court business in RepúblicaBolivariana de Venezuela 87
4.5 Crime takes a heavy toll on many Latin Americaneconomies 89
01_WDR_FM.qxd 9/3/04 11:15 AM Page x

4.6 Crime is a significant constraint on firms in allregions 89
4.7 Risky business 93
5.1 Low-income countries tend to regulate more 96
5.2 Starting a new business takes longer and is morecostly in developing countries 100
5.3 Larger firms spend more time dealing withregulations and are inspected more often 100
5.4 Firms of all sizes report that officials’ interpretationsof regulations are unpredictable 102
5.5 Despite strong laws, competition policy is seen to beless effective in low-income countries 105
5.6 Corporate tax and VAT rates are similar in high-income and developing countries 107
5.7 Corporate tax revenues remained stable or increasedduring the 1990s, except in ECA 107
5.8 Caught in the middle: Taxing firms in Uganda andCameroon 109
5.9 Many firms rate tax administration as a seriousobstacle 109
5.10 Most changes in national regulations governing FDIreduced restrictions 112
5.11 Restrictions on FDI have fallen in manufacturing, butpersist in other sectors 112
5.12 Clearing customs for imports—from under 2 days to 18 113
6.1 The inadequacies of finance and infrastructure aresevere for many developing countries 115
6.2 Sources of fixed investment financing differ for smalland large firms 116
6.3 State-owned banks are holding on, especially in Indiaand in the Middle East and North Africa 118
6.4 Infrastructure concerns expressed by firms vary bysize and sector 124
6.5 More developing countries are involving the privatesector in infrastructure provision 126
6.6 Investment in infrastructure projects with privateparticipation has recently fallen 126
6.7 Teledensity increases with the quality of the investmentclimate, even controlling for incomes 126
6.8 Perceived fairness allows lower rates of return to bepromised for a given legal protection 127
6.9 Long delays for phone connections are common,especially without competition 130
6.10 Liberalization and good regulation accelerate thegrowth of phone connections 130
6.11 Competition spurs the spread of mobile phones inSub-Saharan Africa 130
6.12 Competition in international calls is still limited orprohibited in much of the developing world 131
6.13 Many days of power outages a year, and a higher shareof firms having their own generators 132
6.14 The declining costs of transport andtelecommunications 133
7.1 Firms rate skill shortages and labor regulations asserious constraints in many countries 136
7.2 The share of the population with secondary or highereducation is still very low in many developingcountries 138
7.3 Skill constraints and innovative firms 139
7.4 The minimum wage is very high in many developingcountries and, at high levels, leads to weakcompliance 144
7.5 Developing countries have more stringent regulationson worker hours and paid leave than many developedcountries 145
7.6 High job turnover in developed and developingcountries in the 1990s 146
7.7 Job turnover is high because of both the entry and exitof firms, and the reallocation among existing firms 147
7.8 Many developing countries have more stringentregulations on hiring and firing than developedcountries 147
Perceptions of the burden of labor regulation varyacross countries and firms 148
7.9 Strict labor regulation is not associated with moreequality in the labor market 149
7.10 Unsynchronized job creation and destruction can giverise to unemployment or underemployment 150
7.11 Since the labor reform of 1990, there has been higherjob turnover in Colombia 150
7.12 Developing countries, particularly low-income ones,offer much weaker and less diverse protection againstunemployment risks than developed countries 151
8.1 Competition has increased with more countriesexporting a larger range of goods 161
8.2 Incentives can be costly 170
8.3 Policy advocacy by investment promotion agenciesreceives a small share of budget 171
8.4 Grants make up the lion’s share of public funding forprivate R&D in many developed countries 173
9.1 Participation in bilateral investment treaties (BITs)has shot up in recent years 177
Contents xi
01_WDR_FM.qxd 9/3/04 11:15 AM Page xi

xii CONTENTS
9.2 NAFTA and Mexico’s investment profile 178
9.3 Regional economic cooperation agreementsproliferated in the 1990s 182
Standards are influencing business 184
10.1 Manufacturing value added in a single country can farexceed net global official development finance 189
Tables
1.1 Government policies and behaviors and investmentdecisions—some examples 22
2.1 Bribes vary by firm size, sector, and region 40
3.1 Who innovates? 67
3.2 Consultative forums dealing with investment climateissues—some illustrations 72
In some developing countries competition agenciesdeal with very few cases 106
5.1 Firms report that tax rates are one of their topconcerns 107
8.1 Export processing zones have proliferated into thethousands 168
8.2 Effective reductions in corporate tax rates due to fiscalincentives 169
8.3 IPAs are not cheap 171
8.4 Fiscal incentives for R&D in selected developingcountries 173
10.1 Support for investment climate reforms and to firmsand transactions 191
New investment climate measures from the WorldBank 245
A1 Investment climate indicators: World BankInvestment Climate Surveys 246
A2 Investment climate indicators: expert polls and othersurveys 248
Other sources of investment climate–relatedindicators—selected examples 251
Classification of economies by region and income,FY2005 255
1 Key indicators of development 256
2 Poverty and income distribution 258
3 Economic activity 260
4 Trade, aid, and finance 262
5 Key indicators for other economies 264
01_WDR_FM.qxd 9/3/04 11:15 AM Page xii

This World Development Report is about creating opportunities for people to escape frompoverty and improve their living standards. It is about creating a climate in which firms andentrepreneurs of all types—from farmers and microenterprises to local manufacturing con-cerns and multinationals—have opportunities and incentives to invest productively, createjobs, and expand, and thereby contribute to growth and poverty reduction. The Report thusdeals with one of the central challenges of development.
Expanding opportunities for people in developing countries is a pressing concern for gov-ernments and for the global community. Nearly half the world’s population lives on less than $2a day, and 1.1 billion barely survive on less than $1 a day. Young people have more than doublethe average unemployment rate in all regions, and population growth will add nearly 2 billionmore people to developing countries over the next 30 years. Improving the climate for invest-ment in developing countries is essential to provide jobs and opportunities for young peopleand to build a more inclusive, balanced, and peaceful world.
There is good news. More governments are recognizing that their policies and behaviorsplay a critical role in shaping the investment climates of their societies, and they are makingchanges. China and India provide compelling examples: investment climate improvements inthese countries have driven growth and the most dramatic reductions in poverty in history.Many other governments are also taking on the agenda, but progress remains slow and uneven.Governments still saddle firms and entrepreneurs with unnecessary costs, create substantialuncertainty and risk, and erect unjustified barriers to competition.
This year’s World Development Report, the 27th in the World Bank’s flagship series, looks atwhat governments can do to create better investment climates for their societies. Drawing onnew research, including surveys of nearly 30,000 firms in 53 developing countries, other newdata, and country case studies, it makes four main points.
First, the Report emphasizes that the goal should be to create an investment climate that isbetter for everyone—in two dimensions. The investment climate should benefit society as awhole, not only firms. Well-designed regulation and taxation are thus an important part of agood investment climate. And the investment climate should embrace firms of all types, notjust large or influential firms. Small and large firms, local and foreign firms, and low-tech andhigh-tech firms each have important and complementary contributions to make to growth andpoverty reduction.
Second, the Report argues that efforts to improve the investment climate need to go beyondjust reducing business costs. Those costs can indeed be extraordinary in many countries,amounting to several times what firms pay in taxes. But policy-related risks dominate firms’concerns in developing countries and can cripple incentives to invest. And barriers to competi-tion remain pervasive, dulling incentives for firms to innovate and increase productivity. Gov-ernments need to address all three aspects of a good investment climate.
Third, the Report underscores that progress requires more than changes in formal policies.The gaps between policies and their implementation can be huge, with the vast informaleconomies in many developing countries providing the most palpable evidence. Governments
Foreword
xiii
01_WDR_FM.qxd 9/3/04 11:15 AM Page xiii

xiv WORLD DEVELOPMENT REPORT 2005
need to bridge these gaps and address deeper sources of policy failure that can undermine a soundinvestment climate. Governments need to tackle corruption and other forms of rent-seeking, tobuild credibility with firms, to foster public trust and legitimacy, and to ensure their policy interven-tions are crafted to fit local conditions.
Finally, the Report reviews strategies for tackling such a broad agenda. It emphasizes that perfec-tion is not required and that everything does not have to be done at once. But progress requires gov-ernments to address important constraints in ways that give firms the confidence to invest—and tosustain a process of ongoing improvements. Persistence pays off.
These findings are supported by detailed analysis and the many examples discussed throughoutthe Report, which should provide practical insights for policymakers and for others concerned withgrowth and poverty reduction in developing countries.
Improving the investment climate is the first pillar of the World Bank’s overall development strat-egy. The World Development Report 2005 complements last year’s WDR, which addressed key aspectsof the second pillar of that strategy: investing in and empowering people to take advantage of oppor-tunities. Together, these two Reports offer sound advice and research that will help the World Bankand our partners realize our common dream—a world free of poverty.
James D. WolfensohnPresidentThe World Bank
01_WDR_FM.qxd 9/3/04 11:15 AM Page xiv

xv
This Report has been prepared by a team led by Warrick Smith and comprising MaryHallward-Driemeier, Gaiv Tata, George Clarke, Raj Desai, Timothy Irwin, Richard Messick,Stefano Scarpetta, and Ekaterina Vostroknutova. Leora Klapper and Sunita Kikeri also con-tributed. The team was assisted by Yanni Chen, Alexandru Cojocaru, Zenaida Hernandez,Tewodaj Mengistu, Claudio E. Montenegro, and David Stewart. Bruce Ross-Larson was thedevelopmental editor. The work was initiated under the direction of Nicholas Stern and carriedout under the general direction of François Bourguignon.
Many others inside and outside the World Bank provided helpful comments, includingDaron Acemoglu, Erik Berglöf, Robin Burgess, Ha-Joon Chang, Shantayanan Devarajan, DavidDollar, John Haltiwanger, Michael Klein, Howard Pack, and Lant Pritchett. The DevelopmentData Group contributed to the data appendix and was responsible for the Selected WorldDevelopment Indicators. Much of the background research was supported by generous trustfund grants from the U.K. Department for International Development and from the Swedishand Swiss Governments.
The team undertook a wide range of consultations for this Report, which included work-shops in Berlin, Dar-es-Salaam, London, New Delhi, Shanghai, and Washington, D.C.; video-conferences with sites in Brazil, Egypt, Guatemala, Honduras, Japan, Lebanon, Nicaragua, Rus-sia, and Serbia and Montenegro; and an on-line discussion of the draft report. Participants inthese workshops, videoconferences, and discussions included researchers, government officials,and staff of nongovernmental and private-sector organizations.
Rebecca Sugui served as executive assistant to the team, Ofelia Valladolid as program assis-tant, and Madhur Arora and Jason Victor as team assistants. Evangeline Santo Domingo servedas resource management assistant.
Book design, editing, and production were coordinated by the World Bank’s Office of thePublisher under the supervision of Susan Graham, Denise Bergeron, and Janet Sasser.
Acknowledgments
01_WDR_FM.qxd 9/3/04 11:15 AM Page xv

APEC Asia-Pacific Economic CooperationBEEPS II Business Environment and Enterprise
Performance Survey II BITs Bilateral investment treatiesDFIs Development finance institutionsEPZs Export processing zonesEU European UnionFDI Foreign direct investmentGATT General Agreement on Tariffs and Trade GDP Gross domestic productGNI Gross national incomeHIV/AIDs Human immunodeficiency virus/
acquired immunodeficiency syndromeICRG International Country Risk GuideICS Investment Climate Surveys ICSID International Centre for Settlement of
Investment DisputesILO International Labour OrganisationIMF International Monetary FundMERCOSUR Common Market of the South
NAFTA North American Free Trade AgreementNEPAD New Partnership for Africa’s DevelopmentNGOs Nongovernmental organizationsOECD Organisation for Economic Co-operation and
DevelopmentPPP Purchasing power parity R&D Research and developmentSMEs Small and medium enterprisesTFP Total factor productivityU.N. United NationsUNCITRAL United Nations Commission on International
Trade LawUNCTAD United Nations Conference on Trade and
DevelopmentUNDP United Nations Development ProgrammeUSAID U.S. Agency for International DevelopmentVAT Value added taxWEF World Economic Forum WTO World Trade Organization
Abbreviations and Data Notes
Abbreviations
xvi
Data NotesThe countries included in regional and income groupings inthis Report are listed in the Classification of Economies tableat the beginning of the Selected World Development Indica-tors. Income classifications are based on GNP per capita;thresholds for income classifications in this edition may befound in the Introduction to Selected World DevelopmentIndicators. Group averages reported in the figures and tablesare unweighted averages of the countries in the group unlessnoted to the contrary.
The use of the word countries to refer to economiesimplies no judgment by the World Bank about the legal or
other status of a territory. The term developing countriesincludes low- and middle-income economies and thus mayinclude economies in transition from central planning, as amatter of convenience. The term developed countries is usedto denote the high-income economies.
Dollar figures are current U.S. dollars, unless otherwisespecified. Billion means 1,000 million; trillion means 1,000billion.
01_WDR_FM.qxd 9/3/04 11:15 AM Page xvi

1
Everyday, firms around the world face impor-tant decisions. A rural microentrepreneurconsiders whether to open a small business tocomplement her family's farm income. Alocal manufacturing company ponderswhether to expand its production line andhire more workers. A multinational enter-prise evaluates alternative locations for itsnext global production facility. Their deci-sions have important implications for growthand poverty in each location. And their deci-sions will depend largely on the way govern-ment policies and behaviors shape the invest-ment climate in those locations.
A good investment climate providesopportunities and incentives for firms—frommicroenterprises to multinationals—to investproductively, create jobs, and expand. It thusplays a central role in growth and povertyreduction. Improving the investment climatesof their societies is critical for governments inthe developing world, where 1.2 billion peoplesurvive on less than $1 a day, where youthshave more than double the average unem-ployment rate, and where populations aregrowing rapidly. Expanding jobs and otheropportunities for young people is essential tocreate a more inclusive, balanced, and peace-ful world.
New data from the World Bank providefresh insights into how investment climatesvary around the world and how they influ-ence growth and poverty. These includeInvestment Climate Surveys, which covermore than 26,000 firms in 53 developingcountries, and the Doing Business Project,which benchmarks regulatory regimes inmore than 130 countries.1 World Develop-ment Report 2005 draws on those data, othernew evidence, and emerging lessons of inter-national experience to look at what govern-ments at all levels can do to create a betterinvestment climate—an investment climate
that benefits society as a whole, not just firms,and one that embraces all firms, not just largeor politically connected firms. In short, a bet-ter investment climate for everyone.
The investment climate is centralto growth and poverty reductionPrivate firms—from farmers and microen-trepreneurs to local manufacturing compa-nies and multinational enterprises—are atthe heart of the development process. Drivenby the quest for profits, they invest in newideas and new facilities that strengthen thefoundation of economic growth and pros-perity. They provide more than 90 percent ofjobs, creating opportunities for people toapply their talents and improve their situa-tions. They provide the goods and servicesneeded to sustain life and improve livingstandards. They are also the main source oftax revenues, contributing to public fundingfor health, education, and other services.Firms are thus critical actors in the quest forgrowth and poverty reduction.
The contribution firms make to societyis mainly determined by the investment cli-mate—the location-specific factors thatshape the opportunities and incentives forfirms to invest productively, create jobs, andexpand (box 1). Government policies andbehaviors play a key role in shaping theinvestment climate. While governmentshave limited influence on factors such asgeography, they have more decisive influ-ence on the security of property rights,approaches to regulation and taxation(both at and within the border), the provi-sion of infrastructure, the functioning offinance and labor markets, and broadergovernance features such as corruption.Improving government policies and behav-iors that shape the investment climate dri-ves growth and reduces poverty.
Overview
02_WDR_Overview.qxd 8/24/04 11:42 AM Page 1
risks, and barriers to competition. As a resultof investment climate improvements in the1980s and 1990s, private investment as ashare of GDP nearly doubled in China andIndia; in Uganda it more than doubled.2 InPoland, Romania, Russia, Slovakia, andUkraine firms that believe their propertyrights are secure reinvest between 14 and 40percent more of their profits in their busi-nesses than those who don’t.3 Improvingpolicy predictability can increase the likeli-hood of new investment by more than 30percent. Reducing barriers to competition intelecommunications in the 1990s unleasheda surge of new investment worldwide—including investment by microentrepreneursin Bangladesh and Uganda.
But it is not just the volume of invest-ment that matters for growth—it is the pro-ductivity gains that result (figure 2).4 Agood investment climate encourages higherproductivity by providing opportunitiesand incentives for firms to develop, adapt,and adopt better ways of doing things—notjust innovations of the kind that mightmerit a patent but also better ways to orga-nize a production process, distribute goods,and respond to consumers.
What is required? Low barriers to the dif-fusion of new ideas, including barriers toimporting modern equipment and adjustingthe way work is organized. And an environ-ment that fosters the competitive processes
2 WORLD DEVELOPMENT REPORT 2005
The investment climate reflects the many loca-tion-specific factors that shape the opportuni-ties and incentives for firms to investproductively, create jobs, and expand. A goodinvestment climate is not just about generatingprofits for firms—if that were the goal, the focuscould be limited to minimizing costs and risks. Agood investment climate improves outcomesfor society as a whole.That means that somecosts and risks are properly borne by firms. Andcompetition plays a key role in spurring innova-tion and productivity and ensuring that thebenefits of productivity improvements areshared with workers and consumers.
Looking at growth and poverty reductionthrough an investment climate lens offers sev-eral insights:
• It puts firms—the actors making investment andhiring decisions—at the center of the discussion.
• It recognizes that firms assess investmentopportunities and related government poli-cies and behaviors as part of a package.Thisreinforces the importance of looking at prop-erty rights, regulation, taxes, finance,infrastructure, corruption, and other areas ofgovernment policy and behavior as part of anintegrated whole, rather than in isolation.
• It highlights the forward-looking nature ofinvestment activity. Investment is based onexpectations about the future and not just oncurrent conditions.This underlines the impor-tance of governments fostering stability andcredibility, which are critical elements of asound investment climate.
• It treats as fundamental the need for policy-makers to balance the goal of encouragingproductive private investment with othersocial goals. Firms provide many benefits for
society, but the interests of firms and societyare not the same in all respects. Good publicpolicy is not about giving firms everythingthey might ask for, but rather about balancinga range of social interests.
A good investment climate provides oppor-tunities for people to better themselves, andimproving the investment climate is the first pil-lar of the World Bank’s overall developmentstrategy. A critical complementary agenda is toinvest in and empower people so they can takeadvantage of those opportunities; this is thesecond pillar of the Bank’s strategy. World Devel-opment Report 2004: Making Services Work forPoor People focused on key aspects of that sec-ond pillar.
Source: Authors and Stern (2002).
B O X 1 The investment climate perspective
Figure 1 Domestic private investment dominates foreign direct investment
Note: Annual averages of 92 developing countries.Source: World Bank (2004k).
0
5
10
15
Perc
ent o
f GDP
20
20001990
Private gross fixed capital formation
1980
FDI
Driving growthWith rising populations, economic growth isthe only sustainable mechanism for increas-ing a society's standard of living. A goodinvestment climate drives growth by encour-aging investment and higher productivity.
Investment underpins economic growthby bringing more inputs to the productionprocess. Foreign investment is becomingmore important in developing countries,but the bulk of private investment remainsdomestic (figure 1).
A good investment climate encouragesfirms to invest by removing unjustified costs,
02_WDR_Overview.qxd 8/24/04 11:42 AM Page 2

that Joseph Schumpeter called “creativedestruction”—an environment in whichfirms have opportunities and incentives totest their ideas, strive for success, and pros-per or fail.5 A good investment climatemakes it easier for firms to enter and exitmarkets in a process that contributes tohigher productivity and faster growth. Netmarket entry can account for more than 30percent of productivity growth.6 And firmsfacing strong competitive pressure are atleast 50 percent more likely to innovate thanthose reporting no such pressure (figure 3).
Reducing povertyThe critical role the investment climateplays in poverty reduction can be seen intwo ways. First, at the aggregate level, eco-nomic growth is closely associated withreductions in poverty (figure 4). Indeed,investment climate improvements in Chinadrove the most dramatic poverty reductionin history, lifting 400 million people out ofpoverty over 20 years. Second, the contribu-tion can be seen in the way a good invest-ment climate enhances the lives of peopledirectly, in their many capacities.
As employees. The World Bank’s “Voices ofthe Poor” study found that poor peopleidentified getting a job—whether throughself-employment or from wages—as theirmost promising path out of poverty (figure
5). The private sector accounts for morethan 90 percent of jobs in developing coun-tries.7 Better job opportunities also increaseincentives for people to invest in their edu-cation and skills, thus complementingefforts to improve human development.Firms that are more productive can also paybetter wages and invest more in training.8
As entrepreneurs. Hundreds of millions ofpoor people in developing countries maketheir living as microentrepreneurs—as farm-ers, as street vendors, as homeworkers, and ina range of other occupations. They oftenoperate in the informal economy, whichaccounts for more than half of economicactivity in many developing countries (figure6). Firms in the informal economy face manyof the same constraints as other firms,including insecure property rights, corrup-tion, policy unpredictability, and limitedaccess to finance and public services. Reliev-ing these constraints increases incomes forentrepreneurs and allows them to expandtheir activities. A good investment climatealso increases incentives to become part ofthe formal economy.
As consumers. A good investment climateexpands the variety and reduces the costs ofgoods and services, including those consumedby poor people. Investment climate improve-ments lowered food prices in countries
Overview: A better investment climate—for everyone 3
Figure 4 Growth is closely associated with poverty reduction
Note: All figures for 1992–98 except Bangladesh (1992–2000) and India (1993–99).Source: World Bank (2002d).
0
2
4
6
Aver
age
annu
al p
erce
nt c
hang
e 8
10
ChinaVietnamIndiaBangladeshPakistan
GDP per capita growth rate
Poverty reduction
Figure 3 More competitive pressure,more innovation
Note: Percentage increase is relative to firmsreporting no competitive pressure.Source: World Bank Investment ClimateSurveys/BEEPS II in 27 countries in EasternEurope and Central Asia.
50
25
Perc
enta
ge in
crea
se in
prob
abili
ty o
f und
erta
king
act
ivity
0
75
Introducenew product
Upgradeproduct
Somepressure
Moderatepressure
Majorpressure
Education 14%
Capital 45%
TFP 41%
Figure 2 Productivity accounts for asignificant share of growth
Note: Sources of growth for 84 countries from1960–2000. “TFP” is total factor productivity. Source: Bosworth and Collins (2003).
02_WDR_Overview.qxd 8/24/04 11:42 AM Page 3

4 WORLD DEVELOPMENT REPORT 2005
including Ethiopia, Ghana, Kenya, Vietnam,and Zambia.9 Lowering barriers to marketentry by 10 percent has been estimated toreduce the average price markup by nearly 6percent.10
As users of infrastructure, property, andfinance. Improving infrastructure, propertyrights, and finance can deliver broad bene-fits across the community. Building ruralroads helps firms get their goods to market,and in Morocco also increased primaryschool enrollment from 28 to 68 percent.11
Providing more secure rights to landencourages farmers and other firms toinvest and can ease their access to finance;in Peru more secure rights also allowedurban slum dwellers to increase theirincomes by working more hours outside thehome.12 Improving the functioning offinance markets helps firms take advantageof promising investment opportunities, andalso helps poor people weather familyemergencies, educate their children, andimprove their homes.
As recipients of tax-funded services or trans-fers. Firms and their activities are the prin-cipal sources of tax revenue for govern-ments, and growing economies generatemore taxes.13 A good investment climatecan thus expand the resources governmentshave available to fund public services(including health and education) and trans-fers to disadvantaged members of society.
Some investment climate improvementsdeliver broad benefits across society—suchas better macroeconomic stability and lesscorruption. Others have a more focusedimpact on particular locations or activities,creating opportunities for governments toinfluence the distribution of benefits. Gov-ernments can design those investment cli-mate improvements to be even more “pro-poor” by targeting constraints where poorpeople live and constraints to activitiespoor people benefit from, including in theircapacities as employees, entrepreneurs, andconsumers. This means that pro-poorapproaches are not limited to efforts thatfocus on constraints that face small firms.
Tackling costs, risks, and barriersto competitionGovernments influence the investment cli-mate through the impact of their policiesand behaviors on the costs, risks, and barri-ers to competition facing firms. Creating abetter investment climate requires govern-ments to tackle all three. Big variations ininvestment climates around the world high-light the potential for improvement.
CostsGovernment policies and behaviors influ-ence the costs of doing business and hencethe range of investment opportunities thatmight be profitable. Taxes are the mostobvious example. But governments alsohave important roles in providing publicgoods, supporting the provision of infra-structure, and addressing market failures.Weaknesses in government performance inthese roles can greatly increase the costs forfirms and make many potential opportuni-ties unprofitable. How greatly? The costs ofcontract enforcement difficulties, inade-quate infrastructure, crime, corruption, andregulation can amount to over 25 percent ofsales—or more than three times what firmstypically pay in taxes. Both the level and thecomposition of these costs vary widelyacross countries (figure 7).
Costs also have a time dimension. Thereare big variations in the time taken toobtain a telephone line and to clear goodsthrough customs, as well as in the time
Figure 6 The informal economy issubstantial in many developingcountries
Source: Schneider (2002).
0 25
Informal outputas percent of GDP
50 75
Thailand
Nigeria
Tanzania
Peru
Georgia
Russia
Sri Lanka
Morocco
Mexico
Figure 5 How 60,000 poor people rated jobs and self-employment as paths out of poverty
Source: Narayan and others (2000).
0 10 20 30 40 50 60 70
Other
Savings
Migration
Education
FemaleMale
Access to credit
Hard work, perseverance, or thrift
Skill acquisition
Access to agricultural land
Income from agriculture, livestock, or fishing
Benefit of family and kin
Income from wages or salaries
Self-employment or business
Percent
02_WDR_Overview.qxd 8/24/04 11:42 AM Page 4

Overview 5
managers need to spend dealing with offi-cials. The time it takes to register a newbusiness ranges from 2 days in Australia tomore than 200 days in Haiti.14
RisksBecause investment decisions are forwardlooking, firms’ judgments about the futureare critical. Many risks for firms, includinguncertain responses by customers and com-petitors, are a normal part of investment,and firms should bear them. But govern-ments have an important role to play inmaintaining a stable and secure environ-ment, including by protecting propertyrights. Policy uncertainty, macroeconomicinstability, and arbitrary regulation can alsocloud opportunities and chill incentives toinvest. Indeed, policy-related risks are themain concern of firms in developing coun-tries (box 2).
Barriers to competitionFirms prefer to face less competition, notmore. But barriers to competition that ben-efit some firms deny opportunities andraise costs for other firms and for con-sumers. They can also dull the incentives forprotected firms to innovate and increasetheir productivity. High costs and risks canact as barriers to entry. Governments alsoinfluence barriers more directly throughtheir regulation of market entry and exitand their response to anticompetitivebehavior by firms. Competitive pressure isreported to be significant by 90 percent offirms in Poland but only 40 percent of firmsin Georgia.15
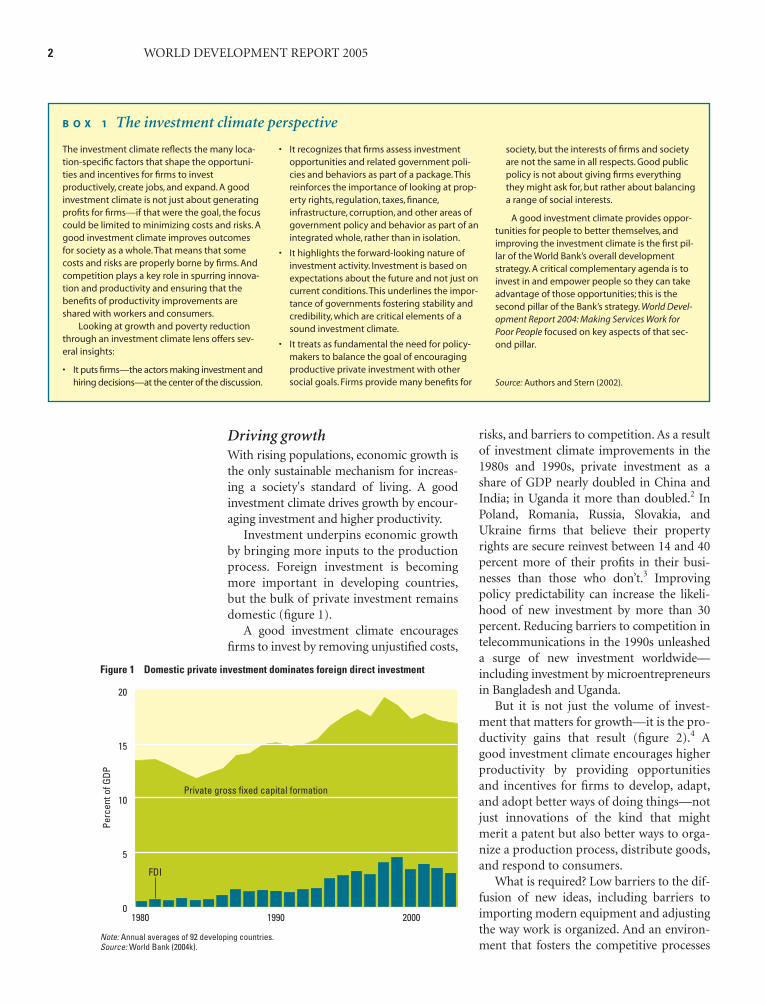
Variations within countries and across firmsEarly efforts to assess investment climatesfocused on developing a single indicator foreach country. But investment climates varynot only across countries but also withincountries because of differences in the waynational policies are administered and inthe policies and behaviors of subnationalgovernments. Even within a single location,the same conditions can affect firms differ-ently depending on the activity they areengaged in and their size, often hitting smalland informal firms the hardest (figure 8).
Figure 7 Costs vary widely in level and composition
Note: See figure 1.2 notes for methodology used.Source: World Bank Investment Climate Surveys. Countries chosen to illustrate range.
TanzaniaAlgeriaBrazilChinaPoland0
5
10
15
Cost
as
perc
ent o
f sal
es 20
25
30Contract enforcement difficultiesRegulationBribesCrimeUnreliable infrastructure
Early results of the World Bank’s program ofInvestment Climate Surveys cover morethan 26,000 firms in 53 countries.While pri-ority constraints can vary widely across and
even within countries, looking at the overallresults highlights the importance of policy-related risks, including policy uncertaintyand macroeconomic stability.
B O X 2 How do firms in developing countries rate variousinvestment climate constraints?
0 20 40 60Percent of firms reporting
80 100
TelecommunicationsAccess to landTransportation
Labor regulationsElectricity
Courts and legal systemSkills
Regulations & tax administrationCrime
Cost & access to financeCorruption
Tax rateMacro instability
Policy uncertainty
Severe obstacleMajor obstacleModerate obstacleMinor obstacle
Note: Firms were asked to rank the list of issues as to whether they were an obstacle to the growth and oper-ation of their business on a 5 point scale, from “no obstacle” to “severe obstacle.” Additional information onthe indicators is available at the back of the book, table A1.Source: World Bank Investment Climate Surveys.
02_WDR_Overview.qxd 8/24/04 11:42 AM Page 5
Progress requires more thanchanges in formal policiesMany investment climate improvementsrequire changes to laws and policies. Butmore is required. Over 90 percent of firms indeveloping countries report gaps betweenformal policies and what happens in prac-tice. And the content as well as the imple-mentation of policies are vulnerable to adeeper set of policy failures. At the heart ofthe problem lies a basic tension: Societiesbenefit greatly from the activities of firms,but the preferences of firms don’t fully matchthose of society. This tension is most evidentin taxation and regulation. Most firms com-plain about taxes, but taxes finance publicservices that benefit the investment climateand other social goals. Many firms wouldalso prefer to comply with fewer regulations,but sound regulation addresses market fail-ures and can therefore improve the invest-ment climate and protect other social inter-ests. Similar tensions can occur across mostareas of investment climate policymaking.
Creating a good investment climaterequires governments to balance these inter-ests. Complicating this task are the differ-ences in preferences and priorities betweenfirms. Firms have common perspectives onmany issues, but their views can diverge onothers—whether on market restrictions, the
structure of taxation, or the priority given toinfrastructure improvements in differentlocations. There can also be differences inpolicy preferences within firms, betweenowners and managers on matters of corpo-rate governance, or between owners andworkers on labor market policies. All gov-ernments must arbitrate those differences inan environment where firms, officials, andother stakeholders seek to tilt the outcometo their advantage.
Four resulting challengesResponding to this tension requires govern-ments to navigate four interrelated challengesthat cut across all areas of investment climatepolicy. The way governments respond tothose challenges has a big impact on invest-ment climates and thus on growth andpoverty. And each involves going beyondchanges in formal policies to confront deepersources of policy failure.
Restraining rent-seeking. Investment cli-mate policies are an enticing target for rent-seeking by firms, officials, and other groups.Corruption can increase the costs of doingbusiness—and when it extends to higherechelons of government, it can lead to deepdistortions in policies. Surveys show that themajority of firms in developing countriesexpect to pay bribes when dealing with offi-cials, but with big variations across coun-tries.16 Capture and patron-clientelism(reflecting unequal information and influ-ence in policymaking) can also create largedistortions, tilting policies in favor of somegroups at the expense of others. Eliminatingunjustified interventions in the economy,curbing discretion, and improving theaccountability of governments, particularlythrough greater transparency, help torestrain rent-seeking.
Establishing credibility. The confidence firmshave in the future—including the credibilityof government policies—determineswhether and how they invest. Policies thatlack credibility will fail to elicit the intendedinvestment response. Policy credibility canbe undermined by many things, includingthe temptations governments face to com-promise sound long-term policies to meetshorter-term or narrower goals (such as
6 WORLD DEVELOPMENT REPORT 2005
Figure 8 Small and informal firms are often hit hardestby investment climate constraints
Note: Based on 10 countries for which formal and informal surveyswere conducted, controlling for industry, country, ownership, andfirm age.Source: World Bank Investment Climate Surveys and WDR Surveysof Micro and Informal Firms.
50
25
Perc
enta
ge o
f firm
s
0
75
Have a loanfrom aformal
financialinstitution
Confidentthat courtswill uphold
propertyrights
Believeregulations
will beinterpretedconsistently
Large
MediumSmall
Informal
02_WDR_Overview.qxd 8/24/04 11:43 AM Page 6
extracting rents for policymakers or curryingfavor with some voters). Mechanisms thatallow governments to commit to sound poli-cies, discipline, and persistence all play a role.
Fostering public trust and legitimacy. Goodinvestment climates are nurtured by broadpublic support: a consensus in favor ofbuilding a more productive society can facil-itate policy improvements regardless of thepolitical party or group in office. Absence ofsuch support can make policy reform moredifficult and undermine the sustainability(and hence the credibility) of reforms. Openand participatory policymaking and effortsto ensure that the benefits of a better invest-ment climate extend widely in society canhelp to build that support.
Ensuring policy responses fit local condi-tions. To be effective, policy interventionsneed to take into account sources of poten-tial government failure and differences inlocal conditions. Failure to do so can lead topoor or even perverse results. Approachesthat demand enforcement capacity beyondthat available will not only fail to meet theirintended objective but also contribute toinformality and corruption and underminecredibility. Approaches that involve highlevels of discretion can expose firms to con-siderable uncertainty and risk when effec-tive safeguards against the misuse of thatdiscretion are not yet developed. Whileapproaches in today’s developed countriescan provide a valuable source of inspira-tion, care needs to be taken to adaptapproaches to local conditions. In somecases this may involve the choice of simplerrules with less discretion and additionalmeasures to restrain arbitrary behavior.
A process, not an eventGovernment policies and behaviors shapingthe investment climate cover a wide field,from contract enforcement and regulationto the provision of infrastructure and labormarket policy. Policies and behaviors in eacharea can influence the opportunities andincentives for firms. And the policy areasoften interact, with progress in one area pos-sibly influenced by progress in others. Thisimplies a broad agenda for government.
Overview 7
China, India, and Uganda illustrate somesimple lessons about strategies for makinginvestment climate improvements.
China and India have both grownimpressively in recent years, greatly reduc-ing poverty. China’s growth is officiallyreported at an average of 8 percent a yearfor the past 20 years, and the share of itspopulation living on less than $1 a day fellfrom 64 percent in 1981 to less than 17 per-cent in 2001. India’s growth has increasedfrom an average of 2.9 percent a year in the1970s to 6.7 percent by the mid-1990s, andthe share of its population living on lessthan $1 a day fell from 54 percent in 1980 to35 percent in 2000.
Yet neither country has an ideal invest-ment climate. China only recently gave con-stitutional recognition to private property,and its banking sector is dragged down bynonperforming loans. Problems in India’spower sector are legendary. Both countriesunleashed growth and reduced povertythrough what appeared to be fairly modestinitial reforms. China began with a rudimen-tary system of property rights that creatednew incentives for a substantial part of itseconomy. India began with early efforts toreduce trade barriers and other distortionsthat covered a significant part of its economy.
In both cases the reforms addressed impor-tant constraints, and were implemented inways that gave firms confidence to invest.And the initial reforms have been followed byongoing improvements that addressed con-straints that were less binding initially, andalso reinforced confidence in the future pathof government policy.
Such strategies are not limited to largecountries. Uganda launched its program ofinvestment climate improvements in theearly 1990s, after a period of civil conflict.Reforms covering many areas of the invest-ment climate provided the basis for grow-ing its economy by an average of more than4 percent per year during 1993—2002 (oreight times the average in Sub-SaharanAfrica) and reducing the share of its popula-tion living below the poverty line from 56percent in 1992 to 35 percent in 2000.Thepersistence of the government’s reformefforts enhanced its credibility, giving firmsthe confidence to invest.
Source: China: Chen and Wang (2001) Qian(2003), and Young (2000); India: Aghion andothers (2003), Ahluwalia (2002), De Long(2003), Rodrik and Subramanian (2004), Varsh-ney (1998), and Panagariya (2003); Uganda:Holmgren and others (2001) and World Bank(2001d).
B O X 3 Tackling a broad agenda—lessons from China,India, and Uganda
But no country has a perfect investmentclimate, and perfection on even one policydimension is not necessary for significantgrowth and poverty reduction. Experienceshows that progress can be made by address-ing important constraints in a way that givesfirms confidence to invest, and by sustaininga process of ongoing improvements (box 3).
Early rounds of economic reform weresometimes seen as one-off events. But invest-ment climate improvements involve an ongo-ing process of policy adjustment and finetuning across a wide domain. This is as truein today’s developed countries as it is indeveloping countries. Policies need regularreview to reflect changes in the conduct ofbusiness and lessons from ongoing experi-ence. Michael Porter has suggested thatreforms in this area are a marathon, not asprint,17 but even that assessment mayunderstate the task. International experienceprovides insights about the essential elementsof reform processes in this area: setting prior-
02_WDR_Overview.qxd 8/24/04 11:43 AM Page 7

ities, managing individual reforms, maintain-ing momentum, and strengthening govern-ment capabilities.
Setting prioritiesThe goal is to identify important con-straints that face firms. There are no stan-dard formulas. Instead, it requires an assess-ment in each case of current conditions, thepotential benefits from improvements, linkswith national or regional goals, and imple-mentation constraints.
Current conditions. The most important con-straints can differ widely across countries,even within a single region (figure 9). Gov-ernments can identify them by surveying andconsulting with firms, but recognizing thatexisting firms will not always reflect the per-spectives of future entrants. New sources ofdata also allow the benchmarking of currentpolicy performance against internationalcomparators in a growing number of areas—highlighting the scope for improvement.
Potential benefits. When the goal is to acceler-ate growth, an improvement that affects alarge part of the economy will usually have abigger impact than reforms that affect asmaller part. Progress in achieving a reason-able level of political and macroeconomic sta-bility is thus fundamental; without it reformsin other areas will gain little traction. Enhanc-ing policy credibility can also leverage the
investment response to reforms in any partic-ular policy area. A key consideration will bethe impact of improvements on opportunitiesfor poor people, including in their capacitiesas employees, entrepreneurs, and consumers.
Governments also need to consider ben-efits that may spill over beyond the firmsand activities affected most directly. Thesemay include spillovers to other firms (forexample, from foreign direct investment tolocal firms), to other policy areas (for exam-ple, from rights to land to access to finance),or to broader social goals (for example,infrastructure improvements benefiting thebroader community). There can also bespillovers to government capabilities, credi-bility, or constituency building.
Links with national or regional goals. Invest-ment climate improvements can affect firmsand activities differently. Because of this, pri-ority-setting will often be influenced by theweight governments place on a subset of thegoals a good investment climate can deliver.These often include integrating the informalor rural economies, unleashing the growthpotential of smaller firms, taking advantageof international openness, or enabling firmsto climb the technology ladder.
Implementation constraints. At any point therange of potential policy improvements willusually be constrained by administrative andpolitical feasibility. Well-designed strategiesaddress these constraints through effectivemanagement of reforms and ongoingstrengthening of government capabilities.
Managing individual reformsThere is often resistance to investment cli-mate reforms from those who benefit fromthe status quo. This resistance may comefrom firms or other interest groups benefit-ing from market distortions or other specialprivileges; officials benefiting from bribesor other perquisites of office; or even thewider community when the implications ofreform are not certain. Experience showsthat progress is possible when committedgovernments communicate to build publicsupport, engage stakeholders construc-tively, and (when appropriate) providesome form of compensation to those disad-
8 WORLD DEVELOPMENT REPORT 2005
Figure 9 Constraints reported by firms—comparingBulgaria, Georgia, and Ukraine
Note: Indices based on surveys of formal sector firms. Values arenormalized by regional maxima and minima for each indicator.Resulting indicators range from 0 (best) to 1 (worst). Countries cho-sen to highlight potential differences. See figure 3.1 notes for moredetails.Source: World Bank Investment Climate Surveys and BEEPS II.
Finance
1
0.5
Taxation
Regulation
Security & stability
Labor
Infrastructure
Ukraine
Georgia
Bulgaria
02_WDR_Overview.qxd 8/24/04 11:43 AM Page 8

Overview 9
vantaged by change. Special efforts to helpvulnerable groups cope with change are alsoimportant, particularly when economywidesafety nets are not yet in place.
Maintaining momentumMany countries are creating specialist insti-tutions to help with specific tasks and tosustain progress even through changes ingovernment. These institutions can per-form one or a combination of several roles:consultation with stakeholders, policy coor-dination, and the more systematic review ofexisting investment climate constraints.Latvia, Senegal, Turkey, and Vietnam illus-trate possible approaches. Governments arealso creating mechanisms to review newpolicy and regulatory proposals more sys-tematically so that they do not introduceunwarranted distortions.
Strengthening governmentcapabilitiesStrengthening capabilities in regulation isoften a high priority. Traditional models forbuilding capacity are being complementedby approaches that facilitate peer-to-peerlearning. Local capacity can also be aug-mented by contracting out some specialistfunctions—a common strategy even indeveloped countries. Governments need toimprove their ability to monitor the perfor-mance of their private sectors so that theycan identify trends and emerging issues andevaluate the impact of their policies.
Focus on delivering the basicsIndustrial development is usually a processof discovery, making it difficult to predictwhat a country or region will be good atproducing. This underscores the impor-tance of creating a good investment climatefor all firms in the economy and so focusingon improving the “basics.” Internationalexperience highlights promising approachesin each of the four core areas of a soundinvestment climate: stability and security,regulation and taxation, finance and infra-structure, and workers and labor markets.
Stability and securityThe outbreak of war or other widespreadviolence spells the end of almost all produc-tive investment, and a reasonable level of
political and macroeconomic stability is athreshold requirement for other policyimprovements to gain much traction. Unsta-ble or insecure environments have their mosttangible affect on investment through theirimpact on property rights, which link effortwith reward. The better protected theserights from government or third parties, thestronger the link between effort and reward,and thus the greater the incentives to opennew businesses, to invest more in existingones, and simply to work harder. Studies inmany countries show that the more securethe rights, the faster the growth. Improvingthe security of property rights requiresaction in four main areas: verifying rights toland and other property, facilitating contractenforcement, reducing crime, and ending theuncompensated expropriation of property.
Verifying rights to land and other property.Providing more secure rights to land andother property encourages investment andcan ease access to finance. Experience inPeru, Thailand, and many other countrieshighlights the benefits of clarifying owner-ship of land and maintaining an effectiveregistration system. Registries for equip-ment and other forms of moveable prop-erty also play an important role.
Facilitating contract enforcement. In manydeveloping countries, firms lack confidencein the courts to uphold their property rights(figure 10). Improving courts is thus a high
Figure 10 Firms in many developing countries lackconfidence in the courts to uphold their property rights
0 20 40 60 80 100
Malaysia
Algeria
Zambia
Brazil
Czech Rep.
Kenya
Kyrgyzstan
Guatemala
Moldova
Bangladesh
Percent
Source: Investment Climate Surveys. Countries chosen to illustrate range.
02_WDR_Overview.qxd 8/24/04 11:43 AM Page 9

priority. Facilitating the free flow of reputa-tion information and removing unnecessaryimpediments to the use of alternative dis-pute resolution mechanisms can also help.
Reducing crime. Crime imposes large costs onsocieties—around a quarter of GDP in somecountries in Latin America.18 Surveys showthat crime is also a serious constraint formany firms in all regions. Promising strategiesinvolve efforts to prevent and deter crime, aswell as to improve enforcement. Communitypolicing strategies along the lines of thoseapplied in New York City are being pursuedby more countries around the world.
Ending the uncompensated expropriation ofproperty. All governments reserve the right toexpropriate private property in some circum-stances. Reducing concerns about the arbi-trary exercise of this power requires crediblerestraints on expropriation without prompt,adequate, and effective compensation.
Regulation and taxationThe way governments regulate and tax firmsand transactions, domestically and at the bor-der, plays a big role in shaping the investmentclimate. Sound regulation addresses marketfailures that inhibit productive investmentand reconciles the interests of firms withwider social goals. Sound taxation generatesthe revenues to finance the delivery of publicservices that improve the investment climateand meet other social objectives. The chal-lenge all governments struggle with is how tomeet these objectives without underminingthe opportunities and incentives for firms toinvest productively, create jobs, and expand.While there can be tensions between firms’preferences and social goals in this area, thereis huge scope for improving approaches inmost developing countries without compro-mising broader social interests.
Improving domestic regulation. Too often,governments pursue regulatory approachesthat fail to achieve the intended social objec-tives because of widespread informality, yetharm the investment climate by imposingunnecessary costs and delays, inviting cor-ruption, increasing uncertainty and risk, andcreating unjustified barriers to competition.
The key is to strike a better balance betweenmarket failures and government failures,including by ensuring that approaches areadapted to local conditions and by enhanc-ing transparency. Successful reforms removeunjustified burdens and streamline proce-dures. They reduce regulatory uncertaintyand risk by curbing discretion and expand-ing consultation. And they remove unjusti-fied barriers to competition by reducing reg-ulatory barriers to entry and exit and bytackling anticompetitive behavior by firms.
Improving domestic taxation. Tax rates indeveloping countries are similar to those indeveloped countries. But a high level ofinformality, coupled with poor administra-tion and corruption, reduces revenue collec-tion, places a disproportionate burden onthose who do comply, and distorts competi-tion. Keeping the size of government incheck and spending public money efficientlyhelp ease the pressure on revenue collection.Beyond this, broadening the tax base andsimplifying tax structures can help. Increas-ing the autonomy of tax agencies has alsoimproved performance in Peru and manyother countries.
Improving regulation and taxation at theborder. Most countries have reduced barri-ers to international trade and investment inrecent years, but many barriers remain.Improving customs administrations canalso offer big benefits, with successfulapproaches exploiting information tech-nologies to reduce delays and corruption, asin Ghana, Morocco, and Singapore.19
Finance and infrastructureFinancial markets, when functioning well,connect firms to lenders and investors will-ing to fund their ventures and share some ofthe risks. Good infrastructure connectsfirms to their customers and suppliers andhelps them take advantage of modern pro-duction techniques. Conversely, inadequa-cies in finance and infrastructure create bar-riers to opportunities and increase costs andrisks for microenterprises as well as multi-nationals. By impeding new entry into mar-kets, inadequacies also limit the competitivediscipline facing incumbent firms, dulling
10 WORLD DEVELOPMENT REPORT 2005
02_WDR_Overview.qxd 8/24/04 11:43 AM Page 10

their incentives to innovate and improvetheir productivity. Such inadequacies arelarge in developing countries (figure 11).
Improving finance. The underlying chal-lenge with finance flows from informationproblems, which are often exacerbated byweak protection of property rights. Govern-ment intervention through state ownership,barriers to competition, directed or subsi-dized credit, and similar approaches cancreate deep distortions and retard financialmarket development. Better approachesrecognize that financial markets are notonly part of the investment climate forfirms, but are also profoundly shaped by theinvestment climate facing providers offinancial services. More governments arethus reducing barriers to competition(including paving the way for nonbankfinancial intermediaries and commercialmicrofinance), strengthening creditor andshareholder rights, supporting the estab-lishment of credit bureaus and other mech-anisms to address information problems,and improving bank regulation.
Improving infrastructure. The underlyingchallenge with infrastructure flows frommarket power associated with economies ofscale. But responses focusing on provisionby public sector monopolies have producedpoor results in many developing countries.Recognizing this, governments are nowfocusing on creating a better investment cli-mate for providers of infrastructure ser-vices. Competition, improved regulation,and private participation have transformedtelecommunications and are playing a big-ger role in electricity supply and ports. Forroads, promising strategies include con-tracting-out services and improving fund-ing mechanisms. Governments are alsoworking to improve management of publicresources—to get more for their moneywhen they finance or subsidize infrastruc-ture services.
Workers and labor marketsGovernment intervention in labor marketsshould help connect people to decent jobs.Improving policy performance requiresprogress on three fronts: fostering a skilled
workforce; crafting market interventions tobenefit all workers; and helping workerscope with change.
Fostering a skilled workforce. Improving theinvestment climate goes hand in hand withenhancing human capital. A skilled work-force is essential for firms to adopt new andmore productive technologies, and a betterinvestment climate raises the returns toinvesting in education. Government sup-port for education and training affects theprospects for individuals and the ability offirms to pursue new opportunities. Manyfirms in developing countries rate inade-quate skills of workers as a serious obstacleto their operations (figure 12). Govern-ments need to take the lead in making edu-cation more inclusive and relevant to theskill needs of firms, strengthening qualityassurance mechanisms, and creating a soundinvestment climate for providers of educa-tion and training services.
Crafting market interventions to benefit allworkers. Regulation of labor markets isusually intended to help workers. But ill-considered approaches discourage firmsfrom creating more jobs and contribute to aswelling of the informal workforce thatlacks statutory protection. When this is thecase, some workers may benefit, but the
Overview 11
Figure 11 The inadequacies of finance and infrastructure are severe for manydeveloping countries
0 10 20 30 40 50 60 70
FinanceInfrastructure
South Asia
Sub-Saharan Africa
Latin America & the Caribbean
Europe & Central Asia
East Asia & Pacific
Middle East & North Africa
Percent of firmsNote: Figure shows the share of firms that report access to finance, and any of electricity, telecommu-nications, or transportation, as “major” or “severe” obstacles to their business.Source: World Bank Investment Climate Surveys.
02_WDR_Overview.qxd 8/24/04 11:43 AM Page 11
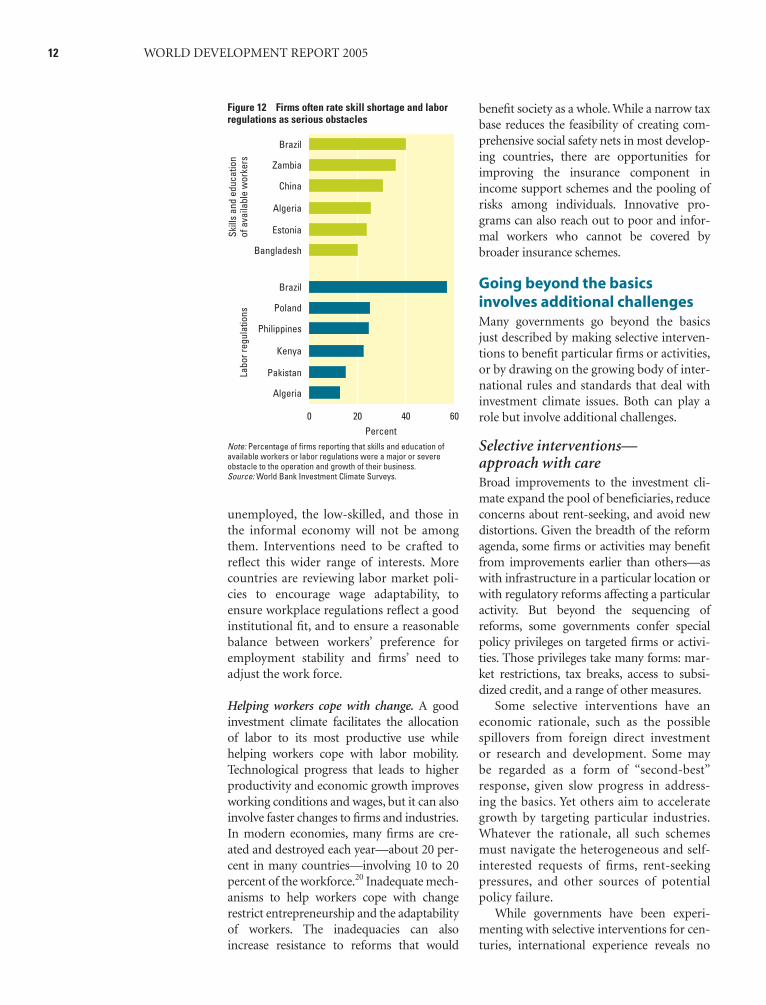
unemployed, the low-skilled, and those inthe informal economy will not be amongthem. Interventions need to be crafted toreflect this wider range of interests. Morecountries are reviewing labor market poli-cies to encourage wage adaptability, toensure workplace regulations reflect a goodinstitutional fit, and to ensure a reasonablebalance between workers’ preference foremployment stability and firms’ need toadjust the work force.
Helping workers cope with change. A goodinvestment climate facilitates the allocationof labor to its most productive use whilehelping workers cope with labor mobility.Technological progress that leads to higherproductivity and economic growth improvesworking conditions and wages, but it can alsoinvolve faster changes to firms and industries.In modern economies, many firms are cre-ated and destroyed each year—about 20 per-cent in many countries—involving 10 to 20percent of the workforce.20 Inadequate mech-anisms to help workers cope with changerestrict entrepreneurship and the adaptabilityof workers. The inadequacies can alsoincrease resistance to reforms that would
benefit society as a whole. While a narrow taxbase reduces the feasibility of creating com-prehensive social safety nets in most develop-ing countries, there are opportunities forimproving the insurance component inincome support schemes and the pooling ofrisks among individuals. Innovative pro-grams can also reach out to poor and infor-mal workers who cannot be covered bybroader insurance schemes.
Going beyond the basicsinvolves additional challengesMany governments go beyond the basicsjust described by making selective interven-tions to benefit particular firms or activities,or by drawing on the growing body of inter-national rules and standards that deal withinvestment climate issues. Both can play arole but involve additional challenges.
Selective interventions—approach with careBroad improvements to the investment cli-mate expand the pool of beneficiaries, reduceconcerns about rent-seeking, and avoid newdistortions. Given the breadth of the reformagenda, some firms or activities may benefitfrom improvements earlier than others—aswith infrastructure in a particular location orwith regulatory reforms affecting a particularactivity. But beyond the sequencing ofreforms, some governments confer specialpolicy privileges on targeted firms or activi-ties. Those privileges take many forms: mar-ket restrictions, tax breaks, access to subsi-dized credit, and a range of other measures.
Some selective interventions have aneconomic rationale, such as the possiblespillovers from foreign direct investmentor research and development. Some maybe regarded as a form of “second-best”response, given slow progress in address-ing the basics. Yet others aim to accelerategrowth by targeting particular industries.Whatever the rationale, all such schemesmust navigate the heterogeneous and self-interested requests of firms, rent-seekingpressures, and other sources of potentialpolicy failure.
While governments have been experi-menting with selective interventions for cen-turies, international experience reveals no
12 WORLD DEVELOPMENT REPORT 2005
Figure 12 Firms often rate skill shortage and laborregulations as serious obstacles
0 20 40Percent
60
Bangladesh
Estonia
Algeria
China
Zambia
Brazil
Algeria
Pakistan
Kenya
Philippines
Poland
Brazil
Skill
s an
d ed
ucat
ion
of a
vaila
ble
wor
kers
Labo
r reg
ulat
ions
Note: Percentage of firms reporting that skills and education ofavailable workers or labor regulations were a major or severeobstacle to the operation and growth of their business. Source: World Bank Investment Climate Surveys.
02_WDR_Overview.qxd 8/24/04 11:43 AM Page 12

sure-fire strategies. Some countries in EastAsia appear to have made selective interven-tions successfully, but recent work suggeststhat the contribution may have been rela-tively modest. Experience also shows howdifficult it is to replicate similar approacheselsewhere and in what is now a very differentinternational environment. Overall, experi-ence with government efforts to “pick win-ners” is discouraging. Efforts to wooinvestors through special inducements havealso met with mixed success; even wheninvestment expands in the targeted industry,it is difficult to know whether the induce-ments were necessary or cost-effective.Indeed, there are many examples of selectiveinterventions going spectacularly wrong—atbest wasting public resources, but sometimescreating large distortions that harm theinvestment climate, and distracting attentionfrom broader improvements.
Even in the best of circumstances, manyselective interventions seem to be a gamble.The more ambitious the goal and the weakerthe governance, the longer the odds of suc-cess. Selective interventions should thus beapproached with caution, and not viewed asa substitute for broader investment climateimprovements. The hazards of such strate-gies can be reduced by ensuring thatschemes have a clear objective and rationale,focus on the sources of problems ratherthan the symptoms, match the instrumentto the rationale, impose discipline on theirbeneficiaries, are administered transpar-ently, and are reviewed regularly.
International rules and standards—many tradeoffsThe body of international rules and stan-dards dealing with investment climate mat-ters has grown exponentially in recentdecades. There are now more than 2,200bilateral investment treaties, over 200regional cooperation arrangements, and aplethora of new and proposed multilateralinstruments covering most aspects of theinvestment climate. International arrange-ments have a clear role in reducing barriersto international trade and investment. Butthey might also contribute to investmentclimate improvements in three broaderways: by enhancing credibility, by harmo-
Overview 13
nizing rules and standards, and by address-ing international spillovers. All threeinvolve tradeoffs.
Enhancing credibility. By increasing thecosts of policy reversal, entering into inter-national obligations can reinforce the credi-bility of government policies and sostrengthen the investment responses offirms. But by design the tradeoff is foregonepolicy flexibility, which means that com-mitments need to be considered carefully.Strategies that involve the strongest form ofcommitment—allowing firms to enforcetreaty commitments against governmentsdirectly through binding international arbi-tration—can enhance credibility but wouldbenefit from efforts to improve the trans-parency of the arbitration process. Strate-gies that rest more on the reputation con-cerns of governments can also contribute topolicy credibility, but their impact willdepend on whether participants insist onhigh levels of mutual compliance.
Harmonizing rules and standards. Toreduce costs in international transactions,many efforts focus on harmonizing particu-lar rules or standards, with examples rang-ing from the harmonization of businesslaws in West Africa to the development ofuniform accounting standards. There canbe benefits for developing countries. Butthere can also be tradeoffs with adaptingapproaches to local conditions and withallowing a degree of competition betweenapproaches. There are also tradeoffs amongmultilateral, regional, and bilateralapproaches to harmonization.
Addressing international spillovers. Overthe past two decades, concerted globalaction has been promoted for a growingnumber of matters where the effects of pol-icy actions by one country may spill overonto others. Addressing internationalspillovers in the environmental area isimportant for sustainable development.When the suggested spillover is less tangibleor the benefits less evenly shared, coopera-tive action is more difficult. Proposals inthese and other areas need to give dueweight to the perspectives of developingcountries.
02_WDR_Overview.qxd 8/24/04 11:43 AM Page 13

The international communitycan lend a handHelping to improve investment climateconditions in developing countries can pro-vide huge development dividends. Themanufacturing value-added unleashed byinvestment climate improvements in even asingle country can far exceed the develop-ment assistance provided worldwide (figure13). The international community can helpdeveloping countries in three main ways: byremoving distortions in developed coun-tries that harm the investment climates ofdeveloping countries; by providing more,and more effective, assistance; and by tack-ling the substantial knowledge agenda.
Removing distortions in developedcountriesDeveloping countries are not alone in grap-pling with investment climate improve-ments. The trade and market distortionscreated by policies in developed countriesimpose large costs on their own economies.These distortions also undermine opportu-nities and incentives for firms to invest indeveloping countries. It has been estimatedthat removing trade protection and relateddistortions in developed countries couldprovide gains to developing countries of$85 billion by 201521—or more than four
times the development assistance currentlyprovided for investment climate improve-ments.
Providing more, and more effective,assistanceThe international community has long pro-vided development assistance to supportthe design and implementation of invest-ment climate improvements. Substantialsupport is also provided directly to firms.There is room to do better in both areas.
Development assistance for investment cli-mate improvements. Around one quarter ofofficial development assistance, or around$21 billion per year, currently focuses onsupport to investment climate improve-ments, with the bulk directed to infrastruc-ture development.22 Technical assistanceplays an important role, but represents just13 percent of assistance for the investmentclimate, and its effectiveness can suffer fromsupply-driven approaches and from inade-quate attention to ensuring recommendedsolutions reflect a good fit with local condi-tions.
Support provided directly to firms andtransactions. Well-designed support of thiskind can complement investment climateimprovements. Development assistance tosupport small firms through credit linesand capacity building has a mixed trackrecord, and would benefit from the sameguidelines suggested for selective interven-tions made by governments. Developedcountries and international agencies alsoprovide around $26 billion per year in non-concessional loans or guarantees to supportspecific transactions. Increasing the empha-sis on the contribution these transactionsmake to the creation of more transparentand competitive markets would expand thedevelopment impact of this support.
Tackling the substantial knowledgeagendaNew sources of data of the kind drawn onin this Report add to our understanding ofthe foundations of growth and poverty
14 WORLD DEVELOPMENT REPORT 2005
Figure 13 Manufacturing value-added in a single country can far exceed net globalofficial development finance
1970 1975 1980 1985 1990 1995 2000
Billi
ons
of 1
995
dolla
rs
0
100
200
300
400
500
India
China
South Korea
Global net officialdevelopment finance
Source: OECD online database (www.oecd.org) and World Bank (2004k).
02_WDR_Overview.qxd 8/24/04 11:43 AM Page 14

reduction. But a long agenda lies ahead inbroadening and deepening this understand-ing to provide guidance to policymakers.This includes expanding the developmentof objective indicators of the investment cli-mate and the systematic analysis of countryexperiences to distill emerging lessons.
By working together on these themes,the international community can do a lot tohelp create better investment climates indeveloping countries—and so contribute toa more balanced, inclusive, and peacefulworld.
Overview 15
The investment climate is central togrowth and poverty reductionImproving the opportunities and incentives forfirms of all types to invest productively, createjobs, and expand should be a top priority forgovernments. It is not just about increasing thevolume of investment but also spurring produc-tivity improvements that are the keys to sustain-able growth.
• The goal is to create a better investment cli-mate for everyone. A good investmentclimate benefits society as a whole, not justfirms. And it embraces all firms, not just largeor politically connected firms.
• Expanding opportunities for young people isa pressing concern for developing countries,where 53 percent of people live on less thanUS$2 a day, youths have more than doublethe average unemployment rate, and popula-tions are growing rapidly.
Reducing unjustified costs is critical, butpolicy-related risks and barriers tocompetition also need to be tackledAll three matter for firms and thus for growthand poverty reduction.
• Costs associated with weak contract enforce-ment, inadequate infrastructure, crime, cor-ruption, and regulation can amount to over
25 percent of sales—or more than threetimes what firms typically pay in taxes.
• Firms in developing countries rate policyuncertainty as their top concern.This andother sources of policy-related risk—such asinsecure property rights, macroeconomicinstability, and arbitrary regulation—chillincentives to invest. Improving policypredictability can increase the likelihood ofnew investment by over 30 percent.
• Barriers to competition benefit some firmsbut deny opportunities and increase costs toother firms and to consumers.They alsoweaken incentives for protected firms toinnovate and improve their productivity.Increasing competitive pressure can increasethe probability of firm innovation by morethan 50 percent.
Progress requires more than changes toformal policiesOver 90 percent of firms claim gaps between for-mal rules and what happens in practice, and theinformal economy accounts for more than half ofoutput in many developing countries. Creating abetter investment climate requires governmentsto bridge these gaps and to tackle deepersources of policy failure that undermine a soundinvestment climate.This requires efforts:
• to restrain corruption and other forms of rentseeking that increase costs and distort poli-cies;
• to build policy credibility to give firms theconfidence to invest;
• to foster the public trust required to enableand sustain policy improvements; and
• to ensure policy responses are crafted to fitlocal conditions.
Investment climate improvements are aprocess, not an eventGovernment policies and behaviors influencingthe investment climate cover a wide field. Buteverything does not have to be fixed at once,and perfection on even a single policy dimen-sion is not required. Significant progress can bemade by addressing important constraints fac-ing firms in a way that gives them theconfidence to invest—and by sustaining aprocess of ongoing improvements.
• Because constraints differ widely across andeven within countries, priorities need to beassessed in each case. Reform processes ben-efit from effective public communication andother measures to build consensus and main-tain momentum.
B O X 4 Main messages from World Development Report 2005
02_WDR_Overview.qxd 8/24/04 11:43 AM Page 15

02_WDR_Overview.qxd 8/24/04 11:43 AM Page 16

THE REPORT ARGUES THAT THE INVESTMENT CLIMATE plays a centralrole in growth and poverty reduction. This part shows why improvingthe investment climates of their societies should be a top priority forgovernments, and looks at how the necessary improvements can bemade.
Chapter 1—The investment climate, growth, and poverty showshow governments influence the investment climate and how improv-ing the investment climate drives growth and reduces poverty.
Chapter 2—Confronting the underlying challenges looks at whyimproving the investment climate can be difficult, and the sources ofpotential policy failure that governments must face.
Chapter 3—Tackling a broad agenda reviews international experi-ence in making investment climate improvements and suggests practi-cal strategies for accelerating and broadening progress.
Improving the InvestmentClimate
IP A R T
03_WDR_PO1_Ch01.qxd 9/3/04 11:17 AM Page 17

03_WDR_PO1_Ch01.qxd 9/3/04 11:17 AM Page 18
19
A good investment climate fosters produc-tive private investment—the engine forgrowth and poverty reduction. It createsopportunities and jobs for people. Itexpands the variety of goods and servicesavailable and reduces their cost, to the ben-efit of consumers. It supports a sustainablesource of tax revenues to fund other impor-tant social goals. And many features of agood investment climate—including effi-cient infrastructure, courts, and financemarkets—improve the lives of peopledirectly, whether they work or engage inentrepreneurial activities or not.
Improving the investment climate—the opportunities and incentives for firmsto invest productively, create jobs, andexpand—is the key to sustainable progressin attacking poverty and improving livingstandards (box 1.1). Varying enormouslyaround the world, both across and withincountries, the investment climate influ-ences the decisions of firms of all types:the decision of the farmer to sow moreseed; the decision of the microentrepre-neur to start a business; the decision of thelocal manufacturing company to expandits production line and hire more workers;the decision of the multinational to locateits next global production facility.
This chapter looks at how improvinggovernment policies and behaviors thatshape the investment climate matters notonly for firms—it also drives growth andimproves opportunities for everyone. Thechapter opens by looking at what we knowabout the investment climate. Some of themany factors influencing the decisions offirms to invest productively, create jobs, andexpand are specific to each firm—its ideas,its capabilities, and its strategies. Many
more are specific to each location, to theinvestment climate in its broadest sense.Governments may have limited influenceover such factors as geography. But theyhave much more influence over the securityof property rights, the approaches to regu-lation and taxation (both at and within theborder), the adequacy of infrastructure, thefunctioning of finance and labor markets,and broader features of governance such ascorruption.
Earlier work looking at differences inincomes across countries highlighted therole of “institutions”—the broad organi-zational framework governing markettransactions. New sources of data drawnon in this Report allow us to go furtherand provide fresh insights into how thedetails of institutional arrangements varyacross and within countries and influencethe level and productivity of privateinvestment.
The chapter then looks at how variationsin government policies and behaviors affectthe investment climate—and thus growthand poverty. The key is to remove unjusti-fied costs, risks, and barriers to competitionfaced by firms of all types. An investmentclimate that encourages growth creates sus-tainable jobs and opportunities formicroentrepreneurs—the key pathways outof poverty for poor people, pathways thatwill become more crowded with comingdemographic changes. A good investmentclimate also helps to reduce the costs ofgoods consumed by poor people, andimproves the living conditions of poor peo-ple directly. It also contributes to anexpanding tax base that allows governmentsto invest in the health, education, and wel-fare of its people.
The investment climate,growth, and poverty
1c h a p t e r
03_WDR_PO1_Ch01.qxd 9/3/04 11:17 AM Page 19

The key message: for governments at alllevels, a top priority should be to improve theinvestment climates of their societies. To doso, they need to understand how their poli-cies and behaviors shape the opportunitiesand incentives facing firms of all types,domestic and foreign, formal and informal,small and large, urban and rural. The agendais broad and challenging, but delivering on itis the key to reducing poverty, improving liv-ing standards, and creating a more inclusive,balanced, and stable world.
Understanding the investmentclimate
Firms invest to make profits. Their invest-ment decisions are affected by their ownideas, capabilities, and strategies, and by theirassessment of the opportunities and incen-tives in particular locations. Early efforts tounderstand how governments influence theselocation-specific factors focused on broadindicators of country risk, often based onsurveys of international experts and usually
20 WORLD DEVELOPMENT REPORT 2005
The investment climate is the set of location-specific factors shaping the opportunities andincentives for firms to invest productively, createjobs, and expand. Government policies andbehaviors exert a strong influence through theirimpact on costs, risks, and barriers to competi-tion—and are the focus of this Report.
Firms are the starting point of theframework.This Report uses that term to includethe full range of economic agents ranging fromindividual farmers and microentrepreneurs todomestic manufacturing establishments andmultinationals, regardless of their size, activity,or formal legal status.
The horizontal plane in the diagram aboverepresents their investment decisions.Firmsdecide whether to incur costs today to change oraugment production in the future,such as invest-ing in machinery, facilities,and research and devel-opment.Firms come to the decision with differentcapabilities and strategies.Their decision is moti-vated by the quest for profits—and profitability isinfluenced by the costs, risks,and barriers to com-petition associated with the opportunity.The vol-ume and productivity of the resulting investmentcontribute to growth and poverty reduction.
A good investment climate is not just aboutgenerating profits for firms—if that were the
goal, the focus could be narrowed to minimizingcosts and risks. It is about improving outcomesfor society. Many costs and risks are properlyborne by firms. And reducing barriers to compe-tition expands opportunities, spurs innovation,and ensures that the benefits of productivityimprovements are shared with workers andconsumers. A good investment climate is onethat benefits everyone in two dimensions. First,it serves society as a whole, rather than justfirms, including through its impact on job cre-ation, lower prices, and broadening the tax base.Second, it embraces all firms, not just large orinfluential firms.
The vertical plane in the figure represents theinvestment climate. Some aspects of the invest-ment climate, including geography and marketsize, are difficult for governments to change. Butgovernments have more decisive influence overa range of other factors.The specific influencesaddressed in the Report are policies closely tiedto investment behavior.Thus, the forward-looking nature of investment points to theimportance of stability and security, especiallythe security of property rights (chapter 4). Regu-lations and taxes qualify property rights and havefirst-order implications for costs, risks, and barriersto competition (chapter 5). Finance,infrastructure, and labor are the key inputs toinvestment activities (chapters 6 and 7).
But firms do not respond to formal policiesalone.They make judgments about how thosepolicies will be implemented in practice. Andfirms (like other stakeholders) will try to influencepolicies in ways favorable to them.Thus, issues ofgovernment behavior and governance, in thebroadest sense, are paramount (chapter 2). It isthe interaction of formal policies and governancethat firms assess in making investment decisions.This has important implications for strategies toimprove the investment climate (chapter 3).
B O X 1 . 1 What do we mean by the investment climate?
03_WDR_PO1_Ch01.qxd 9/3/04 11:17 AM Page 20

resulting in a single score for each country.1
Many studies focused on the narrower ques-tion of the constraints facing foreign firms.The last 20 years have seen a broadening anddeepening of efforts to understand how vari-ous location-specific factors influence differ-ences in incomes across countries.
Researchers began by looking at variousaggregate indicators of a country’s institu-tional and policy environment, such as therule of law, corruption, openness to trade,legal origins, and financial sector depth.2
Their work generated useful insights—themost important is that secure property rightsand good governance are central to eco-nomic growth (figure 1.1).3 However, relyingon aggregate indicators and cross-countryregressions provides limited insights into theheterogeneity of institutional arrangementsacross and within countries—or the impactof those arrangements on the investmentdecisions of different types of firms.4 It isalso difficult to distinguish the effects of spe-cific policy actions from the broader back-ground institutions that influence the con-tent and impact of those actions.5
These limits inspired the search for moredisaggregated evidence on the quality of alocation’s investment climate and for waysto trace the impact of that climate on theinvestment decisions and performance offirms. The World Bank is contributing tothis work in several ways, including Invest-ment Climate Surveys and the Doing Busi-ness Project (box 1.2). These and other newsources of data provide fresh insights abouthow investment climates vary across and
within countries—and impact on firm per-formance, growth, and poverty.
The opportunities and incentives firmshave to invest productively, create jobs, andexpand can be traced through their impacton expected profitability. And profitability isinfluenced by the costs, risks, and barriers tocompetition associated with particularopportunities. Each factor matters indepen-dently, and all three are interrelated. Somerisks can be mitigated by incurring greatercosts. High costs or risks can be barriers tocompetition. Barriers to competition canreduce risks for some firms but deny oppor-tunities and increase costs for others.
Many factors shape the costs, risks, andbarriers to competition in a particularlocation. Factors like geography are difficult
The investment climate, growth, and poverty 21
Note: The horizontal axis represents the average of “rule of law,”“government effectiveness,” “regulatory quality,” and “control ofcorruption” as defined by Kaufmann, Kraay, and Mastruzzi (2003).The variables are normalized so that the average is at 0, and thestandard deviation equals 1.Source: Kaufman, Kraay, and Mastruzzi (2003).
–2 –1 0Aggregate governance measure
Log
GDP
per c
apita
, 200
1
1 2
10
12
8
6
Figure 1.1 Institutions, broadly measured, clearlymatter for growth
The World Bank recently launched two majorinitiatives to understand more about the deter-minants of growth and productivity.
• Investment Climate Surveys. Large randomsamples of firms have been interviewed tocollect assessments of constraints facingfirms including governance, regulation, taxa-tion, finance, infrastructure, and labor.The sur-veys also collect objective data, which allowinvestment climate indicators to be linkedwith firm performance to understand theirimpact on productivity, investment decisions,and employment decisions.The surveys were
launched in 2001, with about 20 new surveysconducted each year since.This Report drawson early results from this work, which coversmore than 26,000 firms in 53 countries, andtogether employ some 4.8 million people.TheInvestment Climate Surveys build on theWorld Business Environment Surveys,launched in 1999, which covered smallersamples of firms and relied more heavily onperception data.
• Doing Business Project. Covering over 130countries, this project reports on the costs ofdoing business for a defined hypothetical firmand transaction based on the views of
selected experts (lawyers, accountants).Underlying information includes the time andcosts of complying with various areas of regu-lation—including business registration, con-tract enforcement, and labor regulation. A firstreport was published in 2003, with annualupdates scheduled with additional topics.
Selected data from these sources appear atthe back of this Report.
This Report complemented these initiativesby surveying 3,250 entrepreneurs in the infor-mal sector in 11 countries recently completingInvestment Climate Surveys.
B O X 1 . 2 New sources of investment climate data from the World Bank
03_WDR_PO1_Ch01.qxd 9/3/04 11:17 AM Page 21

to influence (box 1.3). Governments havemore decisive influence over many otheraspects of the investment climate, such asthe security of property rights, approachesto regulation and taxation, the adequacy ofinfrastructure, and the functioning offinance and labor markets (table 1.1). Gov-ernment policies on these subjects inter-act—for example, secure rights to land canease access to finance. Moreover, the contentand impact of formal policies in these areasare determined by broader features of thegovernance environment, including corrup-tion and credibility (chapter 2). Firms assess
how government policies and behaviorsinteract as part of a package to influence thecosts, risks, and barriers to competitionassociated with particular opportunities.
The new data show how costs, risks, andbarriers to competition can affect firms’investment behavior—and how they varyaround the world.
CostsThe costs of producing and distributingproducts influences the range of opportuni-ties that may be profitable. Many costs tofirms are a normal function of commercialactivity, while others flow directly or indi-rectly from government policies and behav-iors. The most obvious direct cost is taxation.But governments have important roles inproviding public goods, supporting the pro-vision of infrastructure, and mitigating othermarket failures. The ways they do this canhave a big impact on the costs that firms face.For example, the costs associated with crime,corruption, regulation, unreliable infrastruc-ture, and poor contract enforcement canamount to over 25 percent of sales—or morethan three times what is typically paid intaxes. The level and composition of thesecosts vary widely (figure 1.2). The time costsof complying with particular regulatoryrequirements also vary widely. For example,registering a new business can take 2 days inAustralia, but over 200 days in Haiti.6
22 WORLD DEVELOPMENT REPORT 2005
Some aspects of the investment climate aremore difficult for governments to changethan others.The most important of them isgeography, which can have direct and indi-rect effects on the investment climate.
Countries with large domestic markets,or near larger markets, may be more attrac-tive to investors than smaller or moreremote markets, though moves towardmore open trade and advances intransportation and communications arereducing the gap.Within countries, lowpopulation densities and distances frommarkets can also affect the attractiveness ofrural areas, though investments ininfrastructure can reduce that gap as well.
Climatic variables can also influence thefeasibility of some types of activity, such as
agriculture and tourism. And countries inmalaria-affected regions face special disad-vantages.
Large endowments of natural resourceswere once thought to be a big advantage.But such concentrations of wealth have con-sumed some societies in rent-seeking, raisingthe question of whether such endowmentsare always a blessing (chapter 2).
Whatever the weight of geography, it isclear that efforts to improve aspects of theinvestment climate more amenable to gov-ernment influence can provide large payoffs.Such efforts help a society make the most ofits innate resources—physical and human.
Source: Easterly and Levine (2003) and Gallup,Sachs, and Mellinger (1999).
B O X 1 . 3 Geography matters, but it is not destiny
Table 1.1 Government policies and behaviors and investment decisions—some examples
Factors that shape opportunities and incentives for firms to invest
Government has strong influence Government has less influence
Costs • Corruption (chapter 2) • Market-determined prices of inputs
• Taxes (chapter 5) • Distance to input and output markets
• Regulatory burdens, red tape (chapter 5) • Economies of scale and scope associated with particular technologies
• Infrastructure and finance costs (chapter 6)
• Labor market regulation (chapter 7)
Risks • Policy predictability and credibility (chapter 2) • Consumer and competitor responses
• Macroeconomic stability (chapter 4) • External shocks
• Rights to property (chapter 4) • Natural disasters
• Contract enforcement (chapter 4) • Supplier reliability
• Expropriation (chapter 4)
Barriers to competition • Regulatory barriers to entry and exit (chapter 5) • Market size and distance to input and output markets
• Competition law and policy (chapter 5) • Economies of scale and scope in particular activities
• Functioning finance markets (chapter 6)
• Infrastructure (chapter 6)
03_WDR_PO1_Ch01.qxd 9/3/04 11:17 AM Page 22

The investment climate, growth, and poverty 23
RisksInvestment decisions are forward looking,allocating resources today in the hope offuture rewards. Many investment risks, likecosts, are a normal function of commercialventures, including uncertain responsesfrom consumers and competitors, so firmsshould bear them. Governments, however,have an important role in helping firmscope with risks associated with the securityof their property rights. Governments canalso increase the risks and uncertainties thatfirms face directly—policy uncertainty andmacroeconomic instability rank consistentlyas the leading investment climate concernsof firms (chapter 2). Unpredictability in theinterpretation of regulations is often a bigconcern (figure 1.3). And almost 95 percentof firms report a gap between formal poli-cies and their implementation.
Assessing the impact of risks is compli-cated by the different ways firms respond—demanding higher returns, adoptingshorter planning horizons, or not investingat all. Firms operating in some high-riskcountries require more than twice the rateof return they would in lower-risk countriesto compensate for the extra risks.7 Firm-level surveys show that improving policypredictability can increase the probability ofnew investment by more than 30 percent(chapter 2).8
Barriers to competitionFirms naturally prefer less competitionrather than more. But a barrier to competi-tion benefiting one firm denies opportuni-ties and increases costs for other firms and toconsumers. And competitive pressure drivesfirms to innovate, to improve productivity,and to share the benefits of productivitygains with consumers and workers. Manyfactors, including economies of scale andmarket size, can influence the level of com-petition in a market. Governments alsoinfluence competitive pressure through theirregulation of market entry and exit—andtheir responses to anticompetitive behaviorby firms. Competition is difficult to measureat the aggregate level, but firm-level evidenceshows how much competitive pressure canvary between countries (figure 1.4).
Figure 1.2 Costs vary widely in level and composition
TanzaniaAlgeriaBrazilChinaPoland0
5
10
15
Cost
as
perc
ent o
f sal
es 20
25
30Contract enforcement difficultiesRegulationBribesCrimeUnreliable infrastructure
25
50
75
Perc
ent o
f firm
s fin
ding
the
inte
rpre
tatio
nof
regu
latio
ns u
npre
dict
able
0
100
Guatemala
RussiaZambiaPakistan
Peru
Indonesia
Estonia
Figure 1.3 Regulatory unpredictabilityis a big concern for firms
Note: Countries selected to illustrate range ofresponses; data limited to Europe and CentralAsia.Source: World Bank Investment ClimateSurveys/BEEPS II.
100
75
50
Perc
ent o
f firm
s re
porti
ng s
igni
fican
t com
petit
ive
pres
sure
25
0
Georgia
Kyrgyzstan
UzbekistanTajikistanSlovakia
HungaryPoland
Figure 1.4 Competitive pressure canvary significantly between countries
Note: The survey asked registered firms to report values either in monetary terms, directly as a share of sales, or interms of time. “Contract enforcement difficulties” captures the share of inputs that are below agreed-upon quality(weighted by material inputs in total sales) and overdue payments (as a share of total payments, using an interest rateof 10 percent for the average length of overdue payments). “Regulation” captures management time spent dealingwith officials (weighted by the cost of management compensation to total sales), and the gap in actual employmentrelative to desired levels due to regulatory costs associated with hiring and firing workers (weighted by total laborcosts in sales). “Bribes” are the total costs of bribes as a share of sales. “Crime “ is the sum of losses due to theft,security costs, and protection payments (as a share of sales). “Unreliable infrastructure” includes sales lost due tointerruptions in power and telecommunications and due to the loss or damage of goods in transit. Countries selectedto illustrate range.Source: World Bank Investment Climate Surveys.
Note: Countries selected to illustrate the range ofresponses.Source: World Bank Investment Climate Surveys.
03_WDR_PO1_Ch01.qxd 9/3/04 11:17 AM Page 23

Improving the investment climate is notabout reducing all costs, all risks, and allbarriers. Taxes and regulation support asound investment climate and protectbroader social interests. Managing the ten-sion between creating a favorable invest-ment climate for firms and achieving othersocial goals is a major challenge for govern-ments—and a key theme of this Report.
The new evidence shows large variationsin investment climate conditions not onlybetween countries, but also within coun-tries, as illustrated by China (figure 1.5).This will often be the case with infrastruc-ture provision or when subnational govern-ments determine policies. But even a singlenational law may be applied differentlywithin a country: for example, the time totransfer property title in Brazil varies from15 days in Brasilia to 65 days in Salvador.9
Even within a single location, the sameconditions can affect firms differently. Thiscan be true across activities—farmers, man-ufacturers, and barbers each have differentperspectives. But a poor investment climateoften hits smaller and informal firms thehardest (figure 1.6).
How investment climateimprovements drive growth andreduce povertyWith rising populations, economic growth isthe only sustainable mechanism for increas-ing a society’s standard of living. Growth isassociated not just with higher incomes, butwith better indicators of human develop-ment, such as lower infant mortality, broadereducation, and longer life expectancy. It pro-vides opportunities for firms of all types, cre-ating jobs and expanding the tax base avail-able to fund public services. Households aswell as firms benefit from better propertyrights, financial markets, and infrastructureservices. It is also now widely understoodthat growth must be sustainable, safeguard-ing the value of national assets—includingenvironmental assets—and the potential forfuture growth (box 1.4). A growing body ofresearch shows how investment climate poli-cies contribute to economic growth, andhow policy approaches might be tailored tobetter target the needs of poor people. Whathas been learned?
Significant economic growth is amodern phenomenon, not shared by allSome early economists were concerned thatthe potential for rising incomes was inher-ently limited, while mercantilists believedthat growth was a zero-sum game, withgains by some countries coming only at theexpense of others. For centuries the average
24 WORLD DEVELOPMENT REPORT 2005
Figure 1.5 Investment climate conditions vary within countries
0
5
10
15
Perc
ent
Days
20
25
0
2
1
3
4
6
5
7
TianjinShanghaiGuangzhouChenduBejingChina
Number of days to obtain a mainline telephone connection
Number of days to clear customs for imports
Percent of production lost because of power outages
Source: World Bank Investment Climate Surveys.
50
25
Perc
enta
ge o
f firm
s
0
75
Have a loanfrom aformal
financialinstitution
Confidentthat courtswill uphold
propertyrights
Believeregulations
will beinterpretedconsistently
Large
MediumSmall
Informal
Note: Uses 10 countries for which formal and informal surveyswere conducted, controlling for industry, country, ownership, andfirm age. Source: World Bank Investment Climate Surveys and WDR Sur-veys of Micro and Informal Firms.
Figure 1.6 Investment climate conditions can affectfirms differently
03_WDR_PO1_Ch01.qxd 9/3/04 11:17 AM Page 24
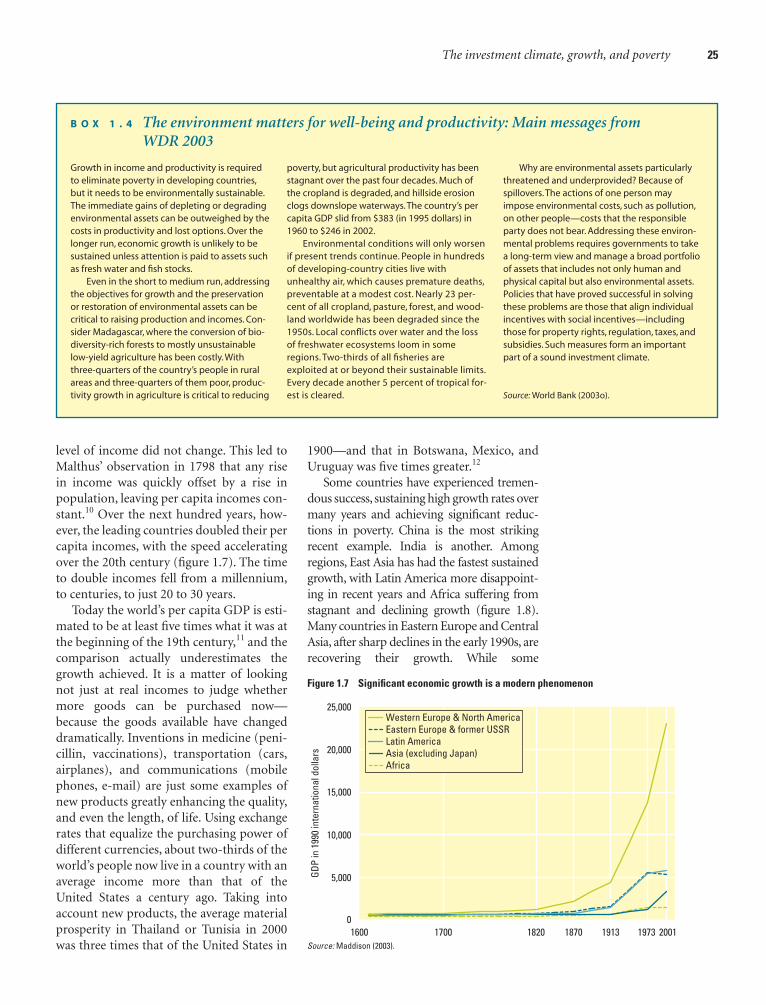
level of income did not change. This led toMalthus’ observation in 1798 that any risein income was quickly offset by a rise inpopulation, leaving per capita incomes con-stant.10 Over the next hundred years, how-ever, the leading countries doubled their percapita incomes, with the speed acceleratingover the 20th century (figure 1.7). The timeto double incomes fell from a millennium,to centuries, to just 20 to 30 years.
Today the world’s per capita GDP is esti-mated to be at least five times what it was atthe beginning of the 19th century,11 and thecomparison actually underestimates thegrowth achieved. It is a matter of lookingnot just at real incomes to judge whethermore goods can be purchased now—because the goods available have changeddramatically. Inventions in medicine (peni-cillin, vaccinations), transportation (cars,airplanes), and communications (mobilephones, e-mail) are just some examples ofnew products greatly enhancing the quality,and even the length, of life. Using exchangerates that equalize the purchasing power ofdifferent currencies, about two-thirds of theworld’s people now live in a country with anaverage income more than that of theUnited States a century ago. Taking intoaccount new products, the average materialprosperity in Thailand or Tunisia in 2000was three times that of the United States in
The investment climate, growth, and poverty 25
Growth in income and productivity is requiredto eliminate poverty in developing countries,but it needs to be environmentally sustainable.The immediate gains of depleting or degradingenvironmental assets can be outweighed by thecosts in productivity and lost options. Over thelonger run, economic growth is unlikely to besustained unless attention is paid to assets suchas fresh water and fish stocks.
Even in the short to medium run, addressingthe objectives for growth and the preservationor restoration of environmental assets can becritical to raising production and incomes. Con-sider Madagascar, where the conversion of bio-diversity-rich forests to mostly unsustainablelow-yield agriculture has been costly.Withthree-quarters of the country’s people in ruralareas and three-quarters of them poor, produc-tivity growth in agriculture is critical to reducing
poverty, but agricultural productivity has beenstagnant over the past four decades. Much ofthe cropland is degraded, and hillside erosionclogs downslope waterways.The country’s percapita GDP slid from $383 (in 1995 dollars) in1960 to $246 in 2002.
Environmental conditions will only worsenif present trends continue. People in hundredsof developing-country cities live withunhealthy air, which causes premature deaths,preventable at a modest cost. Nearly 23 per-cent of all cropland, pasture, forest, and wood-land worldwide has been degraded since the1950s. Local conflicts over water and the lossof freshwater ecosystems loom in someregions. Two-thirds of all fisheries areexploited at or beyond their sustainable limits.Every decade another 5 percent of tropical for-est is cleared.
Why are environmental assets particularlythreatened and underprovided? Because ofspillovers.The actions of one person mayimpose environmental costs, such as pollution,on other people—costs that the responsibleparty does not bear. Addressing these environ-mental problems requires governments to takea long-term view and manage a broad portfolioof assets that includes not only human andphysical capital but also environmental assets.Policies that have proved successful in solvingthese problems are those that align individualincentives with social incentives—includingthose for property rights, regulation, taxes, andsubsidies. Such measures form an importantpart of a sound investment climate.
Source: World Bank (2003o).
B O X 1 . 4 The environment matters for well-being and productivity: Main messages from WDR 2003
Figure 1.7 Significant economic growth is a modern phenomenon
01600 1700 1820 1870 1913 1973 2001
10,000
5,000
20,000
15,000
25,000
GDP
in 1
990
inte
rnat
iona
l dol
lars
Western Europe & North AmericaEastern Europe & former USSRLatin AmericaAsia (excluding Japan)Africa
Source: Maddison (2003).
1900—and that in Botswana, Mexico, andUruguay was five times greater.12
Some countries have experienced tremen-dous success, sustaining high growth rates overmany years and achieving significant reduc-tions in poverty. China is the most strikingrecent example. India is another. Amongregions, East Asia has had the fastest sustainedgrowth, with Latin America more disappoint-ing in recent years and Africa suffering fromstagnant and declining growth (figure 1.8).Many countries in Eastern Europe and CentralAsia, after sharp declines in the early 1990s, arerecovering their growth. While some
03_WDR_PO1_Ch01.qxd 9/3/04 11:17 AM Page 25
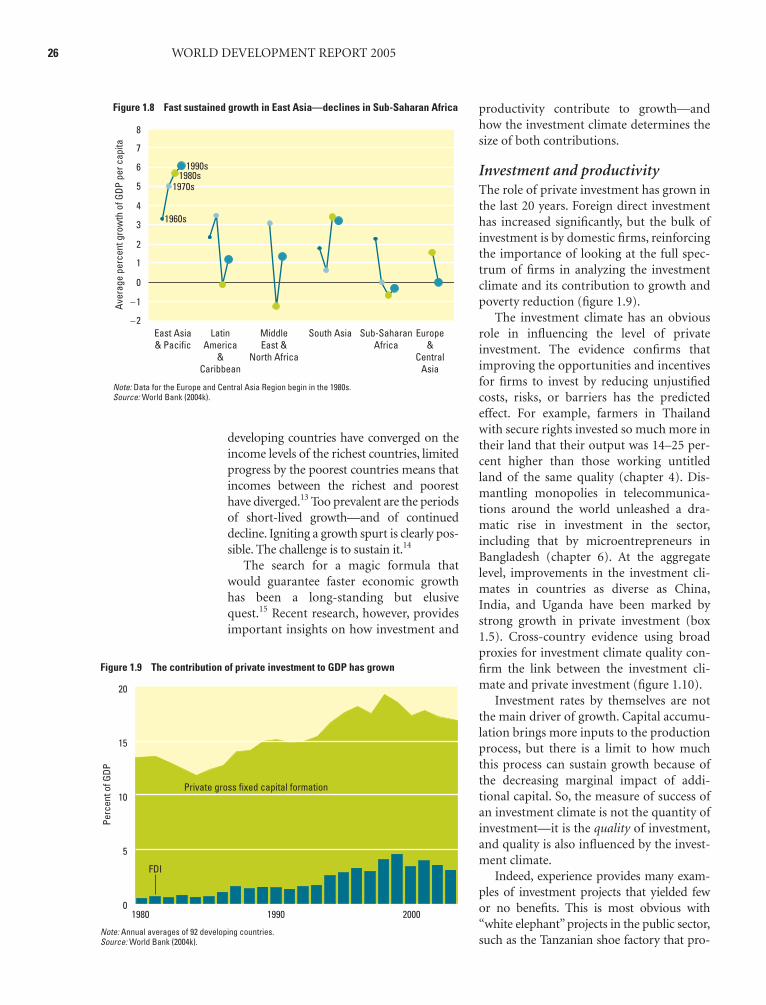
developing countries have converged on theincome levels of the richest countries, limitedprogress by the poorest countries means thatincomes between the richest and pooresthave diverged.13 Too prevalent are the periodsof short-lived growth—and of continueddecline. Igniting a growth spurt is clearly pos-sible. The challenge is to sustain it.14
The search for a magic formula thatwould guarantee faster economic growthhas been a long-standing but elusivequest.15 Recent research, however, providesimportant insights on how investment and
productivity contribute to growth—andhow the investment climate determines thesize of both contributions.
Investment and productivityThe role of private investment has grown inthe last 20 years. Foreign direct investmenthas increased significantly, but the bulk ofinvestment is by domestic firms, reinforcingthe importance of looking at the full spec-trum of firms in analyzing the investmentclimate and its contribution to growth andpoverty reduction (figure 1.9).
The investment climate has an obviousrole in influencing the level of privateinvestment. The evidence confirms thatimproving the opportunities and incentivesfor firms to invest by reducing unjustifiedcosts, risks, or barriers has the predictedeffect. For example, farmers in Thailandwith secure rights invested so much more intheir land that their output was 14–25 per-cent higher than those working untitledland of the same quality (chapter 4). Dis-mantling monopolies in telecommunica-tions around the world unleashed a dra-matic rise in investment in the sector,including that by microentrepreneurs inBangladesh (chapter 6). At the aggregatelevel, improvements in the investment cli-mates in countries as diverse as China,India, and Uganda have been marked bystrong growth in private investment (box1.5). Cross-country evidence using broadproxies for investment climate quality con-firm the link between the investment cli-mate and private investment (figure 1.10).
Investment rates by themselves are notthe main driver of growth. Capital accumu-lation brings more inputs to the productionprocess, but there is a limit to how muchthis process can sustain growth because ofthe decreasing marginal impact of addi-tional capital. So, the measure of success ofan investment climate is not the quantity ofinvestment—it is the quality of investment,and quality is also influenced by the invest-ment climate.
Indeed, experience provides many exam-ples of investment projects that yielded fewor no benefits. This is most obvious with“white elephant” projects in the public sector,such as the Tanzanian shoe factory that pro-
26 WORLD DEVELOPMENT REPORT 2005
Figure 1.8 Fast sustained growth in East Asia—declines in Sub-Saharan Africa
Note: Data for the Europe and Central Asia Region begin in the 1980s. Source: World Bank (2004k).
East Asia& Pacific
0
2
1
–1
–2
4
3
7
6
5
8Av
erag
e pe
rcen
t gro
wth
of G
DP p
er c
apita
LatinAmerica
&Caribbean
South Asia Sub-SaharanAfrica
MiddleEast &
North Africa
Europe&
CentralAsia
1990s1980s
1970s
1960s
Figure 1.9 The contribution of private investment to GDP has grown
0
5
10
15
Perc
ent o
f GDP
20
20001990
Private gross fixed capital formation
1980
FDI
Note: Annual averages of 92 developing countries.Source: World Bank (2004k).
03_WDR_PO1_Ch01.qxd 9/3/04 11:17 AM Page 26

The investment climate, growth, and poverty 27
duced few shoes, the nuclear power plant inthe Philippines that was never commis-sioned, and the numerous roads tonowhere.16 The former Soviet Union also hadvery high investment rates in the 1950s, buttoo often in projects that provided little eco-nomic or social return.
Reflecting this, cross-country studies findlittle correlation between aggregate invest-ment and growth, particularly if no distinc-tion is made between public and privateinvestment.17 This highlights the importanceof ensuring that investment is undertakenwith some discipline to improve the likeli-hood of it being productive. That disciplinewill most likely be forthcoming when privatefirms put their own money at risk to invest ina competitive business environment, so thatthey bear the consequences of their invest-ment decisions.
The critical role of productivity is under-scored by studies of aggregate growth perfor-
mance across countries. Over 1960–2000 thebulk of the differences in growth betweencountries (45–90 percent) is accounted fornot by the accumulation of physical capital,or of human capital, but by total factor pro-ductivity (TFP)—the productivity contribu-tions above those made by physical andhuman capital (figure 1.11 and box 1.6).18 AsKrugman said,“Productivity isn’t everything,but in the long run it’s almost everything.”19
Aggregate-level studies differ in theweight they attach to TFP and factor accu-mulation in explaining economic growth.20
The debate is important because it hasimplications for the sustainability ofgrowth. If growth is due to factor accumu-lation, the diminishing marginal contribu-tion of capital implies that high growthrates, such as those achieved in East Asia,will not be sustainable. However, the samelimitation is not true for gains in TFP. Inpractice the distinction between invest-
China and India have grown impressively inrecent years, greatly reducing poverty. In bothcases the roots can be found in improving theinvestment climate. Beginning in the early 1980sChina introduced rudimentary systems of prop-erty rights and private enterprise, liberalizedtrade and investment, and embraced a broadprogram of improvements across theinvestment climate. India introduced reforms toreduce tariffs and loosen licensing requirementsin the mid-1980s, followed in the early 1990s
with more extensive trade liberalization and afurther dismantling of the so-called licensingRaj.
The results? Private investment as a share ofGDP nearly doubled in both countries. Percapita GDP in China rose tenfold from $440 in1980 to $4,475 in 2002 (in international prices),and India’s almost quadrupled from $670 in1980 to $2,570 in 2002. Both experienced dra-matic reductions in poverty (see figure)—eachon distinctive paths, but both sustaining efforts
to improve the opportunities and incentives forfirms to invest productively.
The benefits of a better investment climateare not limited to large countries.Take Uganda.Many countries in Africa have experienced lim-ited or negative growth, with investmentclimates often clouded by historical legacies,political instability, excess government interfer-ence, and other factors that stifle opportunitiesand incentives for firms to invest productively.Beginning in the early 1990s, however, Ugandaembarked on a program to improve its invest-ment climate. Macroeconomic stability wasachieved. Expropriations by a previous govern-ment were reversed.Trade barriers werereduced.Tax and court systems were reformed.Private sector participation and competitionwere introduced in telecommunications. Nowefforts are under way to improve business regu-lation.While many challenges remain, theseefforts are reaping rewards.The share of privateinvestment in GDP more than doubled between1990 and 2000. Per capita GDP grew by over 4percent from 1993 to 2002 (8 times the averagein Sub-Saharan Africa).The percentage of thepopulation living below the poverty line fellfrom 56 percent in 1992 to 35 percent in 2000.
Source: Ahluwalia (2002); Chen and Ravallion (2004);De Long (2003); Chen and Wang (2001); Qian (2003);Rodrik and Subramanian (2004);Young (2003);Young(2000); Holmgren and others (2001);World Bank(2002d);World Bank (2001d); and IMF and IDA (2003);World Bank (2004k); IMF (2004).
B O X 1 . 5 Improving the investment climate and growth: the cases of China, India, and Uganda
Note: Dates reflect the timing of significant reform efforts and, particularly for China, the availability of data. Povertydata for Uganda based on national poverty line.
0
6Perc
ent o
f GDP
12
18
19991990China
20001981India
20021990Uganda
0
25
Shar
e of
pop
ulat
ion
belo
w th
e $1
a d
ay p
over
ty li
ne
50
75
20011981China
20011981India
Private investment Poverty
20001992Uganda
Note: Data presented are averages for1984–2000. ICRG’s index of “investment profile”is based on measures of contract enforceability,expropriation, profit repatriation, and paymentdelays. Higher numbers are associated with lessrisk and stronger investment climates. Source: World Bank (2004k) and InternationalCountry Risk Guide.
3 4 5 6Investment profile
Annu
al g
row
th o
f priv
ate
inve
stm
ent
7 8 9–8
–4
0
4
8
12
Figure 1.10 Private investment hasgrown faster in countries with betterinvestment climates
03_WDR_PO1_Ch01.qxd 9/3/04 11:17 AM Page 27

ment and TFP is not always straightforward.For example, technological improvementscan encourage investment, and investmentcan help to improve technology. And invest-ment climate improvements can spur both.
This provides encouraging news for devel-oping countries—improving investment cli-mate conditions can directly improve effi-ciency, encourage the adoption of bettertechnology, and strengthen incentives forinvestment in physical and human capital.
Early growth research emphasized tech-nological progress in explaining TFP, suggest-ing that differences in growth rates were dri-ven by differences in the technologiesadopted.21 The dramatic acceleration inincome levels among the fast growing coun-tries over the last 200 years can be understoodby improvements in technology. “Technol-ogy” in this sense, however, is not limited toscientific breakthroughs of the kind thatmight merit a patent. It can also include moremodest advances, as well as new and betterways to organize production processes, inter-act with consumers, or distribute goods.
Importantly, firms and countries do nothave to invent everything afresh. Even incountries that make some of the biggest con-tributions to innovation, the ratio of adapta-tion to innovation is extremely high—Jovanovic estimates it at 20 or 30 to 1 in theUnited States.22 This highlights the hugepotential for developing countries to catch upwith richer countries by creating an environ-ment that facilitates the diffusion of ideasdeveloped elsewhere, as well as the develop-ment of new ones. The potential for catchingup is real. It took some of the first industrializ-ing countries 40 to 60 years to double theirincomes in real terms, but others have donethis much faster—Costa Rica in 19 years start-ing in 1961, Jordan in 15 years starting in 1965,Taiwan, China, in 10 years starting in 1965.23
Recent research has emphasized that TFPcan also be understood to encompass morethan just differences in technology.24 Thebroader environment in which firms oper-ate matters too, whether this is understoodin terms of property rights, institutions, orthe investment climate. A better investmentclimate can directly improve productivityby reducing unjustified costs and risksflowing from government policies andbehaviors. By making it more attractive todevelop and adopt new and better ways ofdoing things, a better investment climatewill help productivity through its impacton technology as well. Thus, at least as
28 WORLD DEVELOPMENT REPORT 2005
Growth quartile
43210
–1
1
2
3
Perc
ent g
row
th o
f GDP
per
wor
ker
4TFPEducationCapital
Note: Decomposition of sources of growth per worker; 1960–2000for 62 developing countries. Source: Data from Bosworth and Collins (2003).
Figure 1.11 Differences in TFP account for the largestshare of differences in GDP growth per worker.
Productivity is the key to growth—for indi-viduals, for firms, and for the economy as awhole. Increasing productivity means pro-ducing more with the same amount ofinputs.Two common measures are laborproductivity and TFP.
Labor productivity is the value-added pro-duced by each unit of labor. Increases in laborproductivity simply mean that an individual isable to produce more.How? Take the exampleof a worker in the informal economy produc-ing garments from home.One possibility isthat she has access to more machinery—suchas greater access to a shared sewing machine.A second is that she has more skills or trainingin sewing.A third is that she has access to newtechnology—such as a newer sewingmachine.A fourth is that she works in an envi-ronment that enables and provides strongerincentives to work efficiently—such as fewerdifficulties accessing raw materials, fewer dis-tractions dealing with bureaucraticharassment and demands for bribes,or lessexposure to theft.Progress in any area allowsher to increase the number (and quality) ofgarments she produces—and thus boosts herincome.Her improved productivity is a contri-bution to economic growth ultimatelyreflected in macroeconomic statistics.
Total factor productivity (TFP) attemptsto measure contributions to output beyond
those made by the number of workers, theirskill level, and the machinery they use. In theabove example it would capture the thirdand fourth sources of growth in labor pro-ductivity. In the macroeconomic literature,studies initially emphasized differences intechnology. More recent work has expandedthis to reflect differences in institutional set-ting (often proxied with measures of prop-erty rights security) or “social infrastructure”that influence the opportunities and incen-tives to adopt new technologies and oper-ate efficiently.The latter measures are largelysynonymous with what this Report refers toas the investment climate.
Rather than being measured directly,TFPis the residual that is not explained by differ-ences in factor inputs. Calculations of TFPoften generate debate because of difficultiesin measuring capital stocks, questions of howto attribute changes in the quality of factorinputs, and the assumptions needed to esti-mate the necessary coefficients. Despite chal-lenges in measurement, it is not disputed thatTFP makes a critical contribution to growth.
Source: Acemoglu (2001); Barro and Sala-i-Mar-tin (2003); Bosworth and Collins (2003); Easterlyand Levine (2001); Hall and Jones (1999); Par-ente and Prescott (2000); Klenow andRodríguez-Clare (1997);Young (1995).
B O X 1 . 6 Measuring productivity
03_WDR_PO1_Ch01.qxd 9/3/04 11:17 AM Page 28

important as reducing costs and risks iseliminating unjustified barriers to thedevelopment, adoption, or adaptation ofnew processes—and fostering competitionto encourage firms to take up those oppor-tunities (box 1.7).
Productivity and competitionFirms do not innovate or improve their pro-ductivity from any sense of philanthropy,because the processes can be demandingand disruptive. Most firms would prefer the“quiet life”—which Hicks noted was the bestof all monopoly profits.25 Instead, firmsadopt and develop new and better ways ofdoing business in response to the pressuresthey face to survive and prosper in a com-petitive marketplace.26 A sound investmentclimate supports the dynamic processes thatSchumpeter called “creative destruction.”27
It encourages firms to experiment and learn,it rewards success, and it punishes failure(box 1.8). The firm-level surveys confirmthe importance of competitive pressure forincentives to innovate (figure 1.12) andincrease productivity.28
Healthy market economies exhibitfairly high rates of opening and closingfirms (box 1.9). In Organisation for Eco-nomic Co-operation and Development(OECD) countries, 5–20 percent of firmsenter and exit the market every year.29
Firms that leave the market are the leastproductive, and their departures con-tribute more than 20 percent of the pro-ductivity gains. New firms are more pro-ductive—though it can sometimes takethem several years before their productiv-ity reaches that of incumbents.30 Thecombined effect of net entry is substantial,particularly in countries with fewer barri-ers to entry (figure 1.13).
The contribution of new entrants to pro-ductivity is particularly strong in highertechnology sectors. There is also evidencethat sectors with many new entrants pushincumbents to increase their productivity.Why might entry rates be strongly corre-lated with productivity growth by incum-bents? Perhaps because new entrants areattracted to productive sectors, or becausethe new entrants stimulate incumbents to
The investment climate, growth, and poverty 29
Growth with a poor investment climate ispossible, but unlikely to be sustained. Forexample, in the 1960s and 1970s Brazilexperienced strong growth while closingdomestic markets to international competi-tion and pursuing heavy public investmentthrough state-owned enterprises.The initialresults were impressive, but the growthproved unsustainable. Protected firmslacked the incentives to improve their pro-ductivity and fell further behindinternational best practices. Other firms hadless access to new technologies and had topay higher prices for inputs supplied by
protected sectors. Public investment to sus-tain growth led to severe debt problems—and ultimately to a macroeconomic crisis.
Subsequent efforts to improve theinvestment climate initially met with cau-tious responses from firms. Many attributethis to questions about the credibility of thegovernment’s commitment to reforms, par-ticularly in the wake of repeated episodes ofmacroeconomic instability.
Source: Castelar Pinheiro and others (2001) andSchor (forthcoming).
B O X 1 . 7 Growth with a poor investment climate—possible, but unlikely to be sustained
Hyundai’s efforts to produce a car began inthe 1960s. It purchased foreign equipment,hired expatriate consultants, and signedlicensing agreements with foreign firms. Butthe process was not a simple matter ofadopting the technology. Despite the train-ing and consulting services of a foreign con-sultant and three experts, Hyundaiengineers repeated trials and errors for 14months before creating the first prototype.The engine block broke into pieces at itsfirst test. New prototype engines appearedalmost every week, only to break in testing.No one on the team could figure out whythe prototypes kept breaking down—cast-ing serious doubts, even among Hyundaimanagement, on the company’s ability todevelop a competitive engine.
The team had to scrap eleven morebroken prototypes before one survived thetest. There were 288 engine designchanges, 156 in 1986 alone. Ninety-seventest engines were made before Hyundairefined its natural aspiration andturbocharger engines, 53 more engineswere produced for durability improvement,88 more for developing a car, 26 more fordeveloping its transmission, and 6 more forother tests, totaling 324 test engines. Inaddition, more than 200 transmissions and150 test vehicles were created beforeHyundai perfected them in 1992. In 2003,Hyundai sold close to 2 million vehiclesaround the world.
Source: Kim (1997).
B O X 1 . 8 Developing a product is a learning process—asHyundai shows
50
25
Perc
enta
ge in
crea
se in
prob
abili
ty o
f und
erta
king
act
ivity
0
75
Introducenew product
Upgradeproduct
Introduce newtechnology
Somepressure
Moderatepressure
Majorpressure
Note: Surveys cover 27 countries in Eastern Europe and Central Asia. Source: World Bank Investment Climate Surveys/BEEPS II.
Figure 1.12 More competitive pressure, more innovation
03_WDR_PO1_Ch01.qxd 9/3/04 11:17 AM Page 29

increase their productivity to maintain theirmarket shares. Census data from develop-ing countries confirm the importance of thesecond explanation.31
The greater microeconomic flexibilityassociated with a good investment climatehelps firms take advantage of internalopportunities. It also helps the economyweather external shocks. Countries in LatinAmerica and East Asia with more microeco-nomic flexibility experienced less dramaticdeclines in output and recovered faster thanthose with less flexible economies.32
Showing the potential returns ofinvestment climate improvementsResearch showing the links between invest-ment climate improvements and improvedfirm performance typically focuses on a sin-gle dimension of the investment climate,
30 WORLD DEVELOPMENT REPORT 2005
The private sector is not static, nor are individualfirms.There is a large and ongoing reallocation ofoutput and jobs across firms. Such dynamism is asign of a vibrant economy, and accounts for a sig-nificant share of productivity growth.This is trueacross OECD countries and in developing coun-tries. Firms are forced to compete in their searchfor profits.There are enticements, such as the lureof larger profits, even if they are short lived. Andfirms dare not be left behind.This is the secret to amarket economy’s success and what Schumpetercalled “the essential fact of capitalism.”
The role of entry and exit. Every year between5 and 20 percent of firms enter or exit an econ-omy. Many of the entrants are small. Most ofthem will remain small. Some will grow, with afew becoming the large firms of the future. Firmsalso contract and some will go out of business.This entry and exit of firms is an inherent part of amarket economy and an important source ofinnovation. Reducing barriers to entry is impor-tant because new entrants—and even the threatof new entry—spur existing firms to improvetheir productivity. Entering firms also tend to usenewer technologies and production methods. Itis not that they are all more productive from theirbeginning—not even in comparison to exitingfirms. Experience in the marketplace will deter-mine which firms will be successful.The highestexit rates are among small and young firms. Iffirms have survived the first five years, however,they are much more likely to remain in businessand to contribute to productivity growth.
While trade theory predicts that much ofthe adjustment to greater openness would lead
to reallocation across sectors, in fact, much ofthe reallocation of resources is from low- tohigh-productivity firms within the same sector.There are large differentials in the levels andrates of growth of productivity across firmswithin a sector, and low productivity helps pre-dict exit.
The evidence underscores the importanceof the process of creative destruction to thegrowth process. Barriers to exit need to beaddressed to free up resources that can be usedmore productively in other activities. Barriers toentry can be particularly harmful, not just by sti-fling the pressure to innovate and leading tomore “technological sclerosis,” but byforestalling the creation of new jobs. However,the churning process can be disruptive, and thegovernment has a role in helping workers copewith change (chapter 7). Improving the invest-ment climate is central to ensuring the processof creative destruction works well—to the bene-fit of workers and society as a whole.
Implications of firm size. Beyond entry andexit, these same pressures impact on firm sizeand growth. Large firms do not grow as fast assmall ones, but they are more likely to survive.Large firms tend to be more productive, payhigher wages, and offer greater job security.Thecausation, however, runs from productivity tosize; firms that are more productive are the onesthat are likely to grow.
The interactions between firms can haveimportant implications for how they develop. Itis not always cutthroat. Firms at the top of a sup-ply chain tend to be large.They provide oppor-
tunities to smaller firms as suppliers—oftenaccompanied by technical assistance and accessto credit. Particularly when financial markets areless developed, large firms can be an importantsource of credit to smaller suppliers.
Economies of scale specific to particulartechnologies help define the minimum efficientsize of a firm, but in practice there is a largerange of firm sizes within the same sector. Someof this can be due to concerns about contract-ing, with some finding it optimal to keep activi-ties in-house.The inability to access credit orother investment climate constraints can keepfirms small. Large firms can face challenges inorganization and can be less agile in respondingto change.
It is not that countries should aim to have aparticular size distribution of firms. Rather, whatis important is allowing the selectionmechanism to work free of political interferencethat favors influential firms. Large firms oftenhave more political influence and try to use thisto manipulate policies to their advantage—often at the expense of smaller firms. A goodinvestment climate facilitates the allocation ofresources, fosters innovation, and encouragesthe selection of firms that increase productivityand so contribute to growth and higher livingstandards.
Source: Bartelsman and others (2004); Klein andHadjimichael (2003); Haltiwanger (2000); Robertsand Tybout (1996); Schumpeter (1942); Caballeroand Hammour (2000); Baumol (2002).
B O X 1 . 9 Firm dynamics
406080 20 0 20 40 60 80
Argentina
France
Finland
Korea
Chile
U.K.
Netherlands
Latvia
Days to register a firmContribution of net entryto productivity growth
Note: Data cover manufacturing firms from 1988–2000, using census data.Source: Bartelsman and others (2004) drawing on World Bank Doing Business Project.
Figure 1.13 The contribution of net entry to productivity is higherwhen barriers to entry are lower
03_WDR_PO1_Ch01.qxd 9/3/04 11:17 AM Page 30
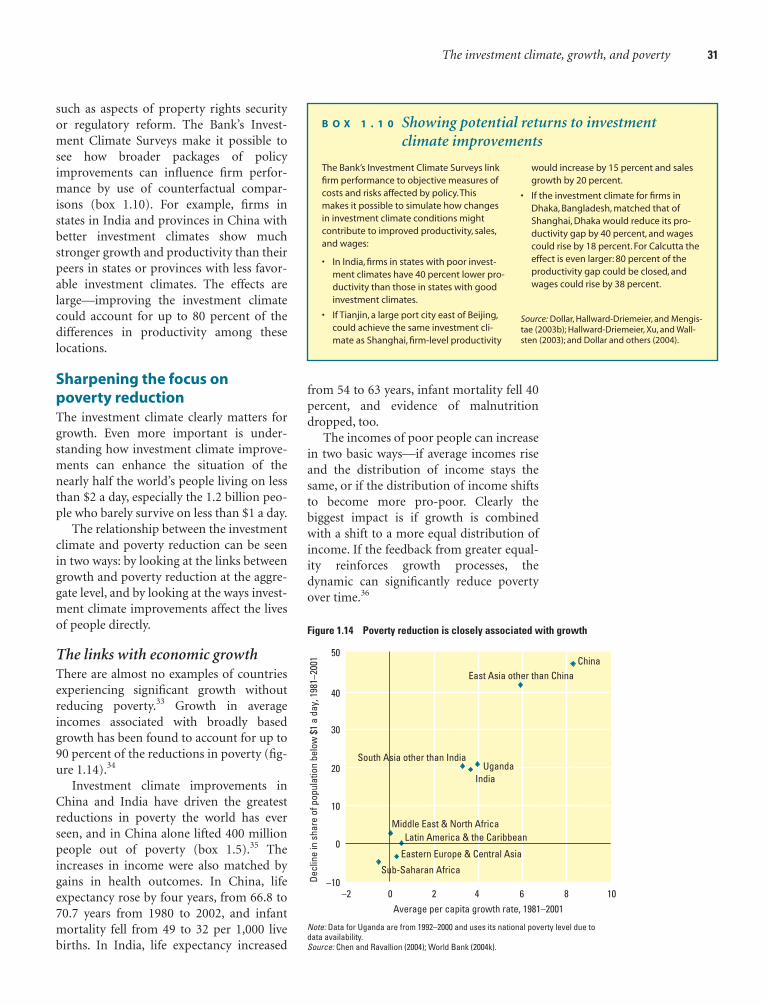
such as aspects of property rights securityor regulatory reform. The Bank’s Invest-ment Climate Surveys make it possible tosee how broader packages of policyimprovements can influence firm perfor-mance by use of counterfactual compar-isons (box 1.10). For example, firms instates in India and provinces in China withbetter investment climates show muchstronger growth and productivity than theirpeers in states or provinces with less favor-able investment climates. The effects arelarge—improving the investment climatecould account for up to 80 percent of thedifferences in productivity among theselocations.
Sharpening the focus onpoverty reductionThe investment climate clearly matters forgrowth. Even more important is under-standing how investment climate improve-ments can enhance the situation of thenearly half the world’s people living on lessthan $2 a day, especially the 1.2 billion peo-ple who barely survive on less than $1 a day.
The relationship between the investmentclimate and poverty reduction can be seenin two ways: by looking at the links betweengrowth and poverty reduction at the aggre-gate level, and by looking at the ways invest-ment climate improvements affect the livesof people directly.
The links with economic growthThere are almost no examples of countriesexperiencing significant growth withoutreducing poverty.33 Growth in averageincomes associated with broadly basedgrowth has been found to account for up to90 percent of the reductions in poverty (fig-ure 1.14).34
Investment climate improvements inChina and India have driven the greatestreductions in poverty the world has everseen, and in China alone lifted 400 millionpeople out of poverty (box 1.5).35 Theincreases in income were also matched bygains in health outcomes. In China, lifeexpectancy rose by four years, from 66.8 to70.7 years from 1980 to 2002, and infantmortality fell from 49 to 32 per 1,000 livebirths. In India, life expectancy increased
The investment climate, growth, and poverty 31
The Bank’s Investment Climate Surveys linkfirm performance to objective measures ofcosts and risks affected by policy.Thismakes it possible to simulate how changesin investment climate conditions mightcontribute to improved productivity, sales,and wages:
• In India, firms in states with poor invest-ment climates have 40 percent lower pro-ductivity than those in states with goodinvestment climates.
• If Tianjin, a large port city east of Beijing,could achieve the same investment cli-mate as Shanghai, firm-level productivity
would increase by 15 percent and salesgrowth by 20 percent.
• If the investment climate for firms inDhaka, Bangladesh, matched that ofShanghai, Dhaka would reduce its pro-ductivity gap by 40 percent, and wagescould rise by 18 percent. For Calcutta theeffect is even larger: 80 percent of theproductivity gap could be closed, andwages could rise by 38 percent.
Source: Dollar, Hallward-Driemeier, and Mengis-tae (2003b); Hallward-Driemeier, Xu, and Wall-sten (2003); and Dollar and others (2004).
B O X 1 . 1 0 Showing potential returns to investmentclimate improvements
Note: Data for Uganda are from 1992–2000 and uses its national poverty level due todata availability.Source: Chen and Ravallion (2004); World Bank (2004k).
420–2 6Average per capita growth rate, 1981–2001
Decl
ine
in s
hare
of p
opul
atio
n be
low
$1
a da
y, 1
981–
2001
8 10
ChinaEast Asia other than China
10
–10
0
30
20
40
50
UgandaIndia
Middle East & North AfricaLatin America & the Caribbean
Eastern Europe & Central Asia
Sub-Saharan Africa
South Asia other than India
Figure 1.14 Poverty reduction is closely associated with growth
from 54 to 63 years, infant mortality fell 40percent, and evidence of malnutritiondropped, too.
The incomes of poor people can increasein two basic ways—if average incomes riseand the distribution of income stays thesame, or if the distribution of income shiftsto become more pro-poor. Clearly thebiggest impact is if growth is combinedwith a shift to a more equal distribution ofincome. If the feedback from greater equal-ity reinforces growth processes, thedynamic can significantly reduce povertyover time.36
03_WDR_PO1_Ch01.qxd 9/3/04 11:17 AM Page 31

With income distribution relatively sta-ble, growth is often said to be good for thepoor because the share of income going tothe poor rises in tandem with averageincomes.37 But there is evidence that thelevel of inequality in a society affects the waygrowth translates into rising incomes for thepoor (box 1.11). It is not just that poor peo-ple’s share of income is relatively smaller in amore unequal society—it also rises by lessthan one-for-one with average incomes.38
Inequality can be of concern for otherreasons too. Greater inequality is associated
with less social cohesion, less secure propertyrights, and greater risk of significant politicalupheaval.39 So inequality can have importantimplications for the likelihood and nature ofinvestment climate improvements, the credi-bility of policy changes, and thus the impacton decisions of firms. This reinforces theimportance of governments being sensitiveto the distribution of gains from growth.
The investment climate and the livesof poor peopleGovernments committed to attacking povertyaggressively need to look beyond aggregatenumbers and understand how investmentclimate improvements can enhance the livesof poor people directly. In this context it isuseful to distinguish the impacts on poorpeople in their various capacities: asemployees; as entrepreneurs; as consumers;as users of infrastructure, finance, andproperty; and as potential recipients of tax-funded transfers or services.
As employees. Studies looking at house-holds that have escaped poverty find that inmore than 80 percent of cases the decisivefactor was the head of household’s getting anew job.40 The World Bank’s “Voices of thePoor” study of more than 60,000 poor menand women in 60 countries identified get-ting a job and self-employment as the bestway to escape poverty (figure 1.15).
Private enterprise is the engine for sus-tainable job creation and the dominantsource of jobs worldwide. In 2003 the pri-vate sector employed more than 90 percentof people in developing countries and 95percent of people in countries such as ElSalvador, India, and Mexico.41 Growingeconomies create more jobs, particularly indeveloping countries (figure 1.16). Theimpact of investment climate improve-ments on employment growth can also beseen by looking at experiences in individualcountries. For example, investment climateimprovements in China, India, and Ugandacontributed to employment growth ofmore than 2 percent a year between 1985and 2000. The garment sector in Cambodiaalso illustrates the potential impact of athriving private sector: exports grew from$20 million in 1995 to more than $1 billionin 2002, employing an additional 200,000
32 WORLD DEVELOPMENT REPORT 2005
The extent of inequality in a society affectshow much average growth is shared bypoor people. Concerns about whethergrowth is “pro-poor” raise a debate aboutwhether absolute or relative rates of growthfor poor people are what matters.The figurecompares overall growth rates and thegrowth rates for the poor to illustrate thesepoints.
Clearly, there is a strong relationshipbetween rising average incomes and theincomes of poor people as illustrated by aselection of country experiences spanningthe mid-1980s to the end of the 1990s (seethe figure). But countries above the 45degree line in the figure are the ones wherethe growth in incomes of the poor is higherthan average: in those cases, growthresulted not only in stronger absolutegrowth in the incomes of poor people, butalso stronger growth relative to theaverage. Under the relative definition ofpro-poor growth, inequality must fall.Theabsolute definition, by contrast, looks onlyat the income growth of poor people,whether inequality changes or not.
Inequality declined in both Ghana andZambia: in Zambia the poor suffered smallerdeclines in income than the average,but were
still worse off in an absolute sense; in Ghana,declining inequality and growth combined toboost the incomes for poor people.
Brazil and Ghana had roughly equaloverall growth rates. But the incomes ofpoor people grew by 1.8 percent in Ghanaand only 0.7 percent in Brazil. Indeed, thegrowth rate for the poor in Ghana is evenslightly higher than that in Bangladesh,whose overall growth rate was triple that ofGhana.
Using the relative definition of pro-poorgrowth, Ghana’s performance is better thanIndia’s—even though in India the absoluteincome of the poor grew by 3.9 percent,twice that of Ghana.While Ghana’s inequalitywas falling, its slower overall growth trans-lated into less poverty reduction than inIndia, with its slight increase in inequality butfaster growth.
Aggregate numbers of this kind maskchanges in which households are poor.Income mobility can be considerable. InIndonesia, among those who were in thepoorest quintile in 1993, 59 percent movedup at least one quintile in the income distri-bution by 1997, with 4 percent moving allthe way to the richest quintile. In SouthAfrica, 62 percent of those who were in the
poorest quintile in 1993 had movedup at least one quintile by 1998, with10 percent making it to the richestquintile. In Russia, 60 percent of thepoorest quintile households movedup between 1995 and 1998, with 9percent attaining the highest incomequintile. In Peru 55 percent moved up,with 5 percent making it to the topquintile between 1991 and 2000.
Source: United Kingdom—DFID (2004);Pritchett (2003); Graham and Pettinato(2001); Fields and Pfeffermann (2003);and López (2003).
B O X 1 . 1 1 How growth translates to rising incomes forpoor people
–2–4 0 2
Chile
India
Bangladesh
Decreasinginequality
Increasinginequality
Brazil
Ghana
Zambia
Overall growth rate (percent)
Grow
th ra
te fo
r the
poo
r (pe
rcen
t)
4 6 8–2
0
2
6
8
4
03_WDR_PO1_Ch01.qxd 9/3/04 11:17 AM Page 32

workers, many of them women and manypreviously poor.42
A vibrant private sector also contributes tohigher wages. More productive firms, nur-tured by a good investment climate, can payhigher wages and invest more in trainingtheir workers.43 The expansion of firms canalso have knock-on effects, raising the wagesof those in smaller firms as the pool of avail-able workers tightens. Similar patterns arefound in rural areas, with rising nonfarmemployment lifting agricultural wages—withsignificant impacts on poverty reduction.44
Improving the investment climate doesmore than create jobs and improve livingstandards today. It also encourages people toinvest more in their own education andskills to take advantage of better jobs in thefuture. There is thus a two-way link betweenskills and jobs, with an improved investmentclimate complementing efforts to improvehuman development (chapter 7).
Demographic trends underline theimperative to create more and better jobs indeveloping countries. Nearly 3 billion peo-ple are under the age of 25 today, 1.5 billionunder 15. In the next 30 years the popula-tion in developing countries is expected toincrease by nearly 2 billion people, and 7out of 8 billion of the world’s people willlive in developing countries. The popula-tion of Sub-Saharan Africa, the region withthe most poor people, will double by thattime, even with today’s incidence ofHIV/AIDS.45
As entrepreneurs. Hundreds of millions ofpoor people in developing countries maketheir living as microentrepreneurs—asfarmers, street vendors, and homeworkers,and in a range of other occupations, a largeshare of them women (box 1.12).46 They area big part of the informal economy, which issubstantial in many developing countries(figure 1.17).47
Individual entrepreneurs and microenter-prises can benefit from the same measuresthat improve the opportunities and incen-tives for larger firms. They benefit from lowercosts of doing business (including less redtape and corruption), and from lower risks(including more secure property rights andless policy uncertainty). Reducing barriers tocompetition also benefits them by expanding
The investment climate, growth, and poverty 33
their opportunities and reducing the costs ofinputs they transform. The way microentre-preneurs have benefited from telecommuni-cations liberalization in Bangladesh andUganda shows how (chapter 6).
As consumers. Improving the investmentclimate reduces the costs of producing anddistributing goods, and stronger competi-tion helps to ensure these benefits flow onto consumers. Poor people benefit fromlower prices for the goods they consume,including staples.
In Vietnam, where up to 80 percent of thepoor’s caloric intake comes from rice, lifting
0 10 20 30 40 50 60 70
Other
Savings
Migration
Education
FemaleMale
Access to credit
Hard work, perseverance, or thrift
Skill acquisition
Access to agricultural land
Income from agriculture, livestock, or fishing
Benefit of family and kin
Income from wages or salaries
Self-employment or business
Percent
Note: Reports views of 60,000 poor people on how they saw their best prospects of escaping poverty.Source: Narayan and others (2000).
Figure 1.15 Self-employment and wage income are the ways out of poverty
Note: Data are average annualized rates for 1960–2000.Source: World Bank (2004k).
0 2 4GDP per capita growth
Grow
th in
em
ploy
men
t
6 80
1
2
3
4
5OECDNon-OECD
Figure 1.16 Growing economies generate morejobs—particularly in developing countries
03_WDR_PO1_Ch01.qxd 9/3/04 11:17 AM Page 33
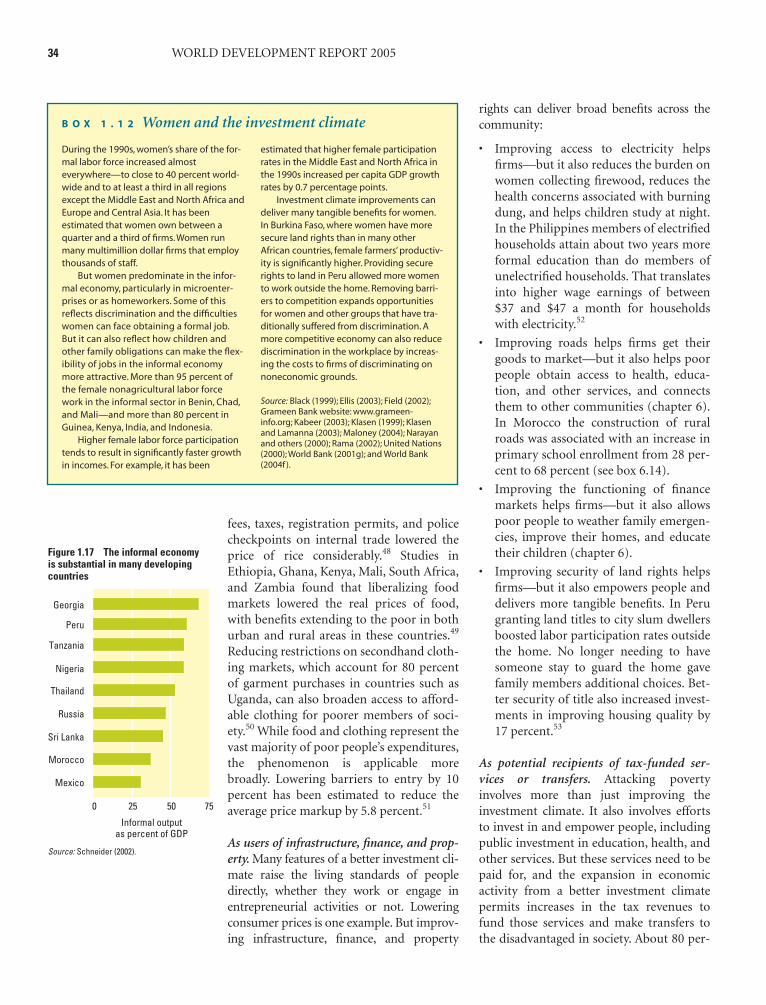
fees, taxes, registration permits, and policecheckpoints on internal trade lowered theprice of rice considerably.48 Studies inEthiopia, Ghana, Kenya, Mali, South Africa,and Zambia found that liberalizing foodmarkets lowered the real prices of food,with benefits extending to the poor in bothurban and rural areas in these countries.49
Reducing restrictions on secondhand cloth-ing markets, which account for 80 percentof garment purchases in countries such asUganda, can also broaden access to afford-able clothing for poorer members of soci-ety.50 While food and clothing represent thevast majority of poor people’s expenditures,the phenomenon is applicable morebroadly. Lowering barriers to entry by 10percent has been estimated to reduce theaverage price markup by 5.8 percent.51
As users of infrastructure, finance, and prop-erty. Many features of a better investment cli-mate raise the living standards of peopledirectly, whether they work or engage inentrepreneurial activities or not. Loweringconsumer prices is one example. But improv-ing infrastructure, finance, and property
rights can deliver broad benefits across thecommunity:
• Improving access to electricity helpsfirms—but it also reduces the burden onwomen collecting firewood, reduces thehealth concerns associated with burningdung, and helps children study at night.In the Philippines members of electrifiedhouseholds attain about two years moreformal education than do members ofunelectrified households. That translatesinto higher wage earnings of between$37 and $47 a month for householdswith electricity.52
• Improving roads helps firms get theirgoods to market—but it also helps poorpeople obtain access to health, educa-tion, and other services, and connectsthem to other communities (chapter 6).In Morocco the construction of ruralroads was associated with an increase inprimary school enrollment from 28 per-cent to 68 percent (see box 6.14).
• Improving the functioning of financemarkets helps firms—but it also allowspoor people to weather family emergen-cies, improve their homes, and educatetheir children (chapter 6).
• Improving security of land rights helpsfirms—but it also empowers people anddelivers more tangible benefits. In Perugranting land titles to city slum dwellersboosted labor participation rates outsidethe home. No longer needing to havesomeone stay to guard the home gavefamily members additional choices. Bet-ter security of title also increased invest-ments in improving housing quality by17 percent.53
As potential recipients of tax-funded ser-vices or transfers. Attacking povertyinvolves more than just improving theinvestment climate. It also involves effortsto invest in and empower people, includingpublic investment in education, health, andother services. But these services need to bepaid for, and the expansion in economicactivity from a better investment climatepermits increases in the tax revenues tofund those services and make transfers tothe disadvantaged in society. About 80 per-
34 WORLD DEVELOPMENT REPORT 2005
During the 1990s, women’s share of the for-mal labor force increased almosteverywhere—to close to 40 percent world-wide and to at least a third in all regionsexcept the Middle East and North Africa andEurope and Central Asia. It has beenestimated that women own between aquarter and a third of firms.Women runmany multimillion dollar firms that employthousands of staff.
But women predominate in the infor-mal economy, particularly in microenter-prises or as homeworkers. Some of thisreflects discrimination and the difficultieswomen can face obtaining a formal job.But it can also reflect how children andother family obligations can make the flex-ibility of jobs in the informal economymore attractive. More than 95 percent ofthe female nonagricultural labor forcework in the informal sector in Benin, Chad,and Mali—and more than 80 percent inGuinea, Kenya, India, and Indonesia.
Higher female labor force participationtends to result in significantly faster growthin incomes. For example, it has been
estimated that higher female participationrates in the Middle East and North Africa inthe 1990s increased per capita GDP growthrates by 0.7 percentage points.
Investment climate improvements candeliver many tangible benefits for women.In Burkina Faso, where women have moresecure land rights than in many otherAfrican countries, female farmers’ productiv-ity is significantly higher. Providing securerights to land in Peru allowed more womento work outside the home. Removing barri-ers to competition expands opportunitiesfor women and other groups that have tra-ditionally suffered from discrimination. Amore competitive economy can also reducediscrimination in the workplace by increas-ing the costs to firms of discriminating onnoneconomic grounds.
Source: Black (1999); Ellis (2003); Field (2002);Grameen Bank website: www.grameen-info.org; Kabeer (2003); Klasen (1999); Klasenand Lamanna (2003); Maloney (2004); Narayanand others (2000); Rama (2002); United Nations(2000); World Bank (2001g); and World Bank(2004f ).
B O X 1 . 1 2 Women and the investment climate
Figure 1.17 The informal economy is substantial in many developingcountries
Source: Schneider (2002).
0 25
Informal outputas percent of GDP
50 75
Thailand
Nigeria
Tanzania
Peru
Georgia
Russia
Sri Lanka
Morocco
Mexico
03_WDR_PO1_Ch01.qxd 9/3/04 11:17 AM Page 34

cent of taxes in developing countries arecollected from firms as value added taxes,corporate taxes, and labor taxes.54 There is aclose relationship between per capitagrowth and tax revenues (figure 1.18).
Of course, there are tradeoffs betweenraising tax revenues and providing incen-tives for firms to invest, create jobs, andexpand. Widening the tax base, rather thanincreasing rates, minimizes the tradeoffs(chapter 5). The extent to which the publicspending from a stronger tax base isdirected to services for the poor will dependon the government and its ability to spendresources wisely.55 But economic growthremains the only way to sustainablyincrease the public resources to fund suchservices and transfers.
Can investment climate improvementsbe made more pro-poor?Improving the investment climate promiseshuge benefits for a society, including thepoor. But can governments fashion theirinvestment climate improvements in waysthat deliver even deeper reductions inpoverty? Much depends on the part of theinvestment climate that is improved. Someimprovements—such as improving macro-economic stability, reducing corruption,and dismantling distortionary barriers togrowth—deliver broad benefits across soci-ety. Other measures are more focused—such as addressing regulatory constraintsaffecting particular activities or improvinginfrastructure in particular locations. In thelatter case governments can influence thedistribution of benefits.
As discussed in chapter 3, there are sev-eral options for making investment climateimprovements more pro-poor. Oneapproach is to focus on improving theinvestment climate where poor people live,which can deliver benefits to poor people inthat location in all of the capacities dis-cussed above. A second approach is to focuson removing constraints to activities thatpoor people benefit from—including asemployees, entrepreneurs, or consumers.
The two approaches can also be combinedby focusing on particular activities in par-ticular locations. While the choice of strat-egy can vary from country to country, thekey point is that pro-poor approaches neednot focus exclusively on addressing theneeds of the smallest firms—they canencompass a much broader set of firms.
Creating a better investmentclimate for everyoneThis chapter showed how investment cli-mate improvements are the driving forcefor growth and poverty reduction. A goodinvestment climate is one that is better foreveryone in two dimensions. It benefitssociety as a whole, not just firms. And itexpands opportunities for all firms, not justlarge or influential firms.
The rest of the Report looks at how gov-ernments can create a better investment cli-mate. The next chapter begins by looking atthe important question of why progress inmaking investment climate improvementsis often slow and difficult.
The investment climate, growth, and poverty 35
Source: World Bank (2004k).
0 5 10 20
Total tax collectionGDP
Annualized rate of growth, 1960–200015
Morocco
Brazil
Latvia
India
Vietnam
Chile
Rep. of Korea
Malaysia
Uganda
China
Figure 1.18 Rising GDP is associated with rising tax revenues—expanding the opportunities to fund services for the poor
03_WDR_PO1_Ch01.qxd 9/3/04 11:17 AM Page 35

36
An investment climate that enhances theopportunities and incentives for firms of alltypes to invest productively, create jobs, andexpand is the key to unleashing growth andreducing poverty. That was the message ofchapter 1—a message now understood bymore governments around the world. But ifa sound investment climate is so beneficial,and understood to be so by governments,why are there such large variations in invest-ment climates across and within countries?Why is progress often slow and difficult?
The government’s role in shaping theinvestment climate is traditionally explainedby market failures—or the failure of laissez-faire conditions to achieve efficient socialoutcomes. This is the textbook rationale formost government interventions in theeconomy—to provide public goods such aslaw and order, to support the provision ofinfrastructure, and to regulate firms andtransactions to address information asym-metries, externalities, and monopoly power.But governments often fail to mitigate mar-ket failures—and too often intervene inways that make matters even worse. Why?
Clearly, failure to create a sound invest-ment climate is not merely due to lack ofmoney. Many investment climate improve-ments place few demands on governmentbudgets, and the growth unleashed byreforms contributes to greater tax revenues.Indeed, considerable oil and mineral wealthis often associated with a worse rather thana better investment climate. Nor are poorinvestment climates simply a result of a lackof technical expertise. While the design ofsome reforms can require the expertise ofspecialists, administering the resulting poli-cies typically demands far less. And thebookshelves of ministries in most develop-ing countries are lined with reports con-
taining detailed recommendations on howpolicies might be improved.
Slow progress in improving the invest-ment climate is better explained by the chal-lenges that arise when governments dealwith a basic tension. Firms are the primarycreators of wealth, and a good investmentclimate must respond to their needs. But asound investment climate serves society as awhole, not just firms, and the preferences ofthe two can diverge. There can also be dif-ferences in the policy preferences and prior-ities between and even within firms.Responding to the resulting tension createsfour practical challenges, and the way gov-ernments respond to those challenges has abig impact on investment climates and thuson growth and poverty:
• Restraining rent-seeking. Investment cli-mate policies are an enticing target forrent-seeking by firms, officials, and otherinterest groups. Corruption can increasethe costs of doing business—and when itextends to higher echelons of govern-ment can lead to deep distortions in poli-cies. Capture, patronage, and clientelismcan also create large distortions, tiltingpolicies toward some groups at theexpense of others.
• Establishing credibility. Uncertainty aboutthe future affects whether and how firmschoose to invest. Governments need toprovide clear rules of the game, butapproaches that lack credibility will fail toelicit the intended investment response,no matter how well crafted the rule orhow sincere the policy pronouncement.
• Fostering public trust and legitimacy. Firmsand governments do not interact in a vac-uum. Trust between market participantsnurtures productive exchange and reduces
Confronting the underlyingchallenges
2c h a p t e r
04_WDR_Ch02.qxd 8/24/04 10:33 AM Page 36
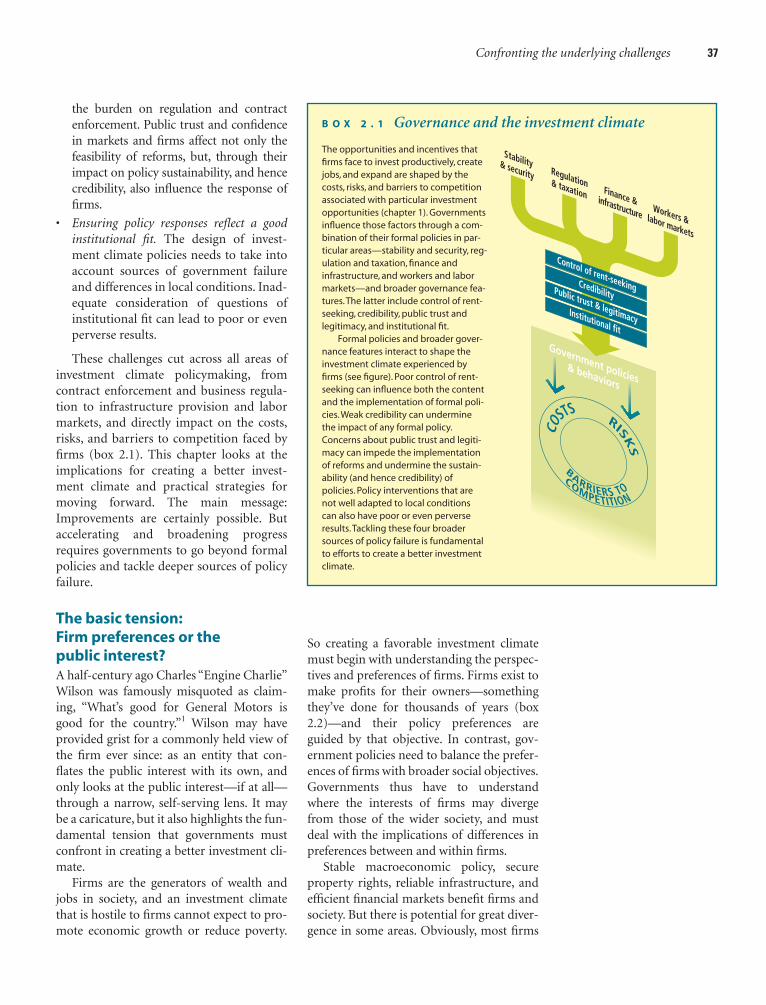
Confronting the underlying challenges 37
the burden on regulation and contractenforcement. Public trust and confidencein markets and firms affect not only thefeasibility of reforms, but, through theirimpact on policy sustainability, and hencecredibility, also influence the response offirms.
• Ensuring policy responses reflect a goodinstitutional fit. The design of invest-ment climate policies needs to take intoaccount sources of government failureand differences in local conditions. Inad-equate consideration of questions ofinstitutional fit can lead to poor or evenperverse results.
These challenges cut across all areas ofinvestment climate policymaking, fromcontract enforcement and business regula-tion to infrastructure provision and labormarkets, and directly impact on the costs,risks, and barriers to competition faced byfirms (box 2.1). This chapter looks at theimplications for creating a better invest-ment climate and practical strategies formoving forward. The main message:Improvements are certainly possible. Butaccelerating and broadening progressrequires governments to go beyond formalpolicies and tackle deeper sources of policyfailure.
The basic tension:Firm preferences or the public interest?A half-century ago Charles “Engine Charlie”Wilson was famously misquoted as claim-ing, “What’s good for General Motors isgood for the country.”1 Wilson may haveprovided grist for a commonly held view ofthe firm ever since: as an entity that con-flates the public interest with its own, andonly looks at the public interest—if at all—through a narrow, self-serving lens. It maybe a caricature, but it also highlights the fun-damental tension that governments mustconfront in creating a better investment cli-mate.
Firms are the generators of wealth andjobs in society, and an investment climatethat is hostile to firms cannot expect to pro-mote economic growth or reduce poverty.
So creating a favorable investment climatemust begin with understanding the perspec-tives and preferences of firms. Firms exist tomake profits for their owners—somethingthey’ve done for thousands of years (box2.2)—and their policy preferences areguided by that objective. In contrast, gov-ernment policies need to balance the prefer-ences of firms with broader social objectives.Governments thus have to understandwhere the interests of firms may divergefrom those of the wider society, and mustdeal with the implications of differences inpreferences between and within firms.
Stable macroeconomic policy, secureproperty rights, reliable infrastructure, andefficient financial markets benefit firms andsociety. But there is potential for great diver-gence in some areas. Obviously, most firms
The opportunities and incentives thatfirms face to invest productively, createjobs, and expand are shaped by thecosts, risks, and barriers to competitionassociated with particular investmentopportunities (chapter 1). Governmentsinfluence those factors through a com-bination of their formal policies in par-ticular areas—stability and security, reg-ulation and taxation, finance andinfrastructure, and workers and labormarkets—and broader governance fea-tures.The latter include control of rent-seeking, credibility, public trust andlegitimacy, and institutional fit.
Formal policies and broader gover-nance features interact to shape theinvestment climate experienced byfirms (see figure). Poor control of rent-seeking can influence both the contentand the implementation of formal poli-cies.Weak credibility can underminethe impact of any formal policy.Concerns about public trust and legiti-macy can impede the implementationof reforms and undermine the sustain-ability (and hence credibility) ofpolicies. Policy interventions that arenot well adapted to local conditionscan also have poor or even perverseresults.Tackling these four broadersources of policy failure is fundamentalto efforts to create a better investmentclimate.
B O X 2 . 1 Governance and the investment climate
04_WDR_Ch02.qxd 8/24/04 10:33 AM Page 37
38 WORLD DEVELOPMENT REPORT 2005
would prefer to pay less in taxes—includingtaxes required to sustain the public servicesthey benefit from and to fund other socialobjectives. Many firms would prefer to com-ply with fewer regulations—including thoseto safeguard the environment and promoteother important social interests. Most firmswould also welcome access to subsidizedcredit—whatever the policy justification orimplications for financial sector develop-ment. And most firms would welcomemonopolies or other restrictions on competi-tion to increase their profits and reduce the
pressure to innovate and perform effi-ciently—whatever the consequences for con-sumers and broader society. Similar ten-sions can arise in most areas of investmentclimate policy.
This is not to suggest that firms are roguesor bandits. Most individuals would also pre-fer to pay less in taxes and welcome subsi-dized loans. Many firms also voluntarilyaccept obligations well beyond those requiredby law, whether through a sense of philan-thropy, as a form of brand differentiation, toprotect their reputation, or to earn the sup-port of their workers and surrounding com-munities (box 2.3). International economicintegration is increasing pressures on firms tobuild and maintain good reputations, but it isnot a new phenomenon: even the infamousUnited Fruit Company provided its workersin Guatemala with schools and hospitals.2
Nor are there always tradeoffs between thepreferences of firms and other social goals,even in matters of regulation and taxation.Improving the design and administration ofregulatory or tax systems can reduce the bur-dens on firms, but can also contribute to bet-ter regulatory compliance and higher tax rev-enues. When regulatory regimes have notbeen reviewed in decades, are only partiallyenforced, and are used more to extract bribesthan to protect broader social interests—alltoo common in many countries—the oppor-tunities for solutions that benefit both firmsand broader society can be huge (chapter 5).
Since ancient times people have been striv-ing to increase their opportunities by mov-ing from subsistence to exchange andinvestment. As far back as 3000 BCE, busi-ness arrangements in Mesopotamia wentbeyond simple barter. Sumerian familieswho traded along the Euphrates and Tigrisrivers developed contracts that tried torationalize property ownership. A thousandyears later the Assyrians developed an earlyversion of a venture capital fund.
Early predecessors of companiesappeared in Rome by the second Punic War(218–202 BCE). For much of the Middle Agesguilds were the most important form ofbusiness organization. In the 16th and 17thcenturies governments and merchantscombined to create chartered companies toexploit the riches of the New World.Whilethe mid-20th century saw widespreadexperiments with public enterprise, the sub-
sequent disenchantment led to a strongrenaissance of private enterprise.Today theprivate sector accounts for the bulk ofinvestment and the overwhelming majorityof jobs in developing countries.
Private trade and investment are notonly ancient—they are extremely hard tosuppress. Some private investment contin-ues even in Somalia’s war zones, and there isrecent acknowledgment of private enter-prise even in North Korea. In the meantimeprivate activities are becoming more global:Trade as a share of global GDP rose from 25percent in 1960 to 57 percent in 2001, andworld flows of foreign direct investmentreached $1.4 trillion in 2000.
Source: Micklethwait and Wooldridge (2003); IMF(2004);,Bates (2001); Bernstein (1996);Yergin andStanislaw (2002);World Bank (1996b); McMillan(2002); The Economist (2003a); Chinoy (1998);World Bank (2004k); and UNCTAD (2003i).
B O X 2 . 2 Firms in history
The debate on firms’ responsibility to social con-cerns has a long history. Part of it stems from dif-ferent conceptions of the objectives of firms.TheAnglo-American model focuses primarily onmaximizing shareholder value, though corporatephilanthropy has long been important. Europeanand Japanese models put more weight on otherstakeholders, especially workers.While there hasbeen some convergence between models, thereare still debates about the extent to which firmscan—or should—worry about matters otherthan wealth creation.
Social obligations are imposed on firmsthrough taxation and regulation. Some firmsvoluntarily accept broader obligations. Forexample, multinational firms operating in devel-oping countries often exceed minimal local reg-
ulatory requirements—one study shows thataffiliates of U.S. multinationals pay a wage pre-mium of 40 percent in high-income countriesand 100 to 200 percent of the local averagewage in low-income countries.
It can be hard to distinguish the motives forthese behaviors.At one level it might be perceivedto be in the best interests of the firm,taking abroad view of reputation and risk.Firms may do itto protect their interests in a healthy workforce,aswith firms in Africa that are providing HIV/AIDSdrugs to their workers.Others may consider it partof a brand differentiation strategy,as with dolphin-free tuna,no animal testing for The Body Shop,orsocially conscious mutual funds.
Still other firms are responding to concernsabout reputation. Nike and Disney have worked
to improve working conditions in their plants inAsia, following criticisms and protests from civilsociety. More firms are also adopting codes ofconduct on matters of corporate social responsi-bility, often based on international norms pro-moted by civil society groups or internationalagencies (chapter 9). For example, about 20banks worldwide have adopted the EquatorPrinciples, a voluntary set of guidelines for man-aging social and environmental issues related tofinancing development projects, based on thepolicies and guidelines of the World Bank andInternational Finance Corporation.
Source: Graham (2000); The Economist (1999, 2002a);and the Equator Principles Web site (www.equator-principles.com).
B O X 2 . 3 Firms and social responsibility
04_WDR_Ch02.qxd 8/24/04 10:33 AM Page 38

Confronting the underlying challenges 39
The task of balancing the preferences offirms and broader social interests is com-plicated by differences in preferences andpriorities between and within firms. Firmsshare common perspectives on manyissues, but their interests may diverge onspecific policy questions. This is mostapparent when considering proposals toreduce barriers to competition. Proposalsto lower barriers will typically be resistedby protected firms, but would benefit firms(and others) that rely on products from theprotected sector as inputs. For example, ithas been estimated that restrictions on steelimports into the United States in 2002 cost
firms relying on steel as an input two-and-a-half times the benefits to local steel pro-ducers.3 Similarly, proposals to develop abond market may be resisted by banks thatprefer less competition in debt markets, butbe welcomed by industrial firms.4 Conflictscan also arise over the structure of taxation,the detailed design of particular regulatoryregimes, or the priority given to infrastruc-ture development in different locations.Even when engaged in the same activity inthe same location, firms of different typescan face different constraints, leading todifferent policy preferences and priorities(box 2.4).
Investment climate policymaking is complicatedby differences in the preferences and prioritiesof firms.Those differences can be seen alongmultiple dimensions: the extent to which thefirm’s activity is labor- or capital-intensive; theextent to which the firm serves local or exportmarkets, or is otherwise exposed tointernational competition; the firm’s specificlocation within a country; and a range of otherfactors particular to each industry or firm. Prefer-ences and priorities can also differ along fourbroader dimensions.
Foreign and local firms. Foreign firms stillface many regulatory barriers intended to pro-tect local firms, and foreign firms may be morevulnerable to expropriation. Foreign firms tendto be less constrained in their access to financ-ing than local firms, may be able to relocatemore easily in response to adverse changes inthe investment climate, and may have more
options for dispute resolution. Foreign firmsalso often place more priority oninfrastructure—in part reflecting more sophisti-cated production methods and a greaterpropensity to export.
Large and small firms. Fixed costs tend toimpose a disproportionate burden on smallerfirms, as with license or permit fees and evenbribes. Evidence from the Investment ClimateSurveys indicates that bribe payments as a shareof sales are 50 percent larger for small firms.Large firms may make higher payments, but theburden on them may be smaller.When unreli-able power supply requires firms to have theirown generators, this cost can also be greater forsmaller firms.This means that smaller firmsstand to benefit more from broadly basedinvestment climate improvements than largerfirms. Smaller firms also tend to have greater dif-ficulty getting finance than larger firms and
tend to pay higher interest rates—survey datashow that small firms are 50 percent more likelyto see this as a major or severe constraint. Largerfirms are more likely to have a bank loan, reflect-ing the advantages of having a track record andholding more assets that can be pledged as col-lateral. So improving the operation of financialmarkets will often be a higher priority for smallfirms.
Formal and informal firms. Informal activitiesaccount for more than half of economic activityin many developing countries. Although firms inthe informal economy operate free of many taxand regulatory requirements, they have lesssecure property rights and more difficulty get-ting public services and obtaining financing atreasonable cost (see figure). In Peru the nominalborrowing rate for informal firms was found tobe more than four times that of formal firms ofsimilar size. Noncompliance with taxes and reg-ulations can also make them easy targets forbribes or bureaucratic harassment.
Rural and urban firms. Remoteness and lowerpopulation densities increase the cost of provid-ing infrastructure and other public services inrural areas. Access to finance is also often moreof a constraint. Informal firms in rural areas canface even more constraints than their peers inurban areas. For example, in Cambodia informalrural firms reported greater concerns aboutinfrastructure and finance than informal urbanfirms.They also had greater concerns about cor-ruption, crime, and policy uncertainty.
Source: World Bank Investment Climate Surveys;WDR Surveys of Micro and Informal Firms; Hallward-Driemeier and Stone (2004); Hallward-Driemeierand Stewart (2004); Schneider (2002); and de Soto(2000).
B O X 2 . 4 How do firm differences affect their policy preferences and priorities?
Formal and informal firms have different perspectives
0 10 20 50
FormalInformal
Percent of firms reporting constraints30 40
Transportation
Access to land
Electricity
Cost & access to finance
Policy uncertainty
Note: Share of firms reporting issue as a major or severe constraint. Source: World Bank Investment Climate Surveys, WDR Surveys of Micro and Informal Firms.
04_WDR_Ch02.qxd 8/24/04 10:33 AM Page 39

40 WORLD DEVELOPMENT REPORT 2005
Within firms, owners, managers, andemployees share some common interestsbut conflict on others. Recent scandalsinvolving Enron and Parmalat highlight thepotential for conflicts between the interestsof management and other shareholders(chapter 6). There are also tensions betweenowners and workers over wages, benefits,and employment protection. For owners,lower labor costs and greater flexibility inhiring and firing workers have many bene-fits. Workers, of course, prefer higher wagesand more job protection. While regulationsthat make it harder to fire workers are oftenseen as favoring workers over employers,the cost of meeting those regulations isoften passed on to existing workers(through lower wages) and to the unem-ployed. Some workers may benefit, butthere are often subgroups with differentinterests (chapter 7).
These differences mean that there is nosingle vision of an ideal investment climate.Governments need to arbitrate between rivalclaims. Like other interest groups, firms arenot passive in this process and are often pre-pared to devote resources to obtain favorablepolicy treatment. Lobbying is an ancient art,and regulated firms have a long history oftrying to win favorable treatment from theirregulators.5
Managing the tension that can arisebetween firm preferences and broader socialinterests gives rise to four practical challengesfor investment climate improvement:
• Restraining rent-seeking
• Establishing credibility
• Fostering public trust and legitimacy
• Ensuring that policy responses reflect agood institutional fit.
Restraining rent-seekingWhen asked why he robbed banks, WillieSutton was reported to have replied, “That’swhere the money is.”6 In a similar way,investment climate policymaking can act asa magnet for rent-seeking by firms, officials,and other interests.
Firms, officials, and other groups haveincentives to manipulate the design orimplementation of investment climate poli-cies to advance their private interests. Cor-ruption and outright predation are themost glaring examples, but rent-seeking canalso include more subtle forms that do notinvolve the breaking of laws or the exchangeof cash. Capture and patron-clientelism canalso undermine the development of asound investment climate.
Corruption and predationCorruption—the exploitation of publicoffice for private gain—can harm the invest-ment climate in several ways.7 When it infectsthe highest levels of government, it can dis-tort policymaking on a grand scale andundermine the credibility of government.Even when played out through officials atlower echelons of government, corruptioncan be a tax on entrepreneurial activity, divertresources from the public coffers, and create aconstituency for erecting or maintainingunnecessary red tape. The Investment Cli-mate Surveys show that the majority of firmsin developing countries expect to pay bribes.They also show how corruption can vary byfirm size and by region (table 2.1), and howthe main locus of bribe-taking can varybetween countries (figure 2.1).
Corruption manifests itself as a publicsector phenomenon. Typically, firms, con-sumers, or other groups make payments topoliticians or public officials in return forfavorable decisions—whether a high-levelpolicy decision or a more mundane matter,such as getting a connection to utilities, clear-ing goods through customs, or registering abusiness. Unlike most production, corrup-
Table 2.1 Bribes vary by firm size, sector, and region
Firms Bribes asreporting bribes share of sales
% %
Formal sector firms 55.5 3.9 Micro (<10 employees) 49.9 4.4 Small (10–19) 56.7 4.8 Medium (20–49) 57.6 4.0 Large (50–249) 58.5 3.4 Very large (250+) 55.7 3.0
Informal sector firms 27.4 8.6 Small (<10 employees) 25.5 8.5 Large (10+) 49.1 9.3
Central and Eastern Europe 43.1 2.8Sub-Saharan Africa 50.0 5.2Commonwealth of Independent States 51.0 3.4East Asia and Pacific 59.1 4.2Latin America and the Caribbean 68.8 7.0South Asia 74.2 3.2
Source: World Bank Investment Climate Surveys, and WDR Surveys of Micro and Informal Firms.
04_WDR_Ch02.qxd 8/24/04 10:33 AM Page 40

Confronting the underlying challenges 41
tion is subject to increasing returns: anincrease in rent-seeking activity may makecorruption more attractive, not less.8 So highlevels of corruption can be sustainable, anddivert energy from more productive activity.No country can claim to be immune from theproblem. In the extreme, a “predatory” stateconsumes the surpluses of the economy, asgovernment offices come to be treated asincome-generating property (box 2.5).
Rent-seeking behavior can be especiallypronounced in countries that have a high-level of dependence on exports of minerals,oil, or other natural resources. While manyof today’s successful economies—includingAustralia, Chile, and Norway—prospered inpart through natural resource endowments,dependence on natural resources has beenmore of a curse than a blessing for manydeveloping countries (box 2.6).
Corruption can be traced to a combina-tion of three basic factors: monopolypower, discretionary authority, and inade-quate accountability for the exercise of thatauthority. As Klitgaard put it
[C]orruption is a crime of calculation, notpassion. True, there are saints who resist alltemptations, and honest officials who resistmost. But when the size of the bribe is large,the chance of being caught small, and thepenalty if caught meager, many officials willsuccumb.9
Figure 2.1 The main locus of bribe-taking can vary
0
1
2
3
4
5
6
3
Perc
ent o
f sal
es
ChinaPakistanTanzania
Utilities
Inspections
Licenses
Other
Note: Countries selected to illustrate variations. “Other” includesconstruction permits and government contracts.Source: World Bank Investment Climate Surveys.
At independence the Democratic Republic ofCongo’s main asset was nothing less than ahorn of plenty—a 300-kilometer-long, 70-kilometer-wide mining complex (UnionMinière du Haut Katanga), renamedGécamines after its nationalization in 1966.The Belgians had left behind a supportingnetwork of refineries, hydroelectric installa-tions, employee housing, schools, and hospi-tals.The company provided 70 percent of thecountry’s export receipts.
The war in Katanga (formerly Shaba)province contributed to an initial collapse ofoutput, but by the late 1960s Gécamines hadrecovered. So important was the mine to thenation’s economy that then-PresidentMobutu had a power line connected fromthe mine to electricity generators 1,800 kilo-meters to the north in Kinshasa as a way offorever tying the mines to the capital.TheInga-Shaba line bypassed thousands of elec-tricity-starved villages, as well as local damsthat might have supplied power to the minemore easily.
In the early 1970s the complex was pro-ducing between 400,000 and 700,000 metrictons of copper and between 10,000 and18,000 metric tons of cobalt a year, securingannual revenues between $700 million and$900 million. For Mobutu, Gécamines was a
source of ready cash. Supported by a coterieof foreign bankers, he used diverse schemesto strip the company, ranging from divertingforeign exchange receipts to presidentialaccounts, to forward selling of minerals withthe proceeds going to the presidency. Not allthe proceeds went solely to the president’spersonal account. Gécamines alsoguaranteed state debts and covered personalexpenses of top executives and their families.According to one outside audit, officials werestealing around $240 million a year, oftenlisted in corporate reports under the categoryredressment exceptionnel déficitaire—”excep-tional deficit recovery.”
These practices starved the company ofany earnings, led to the deterioration of itsfixed assets,and when copper prices collapsedin 1974,sped the company’s demise.By 1990Zairean copper cost twice as much to produceas its foreign equivalent. In 1994 productiondropped to 30,600 metric tons of copper and3,000 metric tons of cobalt a year,with zerorevenues.According to some estimates, inorder to restore annual production to 300,000metric tons a new investor would need toinject around $3 billion, including $2 billionjust to absorb the company’s debts.
Source: Wrong (2001).
B O X 2 . 5 The predation of Gécamines in Mobutu’s Zaïre
In principle an abundance of naturalresources such as minerals or oil should bea valuable asset in creating a modern, pros-perous economy. Certainly many of today’ssuccessful economies have been able toleverage these assets to their advantage.But in many developing countries substan-tial endowments of natural resources oftenseem more like a curse than a blessing.
A wealth of natural resources can haveseveral adverse consequences.When thediscovery of natural resources attracts signif-icant capital inflows, the value of thenational currency can appreciate, makingnon-resource exports less competitive—theso-called “Dutch disease.”Heavy reliance onresource exports can also expose an econ-omy to the vicissitudes of international com-modity price movements. But the impact ongovernance can be far more harmful.Thepotential to exploit natural resources canprompt more intense rent-seeking behaviorby politicians and others, diverting attentionfrom more productive activities. In theextreme, competition over access to therents from natural resources can lead to, orperpetuate, civil war.When governments
rely heavily on revenues from suchresources there are also weak incentives todevelop a broad tax base or consistent andnon-arbitrary tax policies. Far from being abenefit to the state, relief from needingeffective local tax laws and administrationcan lead to unaccountable, inefficient, anduninformed government.
How have some countries been able tocapitalize on resource endowments withoutsuccumbing to the resource curse? Historicaland contemporary evidence suggests sev-eral possibilities. It helps if natural resourcesdo not dominate the local economy, and ifresource extraction is not dominated bymonopolies. It also helps if governments areheld accountable for their behavior throughpolitical competition and an informed popu-lation. Efforts to create a better investmentclimate for firms outside the resource sectorcan also play an important role by helping todiversify the economy and so reduce depen-dence on natural resources.
Source: Stijns (2000); Tornell and Lane (1999);Levi (1988); Sachs and Warner (2001); Leite andWeidmann (1999); Ross (2001); Chaudhry(1997); and Moore (1998).
B O X 2 . 6 Natural resource endowments: Blessing or curse?
04_WDR_Ch02.qxd 8/24/04 10:33 AM Page 41

42 WORLD DEVELOPMENT REPORT 2005
Strategies for tackling corruption focuson the same three points. The scope ofmonopoly power can be reduced in severalways. Competition can be facilitated wher-ever possible, and government interven-tions that lack a compelling policy justifica-tion can be eliminated. Firm surveys
confirm that bribe payments are higherwhen dealings with officials cannot beavoided.10 Evidence suggests that countrieswith more interventionist approaches tobusiness regulation also tend to have morecorruption (figure 2.2).
Where intervention is justified, the scopefor bureaucratic discretion can be limited byreducing unnecessary ambiguity or vague-ness in government policies and regulations,by promptly publishing implementing regu-lations, and by promoting adherence toprecedent by publishing administrativedecisions and rulings (chapter 5).
The third and complementary strategy isto enhance accountability for the exercise ofpublic authority. Political competition canplay an important role in holding govern-ments responsible for their results and fortheir behaviors. But experience shows thatmore is required. Enhancing the trans-parency of government-firm transactions isone of the most promising strategies, andhas become an increasing focus of efforts toaddress corruption worldwide. A free pressalso plays a critical role in monitoring gov-ernments and informing citizens, helping tokeep potential abuses in check.11 A growingnumber of countries are also creating spe-cialist bodies to investigate and prosecutecorruption and lead broader preventionstrategies (box 2.7).
Developing clear standards of publicconduct and conflict-of-interest laws for thecivil service can constrain discretion andinfluence social norms within an agency.Providing protections to whistleblowers canreinforce those norms and complementother monitoring mechanisms.12 Lowsalaries in the civil service are often believedto contribute to corruption, but the rela-tionship can be complex. Certainly civil ser-vice salaries are less likely to influence large-scale corruption at higher echelons ofgovernment, which can be particularlydestructive to the investment climate and tosociety generally. And while studies suggestthat increasing salaries for lower-level offi-cials might reduce the incidence of smaller-scale corruption, this will not always be afeasible or cost-effective strategy.13 So, whileimproving civil service wages and condi-tions can be an important part of improv-
Figure 2.2 More business start-up proceduresincrease both delays and corruption
100 80 60 40 20 0 10080604020CorruptionDays required
Proc
edur
es to
sta
rt a
busi
ness
≥18171615141312111098765432
Note: 133 countries are grouped by average number of proceduresneeded to start a business in each country. Number of daysrequired to start a business and level of corruption are then aver-aged according to the number of procedures needed to start abusiness across those groups of countries. Corruption is aweighted average of multiple indicators of corruption, taken fromKaufmann, Kraay, and Mastruzzi (2003), and normalized by samplemaximum and minimum.Source: World Bank (2004b) and Kaufmann, Kraay, and Mastruzzi(2003).
In 1974 Hong Kong established a three-pronged anticorruption strategy focused oninvestigation, prevention, and education,implemented by the autonomous Commis-sion against Corruption. Drawinginspiration from its success, similarinitiatives have been adopted in countriesas diverse as Botswana and Lithuania.
Botswana. Following a series of high-level corruption scandals, Botswana createda Directorate of Corruption and EconomicCrime in 1994 with powers to investigateand prosecute suspects, prevent corruption,and educate the public.The directorate is anautonomous agency under the Office of thePresident. In its first two years of operation, itlaunched 828 investigations, bringing 141
persons before the court and recoveringapproximately $1 million in fines, forfeitures,seizures, and taxes. It has sustained an activepublicity campaign through seminars,poster campaigns, displays at trade exhibi-tions, and cartoon strips, as part of the moraleducation of the young.
Lithuania. In 1997 Lithuania established aSpecial Investigation Service that reports tothe president and the parliament.The numberof prosecutions for bribe-taking increasedsevenfold between 1997 and 2002 (from 10 ayear to 73),and the cases of prosecution forabuse of office, from 2 in 1997 to 19 in 2002.
Source: Open Society Institute (2002); Fombad(1999); and Doig and Riley (1998).
B O X 2 . 7 Combating corruption in Botswana andLithuania
04_WDR_Ch02.qxd 8/24/04 10:33 AM Page 42

Confronting the underlying challenges 43
ing the quality and professionalism of thecivil service, merely increasing salaries doesnot substitute for broader efforts to limitmonopoly power, curb discretion, andenhance accountability.
Capture and patron-clientelismInvestment climate policies can be distortedby rent-seeking in forms that do not involvebreaking laws or direct exchanges of cash.Industrial-financial elites, workers, con-sumers, and other groups influence policy-making to very different degrees in differentsettings. When one group has dispropor-tionate influence, the design or implementa-tion of policies can be skewed in their favorat the expense of society as a whole in waysthat establish long-lasting privileges for thatgroup. There are two related phenomena:capture and patron-clientelism.
Capture. Firms and other groups can skewpolicies in their favor by formal or informallobbying, controlling access to information,or a variety of other strategies. It has longbeen recognized that regulatory agencies arevulnerable to becoming “captured” by theindustries they are charged with regulating,and so promote the interests of the industryrather than those of the broader public.14
The concept of “state capture” has morerecently been used to describe how firmsand other groups can shape the formationof laws and policies (as opposed to theirimplementation) through informal andopaque channels of influence—by control-ling the policy agenda or by changing thebasic nature of representation and constitu-tional design.15 Firms or other groups mostdirectly affected by particular laws or poli-cies will have stronger incentives to invest ininfluencing policy than consumers andother groups, and usually also face fewerlogistical difficulties in framing a coordi-nated view. These groups often also havesuperior access to information and technicalexpertise than legislators, regulators, or oth-ers affected by the policy decision.
Patron-clientelism. Under conditions ofcapture, it is usually the private interestgroup that derives benefits. But politiciansand officials also have incentives to exploit
relationships with private interests. In soci-eties with democratic forms of government,elected representatives make policy in theinterests of their constituents in exchangefor political support. This is a necessarypart of ensuring the accountability andresponsiveness of policymakers to their citi-zens. But representative government candevolve into patron–clientelism when poli-cymakers distribute policy privileges to par-ticular groups on the basis of ethnic or cul-tural solidarity or political support, often atthe expense of society as a whole. The prob-lems can be even worse in dictatorships,where leaders still need to curry favor withparticular groups, but are subject to fewerconstraints.16
Investment climate policymaking pre-sents myriad opportunities for grantingbenefits to, and redistributing resourcestoward, favored groups. Policies that wouldbenefit the investment climate may not beimplemented because they cannot rewardloyalty and strengthen ties between patronsand clients.17 The result: property rights, tax,and regulatory regimes are designed withspecific constituencies in mind. Govern-ments suppress competition by conferringmonopolies, devising market restrictions, ortolerating cartels. Tax systems become rid-dled with special exemptions—or areenforced selectively. Financial markets areunderdeveloped because governments helpmiddlemen maintain their stranglehold onthe allocation of funds. Public investment ininfrastructure and related tariff policies aredesigned to reward favored groups.18
Patron-clientelism can be exacerbated inpolarized and fragmented societies, wherepoliticians use their authority to benefit theirparticular constituencies. Governments withlow credibility in the eyes of the public as awhole may also resort more to clientelisticapproaches to buy support from particulargroups.19 Unequal access to information canhave an even more pervasive impact onclientelism. Citizens may want leaders whowill implement policies that benefit societyas a whole rather than favor particulargroups, but they cannot always tell the differ-ence—particularly when governments useless transparent forms of intervention (box2.8). Uninformed voters are more likely to
04_WDR_Ch02.qxd 8/24/04 10:33 AM Page 43

44 WORLD DEVELOPMENT REPORT 2005
ment projects and targeted tax breaks tend toproliferate as elections approach.21
There is some evidence to suggest thatthe more widespread the direct personalconnections between owners of firms andpoliticians, the poorer the quality of a coun-try’s investment climate.22 These connec-tions can yield substantial benefits to firmsand politicians alike, creating incentives forboth parties to invest in such relationships.It has been estimated that as much as aquarter of the share value of Indonesianfirms before 1998 could be attributed todependence on the Suharto family.23
The Bank’s surveys confirm that firmsthat are part of the favored circle tend toface a more attractive policy environmentthan other firms (figure 2.3). The evidencealso suggests that more influential firms arelikely to innovate less (figure 2.4).24 Oneinterpretation is that a more challengingenvironment is more conducive to innova-tion. More likely, perhaps, the favored firmsare more concerned with maintaining theirinfluence and enjoying the resulting bene-fits than focusing on improving their pro-ductivity.
Every society faces the challenge of creat-ing governance arrangements that canaccommodate a spectrum of interests whilepreventing the formation of undue or illicitinfluence by any particular group to thedetriment of others. Three complementarystrategies can help:
• Enhancing the transparency of govern-ment-firm relations. Regulatory arrange-ments can be designed and administeredin ways that facilitate public scrutiny,
Governments wishing to confer benefits on aparticular group can choose between two mainstrategies.They can make an explicit budgetarytransfer, or they can create a market restrictionor provide other forms of less transparent sup-port.
From an economic standpoint, the firstapproach is more efficient.The costs are borneby taxpayers in general. And when the tax sys-tem is reasonably efficient, those costs are usu-ally of the same order of magnitude as the ben-efit. Market restrictions, by contrast, impose thecosts on a subcategory of society (typically con-
sumers), and those costs usually far exceed thebenefits received. For example, restrictions onthe import of steel in the United States in 2002were estimated to deliver benefits to theprotected industry of $240 million, but imposecosts on U.S. steel-using industries of nearly$600 million. Market restrictions also createadditional costs for society by dulling the incen-tives of the protected group to innovate andimprove productivity.
Why do governments so frequently choosethe less efficient option? One possible explana-tion is that they lack the budget resources to
make direct transfers.This is not always the case,however, and an explicit tax rebate could oftenachieve similar results. A more common expla-nation is that the less efficient approach is moreappealing politically.The transfer is nottransparent. It is usually not exposed to thesame level of scrutiny as a budgeted item. Andconsumers or others are often not in a positionto evaluate the magnitude of the costs beingimposed on them.
Source: Tullock (1983); Acemoglu, Johnson, andRobinson (2001); Hufbauer and Goodrich (2003b).
B O X 2 . 8 The form of intervention: How many cheers for transparency?
Figure 2.3 More influential firms face fewer constraints
0 10 30Percent of firms reporting constraintto be a “severe” or “major” obstacle
20
Tax rates
Policy uncertainty
Tax administration
Corruption
Access to financing
Customs and trade regulations
Legal system
Licenses and permits
Labor regulations
Electricity
Crime
Access to land
Transportation
Telecommunications
Least influentialfirms
Most influentialfirms
Note: Percentages based on simulations controlling for country, firm size, and sector. “Influence” is measured as the dif-ference, as perceived by firms, between their own ability to influence national policies and legislation and the ability ofother domestic firms to do so. Figure shows responses for those firms regarding themselves as most and least influential.Source: Desai (2004), drawing on World Bank Investment Climate Surveys.
support or oppose policies based on crude,visible criteria—for example, whether theeconomy seems to be prospering or whethernew highways are being built.20 In manycountries—rich and poor—public invest-
04_WDR_Ch02.qxd 8/24/04 10:33 AM Page 44

Confronting the underlying challenges 45
including through use of regulatoryimpact assessments (chapter 3). The dis-closure of budgetary or quasi-budgetarysupport provided to firms or industriescan be mandated. Government procure-ment practices can be made open andcompetitive. “Sunshine laws” can requirecertain government decisions to be pre-ceded by opportunities for public com-ment and for public access to certainrecords. No less important, the disclo-sure of funding for political parties canbe mandated.25
• Broadening policy dialogues. Investmentclimate policymaking affects a broadrange of interests—not just those oflarge or influential firms. Creating aninvestment climate that benefits every-one requires processes to ensure thisfuller set of interests is heard, includingrepresentatives of consumers andsmaller firms. Business associations cansometimes give smaller firms more of avoice in policymaking (box 2.9). Manygovernments are also establishing dedi-cated consultative mechanisms tobroaden the dialogue on investment cli-mate issues (chapter 3).
• Strengthening accountability mechanisms.Strong and competitive legislatures canpermit disenfranchised groups to chal-lenge the authority and privilege ofincumbents, and make it more difficultfor executive branch officials to deliverclientelistic policies (figure 2.5).26
Expanding legislative authority overbudgetary matters and strengtheningoversight of regulators reduces the pref-erentialism in taxation and the preva-lence of regulatory capture.27 A free andindependent media can make the publicaware of the costs of clientelistic prac-tices and reinforce accountabilitythrough the ballot box.
Establishing credibilityFirms do not make decisions based on theformal content of laws, regulations, or pol-icy statements alone. Because investmentdecisions are forward looking, firms need toassess the likelihood of those policies actu-ally being implemented and sustained over
the life of their proposed investment.Addressing firms’ concerns about uncer-tainty, and building policy credibility, arefundamental to creating a better investmentclimate.
The central role of uncertaintyUncertainty plays a central role in invest-ment decisions. Because those decisions areforward looking, with the bulk of costs
Figure 2.4 More influential firms innovate less
0
Perc
enta
ge d
ecre
ase
in p
roba
bilit
yof
und
erta
king
act
ivity
–10
–20
–30
–40
–50
–60New
facilityUpgrade product
lines
Moderatelyinfluentialfirms
Mostinfluentialfirms
Introducenew
technology
Introducenew
productlines
Note: Percentage decrease is relative to firms’ regarding themselves as least influen-tial. The findings are based on simulations controlling for country, firm size, and sec-tor. “Influence” is measured as the difference, as perceived by firms, between theirown ability to influence national policies and legislation and the ability of otherdomestic firms to do so.Source: Desai (2004), drawing on World Bank Investment Climate Surveys.
Business associations can lower the costs ofinformation and help firms seek opportunitiesand make transactions in new markets.Theycan be economywide,or “peak”associations,such as confederations of industry,manufac-turers’associations,and entrepreneurs’associ-ations.They can also be sectoral lobbies.
In some cases business associations con-solidate the influence of already powerfulgroups.The Thai Bankers’Association,forexample,represents 13 banks,four of whichcontrol more than two-thirds of Thailand’sbanking assets.But business associations canalso help to broaden the dialogue on invest-ment climate policy issues,giving voice tofirms that might not otherwise be heard.InIndia, for example,the Self-Employed Women’s
Association represents the policy concerns ofmore than 300,000 members working in theinformal economy.
Experience suggests that business asso-ciations are more likely to contribute to asound investment climate when:
• They are free of state influence and notreliant on governments for resources,capital, or personnel.
• They are unaffected by endemic sectar-ian divisions.
• They have a broad constituency.
• They exercise their influence through for-mal, transparent channels.
Source: Maxfield and Schneider (1997), andRecanatini and Ryterman (2001).
B O X 2 . 9 Business associations and the investmentclimate
04_WDR_Ch02.qxd 8/24/04 10:33 AM Page 45
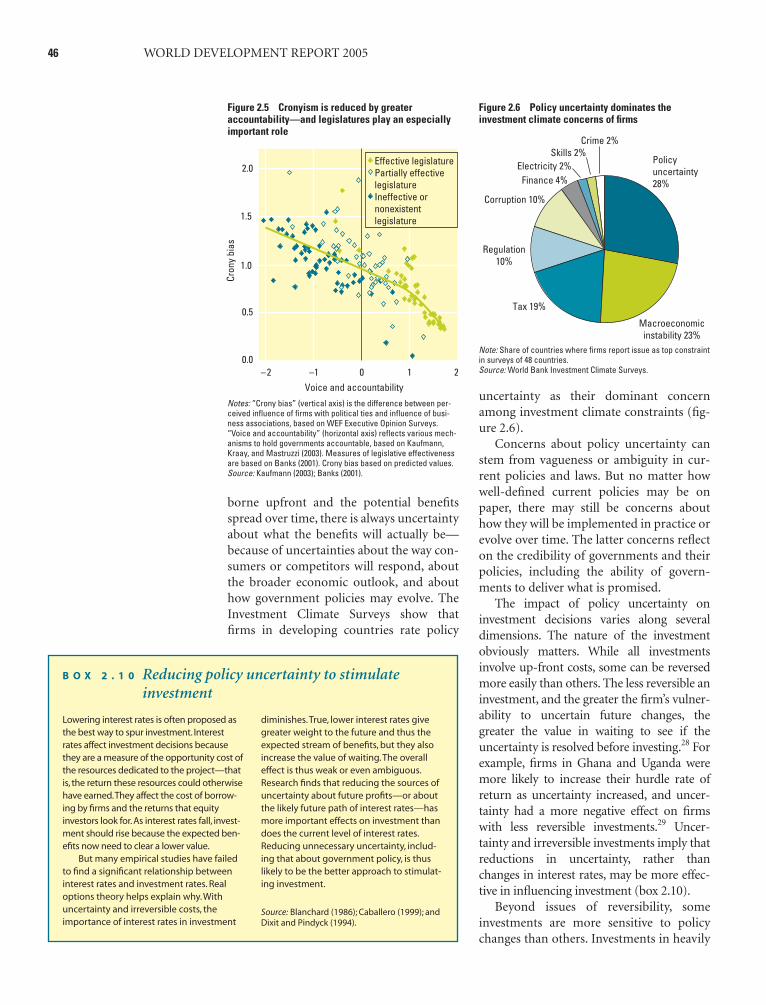
46 WORLD DEVELOPMENT REPORT 2005
borne upfront and the potential benefitsspread over time, there is always uncertaintyabout what the benefits will actually be—because of uncertainties about the way con-sumers or competitors will respond, aboutthe broader economic outlook, and abouthow government policies may evolve. TheInvestment Climate Surveys show thatfirms in developing countries rate policy
uncertainty as their dominant concernamong investment climate constraints (fig-ure 2.6).
Concerns about policy uncertainty canstem from vagueness or ambiguity in cur-rent policies and laws. But no matter howwell-defined current policies may be onpaper, there may still be concerns abouthow they will be implemented in practice orevolve over time. The latter concerns reflecton the credibility of governments and theirpolicies, including the ability of govern-ments to deliver what is promised.
The impact of policy uncertainty oninvestment decisions varies along severaldimensions. The nature of the investmentobviously matters. While all investmentsinvolve up-front costs, some can be reversedmore easily than others. The less reversible aninvestment, and the greater the firm’s vulner-ability to uncertain future changes, thegreater the value in waiting to see if theuncertainty is resolved before investing.28 Forexample, firms in Ghana and Uganda weremore likely to increase their hurdle rate ofreturn as uncertainty increased, and uncer-tainty had a more negative effect on firmswith less reversible investments.29 Uncer-tainty and irreversible investments imply thatreductions in uncertainty, rather thanchanges in interest rates, may be more effec-tive in influencing investment (box 2.10).
Beyond issues of reversibility, someinvestments are more sensitive to policychanges than others. Investments in heavily
–2 –1 0Voice and accountability
Cron
y bi
as
1 20.0
0.5
1.0
1.5
2.0Effective legislaturePartially effectivelegislatureIneffective ornonexistentlegislature
Notes: “Crony bias” (vertical axis) is the difference between per-ceived influence of firms with political ties and influence of busi-ness associations, based on WEF Executive Opinion Surveys.“Voice and accountability” (horizontal axis) reflects various mech-anisms to hold governments accountable, based on Kaufmann,Kraay, and Mastruzzi (2003). Measures of legislative effectivenessare based on Banks (2001). Crony bias based on predicted values.Source: Kaufmann (2003); Banks (2001).
Figure 2.5 Cronyism is reduced by greater accountability—and legislatures play an especiallyimportant role
Figure 2.6 Policy uncertainty dominates theinvestment climate concerns of firms
Crime 2%Skills 2%
Electricity 2%Finance 4%
Corruption 10%
Regulation10%
Tax 19%
Macroeconomicinstability 23%
Policyuncertainty28%
Note: Share of countries where firms report issue as top constraintin surveys of 48 countries.Source: World Bank Investment Climate Surveys.
Lowering interest rates is often proposed asthe best way to spur investment. Interestrates affect investment decisions becausethey are a measure of the opportunity cost ofthe resources dedicated to the project—thatis, the return these resources could otherwisehave earned.They affect the cost of borrow-ing by firms and the returns that equityinvestors look for. As interest rates fall, invest-ment should rise because the expected ben-efits now need to clear a lower value.
But many empirical studies have failedto find a significant relationship betweeninterest rates and investment rates. Realoptions theory helps explain why.Withuncertainty and irreversible costs, theimportance of interest rates in investment
diminishes.True, lower interest rates givegreater weight to the future and thus theexpected stream of benefits, but they alsoincrease the value of waiting.The overalleffect is thus weak or even ambiguous.Research finds that reducing the sources ofuncertainty about future profits—or aboutthe likely future path of interest rates—hasmore important effects on investment thandoes the current level of interest rates.Reducing unnecessary uncertainty, includ-ing that about government policy, is thuslikely to be the better approach to stimulat-ing investment.
Source: Blanchard (1986); Caballero (1999); andDixit and Pindyck (1994).
B O X 2 . 1 0 Reducing policy uncertainty to stimulateinvestment
04_WDR_Ch02.qxd 8/24/04 10:33 AM Page 46
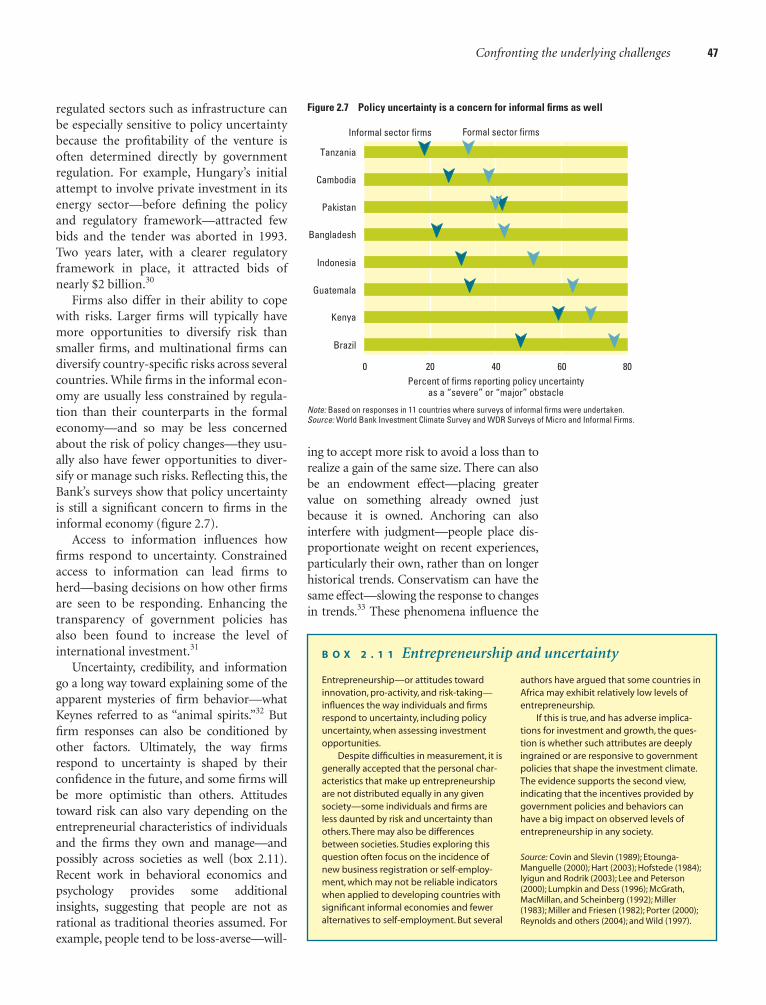
Confronting the underlying challenges 47
regulated sectors such as infrastructure canbe especially sensitive to policy uncertaintybecause the profitability of the venture isoften determined directly by governmentregulation. For example, Hungary’s initialattempt to involve private investment in itsenergy sector—before defining the policyand regulatory framework—attracted fewbids and the tender was aborted in 1993.Two years later, with a clearer regulatoryframework in place, it attracted bids ofnearly $2 billion.30
Firms also differ in their ability to copewith risks. Larger firms will typically havemore opportunities to diversify risk thansmaller firms, and multinational firms candiversify country-specific risks across severalcountries. While firms in the informal econ-omy are usually less constrained by regula-tion than their counterparts in the formaleconomy—and so may be less concernedabout the risk of policy changes—they usu-ally also have fewer opportunities to diver-sify or manage such risks. Reflecting this, theBank’s surveys show that policy uncertaintyis still a significant concern to firms in theinformal economy (figure 2.7).
Access to information influences howfirms respond to uncertainty. Constrainedaccess to information can lead firms toherd—basing decisions on how other firmsare seen to be responding. Enhancing thetransparency of government policies hasalso been found to increase the level ofinternational investment.31
Uncertainty, credibility, and informationgo a long way toward explaining some of theapparent mysteries of firm behavior—whatKeynes referred to as “animal spirits.”32 Butfirm responses can also be conditioned byother factors. Ultimately, the way firmsrespond to uncertainty is shaped by theirconfidence in the future, and some firms willbe more optimistic than others. Attitudestoward risk can also vary depending on theentrepreneurial characteristics of individualsand the firms they own and manage—andpossibly across societies as well (box 2.11).Recent work in behavioral economics andpsychology provides some additionalinsights, suggesting that people are not asrational as traditional theories assumed. Forexample, people tend to be loss-averse—will-
ing to accept more risk to avoid a loss than torealize a gain of the same size. There can alsobe an endowment effect—placing greatervalue on something already owned justbecause it is owned. Anchoring can alsointerfere with judgment—people place dis-proportionate weight on recent experiences,particularly their own, rather than on longerhistorical trends. Conservatism can have thesame effect—slowing the response to changesin trends.33 These phenomena influence the
80Percent of firms reporting policy uncertainty
as a “severe” or “major” obstacle
6040200
Brazil
Indonesia
Kenya
Guatemala
Informal sector firms Formal sector firms
Pakistan
Cambodia
Tanzania
Bangladesh
Note: Based on responses in 11 countries where surveys of informal firms were undertaken. Source: World Bank Investment Climate Survey and WDR Surveys of Micro and Informal Firms.
Figure 2.7 Policy uncertainty is a concern for informal firms as well
Entrepreneurship—or attitudes towardinnovation, pro-activity, and risk-taking—influences the way individuals and firmsrespond to uncertainty, including policyuncertainty, when assessing investmentopportunities.
Despite difficulties in measurement, it isgenerally accepted that the personal char-acteristics that make up entrepreneurshipare not distributed equally in any givensociety—some individuals and firms areless daunted by risk and uncertainty thanothers.There may also be differencesbetween societies. Studies exploring thisquestion often focus on the incidence ofnew business registration or self-employ-ment, which may not be reliable indicatorswhen applied to developing countries withsignificant informal economies and feweralternatives to self-employment. But several
authors have argued that some countries inAfrica may exhibit relatively low levels ofentrepreneurship.
If this is true, and has adverse implica-tions for investment and growth, the ques-tion is whether such attributes are deeplyingrained or are responsive to governmentpolicies that shape the investment climate.The evidence supports the second view,indicating that the incentives provided bygovernment policies and behaviors canhave a big impact on observed levels ofentrepreneurship in any society.
Source: Covin and Slevin (1989); Etounga-Manguelle (2000); Hart (2003); Hofstede (1984);Iyigun and Rodrik (2003); Lee and Peterson(2000); Lumpkin and Dess (1996); McGrath,MacMillan, and Scheinberg (1992); Miller(1983); Miller and Friesen (1982); Porter (2000);Reynolds and others (2004); and Wild (1997).
B O X 2 . 1 1 Entrepreneurship and uncertainty
04_WDR_Ch02.qxd 8/24/04 10:33 AM Page 47
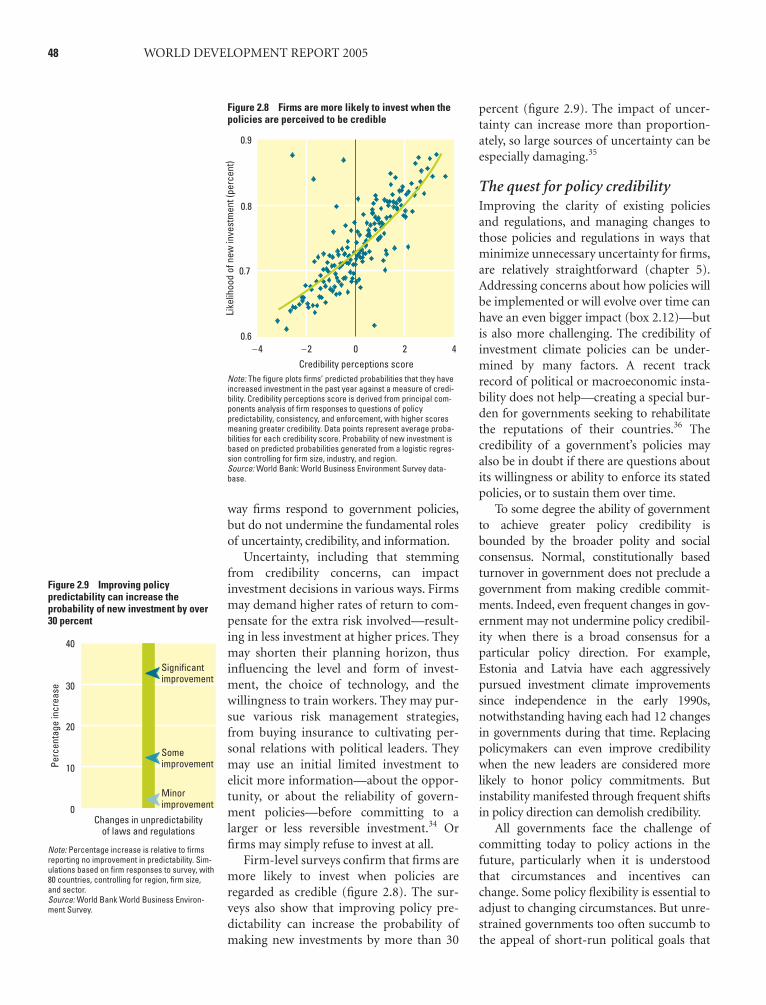
48 WORLD DEVELOPMENT REPORT 2005
way firms respond to government policies,but do not undermine the fundamental rolesof uncertainty, credibility, and information.
Uncertainty, including that stemmingfrom credibility concerns, can impactinvestment decisions in various ways. Firmsmay demand higher rates of return to com-pensate for the extra risk involved—result-ing in less investment at higher prices. Theymay shorten their planning horizon, thusinfluencing the level and form of invest-ment, the choice of technology, and thewillingness to train workers. They may pur-sue various risk management strategies,from buying insurance to cultivating per-sonal relations with political leaders. Theymay use an initial limited investment toelicit more information—about the oppor-tunity, or about the reliability of govern-ment policies—before committing to alarger or less reversible investment.34 Orfirms may simply refuse to invest at all.
Firm-level surveys confirm that firms aremore likely to invest when policies areregarded as credible (figure 2.8). The sur-veys also show that improving policy pre-dictability can increase the probability ofmaking new investments by more than 30
percent (figure 2.9). The impact of uncer-tainty can increase more than proportion-ately, so large sources of uncertainty can beespecially damaging.35
The quest for policy credibilityImproving the clarity of existing policiesand regulations, and managing changes tothose policies and regulations in ways thatminimize unnecessary uncertainty for firms,are relatively straightforward (chapter 5).Addressing concerns about how policies willbe implemented or will evolve over time canhave an even bigger impact (box 2.12)—butis also more challenging. The credibility ofinvestment climate policies can be under-mined by many factors. A recent trackrecord of political or macroeconomic insta-bility does not help—creating a special bur-den for governments seeking to rehabilitatethe reputations of their countries.36 Thecredibility of a government’s policies mayalso be in doubt if there are questions aboutits willingness or ability to enforce its statedpolicies, or to sustain them over time.
To some degree the ability of governmentto achieve greater policy credibility isbounded by the broader polity and socialconsensus. Normal, constitutionally basedturnover in government does not preclude agovernment from making credible commit-ments. Indeed, even frequent changes in gov-ernment may not undermine policy credibil-ity when there is a broad consensus for aparticular policy direction. For example,Estonia and Latvia have each aggressivelypursued investment climate improvementssince independence in the early 1990s,notwithstanding having each had 12 changesin governments during that time. Replacingpolicymakers can even improve credibilitywhen the new leaders are considered morelikely to honor policy commitments. Butinstability manifested through frequent shiftsin policy direction can demolish credibility.
All governments face the challenge ofcommitting today to policy actions in thefuture, particularly when it is understoodthat circumstances and incentives canchange. Some policy flexibility is essential toadjust to changing circumstances. But unre-strained governments too often succumb tothe appeal of short-run political goals that
–4 –2 0Credibility perceptions score
Like
lihoo
d of
new
inve
stm
ent (
perc
ent)
2 40.6
0.7
0.8
0.9
Note: The figure plots firms’ predicted probabilities that they haveincreased investment in the past year against a measure of credi-bility. Credibility perceptions score is derived from principal com-ponents analysis of firm responses to questions of policypredictability, consistency, and enforcement, with higher scoresmeaning greater credibility. Data points represent average proba-bilities for each credibility score. Probability of new investment isbased on predicted probabilities generated from a logistic regres-sion controlling for firm size, industry, and region.Source: World Bank: World Business Environment Survey data-base.
Figure 2.8 Firms are more likely to invest when thepolicies are perceived to be credible
30
20
10Perc
enta
ge in
crea
se
0
40
Changes in unpredictabilityof laws and regulations
Significantimprovement
Someimprovement
Minorimprovement
Figure 2.9 Improving policypredictability can increase theprobability of new investment by over30 percent
Note: Percentage increase is relative to firmsreporting no improvement in predictability. Sim-ulations based on firm responses to survey, with80 countries, controlling for region, firm size,and sector.Source: World Bank World Business Environ-ment Survey.
04_WDR_Ch02.qxd 8/24/04 10:33 AM Page 48
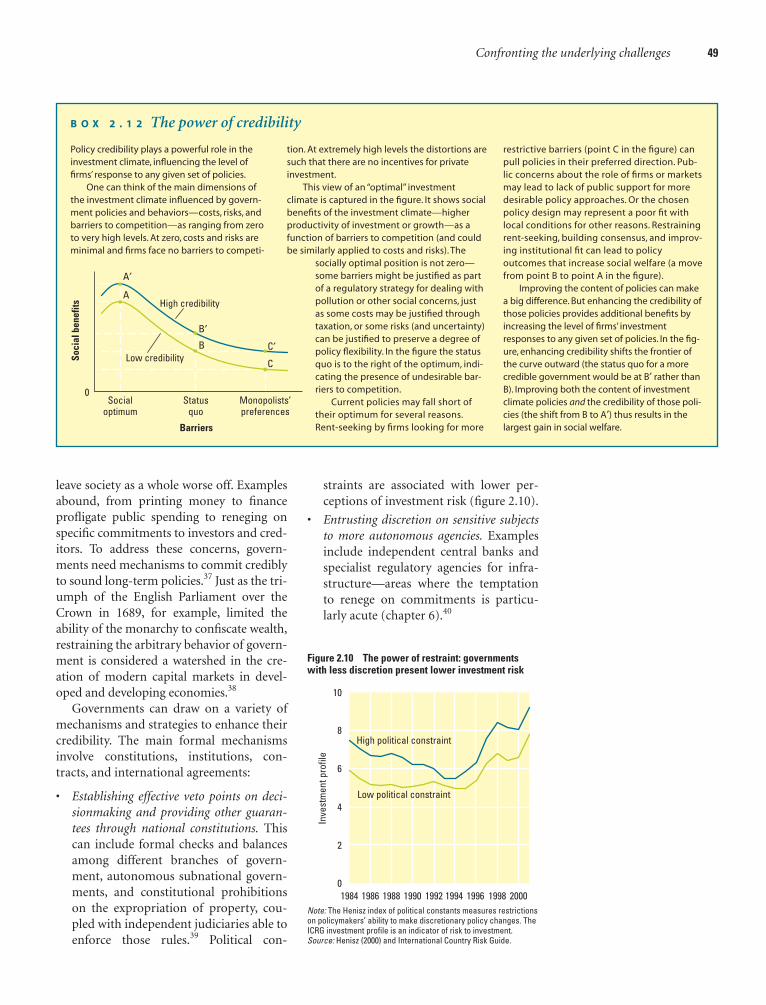
Confronting the underlying challenges 49
leave society as a whole worse off. Examplesabound, from printing money to financeprofligate public spending to reneging onspecific commitments to investors and cred-itors. To address these concerns, govern-ments need mechanisms to commit crediblyto sound long-term policies.37 Just as the tri-umph of the English Parliament over theCrown in 1689, for example, limited theability of the monarchy to confiscate wealth,restraining the arbitrary behavior of govern-ment is considered a watershed in the cre-ation of modern capital markets in devel-oped and developing economies.38
Governments can draw on a variety ofmechanisms and strategies to enhance theircredibility. The main formal mechanismsinvolve constitutions, institutions, con-tracts, and international agreements:
• Establishing effective veto points on deci-sionmaking and providing other guaran-tees through national constitutions. Thiscan include formal checks and balancesamong different branches of govern-ment, autonomous subnational govern-ments, and constitutional prohibitionson the expropriation of property, cou-pled with independent judiciaries able toenforce those rules.39 Political con-
straints are associated with lower per-ceptions of investment risk (figure 2.10).
• Entrusting discretion on sensitive subjectsto more autonomous agencies. Examplesinclude independent central banks andspecialist regulatory agencies for infra-structure—areas where the temptationto renege on commitments is particu-larly acute (chapter 6).40
Policy credibility plays a powerful role in theinvestment climate, influencing the level offirms’ response to any given set of policies.
One can think of the main dimensions ofthe investment climate influenced by govern-ment policies and behaviors—costs, risks, andbarriers to competition—as ranging from zeroto very high levels. At zero, costs and risks areminimal and firms face no barriers to competi-
tion. At extremely high levels the distortions aresuch that there are no incentives for privateinvestment.
This view of an “optimal” investmentclimate is captured in the figure. It shows socialbenefits of the investment climate—higherproductivity of investment or growth—as afunction of barriers to competition (and couldbe similarly applied to costs and risks). The
socially optimal position is not zero—some barriers might be justified as partof a regulatory strategy for dealing withpollution or other social concerns, justas some costs may be justified throughtaxation, or some risks (and uncertainty)can be justified to preserve a degree ofpolicy flexibility. In the figure the statusquo is to the right of the optimum, indi-cating the presence of undesirable bar-riers to competition.
Current policies may fall short oftheir optimum for several reasons.Rent-seeking by firms looking for more
restrictive barriers (point C in the figure) canpull policies in their preferred direction. Pub-lic concerns about the role of firms or marketsmay lead to lack of public support for moredesirable policy approaches. Or the chosenpolicy design may represent a poor fit withlocal conditions for other reasons. Restrainingrent-seeking, building consensus, and improv-ing institutional fit can lead to policyoutcomes that increase social welfare (a movefrom point B to point A in the figure).
Improving the content of policies can makea big difference. But enhancing the credibility ofthose policies provides additional benefits byincreasing the level of firms’ investmentresponses to any given set of policies. In the fig-ure, enhancing credibility shifts the frontier ofthe curve outward (the status quo for a morecredible government would be at B′ rather thanB). Improving both the content of investmentclimate policies and the credibility of those poli-cies (the shift from B to A′) thus results in thelargest gain in social welfare.
B O X 2 . 1 2 The power of credibility
Socialoptimum
0Status
quoMonopolists’preferences
Barriers
Low credibility
High credibility
A′
A
B
C
C′
Soci
al b
enef
its
B′
01984 1986
Low political constraint
High political constraint
1988 1990 1992 1994 1996 1998 2000
2
4
6
8
10
Inve
stm
ent p
rofil
e
Figure 2.10 The power of restraint: governmentswith less discretion present lower investment risk
Note: The Henisz index of political constants measures restrictionson policymakers’ ability to make discretionary policy changes. TheICRG investment profile is an indicator of risk to investment. Source: Henisz (2000) and International Country Risk Guide.
04_WDR_Ch02.qxd 8/24/04 10:33 AM Page 49

• Providing specific contractual commit-ments on particularly sensitive matters.While clearly not feasible for all firms ortopics, this is a common strategy formajor natural resource and infrastructureprojects, and increasingly common onmatters of taxation for a broader range ofactivities (chapter 5). The credibility ofcontractual commitments can be furtherenhanced by making them subject tointernational arbitration (chapter 4).
• Entering international agreements thatcommit governments to sound policies.International agreements cover a growingrange of investment climate policy areas.They can enhance credibility by increas-ing the costs of reneging on relevant pol-icy commitments, whether through rep-utation effects or by the threat of moretangible sanctions (chapter 9).
Formal mechanisms of these kinds arenot the whole story. For example, privatiza-tion programs in sensitive areas often allo-cate at least some of the shares in the priva-tized enterprise to a wide range of localpeople to raise the political costs of a policyreversal. In the transition economies, this
was one rationale for mass privatizationprograms. In Bolivia and Chile similareffects were obtained by including pensionfunds among the investors in privatizedutilities. Improving the ability of firms andconsumers to monitor and evaluate policyactions can also enhance credibility,41 andso can create structures to sustain an ongo-ing process of reforms, including effectiveconsultation and policy review mechanisms(chapter 3).
Establishing credibility can be particu-larly challenging for governments buildingon a legacy of political and economicinstability. But Uganda’s experience in the1990s shows how persistence can pay off(box 2.13).
Firms and governments can also come toother arrangements that may allow invest-ment to proceed but that involve longer-term costs for society. For example, in theaftermath of the Mexican revolution of1910–20 one might have expected privateinvestment to collapse as revolutions, civilwars, and coups took their toll. Yet invest-ment was not disrupted. One explanation isthat revolution-era Mexican governmentsoffered credible protection to existinginvestors by incorporating them into rulingcoalitions.42 The phenomenon of “cronycapitalism” in Indonesia and other coun-tries in more recent history can beexplained through the same lens: forgingclose ties between selected firms and politi-cians allowed investment to proceed in anenvironment with few formal checks ongovernment.43 But these arrangements canossify to the detriment of the broaderinvestment climate—and to the detrimentof more innovative entrepreneurs, smallerfirms, and consumers. This underscores theimportance of drawing on commitmentmechanisms that embrace broader seg-ments of society—not merely elites or thelargest firms, but smaller firms and othergroups as well.
Fostering public trust and legitimacyGovernments and firms do not interact in avacuum. The broader social context caninfluence the investment climate in twomain ways: in the level of social cohesion
50 WORLD DEVELOPMENT REPORT 2005
Many economies in Africa have stagnatedor shrunk in recent decades, largely reflect-ing poor investment climates.Yet Ugandaclimbed out of civil conflict and chaos in thelate 1980s and severe macroeconomicinstability in the early 1990s to more thandouble the share of private investment inGDP between 1990 and 2000, and boostedits per capita GDP by over 4 percent a yearfrom 1993 to 2002—or 8 times the averagein Sub-Saharan Africa. How?
Beginning in 1991–92 the governmentlaunched reforms that eventually encom-passed most aspects of the investment cli-mate. Macroeconomic stability wasachieved, and the independence of the cen-tral bank was strengthened. Monopolies incoffee, cotton, and tea were dismantled, andtrade barriers were reduced. A new invest-ment code providing protection againstexpropriation was introduced, and thereturn of property expropriated by an ear-lier government was accelerated. Anautonomous tax agency was created. Publicenterprises were privatized. A new commer-
cial court was established in 1996.Thetelecommunications sector wasmodernized through competition and pri-vate sector participation, including the pri-vatization of Uganda Telecom Limited in2002.The power sector was opened to pri-vate participation, and in 2002 a 20-yearconcession was awarded for the country’smain generating station. Efforts are underway to improve business regulation.
Each reform had some impact on theopportunities and incentives for firms. Justas important, the determination of policy-makers to stick with reforms—includingdealing with setbacks along the way—enhanced the credibility of thegovernment’s commitment to create amore productive society. For example, theprivatization of Uganda Telecom succeededonly on the third attempt.The UgandaCommercial Bank was privatized only in2002, after an earlier unsuccessful attempt.
Source: Holmgren and others (2001) and WorldBank (2001d).
B O X 2 . 1 3 Building credibility through persistence inUganda
04_WDR_Ch02.qxd 8/24/04 10:33 AM Page 50
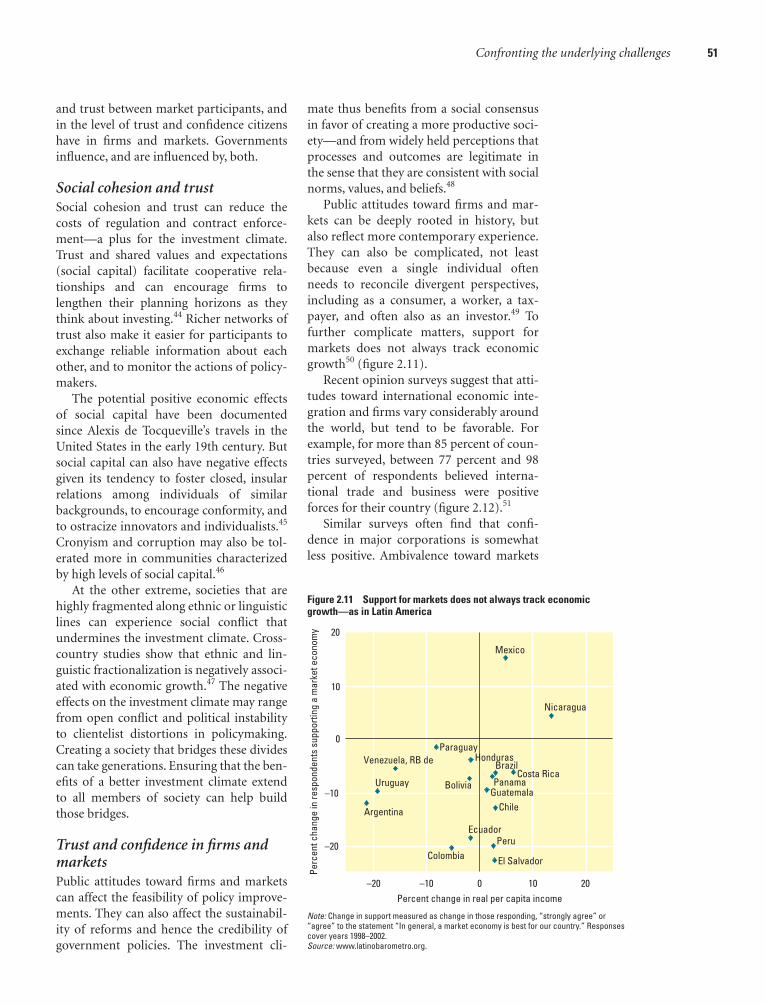
and trust between market participants, andin the level of trust and confidence citizenshave in firms and markets. Governmentsinfluence, and are influenced by, both.
Social cohesion and trustSocial cohesion and trust can reduce thecosts of regulation and contract enforce-ment—a plus for the investment climate.Trust and shared values and expectations(social capital) facilitate cooperative rela-tionships and can encourage firms tolengthen their planning horizons as theythink about investing.44 Richer networks oftrust also make it easier for participants toexchange reliable information about eachother, and to monitor the actions of policy-makers.
The potential positive economic effectsof social capital have been documentedsince Alexis de Tocqueville’s travels in theUnited States in the early 19th century. Butsocial capital can also have negative effectsgiven its tendency to foster closed, insularrelations among individuals of similarbackgrounds, to encourage conformity, andto ostracize innovators and individualists.45
Cronyism and corruption may also be tol-erated more in communities characterizedby high levels of social capital.46
At the other extreme, societies that arehighly fragmented along ethnic or linguisticlines can experience social conflict thatundermines the investment climate. Cross-country studies show that ethnic and lin-guistic fractionalization is negatively associ-ated with economic growth.47 The negativeeffects on the investment climate may rangefrom open conflict and political instabilityto clientelist distortions in policymaking.Creating a society that bridges these dividescan take generations. Ensuring that the ben-efits of a better investment climate extendto all members of society can help buildthose bridges.
Trust and confidence in firms andmarketsPublic attitudes toward firms and marketscan affect the feasibility of policy improve-ments. They can also affect the sustainabil-ity of reforms and hence the credibility ofgovernment policies. The investment cli-
mate thus benefits from a social consensusin favor of creating a more productive soci-ety—and from widely held perceptions thatprocesses and outcomes are legitimate inthe sense that they are consistent with socialnorms, values, and beliefs.48
Public attitudes toward firms and mar-kets can be deeply rooted in history, butalso reflect more contemporary experience.They can also be complicated, not leastbecause even a single individual oftenneeds to reconcile divergent perspectives,including as a consumer, a worker, a tax-payer, and often also as an investor.49 Tofurther complicate matters, support formarkets does not always track economicgrowth50 (figure 2.11).
Recent opinion surveys suggest that atti-tudes toward international economic inte-gration and firms vary considerably aroundthe world, but tend to be favorable. Forexample, for more than 85 percent of coun-tries surveyed, between 77 percent and 98percent of respondents believed interna-tional trade and business were positiveforces for their country (figure 2.12).51
Similar surveys often find that confi-dence in major corporations is somewhatless positive. Ambivalence toward markets
Confronting the underlying challenges 51
–10–20 0Percent change in real per capita income
Mexico
ParaguayVenezuela, RB de
Uruguay
Argentina
BrazilCosta Rica
PanamaGuatemala
Chile
Peru
El SalvadorColombia
Bolivia
Nicaragua
Perc
ent c
hang
e in
resp
onde
nts
supp
ortin
g a
mar
ket e
cono
my
10 20
–10
–20
10
0
20
Ecuador
Honduras
Note: Change in support measured as change in those responding, “strongly agree” or“agree” to the statement “In general, a market economy is best for our country.” Responsescover years 1998–2002.Source: www.latinobarometro.org.
Figure 2.11 Support for markets does not always track economicgrowth—as in Latin America
04_WDR_Ch02.qxd 8/24/04 10:33 AM Page 51

and firms, particularly toward “big busi-ness,” has a long pedigree.52 Historicallythese concerns have been heightened bycorporate or corruption scandals, leading topublic backlashes against firms and marketsand to demands for more intrusive regula-tion or even nationalization.53 These con-cerns also reflect responses to the way gov-ernments manage conflicts and protect theircitizens.
Multinational firms have long arousedsuspicion due to concerns about their loyal-ties and their possible economic power.54
This has recently led to mutual efforts topromote corporate social responsibilitythrough the elaboration of various codes ofconduct (see box 2.2). Other concernsabout government–firm relationships,including those about corruption and otherforms of rent-seeking, are also creating
52 WORLD DEVELOPMENT REPORT 2005
1
2
3
Confidence in corporations (left axis)
Conf
iden
ce in
maj
or c
orpo
ratio
ns
International trade and global business (right axis)
Supp
ort f
or in
tern
atio
nal t
rade
and
bus
ines
s
4
0
20
40
80
60
100
U.K.China
France
Ukraine
U.S.
Canada
RB de VenezuelaBrazil
India
BangladeshPoland
Philippines
South Africa
NigeriaGhana
Argentina
Czech Rep.
Russia
Slovak R
ep.
BulgariaJapan
Germany
Peru
Rep. of K
orea
Mexico
Italy
Note: Survey questions were (right axis) “Are international trade and business ties good for your country?” (percent responding yes); (leftaxis) “How much confidence do you have in major corporations?” (1 = none, 4 = a great deal).Source: The Pew Global Attitudes Project (2003) and Inglehart and others (2000).
Figure 2.12 Strong support for international trade and business—but less confidence in corporations
Proposals to enhance the transparency of gov-ernment–firm dealings are often seen as mainlyaddressing corruption or other forms of rent-seeking. But reducing concerns about inappropri-ate behavior can also contribute to broader pub-lic support for firms and markets, and so facilitateongoing investment climate improvements.
Two recent global initiatives focus onimproving the transparency of revenue arrange-ments between international investors and hostgovernments in the natural resources sector.ThePublish What You Pay campaign, supported by acoalition of more than 200 nongovernmentalorganizations (NGOs), proposes legislationrequiring publicly listed oil and mining compa-nies to disclose information about payments togovernment as a condition of stock exchangelisting.The Extractive Industries TransparencyInitiative, launched at the World Summit on Sus-tainable Development in 2002, encourages gov-ernments; international organizations; NGOs;
publicly traded, private, and state-owned extrac-tive enterprises; and others with an interest inthe sector to work together to develop a frame-work for reconciling payments by firms to gov-ernments and account for any missing amounts.
Nigeria took an initial lead in enhancing rev-enue transparency. In 2003 the Nigerian govern-ment agreed to publish budgets and records ofoil revenue collection, as well as applicablestatutes and rules. It also encouraged oil compa-nies doing business in the country to make fulldisclosure of their revenues and costs of opera-tion.The accounts are then to be examined byan “aggregator”—an independent auditor—toassess any discrepancies.
Under the Extractive Industries TransparencyInitiative a commission was also established inAzerbaijan to publish revenues of the State OilFund. In a similar vein the Chad-CameroonPetroleum Development and Pipeline project,supported by the World Bank, established a
framework for revenue management from thepipeline, earmarking revenues for poverty reduc-tion, and requiring private operators to conductbusiness only with firms that comply with trans-parency and disclosure rules.
The impetus for enhanced transparency isalso extending to private infrastructure arrange-ments.Traditionally many countries treated con-cession contracts and licenses like commercialagreements, not publicly disclosed. Growingrecognition of the public character of thesearrangements, and of the importance of foster-ing broad public support for reforms, has ledArgentina, Brazil, Panama, and Peru to publishthese contracts by placing them on a publicWeb site.Together, they have published morethan 120 contracts covering a range ofinfrastructure sectors.
Source: World Bank (2000b); World Bank (2001e);and World Bank staff.
B O X 2 . 1 4 Shining the light on government–firm dealings in natural resources and infrastructure
04_WDR_Ch02.qxd 8/24/04 10:33 AM Page 52

impetus to enhance the transparency ofdealings between governments and firms,particularly in areas where relationships canbe especially troublesome (box 2.14).
Because public support for markets doesnot necessarily track economic growth, andbecause the growth response from reformsis not always immediate, governments oftenneed to actively foster public support forinvestment climate improvements. Buildinga consensus in favor of a more productivesociety not only enhances the feasibility ofreform, but through its impact on sustain-ability and hence credibility can also have abig influence on the size of the investmentresponse. There are no simple formulas inthis area, but experience underlines theimportance of four key elements:
• Ensuring the benefits of a better invest-ment climate are not confined to partic-ular categories of firms, but extendwidely across society
• Promoting broad public understandingof the benefits of reform
• Enhancing the transparency of govern-ment-firm dealings to reduce concernsabout rent-seeking
• Protecting vulnerable groups that maybe disadvantaged during the transition.
Ensuring policy responsesreflect a good institutional fitMarket failure is the textbook rationale formost government interventions intended toimprove the investment climate. But thoseinterventions can fail to achieve theirintended result for myriad reasons, includ-ing inadequate information, expertise, orresources—or from rent-seeking, credibilitygaps, and lack of public support. The suc-cess of any policy intervention ultimatelydepends on the extent to which the chosenapproach reflects a good fit with local insti-tutional conditions.
Market failures may be more prevalentin developing countries than in developedcountries.55 But government failures canalso be more severe in countries with lim-ited resources and expertise and less devel-oped checks on government behavior. Pol-icy interventions make sense only when theexpected benefits exceed the likely costs.
Confronting the underlying challenges 53
This means governments need to weighcarefully the costs and benefits of alterna-tive approaches and take local conditionsinto account when designing particular pol-icy responses. Failure to give sufficientweight to local conditions can leave impor-tant market failures unchecked—or makematters worse. For example, approachesthat demand enforcement capacity beyondthat available may not only fail to meet theintended social objective but can also con-tribute to informality and corruption andundermine government credibility. Simi-larly, in the absence of effective safeguards,approaches that involve significant discre-tion may be misused to obtain bribes orexpose firms to unnecessary uncertaintyand risk (box 5.2).
The challenge of ensuring that policyresponses fit with local institutional condi-tions has implications for policy designacross the investment climate. It plays anespecially important role in the design ofregulatory strategies but is also relevant tothe distribution of responsibilities betweentiers of government (box 2.15).
Because conditions vary across coun-tries, transplanting approaches uncriticallyfrom one country to another often leads to
Decentralization has been a theme in con-stitutional design since at least the founda-tion of the Swiss Confederation in 1291, andremains a major theme to this day. Howdoes decentralization affect the investmentclimate?
Decentralization can contribute to asound investment climate in several ways.Decentralization of regulatory responsibili-ties can help locales adapt approaches totheir conditions and preferences and facili-tate the involvement of stakeholders. Fiscaldecentralization can assure local authoritiesthat taxes raised locally will not be appro-priated by the central government, givinglocal authorities incentives to develop theirlocal tax base. Decentralization also permitsa degree of institutional competitionbetween centers of authority that can stim-ulate policy innovation and reduce the riskthat governments will expropriate wealth.
But there are tradeoffs. Subnationalauthorities are not well placed to deal withissues that involve spillovers between juris-
dictions.They may also face more severecapacity constraints and be unable toexploit economies of scale associated withparticular functions. And subnational gov-ernments are not immune from governanceproblems—and in some contexts may bemore vulnerable to them than nationalauthorities.
Reflecting these tradeoffs, the optimallocation of particular policy and administra-tive responsibilities will depend on thecountry and policy issue concerned. Smallcountries present fewer opportunities fordecentralization than larger ones. But evenin large countries, some matters will be besthandled centrally, some subnationally, andothers may require some form of sharedresponsibility. A clear delineation of respon-sibility between tiers of governmentsreduces uncertainty and risk for firms andimproves accountability.
Source: Brueckner (2000); Treisman (2000); Tanzi(1995); and Weingast (1995).
B O X 2 . 1 5 Decentralization and the investment climate
04_WDR_Ch02.qxd 8/24/04 10:33 AM Page 53
poor results. Historically, many regulatorysystems in developing countries were trans-planted from colonial or occupying powerswith little regard to how they might operatein a very different environment. Becausethey were less relevant to local circum-stances, they were often ignored or enforcedselectively to solicit bribes. While the laws inthe source country went through a continu-ing process of modernizing and upgrading,the regimes left behind often did not. Forexample, company law regulating businessentry dates back to 1884 in the DominicanRepublic and to 1901 in Angola, while lawsdealing with insolvency date back to 1916 inNicaragua. One result is a high level ofinformality, with regulations ostensiblyaimed at mitigating market failures or pro-moting other social objectives often com-plied with by less than half the economy—yet placing a disproportionate burden onfirms that do comply.
A tendency to transplant approachesuncritically from one country to anothercontinues to this day. Policy approaches intoday’s rich countries can provide a usefulsource of inspiration. They may also reduce
the information costs faced by foreigninvestors and help signal the application ofhigh standards to local stakeholders. Butfailure to adapt approaches to local realitiescan lead to outcomes as poor as their moreancient forebears.
Strategies for tailoring approaches to localconditions vary according to the area of pol-icy intervention. They may involve develop-ing simpler rules with less discretion; relyingmore heavily on transparency, competition,and market monitoring; and reinforcing localinstitutional safeguards, including throughthe use of appropriate international arrange-ments. These strategies need to be comple-mented by efforts to strengthen governmentcapabilities (chapter 3).
Advances in information technology arealso creating opportunities to reducedemands on government capabilities, whileenhancing transparency and easing the bur-den on firms.56 These approaches have beenapplied to a wide range of investment cli-mate areas, including business regulationand land titles (box 2.16) as well as tax andcustoms administration (chapter 5).
Making progressThese four separate but related challengescan produce vicious circles of worseninggovernance and stagnating investment cli-mates. Weak control over rent-seeking notonly directly leads to poor economic out-comes, but also undermines governmentcredibility and can create or exacerbate fis-sures in society, and erode public trust infirms and markets. Low government credi-bility can contribute to rent-seeking and alack of public trust in firms and markets.Lack of public confidence in firms and mar-kets can undermine the credibility of policyreforms. Policy interventions that arepoorly adapted to local conditions can leaveimportant market failures unchecked,encourage informality and rent-seeking,undermine credibility, and also weakenpublic trust in firms and markets. Con-versely, the circles can be virtuous—withprogress in one area contributing to that inothers.
A common strategy for addressing allfour challenges is to enhance the trans-parency of government-firm dealings. This
54 WORLD DEVELOPMENT REPORT 2005
Advances in information technology, includ-ing the Internet, are paving the way forinvestment climate improvements thatreduce demands on public administration,enhance transparency, and ease complianceburdens on firms. Approaches to businessregulation in Singapore and land titling inIndia’s Karnataka state illustrate the potential.
The e-government initiative launchedby Singapore in 2000 included businessregistration and licensing procedures. Itprovides an online application system forbusiness registration and licensing and aone-stop online application system for cer-tain special licenses (for example, buildingand construction permits) that previouslyrequired separate submissions to as manyas 12 regulatory authorities.The integratedapproach reduced the cost of incorporatinga new company from anywhere betweenS$1,200 and S$35,000 (around $700 to$20,000) (depending on the capital of thecompany) to a flat fee of S$300 ($175).Whatused to require two days now requires lessthan two hours. Streamlining the submis-sion process for construction permits savesapplicants more than S$450 ($260).
India’s Karnataka state introduced anelectronic land-titling system, Bhoomi, inthe late 1990s.The online system isdelivered through kiosks installed in all landoffices of Karnataka.These kiosks providecopies of a Record of Rights,Tenancy, andCrops (RTC). Obtaining an RTC oncerequired up to 30 days, and typically a bribeof as much as Rs. 2,000 (about $43). Landrecords could be deliberately “blurred” forfees of Rs. 10,000 ($220).These records werenot open to the public, and it sometimestook two years for the records to beupdated under the manual accounting sys-tem maintained by 9,000 “village” accoun-tants—state employees responsible forthree to four villages each.Today an RTC canbe obtained for a fixed fee of Rs. 15 ($0.32)in 5 to 30 minutes.The records are open forpublic scrutiny. Citizens can now requestthat land titles be updated quickly throughthe kiosks, a process that has increased thenumber of annual applications for updatesby 50 percent.
Source: Tan (2004); Bhatnagar and Chawla(2004); and Lobo and Balakrishnan (2002).
B O X 2 . 1 6 E-government and the investment climate
04_WDR_Ch02.qxd 8/24/04 10:33 AM Page 54

can play a critical role in restraining rent-seeking, in contributing to policy credibility,and in helping to build public support forreforms. It can also be part of a strategy forcomplementing government capabilities andthus helping to ensure policy interventionsreflect a good institutional fit. Governmentsin both rich and poor countries have a longhistory of resisting calls for more openness,and some firms benefit from the resultingsecrecy.57 But more governments are open-ing their policy processes to public scrutinyand improving public access to information.Stakeholders are being consulted on regula-tion in Bolivia and Ghana. Infrastructurecontracts are being placed on public Websites in Argentina and Peru. Freedom ofinformation legislation is being introducedin China and Mexico. While care needs to be
Confronting the underlying challenges 55
taken not to encumber weak administrationswith some of the more elaborate proceduresadopted in some developed countries, morepragmatic approaches, including those thatexploit the potential of new informationtechnologies, create opportunities to trans-form governments—and the investment cli-mates they produce.
Improving the investment climate requiresgovernments to address these challenges inthe context of specific policy areas affectingstability and security, regulation and taxa-tion, finance and infrastructure, and work-ers and labor markets. The agenda is broadand demanding. Chapter 3 looks at whathas been learned about successful strategiesfor tackling such a broad agenda.
04_WDR_Ch02.qxd 8/24/04 10:33 AM Page 55

56
As chapter 2 highlighted, improving theinvestment climate requires governments tonavigate four sources of potential policyfailure that play out across a broad range ofpolicy areas, from property rights and busi-ness regulation to infrastructure and labormarkets. While the task may seem daunting,more countries are making significantimprovements—and are being rewardedwith faster growth and deeper povertyreductions. China, India, and Uganda, men-tioned for their achievements in chapter 1,are hardly alone. Many countries haveimproved at least some areas of their invest-ment climates. Their experience providesinsights into possible strategies for broad-ening and accelerating progress.
This chapter opens by looking at theimplications of the investment climate’sbreadth, encompassing a wide range of gov-ernment policies and behaviors, many ofthem interrelated, and all possibly influenc-ing the opportunities and incentives facingfirms. The good news is that perfection isnot needed in any given area to ignite signif-icant growth and poverty reduction. The keyis to address important constraints in a waythat gives firms confidence to invest—and tosustain a process of ongoing improvements.
The chapter then looks at lessons ofexperience in each of the four key require-ments for managing such a process:
• Setting priorities. The key is to reduceunjustified costs, risks, and barriers tocompetition. But there are no simpleformulas for translating those principlesto specific reform areas. Priorities needto be determined in each case based onan assessment of current conditions, thepotential benefits from improvement,the links with national or regional goals,and implementation constraints.
• Managing individual reforms. Reformsoften need to overcome resistance fromthose who benefit from the status quo.This can require a high level of politicalcommitment, but also benefits fromeffective communication, consultation,and when appropriate, compensation.
• Maintaining momentum. Given thebreadth of the agenda, and the need toreview policies regularly, reforms in thisarea can be characterized as a marathonrather than a sprint. To help maintainmomentum, many governments are cre-ating specialized supporting institutions,including those that facilitate consulta-tion, coordination, the review of existingconstraints, and the review of new policyand regulatory proposals.
• Strengthening government capabilities.Improving government capabilities is anessential complement to any reformprocess. This means building not onlymore technical expertise, but also betterand more reliable sources of information.
The investment climate as a packageGovernment policies and behaviors shapingthe investment climate play out over a broaddomain, from contract enforcement, busi-ness regulation, and taxation—to finance,electricity supply, and labor markets. Govern-ments typically administer each area in isola-tion, distributing responsibilities across arange of ministries and agencies. In contrast,firms tend to view particular investmentopportunities as a package, with governmentpolicies and behaviors that influence thecosts, risks, and barriers to competition aspart of that package. Why might this matter?
First, the impact of any policy improve-ment will depend on how it addresses a
Tackling a broad agenda
3c h a p t e r
05_WDR_Ch03.qxd 8/24/04 11:44 AM Page 56

Tackling a broad agenda 57
constraint that is actually binding on firms.So expanding access to credit will not havemuch impact on firms’ investment deci-sions—an effort sometimes described as“pushing on a string”1—until more funda-mental concerns about the security of theirproperty rights have been addressed.2 Pro-viding tax breaks may not be enough tocompensate for other weaknesses in theinvestment climate in some situations—but may be unnecessary in others.3 Simi-larly, introducing a competition law maynot have a big impact on the economywhen the main barriers to competitionstem from trade restrictions, governmentmonopolies, or other regulatory barriers toentry and exit.
Second, different areas of the investmentclimate policy can interact. Clarifying rightsto land can help ease access to credit byfirms and households—but only whencomplementary aspects of financial infra-structure are in place. Reducing barriers totrade will not deliver its full potential ifweak bankruptcy laws slow the exit of lessefficient firms, or if labor market policieslimit the ability of firms to adjust produc-tion processes to respond to a more com-petitive environment. Similarly, efforts toencourage local R&D can be hobbled byshortages of skilled workers, limited com-petition, or weak intellectual propertyrights.
So investment climate improvementsinvolve more than one-off, “stroke-of-the-pen” reforms. But this does not mean that
simultaneous and comprehensive reform isnecessary for significant results. Indeed,efforts to tackle the full set of investmentclimate policies simultaneously, even iftechnically feasible, could generate so muchuncertainty for firms that it might deterrather than encourage investment, at leasttemporarily.4 Deep and rapid institutionalchange can also be disruptive for society,possibly undermining public support andthus the sustainability of reform. So somesequencing of reforms is inevitable in a fieldas broad as the investment climate. Fortu-nately, experience shows that countries canreap significant benefits by addressingimportant constraints in a way that givesfirms confidence to invest—and sustaininga process to address other constraints asthey become more binding.
Take China, the country enjoying theworld’s fastest growth and poverty reduc-tion in recent years. The reform thatignited growth was the introduction of arudimentary system of property rights, ini-tially for township and village enterprisesand then for individual farmers and entre-preneurs. Once official targets were met,additional production could be sold forpersonal gain. The improvements unleasheda strong response because of the size of theeconomy benefiting from the change, andbecause the changes were implemented inways that gave people the confidence toinvest (box 3.1). Subsequent improve-ments—including those attracting foreigndirect investment (FDI) and improving
Growth in China is officially reported at an averageof 8 percent a year for the last 20 years—giving itthe most impressive (if disputed) sustained growthperformance in history.Declines in poverty havebeen equally dramatic—from 60 percent of thepopulation to 17 percent.Yet China only recentlygave constitutional protection to private propertyrights, inefficient state-owned enterprises still clut-ter the landscape,and the financial sector isdragged down with nonperforming loans.Howwas such sustained growth possible?
Growth was ignited by introducing a rudimen-tary system of property rights that gave farmersand township and village enterprises incentives totake risks and invest.The response was magnified
by the large size of the economy affected.No lessimportant,the reforms were interpreted by individ-uals and emerging enterprises as a decisive shift ingovernment policy favoring private initiative,rein-forced by a high level of policy stability,strengthen-ing the confidence to invest.The initial signal wasconfirmed by subsequent reforms that improvedthe environment for private business.Theseincluded efforts to attract FDI, improvements tobusiness regulation and infrastructure,accession tothe World Trade Organization (WTO),and efforts totackle corruption and improve transparency.
The Bank’s Investment Climate Surveysshow that China has created an investment cli-mate in its main industrial centers that would be
the envy of many developing countries—and itis not just about wages or exchange rates.Thesurveys show that in five of the main industrialcenters, the costs of infrastructure disruptions,crime, bribes, regulation, and contract enforce-ment difficulties average less than 14 percent ofsales.This is well below the average in countriessuch as Brazil and Pakistan, and half the averagein Tanzania (see figure 1.2). China still has a longway to go—especially in extending similarimprovements across the country—but itsstrong performance is less of a riddle whenviewed in this light.
Source: Chen and Wang (2001); Qian (2003); andYoung (2000).
B O X 3 . 1 Improving the investment climate, China’s way
05_WDR_Ch03.qxd 8/24/04 11:44 AM Page 57

58 WORLD DEVELOPMENT REPORT 2005
business regulation and infrastructure—addressed constraints initially less binding.A degree of autonomy between provinceshas also fostered experimentation and cre-ated incentives for lagging provinces toemulate the success of their faster movingcounterparts.5
India’s experience highlights the samebasic point (box 3.2). Its current period ofgrowth began with some trade, tax, and reg-ulatory reforms in the 1980s. Firmsresponded because the reforms addressedimportant constraints and because theywere seen as signaling a decisive policy shifttoward private sector–led growth. Subse-quent reforms, including the dismantling ofthe “licensing Raj” and further trade liberal-ization in 1991, did more to reduce costsand increased competitive pressure in theeconomy. Just as in China, a degree ofautonomy between state governments cre-ated room for states to innovate. Competi-tion between states is creating incentives forlagging states to follow the leaders, includ-ing by addressing long-standing problemsin the power sector.
Even when a policy improvementaddresses an important constraint, and isimplemented in a credible way, the extent ofthe benefits often depends on going on toaddress constraints that may have been lessbinding initially. For example, productivityimprovement in India’s manufacturing sec-
tor, while evident, has been reduced by bar-riers to exit that slow the pace of industrialrestructuring. Similarly, labor marketrestrictions have limited the productivityimprovements from trade reforms in manycountries in Latin America.6 Investment cli-mate policies also require regular review totake into account changes in the conduct ofbusiness, and ongoing lessons of experi-ence. Both considerations underline theimportance of processes to support ongo-ing policy improvements. As Porterobserved, reforms in this area are amarathon, not a sprint.7
Setting prioritiesImproving the investment climate involvesreducing unjustified costs, risks, and barri-ers to competition. In practice, costs, risks,and barriers are a function of governmentpolicies and behaviors that play outthrough a wide range of specific policyareas. Where should governments begin?
The diversity of investment climate con-ditions across and within countries, and thepotential for reforms to impact on firmsand activities differently, mean that thereare no standard formulas. Governmentsneed to determine priorities by assessingcurrent conditions, the potential benefitsfrom improvement, the links with broadernational or regional goals, and implementa-tion constraints.
In India much attention is paid to the liberaliza-tion efforts of 1991. Growth actually began pick-ing up in the 1980s.The early reforms were lessdramatic, more ad hoc, but they signaled animportant shift in government policy towardthe private sector.
In 1984 Rajiv Gandhi’s government initiatedreforms to encourage exports, facilitate foreigntechnology transfers, and rationalize the tax sys-tem. Quantitative controls on the import of capi-tal goods were eliminated.Tariffs were cut by 60percent.Taxes on profits from exports were cutby half. Fewer industries were subject to licens-ing.The policies were a major shift in approachaway from socialism and the primacy of redistri-bution over growth in production.
In the early 1990s the reforms were moredramatic—the Rupee became convertible,restrictions on foreign ownership were relaxed,additional quotas were abolished, and tariffs
were further reduced. Over the 1990s the paceslowed but reform continued. Licensing hasbeen eliminated in all but seven industries. Pri-vate firms have been allowed to compete inmore and more sectors. A new competition lawreplaced the former Monopolies and RestrictiveTrade Practices Act, which had required specialapproval for any large investment. Long-stand-ing problems in infrastructure are being tackled.Anticorruption efforts are also being scaled upat the national and state levels.
The effects have been substantial. Privateinvestment as a share of GDP grew from lessthan 9 percent in 1981 to more than 15 percentin 2000. Growth increased from an average of2.9 percent a year in the 1970s to 5.8 percent inthe 1980s, and to 6.7 percent in the mid-1990s.
More puzzling, however, has been theimpact on total factor productivity.The generalpattern is that many firms have increased their
productivity significantly but that the aggregatenumbers have been slow to respond. In manysectors the dispersion of productivity hasincreased, with the more advanced firms realiz-ing additional gains, and the least productivefirms falling behind.The expected patternwould have been to see greater competitivepressures reduce dispersion as less successfulfirms left the market.This highlights the signifi-cance of continuing barriers to exit. Accordingto the Bank’s Doing Business Project, it can take10 years to complete bankruptcy procedures inIndia. Firms may be taking advantage ofstronger incentives to invest, but there clearly isscope for further improvement.
Source: Aghion and others (2003); Ahluwalia (2002);De Long (2003); Rodrik and Subramanian (2004);Varshney (1998); and Panagariya (2003).
B O X 3 . 2 India’s path
05_WDR_Ch03.qxd 8/24/04 11:44 AM Page 58
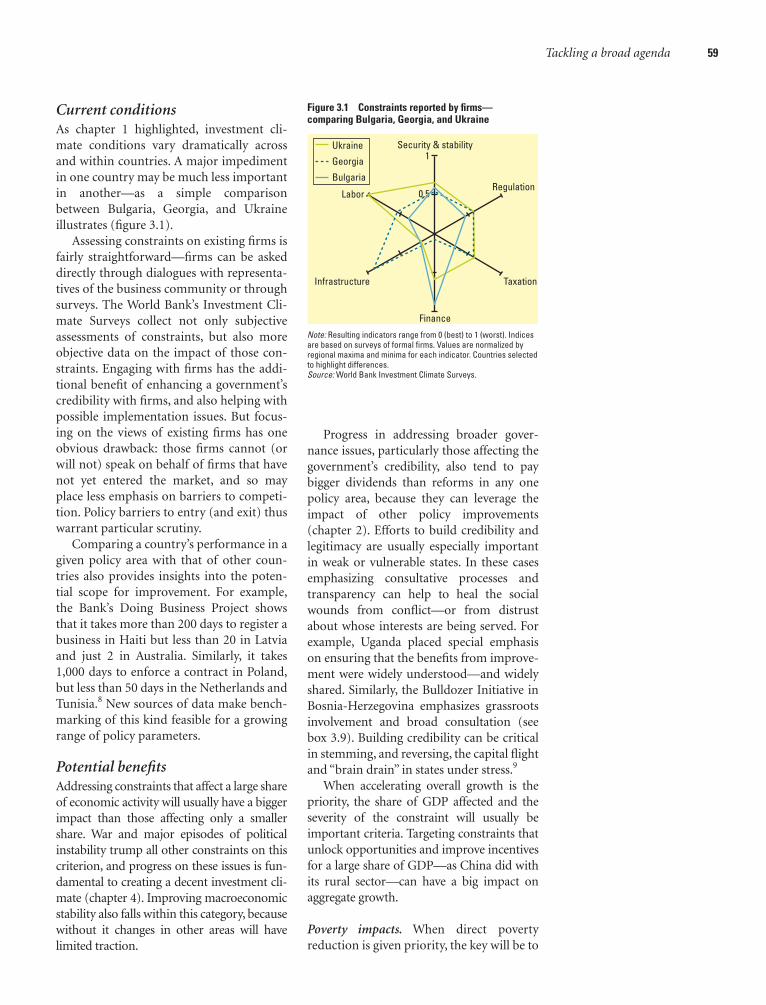
Tackling a broad agenda 59
Current conditionsAs chapter 1 highlighted, investment cli-mate conditions vary dramatically acrossand within countries. A major impedimentin one country may be much less importantin another—as a simple comparisonbetween Bulgaria, Georgia, and Ukraineillustrates (figure 3.1).
Assessing constraints on existing firms isfairly straightforward—firms can be askeddirectly through dialogues with representa-tives of the business community or throughsurveys. The World Bank’s Investment Cli-mate Surveys collect not only subjectiveassessments of constraints, but also moreobjective data on the impact of those con-straints. Engaging with firms has the addi-tional benefit of enhancing a government’scredibility with firms, and also helping withpossible implementation issues. But focus-ing on the views of existing firms has oneobvious drawback: those firms cannot (orwill not) speak on behalf of firms that havenot yet entered the market, and so mayplace less emphasis on barriers to competi-tion. Policy barriers to entry (and exit) thuswarrant particular scrutiny.
Comparing a country’s performance in agiven policy area with that of other coun-tries also provides insights into the poten-tial scope for improvement. For example,the Bank’s Doing Business Project showsthat it takes more than 200 days to register abusiness in Haiti but less than 20 in Latviaand just 2 in Australia. Similarly, it takes1,000 days to enforce a contract in Poland,but less than 50 days in the Netherlands andTunisia.8 New sources of data make bench-marking of this kind feasible for a growingrange of policy parameters.
Potential benefitsAddressing constraints that affect a large shareof economic activity will usually have a biggerimpact than those affecting only a smallershare. War and major episodes of politicalinstability trump all other constraints on thiscriterion, and progress on these issues is fun-damental to creating a decent investment cli-mate (chapter 4). Improving macroeconomicstability also falls within this category, becausewithout it changes in other areas will havelimited traction.
Figure 3.1 Constraints reported by firms—comparing Bulgaria, Georgia, and Ukraine
Finance
1
0.5
Taxation
Regulation
Security & stability
Labor
Infrastructure
Ukraine
Georgia
Bulgaria
Note: Resulting indicators range from 0 (best) to 1 (worst). Indicesare based on surveys of formal firms. Values are normalized byregional maxima and minima for each indicator. Countries selectedto highlight differences.Source: World Bank Investment Climate Surveys.
Progress in addressing broader gover-nance issues, particularly those affecting thegovernment’s credibility, also tend to paybigger dividends than reforms in any onepolicy area, because they can leverage theimpact of other policy improvements(chapter 2). Efforts to build credibility andlegitimacy are usually especially importantin weak or vulnerable states. In these casesemphasizing consultative processes andtransparency can help to heal the socialwounds from conflict—or from distrustabout whose interests are being served. Forexample, Uganda placed special emphasison ensuring that the benefits from improve-ment were widely understood—and widelyshared. Similarly, the Bulldozer Initiative inBosnia-Herzegovina emphasizes grassrootsinvolvement and broad consultation (seebox 3.9). Building credibility can be criticalin stemming, and reversing, the capital flightand “brain drain” in states under stress.9
When accelerating overall growth is thepriority, the share of GDP affected and theseverity of the constraint will usually beimportant criteria. Targeting constraints thatunlock opportunities and improve incentivesfor a large share of GDP—as China did withits rural sector—can have a big impact onaggregate growth.
Poverty impacts. When direct povertyreduction is given priority, the key will be to
05_WDR_Ch03.qxd 8/24/04 11:44 AM Page 59
60 WORLD DEVELOPMENT REPORT 2005
understand how potential investment cli-mate improvements impact the poorestmembers of society in their various capaci-ties: as employees, as entrepreneurs, as con-sumers, as users of public services, and asrecipients of tax-funded services or trans-fers (chapter 1). The breadth of theseimpacts means that there is no one best wayto make investment climate improvementsmore pro-poor. Certainly, poverty reduc-tion does not justify an exclusive focus onsmall or informal firms.
One approach is to focus on constraintsin locations where poor people live, whichcan benefit poor people in all their variouscapacities. Rural poverty is a major chal-lenge in many countries. Nonfarm employ-ment can contribute much to the incomesof the rural poor, and research in India sug-gests that manufacturing jobs contributetwice as much as agricultural productivityin raising nonfarm income. There can alsobe opportunities to focus improvements onurban or peri-urban areas with high con-centrations of poverty.
A second approach is to focus on con-straints to particular activities that benefitpoor people in their various capacities:
• Constraints facing microentrepreneurs.Hundreds of millions of poor people earntheir livings as microentrepeneurs in theinformal economy. Improving the invest-ment climate they face can involve improv-ing the security of their property rights,reducing red tape in business registration,and removing distortions that make accessto financing more difficult. Sometimes theimpact may not be fully anticipated: forexample, liberalizing telecommunicationsin Bangladesh and Uganda created oppor-tunities for microentrepreneurs to enterthe market, helping them and their broadercommunities.
• Constraints facing other firms likely to cre-ate jobs for poor people. Improvinginvestment climate conditions for firmslikely to hire poor people can do muchfor poverty reduction. This may meanfocusing on constraints faced by largerfirms, which create jobs directly and alsocreate more opportunities for suppliersof a range of goods and services.
• Constraints facing firms that can deliverother benefits to poor people. While self-employment and jobs have been identi-fied by poor people themselves as themost promising pathways out of poverty,investment climate improvements candeliver additional benefits to poor peo-ple. Improving conditions for firms thatproduce or distribute goods and servicesconsumed by poor people can have a bigimpact on their living standards. Improv-ing infrastructure in a particular locationcan also enhance living conditions forpoor people, whether or not they work orengage in entrepreneurial activities.Because larger firms are more likely topay taxes, improving their conditionsincreases the potential for them to con-tribute to social objectives.
Potential spillovers. When considering thepotential benefits from an improvement, itis also important to look at the possiblespillovers beyond the firms and activitiesmost directly affected. Six are worth high-lighting:
• Spillovers to other firms. Sometimes thebenefits of an improvement spill overfrom the firms that immediately benefitfrom the reform to others. For example,one of the attractions of increasing FDIis that technology and expertise mayspill over to local suppliers, customers,and competitors.
• Spillovers to other policy areas. Improve-ments in some policy areas can make apositive contribution to others. Forexample, increasing the security of rightsto land can help ease access to financing(chapter 4).
• Spillovers to government credibility. Theway governments approach policyimprovements can help—or harm—their credibility and resulting investorconfidence. Efforts to engage firms andother stakeholders openly and transpar-ently, with timely execution of reforms,can enhance firms’ confidence and soelicit a stronger investment response.The corollary is that overly ambitious orpoorly executed reforms can underminecredibility and confidence.
05_WDR_Ch03.qxd 8/24/04 11:44 AM Page 60

Tackling a broad agenda 61
• Spillovers to government capabilities. Someinvestment climate improvements canstrengthen a government’s fiscal position—and so facilitate other improvements. Forexample, Uganda gave early priority to bet-ter revenue collection, nearly doubling theratio of tax revenue to GDP between 1991and 1996. Privatizing state-owned enter-prises can sometimes play a similar role.
• Spillovers to broader social goals. Manyfeatures of a good investment climatedeliver benefits that extend beyondfirms. For example, more effective courtscan help defend civil and political rights,not just property rights (chapter 4). Bet-ter infrastructure and financial systemshelp all members of the community,whether engaged in entrepreneurialactivities or not (chapter 6).
• Spillovers to constituency building. Thechoice of initial priorities can also influ-ence the feasibility of later improvements.For example, reducing barriers to newbusiness formation can increase the poolof firms with an interest in broad-basedpolicy improvements. Similarly, ensuringthat improvements extend to firms acrosssociety—rather than just to large or con-nected firms—can contribute to the pub-lic support necessary to sustain progress.
Priority-setting may also be influencedby broader strategic considerations. Forexample, barriers to entry may be easier toaddress than labor market distortions—andmay facilitate subsequent labor marketreforms by reducing the rents available forthe participants to contest.10
Some improvements—such as reducingbarriers to entry—can deliver fairly quickresults. Others require a longer process ofinstitutional development to deliver theirfull potential—such as reforms to courtsand the development of new regulatoryagencies. They promise large benefits butrequire patience and persistence. Of course,the sooner the longer-term projects begin,the sooner the benefits arrive.
Link with national or regional goalsCreating an investment climate that allowsfirms of all types to grow and contribute topoverty reduction has many advantages. It
avoids the difficulty of governments tryingto “pick winners” where the track record hasbeen discouraging (chapter 8). It createsopportunities for unforeseen success storiesto emerge. It reduces concerns about rent-seeking. And ensuring that opportunitiesfor growth are shared widely in societyhelps build social cohesion and support forongoing policy improvements.
Investment climate improvements canaffect firms and activities differently.Because of this, priority-setting may beinfluenced by the weight governments placeon a subset of the goals a good investmentclimate can deliver:
• Integrating firms in the informal andrural economies
• Unleashing the growth potential ofsmaller firms
• Taking advantage of opportunities frominternational openness
• Allowing firms to climb the technologyladder.
What are the implications for priority-setting?
Integrating firms in the informal economy.Most developing countries have a dualstructure, with a modern economy operat-ing alongside a more traditional economywith high levels of informality. Estimatessuggest that more than half the economy isinformal in many developing countries (fig-ure 1.17)—and that informality is grow-ing.11 There are also degrees of informality.One criterion is whether firms are registeredwith the government, another is compliancewith regulations and taxes. What is strikingis how few firms are completely “formal” bythe second definition (figure 3.2).
The informal economy is diverse, rang-ing from subsistence farmers and thoseengaging in entrepreneurship out of neces-sity,12 to more affluent firms that find it fea-sible to evade tax and regulatory obliga-tions, and others in the middle. A large poolof individual workers also exists in theinformal economy, sometimes working forformal firms “off the books,” sometimesworking for enterprises that are themselvesinformal. Women are disproportionatelyconcentrated among the smallest of theinformal microenterprises (figure 3.3).13
05_WDR_Ch03.qxd 8/24/04 11:44 AM Page 61

62 WORLD DEVELOPMENT REPORT 2005
Governments have an interest inexpanding the net of the formal economy tobroaden the tax base, extend the reach ofregulations intended to meet importantsocial objectives, and remove distortions incompetition between firms in the formaland informal economies. They also have aninterest in reducing obstacles to growthfaced by firms, and in expanding income-earning opportunities for those on the low-est rung of the economic ladder. Getting thebalance right can be difficult. Simplyenforcing existing regulations and taxesmore strenuously may drive those on the
lowest rung of the ladder out of businessand so exacerbate poverty. Recent work inEgypt suggests that society as a whole canbe worse off if this were to happen, but bebetter off if formalization were encouragedin an environment with reformed regula-tions.14 Experience in Vietnam and Ugandashows that reducing unjustified regulatoryburdens, including the costs of going for-mal, can do much to encourage formality(chapter 5).
Beyond encouraging formality, govern-ments can focus on addressing constraintsfaced by microentrepreneurs in the infor-mal economy. The constraints they per-ceive can differ from those of formalfirms.15 Informal firms can evade manyregulatory and tax obligations, but faceother obstacles, including less secure prop-erty rights and greater difficulty obtainingaccess to finance and public services. Entre-preneurs who do not have a fixed place ofbusiness, such as street vendors, are partic-ularly vulnerable.16 While constraints needto be assessed in each context, surveysundertaken for this Report show that pri-ority areas will often include strengtheningproperty rights, such as clarifying rights toland (chapter 4);17 reforming regulationsor taxes that encourage informality or con-tribute to harassment and corruption(chapter 5); and improving access to credit,including though microfinance schemes(chapter 6). Reforming labor market regu-lations can also encourage greater formal-ity in employment relationships, and soextend the coverage of important protec-tions for workers (chapter 7).
Integrating firms in the rural economy.Many firms operating in rural areas alsotend to be part of the informal economy,but rural location can be a separate sourceof disconnection from the modern econ-omy. Seventy percent of people in low-income countries live in rural areas, andimproving their opportunities can make adirect contribution to reducing poverty.
Increasing the productivity of agricul-ture expands opportunities in rural areas—not least because it increases the demandfor local services and provides an importantmeans of diversifying risks.18 Improving
0
25
50
Shar
e of
wor
kers
who
are
wom
en
75
Pakistan TanzaniaGuatemalaCambodiaBrazilBangladesh
Unregistered, 1–4 workersUnregistered, 5+ workersRegistered
Source: World Bank Investment Climate Surveys and WDR Surveys of Micro and InformalFirms.
Figure 3.3 Women’s participation is concentrated in the informalsector, among the smallest firms
0
25
50
Perc
ent o
f sal
es re
porte
d to
tax
auth
oriti
es
75
100
Indonesia TanzaniaGuatemalaCambodiaBrazilBangladesh
Unregistered, 1–4 workersUnregistered, 5+ workers
Registered, <50 workersRegistered, 50–199 workersRegistered, 200+ workers
Source: World Bank Investment Climate Surveys and WDR Surveys of Micro and Informal Firms.
Figure 3.2 Informality is a matter of degree
05_WDR_Ch03.qxd 8/24/04 11:44 AM Page 62
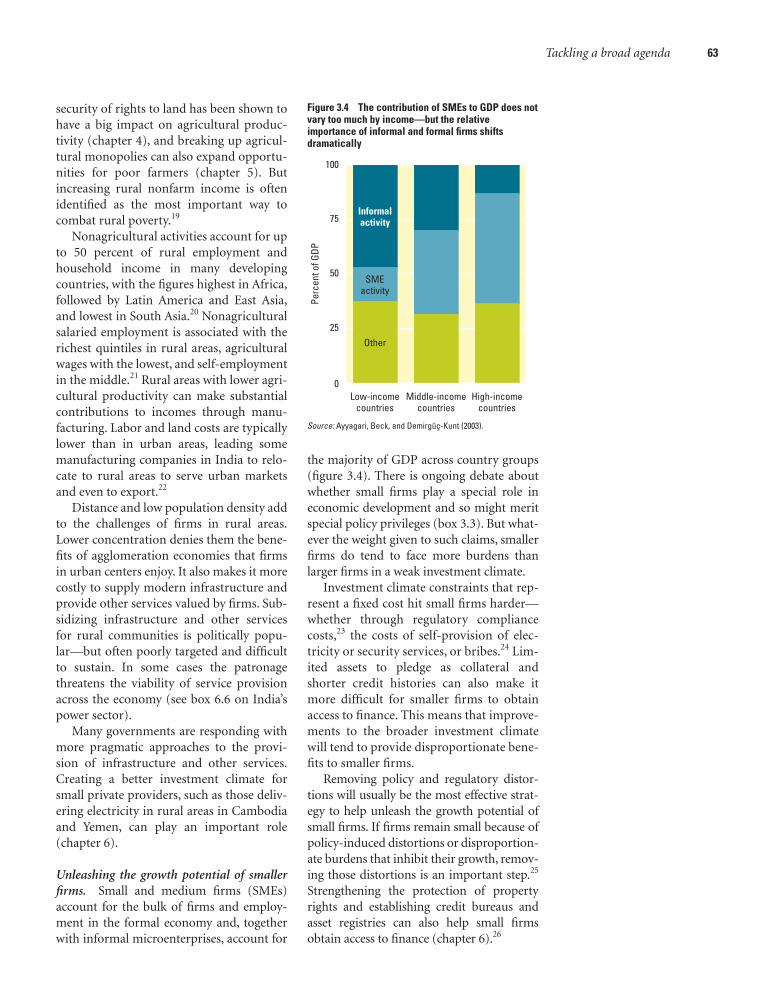
Tackling a broad agenda 63
security of rights to land has been shown tohave a big impact on agricultural produc-tivity (chapter 4), and breaking up agricul-tural monopolies can also expand opportu-nities for poor farmers (chapter 5). Butincreasing rural nonfarm income is oftenidentified as the most important way tocombat rural poverty.19
Nonagricultural activities account for upto 50 percent of rural employment andhousehold income in many developingcountries, with the figures highest in Africa,followed by Latin America and East Asia,and lowest in South Asia.20 Nonagriculturalsalaried employment is associated with therichest quintiles in rural areas, agriculturalwages with the lowest, and self-employmentin the middle.21 Rural areas with lower agri-cultural productivity can make substantialcontributions to incomes through manu-facturing. Labor and land costs are typicallylower than in urban areas, leading somemanufacturing companies in India to relo-cate to rural areas to serve urban marketsand even to export.22
Distance and low population density addto the challenges of firms in rural areas.Lower concentration denies them the bene-fits of agglomeration economies that firmsin urban centers enjoy. It also makes it morecostly to supply modern infrastructure andprovide other services valued by firms. Sub-sidizing infrastructure and other servicesfor rural communities is politically popu-lar—but often poorly targeted and difficultto sustain. In some cases the patronagethreatens the viability of service provisionacross the economy (see box 6.6 on India’spower sector).
Many governments are responding withmore pragmatic approaches to the provi-sion of infrastructure and other services.Creating a better investment climate forsmall private providers, such as those deliv-ering electricity in rural areas in Cambodiaand Yemen, can play an important role(chapter 6).
Unleashing the growth potential of smallerfirms. Small and medium firms (SMEs)account for the bulk of firms and employ-ment in the formal economy and, togetherwith informal microenterprises, account for
the majority of GDP across country groups(figure 3.4). There is ongoing debate aboutwhether small firms play a special role ineconomic development and so might meritspecial policy privileges (box 3.3). But what-ever the weight given to such claims, smallerfirms do tend to face more burdens thanlarger firms in a weak investment climate.
Investment climate constraints that rep-resent a fixed cost hit small firms harder—whether through regulatory compliancecosts,23 the costs of self-provision of elec-tricity or security services, or bribes.24 Lim-ited assets to pledge as collateral andshorter credit histories can also make itmore difficult for smaller firms to obtainaccess to finance. This means that improve-ments to the broader investment climatewill tend to provide disproportionate bene-fits to smaller firms.
Removing policy and regulatory distor-tions will usually be the most effective strat-egy to help unleash the growth potential ofsmall firms. If firms remain small because ofpolicy-induced distortions or disproportion-ate burdens that inhibit their growth, remov-ing those distortions is an important step.25
Strengthening the protection of propertyrights and establishing credit bureaus andasset registries can also help small firmsobtain access to finance (chapter 6).26
0
50
25
75
100
Perc
ent o
f GDP
High-incomecountries
Middle-incomecountries
Low-incomecountries
Informalactivity
Other
SMEactivity
Source: Ayyagari, Beck, and Demirgüç-Kunt (2003).
Figure 3.4 The contribution of SMEs to GDP does notvary too much by income—but the relative importance of informal and formal firms shifts dramatically
05_WDR_Ch03.qxd 8/24/04 11:44 AM Page 63

64 WORLD DEVELOPMENT REPORT 2005
economies of scale. The higher productivityof successful exporters (box 3.5) can alsoresult in spillovers to other firms in the localeconomy. Exporting firms can contribute toraising other firms’ productivity throughdemonstration effects, labor turnover, andconnections to overseas markets: firms inMexico in locations where multinationalfirms exports are higher are more likely toexport themselves.28 Removing regulatoryand other policy-related barriers to export-ing is usually a top priority.29
What then, about imports? Reducingbarriers to imported goods can be beneficialin three ways:
• Reducing the cost of imported inputs. Pricemarkups are lower in countries whereforeign competition is greater, however
Microenterprises in the informal economy oftenreceive particular attention due to their role inpoverty reduction. Small firms in the formal econ-omy are also often targeted for special policytreatment in the belief that they play an especiallypowerful role in economic development, butthese claims are difficult to substantiate.
Some believe that SMEs warrant specialattention because of their high rate of job cre-ation.True, SMEs as a group typically create morejobs than larger firms. But they also tend to shedmore workers, with a higher rate of “churn,”sodo not necessarily lead to greater net jobcreation. Large firms (more than 100 employees)were estimated to account for a greater share ofnet job creation in Ghana (56 percent), Kenya (74percent), and Zimbabwe (76 percent) in the early1990s than small firms in the formal economydid. SMEs might, however, play a larger role inproviding opportunities for low-skilled workers.
Some believe that SMEs are particularlyinnovative—adopting, designing, and produc-ing new technologies and new approaches to
production.They do tend to be nimbler thanlarge firms in responding to niche opportunitiesand changing market conditions. But whilethere are many anecdotes about small firms pio-neering particular technologies or ideas, firmsthat fit that profile seem to be the exceptionrather than the rule. Indeed, most R&D in devel-oping countries is undertaken by larger firms(see table). SMEs also appear less likely toengage in activities that promote technologytransfers. For example, small firms in Brazil, Cam-bodia, and Pakistan are less likely than largerfirms to license technologies from abroad andless likely to have technical assistance contracts.Studies in Colombia, Indonesia, Malaysia, Mex-ico, and Zimbabwe show that small firms areless likely to have formal training programs.Small firms in developing countries are also lesslikely to export than larger firms.
Others believe that expanding opportunitiesfor SMEs can play a special role in helping tobroaden public support for markets and inexpanding domestic competition.These claims are
plausible,but imply that policy responses shouldaim to remove barriers facing all firms in the econ-omy,rather than targeting a particular group forspecial treatment based solely on size.
Recent macroeconomic evidence also castsdoubt on the claim that SMEs are especially impor-tant for growth and poverty reduction.A cross-country study looking at the correlation betweeneconomic growth and SMEs’share of total employ-ment found that although the SME sector is largerin countries where growth is faster, the size of theSME sector did not appear to cause faster growth.The study also found no correlation betweenpoverty reduction and SME development.Oneinterpretation is that policies that successfully pro-mote growth—such as those to improve theinvestment climate—also promote SME develop-ment,but that policies that target SME develop-ment do not necessarily result in faster growth.
Source: Biggs, Ramachandran, and Shah (1998);Biggs (2003); Acs and Audretsch (1987); Biggs, Shah,and Srivastava (1995); Batra and Tan (1995); andBeck, Demirgüç-Kunt, and Levine (2003).
B O X 3 . 3 Do small firms play a special role in economic growth?
Small Medium Large Very Large(< 20) (20–49) (50–249) (250 and up)
R&D expenditures (% of sales) 0.9 1.4 1.5 1.4Any R&D expenditures (% of firms) 6.7 13.6 20.4 24.9Formal training program (% of firms) 27.2 41.6 56.7 63.4Exports (% of sales) 5.7 10.1 21.0 34.0Any exports (% of firms) 12.6 20.9 39.6 56.8Uses e-mail to communicate with suppliers and customers
(% of firms) 36.0 46.9 55.4 58.9
Source: World Bank Investment Climate Surveys.
Taking advantage of international open-ness. Few countries have grown withoutbeing open to trade.27 Expanding marketsand lowering barriers to new productsand ideas creates opportunities for devel-oping countries to grow faster and catchup with richer countries. More developingcountries are taking advantage of oppor-tunities to connect to the internationaleconomy. Their exports increased from 12percent of global GDP in 1970 to 29 per-cent in 2001, and FDI to developing coun-tries increased from 0.1 percent of globalGDP in 1970 to 3 percent in 2001 (figure3.5). While all economies can benefit,international integration is crucial forsmaller states (box 3.4).
Exporting expands access to foreignexchange and allows firms to exploit
05_WDR_Ch03.qxd 8/24/04 11:44 AM Page 64

Tackling a broad agenda 65
competition is measured (by importpenetration, effective protection rates, orlicense coverage rates).30 The costs thatimport restrictions impose on firms andconsumers relying on inputs from theprotected sector usually far outweigh thebenefits to the protected firms.31
• Facilitating the diffusion of knowledge andmodern technology. Imported machineryis an important source for new technolo-gies. Productivity growth is faster indeveloping countries that import morecapital goods from developed economies.One study estimates that if developingcountries expanded their trade by 5 per-cent of GDP, their output would be about6.5 percent greater in the long term.32
01970 1975 1980 1985 1990 1995 2000
20
10
30
Expo
rts a
s a
shar
e of
GDP
(per
cent
)
FDI a
s a
shar
e of
GDP
(per
cent
)
40
0
1
2
4
3
5FDI: Low- and middle-income countriesFDI: High-income countriesExports: Low- and middle-income countriesExports: High-income countries
Note: Gross exports are of goods and services; FDI refers to net inflows in reporting economy.Source: World Bank (2004b).
Figure 3.5 Gross exports and FDI in developing economies jumped in the 1990s
Forty-five developing countries have fewer than1.5 million people each.Their small localmarkets and small pools of workers limit domes-tic competition and the diversity of economicactivities. For them, greater integration withinternational markets is crucial. It involves pro-viding adequate infrastructure to facilitate tradeand fostering regional cooperation.
Regional integration enables firms toachieve economies of scale by expanding mar-ket size. It can reduce transaction costs andinvestment risk, also encouraging more invest-ment. Increased opportunities for competitionalso strengthen incentives for firms to innovateand improve their productivity.Where regionalintegration involves a common currency orcommon regulatory frameworks and agencies,there can be big reductions in the transactionand administrative costs for firms. Regional inte-
gration can also reduce the cost of telecommu-nications and energy infrastructure.
In the Caribbean two main organizationsdeal with economic integration. The CaribbeanCommunity (CARICOM), with 15 members anda total population of 15 million people, is dis-cussing a single market and economy to allowthe free movement of goods, capital, and peo-ple. The Organization of Eastern CaribbeanStates, a smaller organization with nine mem-ber states and 500,000 inhabitants, has alreadyestablished a common central bank, a commoncurrency, and a common regulator for telecom-munications. It is working on an economicunion.
The South Pacific Forum, a 16-member orga-nization (including Australia and New Zealand),has adopted investment principles along thelines of those drawn up for the Asia Pacific Eco-
nomic Cooperation countries. Concerned aboutthe high costs of transportation in the region,the Forum’s main priority is shipping.
Among the many African regional integra-tion initiatives, the Southern African Develop-ment Community (SADC) is one of the moresuccessful. It has enabled greater FDI from themore developed countries (South Africa andMauritius) to the less developed countries, giv-ing a new dynamism to the region. French-speaking countries in West Africa have created acommon central bank and have an active pro-gram for harmonizing business regulation (seebox 9.5 on OHADA).
Source: Commonwealth Secretariat and World BankJoint Task Force on Small States (2004), Brautigamand Woolcock (2001), Commonwealth Secretariat(2003), Harsch (2002), and Fairbairn and DeLisle(1996).
B O X 3 . 4 International integration is especially important for small states
Economists suggest two possible explanations forexporters’higher productivity. One is that export-ing directly improves the productivity of the firmsdoing it (the learning-by-exporting hypothesis).The discipline of competing in international mar-kets encourages firms to improve their productiv-ity or exposes them to foreign technologies andmodes of production. In addition, exportingallows firms to achieve greater economies of scaleby expanding their potential market.
The second explanation is that because firmshave to be efficient to compete in internationalmarkets,only firms that are already efficient canexport (the self-selectivity hypothesis).Althoughinefficient firms might prosper in domestic mar-
kets when protected from international competi-tion by natural barriers (high transportation costs)and policy barriers to trade (tariffs and quotas),they are unable to survive in international markets.Thus,only efficient firms end up exporting.
The two hypotheses are not mutually exclu-sive. Even if efficient firms are more likely to startexporting, this does not rule out the possibilitythat exporting will help them increase their pro-ductivity further.
The evidence supports both hypotheses tosome degree. Several econometric studies havefound that productivity improvements precedeexporting, providing support for the self-selec-tivity hypothesis. But case studies often support
the learning-by-exporting hypothesis. Studies ofexporters in South Korea and Taiwan, China,found that export buyers were an importantsource for new technologies, which theyprovided in forms including blueprints, informa-tion about manufacturing processes and qualitycontrol methods, technical advice and on-siteplant inspections, and training for technical andproduction staff. Some econometric studies alsosupport the learning-by-exporting hypothesis.
Source: Aw, Chung, and Roberts (2000); Bernard andJensen (1999); Clerides, Lach, and Tybout (1998);Hallward-Driemeier, Iarossi, and Sokoloff (2002);Kraay (1999); Liu,Tsou, and Hammitt (1999); andWestphal (2002).
B O X 3 . 5 Exporting and productivity—what is the link?
05_WDR_Ch03.qxd 8/24/04 11:44 AM Page 65
66 WORLD DEVELOPMENT REPORT 2005
India began reducing trade restrictions in themid-1980s—eliminating quantitativerestrictions on imports of industrial machineryand reducing tariffs on capital goods by 60 per-cent. But its trade policies remained quiterestrictive at the beginning of the 1990s. In 1991the average tariff rate was about 83 percent, andonly 13 percent of goods were importable with-out a license. By 1998 average tariffs had beenreduced to 30 percent, and the range of goodsimportable without any restrictions wasincreased to 57 percent.
Firm and industry studies that compare per-formance in the 1980s with that in the 1990sfind that productivity increased for firmsexposed to competition from imports.The effectwas large.Topalova found that a 10 percentdecrease in tariffs resulted in a 0.5 percent
increase in total factor productivity. Firms thatwere most efficient appear to have improvedtheir performance the most. Another studyfound that investment and productivityimproved in industries close to the technologi-cal frontier, but failed to improve in less techno-logically advanced industries.
Few firms closed down following trade liber-alization.This might suggest that most firmsmanaged to cope with the additional competi-tive pressure, but it might also be because exitwas very difficult for firms in India at that time.Although recent government reforms shouldspeed up bankruptcy procedures, in 2003 theytook longer in India (11 years) than in any othercountry with comparable data.
Looking at a specific industry brings out thelessons clearly. From the 1950s until the early
1990s the Indian machine tool industry was pro-tected by tariffs of up to 100 percent and byother restrictions.When tariffs were reduced toaround 15 percent in 1992, local firms foundthemselves unable to compete with more effi-cient foreign producers. After several difficultyears, some of the local firms adapted to foreigncompetition by boosting their productivity. Butthe firm that led the recovery was not one of thefirms that had enjoyed protection for 40 years—it was a fairly new producer, Ace Designers, thatstarted operating only two years before the tar-iffs were reduced.
Source: Aghion and others (2003); De Long (2003);Rodrik and Subramanian (2004); Sutton (2002);Topalova (2003); and World Bank (2004k).
B O X 3 . 6 Trade liberalization in India—recent evidence
• Strengthening incentives for local firms toinnovate and improve their productivity.Firm-level studies find that trade liberal-ization improves productivity amongfirms competing with imports.33 Episodesof trade liberalization in Brazil between1990 and 1995, Chile in the 1970s and1980s, India in the early 1990s, andColombia between 1977 and 1991, were allassociated with higher firm productivity inimport-competing sectors.34 The effect ofliberalization can be large (box 3.6). InColombia a 10 percent decline in tariffswas associated with as much as a 3 percentincrease in productivity in firms.35 Theproductivity gains reflect within-plantgains and the exit of inefficient firms.36
Foreign investment can also do much forproductivity—by providing access to newinvestment capital, new technologies, man-agement expertise, and export markets. Thepositive impact of foreign participation onproductivity is demonstrated by studies fromChina, the República Bolivariana deVenezuela, and transition Europe.37 There canalso be productivity spillovers to local suppli-ers and customers. Foreign multinationalsoften help local suppliers by providing themwith new technologies and advice on how toimprove quality and productivity so that theycan meet international standards. Studies inIndonesia and Latvia found that foreign entryin downstream industries boosts the produc-tivity of local suppliers upstream.38
Foreign firms also put competitive pres-sure on local firms. This can benefit firmsand other consumers that depend on inputsfrom the industry gaining FDI. In principlethe rival firms might also benefit from tech-nological spillovers as well as sharper incen-tives to innovate and improve their produc-tivity. However, the evidence of horizontalspillovers from FDI (to firms that competewith the foreign-owned firm) is moremixed than evidence for vertical spillovers(to firms that supply or use inputs pro-duced by the foreign firm).39
Trade and foreign investment are oftenfacilitated by informal contacts through emi-grants and diaspora (box 3.7). But the bene-fits from international openness provide astrong rationale for giving priority to easingrelevant policy constraints. The agendaincludes improving customs administration,liberalizing trade and foreign investmentregimes (chapter 5), and improving trans-port infrastructure (chapter 6). Adoption ofinternational rules and standards can alsohelp improve the environment for interna-tional transactions (chapter 9).
Climbing the technology ladder. Techno-logical progress is important for economicgrowth. That does not mean every countryhas to invent everything afresh—or that alltechnological improvements have to becutting edge, pushing out the technologicalfrontier. For most countries adopting andadapting available technologies is more fea-
05_WDR_Ch03.qxd 8/24/04 11:44 AM Page 66

Tackling a broad agenda 67
sible and can still improve productivity.The Bank’s Investment Climate Surveysconfirm the important role of competitivediscipline in encouraging firms to innovate(chapter 1).
For firms a long way from the technolog-ical frontier, the most cost-effective strategyfor technological upgrading is to tap tech-nologies developed elsewhere, throughtrade and licensing.40 Several studies high-light the impact of machinery and equip-ment imports on productivity in develop-ing countries.41 Consistent with this, 33percent of firms in low-income countriesand 49 percent of firms in middle-incomecountries reported that knowledge embed-ded in new machinery was their mostimportant source for technological innova-tion (figure 3.6).42
Another way to climb the technologyladder is to encourage local R&D. Firms indeveloping countries perform only about26 percent of the R&D (as a share of GDP)of those in developed economies (table3.1). This difference can be understood inpart because high-income countries tendto have better intellectual property protec-tion, deeper credit markets, higher-qualityresearch institutions, and more govern-ment capacity to mobilize public R&Dexpenditures.43 Low skill levels can alsohinder moves to more technology-inten-sive industries (chapter 7).44
Implementation constraintsThe priority-setting process is also influ-enced by implementation constraints—both administrative and political (box 3.8).Strategies for strengthening governmentcapabilities to relieve administrative con-
Emigrants, or diaspora, have been an importantsource of investment and contacts for exportmarkets throughout history, with networks eas-ing some investment climate constraints andbuilding bridges between local and foreign firms.
Overseas Chinese contributed 70 percent ofChina’s FDI over the past 15 years. By 1995, 59 per-cent of the accumulated FDI in China came fromHong Kong, China, and Macao, with a further 9percent from Taiwan, China. Korean Americanswere the bridgeheads for the successful penetra-tion into the U.S. market by Korean car, electronics,
and white goods manufacturers. In Canada a dou-bling of skilled immigrants from Asia was accom-panied by a 74 percent increase in Asian imports.
In the mid-1990s, when India started to openits economy, it began to attract its 20 millioncompatriots living abroad.The Indian diaspora,second only to China’s, contributed 9 percent, or$4 billion, to the country’s FDI in 2002. Membersof IndUS Entrepreneur, a networking group ofIndian information technology entrepreneursand professionals, are funneling funds into star-tups in India as well as hybrid companies that
operate in both India and the United States.Thishas boosted the confidence of overseasinvestors in India’s potential. Several overseasIndians who had reached high managementpositions in western multinationals helped toconvince their firms to set up operations in India,with Hewlett-Packard a prime example.
Source: Biers and Dhume (2000);The Economist(2003c);The Economist (2001); Head and Reis (1998);Gillespie and others (1999); Kapur (2001); Li, Li, andZhang (1999); and Rauch and Trindade (2002).
B O X 3 . 7 Foreign locals—the role of emigrants and diaspora
60Share of firms
40200
Licensing
Other
Universities andpublic institutions
Low-income Middle-income
Developed oradapted internally
Developed or adaptedwith clients/suppliers
Purchasing machinery
Hiring keypersonnel
Note: “Other” includes transfers from parent companies, trade fairs, study tours, consultants, and busi-ness associations.Source: World Bank Investment Climate Surveys.
Figure 3.6 Gaining access to technological innovations—key sources
Table 3.1 Who innovates?
High-income Developing countries countries
Patents granted by the U.S. Patent and Trademark Office a 0.35 0
Patents granted by the European Patent Office a 0.15 0
R&D personnel a 16.16 3.87
R&D expenditure b 1.58 0.41
R&D financed by the productive sector b 0.74 0.13
R&D financed from abroad b 0.04 0.01
R&D performed by the productive sector b 0.96 0.25
R&D performed by higher education b 0.34 0.12
R&D performed by the public sector b 0.28 0.22
a. Per 10,000 inhabitants.b. As a percent of GDP.Source: Lederman and Saenz (2003).
straints are discussed later in this chapter.Political constraints often require both ahigh level of commitment as well as effec-tive strategies for managing change.
05_WDR_Ch03.qxd 8/24/04 11:44 AM Page 67

68 WORLD DEVELOPMENT REPORT 2005
Managing individual reformsLand titling obviously differs from trade lib-eralization, and improving the courts differsfrom labor market reform. But a commonissue across most areas of investment cli-mate reform is the need to deal with resis-tance from those who have incentives tomaintain the status quo. Resistance maycome from firms or other interest groupsthat benefit from market restrictions orother special privileges. It may come fromofficials who benefit from informal pay-ments or other perquisites of office. Even thebroader community may have a bias towardthe status quo when the implications ofchange are not certain,45 or where there areother concerns about the reform process.
Overcoming this resistance is a key partof any strategy to broaden and accelerateinvestment climate improvements. Whathas been learned about the catalysts for
change? And how might such changes besuccessfully managed?
Catalyzing changeChange tends to occur when somethingshifts the incentives for maintaining the sta-tus quo. International experience illustrateshow a diverse range of factors can triggerpolicy change even in the face of resistanceby beneficiaries of the status quo. Thosetriggers can include external shocks andcrises, technological change, new opportu-nities, new information and institutionalcompetition, political change, and the ini-tiative of policy entrepreneurs.
External shocks and crises. External shocks orcrises can weaken the bargaining position ofthose who would normally oppose reform.46
They can also create opportunities forreformers to exploit rapidly changing eco-nomic or social conditions to justify or legit-imize reform. In Korea reducing cross-subsi-dies among chaebol subsidiaries, triedthroughout the early 1990s without success,was implemented only after the 1997–98financial crisis.47 In Slovakia a deterioratingfiscal situation combined with high unem-ployment led the government to pass a host ofreforms in 2002, including collateral, tax, andlabor reforms. Crises in a single sector can alsoprompt policy change. Power brownouts inthe Philippines in the 1980s led to efforts toengage the private sector in power delivery. Inthe U.S. coal industry, labor restrictions werereformed only when movements in oil pricesput the future of mines in question.48 Butcrises do not always have this effect, andindeed the heightened social tensions associ-ated with large-scale crises can overwhelmpolicymakers.
Technological change. Technological changecan threaten the interests of those commit-ted to current technologies and provokefierce resistance. Recall the Luddites in early19th century England who rioted againsttechnological progress in the textile indus-try. But technological progress can also alterthe costs and benefits of policymakers main-taining current policies. For example,advances in telecommunications technologycreated new opportunities for introducing
Proposed improvements to investment cli-mate policies must meet three tests. Clearly,the proposed reform should be desirable, inthe sense that it improves public welfare. Itshould be administratively feasible, in thesense that the government has the financialresources and technical expertise to imple-ment the reform. And it must be politicallyfeasible, in the sense that the government isable to secure sufficient support toovercome resistance from those who preferthe status quo.
At any point the menu of possible pol-icy options that meet all three tests is lim-ited—as shown in zone A in the figure.Options in zone D are technically andpolitically feasible but not desirable—
market restrictions or distortions of vari-ous kinds provide examples. Options inzones B or C would be sound policy butare not feasible in the short run, so reformefforts in these areas would either beunsuccessful or, if implemented, wouldlack credibility.
Over time the goal is to expand the“sweet spot” by increasing the congruenceof the three elements.The sphere of desir-able policies can be expanded through pol-icy innovation and learning. Administrativefeasibility can be enhanced by mobilizingresources and expertise. Political feasibilitycan be enhanced by effective change man-agement, including strategies for buildingpublic support.
B O X 3 . 8 Expanding the zone of feasible and desirablepolicy improvements
Policydesirability
Administrativefeasibility
Politicalfeasibility
B CA
D
Policydesirability
Administrativefeasibility
Politicalfeasibility
B C
A
D
Source: Adapted from Lax and Sebenius (1986).
05_WDR_Ch03.qxd 8/24/04 11:44 AM Page 68

Tackling a broad agenda 69
competition, increased the costs of inertiafor those beholden to national monopolies,and so sparked a wave of telecommunica-tions reforms around the world in the 1990s.
New opportunities. New opportunities, suchas access to new markets, can catalyze change.For example, the lure of EU accession alteredthe reform agendas of governments in Easternand Central Europe,49 and joining NAFTA didthe same for Mexico. The prospect of joiningthe WTO also had wide-ranging effects on thereform agenda in China.
New information and institutional competi-tion. New information can shake assump-tions about the desirability of the status quoand highlight the costs of inertia. Informa-tion that benchmarks a jurisdiction’s perfor-mance against other jurisdictions in terms ofcosts, productivity, or other measures canspur change through its impact on localprestige and concerns about future livingstandards. Success from policy reforms inneighboring jurisdictions can also have tan-gible effects. In China competition amongprovinces for investment is spurring changesacross a range of policy areas,50 and similareffects are evident in India.
Political change. Marked shifts in policyapproaches can occur on a grand scale—aswith the collapse of central planning in theformer Eastern bloc. They may also reflect achanging social consensus, as when theemergence of the merchant class in Englanddrove the protection of property rights.51 Agrowing middle class can also create a con-stituency against confiscatory, populist poli-cies.52 Political transitions and changes ofleadership also provide reformers with afresh mandate and an interest in differentiat-ing their policies from those of their prede-cessors. In Colombia, a second round oflabor reforms, after having been defeated in2000, was implemented in 2002 under a newgovernment acting quickly to take advantageof political support.
Policy entrepreneurs. Individuals identifyingand promoting policy changes are oftenfound within government—and in placesthat have the ear of the government or the
public.53 In Peru the effort to reform landtitles can be traced in part to the Institute forLiberty and Democracy’s persuading the gov-ernment and the wider community of thevalue of reform. Civil society groups are alsoplaying an active role in promoting improve-ments in investment climate policies andbehaviors. For example, Consumers Interna-tional and its national chapters champion thebenefits of greater competition, and Trans-parency International has emerged as aninfluential champion for greater trans-parency in government-firm dealings.54
The level of resistance to any reform willbe influenced by what the beneficiaries ofthe status quo have at stake, and by theiralternatives. Firms benefiting from clien-telistic relationships with governments,ineffective regulation, market restrictions,or other privileges that weaken the broaderinvestment climate might be expected tofiercely resist change. But this is not alwaysthe case. Concerns about corporate reputa-tions, about the long-term future of theirbusinesses, or about the implications ofmore drastic government action can leadfirms to take a more enlightened view oftheir self-interest. This is evident in movesby firms to burnish their reputationsthrough corporate philanthropy, corporatesocial responsibility initiatives, and forms ofself-regulation. Similar considerations canlead firms to moderate their resistance toreform and even to cooperate with reform-ers to develop workable solutions.
Communicating to build supportCommunicating the costs and benefits ofalternative policy approaches is a centralfeature of successful reforms across mostareas of the investment climate. Indeed, astudy of senior officials and civil societyrepresentatives from 60 developing andtransition economies cited the public’s poorunderstanding of economic reform as a keyobstacle to success.55
Gathering and disseminating informationthat benchmarks a country’s performance orthat analyzes the costs and benefits ofreform—including the costs of not reform-ing—can build public awareness and under-standing of reform. It can also help mobilize abroader range of support, including citizens,
05_WDR_Ch03.qxd 8/24/04 11:44 AM Page 69
Buro de Crédito undertook a campaign toincrease consumer awareness by placing theregulatory framework on their Web sitesand listing the rights of consumers in a sim-ple and accessible way. As part of its judicialreforms, Georgia launched a comprehen-sive communication effort to educate thepublic about newly acquired rights, increasetrust in the system, and help users navigatethe courts.56
Engaging stakeholdersEarly consultation with key stakeholders,including potential winners and losers, onproposed changes can help validate assump-tions behind the proposed improvement. Itcan garner suggestions on how proposalsmight be fine-tuned to lead to better out-comes or easier implementation. It can alsoreduce the uncertainty firms face when deal-ing with changing policies and regulations—and thus elicit a faster and stronger invest-ment response. Broad consultations can alsoallay concerns that favored groups mightexercise disproportionate influence in policy-making processes, thus enhancing the trans-parency and public acceptance of reforms.
The form and structure of consultationcan vary. In Vietnam reforms to simplifybusiness registration involved consultationswith private sector associations, domesticbusiness groups, lawyers, the media, andmembers of the National Assembly. In Pak-istan business registration reforms weredesigned and approved after a consultativeprocess that involved circulating and dis-cussing draft rules with various chambers ofcommerce, industry, professional bodies, andthe public. In Peru’s land reforms, urban set-tlers were consulted through public assem-blies to inform them about the method andschedule of land formalization programs andto elicit their views. In Latvia reform priori-ties and an action plan were developedthrough consultations with business associa-tions and a wide range of inspectorates. InChina, Hangzhou municipality recentlyestablished a hearing system, inviting stake-holders and the public to express their viewson reform proposals.57 In Bosnia and Herzo-govina, the Bulldozer initiative includesgrassroots involvement in identifying, evalu-ating, and monitoring reforms (box 3.9).
70 WORLD DEVELOPMENT REPORT 2005
Bosnia and Herzegovina launched the Bull-dozer Initiative in 2002 to involve the pri-vate sector in reforms. A reform coordina-tion unit invited 30 local associations tohelp in proposing, evaluating, and refiningreforms. Among them were regional busi-ness associations, municipal associationsof entrepreneurs, the Employers’ Confeder-ation, the Women’s Business Network, theMicro-Credit Network, and the Associationof Honey and Bee Production—all mem-bers of the Bulldozer Plenary Committee.
A group of lawyers and economistsevaluates proposals. Each proposal is sub-jected to a cost-benefit analysis, and indus-try experts are invited to comment on ideasbefore taking the reform to the next stage.This way no single firm can exploit theprocess to serve its own interests.
The proposed reforms are then submit-ted to the government, opening an inten-
sive dialogue between the Bulldozer Com-mittee and the Council of Ministers andRegional Governments. Once the reform isdesigned, the Committee becomes animplementation watchdog. A biannual pub-lication informs the public of progress,including scores for each reform.
The initiative has helped to reduce sig-nificantly the burden of bureaucratic proce-dures on firms. It halved the number ofsteps to register FDI, expedited customsclearance procedures, bridged theconstituency gap by training and empower-ing local advocacy groups, and establishedmechanisms for civic participation in gov-ernment. In June 2003 it establishedregional Bulldozer committees, all voluntaryand self-financed.
Source: Herzberg (2004).
B O X 3 . 9 The Bulldozer initiative in Bosnia andHerzegovina
consumers, and groups of smaller entrepre-neurs who would benefit from change. Build-ing public awareness and support can alsoreduce the risk of later policy reversal andthus enhance the credibility of the reform,increasing the likely investment response(chapter 2).
The most effective form of communica-tion depends on the issue, the society, and thegroups that need to be reached. In Tanzania asong highlighting the case for privatizationbecame a popular favorite. In Uganda radiotalk shows and plays in local dialects wereimportant. In Peru television commercialsand public ceremonies at the delivery of landtitles were the main channels. In Lesotho andthe República Bolivariana de Venezuela comicbooks reached a wide audience. In post-con-flict Bosnia and Herzegovina, the BulldozerInitiative came up with a brand name andused a range of communication devices,including the staging of symbolic events.
Apart from building support, communi-cation campaigns can educate the publicabout the reforms and help change publicbehavior. Educating firms, consumers, andother groups about their rights and themeasures to uphold them is part of theprocess. In reforming credit rating agenciesin Mexico, the financial authorities and the
05_WDR_Ch03.qxd 8/24/04 11:44 AM Page 70
Engaging with prospective losers fromreform—a group unlikely to remain silentin any event—is also important They canprovide feedback on the details of the pro-posed reform, and engaging them construc-tively may facilitate implementation. Partic-ularly if some workers stand to bedisadvantaged by a reform, early and con-structive engagement can mitigate any neg-ative social impacts (chapter 7). In SouthAfrica the government provided funds andtraining programs to help trade unionsbecome more effective interlocutors in thedialogue on privatization.
Compensating when appropriateWhen state-owned enterprises are restruc-tured or privatized, it is common to givesome of the shares to employees and to pro-vide severance, pension, retraining, or othersupport to ease the adjustment to newemployment. Special mitigation measures forworkers can also be adopted when particularindustries are undergoing significant restruc-turing, particularly if effective economywidesafety nets are not yet in place (chapter 7).
The case for compensating firms affectedby policy changes tends to be different. If aproposed reform would violate property orcontractual rights, failing to compensatecan chill the investment climate—as recentexpropriations in Zimbabwe show (chapter4). When no specific rights are affected,arguments for compensation involve morejudgment. Firms tend to be compensatedwhen they are a small group in society andthe reform would disrupt their legitimateexpectations. For example, investors in Sin-gapore’s privatized telecommunicationscompany were compensated when the gov-ernment shortened the promised period ofexclusivity.58 Power utilities in the UnitedStates were compensated when the transi-tion to a competitive market “stranded”some of the assets built under a previousregulatory regime.59 Compensation is lesscommon when all or most firms in societyare affected by a change seen as a normalrisk of doing business—such as changes intaxes or the introduction of a new competi-tion law.
Compensation need not always involvecash. In the United States, for example,
compensation for utilities disadvantaged bychanges in the regulatory environmentcame from a levy imposed on consumertariffs. Reform programs can sometimes bedesigned so that firms disadvantaged by onereform (liberalizing trade) benefit fromothers (improving business regulation).
When compensation is proposed, a com-mon concern is that governments might beheld hostage by the affected group, who usetheir resistance to reform to extract largerpayments. Mechanisms for arbitrating dis-putes can reduce the incidence of strategicbehavior, as can benchmarks or principlesderived from experience in other countries.
Maintaining momentumInvestment climate improvements are aprocess, not an event. Given the breadth ofthe agenda, and the need to review policiesregularly, many countries are creating sup-porting institutions to help with specifictasks and to sustain progress throughchanges in government. Those institutionstake many forms, but perform one or acombination of four main functions:
• Facilitating consultation
• Facilitating coordination
• Reviewing existing laws and policies
• Reviewing new policy and regulatoryproposals.
Facilitating consultationMany governments have created specialstructures to facilitate ongoing dialogues withrepresentatives of stakeholders. To be effec-tive, these structures should encourage thefree flow of information, build trust amongparticipants, and assist in framing solutions.It is particularly important that they reflectthe diversity of interests affected by invest-ment climate reforms and not merelyentrench elites. A high level of transparencyin their operation—such as the regular publi-cation of reports—can also increase publicconfidence in reform programs.
The scope of representation varies widely(table 3.2), as do their mandates. Some lookat policymaking economywide while othersfocus more sharply on private sector issues.Many of the latter have a mandate that goesbeyond dialogue and includes identifying
Tackling a broad agenda 71
05_WDR_Ch03.qxd 8/24/04 11:44 AM Page 71

bottlenecks, building consensus, recom-mending policy approaches, and monitor-ing progress of reforms. Latvia and Turkeyillustrate common approaches (box 3.10).
Facilitating coordinationResponsibilities for investment climate pol-icy issues are often distributed among sev-eral government ministries and agencies,and often across tiers of governments aswell. Fostering coordination between rele-vant agencies can be important to dealeffectively with issues of common interestand to promote policy coherence. Centralleadership can also help give impetus to
reforms and help overcome resistance fromagencies that may have a stake in maintain-ing the status quo.
Forums for consulting with external stake-holders can contribute to policy coherencewhen led by senior policymakers. But mecha-nisms are also often needed within the gov-ernment. This may take the form of high-levelcabinet committees or even the establishmentof a dedicated ministry. For example, coun-tries acceding to the EU often created min-istries for Europe to foster coordination ofindividual reform initiatives across ministries.In Poland that task was given to a Committeefor European Integration.60
More day-to-day coordination may beundertaken by the technical secretariat tothe consultative forum or the coordinationcommittee. In 2000 Vietnam established anInter-Ministerial Steering Group on Enter-prise Law Implementation to support theongoing implementation of its reform pro-gram (box 3.11).
Fostering policy coordination betweennational and subnational governments canbe tricky politically, but also raises otherissues. As China and India show, institutionalcompetition between subnational govern-ments can be a source of strength for theinvestment climate by fostering policy inno-vation and providing a check on arbitrarygovernment behavior (chapter 2). But somecoordination may be desirable to addressspillovers across jurisdictional boundaries. InMexico, for example, procedures for state andmunicipal governments to make regulationson road freight compatible and complemen-tary are being improved.
72 WORLD DEVELOPMENT REPORT 2005
Table 3.2 Consultative forums dealing with investment climate issues—some illustrations
Civil Government Business Unions Legislators society Donors
Economywide focus
Latvia—Tripartite Cooperation Council ✔ ✔ ✔
South Africa—National Economic Development and Labor Council ✔ ✔ ✔ ✔
Papua New Guinea—Consultative Implementation and Monitoring Council ✔ ✔ ✔ ✔ ✔
Private sector issues
Vietnam—Private Sector Forum ✔ ✔ ✔ ✔
Uganda—Private Sector Foundation ✔ ✔ ✔ ✔
Pakistan—Workers and Employers Bilateral Council ✔ ✔ ✔
Singapore—Competitiveness Council ✔ ✔
Source: World Bank staff.
Many countries have created dedicatedstructures to facilitate an ongoing dialoguewith stakeholders on investment climateimprovements.The approaches in Latviaand Turkey illustrate some of the keyfeatures.
In Latvia the Steering Committee forImprovement of the Business Environmentreports to the Minister of Economy. In Turkeythe Coordination Council for the Improve-ment of the Investment Climate reports tothe Undersecretariat of the Prime Ministry.Both bodies comprise representatives fromkey ministries, as well as from associations oflocal firms, exporters, and foreign investors.In both countries the bodies are served by asecretariat responsible for the daily workand for monitoring reforms—in Latvia, theBusiness Environment Improvement Unit atthe Latvian Development Agency; in Turkey,the General Directorate for Foreign Invest-ment in the Treasury.
Both bodies have clearly defined objec-tives and mandates.Their tasks cover abroad spectrum of issues with a view todeveloping concrete proposals and strate-gies for ongoing reform.They are usuallymanaged by technical committees.Turkeyhas nine committees, and Latvia startedwith four, but the number and focus changewith the needs and concerns of business.
Both bodies help to design and imple-ment reforms.Turkey’s Council helpeddesign laws on recruitment of foreign per-sonnel, FDI, company registration, and labor.It is also engaged in reforms for customs,licensing, intellectual property rights, andland acquisition. Latvia’s Committeecontributes to implementing ongoing leg-islative and procedural reforms of inspec-tions, registration, taxes, customs, landacquisition, and construction.
Source: Coolidge, Grava, and Putnina (2004)and www.yased.org.tr.
B O X 3 . 1 0 Consultative mechanisms in Latvia and Turkey
05_WDR_Ch03.qxd 8/24/04 11:44 AM Page 72

Reviewing existing laws and policiesMost distortions in the investment climatestem from existing laws and policies. To sus-tain an ongoing process of policy reviewand reform, many governments are creatinginstitutions with a mandate to more sys-tematically review such arrangements andrecommend reforms.
This role may be given to the technicalsecretariats of consultative or coordinatingbodies. For example, Thailand’s NationalCompetitiveness Committee and Singapore’sCommittee on Competitiveness have man-dates to study constraints on competitive-ness and to make specific recommendations.Thailand’s committee is chaired by the primeminister, with the National Economic andSocial Development Board as its secretariat.It has undertaken assessments of several sec-tors of the economy, including handicrafts,tourism, and software, and brought severalsector-specific and economywide issues tothe attention of the government: one-stopshopping for international investors, infor-mation about laws and regulations, and theskill levels of the workforce.61
Sometimes the body has a broader man-date. For example, Australia’s ProductivityCommission focuses on providing detailedanalyses of particular areas of policyreferred to it by the government. A strongreputation for rigorous and independentwork, coupled with effective consultationwith stakeholders, has allowed it to exercisesignificant influence. Japan’s RegulatoryReform Committee, reporting to the primeminister, has responsibility for coordinatingthe implementation of a broad deregulationplan.62 In Mexico an Economic Deregula-tion Unit was created in 1988 to overseeimprovements to business regulation.Among other reforms, it proposed disman-tling price controls, deregulating the trans-port sector, and streamlining the standard-ization process. In 2000 it was transformedinto the independent, nongovernmentalRegulatory Improvement Commission(COFEMER), maintaining broad formaloversight powers for the analysis of federalregulations and working with subnationalgovernments to reduce red tape. Competi-tion and investment promotion agencies
Tackling a broad agenda 73
are also often given a mandate to act aschampions of reform in their particularareas (chapter 5).
Experience with dedicated reform champi-ons in low-income countries remains limited,but there have been successes. For example,Senegal created a Growth and Competitive-ness Review Group to identify policy and reg-ulatory constraints to investment and compet-itiveness and to formulate and implementremedial measures (box 3.12).
Reviewing new policy and regulatory proposalsGovernments also need to ensure that newpolicy or regulatory proposals do not under-mine the investment climate by introducingunjustified burdens or other distortions. Acommon response in Organization for Eco-nomic Co-operation and Development(OECD) countries has been to establishprocesses for regulatory impact assessment.Proposed laws and regulations are subjectedto a quantitative assessment of their costsand benefits, with the information madeavailable to legislators and other policymak-ers. These processes help to ensure proposalsreflect an economywide perspective. Theadditional scrutiny involved can also act as acheck on rent-seeking.
Vietnam began its transformation from a cen-trally planned to a more market-orientedeconomy in the late 1980s. Despite manyimprovements, particularly in opening to FDI,there was a cumbersome, overlapping, andinconsistent regulatory environment for thedomestic private sector.
To advance the needed reforms, officialsworked with a broadly based business asso-ciation (the Vietnam Chambers ofCommerce and Industry) and a team in theCentral Institute for Economic Managementwithin the Ministry of Planning and Invest-ment—the technical “champions” of thereform. In January 2000 a new EnterpriseLaw was passed to facilitate the entry ofnew firms, protect businesses from bureau-cratic interference in business operations,increase flexibility to expand business oper-ations, and improve corporate governance.
Recognizing that passing the law wasonly the first step, the government estab-
lished an Inter-Ministerial Steering Groupon Enterprise Law Implementation, chairedby the Minister for Planning andInvestment.The steering group, continuingto improve interagency coordination at thecenter, recently exhorted state agencies to“change their management mindset andput themselves in the shoes of enterprises.”Local authorities seem caught betweenregaining their discretionary powers overbusiness registration (often for personalgain) and streamlining procedures toattract new businesses to locate within theirgeographic areas.
A recent survey of firms noted a “returnof troublesome and cumbersome unwrittenprocedures among various localauthorities.”Vietnam thus shows that con-tinuing vigilance is often needed to ensurethat reforms take deep roots.
Source: Mallon (2004).
B O X 3 . 1 1 Shepherding investment climate improvementsin Vietnam
05_WDR_Ch03.qxd 8/24/04 11:44 AM Page 73

tise and promote consistent assessments,but are often seen as too intrusive on theprerogatives of line ministries. Delegatingresponsibility to line ministries can help toget their buy-in to the process, but doing sowithout a clear framework can lead to dis-appointing results. In Ghana, for example,no ministry was really in charge of policyand regulatory reviews. Instead, each pro-duced its own checklists, expressing differ-ent preferences in what were not muchmore than qualitative assessments.68
Bulgaria’s review process had similarweaknesses until recently, with each agencyperforming different types of evaluations,using different accounting methods and dif-ferent benchmarks, and publicly releasingdifferent amounts of information. Thereviews did not have a perceptible impact onlegislation until uniform review criteria andmethods were devised.69 In Lithuania, bycontrast, assessment for all draft legislationwas mandated under the leadership of thepresidency. Reviews are undertaken by thesponsor of the legislation in consultationwith those affected by the proposed policychanges. Summary assessments accompanyall draft legislation and are reviewed at inter-ministerial, sectoral, and cabinet levels, any ofwhich can return the legislation to the spon-sor with a list of requested improvements.70
Mechanisms and processes of the kinddiscussed here can help to maintainmomentum, but they depend for their suc-cess on high levels of political commitmentand on being credible to stakeholders. Theyalso benefit from ongoing processes tostrengthen capabilities within government.
Strengthening capabilitiesInvestment climate improvements differ intheir demands on resources, expertise, andinformation. Many do not demand muchfrom the budget—and improving eco-nomic growth can increase the tax revenuesto governments. All governments, however,have to improve the quality of their civilservices and the quality of the informationavailable to guide and administer reforms.
ExpertiseCreating a skilled, professional, and account-able civil service can benefit all areas of the
74 WORLD DEVELOPMENT REPORT 2005
Senegal’s Growth and CompetitivenessReview Group was created by presidentialdecree in 1993 to identify policy and regula-tory constraints to investment and competi-tiveness and to formulate and implementremedial measures.
Established as a coordinating body, theGroup also consults broadly with represen-tatives of government, private sector orga-nizations, labor unions, universities, and themedia. It set up committees to reviewdomestic competition issues, export andinvestment promotion, labor–managementrelations and labor regulation, andtransportation costs. It took the lead in facil-itating substantial improvements to theinvestment climate.
In 2000 the Group’s functions were inte-grated into a new Investment Promotion andMajor Projects Agency (APIX), directlyattached to the President’s Office. APIX wasdirected to identify and support investors,facilitate the restructuring of the private sec-tor, simplify administrative procedures, andimplement strategies for the development ofpriority sectors such as tourism and buildingand civil engineering works. It established aone-stop shop for processing all proceduresfor the registration of change of status of abusiness, reducing the amount of timerequired for the registration to operate underthe investment code from 60 days to 14.
Source: Diop (2003). See also www.apix.sn.
B O X 3 . 1 2 The evolution of a reform champion in Senegal
In the United States some 60 percent ofregulations are changed as a result of reviewby the Office of Information and Regula-tory Affairs. Variations of these arrange-ments are in place in 22 OECD countriesand in some upper-middle-income coun-tries in Eastern Europe, Latin America, andAsia.63 In Mexico the review process is sup-ported by COFEMER, which reviewedalmost 1,500 regulations between 2000 andearly 2003.64 In Korea a regulatory reviewcommittee reviewed nearly 3,000 regula-tions between 1998 and 2002, declining 387draft regulations and returning 1,157 tosponsoring agencies for revision.65 Thequestion is whether such impact assess-ments can work in lower- income countries.
Strong political commitment is essential,and without it schemes can disintegrate inany country. Technical capacity can be moreof a constraint in low-income countries,although drawing on the expertise of localuniversities or other entities can often aug-ment this.66 For example, Bulgaria’s regula-tory review processes benefited from collab-oration with a not-for-profit think tank.67
Questions of institutional design can bethornier. There is a tension between creat-ing a central entity with the autonomy andexpertise to take an objective view of regu-lations and creating a process that is ade-quately nested in the government’s day-to-day policymaking and administrativestructure. Independent central review unitscan help to leverage scarce technical exper-
05_WDR_Ch03.qxd 8/24/04 11:44 AM Page 74
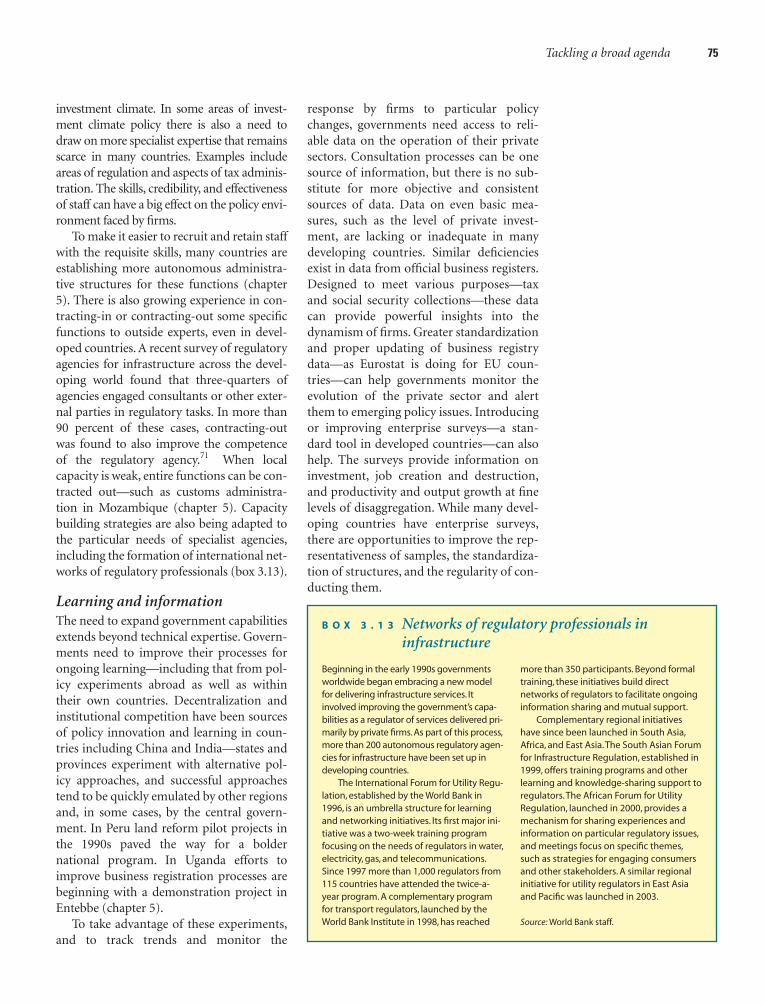
investment climate. In some areas of invest-ment climate policy there is also a need todraw on more specialist expertise that remainsscarce in many countries. Examples includeareas of regulation and aspects of tax adminis-tration. The skills, credibility, and effectivenessof staff can have a big effect on the policy envi-ronment faced by firms.
To make it easier to recruit and retain staffwith the requisite skills, many countries areestablishing more autonomous administra-tive structures for these functions (chapter5). There is also growing experience in con-tracting-in or contracting-out some specificfunctions to outside experts, even in devel-oped countries. A recent survey of regulatoryagencies for infrastructure across the devel-oping world found that three-quarters ofagencies engaged consultants or other exter-nal parties in regulatory tasks. In more than90 percent of these cases, contracting-outwas found to also improve the competenceof the regulatory agency.71 When localcapacity is weak, entire functions can be con-tracted out—such as customs administra-tion in Mozambique (chapter 5). Capacitybuilding strategies are also being adapted tothe particular needs of specialist agencies,including the formation of international net-works of regulatory professionals (box 3.13).
Learning and informationThe need to expand government capabilitiesextends beyond technical expertise. Govern-ments need to improve their processes forongoing learning—including that from pol-icy experiments abroad as well as withintheir own countries. Decentralization andinstitutional competition have been sourcesof policy innovation and learning in coun-tries including China and India—states andprovinces experiment with alternative pol-icy approaches, and successful approachestend to be quickly emulated by other regionsand, in some cases, by the central govern-ment. In Peru land reform pilot projects inthe 1990s paved the way for a boldernational program. In Uganda efforts toimprove business registration processes arebeginning with a demonstration project inEntebbe (chapter 5).
To take advantage of these experiments,and to track trends and monitor the
Tackling a broad agenda 75
Beginning in the early 1990s governmentsworldwide began embracing a new modelfor delivering infrastructure services. Itinvolved improving the government’s capa-bilities as a regulator of services delivered pri-marily by private firms. As part of this process,more than 200 autonomous regulatory agen-cies for infrastructure have been set up indeveloping countries.
The International Forum for Utility Regu-lation, established by the World Bank in1996, is an umbrella structure for learningand networking initiatives. Its first major ini-tiative was a two-week training programfocusing on the needs of regulators in water,electricity, gas, and telecommunications.Since 1997 more than 1,000 regulators from115 countries have attended the twice-a-year program. A complementary programfor transport regulators, launched by theWorld Bank Institute in 1998, has reached
more than 350 participants. Beyond formaltraining, these initiatives build directnetworks of regulators to facilitate ongoinginformation sharing and mutual support.
Complementary regional initiativeshave since been launched in South Asia,Africa, and East Asia.The South Asian Forumfor Infrastructure Regulation, established in1999, offers training programs and otherlearning and knowledge-sharing support toregulators.The African Forum for UtilityRegulation, launched in 2000, provides amechanism for sharing experiences andinformation on particular regulatory issues,and meetings focus on specific themes,such as strategies for engaging consumersand other stakeholders. A similar regionalinitiative for utility regulators in East Asiaand Pacific was launched in 2003.
Source: World Bank staff.
B O X 3 . 1 3 Networks of regulatory professionals ininfrastructure
response by firms to particular policychanges, governments need access to reli-able data on the operation of their privatesectors. Consultation processes can be onesource of information, but there is no sub-stitute for more objective and consistentsources of data. Data on even basic mea-sures, such as the level of private invest-ment, are lacking or inadequate in manydeveloping countries. Similar deficienciesexist in data from official business registers.Designed to meet various purposes—taxand social security collections—these datacan provide powerful insights into thedynamism of firms. Greater standardizationand proper updating of business registrydata—as Eurostat is doing for EU coun-tries—can help governments monitor theevolution of the private sector and alertthem to emerging policy issues. Introducingor improving enterprise surveys—a stan-dard tool in developed countries—can alsohelp. The surveys provide information oninvestment, job creation and destruction,and productivity and output growth at finelevels of disaggregation. While many devel-oping countries have enterprise surveys,there are opportunities to improve the rep-resentativeness of samples, the standardiza-tion of structures, and the regularity of con-ducting them.
05_WDR_Ch03.qxd 8/24/04 11:44 AM Page 75

Part I argued that improving governmentpolicies and behaviors shaping the invest-ment climate is critical to spurring growthand reducing poverty—and so should be atop priority for governments.
Chapter 1 argued that the key is toimprove the opportunities and incentives forfirms of all types to invest productively, createjobs, and expand. This in turn requires effortsto reduce unjustified costs, risks, and barriersto competition. Chapter 2 focused on thebasic tension that governments need toconfront in investment climate policymak-ing: While firms play a key role in improv-ing living standards in society, their policypreferences can diverge from those of soci-ety as a whole. Arbitrating these differencessuccessfully requires governments to navi-gate four sources of potential policy failure:rent-seeking, credibility gaps, lack of publictrust, and poor fits between policyresponses and local conditions. It outlinedlessons of experience in addressing thosechallenges, highlighting the powerful role oftransparency. This chapter looked at practi-cal strategies for tackling a broad agenda. Itargued that the key to accelerating andbroadening improvements is to addressimportant constraints facing firms in a waythat gives firms the confidence to invest—
and to sustain a process of ongoingimprovements. It looked at issues associatedwith setting priorities, managing individualreforms, maintaining momentum, andstrengthening government capabilities.
The remainder of the Report looks at moredetailed issues associated with the design andimplementation of effective strategies to cre-ate a better investment climate.
• Part II examines lessons of experience indelivering the basics—the foundations ofa sound investment climate—stability andsecurity (chapter 4), regulation and taxa-tion (chapter 5), finance and infrastruc-ture (chapter 6), and workers and labormarkets (chapter 7). It reviews a rich bodyof international experience to highlightopportunities for policy improvement inall areas.
• Part III looks at the possible role of mea-sures that go beyond the basics—selec-tive interventions (chapter 8) and the useof international rules and standards(chapter 9). These measures can play asupporting role, but also raise specialchallenges that warrant careful attention.
• Part IV concludes by looking at how theinternational community might helpdeveloping countries improve the invest-ment climates of their societies.
76 WORLD DEVELOPMENT REPORT 2005
05_WDR_Ch03.qxd 8/24/04 11:44 AM Page 76

THE REPORT ARGUES THAT GOVERNMENTS SHOULD STRIVE to create abetter investment climate for everyone by tackling unjustified costs,risks, and barriers to competition. This part of the Report highlightsopportunities for governments to improve their performance indelivering the basic foundations of a good investment climate.
Chapter 4—Stability and security suggests measures that governmentscan take to enhance the security of property rights in their societies.
Chapter 5—Regulation and taxation highlights the huge opportunitiesfor improving approaches in these areas without compromising othersocial goals.
Chapter 6—Finance and infrastructure shows how governments aregetting better results through new approaches to the provision ofthese services.
Chapter 7—Workers and labor markets outlines a three-prongedagenda for strengthening the connection between people and decentjobs to create a more productive and equitable society.
Delivering the Basics
IIP A R T
06_WDR_PO2_Ch04.qxd 8/24/04 3:56 PM Page 77

06_WDR_PO2_Ch04.qxd 8/24/04 3:56 PM Page 78
79
Nothing so undermines the investmentclimate as the outbreak of armed conflict.Capital of all kinds—human, physical,and social—is destroyed, investment dis-rupted, and resources diverted fromgrowth-enhancing activities. Civil war, thepredominant form of warfare over thepast half century, has a particularly devas-tating impact on poverty and growth. Byone estimate, over the past 50 years thetypical civil war lasted 7 years and cut 2.2percent off the projected annual growthrate—at the end of hostilities GDP was 15percent lower than it would have other-wise been. A particularly severe civil warcan, in the short run, also reduce incomeper capita in neighboring states by asmuch as a third.1
Civil war and low income go hand inhand. The odds that a civil war will erupt inlow income states are 15 times greater thanin a developed country. The poorer thecountry, the greater the risk of a nationbeing trapped in a downward spiral of vio-lence and economic decay. A doubling ofper capita income can halve the risk of civilwar. Accordingly, the poorer the country,the stronger the imperative to improve itsinvestment climate to reduce the likelihoodof falling into a conflict trap.2
While peace is essential to unleash pro-ductive investment, firms require morethan this. They require an environmentwith a reasonable level of political andeconomic stability, and one where person-nel and property are reasonably secure.Political instability can create considerableuncertainty and risk for firms, undermin-ing the credibility of current laws andpolicies (chapter 2). Macroeconomic sta-bility also plays a critical role, becausewithout it changes in other areas will have
limited impact (box 4.1). An unstable orinsecure environment has its most tangi-ble effect on property rights, so this chap-ter concentrates on the impact of insecurerights on the investment climate and whatgovernment can do to make them moresecure.
Secure property rights link effort withreward, assuring all firms—small and large,informal and formal, rural and urban—thatthey will be able to reap the fruits of theirinvestments. The better protected theserights, the stronger the link between effortand reward and hence the greater the incen-tives to open new businesses, to invest morein existing ones, and simply to work harder(box 4.2).
New evidence confirms how importantsecure property rights can be. Recent sur-veys from Poland, Romania, Russia, Slova-kia, and Ukraine show that entrepreneurswho believe their property rights aresecure reinvest between 14 and 40 percentmore of their profits in their businessesthan those who don’t.3 Farmers in Ghanaand Nicaragua invest up to 8 percent morein their land when their rights to it aresecure.4 By contrast, to compensate for thegreater insecurity of property rights,equity investors in firms in some low-income countries can require returnsmuch higher than those in firms in devel-oped countries.5
Studies across a broad range of countriesfind that the more secure the rights, thefaster the growth. They also show that evenmodest improvements in security canincrease annual economic growth rates byas much as one percentage point.6 No mat-ter what factors are included in the analysesand what measures of property rights secu-rity are used, all report a close connection
Stability and security
4c h a p t e r
06_WDR_PO2_Ch04.qxd 8/24/04 3:56 PM Page 79
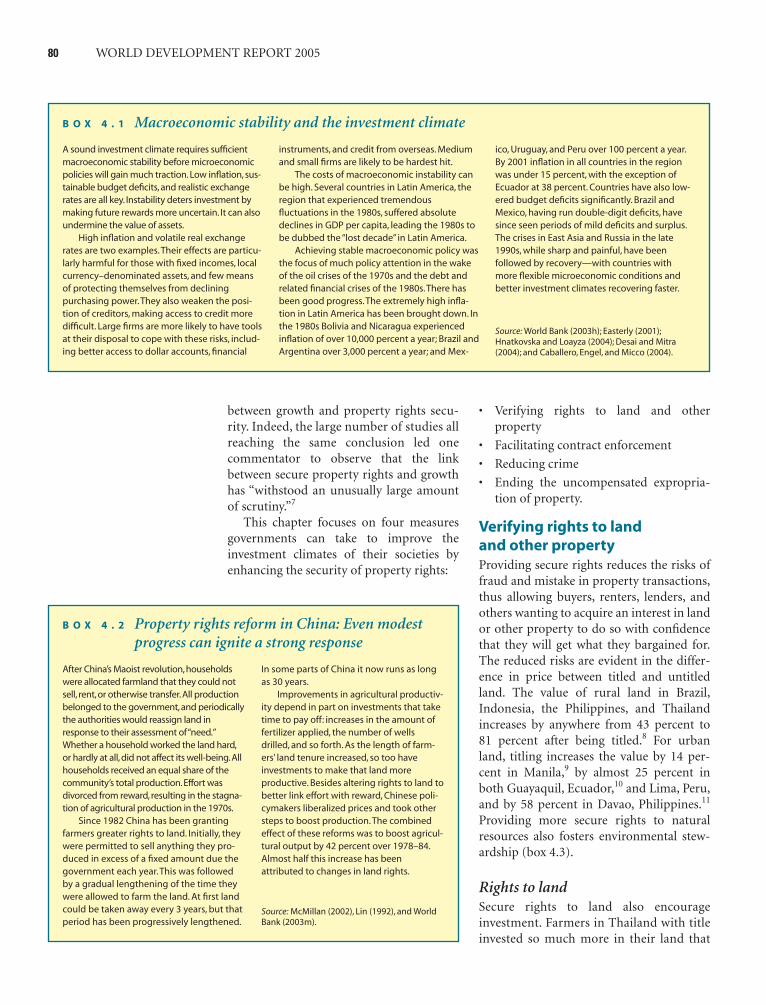
between growth and property rights secu-rity. Indeed, the large number of studies allreaching the same conclusion led onecommentator to observe that the linkbetween secure property rights and growthhas “withstood an unusually large amountof scrutiny.”7
This chapter focuses on four measuresgovernments can take to improve theinvestment climates of their societies byenhancing the security of property rights:
• Verifying rights to land and otherproperty
• Facilitating contract enforcement
• Reducing crime
• Ending the uncompensated expropria-tion of property.
Verifying rights to land and other propertyProviding secure rights reduces the risks offraud and mistake in property transactions,thus allowing buyers, renters, lenders, andothers wanting to acquire an interest in landor other property to do so with confidencethat they will get what they bargained for.The reduced risks are evident in the differ-ence in price between titled and untitledland. The value of rural land in Brazil,Indonesia, the Philippines, and Thailandincreases by anywhere from 43 percent to81 percent after being titled.8 For urbanland, titling increases the value by 14 per-cent in Manila,9 by almost 25 percent inboth Guayaquil, Ecuador,10 and Lima, Peru,and by 58 percent in Davao, Philippines.11
Providing more secure rights to naturalresources also fosters environmental stew-ardship (box 4.3).
Rights to landSecure rights to land also encourageinvestment. Farmers in Thailand with titleinvested so much more in their land that
80 WORLD DEVELOPMENT REPORT 2005
A sound investment climate requires sufficientmacroeconomic stability before microeconomicpolicies will gain much traction. Low inflation, sus-tainable budget deficits, and realistic exchangerates are all key. Instability deters investment bymaking future rewards more uncertain. It can alsoundermine the value of assets.
High inflation and volatile real exchangerates are two examples.Their effects are particu-larly harmful for those with fixed incomes, localcurrency–denominated assets, and few meansof protecting themselves from decliningpurchasing power.They also weaken the posi-tion of creditors, making access to credit moredifficult. Large firms are more likely to have toolsat their disposal to cope with these risks, includ-ing better access to dollar accounts, financial
instruments, and credit from overseas. Mediumand small firms are likely to be hardest hit.
The costs of macroeconomic instability canbe high. Several countries in Latin America, theregion that experienced tremendousfluctuations in the 1980s, suffered absolutedeclines in GDP per capita, leading the 1980s tobe dubbed the “lost decade” in Latin America.
Achieving stable macroeconomic policy wasthe focus of much policy attention in the wakeof the oil crises of the 1970s and the debt andrelated financial crises of the 1980s.There hasbeen good progress.The extremely high infla-tion in Latin America has been brought down. Inthe 1980s Bolivia and Nicaragua experiencedinflation of over 10,000 percent a year; Brazil andArgentina over 3,000 percent a year; and Mex-
ico, Uruguay, and Peru over 100 percent a year.By 2001 inflation in all countries in the regionwas under 15 percent, with the exception ofEcuador at 38 percent. Countries have also low-ered budget deficits significantly. Brazil andMexico, having run double-digit deficits, havesince seen periods of mild deficits and surplus.The crises in East Asia and Russia in the late1990s, while sharp and painful, have beenfollowed by recovery—with countries withmore flexible microeconomic conditions andbetter investment climates recovering faster.
Source: World Bank (2003h); Easterly (2001);Hnatkovska and Loayza (2004); Desai and Mitra(2004); and Caballero, Engel, and Micco (2004).
B O X 4 . 1 Macroeconomic stability and the investment climate
After China’s Maoist revolution,householdswere allocated farmland that they could notsell, rent,or otherwise transfer.All productionbelonged to the government,and periodicallythe authorities would reassign land inresponse to their assessment of “need.”Whether a household worked the land hard,or hardly at all,did not affect its well-being.Allhouseholds received an equal share of thecommunity’s total production.Effort wasdivorced from reward,resulting in the stagna-tion of agricultural production in the 1970s.
Since 1982 China has been grantingfarmers greater rights to land. Initially, theywere permitted to sell anything they pro-duced in excess of a fixed amount due thegovernment each year. This was followedby a gradual lengthening of the time theywere allowed to farm the land. At first landcould be taken away every 3 years, but thatperiod has been progressively lengthened.
In some parts of China it now runs as longas 30 years.
Improvements in agricultural productiv-ity depend in part on investments that taketime to pay off: increases in the amount offertilizer applied, the number of wellsdrilled, and so forth. As the length of farm-ers’ land tenure increased, so too haveinvestments to make that land moreproductive. Besides altering rights to land tobetter link effort with reward, Chinese poli-cymakers liberalized prices and took othersteps to boost production.The combinedeffect of these reforms was to boost agricul-tural output by 42 percent over 1978–84.Almost half this increase has beenattributed to changes in land rights.
Source: McMillan (2002), Lin (1992), and WorldBank (2003m).
B O X 4 . 2 Property rights reform in China: Even modestprogress can ignite a strong response
06_WDR_PO2_Ch04.qxd 8/24/04 3:56 PM Page 80

their output was 14–25 percent higherthan those working untitled land of thesame quality.12 In Vietnam rural house-holds with a document assigning clearrights of control and disposition commit7.5 percent more land to crops requiring agreater initial outlay and yielding returnsafter several years than households with-out documentation.13 In Peru almost halfthose with title to their property in Lima’ssquatter settlements have invested inimprovements, compared with 13 percentof those without title.14
Titling can improve access to creditwhen product markets, lending institutions,and the other elements of a financial infra-structure are present. Land ownership is animportant indicator of creditworthiness,and a registered title allows lenders to easilyverify ownership. Titled land is alsoaccepted more readily as collateral. Lenderscan determine whether others have aninterest in the property and thus assess thelikelihood of seizing the land if the bor-rower refuses to repay the debt.
Farmers with secure title in Costa Rica,Ecuador, Honduras, Jamaica, Paraguay, andThailand obtain larger loans on betterterms than those without. In Thailandfarmers with title borrowed anywhere from50 percent to five times more from banksand other institutional lenders than farmerswith land identical in quality but withouttitle.15 The benefits extend beyond farmers.In Peru residents of urban areas in Limathat received title to their land have used thetitled land as collateral to buy microbuses,build small factories, and start other typesof small businesses. Lack of secure title—common in many countries (figure 4.1)—isthus one more obstacle smaller entrepre-neurs face when trying to find financing fortheir operations.
Securing rights contributes to a betterinvestment climate in ways besides boostinginvestment and easing access to credit.Owners with secure rights do not have towaste time at home guarding their property.In Peru those with title to their land workoutside the home an average of 20 hoursmore per week than those in the sameneighborhood whose land is not titled.16 InVietnam farm households with secure rights
to land spend an average of nine weeks moretime working off the farm than those with-out secure rights.
Improving the security of property rightscan raise important distributional questionsin society (box 4.4). But even the landlesspoor can benefit when rights are secure.Owners with insecure rights are often reluc-tant to rent their land, fearing that a tenantmay try to assert a claim to the property.
Stability and security 81
When rights to natural resources are uncer-tain, those in immediate control often feelthey should “use it or lose it.” After all, if theyare not sure the resource will be theirstomorrow, why not take as much as possibletoday?
Fisheries are often depleted because ofthis use-it-or-lose-it syndrome. Each fisher-man catches as much as he can as fast as hecan, knowing that others are doing thesame.The result: the stock of fish is soonexhausted. Iceland devised a way to useproperty rights to overcome this problem.Each fisherman was awarded a quota of fishbased on how much he had historicallycaught.The fisherman was free to catch upto that number of fish each period or totrade some or all of the quota to others.Thequota prevented overfishing while givingeach holder an interest in ensuring thefuture health of the fishery. Since the adop-tion of a quota for herring, stocks haveincreased, as has the catch. Quota schemeshave produced similar results in NewZealand and Nova Scotia, and Peru is experi-menting with a quota system as well.
Another example of the relationshipbetween secure rights and environmentalstewardship involves land. Ethiopian farm-ers are less likely to plant trees and buildterraces to protect against erosion—andmore likely to increase the use of fertilizerand herbicides—if their rights to land areinsecure.When the rights to gatherfirewood, graze animals, and otherwise usethe resources of neighboring forests are rec-ognized, Kenyan communities keep carefulwatch to ensure that they are not overused.
Cross-country studies confirm theclose link between secure rights and envi-ronmental stewardship. One recent analy-sis of 53 developing countries concludedthat a modest improvement in the protec-tion of property rights could reduce therate of deforestation in these countries byas much as one-third.
Source: Deininger and others (2003); Samueland Pender (2002); Pender and others (2001);Mwangi, Ongugo, and Njuguna (2000); Norton(2002); Gissurarson (2000); and Newell,Sanchirico, and Kerr (2002).
B O X 4 . 3 Secure property rights and environmentalstewardship
75
50
25
Estim
ated
pro
porti
on o
f citi
zens
livin
g in
unt
itled
hou
ses
(per
cent
)
0
100
Egypt Haiti Peru
Rural
Urban
Philippines
Source: De Soto (2000).
Figure 4.1 Not entitled?
06_WDR_PO2_Ch04.qxd 8/24/04 3:56 PM Page 81

Many will thus let their land lie fallow ratherthan risk leasing it to a household wantingto work it, or they will rent it only to thosethey know well. In either case productivitysuffers because the rural poor—less likely tobe a part of the owner’s social circle—aredenied access to land.17 In the DominicanRepublic the effect of securing owners’rights increased the number of plots leasedout by 21 percent, with 17 percent morehouseholds obtaining access to land. Poorhouseholds realized the largest share of ben-efits. The percentage of poor tenantsincreased by 40 percent, and the actual arearented to them grew by 67 percent.18
Securing rights benefits both individuallandholders, through investment incentivesand credit access, and the community atlarge, through its impact on growth andpoverty reduction. While the price govern-ments charge for titling services shouldreflect this mix of public and private bene-
fits, that price should not be inflated becauseof red tape or demands for “unofficial” pay-ments by registry staff. Maintaining monop-olies over surveyors, notaries, and other pro-fessionals who prepare the necessarydocumentation can also boost costs and sodeter registration. In Russia surveyor feesequal to two years of the minimum wagekeep many from registering their property.19
In Peru the key to titling urban land belong-ing to the poor and near-poor was breakingthe notaries’ monopoly over drafting deeds.
Maintain an effective titling program. Gov-ernments can improve the security of landtitle by maintaining an efficient land reg-istry, something becoming easier withadvances in computer technology (see box2.16). Even this straightforward measurecan face challenges.
First, the cost of issuing initial titles canbe significant, particularly when a large per-
82 WORLD DEVELOPMENT REPORT 2005
As economic activity intensifies, the returnsfrom establishing rights over a resource increaseaccordingly.The paradigmatic case involvesrights to the lands of the Labrador Peninsula,now part of Canada.These lands were home tootters, raccoons, and other fur-bearing animals,and as demand for pelts grew in 18th centuryEurope, the risk of overhunting increased appre-ciably. But because the land was heldcollectively, individuals had no incentive to cur-tail hunting.
Parceling the land out to extended familiessolved the problem, giving each an incentiveto restrict the taking of animals living on theirland to sustainable levels. Allocating rights tonatural resources to groups, families, or indi-viduals continues to protect against deforesta-tion, overfishing, and other practices that per-manently damage the environment, asdescribed in box 4.3.
Changes in property rights regimes can cre-ate strains within a community. Although thetransition to a system of better-defined rightsincreases the wealth of the community, somemembers will gain more than others, and somemay even be worse off. Less skilled hunters real-ized more from curbs on hunting in Labradorthan the more skilled.The problem is political:finding acceptable mechanisms to allocate thegains and losses while maintaining the advan-tages from more clearly specified rights.Thebargaining to reach a solution can be difficult,and an impasse is always possible.
Why do some groups reach agreement andothers not? One explanation is social capital—the trust, norms, and networks that facilitatecoordinated action. Social capital tends to behigher when the community is smaller andmore homogeneous and when informationabout the effect of different solutions circulatesfreely.These factors have been critical to com-munity-wide agreements on the use ofresources. And as World Development Report2002 explained, the larger the community, themore ethnically and culturally diverse, the moreopen to trade, and the greater the spread in lev-els of income and wealth, the less likely that anaccord will emerge.
In an ideal world government would act asan impartial arbiter among competing interests,nudging them in the direction of a mutuallyadvantageous agreement while curbing oppor-tunistic behavior and ensuring that norms of jus-tice are observed. Governments rarely achievethis ideal, however. Instead, as an analysis of thecreation of rights to farmland in 23 countriesover three millennia shows, those in control ofthe governmental machinery often use theirpower to favor certain interests—aristocrats,colonists, and others with political influence—atthe expense of the small peasant farmer.
A more recent example is the privatizationof state property. As with land rights, the sale ofstate-owned property in an ideal world wouldproduce a solution advantageous to all, transfer-ring factories and other productive assets to
those who can most efficiently exploit them atprices that reflect their value in a market econ-omy. Some privatizations have favored a selectfew, however, as have several recent mass priva-tizations in Eastern Europe and the formerSoviet Union. Indeed, one poll shows that 80percent of the Russian public believes that themass privatizations of Russian enterprises in the1990s were unfair.
As Hobbes recognized, and several modernauthors have recently tried to model, there is adynamic at work in enforcing property rights. Ifenough citizens accept (or at least acquiesce to)the current regime, the government’senforcement resources can be devoted to bring-ing those who refuse to accept existing arrange-ments into compliance. Greater compliance pro-duces a virtuous circle. As more people believeothers will respect the current regime, theirincentives to respect it increase too.Those whowould undermine secure property rights alsoface ever higher levels of deterrence as govern-ment brings more resources to bear on fewerindividuals.The corollary is that when large num-bers of citizens believe the existing distribution ofrights is unfair, the resulting tensions can under-mine secure rights. Government is not helpless inthe face of widespread discontent with the distri-bution of rights, however (see box 4.10).
Source: Demsetz (1967); Libecap (1994); Putnam,Leonardi, and Nanetti (1993); Ostrom (2000);Binswanger, Deininger, and Feder (1995); Transition(2003); and Hoff and Stiglitz (2004).
B O X 4 . 4 The distribution of property rights
06_WDR_PO2_Ch04.qxd 8/24/04 3:56 PM Page 82

centage of land is untitled, as is the case inmany developing countries. Conflictingclaims may need to be resolved, boundariesdetermined, and accurate maps drawn. Inrecent World Bank-supported projects theunit cost of a title or first registrationranged from $9.90 in Moldova to $24.40 inIndonesia to $1,354 in Latvia.20
Second, it is typically much easier to pro-vide title to land where de facto ownershiprights are recognized in the community thanwhere titling may encroach on the claims ofothers. The programs in Peru and Thailandbegan by issuing titles to residents whoserights were essentially uncontested, either byother individuals or by the government. Assupport for the projects grew, and experi-ence in administering them increased, thetitling effort was extended to areas where theissues were more complex (box 4.5).
Even when there are no rival claimants,titling reforms can run into resistance. Landregistry personnel often oppose moderniza-tion, either from inertia or the loss ofopportunities to collect side-paymentsfrom registrants. In Russia, Ukraine, andother former socialist countries, oppositionto rural land titling has come from themanagers of collective farms. Titlingrequires breaking these farms up into indi-vidual parcels, threatening managers’ jobsand income and weakening their powerover the farmers.21
Consider alternatives to full-blown titling.A large titling program is costly andrequires many trained professionals. Beforeinitiating a program, governments shouldconsider whether their policy objectives canbe realized through measures short of pro-viding a full legal title. Indeed, experiencearound the globe shows that a diversity oftenure options can facilitate access to land.In Niger, security of rights was realizedthrough a simple, community-based regis-tration scheme.22 In Honduras simple titledocuments that lenders can hold while theloan is outstanding have been enough toimprove the flow of formal credit to smallfarmers.23 In urban areas, too, interim mea-sures short of full titling can begin to meetresidents’ needs for greater security.24
Botswana has issued use certificates that
have protected holders from eviction whilethe government considers options to addressurban landlessness.25 Other examples wheresecure rights were achieved without a full-blown title come from India and Vietnam.
Foster competition among service providers.Whatever the means chosen to enhance thesecurity of property rights, governmentsneed to be sure that consumers are not over-charged for the required services. Experiencein Australia, the Netherlands, and the UnitedKingdom shows that transaction costs can bereduced, without sacrificing the quality ofservice, by introducing competition into theprovision of services associated with landtransactions (box 4.6).
Title to other propertyTitling automobiles, equipment, machinery,and other valuable forms of “movable”property can provide benefits similar totitling land. As with land the registration canfacilitate access to credit. Lenders can verifyownership and determine whether othershave already either lent against the propertyor may have some other interest that wouldmake it difficult to foreclose on the propertyin the event of default. Experience inIndonesia and Romania demonstrates thevalue of movable property registries. Both
Stability and security 83
In 1982 the Thai government began a 20-year project to title and register farmlandthroughout the kingdom.The aim? Enhanc-ing farmers’ access to institutional creditand increasing their productivity by givingthem an incentive to make long-terminvestments.
Just over 8.5 million titles were issuedduring the life of the project. Along withthose issued outside the project, the num-ber of registered titles increased from 4.5million in 1984 to just over 18 million bySeptember 2001. Studies conducted duringthe project show that it met both its objec-tives: titled farmers secured larger loans onbetter terms than untitled farmers, and pro-ductivity on titled parcels rose appreciably.
The success in Thailand is attributed toseveral factors.
• There was a clear vision for the project, along-term plan to achieve it, and a com-
mitment by the government and keystakeholders to project implementation.
• A strong policy, legal, and institutionalframework was in place for land adminis-tration.
• The project built on earlier efforts toissue documents recognizing holders’rights to their land.
• Registration procedures developed bythe Department of Lands were efficientand responsive to public demand.
• The public had confidence in the landadministration system and actively par-ticipated in the reform process.
• The interests that can complicateprojects in other countries—publicnotaries, private lawyers, and privatesurveyors—were not present.
Source: Burns (2004).
B O X 4 . 5 Thailand’s 20-year program to title rural land
06_WDR_PO2_Ch04.qxd 8/24/04 3:56 PM Page 83

countries created one in 2000. By the end of2003 Romania had recorded 200,000entries, while in Jakarta alone creditorssought in 2003 to register 12,000 interests invehicles, machinery, and other items cov-ered by the new law.26 According to theBank’s Doing Business Project, the timerequired to register property ranges from 3days in Lithuania, to 274 days in Nigeria,and nearly 1,000 days in Croatia.
The easier it is for banks and other finan-cial institutions to recover the property inthe event of nonpayment, the more willingthey are to lend (chapter 6). A commonmethod for lowering the costs of foreclo-sure is for the lender to retain title to theproperty. The lender simply leases it to theborrower for a fixed time at an agreed uponprice, often payable monthly. Not only cansuch leasing agreements simplify foreclo-sure proceedings, but they are also animportant means for broadening access tofinance. Small and medium firms do notneed to accumulate the funds required tobuy machinery or other assets outright butcan obtain the equipment by paying a bank,
or a firm that specializes in leasing, amonthly rental fee.
The extent to which firms can takeadvantage of leasing depends largely onhow secure the lessor’s rights in the prop-erty are. If, in the event of nonpayment, thelessor must go to great lengths and expenseto reclaim the property, the lessor willrequire that firms leasing the equipmentprovide large cash advances or other formsof guarantees.27 In Egypt it can take years torepossess leased property, in Lebanon any-where from nine months to two-and-a-halfyears. In Tunisia, by contrast, it takes threemonths at most to obtain a court order per-mitting repossession.28 Partly as a result oflessors’ ability to obtain these ordersquickly, estimates from 2000 show leasingto be far more prevalent in Tunisia thaneither Lebanon or Egypt (figure 4.2).
One type of property of growing impor-tance is intellectual—the patents, copy-rights, trademarks, and other legally createdrights to enjoy the fruits of one’s intellectualefforts. Because intellectual property isintangible, and can be transported easilyacross national boundaries, internationalagreement on the enforcement of theserights is critical to its protection (box 4.7).
Facilitating contract enforcementProperty rights are more secure, and morevaluable, when the costs and risks ofexchanging them are low. Delays or uncer-tainties in the enforcement of exchangeerode the value of property rights anddiminish the opportunities and incentivesto invest. In an ideal world all contractualexchanges would occur without a hitch.Neither party would ever fail to deliver thepromised good or service or be short on thequality or quantity promised. It is easy tosee why such a world would have an extra-ordinarily favorable investment climate.Firms could commit to long-term, complexcommercial relationships with perfectstrangers, confident that the other sidewould faithfully uphold its end of the bar-gain over as many years as the contract lasts.
It is also easy to see why such a worlddoesn’t exist. Anytime the parties do not paywith one hand and take with the other, thereis a risk that the party to perform later will
84 WORLD DEVELOPMENT REPORT 2005
In early 1984 the British governmentannounced it was considering ending thelegal profession’s 180-year monopoly onproviding the services required to buy orsell real estate.Within months reportsbegan circulating that prices for conveyanc-ing services were falling. Spurred by favor-able responses from consumerorganizations, and over the vigorous objec-tions of the organized bar, the governmentwent through with its proposal to open themarket to non-lawyers. Starting in October1987 anyone passing a rigorous licensingexamination was permitted to offerconveyancing services. In accord with anearlier reform, both legal professionals andlicensed conveyancers were allowed toadvertise rates and services.
Competition brought prices down with-out sacrificing quality.The mean pricecharged for conveyancing services fellalmost 10 percent between 1983 and 1986,a period when housing prices, and thus thefees under the old schedule, rosesignificantly. Consumers asking for an esti-mate of the cost of the services realized sig-nificant savings because providers cut their
initial quotes for fear of losing the business.Despite the price reductions, consumersbuying or selling real estate after de-monopolization reported the same satisfac-tion with the services, if not more.
Similar deregulation initiatives havebrought the costs of land transactionsdown in the Australian state of New SouthWales and in the Netherlands. Conveyanc-ing fees in New South Wales fell an averageof 18 percent in the mid-1990s after themarket was opened to non-lawyers, savingthe community close to A$100 million infees. In the Netherlands abolishing the pro-fessional monopoly held by real estateagents lowered costs and providedconsumers with a greater selection of ser-vices.These results are consistent with abroader study of professional regulationconducted by the European Commission. Itfound that less regulation of lawyers,notaries, and other legal professionalsenhances consumer welfare without com-promising other values.
Source: Domberger and Sherr (1989); Baker(1996), Philipsen (2003); and European Com-mission (2004b).
B O X 4 . 6 De-monopolizing property transactionprofessionals
8
4
Perc
ent o
f gro
ss fi
xed
inve
stm
ent
in p
lant
& e
quip
men
t
0
12
16
EgyptLebanon
Tunisia
Source: World Bank (2002b).
Figure 4.2 Leasing activity is moreprevalent in Tunisia than in Egypt orLebanon, thanks to laws facilitatingrepossession
06_WDR_PO2_Ch04.qxd 8/24/04 3:56 PM Page 84

breach the agreement. Governments can helpfirms cope with these risks by fostering thedissemination of accurate reputation infor-mation and supporting effective dispute reso-lution and enforcement mechanisms.
Facilitate the flow of informationabout reputationReputation is central to ensuring contractperformance in all societies.29 In decidingwhether to contract with a new partner,firms are guided by what they know aboutthe potential partner’s history of complyingwith contractual obligations. A firm is morelikely to contract with those who have agood reputation. Various entities haveemerged to meet the demand for suchinformation. They collect information onthe creditworthiness and reliability of indi-viduals and firms and provide it to financial
institutions, industrial companies, and oth-ers in the business community. Those whocontemplate breaching their obligationsknow that if they do, all will soon know.
Government policy sometimes hinders thecreation of firms that market reputationinformation by restricting the flow of com-mercial or financial data. Free-rider problems,highly concentrated financial systems, andother market failures can also retard the emer-gence of private organizations that gather anddisseminate reputation information.30 Gov-ernments should first remove the impedi-ments to circulating accurate data on credit-worthiness.31 If private firms still do not enterthe market, government can. In Bangladesh,Bolivia, Bulgaria, Nigeria, Romania, and Viet-nam, government-owned reporting agencieshave been established, building on data col-lected by the central bank.32
Stability and security 85
Inventors and authors often require an incentiveto develop innovative products, as has been rec-ognized since at least the 4th century BCE.Todaythe incentive is provided by granting creators ofnew inventions, software programs, or otherproducts a patent, copyright, or other similarright to their creation. An idea of how powerfulthis stimulus can be comes from a recent analy-sis of spending on research and development byAmerican firms. A modest increase in the valuemanagers expect to realize from patenting newproducts was found to boost R&D by anywherefrom 11 percent in the biotech industry to 8 per-cent in the pharmaceutical industry to 7 percentin the chemical industry.
This stimulus comes at a price. Intellectualproperty rights give their holders the exclusiveright to sell the product embodying their creationfor a limited time. During this period, holders arefree to charge whatever price they wish irrespec-tive of production costs. Intellectual propertyrights thus need to strike a balance between soci-ety’s interests in fostering innovation and in keep-ing prices to consumers low.
Finding the right balance is a challenge.Early in the 19th century, when the UnitedStates had few authors but many readers, Eng-lish writers complained that the American gov-ernment did not enforce their copyrights. But asthe United States produced more authors, gov-ernment policy toward copyright changed untilthe United States became a leader in persuad-ing other nations to honor copyrighted works.For the past two decades countries where themajority of innovative products are producedhave urged countries that mainly purchase
these products to strengthen their enforcementof intellectual property rights to prevent thedilution of incentives to innovate.While thedebate continues, four recent developments arehelping to change its terms.
First, more firms in more developing coun-tries are now producing innovative products andthus have a direct stake in the protection ofintellectual property rights. In Brazil and thePhilippines short-duration patents have helpeddomestic firms adapt foreign technology to localconditions, while in Ghana, Kuwait, and Moroccolocal software firms are expanding into the inter-national market. India’s vibrant music and filmindustry is in part the result of copyright protec-tion, while in Sri Lanka laws protecting designsfrom pirates have allowed manufacturers ofquality ceramics to increase exports. Softwareand recording industry firms in Indonesia reportthat they would expand production if their copy-rights were better protected.
Second, a growing number of developingcountries are seeking to attract FDI, including inindustries where proprietary technologies areimportant. But foreign firms are reluctant totransfer their most advanced technology, or toinvest in production facilities, until they are con-fident their rights will be protected. Innovatorsin many knowledge-intensive industries simplywill not invest where the protection of theirintellectual property is uncertain.
Third, there is growing recognition that con-sumers in even the poorest countries can sufferfrom the sale of counterfeit goods, as examplesranging from falsely branded pesticides inKenya to the sale of poisoned meat in China
attest. Consumers usually suffer the most whenlaws protecting trademarks and brand namesare not vigorously enforced.
Fourth, there is a trend toward addressingintellectual property issues one by one, helpingto identify areas of agreement and findcommon ground on points of difference. Anagreement at the WTO ministerial meeting inNovember 2001 reflects developing countries’need for access to medicine. Discussion is alsounder way on policies that would give manufac-turers of patented goods greater flexibility tosell at lower prices in poor countries than inwealthier ones.
How nations recognize intellectual propertyrights can be as important as the decision toprotect them.When the United Statesestablished a patent regime in the early 19thcentury, it modeled its laws after those of theUnited Kingdom. But unlike the UnitedKingdom, the fees for registering a patent werevery low, innovators were free to license theirpatents to others, and administrativeprocedures ensured even-handed application ofthe law to all. Broadening access to intellectualproperty rights spurred an enormous increasein innovative activity, and shortly after a mid-century exhibition in London, where British offi-cials were shocked by America’s technologicalachievement, they followed its example andopened up their patent regime.
Source: Braga, Fink, and Sepúlveda (2000); Maskus(2002); Arora, Ceccagnoli, and Cohen (2003); NathanAssociates Inc. (2003); Hoff (2003); and Luthria andMaskus (2004).
B O X 4 . 7 Intellectual property rights: The ongoing debate
06_WDR_PO2_Ch04.qxd 8/24/04 3:56 PM Page 85

Improve courts and other disputeresolution mechanismsThere are limits to the reach of reputation-based mechanisms. Firms without a historyof creditworthiness will have difficultygaining a foothold in the market resulting,in extreme cases, in the prevention of newentry altogether.33 Reputation mechanismsalso depend on participants being willing tocollectively boycott anyone with a bad repu-tation. As economies expand, however, thedifficulties of enforcing a group boycottincrease. More information must be col-lected and disseminated on more individu-als and firms, and the temptation to cheat,or free-ride, on the agreement grows. Even-tually a centralized contract enforcementmechanism operated by the state becomes aless costly alternative.34 Rather than incur-ring substantial costs before entering into atransaction, firms find it less expensive toturn to a court after the fact to resolve dif-ferences over performance. The importanceof courts grows as the number of large andcomplex long-term transactions increases.
The impact of a well-functioning courtsystem extends far beyond the number ofcases it resolves. The more timely and pre-dictable a court’s decisions, the better ablefirms are to predict the outcome of any dis-pute. As predictability and timelinessimprove, the number of disputes filed maydecline, because a credible threat of pursu-ing a remedy in court provides incentivesfor the parties to honor their obligations.Bargaining takes place in the shadow cast bythe courts and the laws they enforce. Thestronger the shadow they cast, the lower therisk of transacting, the larger the number oftransactions, and the lower their cost.35
Where the shadow is weak, a firm’s costsand risks increase. In India those whose con-tracts have been breached or who have suf-fered other injury must either accept asharply discounted settlement or wait years,if not decades, to have their case resolved incourt.36 A weak shadow can also make sometransactions so risky that they never occur,for if there is no way to ensure performance,the risk of going forward may simply be toogreat. Or firms may circumvent the judicialsystem altogether, taking the costly but lessrisky route of purchasing their suppliers or
customers and so turning arm’s length trans-actions into transactions within firms.37
New research underlines the importanceof well-performing courts for a soundinvestment climate. Studies from Argentinaand Brazil show that firms doing businessin provinces with better-performing courtsenjoy greater access to credit.38 New work inMexico shows that larger, more efficientfirms are found in states with better courtsystems. Better courts reduce the risks firmsface, and so increase the firms’ willingnessto invest more.39
• Firms in Brazil, Peru, and the Philippinesreport that they would be willing toincrease investment if they had moreconfidence in their nation’s courts.40
• Firms in Albania, Bulgaria, Croatia,Ecuador, Moldova, Peru, Poland, Roma-nia, Russia, Slovakia, Ukraine, and Viet-nam say they would be reluctant toswitch suppliers, even if offered a lowerprice, for fear they could not turn to thecourts to enforce the agreement.41
• Firms with confidence in the courts inPoland, Romania, Russia, Slovakia, andUkraine are more likely to extend tradecredit and to enter new relations withlocal firms.
• In Bangladesh and Pakistan the WorldBank’s Investment Climate Surveys showthat while firms with confidence in thecourts make half their sales on credit,those with little confidence extend crediton only one-fourth of their sales.
• In Burundi, Cameroon, Côte d’Ivoire,Kenya, Madagascar, Zambia, and Zim-babwe, where firms have little confidencein the courts, they are unwilling toexpand trade by doing business with any-one other than those they know well.42
The Investment Climate Surveys showthat in many countries, firms have littleconfidence in courts (figure 4.3). One rea-son may be the length of time and the costrequired in many countries to resolve evensimple cases. The World Bank’s Doing Busi-ness Project shows that in 2003 the timerequired to enforce a contract range fromunder 50 days in the Netherlands, nearly600 days in Bolivia, to nearly 1,500 days in
86 WORLD DEVELOPMENT REPORT 2005
06_WDR_PO2_Ch04.qxd 8/24/04 3:56 PM Page 86

Stability and security 87
Guatemala. Nor does the evidence showthat slower, more costly courts deliver betterresults than less expensive, more expedi-tious ones.43
Strengthen court systems. As World Devel-opment Report 2004 showed, agencies thatprovide a public service perform betterwhen they are accountable to users, whenusers have a say in the policies governingthe delivery of the service, and when thoseproviding the service have a strong incen-tive to deliver quality services. These sameprinciples apply to courts.
A common result of giving users morevoice in the operation of the courts is pro-cedural simplification. Court procedures inmany developing countries are more com-plex and costlier than those in developedcountries. Not only do these lengthier andmore expensive procedures provide no off-setting benefits, they are often simply a fur-ther drag on entrepreneurial activity.44 InBrazil complex court procedures retardcredit markets and increase the cost ofcredit transactions.45
Coupling procedural reform withchanges in the way courts are managed andcombining both with the introduction ofinformation technology can dramaticallycut the time needed to decide a case. Thismix produced an average reduction in pro-cessing time of 85 percent in six pilot courtsin Ecuador. Similar results were realizedacross a range of courts in República Boli-variana de Venezuela as well. In Barques-imeto and Ciudad Bolivar, reforms intro-duced in 1999 trimmed the time required todispose of leasing and debt collection casesfrom anywhere between half to two-thirds(figure 4.4). Judges were relieved of routineadministrative tasks, clerical work was cen-tralized in a judicial support office, whilethe entire litigation process, from the filingof a complaint to the scheduling of hearingsto the issuance of judgment, was auto-mated.
One frequently considered option forspeeding up commercial cases is the cre-ation of either a separate court or a separatedivision or chamber within an existingcourt to handle business disputes. Tanza-nia’s recently created commercial courtdraws praise from lawyers who appear
before it, and although its filing fees arehigher than the ordinary courts, to whichlitigants can also turn, its case load contin-ues to grow.
Efforts to create specialized commercialcourts in Bangladesh, Indonesia, CapeVerde, Côte d’Ivoire, Pakistan, and Rwandahave so far been less successful. The differ-ence often lies in the political supportcourts enjoy. In Tanzania the court handlescases filed by banks and other financialinstitutions that constitute a powerful lobbyin support of the court. But progress ismore difficult when the targets of courtaction hold significant political influence.InBangladesh, for example, the defendants
Note: Countries selected to illustrate range of responses.Source: World Bank Investment Climate Surveys.
Figure 4.3 Many firms do not believe the courts will uphold their property rights
0 20 40 60 80 100
Malaysia
Algeria
Zambia
Brazil
Czech Rep.
Kenya
Kyrgyzstan
Guatemala
Moldova
Bangladesh
Percent
600
400
200
Days
from
initi
atio
n to
term
inat
ion
0
800
Barquesimeto CiudadBolivar
Barquesimeto
Leasing Debt collection
2001
1999
CiudadBolivar
Source: Supreme Court of República Bolivariana de Venezuela.
Figure 4.4 Reforms speed up court business in República Bolivariana de Venezuela
06_WDR_PO2_Ch04.qxd 8/24/04 3:56 PM Page 87

include influential citizens being asked torepay millions of dollars in loans from state-run banks. Similarly, in Indonesia the defen-dants include those being asked to acceptsignificant losses in court-ordered reorgani-zation and liquidation proceedings.
Court performance depends on judges,lawyers, clerks, and other participants work-ing to ensure the timely and accurate resolu-tion of disputes. Differences in court perfor-mance are largely a function of differentincentives.46 When participants have strongincentives to see that cases are decided expe-ditiously, accurately, and at a reasonable cost,court performance improves dramatically
Legal professionals who work in andaround courts often fear that changing incen-tives will affect their incomes. In Tanzaniareformers overcame the lawyers’ oppositionby persuading key members of the professionthat they would benefit from reform. As con-fidence in the courts increased, reformersargued, more cases would be filed, so thedemand for legal services would increase. Inseveral countries, working groups of seniorjudges, respected members of the bar, andcivil society have come together to develop aconsensus on the benefits of reform.
A special challenge in court reform isthat the judiciary is usually a separate andindependent branch of government. Offi-cials in the executive can urge judges toreform, and the legislature can pass laws tostreamline procedures, but implementationdepends on the courts. One step the execu-tive branch can take on its own is to reviewits use of the courts. Governments are oftenthe largest single user of the courts, and as astudy in the Indian state of Andhra Pradeshshows, government often contributes todelays by pursuing matters it has no chanceof winning and lodging appeals it is sure tolose.47 Curbing such behavior can reducethe demands on the courts and allow themto concentrate on genuine disputes.
Remove impediments to private dispute set-tlement. Fostering private resolution througharbitration, mediation, or conciliation willalso improve the contracting environment.Not only are these methods often less expen-sive than a lawsuit, they can produce moreaccurate decisions as well. Where the dispute
involves technical issues, the parties can selectan engineer or other expert versed in the rele-vant issues to decide the matter.
Some governments discourage private dis-pute resolution through unnecessary restric-tions on procedures. In Bolivia and Tanzaniavarious restrictions on alternative dispute res-olution mechanisms prevent firms from tak-ing full advantage of them.48 By contrast, inColombia and Peru—where government hasenacted legislation supporting the use ofalternatives—the results have been promising.A commercial arbitration chamber run by theBogotá Chamber of Commerce handled 371cases in 2001 involving claims of Col$3.2 bil-lion. The Lima Chamber of Commerceresolved 182 commercial disputes in 2000 inan average time of less than six months.49
Where the parties to an arbitration orother alternative dispute resolution mecha-nism contemplate continued dealings, eachhas an incentive to abide by the arbitrator’saward. Each may also comply because of theeffect on its reputation if it refuses to do so.If a party refuses to honor an arbitrator’sdecision, it runs the risk that other firms willdecline to do business with it in the future.
Where the incentives of reputation orrepeat dealing are not present, the courtsneed to backstop arbitration by permittingthe prevailing party to bring an enforce-ment action. To be an effective backstop, thelaw must not give the loser in an arbitrationproceeding a long period or numerous waysto challenge the award. The United NationsCommission on International Trade Lawrecommends that courts should be permit-ted to set aside awards only in limited andprecisely defined situations. Otherwise, ashappened in India, litigation over the valid-ity of awards can spiral out of control as thelosing side seeks to win in court what it lostat the arbitration table.50
Access to arbitration in a neutral countryis often important to foreign investors, whomay fear that the courts in the country of theinvestment are biased against them, or tooslow, or too inexpert to hand down a timelyand accurate decision. International arbitra-tion has emerged as an important way forinvestors to reduce the risks of submittingdisputes to local courts.51 To improve theinvestment climate, governments should
88 WORLD DEVELOPMENT REPORT 2005
06_WDR_PO2_Ch04.qxd 8/24/04 3:56 PM Page 88

remove obstacles to international arbitrationas well, by joining relevant international con-ventions and ensuring effective mechanismsexist to enforce the resulting awards. Forexample, the Russian government recentlyclarified that awards by internationalarbitrators in disputes involving minorityshareholders in Russian corporations areenforceable in domestic courts. The role ofinternational dispute settlement mecha-nisms is discussed further in chapter 9.
Reducing crimeRobbery, fraud, and other crimes againstproperty and against the person underminethe investment climate. Rampant crime dis-courages firms from investing and increasesthe costs of business, whether through thedirect loss of goods or the costs of takingprecautions such as hiring security guards,building fences, or installing alarm systems.In the extreme, foreign firms will decline toinvest, and domestic ones will flee the coun-try for a more peaceful locale.
Estimates compiled in 2000 show thedevastating impact of violent crime andproperty crime on the economies of sixLatin American nations. In Colombia andEl Salvador almost one-quarter of nationalGDP was lost to crime; only in Peru was thecost of crime less than 10 percent of grossdomestic product (figure 4.5).
The World Bank’s Investment ClimateSurveys show that crime retards entrepre-neurial activity in every region. In LatinAmerica more than 50 percent of firms sur-veyed judged crime to be a serious obstacleto conducting business. In Sub-SaharanAfrica and East Asia more than 25 percentor more said the same (figure 4.6).
The impact of crime varies by country.In Nigeria the Investment Climate Surveyshows 37 percent of respondents identifycrime as a major or severe constraint ontheir operations, in Zambia 50 percent, andin Kenya 70 percent. In Guatemala an extra-ordinary 80 percent of surveyed firms saidthat crime is a major or severe constraint.Crime tends to have a similar effect on firmsof all sizes. One exception is Bangladesh.Although 45 percent of medium and largefirms say crime is a constraint, only 20 per-
cent of the small ones do.A 2002 survey of 400 Jamaican firms
offers further insights into the way crimecan affect incentives to invest.52 Just undertwo-thirds of firms surveyed reported beingthe victim of some kind of property crimeduring 2001, with many firms repeatedlyvictimized. More than one-fourth had prop-erty stolen once a quarter, with 9 percentreporting theft once a week, and 22 percentsaying they were defrauded at least once aquarter. Firms of all sizes and locations werevictimized. Eight of 10 farmers reportedequipment or livestock stolen. Financialfirms were most vulnerable to fraud. Manu-facturing, distribution, and constructioncompanies all reported significant theft andfraud. Smaller firms were more likely to bevictims, and more often, than larger firms.Extortion, fraud, robbery, burglary, and
Stability and security 89
0 10Cost of crime as a percentage of GDP
20 30
Peru
Brazil
RB de Venezuela
Mexico
Colombia
El Salvador
Note: Data cover 1999–2000.Source: Londoño and Guerrero (2000).
Figure 4.5 Crime takes a heavy toll on many LatinAmerican economies
40
20
Firm
s re
porti
ng c
rime
a m
ajor
or m
oder
ate
cons
train
t on
doin
g bu
sine
ss (p
erce
nt)
0
60
East Asia & Pacific
Sub-Saharan Africa
South Asia
Latin America& the Caribbean
Eastern Europe& Central Asia
Source: World Bank Investment Climate Surveys.
Figure 4.6 Crime is a significant constraint on firmsin all regions
06_WDR_PO2_Ch04.qxd 8/24/04 3:56 PM Page 89

arson caused 116 of 400 firms to sufferlosses amounting on average to J$665,000(around $11,000). The cost of crime as apercentage of revenue was 9 percent forsmall firms and firms with J$20-50 millionin annual revenues. Manufacturing firmsreported that crime cost them nearly 6 per-cent of annual revenues.
When government is not strong enoughto protect property rights, private organiza-tions selling “protection services” fill the void.Some private security services cooperateclosely with the police. Others are not nearlyso law abiding. “Violent entrepreneurs,” as arecent analysis of organized crime in Russialabeled them, rely on force and intimidationand often end up demanding a share of theprofits of the firms they “protect.”53 Whilerespondents to the World Business Environ-ment Survey said that organized crime hasless impact on their business than streetcrime, the Jamaica survey suggests the datamay understate its effect. Many businesses arereluctant to admit they are victims of extor-tion, either from shame or for fear of violentreprisal.
Firms can do much to reduce propertycrime—from installing burglar alarms toposting security guards. But there are limitsto what they can achieve without govern-ment assistance. Property crime is rarely acrime of passion, suddenly triggered byoverwhelming feelings of jealousy, betrayal,or rage. Instead, as analysts have recognizedfor more than two centuries, it is almostalways motivated by a calculation, howeverrough, of the benefits to be gained againstthe consequence of apprehension and pun-ishment (box 4.8).54
Combating crime is a major challenge inall societies, rich and poor. Experience sug-gests that governments can change theincentives for criminals through better lawenforcement, stronger deterrence, and moreeffective crime prevention programs.
Better enforcementApprehending and punishing criminals is aclassic government function, but one oftennot performed with great efficiency. Reac-tive policing, where police simply receivereports from victims and then attempt toapprehend the responsible party, is notori-ously ineffective. Modern policing is “prob-lem oriented.” It attempts to identify recur-ring crime problems and—with othergovernment agencies and civil society—change the conditions leading to theseproblems. The approach emphasizes crimemapping, working with communities, andinvestigative techniques, rather than a gen-eralized “get tough on crime” approach.Nor can policing be separated from humanrights concerns: force may be required tocapture and detain suspects, and the policeneed to be accountable to multiple con-stituencies when they use it.
Stronger deterrenceGovernment can also improve the deterrenteffect of its criminal justice system. Are thepenalties for theft, robbery, and other prop-erty crimes enough to alter a thief ’s cost-benefit calculus? Are they applied consis-tently? How effective is the overall system atpreventing and deterring crime?
No matter the penalties, criminal law isonly as effective as those who enforce it. Thepolice are the frontline enforcement agency,and any crime reduction initiative must
90 WORLD DEVELOPMENT REPORT 2005
Evidence from a single country over time orfrom many at one point in time shows thatan increase in relative poverty or incomeequality leads to a rise in crime. One studydrawing on data from developing countriesfinds that a relatively modest increase ininequality would produce an averageincrease in robberies of 30–45 percent.Another study suggests that a 5 percentdrop in GDP would produce an immediate50 percent jump in the robbery rate.
According to one view this relation-ship follows as a matter of economiclogic. The decision to commit a crimedepends on whether the return,discounted by the likelihood of apprehen-sion and punishment, exceeds the gainfrom working. The more unequal the dis-tribution of income and wealth in a soci-ety, the larger the potential gains fromcrime for those at the bottom of the scale.
Another view is that inequality is associ-ated with discrimination and other socialfactors that affect character formation—and is thus the “real” cause of crime.
Study after study affirms the greatpower of the economic explanation. But
there is always a residual, something leftover after all economic factors are included,that explains part of the crime rate. Thisresidual becomes more significant as thetime frame lengthens. Long-run changes inthe crime rate appear to respond to soci-etal forces largely independent ofeconomic ones.
Several policy implications follow fromwhat is known. One is the importance ofreducing relative poverty and inequality,not only for reasons of social justice, but forthe very practical reason that it is a sureway to cut crime rates. A second is thatsharp increases in relative poverty orinequality call for an immediate response.Both crime prevention and crimedeterrence programs need to be expandedto dampen the inevitable rise in crimelikely to follow. Third, each society needs toexamine what accounts for the part of thecrime rate not explained by economic fac-tors. In other words, what shapes the char-acter of its citizens?
Source: Bourguignon (2000); Demombynes andÖzler (2002); and Wilson (1991).
B O X 4 . 8 Crime, poverty, and inequality
06_WDR_PO2_Ch04.qxd 8/24/04 3:56 PM Page 90

begin with ensuring their effectiveness. Butpolice reform is a challenge—for developedand developing countries alike. It is hard tomonitor the actions of individual officers onpatrol or to prescribe how they should handlethe variety of often dangerous situations theyconfront on a daily basis. Difficult workingconditions coupled with the sometimes hos-tile relations between police and citizens tendto isolate the police, creating a strong sense ofloyalty among officers, and making externaloversight and accountability difficult.
Despite these hurdles, some promisingapproaches emerged in the 1990s under therubric of community policing (box 4.9).Although the details differ across countries,and even within countries, such policingincludes one or more of the following:
• Assigning officers to foot patrols so thatthey can concentrate on those offensesthat are major annoyances to local resi-dents and firms and build relationshipswith the community
• Meeting regularly with individuals andfirms to hear their views on police priorities
• Analyzing trends and focusing effortsrather than responding to each individ-ual crime as a report comes in.55
Putting police into the communityincreases their accountability and providescitizens with a greater voice in their opera-tions. Community policing contributes tomore effective policing as well. Police solvevery few crimes on their own, fewer than 10percent in a recent U.S. study. Victims andwitnesses from the community have to comeforward with information about the perpetra-tors for police to improve on this figure.As theSouth African police have learned, by forgingstronger ties between the police and citizens,community policing has furthered coopera-tion between the two, leading to higher arrestrates and greater respect for human rights.56
More effective preventionGovernments need to resist the temptationto look for answers only within the confinesof the criminal justice system. Several recentstudies show that well-designed crime pre-vention programs are more cost-effectivethan criminal justice approaches.57 A classicstudy in the United States found that forevery dollar invested in prevention pro-grams, six to seven dollars could be saved incriminal justice expenditures.58 Effective pre-vention strategies include early interventionsfor at-risk teens, school-based initiatives to
Stability and security 91
In the mid-1990s crime rates in New York City felldramatically. Murders plunged 68 percent, bur-glaries 53 percent, and car thefts 61 percent.Thisextraordinary turnaround in crime helped sup-port an economic renewal as employment, prop-erty values, and the growth rate rose sharply.
Much of the credit for this achievement isattributed to police reforms introduced byWilliam Bratton during his tenure as head ofNew York City’s Police Department from 1994 to1996.The reforms were built around two princi-ples: wholesale changes in management, toreward those who succeeded in combatingcrime while penalizing those who didn’t, and aproactive crime-fighting strategy.
Incentives. Bratton inherited a departmentwhere promotion depended not on arrestingcriminals but on avoiding scandals, conflicts withthe community, and indeed any activity thatmight make waves. After long consultations withofficers and other stakeholders, some 400changes were made in the way the departmentoperated. Recruiting standards were raised, train-ing was improved, and disciplinary procedureswere modernized. Most important, power was
devolved to precinct commanders, the depart-ment’s line managers, and a new career systemrewarded commanders who reduced crime rates.
Strategy. Department personnel developeda new computerized data management systemto rapidly compile crime statistics and plotemerging trends and the locations of crime.“Compstat” turned out to be critical to the entirereform process. By providing weekly totals ofcrime and arrests by precinct and comparingthem to historical data, supervisors could evalu-ate the performance of the precinct comman-ders, which they did at weekly strategy sessions.The system also allowed the department toadopt a new strategy. Rather than react to indi-vidual crime reports, managers could spotevolving patterns and redeploy personnelaccordingly. At the same time the police beganconcentrating on the infrastructure thatsupports individual crimes. Instead of targetingindividual car thieves, they went after those whodealt in stolen automobiles, thus shrinking thethieves’ market.
Exportable? Several Latin American citieshave begun experimenting with different
aspects of the New York City reforms. Fortaleza,a resort stop on the Brazilian coast, has createdits own version of Compstat and is striving toimprove police-citizen relations. Chile adoptedseveral New York City–style reforms, includingthe redeployment of police to high-crime areas,more policing on foot, and better methods ofcollecting and analyzing crime statistics.
Bratton acknowledges that New York City’sexperience must be adapted to the very differ-ent cultures and crime environments in thedeveloping world, where the police are oftennot yet fully subject to civilian control andrespect for citizen rights can be weak. Even so,the underlying principles—devolving power tolocal commanders, holding them accountablefor results, building citizen confidence in thepolice, and adopting proactive crime fightingstrategies—are as applicable in Santiago or For-taleza as in New York’s toughest neighborhoods.
Source: Bratton and Andrews (1999); Lifsher (2001);Fundación Paz Ciudadana (2001, 2002); Webb-Vidal(2001); and Bratton and Andrews (2004).
B O X 4 . 9 New York City’s police reforms—are they exportable?
06_WDR_PO2_Ch04.qxd 8/24/04 3:56 PM Page 91

teach social competency skills and reduce vio-lence in and around schools, and other pro-grams to build character and foster commu-nity responsibility.59 Emerging evidence fromColombia shows that handgun control andrestrictions on the sale of liquor can reduceviolent crime significantly.60 Situational crimeprevention—in which physical space is modi-fied to make the commission of a crime morerisky or less lucrative for the potentialoffender—is a promising prevention strategyfor housing ministries or local governments.61
Government can also take some of theprofit out of organized crime by reducing theregulatory burden on firms. Surveys of retailstores in three Russian cities show that pro-tection rackets and other forms of organizedcrime flourish when the regulatory burden ishigh.62 As the regulatory burden increases,store owners are less able to comply with therules and thus more reluctant to call on stateagencies to protect them from criminals orenforce their contracts. Organized criminalsthen step forward to meet the demand.
Ending the uncompensatedexpropriation of propertyThe discussion so far has focused on howgovernments can help firms cope with threatsto their property rights from third parties. Aschapter 2 showed, however, government canitself threaten the security of property rights.A government strong enough to protectproperty is also strong enough to take it.63
All governments reserve the right to takeproperty in some circumstances.64 To combathealth emergencies, government must be ableto order the destruction of livestock or poul-try spreading disease. Without the power totake land, those holding parcels needed tocomplete an expressway can “hold up” gov-ernment by demanding unreasonable pricesto sell. The taking, or expropriation, of prop-erty can also be a more efficient means ofobtaining it for public purposes than openmarket purchases. When an undergroundwater pipe must traverse a large number ofproperties, the costs of reaching an agreementon price with each individual owner will befar greater than setting a price by decree.
Governments have also seized privateproperty where the public interest was less
clear. Mass expropriations usually occur inthe wake of violent upheavals, as when thepost-1917 government in Russia or those inpower in Eastern and Central Europe afterWorld War II seized private property. Sincethen, expropriation has been most com-monly associated with the nationalizationof foreign investments, though recent expe-rience in Zimbabwe shows that local firmsare not immune (box 4.10).
Property need not be taken in its entirety,or in a single stroke, to constitute a “taking” or“expropriation.” Taxes may be progressivelyraised to confiscatory levels or regulationsmade so onerous that an owner is forced tosell all or part of the property at a depressedprice. While the outright expropriation of for-eign investments has become less common inrecent times, these forms of indirect or “creep-ing” expropriation have grown significantly.65
Foreign investors are often particularlyvulnerable, because it may be politicallyattractive for politicians to target foreigners,and local courts may be reluctant to ruleagainst the host government if a disputearises. Large and immobile investments areespecially at risk. Because they cannot bemoved to another location in response tochanging circumstances, they constitutewhat Vernon called an “obsolescing bargain,”being exposed to host government efforts torenegotiate unilaterally the terms of the orig-inal agreement.66 Foreign investments in pri-vate infrastructure projects have both thesefeatures—and are often in politically sensi-tive sectors with returns subject to regula-tion, making them even more vulnerable.67
The threat of expropriation varies fromproject to project, even in a single country.68
While not amenable to precise measure-ment, the risk of expropriation is reflected inmeasures of “country risk” or “political risk”prepared by various rating agencies (figure4.7). Some governments have credible mech-anisms to restrain these threats and, coupledwith a history of treating investors fairly,investments in these countries are perceivedto involve only modest risks. Other govern-ments have not yet established the samerecord—or have not been able to crediblycommit to restrain such risks. When this isthe case, investors will decline to invest, avoidundertaking investments that are difficult to
92 WORLD DEVELOPMENT REPORT 2005
06_WDR_PO2_Ch04.qxd 8/24/04 3:56 PM Page 92
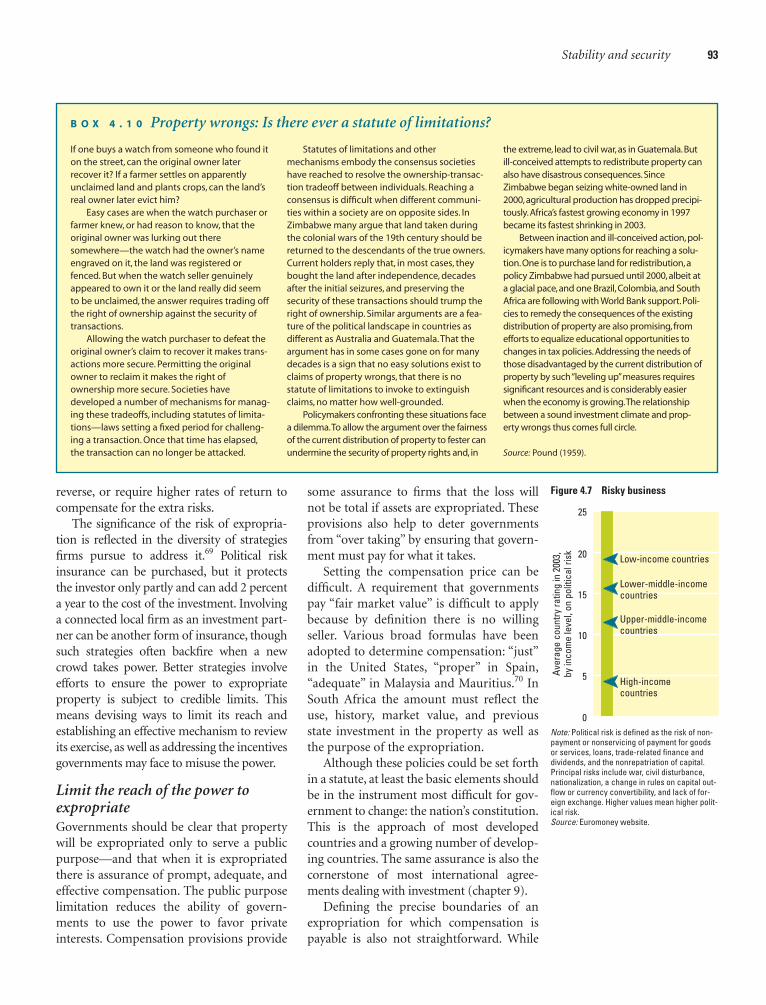
reverse, or require higher rates of return tocompensate for the extra risks.
The significance of the risk of expropria-tion is reflected in the diversity of strategiesfirms pursue to address it.69 Political riskinsurance can be purchased, but it protectsthe investor only partly and can add 2 percenta year to the cost of the investment. Involvinga connected local firm as an investment part-ner can be another form of insurance, thoughsuch strategies often backfire when a newcrowd takes power. Better strategies involveefforts to ensure the power to expropriateproperty is subject to credible limits. Thismeans devising ways to limit its reach andestablishing an effective mechanism to reviewits exercise, as well as addressing the incentivesgovernments may face to misuse the power.
Limit the reach of the power toexpropriateGovernments should be clear that propertywill be expropriated only to serve a publicpurpose—and that when it is expropriatedthere is assurance of prompt, adequate, andeffective compensation. The public purposelimitation reduces the ability of govern-ments to use the power to favor privateinterests. Compensation provisions provide
Stability and security 93
some assurance to firms that the loss willnot be total if assets are expropriated. Theseprovisions also help to deter governmentsfrom “over taking” by ensuring that govern-ment must pay for what it takes.
Setting the compensation price can bedifficult. A requirement that governmentspay “fair market value” is difficult to applybecause by definition there is no willingseller. Various broad formulas have beenadopted to determine compensation: “just”in the United States, “proper” in Spain,“adequate” in Malaysia and Mauritius.70 InSouth Africa the amount must reflect theuse, history, market value, and previousstate investment in the property as well asthe purpose of the expropriation.
Although these policies could be set forthin a statute, at least the basic elements shouldbe in the instrument most difficult for gov-ernment to change: the nation’s constitution.This is the approach of most developedcountries and a growing number of develop-ing countries. The same assurance is also thecornerstone of most international agree-ments dealing with investment (chapter 9).
Defining the precise boundaries of anexpropriation for which compensation ispayable is also not straightforward. While
If one buys a watch from someone who found iton the street, can the original owner laterrecover it? If a farmer settles on apparentlyunclaimed land and plants crops, can the land’sreal owner later evict him?
Easy cases are when the watch purchaser orfarmer knew, or had reason to know, that theoriginal owner was lurking out theresomewhere—the watch had the owner’s nameengraved on it, the land was registered orfenced. But when the watch seller genuinelyappeared to own it or the land really did seemto be unclaimed, the answer requires trading offthe right of ownership against the security oftransactions.
Allowing the watch purchaser to defeat theoriginal owner’s claim to recover it makes trans-actions more secure. Permitting the originalowner to reclaim it makes the right ofownership more secure. Societies havedeveloped a number of mechanisms for manag-ing these tradeoffs, including statutes of limita-tions—laws setting a fixed period for challeng-ing a transaction. Once that time has elapsed,the transaction can no longer be attacked.
Statutes of limitations and othermechanisms embody the consensus societieshave reached to resolve the ownership-transac-tion tradeoff between individuals. Reaching aconsensus is difficult when different communi-ties within a society are on opposite sides. InZimbabwe many argue that land taken duringthe colonial wars of the 19th century should bereturned to the descendants of the true owners.Current holders reply that, in most cases, theybought the land after independence, decadesafter the initial seizures, and preserving thesecurity of these transactions should trump theright of ownership. Similar arguments are a fea-ture of the political landscape in countries asdifferent as Australia and Guatemala.That theargument has in some cases gone on for manydecades is a sign that no easy solutions exist toclaims of property wrongs, that there is nostatute of limitations to invoke to extinguishclaims, no matter how well-grounded.
Policymakers confronting these situations facea dilemma.To allow the argument over the fairnessof the current distribution of property to fester canundermine the security of property rights and, in
the extreme, lead to civil war,as in Guatemala.Butill-conceived attempts to redistribute property canalso have disastrous consequences.SinceZimbabwe began seizing white-owned land in2000,agricultural production has dropped precipi-tously.Africa’s fastest growing economy in 1997became its fastest shrinking in 2003.
Between inaction and ill-conceived action,pol-icymakers have many options for reaching a solu-tion.One is to purchase land for redistribution,apolicy Zimbabwe had pursued until 2000,albeit ata glacial pace,and one Brazil,Colombia,and SouthAfrica are following with World Bank support.Poli-cies to remedy the consequences of the existingdistribution of property are also promising, fromefforts to equalize educational opportunities tochanges in tax policies.Addressing the needs ofthose disadvantaged by the current distribution ofproperty by such “leveling up”measures requiressignificant resources and is considerably easierwhen the economy is growing.The relationshipbetween a sound investment climate and prop-erty wrongs thus comes full circle.
Source: Pound (1959).
B O X 4 . 1 0 Property wrongs: Is there ever a statute of limitations?
20
15
10
5Aver
age
coun
try ra
ting
in 2
003,
by in
com
e le
vel,
on p
oliti
cal r
isk
0
25
High-incomecountries
Lower-middle-incomecountries
Upper-middle-incomecountries
Low-income countries
Note: Political risk is defined as the risk of non-payment or nonservicing of payment for goodsor services, loans, trade-related finance anddividends, and the nonrepatriation of capital.Principal risks include war, civil disturbance,nationalization, a change in rules on capital out-flow or currency convertibility, and lack of for-eign exchange. Higher values mean higher polit-ical risk. Source: Euromoney website.
Figure 4.7 Risky business
06_WDR_PO2_Ch04.qxd 8/24/04 3:56 PM Page 93

creeping or indirect expropriation may takemany forms, governments cannot beexpected to compensate firms for everyaction that influences the value of theirproperty in some way. Routine adjustmentsto tax policies and regulatory regimes maymake some firms worse off but do not con-stitute an expropriation for which compen-sation should be paid. Detailed standardshave emerged in the laws, regulations, andcourt decisions of many countries, andmake it clear, for example, that a change toan environmental regulation that has a dif-fuse effect across a large number of firmsdoes not rise to a compensatory taking. Sim-ilar standards are emerging in the arbitra-tion cases decided under internationalinvestment treaties (chapter 9).
In devising their policies in these areas,governments must bear in mind that theyare not writing on a blank slate. Where theirpredecessors have recklessly expropriatedproperty, the current government may needto overcome the effects of a reputation thatit had no hand in making. Following a waveof expropriations in the 1980s under a lawproviding minimal compensation, Peruvianfirms in the early 1990s were reluctant toexpand operations or invest in new ones. Tohelp restore confidence the 1993 constitu-tion requires government to reimbursefirms for the actual value of any propertytaken and any “possible loss” as well. Where,for example, the land on which a factory islocated is taken for a highway, governmentmust not only pay for the land but alsoreimburse the owner for the costs of mov-ing the machinery and other equipment toa new location.
Establish a mechanism to review theexercise of the expropriation powerLimitations on the government’s power toexpropriate are credible only if means existto ensure that the limits will be respected.Ordinarily this will be a court separate fromthe executive. While courts in many devel-oping countries are gradually breaking freeof executive branch control, the history ofjudicial independence in developed coun-tries teaches that this process can take
decades. It requires not only a well-trainedand dedicated cadre of judges but vigorousand sustained political competition aswell.71
When domestic courts are weak, or theircredibility is low, government can agree tosubmit disputes involving expropriation toan international tribunal. As discussed inchapter 9, a growing number of interna-tional investment treaties provide for thisoption. Although these treaties deal withforeign investment, there are halo effects forlocal firms, and there is no reason why gov-ernments cannot agree to similar arrange-ments for local firms.
Create incentives against the misuseof the expropriation powerThe incentives governments face to misusethe expropriation power are ultimatelyinfluenced by the broader social and politi-cal context. As chapter 2 emphasized, tam-ing the “grasping hand” of government caninvolve a range of strategies, includingefforts to improve the accountability ofgovernments, enhance the transparency ofthe government-business interface, andstrengthen competition. No less importantis to foster a broad social consensus in favorof building a more productive society—including by ensuring that the opportuni-ties of a better investment climate areshared widely across society.
Expropriation is the most direct way govern-ments threaten the security of propertyrights and so dampen incentives to investproductively, but it is not the only way. Policyuncertainty and unpredictability also under-mine the value of property rights by creatingadditional risk for firms (chapter 2).
Governments also qualify property rightsthrough the ways they regulate and tax firmsand transactions. In these cases, the qualifica-tion of property rights is deliberate, andintended to balance the benefits of moresecure property rights with other social goals.Some of the special issues government mustgrapple with in striking that balance are thesubject of chapter 5.
94 WORLD DEVELOPMENT REPORT 2005
06_WDR_PO2_Ch04.qxd 8/24/04 3:56 PM Page 94

95
The way governments regulate and taxfirms and transactions—both within and attheir borders—plays a big role in shapingthe investment climate. Sound regulationaddresses market failures that inhibit pro-ductive investment and reconciles the inter-ests of firms with those of society. Soundtaxation generates the revenues to financepublic services that improve the investmentclimate and meet other social goals. Thechallenge all governments struggle with ishow to meet these objectives withoutundermining the opportunities and incen-tives for firms to invest productively, createjobs, and thereby contribute to growth andpoverty reduction.
There is huge scope in most countriesfor improving regulation and taxationwithout compromising broader socialinterests. Too often, governments pursueapproaches that fail to meet the intendedsocial objective, yet harm the investmentclimate. How? By imposing unnecessarycosts, by increasing uncertainty and risks,and by erecting unjustified barriers to com-petition.
Examples of regulatory problemsabound. Regulations to promote socialgoals are often enforced only partially—asis evident in the huge informal sectors inmost developing countries. Yet they canimpose significant burdens on firms that docomply—whether through the extraordi-nary requirements to set up a new businessor the long delays in getting goods throughcustoms. The interpretation and applica-tion of regulations can be unpredictable—creating uncertainty and risk for firms andinviting corruption. Regulations also createmonopolies or cartels for favored groups—imposing costs on consumers and otherfirms, and stifling incentives for the pro-
tected firms to innovate and boost theirproductivity.
Tax systems are plagued by similar prob-lems. Tax structures often benefit favoredgroups, distorting competition and foistinghigher taxes on others. And tax administra-tion can be burdensome, increasing compli-ance costs, reducing revenues, and openingthe way to corruption.
That such problems exist is hardly news.But new sources of evidence underline theextent of the problems and their impact onproductivity and growth. While the under-lying problems do not always have simplesolutions, a growing body of internationalexperience points to some practical stepsthat governments can take to improve theseareas of their investment climates. Thischapter takes a broad view and considersregulation and taxation behind and at acountry’s borders. It shows that there isgreat scope for improving performance.Later chapters look at specific challenges inregulating the financial system and infra-structure (chapter 6), regulating labor mar-kets (chapter 7), as well as issues associatedwith selective interventions (chapter 8) andthe use of international rules and standards(chapter 9).
Regulating firmsGovernments regulate firms in manyways—for many reasons. They regulate torestrict who may participate in a market,where firms may locate, the productionprocess used, the quality or other parame-ters of the goods and services produced,and the way products are marketed anddistributed. Indeed, it is hard to find anyaspect of a firm’s business and investmentdecisions that is not affected in some wayby regulation. While it is difficult to find a
Regulation and taxation
5c h a p t e r
07_WDR_Ch05.qxd 8/24/04 12:35 PM Page 95

single indicator that captures the manydimensions of regulation and the varia-tions in its intensity, recent work suggeststhat developing countries tend to regulatemore than richer countries in many areas(figure 5.1).
How, then, can governments makeprogress? The key is to strike a better bal-ance between market failures and govern-ment failures, and to ensure a good fit withlocal conditions. This requires efforts toaddress regulatory costs and informality, toreduce regulatory uncertainty and risk, andto tackle barriers to competition.
Balancing market and governmentfailures and achieving a goodinstitutional fitRegulation improves social welfare—andthe investment climate—when it respondsto a market failure cost effectively. Thisrequires an assessment of market failuresand government failures, and the extent towhich the proposed regulatory strategyreflects a good fit with local conditions.
Market failures. The usual rationale for reg-ulation is market failure, the three mostcommon of which are externalities, infor-mation problems, and monopoly.
• Externalities arise when producing orconsuming a product imposes costs (neg-ative externalities) or confers benefits
(positive externalities) on others. Pollu-tion is a classic negative externality: a firmthat releases pollution into a river canimpose costs on its neighbors fartherdownstream. If the firm fails to takeaccount of the effect of its pollution onothers, it will generate more than issocially optimal. Governments can recon-cile the firm’s incentives with those of thewider community by restricting pollu-tion. They may do this through tradi-tional command-and-control regulation,such as prohibiting certain activities orestablishing standards for acceptableeffluent levels, or they might fully assignproperty rights or tax the product thatcauses the negative externality.1
• Information problems arise when con-tracting parties have unequal access toinformation about the good or service inquestion. For example, consumers maylack reliable information about the qual-ity or safety of a product, or the qualifica-tions of a service provider. Regulationmay address these concerns in severalways. Over and above prohibiting fraudu-lent conduct, governments may requirefirms to disclose certain informationabout their products (as through productlabeling), require the safety of products tobe independently verified (as with drugsin many countries), or simply ban the saleof hazardous products.
• Monopoly arises when a firm (or group offirms acting in concert) has enough mar-ket power to raise prices above the com-petitive level and thereby extract higherprofits at the expense of consumers andeconomic efficiency. In assessing marketpower, competitive pressure is not limitedto direct head-to-head competitionbetween existing firms offering identicalproducts. It can also come from the threatof entry by new firms, as well as fromproducts that may be effective substitutes(rice might compete with beans for someuses). Governments can address monop-oly by removing unjustified regulatorybarriers to competition, by dealing withanticompetitive behavior by firmsthrough competition law, or in extremecases by regulating the price and qualityof the goods or services provided. Some
96 WORLD DEVELOPMENT REPORT 2005
Lessregulation
Moreregulation
Inde
x
Num
ber o
f pro
cedu
res
High-income
countries
Upper-middle-income
countries
Lower-middle-income
countries
Low-income
countries
66
30
11
63
27
56
2743
18
710
12
Entry procedures (number)
Court powers in bankruptcy (index)
Contractprocedures(number)
Note: Data from World Bank Doing Business Project.Source: World Bank (2004b).
Figure 5.1 Low-income countries tend to regulate more
07_WDR_Ch05.qxd 8/24/04 12:35 PM Page 96

countries have also used public owner-ship as a form of regulation, typicallywith poor results (box 5.1).
Government failure. Regulation thataddresses a market failure can benefit soci-ety and the investment climate. However,even when a market failure exists, it makessense to intervene only when the expectedbenefits exceed the likely costs. This involvesbalancing market failures with potentialgovernment failures. There are three com-mon sources of government failure:
• Information and capacity problems. Indesigning and implementing interven-tions, governments often face severeinformation problems. Governmentswill never have as much information asfirms about the impact of interventionson their costs or incentives. This is a par-ticular challenge in utility regulation, butcan arise in other areas as well. And theimplementation of some kinds of regu-lation demands a reasonable level of
technical expertise, the absence of whichcan undermine effectiveness.
• Rent-seeking. Regulation may be dis-torted by rent-seeking in its many forms(chapter 2). Firms or other groups mayseek regulation to protect them fromcompetition. Officials may use regulationto extract bribes in return for favorableinterpretations, quick decisions, or selec-tive enforcement, and regulated firmshave incentives to try to “capture” theirregulators through a range of strategies.
• Rigidity. Regulation tends to be rigid,making it hard to keep up with changesin technology or the way business is con-ducted. Indeed, many regulations indeveloping countries have not beenreviewed for many decades or longer.Part of the problem lies in inertia, butfirms, officials, or other interest groupsthat benefit from particular regulationscan have strong incentives to resistreform, no matter how beneficial it maybe to society.
Regulation and taxation 97
Modern notions of regulation involve a set ofexplicit rules that define acceptable conductthat are administered and enforced by an entityoperating at arm’s length from regulated firms.Some governments have also experimentedwith public ownership as a form of regulation.
Combining production and regulatory rolesinvolves an inherent conflict of interest. Experi-ence shows that this conflict—coupled withpolitical interference, protection from competi-tion, and weak accountability—often leads pub-lic enterprises to have dismal productivity.Thedramatic improvements unleashed through pri-vatization have highlighted how significant thecosts can be.
No less important, public enterprises indeveloping countries have a poor record inmeeting regulatory requirements. For example,state-owned enterprises in Indonesia werefound to emit more than five times as much pol-lution as similar private firms. State-owned pulpand paper plants in Bangladesh, India, Indone-sia, and Thailand also controlled pollution lesswell than similar private firms.
Several factors seem to be at work. First, dif-fuse objectives, political interference, and weakaccountability can conspire against good per-formance. Second, even when regulation isentrusted to a separate regulatory body, public
enterprises have weaker incentives to complywith regulations than private firms.While thethreat of being fined can motivate private firms,governments have only weak incentives to pros-ecute enterprises that they own, for both politi-cal and fiscal reasons.Third, public enterprisesthat depend on budget support, or whoseprices are regulated with political criteria inmind, often lack the resources to meet environ-mental or other regulatory standards.
Overall,public ownership has the potential toweaken the investment climate in three main ways:
• When public enterprises are responsible forproviding inputs relied on by private firms(such as power, telecommunications, orfinance), weaknesses in their productivity andincentives can contribute to higher costs andless reliable service, to the detriment of firms(and other consumers) dependent on thoseinputs (chapter 6).
• Public ownership can increase demands forcorrupt payments, because public managersusually have weaker incentives to reduce leak-age and graft. For example, firms in transitioneconomies are more likely to have to paybribes to get telecommunications and electric-ity services when they are provided by publicenterprises. Employees of state-owned power
companies in South Asia have developed ahighly organized system to extract bribe pay-ments from customers.The result can be highercosts for firms and reduced revenues for thepublic enterprise, reducing public investmentor increasing the burden on taxpayers.
• When public enterprises are granted a monop-oly,opportunities are denied to other firms.Even when competition is permitted betweenpublic enterprises and private firms, it is notori-ously difficult to create a level playing field.Theproblems are especially acute when the publicenterprise has a regulatory role,because it willface incentives to use that role to advance itsinterests over those of competitors—aphenomenon common in telecommunications.Even when such obvious conflicts of interesthave been addressed by moving regulatoryresponsibility to a more independent body,pressures to favor the interests of public enter-prises can continue.Public enterprises oftenalso enjoy a range of exemptions (by law or bypractice) from taxes and other regulations thatcan also distort competition.
Source: Clarke and Xu (2004); Djankov and Murrell(2002); Hettige and others (1995); Lovei and McKech-nie (2000); Megginson and Netter (2001); Shirley andWalsh (2000);Wheeler (2001); and World Bank (1995a).
B O X 5 . 1 Public ownership, regulation, and the investment climate
07_WDR_Ch05.qxd 8/24/04 12:35 PM Page 97
The challenge of “institutional fit.” As dis-cussed in chapter 2, interventions that workwell in one country may lead to very differ-ent results in others. This means the costsand benefits of intervention, and the choiceof regulatory strategy, need to take accountof local conditions. While there is amplescope to learn from regulatory experiencein other countries, too often regulatory sys-tems have been transplanted uncritically todeveloping countries from elsewhere.
Many developing countries inheritedtheir regulatory systems from former colo-nial powers. Particularly when the colonizingpower had little interest in establishing long-term settlements, there was little incentive toadapt approaches to the needs of the broadercommunity.2 Being largely irrelevant to con-ditions in the host society, the regulationswere often ignored, or used mainly as a leverfor officials or others to extract rents.3 Thosebenefiting from the status quo have incen-tives to resist reform, no matter how dys-functional the regulations may be for theinvestment climate. So the same laws andregulations often remain unchanged fordecades, even as laws in the source countryevolve. For example, Chile established arestrictive corporate law in 1854, based uponSpanish and French law from that time. Therestrictive law was maintained until 1981,when the code underwent a major revision.As a result, Chile did not adopt the principle
of free incorporation until a century afterFrance and Spain did so.4 In some cases thetransplanted laws remain in place today. Forexample, the law regulating business entry inthe Dominican Republic dates back to 1884.
The tendency to transplant laws and regu-latory systems from other countries contin-ues to this day.5 Regulatory systems in richcountries can seem a convenient way to mod-ernize regulation by offering a proven systemthat is familiar to foreign investors, or foreignexperts advising on these matters may simplybe more familiar with the approach in theirhome country. But in many cases adaptationto local conditions is required, and without ittransplanted approaches can lead to poorresults.6 Regulatory standards may be set atunrealistic levels relative to local circum-stances, contributing to compliance prob-lems, informality, and unjustified costs.Approaches may not fit easily with relatedparts of the policy and regulatory framework,generating additional uncertainty and risk.Or regulatory systems may involve high levelsof discretion relative to the effectiveness oflocal institutional safeguards. Experience inJamaica’s telecommunications sector illus-trates the hazards of the last phenomenon(box 5.2).
Government failures and poor institu-tional fits combine to create many distortionsin regulatory approaches that harm theinvestment climate in developing countries.
98 WORLD DEVELOPMENT REPORT 2005
Regulatory systems for utilities need to reconcilethe investor’s need to receive a reasonable rateof return on an investment with the concern thata firm with monopoly power can misuse it to thedetriment of consumers (chapter 6). A variety ofapproaches to reconcile these interests havedeveloped around the world. In the UnitedStates the system involves giving substantial dis-cretion to an independent regulatory agency,with legislative guidance on tariffs often definedonly as “fair”or “just.”Discretion of this breadthon an issue as politically sensitive as tariffs is asource of considerable risk to investors in capital-intensive sectors with immobile assets.Thoserisks have been mitigated in the United States,however, by a series of Supreme Court decisions,dating from the 1890s, that have interpreted theConstitution in ways that create safeguards forinvestors in regulated industries.
In 1965 Jamaica adopted a regulatory systemmodeled closely on those in the United States.TheJamaica Public Utilities Commission wasauthorized to determine a “fair”rate of return butlacked the complementary institutional safeguardsthat developed over decades in the United States.The commission became politicized,and despiteincreased inflation and the need to expandservices,the private phone company was notgranted a single rate increase between 1962 and1971.The company’s profits fell and after 1970failed to cover the real depreciation of its assets.Service deteriorated and disputes developed, lead-ing to the company’s nationalization in 1974.
With poor service and a shortage of fundsfor investment under public ownership, the gov-ernment reintroduced private participation inthe telephone company in 1985.This time, tocompensate for the lack of broader institutional
safeguards, the discretion of the regulatoryagency was reduced considerably.The licenseguaranteed the private operator a fixed rate ofreturn based on shareholder equity and allowedfor arbitration when the government and theinvestor could not agree on rates. In 1995Jamaica undertook more wide-ranging changesto its regulatory system for utilities, replacing thePublic Utilities Commission with a new Office ofUtility Regulation.While the new agency hassome discretion, the new law retained a mecha-nism for providing specific pricing and othercommitments to investors through contracts,thus helping to mitigate the risks of a traditionalU.S.-style agency operating in a country with lessdeveloped institutional safeguards.
Source: Spiller and Sampson (1996); Phillips (1993);and Jamaica Office of Utility Regulation Act.
B O X 5 . 2 Regulating in Jamaica—from transplants to better institutional fit
07_WDR_Ch05.qxd 8/24/04 12:35 PM Page 98
Tackling those problems requires a three-pronged approach:
• Addressing regulatory costs and infor-mality
• Reducing regulatory uncertainty andrisk
• Removing unjustified barriers to compe-tition.
Addressing regulatory costs and informalityAll regulations can impose costs on firms,whether in the need to adapt businessprocesses to meet regulatory requirements, topay licensing fees, to await delays in obtainingregulatory approval, or to spend managementtime dealing with officials. A good investmentclimate does not seek to eliminate thosecosts—instead, it seeks to ensure they are nohigher than necessary to meet social interests(box 5.3). The goal is thus better regulation,not no regulation. Too often the costs areunnecessarily high as a result of rent-seeking,inefficient administration, poor institutional
fit, or a combination of these. Regulation thatimposes costs beyond the expected social ben-efits is usually regarded as red tape.
A growing body of evidence highlightsthe toll of outdated or ill-considered regula-tions on the investment climate. Recentstudies looking at the effect of regulation inOrganisation for Economic Co-operationand Development (OECD) economies showthat both investment and the productivity ofthat investment are lower in countries wherethe regulatory burden is greater.7 The effectcan be large. For example, it has been esti-mated that reducing the burden of transportregulation in Italy to the level in the U.S.could increase the investment rate in thatsector by 2.6 percentage points.8
Recent work focusing on objective mea-sures of the compliance costs for particularregulations highlights the wide variationsacross countries. For example, the WorldBank’s Doing Business Project shows that thetime to set up a new business ranges from 2days in Australia and 9 days in Turkey tomore than 200 days in Haiti.9 The overall
Regulation and taxation 99
As it became easier for goods and investmentsto flow across borders in the 1990s, concernarose that a race to the bottom in environmen-tal regulation might follow. For goods that canbe transported between countries, firms mightchoose to produce in locations with low envi-ronmental standards and then export to coun-tries with higher standards.The concern is thatcountries with high standards would find them-selves at a disadvantage and, as capital left theireconomy, would feel under pressure to relaxtheir own standards to stem the outflow. Coun-tries with already low standards might reducethem further to vie for footloose investment.Sofar, however, there is little evidence to supportsuch concerns.There seem to be three mainexplanations.
Environmental regulation is only one partof the investment decisionThe cost of complying with environmental regu-lation can influence firms’ investment decisions,but it is only one of many factors, and theweight given to it will vary by firm, by industry,and by location. Polluting industries tend to becapital intensive, which means investors tend toplace a high premium on the broader policyenvironment, particularly political and regula-tory risk. Costs associated with environmentalregulation might carry more weight in invest-
ment decisions between two locations that areotherwise highly comparable, such as states inthe United States or countries in Europe.
But developing countries tend to face disad-vantages relative to developed countries on thisbroader set of criteria, so differences in environ-mental regulation tend to carry less weight.Indeed, a recent study of foreign direct invest-ment (FDI) in developing countries found noevidence that environmental standards signifi-cantly affected investment decisions.
Society’s preferences for higher standardsrise with incomeAs societies prosper, the value they place onhigher environmental standards tends toincrease. Environmental quality appears to haveimproved, rather than deteriorated, in manycountries over the past decade. For example, airpollution in industrial areas fell in the 1990s inBrazil, China, and Mexico—three developingcountries that have received significant FDI. Ascountries improve their broader investment cli-mates and experience faster economic growth,there is likely to be pressure for more environ-mental regulation, not less.The preferences ofcitizens in high income countries for high stan-dards of environmental protection also show nosigns of abating, further reducing the risk of acollapse in standards. Indeed, the race, if there is
one, may be to the top rather than the bottomas countries become more prosperous.
Incentives to comply with higherstandards are already strongMultinational firms often have stronger incen-tives to comply with higher environmental stan-dards than local regulations require, bothbecause of advantages in adopting commontechnologies and standards across the countriesin which they operate, and also to protect theircorporate reputations. Indeed, the evidence sug-gests that multinational firms tend to exceedlocal regulatory requirements in many areas.
Concerns about a possible race to the bot-tom need to be distinguished from the possibil-ity of low environmental standards in onecountry reducing the environmental quality ofother countries by producing effluents thatflow across national boundaries. Theinternational community has been addressingthese concerns in recent decades, includingthrough a host of new international rules andstandards (chapter 9).
Source: Copeland and Taylor (2004); Wheeler (2001);Becker and Henderson (2000); Dowell, Hart, andYeung (2000); Frankel (2003); Greenstone (2002);Jaffe and others (1995); Keller and Levinson (2002);Klein and Hadjimichael (2003); and List and others(2003).
B O X 5 . 3 Environmental regulation and global integration
07_WDR_Ch05.qxd 8/24/04 12:35 PM Page 99

pattern is that delays are greater and costshigher in low-income countries (figure 5.2).
When compliance costs are the same forfirms of different sizes, they impose a dis-proportionate burden on smaller firms. InTanzania small formal firms, on average,pay an amount equal to about 0.4 percent oftheir sales for an operating license—largeenterprises pay only about 0.01 percent.10
Other regulations can also be a greater bur-den for small firms because it is (relatively)
more costly for them to hire professionalsto help them complete bureaucratic proce-dures. Large firms in Peru are almost threetimes as likely as small firms to hire lawyersto help them complete application proce-dures for licenses and permits.11 Other costsare greater for large firms: managers of largefirms spend more time dealing with govern-ment regulations, and large firms are alsomore likely to be inspected than small firms(figure 5.3).
When it is costly to comply with regula-tion, firms have an incentive to evade thesecosts through informality. By staying infor-mal, firms can reduce—but not completelyeliminate—compliance costs (figure 5.3).Informality is widespread in many develop-ing countries, often accounting for morethan half of GDP.12 The fact that most ofthe economy is not complying with regula-tions raises fundamental questions aboutthe effectiveness of the chosen regulatorystrategy.
The answer is not simply to apply greaterefforts to enforce all existing regulations.Unless the regulations themselves are wellconsidered, this may just put a dispropor-tionate burden on poor entrepreneurs in theinformal economy and lead to perverseresults. Efforts are required to first see if theregulation is necessary to meet an importantsocial objective and, if so, whether theexpected social benefits outweigh the likelycosts. A growing number of countries arenow focusing on reducing requirements forbusiness registration in this light, with posi-tive results. For example, when the munici-pal government of La Paz, Bolivia, reducedthe number of procedures required to regis-ter a business, the number of registered busi-nesses increased by 20 percent.13 Even largergains have been observed in Vietnam andUganda (box 5.4).
Governments are also making efforts tostreamline other regulatory approvalprocesses. This may involve using informa-tion technology that allows on-line process-ing of regulatory approvals as in the case ofSingapore (box 2.15) or the creation of“one-stop shops” (box 5.5). To encourageagencies to act upon approvals quickly,more countries are also adopting “silence asconsent” rules for some licenses and per-
100 WORLD DEVELOPMENT REPORT 2005
0
40
80
0
20
40
80
Cost
(per
cent
of G
NI p
er c
apita
)
Days
120
160
High-incomecountries
Middle-incomecountries
Low-incomecountries
Cost of starting a business (left axis)Days to start a business
60
Note: Based on median cost as percent of gross national income (GNI) per capitaand median days reported in the World Bank Doing Business Project.Source: World Bank (2004b).
Figure 5.2 Starting a new business takes longer and is morecostly in developing countries
15
10
5Perc
ent o
f man
agem
ent t
ime
Num
ber o
f ins
pect
ions
0
20
15
10
5
0
20
Microinformal(1–10)
Inspections
Percent of managementtime spent dealing with government regulation
Microformal(1–10)
Small(10–20)
Medium(20–50)
Firms & number of employees
Large(50–250)
Extralarge
(250 & up)
Note: Data covering firms in Bangladesh, Brazil, Cambodia, Guatemala, India, Indonesia, Kenya, Pakistan, Tanzania,and Uganda. Source: World Bank Investment Climate Surveys and WDR Surveys of Micro and Informal firms.
Figure 5.3 Larger firms spend more time dealing with regulations and are inspected more often
07_WDR_Ch05.qxd 8/24/04 12:35 PM Page 100

mits.14 If the licensing office does notrespond within a set period of time, thelicense is issued automatically. The Bank’sDoing Business Project shows that businessregistration takes an average of 28 days lesswhen a time limit is combined with a silentconsent rule.15
Reducing regulatory uncertaintyand riskRegulations can increase the risks firms facewhen the regulations change frequently, arevaguely drafted, or are interpreted orenforced inconsistently. The result in eachcase is greater uncertainty, which makes it
Regulation and taxation 101
The high cost of business registration discour-ages new firms from entering the formal econ-omy.Vietnam and Uganda illustrate successfulstrategies for reducing these costs.
VietnamBefore a new Enterprise Law was enacted in Jan-uary 2000, business registration and licensingrequirements were extremely burdensome inVietnam. Entrepreneurs were required to submitdetailed business plans, curricula vitae, characterreferences, medical certificates, and other docu-ments along with their applications for registra-tion. On average, registering a business tookabout three months, and required visits to 10different agencies and submissions of about 20different documents with official seals.Additional licenses were often required beforefirms could start operating. Some of theselicenses did not appear to serve vital publicinterests (such as those to operate photocopy-
ing machines). It took 6 to 12 months to fulfillthe legal requirements to establish a business ata cost of $700 to $1,400.
The new law reduced the costs of establish-ing a new business.The time to establish a newbusiness came down to about two months—with business registration taking only 15 days—and total start-up costs were reduced to about$350.Vietnamese entrepreneurs responded.Fewer than 6,000 new businesses had registeredin 1999, but the number shot up to more than14,000 in 2000 and to more than 21,000 in both2001 and 2002.
UgandaA recent pilot program in Entebbe reduced thetime and monetary costs to register a business.By streamlining licensing processes and reduc-ing the number of previously requiredapprovals and assessments, the time to registera business was reduced from two days to about
30 minutes.This reduced the cost of registeringa business by 75 percent. Although businessregistration is only one of several steps to start anew business in Uganda (businesses have toregister for tax purposes and many need addi-tional licenses), the cost can be significantbecause registration needs to be repeatedannually for most businesses.
The pilot program increased business regis-trations, with an estimated four times as manybusinesses registering in Entebbe the year afterthe pilot. Despite the lower fees, the highernumber of registrations meant that revenue col-lections increased by 40 percent.With adminis-trative savings of 25 percent in staff time and 10percent in financial resources, the program alsobenefited the municipal authority.
Source: Vietnam: Mallon (2004); and Uganda: Sander(2004).
B O X 5 . 4 Easing business registration requirements in Vietnam and Uganda
In many countries firms have to receiveapprovals from a range of different agenciesbefore they can start operating: one to registerthe business, another to register for taxes,another to get environmental approvals,another for health and safety clearances, and soon.To reduce this burden some governmentshave established “one-stop shops” where firmscan find all the information and complete all theregulatory procedures that they need to startoperating a business in a given jurisdiction.
One approach would be to give a singleagency the power to grant all licenses, permits,approvals, and clearances necessary for a newfirm to start operating. In practice this is difficult.Existing ministries and agencies often resist sur-rendering their powers to a new agency. More-over, to the extent that approvals are a responseto a valid policy concern, the one-stop shopwould need to duplicate expertise and facilitieselsewhere in the government. Of course, if theapprovals do not meet valid policy objectives,the procedures could simply be eliminated.
Because of these considerations, most one-stop shops have narrower mandates, with
authority to grant some approvals and provideassistance on others. For approvals that remainthe responsibility of other agencies, the one-stop shops may house staff from the relevantagencies or simply pass the applications on tothem. Even when the staff from other agenciesthat are housed at the one-stop shop are unableto approve the application themselves, they canoften facilitate the approval process.
The Tanzania Investment Center houses ninesenior officials from other ministries, and normallymanages to turn around applications within a fewdays.The rapid turnaround is due in part to a “noobjection”provision written into the investmentcode—unless a ministry objects within 14 days,the Center is entitled to approve the application.
This approach has been less successfulwhen the lines of authority are not clearlydrawn. After being set up in 1987, the One-StopAction Center in the Philippines housed repre-sentatives from seven agencies who wereresponsible for providing information to appli-cants and acting on some applications. Lack ofeffective agency representatives—and the non-reporting of some representatives to the Center
led to poor results, requiring the government toreorganize the center in the late 1990s.
When agencies lack authority to grant allnecessary approvals, it is important that theystill add value to the process and do not justconstitute an additional regulatory burden. InThailand the Investment Services Center couldissue establishment licenses for nonpollutingactivities, but factories still had to getpermission from the Ministry of Industry beforeproduction could actually start.To avoid delayslater in the process, many firms preferred toobtain the necessary licenses directly from theministry from the outset.
One-stop shops with narrower mandateshave sometimes accelerated the process ofgaining specific approvals. For example, by shift-ing from a pre-auditing to a post-verificationsystem, the One-Stop Service Center for Visasand Work Permits in Thailand reduced the timeit took foreign firms to get visas for foreignworkers from about 45 days to just 3 hours.
Source: Bannock Consulting (2001); Brimble (2002);Miralles (2002); and Sader (2003).
B O X 5 . 5 One-stop shops—or one-more-stop shops?
07_WDR_Ch05.qxd 8/24/04 12:35 PM Page 101
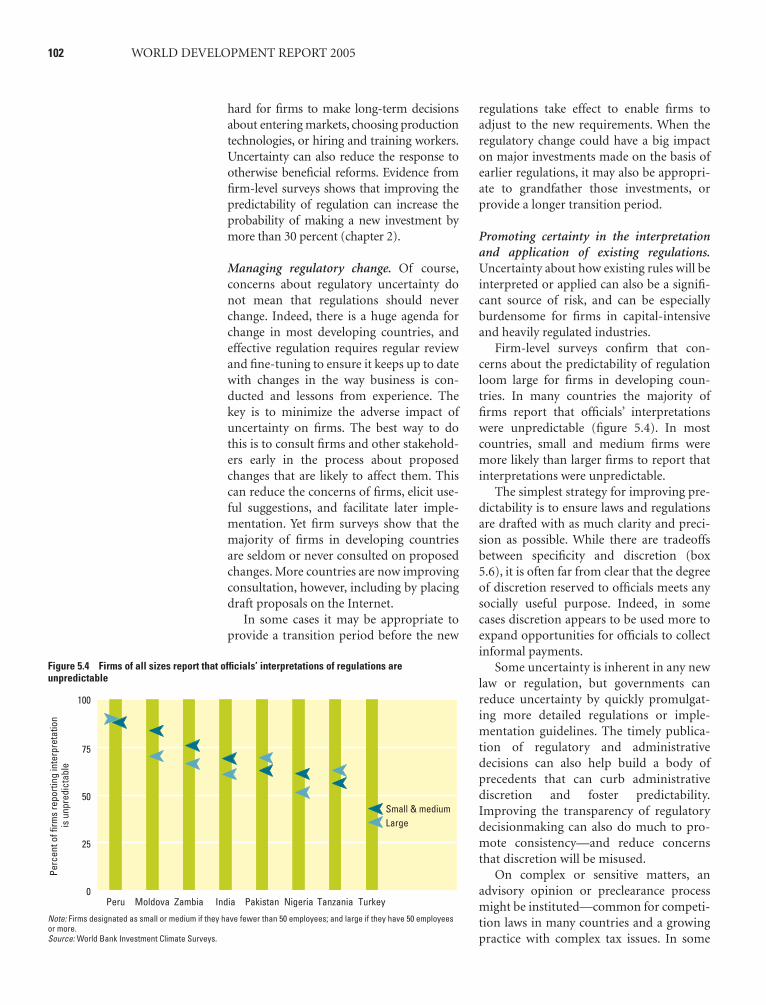
hard for firms to make long-term decisionsabout entering markets, choosing productiontechnologies, or hiring and training workers.Uncertainty can also reduce the response tootherwise beneficial reforms. Evidence fromfirm-level surveys shows that improving thepredictability of regulation can increase theprobability of making a new investment bymore than 30 percent (chapter 2).
Managing regulatory change. Of course,concerns about regulatory uncertainty donot mean that regulations should neverchange. Indeed, there is a huge agenda forchange in most developing countries, andeffective regulation requires regular reviewand fine-tuning to ensure it keeps up to datewith changes in the way business is con-ducted and lessons from experience. Thekey is to minimize the adverse impact ofuncertainty on firms. The best way to dothis is to consult firms and other stakehold-ers early in the process about proposedchanges that are likely to affect them. Thiscan reduce the concerns of firms, elicit use-ful suggestions, and facilitate later imple-mentation. Yet firm surveys show that themajority of firms in developing countriesare seldom or never consulted on proposedchanges. More countries are now improvingconsultation, however, including by placingdraft proposals on the Internet.
In some cases it may be appropriate toprovide a transition period before the new
regulations take effect to enable firms toadjust to the new requirements. When theregulatory change could have a big impacton major investments made on the basis ofearlier regulations, it may also be appropri-ate to grandfather those investments, orprovide a longer transition period.
Promoting certainty in the interpretationand application of existing regulations.Uncertainty about how existing rules will beinterpreted or applied can also be a signifi-cant source of risk, and can be especiallyburdensome for firms in capital-intensiveand heavily regulated industries.
Firm-level surveys confirm that con-cerns about the predictability of regulationloom large for firms in developing coun-tries. In many countries the majority offirms report that officials’ interpretationswere unpredictable (figure 5.4). In mostcountries, small and medium firms weremore likely than larger firms to report thatinterpretations were unpredictable.
The simplest strategy for improving pre-dictability is to ensure laws and regulationsare drafted with as much clarity and preci-sion as possible. While there are tradeoffsbetween specificity and discretion (box5.6), it is often far from clear that the degreeof discretion reserved to officials meets anysocially useful purpose. Indeed, in somecases discretion appears to be used more toexpand opportunities for officials to collectinformal payments.
Some uncertainty is inherent in any newlaw or regulation, but governments canreduce uncertainty by quickly promulgat-ing more detailed regulations or imple-mentation guidelines. The timely publica-tion of regulatory and administrativedecisions can also help build a body ofprecedents that can curb administrativediscretion and foster predictability.Improving the transparency of regulatorydecisionmaking can also do much to pro-mote consistency—and reduce concernsthat discretion will be misused.
On complex or sensitive matters, anadvisory opinion or preclearance processmight be instituted—common for competi-tion laws in many countries and a growingpractice with complex tax issues. In some
102 WORLD DEVELOPMENT REPORT 2005
75
50
25
Perc
ent o
f firm
s re
porti
ng in
terp
reta
tion
is u
npre
dict
able
0
100
Peru
LargeSmall & medium
Moldova Zambia India Pakistan Tanzania TurkeyNigeria
Note: Firms designated as small or medium if they have fewer than 50 employees; and large if they have 50 employeesor more.Source: World Bank Investment Climate Surveys.
Figure 5.4 Firms of all sizes report that officials’ interpretations of regulations areunpredictable
07_WDR_Ch05.qxd 8/24/04 12:35 PM Page 102

Regulation and taxation 103
cases it may be feasible to promote certaintyby entering specific contractual commit-ments on particular issues of interpretation(box 5.7).
Removing barriers to competitionRegulation also affects the investment climatethrough its impact on competition. Whileindividual firms typically prefer less competi-tion, not more, competition plays a criticalrole in the investment climate by creatingopportunities for new firms and providingincentives for existing firms to innovate andimprove their productivity.
Much early evidence on the benefits ofcompetition came from experience inOECD countries. For example, a study ofthe impact of pro-competitive regulatoryreform in several industries in the UnitedStates found that annual welfare gains inthe part of GDP affected by reform weremore than 7 percent, with 90 percent of thebenefits flowing to consumers.16 New workin developing countries shows significantgains as well.17 For example, the benefits ofgreater competition from trade reform havebeen documented in countries such asBrazil, Chile, Colombia, and India.18 Firmsurveys also show that competition plays amuch larger role in encouraging firms to beefficient than do customers, shareholders,or regulators. The surveys also show thatfirms reporting strong competitive pressureare at least 50 percent more likely to inno-vate than those feeling no such pressure(chapter 1).
Regulation has a pervasive impact on com-petition. Regulatory approaches that increasecosts or risks faced by firms can deter firmentry and thus dull competitive pressure. Butregulation can also influence competitionmore directly, including by creating barriersto market entry or exit, and by addressinganticompetitive behavior by firms.
Regulatory barriers to market entry. Regu-latory barriers to entry can take many forms
Firms have a strong interest in regulatory cer-tainty.Without such certainty—both for thestability and interpretation of rules—therecan be concerns about the extent of theirregulatory obligations and thus the potentialreturns from an investment opportunity.
Providing firms with appropriate assur-ances on the stability of the regulatoryregime can reduce their risks and thusencourage investment. Reducing discretioncan also reduce concerns about corruption.But there can be tradeoffs. Highly specifiedregulatory regimes reduce the flexibility tofine-tune applications to particular cases,and to accommodate changingcircumstances.
The optimal balance betweenspecificity and discretion will vary accordingto the issue, sector, and country. For exam-ple, highly discretionary regimes can have achilling effect on private investment ininfrastructure—where investments arelarge, long-lived, and immobile; where regu-lation has a significant impact on the
returns from the investment; and wherepolitical economy problems can createincentives for governments to renege oncommitments (chapter 6). Regulatory dis-cretion may have a less deleterious effecton investments that are more easilyreversed, where regulation plays a minorrole in influencing expected returns, andwhere there are no special political sensitiv-ities about regulation. But regulatory discre-tion can still create uncertainty for firms andbe used as a source of bribes by officials inany sector.
Concerns about regulatory discretioncan also vary by country. In the United States,legislative guidance on the regulation ofinfrastructure involves considerable discre-tion—but broader institutional safeguardshelp provide assurance to investors. Coun-tries that have not yet established crediblesafeguards for investor interests need to pro-vide more specific regulatory assurances—orexpect reduced investment at higher cost toreflect the risks (see box 5.2).
B O X 5 . 6 Balancing the tradeoffs between specificity anddiscretion in regulation
One strategy governments can adopt to promoteregulatory certainty is to enter specific contrac-tual commitments with firms.While it is obviouslynot feasible to do this with every firm in the econ-omy, this approach can be useful in dealing withrisks associated with major investments.
During the first wave of foreign investmentafter World War II, many firms entered contractswith host governments that included “stabiliza-tion clauses.”Covering everything from tax rates,to the duties payable on capital goods importedto develop a project, to the rules governing for-eign exchange and profit repatriation, theseclauses sought to freeze in place those host gov-ernment policies that could affect the return onthe investment.These approaches have been
applied to major resource projects and extendedto private infrastructure projects (where theyoften include specific commitments on tariff reg-ulation) and to other major investments.
Besides such global efforts to deal with policycertainty, firms often seek advance rulings andother forms of before-the-fact signals on howgovernment will interpret various laws and regu-lations. One example is the transfer pricing agree-ments that developing and developed countriesoften sign with domestic and foreign firms.
A major factor in determining amultinational firm’s income tax is whethernational tax authorities in the countries where itoperates will agree with the prices it uses totransfer goods and services among its corporate
affiliates. Because these transfer prices can bemanipulated to shift tax liability from one coun-try to another, tax agencies usually reserve theright to determine whether the prices reflectmarket conditions.The methods for makingthese determinations involve a good deal ofjudgment, thus introducing much uncertaintyinto the calculation of the taxes due.To makefirms’ tax bills more predictable, governmentshave entered advance agreements on the appro-priate level of transfer prices. China, Colombia,and Mexico have entered into hundreds of suchagreements. India and Thailand are consideringsimilar programs.
Source: Waelde and Ndi (1996) and Tropin (2003).
B O X 5 . 7 Contracting for certainty
07_WDR_Ch05.qxd 8/24/04 12:35 PM Page 103
and have many rationales. Requirements toset up a new business are one obvious formof entry barrier, but can be designed in waysthat are not especially burdensome. Butunnecessarily high registration costs canstill have a negative impact on competition.For example, estimates for a group of devel-oping countries—none of them the worstoffenders—suggest that reducing the cost ofregistration procedures to the level in theUnited States (0.6 percent of per capitaincome) could increase the number of newentrants by more than 20 percent.19
Governments often erect more substan-tial regulatory barriers to entry in particularindustries. Some of these may be part of astrategy to address a market failure but arevulnerable to being made more onerousthan necessary through rent-seeking by theprotected groups. Other restrictions lackany clear economic rationale. Public enter-prises also often benefit from legislatedmonopolies.
In India the manufacture of certainproducts is reserved for small firms, reduc-ing opportunities for other firms to partici-pate—and reducing incentives for smallfirms to grow (box 8.5). Agricultural mar-kets in many countries have been heavilyregulated, with parastatals granted monop-olies over marketing or processing of exportcrops, and traders who purchase goodsfrom farmers required to be licensed.Recent efforts to liberalize agricultural mar-kets have, for the most part, benefited poorrural producers of export crops by increas-ing producer prices relative to borderprices.20 While supply responses have some-times been slower than expected, this seemsto reflect continuing impediments in otherparts of the investment climate (includinginsecure property rights and poor infra-structure)21 or concerns about the credibil-ity of the government’s commitment to lib-eralization.22
Removing unjustified regulatory barriersto entry can have a big impact not only oncompetition but also on opportunities forindividual entrepreneurs. For example,reducing regulatory barriers to competitionin telecommunications has created opportu-nities for microentrepreneurs to enter themarket and provide services in rural areas,
helping their communities while improvingtheir own livelihoods (chapter 6). WhenBangladesh introduced competition in cellu-lar phone services, one of the new entrantsencouraged female entrepreneurs to set upand run phone shops in rural areas. By 2004these shops provided service to about 5,000villages and an estimated 12.5 million peoplewho previously had no access to this ser-vice.23 Barriers have been lifted even more inUganda, opening new opportunities forsmall entrepreneurs across the country andexpanding service in rural areas.
Regulatory barriers to market exit. Compe-tition is also affected by barriers to firmsleaving the market. The most pervasive bar-rier to exit is bankruptcy regulation. Whenthose procedures are long and costly, dis-tressed firms and their creditors are lesswilling to use them, and markets becomecluttered with failed firms that block oppor-tunities for new entrants. Firms will also beless likely to risk entering new markets, andlenders will be less willing to lend to firmsthey do not already have a relationshipwith, further reducing competition.24 As aresult, long and costly bankruptcy proce-dures have a negative impact on productiv-ity—over 20 percent of productivity gainscan be attributed to the least productivefirms exiting (chapter 1).
Bankruptcy procedures tend to be longerand more expensive in developing countriesthan in developed countries. A standard bank-ruptcy procedure takes an extraordinarily longtime in some countries. According to theBank’s Doing Business Project, a procedurethat takes only five months in the fastest coun-try (Ireland) would take 10 years in Brazil,India, and Chad. The costs can also consume alarge share of the estate. While taking onlyabout 1 percent of the estate value in severalcountries (Colombia, the Netherlands, Nor-way, and Singapore), they take up to 76 per-cent in Chad and Lao PDR. Bankruptcy proce-dures also appear less likely to result in efficientoutcomes (rehabilitating viable businesses andliquidating unviable businesses) in developingcountries. A growing number of developingcountries are recognizing the importance ofreform in this area, with recent examplesincluding Bulgaria, India, and Poland.25
104 WORLD DEVELOPMENT REPORT 2005
07_WDR_Ch05.qxd 8/24/04 12:35 PM Page 104

Addressing anticompetitive behavior by firms.Regulation is not the only source of barriers tocompetition. Firms can curb competition bycolluding or forming cartels, by enteringrestrictive agreements with suppliers or cus-tomers, by misusing their market power, orsimply by merging with competitors.
To address these concerns, a growingnumber of countries have introduced com-petition (or antitrust) law.26 While thedetails vary, most competition laws includeprovisions to do the following:27
• Prevent firms from colluding or formingcartels to limit competition. Prohibitedactions typically include agreements to fixprices, restrict output, allocate marketsand customers, and rig bids or tenders.
• Prevent dominant firms from abusingtheir market positions by engaging inpredatory pricing, forcing firms that buyparticular goods or services to also buyother goods or services, foreclosing mar-kets for inputs or distribution, or settingdiscriminatory prices or terms of service.
• Require proposed mergers to bereviewed by a specialist agency to ensurethat any resulting reduction in competi-tion has offsetting public benefits.
Competition laws are usually enforcedby specialist agencies. In addition to theirroles in enforcing competition law, theagencies often act as advocates for competi-tion by commenting on policy proposals byother government agencies and performingstudies to make policy recommendationson competition-related issues (chapter 3).According to a recent survey, 65 percent of43 responding agencies participate early inthe regulatory review and decision process,while 28 percent were consulted through-out the process or at any stage.28 Indeed,some argue that competition advocacyshould be the first priority of competitionagencies—particularly in economies with alegacy of heavy-handed government inter-ventions.29
Competition laws are relatively new indeveloping countries and early results pre-sent a mixed picture. A recent study thatlooked at price markups in a number ofdeveloped and developing countries found
that markups were no different in countrieswith and without competition laws.30 Whileagencies in countries such as Brazil, Chile,Korea, and Mexico have achieved somestanding, implementation in many othercountries has so far been less impressive.Recent work suggests that while competi-tion laws in developing countries tend to beno weaker than in developed countries,competition policy is perceived to be muchless effective (figure 5.5). Why? Limitedresources and slow and inefficient courtsare part of the story. Perhaps more impor-tant, however, are other policies that reducecompetition (such as regulatory barriers toentry and exit) and the politics of prosecut-ing firms that have close ties to the govern-ment, such as state-owned enterprises andfirms owned by influential people (box 5.8).
Toward better regulation for theinvestment climateThe challenge of regulatory improvementis large and ongoing. It requires continu-ing efforts to review and modernizeapproaches in line with changes in the waybusiness is conducted and lessons of expe-rience, but doing so in ways that provideas much predictability as possible forfirms. This is true in all countries, but it is
Regulation and taxation 105
0
2
0
10
5
20
Perc
eive
d ef
fect
iven
ess
of c
ompe
titio
n po
licy
Stric
tnes
s of
com
petit
ion
law
4
6
Upper-middle-income
countries
Lower-middle-income
countries
Low-incomecountries
Perceptions about competition policy
Strictness of competition law
High-incomecountries
15
Note: For competition policy data, higher values mean more effective policy; for competitionlaw, the higher values mean stricter laws.Source: World Economic Forum (2002) and Nicholson (2003).
Figure 5.5 Despite strong laws, competition policy is seen to be lesseffective in low-income countries
07_WDR_Ch05.qxd 8/24/04 12:35 PM Page 105

especially important in developing coun-tries where the existing body of regulationtoo often bears little relationship to con-temporary circumstances, is only partiallyenforced, and if enforced more vigorouslycould lead to even more perverse results.As highlighted in chapter 3, tackling theregulatory reform agenda requires effortsto systematically review existing regula-tions, as well as assessing new regulatoryproposals more carefully. Strengtheningthe skills and expertise of regulators andthose on the front line of government-firm relations also plays an importantrole.
Taxing firmsGovernments need revenue to cover thecosts of providing public services—includ-ing those that improve the investment cli-mate—and of meeting other social goals.Yet taxes represent a cost to firms and soreduce their incentives to invest and create
jobs. All societies struggle with how best tostrike the balance in an efficient, equitable,and sustainable way. This section reviewsthe nature of the challenge and highlightssome promising areas for improvement.
Taxes and the investment climateThroughout history, governments haveraised revenues in many ways. They haveseized the assets of their enemies—and theirsubjects. They have created monopolies tosell to the highest bidder. They have taxedland, production, transactions, income, andconsumption—and in most cases still do.Indeed, income taxes are fairly recent. Thefirst income tax, levied by the Dutch BatavianRepublic, dates from 1797,31 but the UnitedStates did not have a corporate income taxuntil 1909 or an individual income tax until1913.32 The value added tax (VAT) is evenmore recent—the first was levied in France in1948, and it did not become common untilthe 1970s and 1980s.33
106 WORLD DEVELOPMENT REPORT 2005
Given the importance of competition to a soundinvestment climate, competition laws and agen-cies could be expected to play a key role. How-ever, experience in developing countries remainsmixed.There are several possible explanations.
First, competition laws do not usuallyaddress barriers to competition flowing fromgovernment policy in other areas—includingtrade barriers, mandated monopolies, licensingregimes, and other regulatory barriers to entryand exit.When those barriers are pervasive—still the case in many countries—competitionlaws and agencies will not be enough tounleash a competitive and productive economy.The primary lever for governments is to addressthe policy barriers directly.
Second, competition laws are not alwaysenforced vigorously in developing countries.Although agencies in some countries appearto be quite active, others appear to be less so(see table). Why is enforcement often weak?
One explanation might be constrainedresources. For example, the competitionagency in Tanzania had only two economistsand no lawyers in 2000, while the authority inZambia had four economists and one lawyer. Asecond explanation is that enforcement oftendepends on effective courts. Unless the com-petition agency can rely upon the judiciary tosupport its decisions and protect it from politi-cal interference, the agency will find it difficultto enforce its rulings.
A third explanation is that it can be difficultto prosecute politically connected firms, evenwhen the competition agency is independent,unless the law and the agency command a highlevel of public support. For example, when theindependent Monopoly Control Authority inPakistan tried to take action to reduce carteliza-tion in the cement market in 1998–99, the gov-ernment intervened, fixing prices at a “mutuallyacceptable” level. Similarly, when the competi-
tion agency in Tanzania forbade a local brewerfrom barring independent agents and mini-wholesalers from stocking competitors’products, the firm, with support of governmentofficials, contravened the agency’s orders.Whenofficials intervene against agency decisions onbehalf of influential firms, competition agencieswill be hesitant to move against them in the firstplace.
The main message? Well-designed competi-tion laws can be an important tool to improvethe investment climate. But they need to beseen as part of a broader strategy that includesreducing regulatory barriers to competition, andhelping to promote a more pro-competitionculture. And as elsewhere, a high level of politi-cal commitment is key.
Source: CUTS Center for Competition (2003) andEconomic and Social Research Foundation (2002).
B O X 5 . 8 Competition laws in developing countries
In some developing countries competition agencies deal with very few cases
India Kenya Pakistan South Africa Sri Lanka Zambia (1999) (1996–2000) (1996–2000) (1999) (1996–2000) (1998–2000)
Total cases disposed of annually 206 30 166 273 6 50Mergers and acquisitions 0 22 16 236 1 22Anticompetitive practices 206 8 149 37 6 28
Cases per professional 9.0 1.3 33 7.4 0.9 24.8
Source: CUTS Center for Competition (2003).
07_WDR_Ch05.qxd 8/24/04 12:35 PM Page 106

For as long as governments have leviedtaxes, those who pay them have com-plained. Firms in developing countries areno exception, and cite tax rates as a majorconstraint on their operations (table 5.1).Taxes affect the incentives for firms to investproductively by weakening the link betweeneffort and reward, and by increasing the costof inputs used in the production process. Taxrates and compliance costs both matter.When levied or applied unevenly, taxes canalso distort competition.
Tax rates. Tax rates are a function of the sizeof government and the way the burden isallocated among alternative sources. Whileviews on the appropriate size of governmentdiffer, government’s share of GDP in manydeveloping countries is much larger than intoday’s developed countries when they wereat similar stages of development.34 The shareof the tax burden carried by firms can beinfluenced by efficiency and equity consid-erations, as well as by more pragmatic con-cerns about collecting revenue.35 Narrow taxbases and weak tax administrations leadgovernments in developing countries to col-lect a larger share of their revenues fromfirms and from commercial transactionsthan is the case in developed countries.Indeed, corporate taxes, direct taxes ongoods and services, and trade taxes accountfor over 70 percent of government revenuesin low-income countries.36
While tax rates and structures differacross countries, corporate tax rates andvalue-added tax rates are broadly similar indeveloping and developed countries (figure5.6). Despite similar rates, revenues col-lected from corporate taxes tend to be lowerin developing countries than in developedcountries due to the narrowness of the taxbase and problems of tax administration(figure 5.7). Corporate tax revenues eitherincreased slightly or remained stable duringthe 1990s in all developing regions exceptEurope and Central Asia, where revenuesfell due to privatization and a general con-traction in the size of the state.37 This iscontrary to some of the dire predictions ofthose concerned about the impact of taxcompetition between countries as a result ofincreasing global integration (box 5.9).
Regulation and taxation 107
Table 5.1 Firms report that tax rates are one of their top concerns
Share of countries where firms report tax rates as key obstacle
Biggest Among top Among top obstacle three obstacles five obstacles
All countries 18 56 82
Upper-middle-income 40 90 100Lower-middle- income 12 35 71Lower-income 11 56 83
Eastern Europe & Central Asia 14 62 86Sub-Saharan Africa 33 67 83Asia 14 29 71Latin America 50 50 50
Note: Reports share of countries where firms rank tax rates as a top constraint in a list of 18 possible obstacles.Source: World Bank Investment Climate Surveys.
40%30%10% 20%0%
Europe & Central Asia
East Asia
Latin America & the Caribbean
Corporate tax rateVAT rate
South Asia
Middle East & North Africa
Lower-middle-income countries
Low-income countries
High-income countries
Sub-Saharan Africa
Upper-middle-income countries
Note: Data are for 1999–2000.Source: World Bank (2004k), and Ebrill and others (2001).
Figure 5.6 Corporate tax and VAT rates are similar in high-income and developing countries
0.0 0.5 1.0 1.5 2.0 2.5 3.0 3.5 4.0
2000–011993–94
Europe & Central Asia
Sub-Saharan Africa
High-income countries
Latin America & the Caribbean
Middle East & North Africa
South Asia
Percent of GDPNote: Averages are for 81 countries for which comparable data was available for both periods.Source: IMF (2003); OECD (2002d); Dobrinsky (2002).
Figure 5.7 Corporate tax revenues remained stable or increased during the 1990s,except in ECA
07_WDR_Ch05.qxd 8/24/04 12:35 PM Page 107
The burden that taxes impose on firmscan vary along several dimensions. First,because firms can partially pass the costs oftaxation on to consumers or workers, theactual burden can differ from the statutoryburden (box 5.10). Second, many firms andactivities benefit from special tax exemp-tions or privileges, whether as a result ofgovernment deliberately trying to promotesome kinds of activity—as is often the casewith foreign investment and research anddevelopment (chapter 8)—or as a reward tofavored constituencies. Third, a large pro-portion of firms in many developing coun-tries are in the informal economy, wherethey typically do not pay taxes. Thisincludes microentrepreneurs, but weak
108 WORLD DEVELOPMENT REPORT 2005
Concern is often expressed about whether com-petition for investment between countries isleading to a race to the bottom in corporate taxrates. Competition might pressure governmentsto cut corporate taxes to attract new investmentor retain existing investment.The concern isgreatest for investment by firms that are themost footloose, such as multinational firms pro-ducing tradable goods.
Do tax rates affect where firms invest?The answer seems to be yes, but like otheraspects of the investment climate, the weightwill likely vary between firms, industries, andlocations. A meta-analysis of 25 studies thatlooked at the effect of tax rates on FDI (mostlyusing data on FDI into the United States or FDIby U.S. firms) concluded that a one percentagepoint increase in tax rates reduces FDI by about3.3 percent. Other surveys and evidencesupport a similar conclusion.
Is tax competition harmful?Because corporate taxes affect the decisions ofinvestors, countries might try to use tax rates tocompete for foreign investment. Internationaltax competition can have both positive andnegative effects on welfare and efficiency, and itis not immediately clear that it will make coun-tries worse off. Allowing countries or regions toset taxes and expenditures based on local pref-erences for and costs of providing local publicgoods (ones that affect people only in that juris-diction) is generally more efficient than requir-ing that governments mandate uniform taxesand expenditures across regions. Manycommentators also argue that a degree of com-petition between governments on taxes andother policies can be a good thing, because itdisciplines governments and prevents them
from wasting public resources or becomingoverly intrusive.
Other theoretical models suggest that taxcompetition might have some adverse conse-quences. One concern is fiscal externalities.When a government cuts its tax rates on capi-tal—and does not cut expenditures that ownersof capital care about (if it cuts only expendituresthat benefit immobile workers)—it mightattract capital from neighboring jurisdictions. Ifit does not take into account the effect of thison taxes (and thus expenditures) in the neigh-boring jurisdictions, it can set tax rates lowerthan are globally optimal. A second concern isthat tax competition might have an undesirableimpact on the distribution of taxes. In particular,if capital is mobile but workers are not, a greaterpart of the burden of corporate taxes will fall onworkers rather than on capital.
A host of other factors—such as other taxinstruments available to the government—alsoaffect whether tax competition improves, orreduces, public welfare in theoretical models ofthe economy.The broader point, however, is thattax competition is not necessarily harmful.
Have corporate taxes fallen as internationaleconomic integration increased?If tax competition was resulting in significantfiscal externalities and thus a race to thebottom, corporate taxes should have fallen inthe 1990s as international integration increased.Although marginal corporate tax rates havefallen over the past decade, bases have oftenbeen broadened. As a result, corporate tax rev-enues have increased or remained steady onaverage, except in the European transitioneconomies, where the decrease in revenues wasmore from privatization than economic integra-
tion (figure 5.7). Further, whether the decrease inmarginal rates is a result of tax competition orother factors is not clear—governments mightreduce rates in an attempt to stimulate privateinvestment by local firms.
The dire predictions of some commentatorsmay not be bearing out for two reasons:
• Tax rates are not the only factor influencinginvestment decisions. Infrastructure, law andorder, and the education of the workforce canbe even more influential, and it is hard forgovernments to sustain those services with ashrinking tax base. Location decisions are alsoinfluenced by agglomeration economies.Together, these factors mean that investmentis not as responsive to changing tax rates assome fear.
• Corporate tax rates also affect the taxes paidby domestic firms and firms producing non-tradable goods, and investment by thesefirms is likely to be far less responsive to dif-ferences in tax rates than investment by for-eign firms, especially those producing tradedgoods.This means that across-the-board cutsin corporate tax rates would be a costly wayto attract foreign investment. Rather than cut-ting taxes across the board, governmentstend to offer tax incentives—or other advan-tages—targeted specifically to firms thoughtto be the most responsive (chapter 8).
Source: Baldwin and Krugman (2004); Brennan andBuchanan (1980); De Mooij and Ederveen (2001); DeMooij and Ederveen (2002); Devereux, Griffith, andKlemm (2002); Glaeser, Johnson, and Shleifer (2001);Gordon and Hines (2002); Haufler (2001); Hines(1999); Mitra and Stern (2003); Oates (2001); Rodrik(1997); Tiebout (1956); Wilson (1999); and Wunder(2001a).
B O X 5 . 9 Taxation and global integration: A race to the bottom?
When governments levy taxes on firms, firmswill often pass the costs of the tax on to oth-ers. For example, if government levies a pay-roll tax on firms, increasing the cost of hiringworkers, firms will hire fewer workers. Asunemployment increases, real wages will fall(or increase more slowly than they wouldhave otherwise), passing the cost of the taxon to workers. So workers ultimately bearsome of the tax burden in the form of lowerwages, even though the tax is levied on thefirm. Part of the burden might also be passedon to consumers through higher prices.
Incidence has been especially contro-versial for corporate taxes. Although thecorporate income tax is often seen as a taxon capital, and the popular press often sug-
gests that raising corporate taxes is neces-sary to make firms “pay their fair share,”labor bears a large part of the burden ofcorporate tax in the United States. Becauselabor’s share of the corporate tax burden ishigher when capital is more mobile, labormay bear a greater part of the burden indeveloping countries than it does in theUnited States. As capital becomes moremobile—and multinational firms becomemore sophisticated in their taxminimization strategies—the share of thecorporate income tax falling on labor willlikely increase.
Source: Fuchs, Krueger, and Poterba (1998);Mulligan (2002); and Rosen (1995).
B O X 5 . 1 0 Who pays taxes levied on firms?
07_WDR_Ch05.qxd 8/24/04 12:35 PM Page 108

enforcement capacity means that evenlarger firms evade at least some taxes. Cor-ruption in tax administration contributesto informality, resulting in less revenue forgovernment and a higher burden on thosethat do pay.
Small firms can often reduce their taxburden through informality and evasion.Large firms can also reduce taxes because oftheir ability to negotiate various tax privi-leges and to avoid taxes through sophisti-cated legal means (hiring accountants tosearch for existing loopholes in the tax sys-tem). This can lead to a disproportionateburden for medium firms. For example,they pay a greater share of their revenues intaxes than either small or large firms inCameroon and Uganda (figure 5.8).38
Tax administration. Firms rate tax adminis-tration as a separate and additional obstaclefrom tax levels. In countries includingBangladesh, Brazil, and Ethiopia, more than50 percent of firms said that tax administra-tion was a very severe or major problem(figure 5.9). Red tape and corruption in taxadministrations are common, and weakenthe incentives to comply with taxes andcontribute to leakages.
Taxes and competition. Taxes can also affectthe level of competition between firms intwo main ways. First, many developingcountries have traditionally relied heavily ontrade taxes (tariffs and export taxes), in partbecause of the ease of collection, which hasreduced competitive pressure on local firms.To take advantage of global integration, gov-ernments have been reducing trade taxeswith a positive impact on the competitivediscipline facing local firms—and reducingcosts for firms and consumers. They havetypically made up for the lost revenues byintroducing or increasing VAT.39
The second way taxes influence competi-tion is through differential treatment of localfirms in the same market. As noted above,medium firms may be disadvantaged relativeto smaller and larger firms. Firms in theinformal sector can have advantages overthose in the formal sector. In Argentina, forexample, it has been suggested that althoughlabor productivity at large meat processors is
Regulation and taxation 109
8
6
4
2Ta
xes
as a
per
cent
of s
ales
0
10
2–5 6–25 26–75
Number of employees
CameroonUganda
76–200 Over 200
Source: Gauthier and Reinikka (2001) and Gauthier and Gersovitz(1997).
Figure 5.8 Caught in the middle: taxing firms inUganda and Cameroon
0 20 40 60Percent
80
Czech Republic
China
Guatemala
Kyrgyzstan
Bangladesh
Ethiopia
Brazil
Note: Percentage of firms reporting tax administration as a“major” or “severe” obstacle to the operation and growth of theirestablishment.Source: World Bank Investment Climate Surveys.
Figure 5.9 Many firms rate tax administration as aserious obstacle
almost twice as high as in smaller firms,small informal processors can undercut theprices of the large firms by evading taxes andnot complying with all regulations.40
Better taxes for the investmentclimateCrafting better tax policies for the invest-ment climate requires governments to rec-ognize the tradeoffs between efficiency,equity, and pragmatic implementation con-cerns, and the impact of tax policies have onthe incentives of firms to invest produc-tively, create jobs, and so contribute to a
07_WDR_Ch05.qxd 8/24/04 12:35 PM Page 109

growing tax base over time. A first step is toensure the tax burden is no higher thannecessary, including by keeping the size ofthe state in check and striving for more effi-ciency in public spending. For example,World Development Report 2004 identifiedmany opportunities for governments tobetter leverage public funding for publicservices. Beyond this, the most promisingstrategies involve broadening the tax base(including by addressing informality), sim-plifying tax structures, and improving taxadministration in its various dimensions.
Broadening the tax base. Reducing impedi-ments to the emergence of new firms thatcontribute to growth expands the tax baseand creates the potential to reduce the taxburden on other firms. Addressing infor-mality of existing firms can require a morenuanced approach. For larger firms thatevade tax obligations, more vigorousenforcement action is justified, but compli-ance can also be encouraged by simplifyingtax structures and tax administration. Sev-eral countries in Eastern Europe are alsoexperimenting with flat corporate and per-sonal taxes to encourage tax compliance,reduce distortions, and simplify adminis-tration. Reducing impediments to firmsjoining the formal economy—including bysimplifying business registration require-ments and relieving other unjustified regu-latory burdens—can also play a role.
Confronting informality. Microenterprisesin the informal economy raise more difficultand sensitive issues (chapter 3). Some smallfirms may not be viable if they have to com-ply with all taxes and regulations.41 Forcingthem to comply might simply result in themclosing down, with an adverse impact onpoverty. And even a big increase in formalityamong microenterprises may not lead to asignificant increase in revenues but wouldgreatly increase the cost of collecting taxes.42
Governments are experimenting withnovel schemes to improve tax morality. InChina, to encourage businesses to issue offi-cial receipts, some local governments haveexperimented with a scheme that allows offi-cial receipts to double as lottery tickets, toencourage customers to demand receipts
from businesses (box 5.11). In Mongoliasome local governments issue awards, includ-ing consumer goods, cash, and plaques tofirms nominated as the best taxpayers.
Simplifying tax structures. Simplifyingcomplicated tax systems can be beneficialfor three main reasons. First, tax systemsriddled with exemptions are not transpar-ent and can act as magnets for rent-seekingbehavior by firms and other groups. Whilethis benefits the favored groups, it reducesrevenues and puts a greater burden on oth-ers. Second, such systems can provide sig-nificant opportunities for corruption.43
Third, complicated systems increase thecost of administration. Large firms candevote resources to reducing their total taxburden. This in turn increases the burden ofadministration for the agencies responsiblefor administering taxes and auditingreturns. Simplifying the tax system is espe-cially useful in countries where administra-tive capacity is limited or control of corrup-tion is weak.
Increasing the autonomy of tax agencies. Acommon strategy for improving revenuecollection and reducing compliance costsis to give tax agencies more autonomy. Sinceautonomous tax agencies were introducedin Bolivia and Ghana in the 1980s, morethan 15 countries have set them up.44
Autonomous tax agencies promise betterperformance than traditional ministries.They can bypass restrictive civil service rulesand pay better salaries to attract and retainwell-qualified professionals.45 They are alsobetter protected from political interference.46
Autonomy usually improves the perfor-mance of revenue agencies.47 A recent studyof agencies in Latin America and Africaconcluded that the agencies granted themost autonomy were the most successful inboosting revenue collection and efficiency,increasing compliance, and improving ser-vice quality.48 After the reform of the KenyaRevenue Agency in 1995, revenue efficiencyand compliance improved and, despite anacross-the-board reduction in tax rates, rev-enues declined by less than had been fore-cast.49 But sustaining autonomy requires ahigh level of political commitment.50
110 WORLD DEVELOPMENT REPORT 2005
Shop owners sometimes haveproblems with employees whopocket the customer’s cash ratherthan putting it into the register.To discourage employees fromdoing this, some stores and fastfood restaurants offer customersa small amount if the checker failsto issue them a receipt. By givingthe customer an incentive toreport employees who fail toenter sales into the register, theowners effectively enlist the cus-tomer in their attempts toprevent employee theft.
In 2002, to boost tax collec-tions, the city government of Bei-jing, China, instituted a similarprogram to encourageenterprises to issue properreceipts. Under this program, asmall scratch box was added toofficial receipts.When thecustomers scratch the box, theycan win small prizes rangingbetween 100 and 5,000 Yuan.Todiscourage forgery, a secondscratch box with a code numberallows customers to check overthe Internet whether thebusiness gave them a validreceipt. In a pilot program out-side Beijing a small townincreased tax revenues by$732,000 while giving out$17,100 in prizes.
Source: The Economist (2002b).
B O X 5 . 1 1 Taxreceipts as lotterytickets?
07_WDR_Ch05.qxd 8/24/04 12:35 PM Page 110

Autonomy also has to be balanced withaccountability. Although an autonomousagency needs to have control over its day-to-day operations (deciding whom to hireand whom to audit), it is important that itremains accountable for its overall perfor-mance, including its relationship with tax-payers. In Mexico the autonomous agencyhas to present a report on its performanceto the legislature three times a year. InKenya the head of the tax authority isrequired to present quarterly audit reports,conducted by the internal audit unit, to theagency’s board, the minister of finance, andthe auditor general. The agency head is alsorequired to present the agency’s financialstatements, performance indicators, andannual report to both the board and theminister of finance. The auditor generalalso conducts an annual audit, which theminister of finance presents along with theannual report, to the National Assembly.51
Tackling corruption in tax administrations.Corruption in the tax authority under-mines collection efforts. Corruption can bea persistent challenge because the problemsare rarely unique to tax administration. Butgovernments can take several practicalsteps.52 One general principle is to mini-mize direct contact between tax officialsand taxpayers—by automating and com-puterizing procedures, increasing the use ofthird-party data for assessments, and rely-ing on tax withholding.53 A second usefulstep is to organize the tax agency alongfunctional lines (such as auditing, taxpayerassistance, and processing tax returns)rather than by tax type, because this makesit harder for officials to develop relation-ships with taxpayers. Broader strategies foraddressing corruption in civil service orga-nizations can also help, such as allowingindependent internal and external audits,protecting whistleblowers, and giving citi-zens a way of complaining about harass-ment (chapter 2).
In some cases corruption also appears tohave been reduced when agencies havebecome autonomous. In Peru, 85 percentof taxpayers surveyed believed that therewas substantially less or much less corrup-tion in SUNAT, the Peruvian tax agency,
after it became autonomous.54 But auton-omy is not a universal salve: for example,corruption remained a serious problem inTanzania after the reform of its revenueagency.55
Improving compliance through computeri-zation. Increasing computerization in rev-enue administration agencies can some-times help.56 Singapore reduced tax arrearsand staff turnover, while public satisfactionwith the tax service improved.57 But experi-ence suggests that increased computeriza-tion is likely to be successful only when partof an overall strategy that takes into accountcivil service wage structures and humancapital constraints.58 Computerization pro-jects tend to be more successful whenimplemented with other reforms toimprove tax administration.59 Using off-the-shelf software and hardware can alsoreduce the risks of having to develop pro-prietary technologies.60
Regulating and taxing at the borderIn addition to regulating and taxing firmswithin their borders, governments regulateand tax goods at the border and imposeadditional regulations and restrictions onforeign-owned firms.
Although the regulation of domestictransactions can often be justified on effi-ciency grounds, such as addressing a marketfailure, similar arguments rarely apply torestrictions on trade or FDI. Apart from rev-enue goals for import tariffs, policies in thisarea are often driven by the preferences oflocal firms to face less competitive pressure.A growing appreciation of the benefits ofopenness has resulted in both developed anddeveloping countries significantly reducingbarriers to trade and investment in recentyears (chapter 3). However, many barriersthat weaken the investment climate remain.
Regulatory barriers to foreigninvestmentSince 1995 at least 60 countries have maderegulatory changes affecting foreign invest-ment every year, with the vast majorityreducing restrictions (figure 5.10).
Regulation and taxation 111
07_WDR_Ch05.qxd 8/24/04 12:35 PM Page 111

Restrictions that discriminate againstforeign investors usually have one of threeobjectives. First are those that seek toencourage FDI but also to promotespillovers to the local economy by impos-ing requirements to enter joint ventureswith local firms or to meet other require-ments. Experience with the effectiveness
of such arrangements is mixed at best(chapter 8).
Second are those that seek to exclude orotherwise more tightly control foreign par-ticipation in sectors perceived to be espe-cially “sensitive”—such as infrastructureand media services. For example, the UnitedStates restricts foreign ownership of radiolicenses and prevents majority foreign–owned companies from operating domesticair services.61 Although many middle-income countries maintain few restrictionson foreign ownership in manufacturing,they often impose greater restrictions onforeign ownership in electricity, telecom-munications, transportation, and financialservices (figure 5.11). Given the benefits offoreign ownership in improving productiv-ity, and the fact that many domestic firmsrely on the services from the restricted sec-tors, restrictions can weaken the investmentclimate.
A third objective may be to control thepotentially destabilizing effects of large,short-term capital flows—with the empha-sis on short-term portfolio investmentrather than FDI (box 5.12).
Regulatory barriers to foreign tradeTariff and nontariff barriers to trade havebeen reduced over the past decade, but theremaining restrictions and weaknesses incustoms administration still have a bigimpact on the investment climate.
Trade protection. Average tariff rates remainmoderately high in developing countries(13 percent).62 It has been estimated that ifdeveloping countries reduced their averagetariffs to 10 percent on agricultural prod-ucts and to 5 percent on manufacturingproducts, their gains would exceed $100 bil-lion by 2015. This is greater than the gainsdeveloping countries would get from devel-oped countries reducing the tariffs andother restrictions they impose on goodsfrom developing countries (chapter 10).63
Improving customs administration. Whencustoms are administered poorly, signifi-cant costs can be imposed on firmsengaged in importing or exporting—andindirectly on firms that supply exporters
112 WORLD DEVELOPMENT REPORT 2005
01991 1992 1993 1994 1995 1996 1997 1998 1999 2000 2001 2002
150
100
50
200
Num
ber o
f reg
ulat
ions
Num
ber o
f cou
ntrie
s
250
0
20
60
40
80
Regulations more favorable to FDIRegulations less favorable toward FDINumber of countries making changes
Figure 5.10 Most changes in national regulations governing FDI reduced restrictions
Source: UNCTAD (2003e).
0 0.2 0.4 0.6 0.8 1.0
Hotels
Business services
Finance
Transportation
Telecommunications
Electricity
Manufacturing
Restrictions on FDI(higher values mean more restrictions)
MexicoCzech RepublicPolandHungary
Source: Golub (2003).
Figure 5.11 Restrictions on FDI have fallen in manufacturing, butpersist in other sectors
07_WDR_Ch05.qxd 8/24/04 12:35 PM Page 112

or depend on imported goods. Delays inimports can also prevent firms fromadopting production processes that relyon just-in-time deliveries and mean thatfirms have to hold larger inventories thanthey would otherwise. Firms in Estoniareported that, on average, imports clearedcustoms in less than 2 days. By contrast,the average for firms in Tanzania was 18days and in Ecuador, 16 days (figure 5.12).These delays can impose real costs onworkers and firms in developing coun-tries: on average firms in the garmentindustry grew more slowly, in both outputand employment, and wages were lower incountries where customs clearance tooklonger.64
Corruption can also be a major problemin customs administration. Officials canimpose large costs on importers—especiallyfor importers of perishable goods—bydelaying the processing of imports. InEastern Europe and Central Asia more than20 percent of firms that directly importedsome inputs reported that bribes wereneeded to deal with customs and imports.Although import licenses are not needed in
many areas in most countries, bribes werecommon for firms that reported applyingfor licenses. Around 10 percent of firms thatapplied for import licenses reported thatbribes were requested or expected when
Regulation and taxation 113
Although most countries now actively courtFDI, there is more debate about the merits ofcapital account liberalization, particularly forshort-term capital flows. Recent crises in Asia,Latin America, and Russia have contributed tothe debate, with many observers questioningwhether it is wise to allow short-term invest-ment to flow freely in and out of developingcountries.
Most of the debate has focused on short-term portfolio investment. FDI—especiallygreenfield investment—is difficult to reverse.Portfolio flows, in contrast, can change directionvery quickly, putting pressure on exchange ratesand fragile banking sectors and sometimescausing currency or banking crises.What cangovernments do to insulate themselves fromthese reversals without deterring all foreigninvestment? Several proposals have been putforward, some more controversial than others.
Avoid overspending and overborrowing dur-ing periods of rapid inflows. Although severalrecent crises have been the result of private bor-rowing (Asia in 1997), governments often con-tribute to crises by overborrowing from interna-tional capital markets as foreign investment
flows into their economy. Governments in manydeveloping countries, including those in LatinAmerica, have run procyclical fiscal policies, con-tributing to cycles of booms and busts. Avoidingoverspending and overborrowing duringbooms is thus important.
Strengthen oversight of the financial system.One way to reduce problems associated withcapital inflows is to improve management offinancial sector risk. In addition to ensuring thatbanks are adequately capitalized and haveappropriate levels of provisioning for bad loans,it is important to ensure they do not developportfolio mismatches in currencies or terms.Banks might also have to be discouraged fromlending foreign currency to firms with earningsprimarily in domestic currency (those operatingin nontraded sectors). Removing implicit orexplicit government deposit insurance mightalso be valuable.
Capital controls. Regulations aimed at pre-venting sudden outflows of investment or dis-couraging short-term inflows are more contro-versial. Several countries have experimentedwith capital controls. In 1991 Chile imposed arequirement that foreign investors make a 20
percent reserve deposit in an unremuneratedaccount for up to a year for all portfolio inflowsfrom abroad. It also required that FDI stay in thecountry for at least three years—a restrictionreduced to one year in 1992.
Evidence on the effectiveness of capital con-trols is mixed. Some studies have found thatcapital controls have altered the composition ofcapital inflows, increasing the share of FDI anddecreasing the share of short-term and portfolioinvestment. Other studies found that capitalcontrols can have harmful side effects. Becausethey impose costs on foreign investors whetherthey restrict inflows or outflows, controls gener-ally increase the cost of borrowing in the coun-try. Further, because controls can often becircumvented, especially in countries where cor-ruption is a problem, it is unclear whether theyare an effective way of deterring crises.
Source: Schmukler (2003); World Bank (2002d);Ariyoshi and others (2000); de Ferranti and others(2000); Edwards (1999); Kaminsky, Reinhart, andVégh (2003); Montiel and Reinhart (1999); andWorld Bank (2001f ).
B O X 5 . 1 2 Dealing with short-term international capital flows
20155 10Days
0
Slovenia
Estonia
Morocco
Exports Imports
India
Russia
China
Ecuador
Tanzania
Honduras
Source: World Bank Investment Climate Surveys.
Figure 5.12 Clearing customs for imports—from under 2 days to 18
07_WDR_Ch05.qxd 8/24/04 12:35 PM Page 113
applying for them, with the median pay-ments exceeding $100 in several countries.
Improving customs administrationpromises large gains. Increasing the use ofinformation technology can help acceleratecustoms processing (box 5.13).65 Comput-erization is becoming less costly and lessdemanding of human capital than beforebecause of standardized software packages.In addition to reducing delays, computeri-zation can increase transparency and soreduce corruption.66 Importers in Morocconow find out in real time the progress ofcustoms operations and the status of theirimports under special import regimes,monitoring payments of duties and taxes,and even monitoring clearance times.67
Customs can also be improved by con-tracting out functions to private firms as inMozambique (box 5.14).
Government approaches to regulation andtaxation are not limited in their impact onproduct markets. They also play a big part inthe quality of a country’s financial system andits infrastructure—the subject of chapter 6.
114 WORLD DEVELOPMENT REPORT 2005
Firms in developing countries often facelong delays when importing and exportinggoods. In recent years computerization hasdemonstrated the potential to dramaticallyspeed up parts of the process. One initia-tive uses software and procedures basedon a program called TradeNet. Rather thansubmit multiple unique forms to multipleagencies, a trader can electronically submita single document that contains all theinformation required by the differentagencies. TradeNet then submits the infor-mation to the relevant agencies, which canthen respond with the necessary permitsor request additional information. By elimi-nating overlapping requirements and mul-tiple forms, the process reducestransaction costs for firms and minimizesdirect contact between public officials andthe trader, reducing opportunities for sidepayments.
Singapore used these methods in 1989to reduce processing time from two to fourdays to a few minutes, and the number ofrequired documents from between 3 and35 to a single document. Freight forwardersestimate that the program has reducedtheir cost of handling trade documentationby between 20 and 35 percent.
Singapore’s success,and a similar programin Mauritius, inspired the government ofGhana to adopt a similar program as part of itsstrategy to become a more attractive locationfor exporters.Before the program, importersestimated that the fastest clearance time atseaports was four days,with an average clear-ance time of several weeks.After implement-ing the program,about 14 percent ofclearances took less than a day at Tema portand only 11 percent took more than five days.At the airport,average clearance times fellfrom three days to four hours,with 18 percentof clearances taking less than two hours.
Although computerization can reducedelays, it will not succeed unless proceduresare modified to fully exploit its benefits.Before implementing TradeNet, the Ghana-ian customs administration was alreadyusing a standard software package to helpprocess imports, but procedures were notdesigned to take advantage of the package,so the technology was underused. Forexample, customs declarations had to bemanually entered into the database, aprocess that took up to 24 hours, ratherthan being submitted electronically.
Source: De Wulf (2004), and World Bank (1998b).
B O X 5 . 1 3 Reducing customs delays in Singapore and Ghana
Before 1995 customs administration had been aserious problem in Mozambique.There was noreliable system for detecting and punishing cor-rupt officials. More than three-quarters of stafflacked a high school education.There was littleuse of information technology, and all goods werephysically inspected after arriving in the country.So revenue collection was poor.The inspectionprocess was slow. Corruption was serious, withimporters and customs officials frequently collud-ing to undervalue and misclassify imports.
In 1995 the government initiated an ambi-tious program to improve customs operations.The program included the following:
• Issuing a new customs code to update the pre-vious law, which dated from the colonial period
• Replacing many workers with better-educated personnel, while boosting employ-ment by 20 percent
• Introducing a new salary scale and compen-sation package that was higher than for othercivil servants and that compared well withprivate sector salaries
• Adopting a new software package and newcomputer hardware
• Reducing the agency’s reliance on physicalinspections
• Adopting anticorruption measures.
In addition the government, with supportfrom the U.K. Department for InternationalDevelopment (DFID), entered a contract withCrown Agents, a private company, which tookover the management of customs in 1996.
Even with a reduction in nominal tariff rates,better administration and reduced exemptionsincreased the ratio of customs revenue toimports between 1996 and 2000 (there was a
slight decline in 2001).The reform also helpedthe investment climate. By 2002 the mediannumber of days for imported goods to clear cus-toms was significantly lower in Mozambiquethan in Tanzania or Kenya and similar to thenumber in China.
Some questions remain. It is not clearwhether the improvements can be sustainedafter Crown Agents leaves. In 1999 CrownAgents’ three-year contract was extended until2003 and then extended again until 2005.Crown Agents’ responsibilities and number ofstaff have declined since the first contract, but areview by DFID and the Mozambique govern-ment concluded that the improvements werenot yet sustainable in mid-2003.
Source: Mwangi (2003).
B O X 5 . 1 4 Contracting out customs in Mozambique
07_WDR_Ch05.qxd 8/24/04 12:35 PM Page 114

6
Finance and infrastructure
115
Financial markets, when functioning well,connect firms to lenders and investors willingto fund their ventures and share some of therisks. Good infrastructure connects them totheir customers and suppliers and helps themtake advantage of modern production tech-niques. Conversely, inadequacies in financeand infrastructure create barriers to opportu-nities and increase costs for rural microentre-preneurs as well as multinational enterprises.By impeding new entry into markets, theseinadequacies also limit the competitive disci-pline facing incumbent firms, dulling theirincentives to innovate and improve their pro-ductivity. Such inadequacies are large indeveloping countries (figure 6.1).
The underlying problem with bothfinance and infrastructure can be traced to aspecific market failure—for finance it isinformation asymmetries, and for infra-structure, market power associated witheconomies of scale. But too often govern-
ment interventions have made mattersworse. Financial markets have beenrepressed and distorted by state ownership,monopolies, directed or subsidized credit,and other policies appealing to the short-term interests of politicians and favoredgroups. Those measures undermine finan-cial sector development, firm-level produc-tivity, and economic growth.1 Infrastruc-ture provision has been undermined bygovernments using state ownership or regu-lation to pursue objectives unrelated to effi-cient service delivery—typically favoringsome groups over broader interests andintroducing new sources of inefficiency.2
The problems in both areas usually hitsmaller firms the hardest.
Governments are confronting theseissues, but progress is slow and uneven.They are pursuing new approaches that rec-ognize that finance and infrastructure arenot only part of the investment climate forother firms, but are also profoundly shapedby the investment climate for providers offinancial and infrastructure services. That iswhy many governments are taking steps toincrease competition among providers offinance and infrastructure, secure theirproperty rights, and regulate them in waysthat recognize the tradeoff between marketfailures and government failures. Govern-ments are also working to improve manage-ment of public resources—to get more fortheir money when they finance or subsidizeinfrastructure services.
Financial marketsDeveloped financial markets provide pay-ment services, mobilize savings, and allo-cate financing to firms wishing to invest.When these markets work well, they givefirms of all types the ability to seize promis-
0 10 20 30 40 50 60 70
FinanceInfrastructure
South Asia
Sub-Saharan Africa
Latin America & the Caribbean
Europe & Central Asia
East Asia & Pacific
Middle East & North Africa
Percent of firms
Note: Figure shows the share of firms that report access to finance, and any of electricity, telecom-munications, or transportation as "major" or "severe" obstacles to the operation and growth of theirbusiness.Source: World Bank Investment Climate Surveys.
Figure 6.1 The inadequacies of finance and infrastructure are severe for manydeveloping countries
c h a p t e r
08_WDR_Ch06.qxd 8/24/04 12:38 PM Page 115

116
ing investment opportunities. They reducefirms’ reliance on internally generated cashflows and money from family and friends—giving them access to external equity anddebt, something that smaller firms in par-ticular often lack (figure 6.2). They allowpoor entrepreneurs to grow their busi-nesses, even though they have little moneythemselves. Well-functioning financial mar-kets also impose discipline on firms to per-form, driving efficiency, both directly andby facilitating new entry into product mar-kets. And they create opportunities forfirms and households to manage risks. As aresult, financial market development leadsto faster growth in productivity and out-put.3 Doubling private credit as a share ofGDP is associated with an increase in aver-age long-term growth of almost two per-centage points.4
Developed financial markets also reducepoverty—directly and through their role ineconomic growth. They reduce incomeinequality by alleviating credit constraintsand increasing access to investment oppor-tunities for poor households.5 By facilitat-ing competition between firms that pur-chase goods produced by poor households,they can help poor households escapeexploitation by those firms.6 They can alsostabilize the economy by reducing volatility:doubling private credit as a share of GDPcan reduce the volatility of growth fromfour percent a year to three.7 There is alsoevidence that child labor is lower in coun-tries with greater access to financing.8
Getting financial markets to work well,however, runs into market failures andproblems of political economy.9 Marketfailure arises mainly from informationasymmetries. Firms seeking to borrowpromise to repay loans, but there is always achance they will not. If lenders could accu-rately estimate the likelihood of default,they could protect themselves by calibratinginterest rates to the risk of default. Lendersdo charge more for riskier loans, but thefact that their knowledge of risk is imper-fect, and poorer than that of borrowers,means that increasing interest rates cannotfully protect them: when lenders chargehigher interest rates, they discourage bor-rowers with low-risk, low-return ventures,leaving them mainly with borrowers forhigh-risk projects. By its nature, then, rais-ing interest rates increases the risks lendersare exposed to. The problem is heightenedby the possibility of dishonesty and weakcontract enforcement—only honest bor-rowers are discouraged by high interestrates.
Providers of debt and equity also haveimperfect information about what therecipients are doing with the capital.Lenders cannot be sure that borrowers aresteering clear of risks that increase thechance of default. Shareholders cannot besure whether managers are investing wiselyor merely enriching themselves.
These failures can make it hard for firmsto obtain financing unless they have collat-eral to secure a loan—or good connections.Failures also make it hard for people withsavings to find attractive opportunities toinvest or lend. The severity of the failuresdepends partly on factors outside govern-ment’s immediate control, such as the effectof technology on the costs of getting betterinformation, but it also depends on govern-ment policy.
Financial markets are also affected bypolitical economy. Government policiestoward financial markets are influenced bythe wishes of powerful groups and the self-interest of politicians. Competition oftensuffers from that influence. In the UnitedStates, until the mid-1990s, state banks per-suaded governments to shelter them fromcompetition by maintaining unwarranted
116 WORLD DEVELOPMENT REPORT 2005
State sources1%
Banks22%
Banks 5%
State sources5%
Equity 5%
Small firms Large firms
Other 13%
Family & friends4%
Family &friends 11%
Other12%
Internal funds 70% Internal funds 52%
Note: The data are for firms in Bangladesh, Brazil, Cambodia, Guatemala, India, Indonesia, Kenya, Pakistan, Tanzania,and Uganda. Small firms are defined as those employing fewer than 10 people, large firms as those employing 50 ormore.Source: World Bank Investment Climate Surveys, WDR Surveys of Micro and Informal Firms.
Figure 6.2 Sources of fixed investment financing differ for small and large firms
08_WDR_Ch06.qxd 8/24/04 12:38 PM Page 116
Finance and infrastructure 117
restrictions on interstate banking. And inJapan until the mid-1980s established bankspersuaded the government to protect themfrom competition from bond markets bymaintaining a rule that required would-bebond issuers to first get approval from acommittee that the banks controlled.10
Financial markets have a long history ofsimilar problems (box 6.1). Overcoming theproblems presents policymakers with achallenge at least as difficult as that createdby information failures.
Avoiding the pitfalls of traditionalgovernment interventionsResponding to market failures and politicalpressures, governments in the post–WorldWar II period intervened heavily in financialmarkets—directing credit to favored groups,guaranteeing loans by private banks, and pro-viding many financial services themselvesthrough state-owned banks and developmentfinance institutions (DFIs). To protect domes-tic banks, governments also restricted compe-tition from foreign banks and other financialinstitutions. They often justified state owner-ship and other interventions in the financialsector as ways of ensuring that small and ruralborrowers had access to funding. The overallrecord of these interventions is discouraging.
State ownership of banks. State-ownedbanks can be given broad mandates or thetask of developing a specific industry, sec-tor, or region—often making loans at subsi-dized rates. Their performance in the devel-oping world has generally been poor.Having a large proportion of state owner-ship in the banking sector has been foundto reduce overall access to financing, reducecompetition, worsen the allocation ofcredit, and increase the likelihood of finan-cial crises.11 Studies of bank privatization inBrazil, Egypt, and Nigeria find less govern-ment ownership is associated with betterbank performance.12 State-owned banks arefrequently associated with weak gover-nance, corruption, and poor procedures forcollecting debts from borrowers. As cross-country studies show, state ownership ofbanks, by impeding private competition,can also impede the development of thefinancial system, hurting small and medium
firms particularly.13 Although their impor-tance has been diminishing, state-ownedbanks remain significant in many parts ofthe developing world (figure 6.3).
Development finance institutions. By subsi-dizing credit to customers unable to borrowfrom traditional banks, DFIs can be justi-fied if they overcome a market failure cost-effectively. A few have been able to lendprofitably and maintain high repaymentrates without the use of traditional collat-eral.14 More often, they have supportedpolitical projects with little economic valueor benefited favored constituencies. Theyusually lack disciplining tools, such as activeprofit-motivated shareholders. Becausethey raise funds through the tax system orgovernment-guaranteed borrowing ratherthan through deposits, they often have aweak sense of the cost of capital.
Improvements in governance can beginto change this. For example, the Thai Bankfor Agriculture and Agricultural Coopera-tives is an unusual case of a development
Throughout history governments in need offunds have found it convenient to expropri-ate the financial assets of their citizens,often by repudiating debt. In England thecycle of expropriation was broken onlywhen the monarchy recognized that thesums from taxing production on privateproperty outweighed those from periodicexpropriation.The Crown first seized andsold vast lands owned by its rivals—thechurch and the nobles—thus creating amarket for land. A dispersed landholdinggentry then emerged, which usedparliament as a coordinating mechanism toprotect their economic interests.
Over time the economic might of thegentry grew so much that they could openlydefy the Crown and the nobles inparliament, in part because their wealthensured that they could hire their own armyif necessary.The gentry thus used Parliamentto ensure that the Crown honored its com-mitment to respect property rights, the basisfor their economic prosperity, despite occa-sional attempts to renege. A credible com-mitment to respect and enforce propertyrights helped the government borrow vastsums to finance the British Empire.
Not all governments solved their finan-cial difficulties through taxation and wide-spread protection of property rights. InMexico in 1876, President Porfirio Díaz wasconfronted with the twin problems of politi-cal disorder and economic stagnation. Heneeded resources to combat his politicalopponents immediately, but Mexico’s longhistory of government defaults made bor-rowing from the private sector impossible.He could have forced loans and confiscatedproperty, but that would hurt productivityin the long run.
Díaz opted instead to protect the rightsof a select group of asset holders and usethe rents generated to combat his politicalopponents.The largest bank, Banamex, thegovernment’s primary financier, enjoyedspecial protections, including reserverequirements half those of other banks,exemptions from taxes, and the sole right toopen branches.While these arrangementsmight have suited Díaz, the lack of contesta-bility in financial markets would dampengrowth throughout the 20th century.
Source: Rajan and Zingales (2003) and Haber,Razo, and Maurer (2003).
B O X 6 . 1 Governments and finance markets: A long anddifficult history
08_WDR_Ch06.qxd 8/24/04 12:38 PM Page 117

118 WORLD DEVELOPMENT REPORT 2005
bank with mandated lending objectives thatdoes not depend on subsidies, yet succeedsin providing credit to farmers. In 1998 itextended loans to more than 80 percent ofThailand’s farming households.15 Its gover-nance arrangements hold local managersaccountable for their branch’s performanceand require managers to meet profit targets.
More often, however, DFIs make poorquality loans and fail to ensure their repay-ment. A study of 18 industrial DFIs foundthat almost 50 percent of their loans were inarrears.16 Credit does not always reach dis-advantaged borrowers, either. In Brazil therural finance credit program provides morethan 57 percent of its loans to the largest 2percent of borrowers, only 6 percent to thesmallest 75 percent of borrowers. Interestrate subsidies and low repayment rates alsostrain government budgets. Mexico injectedalmost $23 billion into agricultural DFIsbetween 1983 and 1992.17
Directed lending. Governments have oftendirected banks to lend to specific regionsand sectors, often singling out rural areas
where lending is discouraged by sparse pop-ulations, high transaction costs, and a lackof traditional collateral. Japan, Singapore,and South Korea appear to have had somesuccess with directed lending for manufac-turing, but experience in most countries hasbeen poor.18
Directing credit for some purposesmeans restricting it for others. In Colombiain the 1980s, a subsidized credit schemerequired firms to show that they needednew capacity, so credit was directed to thebuilding of new plants—and away fromimproving the efficiency of existing plants.Such direction works only when officials arebetter than bank managers—which is rarelythe case—at deciding whether new plantsare more valuable than greater efficiency.
Directing credit, even when it may helpmeet some social objective, is difficult inpractice because it pushes against the cur-rent of market forces. Lenders and borrow-ers want to lend and invest where thereturns are greatest, not in sectors deemeda priority by the government. So lendersreclassify loans to comply with the direc-tions, and borrowers surreptitiously usecredit for unintended purposes. Bothlenders and borrowers might bribe offi-cials to turn a blind eye. And as in SouthKorea during the height of its enthusiasmfor directed credit, markets can develop forborrowers with access to directed credit toon-lend to those without it. In theextreme, directed-credit policies merelyreallocate wealth and leave the ultimateallocation of credit unchanged. For thesereasons, directed credit often fails to reachits intended beneficiaries.19
Directing credit has also slowed thedevelopment of financial markets. Manydirected loans go to unprofitable projectsand are not repaid. Some borrowers simplyrefuse to repay their loans, hoping thatbeing in a favored sector will protect themfrom court action. And large, diverse firmscan operate an internal credit market,bypassing the political direction of creditand cutting banks out of the picture. Sobanks suffer losses and financial marketsfalter.20 Reflecting this experience, govern-ments are now backing away from directingcredit.
0
30
20
10
90
80
70
60
50
40
100
Perc
enta
ge o
f ban
k as
sets
at p
rivat
e co
mm
erci
al b
anks
MiddleEast &NorthAfrica
LatinAmerica
& theCaribbean
East Asia& Pacific
India DevelopedEurope &Central
Asia
1985
19952003
Note: “East Asia” includes South Korea, Malaysia, Philippines, and Thailand. “Europe and CentralAsia” includes Bulgaria, Croatia, Czech Republic, Hungary, Poland, Romania, Russia, Slovakia, andSlovenia. “Latin America & the Caribbean” includes Argentina, Bolivia, Brazil, Chile, Colombia,Costa Rica, El Salvador, Guatemala, Honduras, Mexico, Panama, Peru, Trinidad and Tobago,Uruguay, and República Bolivariana de Venezuela. “Middle East & North Africa” includes Algeria,Egypt, Jordan, Lebanon, Morocco, and Tunisia. “Developed” includes Australia, Austria, Belgium,Canada, Denmark, Finland, Germany, Greece, Italy, and Japan.Source: Data for 2003 are from Clarke, Cull, and Shirley (2003); data for 1985 and 1995 are from LaPorta, López-de Silanes, and Shleifer (2002).
Figure 6.3 State-owned banks are holding on, especially in India and in the Middle East and North Africa
08_WDR_Ch06.qxd 8/24/04 12:38 PM Page 118

Finance and infrastructure 119
Credit Guarantees. Credit guarantees offeredby governments can encourage more lendingto riskier borrowers, including new andsmall firms. But shifting the risk of default totaxpayers raises several practical challenges.Because guarantees encourage banks toworry less about credit risk and monitoringborrowers, default rates can be high, raisingissues of sustainability.21 To better alignincentives, programs can be designed thatrequire banks to share in the default risk,involve independent screening of loan appli-cations, and impose fees that are highenough to discourage banks from using theguarantee for loans that do not need it. Thesemeasures increase the costs facing borrow-ers, however, and so reduce participation bysmaller firms, which are often the intendedbeneficiaries.22 While many countries haveexperimented with these schemes, examplesof unambiguous success stories in develop-ing countries remain scarce.23
Better approachesGovernments are learning from the pastand taking new approaches that involve fivekey elements:
• Ensuring macroeconomic stability
• Fostering competition
• Securing the rights of borrowers, credi-tors, and shareholders
• Facilitating the flow of information
• Ensuring that banks do not take exces-sive risks.
Ensuring macroeconomic stability. Macro-economic stability—more specifically, lowinflation, sustainable debt, and realisticexchange rates—is fundamental to theeffective functioning of finance markets.Macroeconomic instability increases thevolatility of interest rates, exchange rates,and relative prices, imposing additionalcosts and risks on financial institutions andtheir clients. High inflation erodes the capi-tal of financial institutions and makes it dif-ficult to mobilize savings or to expand ser-vices. High fiscal deficits increase interestrates and spreads. The increase in holdingsof government paper by banks, mutualfunds, and investment funds crowds outcredit to the private sector, because these
providers of finance find it more profitableto hold government securities than to makeloans to firms. For example, in Brazil, theexpansion of government borrowingbetween 1995 and 2003 was associated witha slowdown in expansion of private sectorcredit.
Fostering competition. Restrictions on com-petition between providers of finance canmean slower economic growth, reducedemployment growth, and slower exit ofmature firms in concentrated bank mar-kets.24 Policies that impede competition—such as entry restrictions, restrictions onforeign banks, and state ownership ofbanks—hurt the financial system and eco-nomic performance. Removing these barri-ers to competition has been shown toimprove banking stability, reduce interestmargins, and expand access to finance.25
One way to foster competition is to(prudently) issue new domestic bankinglicenses. In the United States the wave ofmergers and acquisitions in the 1980s and1990s created large banks, which reducedlending to new and small firms. Yet fairlyliberal licensing policies allowed new banksto form to help offset the lack of supply andkeep interest margins low.26 Competition isalso benefiting from technological innova-tion, as in India’s rural areas (box 6.2).
Policymakers are sometimes concernedthat the competition from foreign bankswill weaken the banking system. However,evidence shows that foreign banks improvethe efficiency and performance of domesticbanks and reduce interest rate margins.27
This is what happened when the Philip-pines allowed more foreign bank competi-tion—interest rate spreads fell and the effi-ciency of domestic banks increased.28
Foreign banks can also use their cross-border experience to introduce innova-tions. Citibank responded to the scarcity ofgood credit information on individualfirms in many developing countries by find-ing other ways to assess creditworthiness.The company identifies industry segmentswith the potential to grow quickly and thenseeks out borrowers in those segments. InIndia it has about 500 customers in 15selected industrial segments.
08_WDR_Ch06.qxd 8/24/04 12:38 PM Page 119

120 WORLD DEVELOPMENT REPORT 2005
Microfinanciers provide thrift, credit, and otherfinancial services of very small amounts, mainlyto the poor, in both rural and urban areas.Theyoffer an alternative to banks, which in mostdeveloping countries serve only 5–20 percent ofthe population.They use noncollateralized loansto deliver short-term working capital tomicroentrepreneurs and households.
One of the key characteristics of microfinance,pioneered by Grameen Bank in Bangladesh andnow replicated throughout the developing world,is substituting joint liability, access to future loans,and frequent repayment periods for traditionalcollateral.These alternatives to collateral are espe-cially important for borrowers who do not haveassets to pledge—and for lenders who operate incountries with weak secured-lending laws andenforcement.
Microfinance has demonstrated its successin reducing poverty. By 2002 more than 1,000microfinance programs around the world hadreached about 30 million borrowers, lendingabout $3.5 billion, with an average loan size of$280. Microfinance has helped the poor increasehousehold income, build viable businesses, and
reduce their vulnerability to external shocks. Itcan also empower the poor, especially women.Subsidized microfinance relying on donors,however, is unlikely to be big enough to reachall potential borrowers.That will requirecommercial microfinance that mobilizes the sav-ings of the general public, raising questionsabout the appropriate role for governments.
Governments are sometimes tempted tomandate below-market interest rates, but thisusually causes more problems than it solves.Theremoval of interest rate controls in Indonesia in1983 allowed Bank Rakyat Indonesia to experi-ment with new financial products, most notablymarket-priced working capital and investmentcapital loans. By 1986 its microfinance businesshad turned from a chronic loss-maker to a prof-itable department.
Governments can also eliminate unfair com-petition from public institutions and changeregulations to facilitate competition on a levelplaying field. In particular, they can allow micro-finance institutions to transform themselvesinto licensed financial institutions and facilitatethe provision of microfinance by commercial
banks. In 1992 ProDem, a microfinancenongovernmental organization (NGO), becameBancoSol, the first commercial bank in LatinAmerica dedicated to microfinance.The trans-formation enabled the expansion from 14,300clients to 70,000 within five years ofcommercialization, and by 1998 BancoSol wasthe most profitable licensed bank in Bolivia.
As in other segments of the credit market,allowing the sharing of credit informationamong microlenders can foster microfinancelending, especially by commercial lenders thatmay not have preexisting relationships withborrowers in rural areas. South Africa has twoprivate credit bureaus operating in the microfi-nance sector. Information can be obtained bytouch-tone phone, and the microfinancebureaus charge much lower fees than largerbureaus—making them affordable even forsmall microlenders.
Source: Ghatak and Guinnane (1999); Morduch(1997); Morduch, Littlefield, and Hashemi (2003);Hubka and Zaide (2004); CGAP (1997); Klapper andKraus (2002); and www.mixmarket.org.
B O X 6 . 3 Commercial microfinanciers enter the market
Firms operating in rural areas often have ahard time getting financing, but financialinnovations and new technology are mak-ing a difference, as India shows.
The agricultural agency model uses athird-party intermediary to coordinate thefinancing of inputs, the delivery of produce tothe end buyer,and the repayment to the bankbefore the farmer receives the proceeds.Theintermediary improves information by advis-ing farmers on crop decisions that affect thequantity and quality of the produce.The inter-mediary can also negotiate better prices onfinal goods than individual farmers can.
The Kisan Credit Card, offered by com-mercial, rural, and cooperative banks, is atechnological innovation in providing creditto the agriculture sector in India, includingsmall farmers. Since its introduction in1998–99, some 31.6 million cards had beenissued by April 2003.Though not truly creditcards, the cards have advantages for borrow-
ers and lenders.They make it easier to getcredit and renew loans, once the initialscreening has been done.They reduce thenumber of visits to branches, and theyincrease the operation of accounts at desig-nated supply branches.
The increasing sophistication of finan-cial markets is helping farmers smooth theirincomes in the face of fluctuating pricesand harvests. Fledgling futures markets areallowing them to fix the prices they willreceive in advance. Innovations in insuranceare allowing them to protect themselvesfrom losses caused by poor weather.Thepayouts are based on an index measuringlocal weather, which allows an objectivedetermination of the payout and maintainsfarmers’ incentives to maximize their outputdespite poor weather.
Source: Hess and Klapper (2003) and WorldBank (2004j).
B O X 6 . 2 Expanding access to finance in rural areas—newapproaches in India
A second concern is that foreign entrymight reduce access to financing by smalland medium firms. But again, foreign bankshave been found to improve access to creditfor those firms. In Chile and Peru, foreignbanks loaned more to small firms than
domestic banks did, and in Argentina andChile, real growth in lending to small firmswas higher for foreign banks.29
While bank-to-bank competition isimportant, other sources of finance can alsostrengthen competition. For example, firmswith access to public bond financing have35 percent more debt (after controlling forother firm characteristics).30 Nonbankfinancial intermediaries can also broadenfinancial markets. For example, leasingcompanies and finance companies oftenfinance start-up firms unable to raise fundsfrom banks. As nonbank financial interme-diaries develop, they often securitize theirassets, further deepening securities mar-kets.31 Pension funds and contractual sav-ings can also compete to supply funds,increasing banking efficiency and loweringthe cost of capital.32 Finally, commercialmicrofinance is beginning to have animpact on financial services for microentre-preneurs and poor households (box 6.3).
How, then, to encourage the develop-ment of nonbank lenders? By not overregu-lating lenders that do not take deposits, andby harmonizing the tax treatment of finan-cial products. In Turkey, factoring compa-nies pay a 5 percent transaction tax while
08_WDR_Ch06.qxd 8/24/04 12:38 PM Page 120

Finance and infrastructure 121
banks pay only 1 percent.33 Pension rulescan also be liberalized as capital marketsmature and regulatory systems develop.For instance, investment in more assetclasses, such as equities, can be allowed.34
Better insurance regulations can alsoencourage insurance providers to innovateand operate efficiently—and to create acompetitive market open to new firms andthe exit of insolvent firms.35 Mutual fundscan be developed under strong accountingand auditing rules and strict disclosurerequirements.36
Securing the rights of borrowers, creditors,and shareholders. Governments can miti-gate the problems for creditors and share-holders—and increase their willingness toprovide finance—by ensuring that the par-ties have clearly defined rights and canenforce them.37 A strong legal environmentand strong enforcement are important foraccess to external finance and the develop-ment of financial markets. When creditorrights are weak, financial institutions will beless willing to extend credit to firms thathave a high risk of default. When share-holders’ rights are weak, investors will beless willing to provide firms with equity.38
Securing borrowers’ property rights toassets they can pledge as collateral (includ-ing land) can increase access to financingand investment (chapter 4). Secure prop-erty rights also allow firms to borrowlonger-term and encourage more foreignlending.39 The cost of external financing isalso lower in countries with stronger prop-erty rights protection and less corruption. Astudy of 37 countries found that if a coun-try improved its property rights protectionfrom the 25th to the 75th percentile, loanspreads would decline by 87 basis points.40
Strong creditor rights—stemming, say,from laws guaranteeing secured creditors’priority in the case of default—allowlenders to reduce their risk of future losses,therefore encouraging them to make moreloans. For example, one explanationoffered for the low level of private credit inMexico is that many social constituenciesmust be repaid before secured creditors,often leaving creditors with few assets toback their claims.41 Studies in the United
States show that small firms are 25 percentmore likely to be denied credit if they are instates that provide creditors with less pro-tection when the borrower is bankrupt.42
The effectiveness of creditor rights alsodepends on strong enforcement of the laws.Russia, for example, has “imported” stronglaws protecting shareholder and creditorrights, but the lack of an effective legal sys-tem to enforce these laws has been a bigimpediment.43 Laws and registries permit-ting the collateralization of movable prop-erty can offer even greater benefits tosmaller firms that are less likely to havefixed assets (box 6.4).
The need for strong shareholder rightsand good corporate governance has beenunderscored by structural changes in mostdeveloping countries—including privati-zation and the widespread listing of firmson stock markets.44 Improvements in cor-porate governance are associated withhigher operational performance of firms,through better management, better alloca-tion of resources, and other efficiencyimprovements.45 Governance is particu-larly important for foreign investors, whomay have informational disadvantages. Aglobal investor opinion survey by McKin-sey suggests that good governance mattersmost to investors (ranking higher thanfirm performance or growth prospects)and that institutional investors prefer to
Legal impediments previously restrictedthe use of movable property as collateral inRomania and thereby limited the access tocredit. First, the system did not allowlenders to access information on whetherother creditors or lenders had claims onthe same goods. Second, the enforcementof agreements and repossession of collater-alized goods was a long process (oftenexceeding the economic life of themovable good).
A new law, adopted in 1999, introduceda system for registering security interests.The registration, valid for five years, isrequired to secure new collateral.The lawprovides for both stronger enforcementand a new electronic archive of outstandingliens.This online collateral registry includes
all registered security interests.Ten opera-tors and 366 agents are licensed to registercollateral in the electronic archive.Thesupervisory authority provides guidelineson the archive’s operation and clarifies rulesand regulations.
The archive functions efficiently, allow-ing financial intermediaries to access infor-mation about creditors, debtors, or assetssecuring a commercial or civil transaction inthe country.This information, accessible bypeople all over the world, presents hugecost-saving and time-savingopportunities—improving the investmentclimate.
Source: Fleisig (1998) and Stoica and Stoica(2002).
B O X 6 . 4 Establishing a registry for movable collateral inRomania
08_WDR_Ch06.qxd 8/24/04 12:38 PM Page 121
122 WORLD DEVELOPMENT REPORT 2005
invest in countries where legal rules andenforcement are both strong.46
In countries where laws do not guaran-tee strong protection of shareholders, firmsmay be able to improve their access to exter-nal equity financing by voluntarily improv-ing their governance through greater trans-parency, preparing financial reportsaccording to international accounting stan-dards, and appointing independent direc-tors. So governance standards need not belegislated for all corporations. Governmentscan still facilitate shareholder monitoringby requiring all large and listed firms to dis-close financial and ownership information.Stricter regulation (in the form of high dis-closure requirements set by the stockexchange or government) and strongenforcement are associated with greatermarket liquidity, lower costs of capital, andhigher valuations of firms (box 6.5).47
Transparency and disclosure require-ments for listed firms are generally set andsupervised by the local exchange, but thegovernment may need to enforce exchangestandards.48 Differences in enforcement help
explain why the Czech Republic, whose gov-ernment took a relatively hands-offapproach to the enforcement of regulation ofthe capital markets, had an inactive equitymarket—while Poland, which had stricterenforcement of regulation and disclosure,witnessed strong growth in its capital mar-ket.49 In countries with developed financialintermediaries—such as brokers, accountingfirms, and investment advisers—exchangesmay be able to delegate some disclosureenforcement to these intermediaries andreduce the cost of enforcement. In emergingmarkets, however, government prosecutionmay be necessary to protect investors andpromote market development. Internation-ally agreed principles for corporate gover-nance create opportunities for governmentsto signal the quality of their regulatory sys-tems in this area (chapter 9).
Using credit bureaus to facilitate the flow ofinformation. One way lenders can addresstheir information disadvantage is to collectinformation about their customers directlythrough costly screening and monitoring.Lenders in most developed countries—andmore now in developing countries—can alsorely on reports from credit informationbureaus. These reports include loan paymenthistories that allow lenders to use informationon how borrowers met past loan obligationsto better predict future loan performance.Credit reporting also improves borrowers’incentives to repay loans promptly, becauselate payment with one lender can result insanctions by many institutions.50
Credit bureaus can increase bank lend-ing and reduce default rates. They also ben-efit small and new firms by alleviating creditrationing based on the lack of a credit his-tory.51 In one survey more than half thecredit bureaus indicated that credit historyinformation reduced the processing time,costs, and default rates in their country bymore than 25 percent.52 On average, coun-tries without credit registries have a private-credit-to-GDP ratio of about 16 percent,those with publicly owned credit registriesabout 40 percent, and those with privatebureaus about 67 percent.53
Governments can create a supportiveenvironment for credit bureaus by enacting
South Korea is leading corporate governancereforms in East Asia. Ceilings have beenremoved on foreign ownership.Theminimum shareholding required to under-take class actions has been reduced, prompt-ing many instances of shareholder activism(for instance, People’s Solidarity ParticipatoryDemocracy challenged Samsung Electronicsand SK Telecom).The appointment ofoutside directors on the boards of financialinstitutions and major conglomerates isrequired. Some exchange listingrequirements were also added, which applyto firms with an asset size greater than W2trillion (about $2 billion).Those firms musthave an audit committee with at least two-thirds of the directors from outside the firmand an outside director as chairman.Thesereforms promise to ease the mobilization ofinvestment capital.
In 2001 BOVESPA (the São Paulo StockExchange) established a new market seg-ment, Novo Mercado, modeled on theNeuer Market in Germany.To attract smallerenterprises, new market segments in other
exchanges usually loosen listingrequirements. But Novo Mercado goesagainst this trend, requiring corporate gov-ernance requirements far stricter than inthe old segment. At least 25 percent of thecapital stock must be floating in the marketand listed companies must adopt interna-tionally recognized accounting standards(U.S. generally accepted accounting princi-ples or International Financial ReportingStandards). In a merger both controllingand minority shareholders must be treatedequally.The companies can issue only com-mon shares—something particularly impor-tant in Latin America, where the use of non-voting preferred stock is commonplace andallows certain shareholders to exert controldisproportionate to their financial commit-ment.The migration to the Novo Mercadolifted the market value of companiesaround the migration date.
Source: McKinsey & Company (2002); Dyer(2001a, 2001b); Weiss (2002); BOVESPA Website; Nova Mercado regulations 10.303; and deCarvalho (2003).
B O X 6 . 5 Improving corporate governance in Brazil andSouth Korea
08_WDR_Ch06.qxd 8/24/04 12:38 PM Page 122
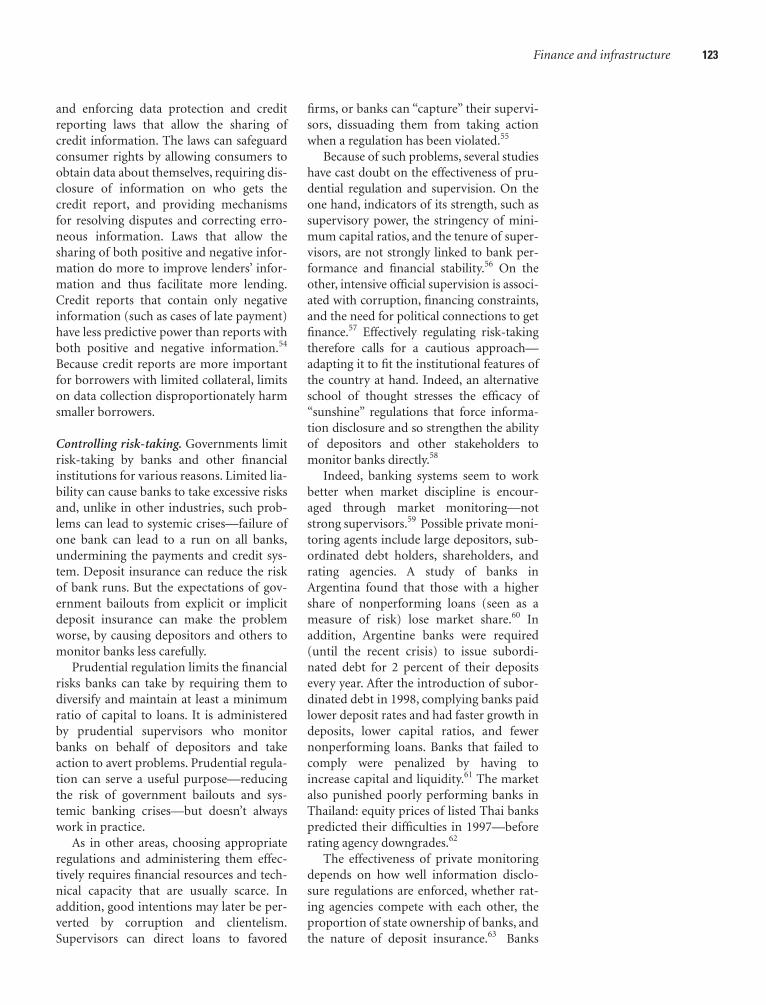
Finance and infrastructure 123
and enforcing data protection and creditreporting laws that allow the sharing ofcredit information. The laws can safeguardconsumer rights by allowing consumers toobtain data about themselves, requiring dis-closure of information on who gets thecredit report, and providing mechanismsfor resolving disputes and correcting erro-neous information. Laws that allow thesharing of both positive and negative infor-mation do more to improve lenders’ infor-mation and thus facilitate more lending.Credit reports that contain only negativeinformation (such as cases of late payment)have less predictive power than reports withboth positive and negative information.54
Because credit reports are more importantfor borrowers with limited collateral, limitson data collection disproportionately harmsmaller borrowers.
Controlling risk-taking. Governments limitrisk-taking by banks and other financialinstitutions for various reasons. Limited lia-bility can cause banks to take excessive risksand, unlike in other industries, such prob-lems can lead to systemic crises—failure ofone bank can lead to a run on all banks,undermining the payments and credit sys-tem. Deposit insurance can reduce the riskof bank runs. But the expectations of gov-ernment bailouts from explicit or implicitdeposit insurance can make the problemworse, by causing depositors and others tomonitor banks less carefully.
Prudential regulation limits the financialrisks banks can take by requiring them todiversify and maintain at least a minimumratio of capital to loans. It is administeredby prudential supervisors who monitorbanks on behalf of depositors and takeaction to avert problems. Prudential regula-tion can serve a useful purpose—reducingthe risk of government bailouts and sys-temic banking crises—but doesn’t alwayswork in practice.
As in other areas, choosing appropriateregulations and administering them effec-tively requires financial resources and tech-nical capacity that are usually scarce. Inaddition, good intentions may later be per-verted by corruption and clientelism.Supervisors can direct loans to favored
firms, or banks can “capture” their supervi-sors, dissuading them from taking actionwhen a regulation has been violated.55
Because of such problems, several studieshave cast doubt on the effectiveness of pru-dential regulation and supervision. On theone hand, indicators of its strength, such assupervisory power, the stringency of mini-mum capital ratios, and the tenure of super-visors, are not strongly linked to bank per-formance and financial stability.56 On theother, intensive official supervision is associ-ated with corruption, financing constraints,and the need for political connections to getfinance.57 Effectively regulating risk-takingtherefore calls for a cautious approach—adapting it to fit the institutional features ofthe country at hand. Indeed, an alternativeschool of thought stresses the efficacy of“sunshine” regulations that force informa-tion disclosure and so strengthen the abilityof depositors and other stakeholders tomonitor banks directly.58
Indeed, banking systems seem to workbetter when market discipline is encour-aged through market monitoring—notstrong supervisors.59 Possible private moni-toring agents include large depositors, sub-ordinated debt holders, shareholders, andrating agencies. A study of banks inArgentina found that those with a highershare of nonperforming loans (seen as ameasure of risk) lose market share.60 Inaddition, Argentine banks were required(until the recent crisis) to issue subordi-nated debt for 2 percent of their depositsevery year. After the introduction of subor-dinated debt in 1998, complying banks paidlower deposit rates and had faster growth indeposits, lower capital ratios, and fewernonperforming loans. Banks that failed tocomply were penalized by having toincrease capital and liquidity.61 The marketalso punished poorly performing banks inThailand: equity prices of listed Thai bankspredicted their difficulties in 1997—beforerating agency downgrades.62
The effectiveness of private monitoringdepends on how well information disclo-sure regulations are enforced, whether rat-ing agencies compete with each other, theproportion of state ownership of banks, andthe nature of deposit insurance.63 Banks
08_WDR_Ch06.qxd 8/24/04 12:38 PM Page 123
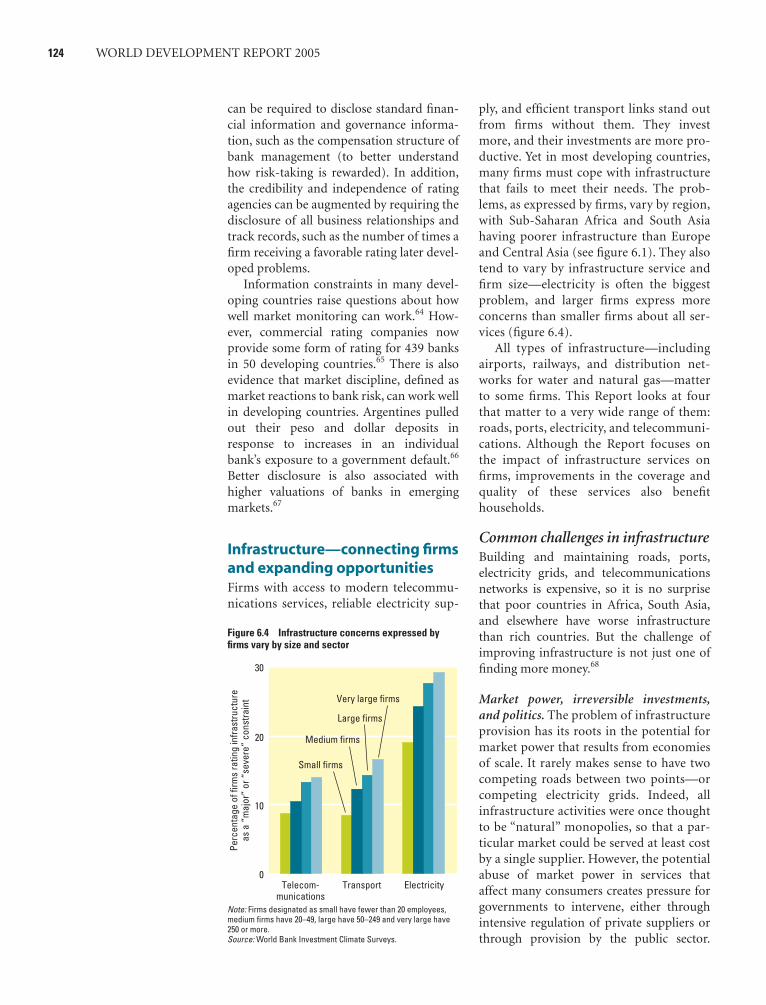
124 WORLD DEVELOPMENT REPORT 2005
can be required to disclose standard finan-cial information and governance informa-tion, such as the compensation structure ofbank management (to better understandhow risk-taking is rewarded). In addition,the credibility and independence of ratingagencies can be augmented by requiring thedisclosure of all business relationships andtrack records, such as the number of times afirm receiving a favorable rating later devel-oped problems.
Information constraints in many devel-oping countries raise questions about howwell market monitoring can work.64 How-ever, commercial rating companies nowprovide some form of rating for 439 banksin 50 developing countries.65 There is alsoevidence that market discipline, defined asmarket reactions to bank risk, can work wellin developing countries. Argentines pulledout their peso and dollar deposits inresponse to increases in an individualbank’s exposure to a government default.66
Better disclosure is also associated withhigher valuations of banks in emergingmarkets.67
Infrastructure—connecting firmsand expanding opportunitiesFirms with access to modern telecommu-nications services, reliable electricity sup-
ply, and efficient transport links stand outfrom firms without them. They investmore, and their investments are more pro-ductive. Yet in most developing countries,many firms must cope with infrastructurethat fails to meet their needs. The prob-lems, as expressed by firms, vary by region,with Sub-Saharan Africa and South Asiahaving poorer infrastructure than Europeand Central Asia (see figure 6.1). They alsotend to vary by infrastructure service andfirm size—electricity is often the biggestproblem, and larger firms express moreconcerns than smaller firms about all ser-vices (figure 6.4).
All types of infrastructure—includingairports, railways, and distribution net-works for water and natural gas—matterto some firms. This Report looks at fourthat matter to a very wide range of them:roads, ports, electricity, and telecommuni-cations. Although the Report focuses onthe impact of infrastructure services onfirms, improvements in the coverage andquality of these services also benefithouseholds.
Common challenges in infrastructureBuilding and maintaining roads, ports,electricity grids, and telecommunicationsnetworks is expensive, so it is no surprisethat poor countries in Africa, South Asia,and elsewhere have worse infrastructurethan rich countries. But the challenge ofimproving infrastructure is not just one offinding more money.68
Market power, irreversible investments,and politics. The problem of infrastructureprovision has its roots in the potential formarket power that results from economiesof scale. It rarely makes sense to have twocompeting roads between two points—orcompeting electricity grids. Indeed, allinfrastructure activities were once thoughtto be “natural” monopolies, so that a par-ticular market could be served at least costby a single supplier. However, the potentialabuse of market power in services thataffect many consumers creates pressure forgovernments to intervene, either throughintensive regulation of private suppliers orthrough provision by the public sector.
20
10
Perc
enta
ge o
f firm
s ra
ting
infra
stru
ctur
eas
a “
maj
or”
or “
seve
re”
cons
train
t
0
30
Telecom-munications
Transport Electricity
Medium firms
Large firms
Very large firms
Small firms
Note: Firms designated as small have fewer than 20 employees,medium firms have 20–49, large have 50–249 and very large have250 or more.Source: World Bank Investment Climate Surveys.
Figure 6.4 Infrastructure concerns expressed byfirms vary by size and sector
08_WDR_Ch06.qxd 8/24/04 12:38 PM Page 124
Finance and infrastructure 125
Whether provision is public or private, gov-ernments tend to tightly control the pricesthat infrastructure providers charge and areoften reluctant to allow prices to rise evenwhen costs have.
This reluctance can create problemsbecause of another feature of many infra-structure services—long-lived, immobileinvestments. Once built, a road or hydro-electric dam cannot sensibly be disman-tled and moved elsewhere. Investors ininfrastructure are often vulnerable, there-fore, to changes in government regula-tions, including those limiting prices.Before they invest, the government maypromise them prices high enough to coverthe costs of investment, but afterward thegovernment will be tempted to please cus-tomers and voters by keeping prices low.So long as prices cover operating costs, theinvestors cannot credibly threaten to with-draw their services.
The underlying problem in the provi-sion of much infrastructure is thus thecombination of two reasonable concerns:customers fear that firms will use theirmarket power to overcharge, and firms fearthat governments will use their regulatorypower to prevent them from covering theircosts. Private firms originally createdmuch of the world’s infrastructure, but theplaying out of these fears, combined with aprevailing skepticism about markets andprivate ownership, led to widespreadnationalization of infrastructure afterWorld War II.69
Under public provision, however, theproblems reemerged in different guisesand were joined by others. Infrastructureservices remained highly politicized, andgovernments frequently kept prices belowcosts. The low prices were sometimes pre-sented as necessary to help the poor, butthe beneficiaries tended to be those whohad access to services, so the poorestmembers of the community usuallymissed out. To take just one example, astudy of the incidence of “lifeline” elec-tricity tariffs in Honduras, under whichthe government subsidized the first blockof household electricity consumption,found that about 80 percent of the subsi-dies went to households that were not
poor.70 Governments also used their infra-structure agencies to channel assistance toparticular regions and give jobs to favoredgroups, increasing the agencies’ costs andfrustrating attempts to hold themaccountable for the efficient delivery ofservices. With high costs and low prices,the agencies were unable to finance invest-ment from their own cash flows or borrowon their own credit (box 6.6).
As long as governments heavily subsi-dized public infrastructure agencies, theagencies could still operate and expand.Fiscal pressures and mounting dissatisfac-tion with public services, however, madegovernments reluctant to go on providinglarge subsidies. That—combined with achange in the prevailing views about mar-kets and private ownership—led manygovernments to turn again to the privatesector for at least some infrastructure ser-vices. While public provision remainsimportant, private participation has nowspread throughout much of the developingworld (figure 6.5).
Indian electricity utilities generally provideunsatisfactory service to their customers,whether firms or households. In a recent bud-get document the central government notedthat electricity shortages routinely lead tooutages and voltage fluctuations that disruptall aspects of economic life—and require sub-stantial investments in voltage stabilizers,generators, and new motors.
Most electricity is generated and sup-plied by state-owned electricity boards,which are experiencing severe financial dif-ficulties and draining state budgets. Beforeprivatizing its electric utility in 2002, forexample, the Delhi government provided itwith implicit subsidies of $200 to $300 mil-lion a year, in loans unlikely to be repaid.Even so, the company still faced financialproblems and provided poor service: powercuts were common in summer and winter.
The problems in Delhi, in other parts ofIndia,and indeed in much of the developingworld are political.Under pressure from well-organized groups of voters,governmentshave kept average prices below average costs,allowing politically influential customers topay especially low prices.Farmers oftenreceive electricity for irrigation pumps atprices well below costs.
The subsidies became popular in thelate 1970s. In Andhra Pradesh the govern-ment offered flat-rate tariffs to farmers as anelection promise. Soon after, in Tamil Nadu,demonstrations by the AgriculturalistsAssociation led to the provision of free elec-tricity to some farmers. Other states thenfollowed with their own agricultural subsidyprograms. Many of the recipients are fairlywell-off land-owning farmers.
Farmers are not the only beneficiaries:many customers steal their electricity, cost-ing suppliers an estimated $4 billion a year.According to one report, utility employeeswho conspire in the theft of electricity canreceive many times their annual salary inbribes.
Although some farmers, employees,and politicians benefit, low prices discour-age both the conservation of power andfurther investment in increasing supplyand improving its reliability. That is whyother users, including many firms, have topay more.
Source: Agarwal, Alexander, and Tenenbaum(2003); Dubash and Rajan (2001); India–Ministry of Finance (2003); and Lal (2004).
B O X 6 . 6 The political economy of electricity in India
08_WDR_Ch06.qxd 8/24/04 12:38 PM Page 125
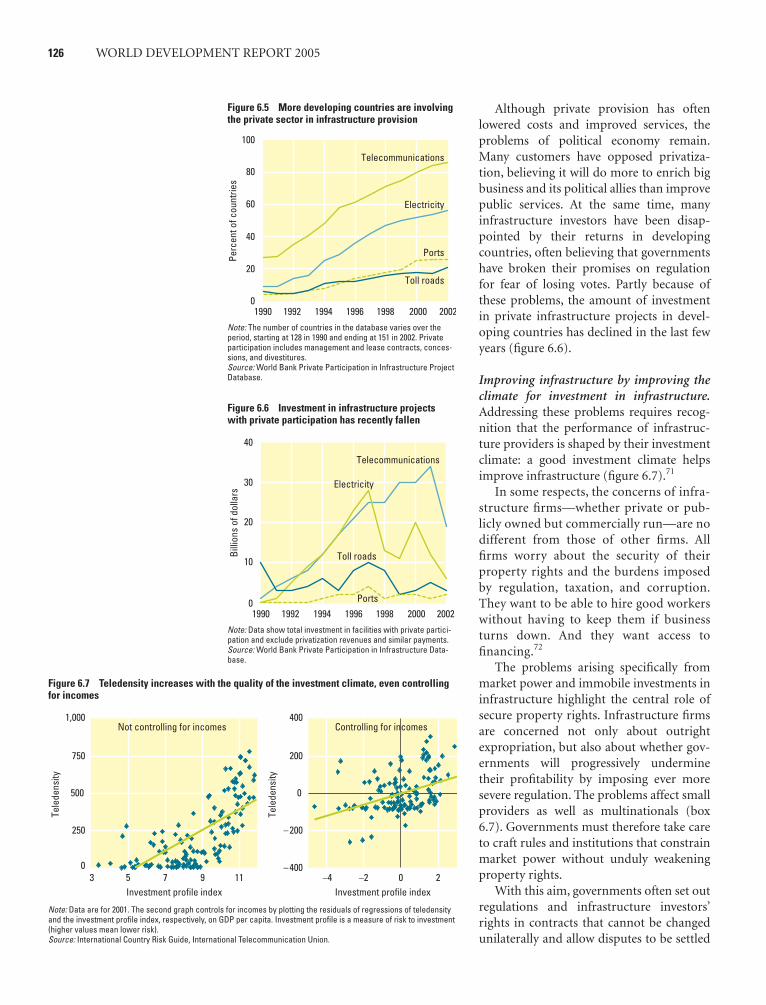
126 WORLD DEVELOPMENT REPORT 2005
Although private provision has oftenlowered costs and improved services, theproblems of political economy remain.Many customers have opposed privatiza-tion, believing it will do more to enrich bigbusiness and its political allies than improvepublic services. At the same time, manyinfrastructure investors have been disap-pointed by their returns in developingcountries, often believing that governmentshave broken their promises on regulationfor fear of losing votes. Partly because ofthese problems, the amount of investmentin private infrastructure projects in devel-oping countries has declined in the last fewyears (figure 6.6).
Improving infrastructure by improving theclimate for investment in infrastructure.Addressing these problems requires recog-nition that the performance of infrastruc-ture providers is shaped by their investmentclimate: a good investment climate helpsimprove infrastructure (figure 6.7).71
In some respects, the concerns of infra-structure firms—whether private or pub-licly owned but commercially run—are nodifferent from those of other firms. Allfirms worry about the security of theirproperty rights and the burdens imposedby regulation, taxation, and corruption.They want to be able to hire good workerswithout having to keep them if businessturns down. And they want access tofinancing.72
The problems arising specifically frommarket power and immobile investments ininfrastructure highlight the central role ofsecure property rights. Infrastructure firmsare concerned not only about outrightexpropriation, but also about whether gov-ernments will progressively underminetheir profitability by imposing ever moresevere regulation. The problems affect smallproviders as well as multinationals (box6.7). Governments must therefore take careto craft rules and institutions that constrainmarket power without unduly weakeningproperty rights.
With this aim, governments often set outregulations and infrastructure investors’rights in contracts that cannot be changedunilaterally and allow disputes to be settled
01990 1992 1994 1996 1998 2000 2002
20
40
60
80
100
Perc
ent o
f cou
ntrie
s
Electricity
Ports
Toll roads
Telecommunications
Note: The number of countries in the database varies over theperiod, starting at 128 in 1990 and ending at 151 in 2002. Privateparticipation includes management and lease contracts, conces-sions, and divestitures.Source: World Bank Private Participation in Infrastructure ProjectDatabase.
Figure 6.5 More developing countries are involvingthe private sector in infrastructure provision
01990 1992 1994 1996 1998 2000 2002
10
20
30
40
Billi
ons
of d
olla
rs
Toll roads
Ports
Telecommunications
Electricity
Note: Data show total investment in facilities with private partici-pation and exclude privatization revenues and similar payments.Source: World Bank Private Participation in Infrastructure Data-base.
Figure 6.6 Investment in infrastructure projectswith private participation has recently fallen
3 5 7Investment profile index
Tele
dens
ity
9 110
250
500
750
1,000
–4 –2 0Investment profile index
Controlling for incomesNot controlling for incomes
Tele
dens
ity
2–400
–200
0
200
400
Note: Data are for 2001. The second graph controls for incomes by plotting the residuals of regressions of teledensityand the investment profile index, respectively, on GDP per capita. Investment profile is a measure of risk to investment(higher values mean lower risk). Source: International Country Risk Guide, International Telecommunication Union.
Figure 6.7 Teledensity increases with the quality of the investment climate, even controllingfor incomes
08_WDR_Ch06.qxd 8/24/04 12:38 PM Page 126

Finance and infrastructure 127
by domestic or international arbitrationwhen investors do not trust the indepen-dence or reliability of local courts (chapter4). Decisionmaking about the implementa-tion of rules is often delegated to indepen-dent regulatory agencies more insulatedthan politicians from day-to-day politicalpressures (see box 5.2).73
To work well, however, the government’sapproach must not only secure investors’property rights on paper. To be credible tofirms, the arrangement must be sustainable,which means it must be perceived as rea-sonably fair and legitimate by consumers(chapter 2). Arrangements widely perceivedas legitimate and fair thus reduce risks facedby providers, lower the returns that com-mercial investors must be promised, and solower the prices that customers must pay,for any given degree of legal protection (fig-ure 6.8).
One cause of popular resistance to pri-vate participation in infrastructure in the1990s was the opacity of some proceduresused to privatize infrastructure businessesand adjust the tariffs the privatized businesscould charge. In the absence of trans-parency, suspicions were reasonably raised
about whether bribes or the public interesthad motivated policy. Responding to theseconcerns, most countries have turned totransparent competitive bidding to awardcontracts. Such countries as Brazil, Panama,and Peru now publish many infrastructureconcession contracts on the Internet.74 In2002 Mexico passed a freedom-of-informa-tion law that will require information aboutsuch contracts to be made public.
The creation of independent regulatoryagencies can be viewed as an attempt toreconcile the partly competing demandsfor investor protection and public legiti-macy. If legitimacy could be ignored,investors’ property rights would be mostsecure if contractual tariff adjustment ruleswere interpreted by independent interna-tional experts and serious disputes resolvedby international arbitration. Using nationalregulatory agencies, courts, or arbitrationincreases one type of risk for investors,because the national institutions are moresusceptible to political pressures to keepprices below costs—but decisions made bynational institutions may be viewed asmore legitimate, enhancing the sustainabil-ity of the arrangements.
Much private investment in infrastructure comesfrom multinationals from rich countries in Asia,Europe, and North America.When concerns areexpressed about the investment climate for infra-structure providers, it is these firms that most nat-urally come to mind. However, small (often infor-mal) infrastructure providers are also importantfor electricity and telecommunications, especiallyin rural areas, and the investment climate forthem matters, too.
Phone operations in BangladeshIn many countries small entrepreneurs buy amobile phone and then run a small businesscharging others to use it. In Bangladesh, withone of the world’s lowest telephone densitiesand waiting times of many years for a fixed con-nection, village phone operators, most of themwomen, provide mobile phone access to theirrural neighbors. Benefiting in many cases fromloans from the Grameen Bank, village phoneoperators are present in thousands of villages.At fairly low cost they enable villagers to com-municate with people in markets in neighbor-ing towns—avoiding the need to walk there to
find out the prices of commodities.This valuableservice has been hampered by the state-ownedcompany BTTB, which has used its monopolyover fixed lines to restrict interconnectionsbetween mobile phones and the fixed-line net-work.
Small electricity suppliers in CambodiaIn Cambodia the biggest electricity supplier isthe state-owned Electricité du Cambodge,which supplies Phnom Penh and a few towns.But several hundred small private providers sup-ply electricity to more than 100,000 householdsand small firms in rural areas, sometimes byrecharging batteries and sometimes throughmetered connections to small electricity grids.Although charging fairly high prices, they sup-ply customers who would otherwise have tosupply themselves or go without.
By law these private providers requirelicenses, which the government issues for arenewable term of three years. Because the capi-tal invested in electricity grids can have a usefullife of more than three years and the assets can-not be costlessly dismantled and moved else-
where, uncertainty about license renewals cre-ates a policy risk that can discourage investmentand increase electricity prices. (It alsoencourages the substitution of easily movedinvestments for those less costly but less easilymoved.) The providers do not know whethertheir license will be renewed—or what bribethey might be asked to pay to ensure itsrenewal. Most of the small providers are, in fact,unlicensed.They thus face a different policy risk:being prosecuted and closed down—or havingto pay a bribe to avoid that.
All providers are also vulnerable to a changein government policy that would give eitherElectricité du Cambodge or other providersexclusive rights to provide service. All arevulnerable to the possibility that, as they growand become better established, the governmentwill come under pressure to regulate the pricesthey charge in a way that undermines their prof-itability.
Source: PPIAF and World Bank (2002); Burr (2000);and Cohen (2001).
B O X 6 . 7 Improving the investment climate for small private providers of infrastructure
Strength of legal protections
Rate
of r
etur
n th
at m
ust b
e pr
omis
ed
Rules perceived as unfair
Rules perceived as fair
Figure 6.8 Perceived fairness allowslower rates of return to be promisedfor a given legal protection
08_WDR_Ch06.qxd 8/24/04 12:38 PM Page 127

128 WORLD DEVELOPMENT REPORT 2005
Competition has the power to trans-form infrastructure industries by increas-ing legitimacy and strengthening investors’property rights. It pushes firms to becomemore efficient and cut prices. As a result, ithelps assure customers that they are get-ting a reasonable deal. This in turn reducespressure on governments to regulate inways that weaken investors’ propertyrights. Where competition works, it canthus help infrastructure provision escapethe problems that have traditionallyafflicted it under both public and privateprovision.
Private participation is often advocatedbecause it provides an alternative sourceof financing to governments that havelimited resources. Such reasoning isflawed—and can encourage privatizationwith few real benefits (box 6.8). The bigproblem is paying for services, not financ-ing them, and though private investorsmay finance services, they don’t pay forthem.75
The real advantage of well-designedprivate participation is different anddeeper: it lies in changing the politicaleconomy of infrastructure provision. First,
when the government is no longer aprovider of services, it can more easilyallow genuine competition (see box 5.1).So private participation can be part of astrategy to help garner the benefits of com-petition—reducing costs and the prop-erty-rights problems of intensive regula-tion. Second, to attract private investment,a government needs to make a crediblecommitment to allow prices to cover costsand not interfere in commercial opera-tions—a commitment it cannot makeunder public provision, because it canrenege on commitments to public agencieswith impunity. If a government can credi-bly make this commitment to investors byusing the policies described above—andsimultaneously persuade customers thattheir interests are being protected—it willhave gone much of the way toward creat-ing a good investment climate for infra-structure providers, thereby doing much toprovide good infrastructure services to allfirms and to their broader societies.
Improving public management. Althoughprivate participation plays a powerful role,governments remain major financiers and
Traditional government accounting emphasizesthe cash deficit as a measure of fiscal performanceand the level of ordinary public debt as a measureof fiscal position.The focus on these twoindicators—at the expense of measures that incor-porate noncash costs,assets,and traditionally “off-balance-sheet”debt—encourages two biases ininfrastructure provision.
First, it discourages profitable public invest-ment and maintenance. Even when investmentor maintenance is expected to generate futurerevenues for the government that outweigh theinitial expenditure, the immediate effect is toincrease the cash deficit and debt. Other biases,such as politicians’ desire for ribbon cutting andbig bribes, may encourage public investmentprojects, but there is evidence thatgovernments sometimes invest too little ininfrastructure, especially when under pressureto reduce cash deficits and debt.
Second, the focus on cash deficits and debtencourages governments to seek private financ-ing for infrastructure projects, irrespective oftheir merits, and then subsidize the projects inways that don’t show up in budgets and
accounts. For example, such a focus encouragesa government to get a toll road privatelyfinanced, and to ensure its creditworthiness byguaranteeing the project company’s debt orproviding a minimum revenue guarantee underwhich the government tops up the toll revenueif it falls below a threshold. Although the guar-antees are valuable to the project company andcostly to the government, they typically leavethe cash deficit and public debt unchanged—unless and until the guarantee is called.
In another manifestation of the second biasthe focus on ordinary public debt can encouragegovernments to prefer off-balance-sheet debt.Instead of borrowing money to have a new powerplant constructed, for example, a government canask a private company to finance the plant, inreturn for the government’s signing a long-termpower-purchase agreement that commits it tomaking monthly payments to the privatecompany for, say, 20 years—with the monthly pay-ments having a present value equal to the cost ofthe power plant. In substance the “privatelyfinanced”arrangement is similar to the govern-ment’s having the power plant constructed with
borrowed money and repaying the loan inmonthly installments over 20 years: the govern-ment’s obligations to make payments may be thesame. Moreover, the arrangement does little toaddress the problems of political economydiscussed earlier.Yet under traditional accountingrules the “private”option spares the governmentfrom disclosing new debt.
Government guarantees and long-term pay-ment commitments can help get good projectsunder way, but as long as a government’saccounting fails to pick up the effects on the gov-ernment’s financial performance and financialposition, doubts may reasonably remain aboutthe government’s motivation for using them. Inthe long run the only way to remove the biases isfor governments to adopt accounting rules thattake into account the value of the assets createdor enhanced by public investment and mainte-nance and the costs of guarantees and long-termpayment commitments given to private investors.
Source: Easterly and Servén (2003); Irwin (2004);and Tanzi and Davoodi (1997).
B O X 6 . 8 Better government accounting, better government policy
08_WDR_Ch06.qxd 8/24/04 12:38 PM Page 128

Finance and infrastructure 129
providers of much infrastructure, especiallyroads. Even in sectors where a good deal ofinvestment is private, complementary publicinvestment in the parts of the sector ownedby the government can be important. Whengovernments do not provide or finance infra-structure, they often subsidize it—sometimesdirectly, sometimes indirectly through guar-antees and other instruments. Because gov-ernment budgets are always more limitedthan the plans of project proponents, govern-ments need ways of deciding how much tospend on infrastructure, how to allocate thatspending, and how to administer it.
The questions are both technically diffi-cult and politically charged. For example, ifthe government can afford to construct andmaintain just one more road in the nextyear, should it connect a poor rural area tothe capital, or should it strengthen the net-work around a congested and more pros-perous commercial center? Answeringrequires technical capability to undertakecost-benefit analyses, financial reportingthat reasonably reflects the true costs ofdifferent policies (box 6.8), and decision-making processes that give weight to theresults of those analyses while allowing asocially acceptable balancing of competinginterests.
When governments provide infrastruc-ture, they need to think about the best way toorganize themselves to do it. Traditionally,governments provided services through min-istries, but a desire to free service providersfrom some of the constraints of bureaucraticprocedures, give them some managerial inde-pendence from ministers, and increase theiraccountability for results led many govern-ments to establish legally independent,though still wholly government-owned,infrastructure agencies.
Some governments have taken extrasteps, such as making the state-ownedagency subject to company law, appointingas directors people outside the governmentwith commercial experience, and requiringthe agency to prepare audited financialreports according to high-quality account-ing standards. In South Africa, for example,the state-owned electricity agency, Eskom,is now a company with mainly outsidedirectors with business experience, which
reports according to international account-ing standards. Even when all these steps aretaken, however, it can be difficult for gov-ernments to resist political pressures tointerfere in business decisions and keepprices below costs. This is part of the reasonwhy many governments undertaking thesereforms have eventually turned to privateparticipation.
The challenges of improving infrastruc-ture are similar in all sectors, but there areenough differences between sectors, espe-cially in the opportunities for competition,to make it easier to discuss them one at atime.
Telecommunications—competitionmakes the differenceModern telecommunications services havebecome more important to firms of allkinds—allowing them to communicaterapidly and cheaply with distant suppliersand customers. The services provide accessto the Internet, underpin modern financialmarkets, and help governments communi-cate with firms and citizens. Moderntelecommunications are vital to the invest-ment climate. In Bangladesh, China,Ethiopia, and India the Bank’s InvestmentClimate Surveys found that garment man-ufacturers are more productive, pay higherwages, and grow more quickly whentelecommunications services are better.76
Among developed countries, investmentsin telecommunications in the last 20 yearsappear not only to have followed growth,but to have fueled it.77 In Latin America a10 percent increase in the number of mainphone lines per worker has been estimatedto increase output per worker by about 1.5percent.78
The extent to which telecommunica-tions services meet firms’ needs variesgreatly from country to country, as well aswithin countries. A three-minute call to theUnited States costs $0.17 from Finland, but$9 from Chad, where the government effec-tively taxes international calls to subsidizelocal calls and other services.79 Getting anew phone line takes only a couple of daysin Lithuania, but most of a year in Algeria(figure 6.9). In East Asia few firms reporthaving to pay a bribe to get a mainline
08_WDR_Ch06.qxd 8/24/04 12:38 PM Page 129

phone connection—in Africa, 20 percentor more do.80
On average, however, telecommunicationsservices have improved dramatically. Overthe last 20 years prices have fallen at an aver-age of 7 percent a year, while the number ofphone subscribers per capita in low-incomecountries has quintupled.81 The changes havebeen driven by changes in technology and bychanges in policy. Most governments have atleast partly privatized their country’s mainphone company and allowed at least somecompetition. The policy changes mean lower
prices, shorter waiting times for connections,and faster expansion of services (figure 6.10and figure 6.11).82
Although challenges remain, includingthe extension of access in rural areas (box6.9), the combination of technologicalchange and liberalization has transformedtelecommunications. Providers need nolonger be monopolies, and with the adventof cellular telephony, investments are nolonger so immobile. Together these changesgreatly reduce the policy-related risks ofinvestment in the sector and go much of theway toward solving the problems that havetraditionally afflicted infrastructure.
Many governments have yet to take fulladvantage of the opportunities of technolog-ical change. By 2002 all developed and mostLatin American countries allowed full com-petition in international telephone calls, butmost other countries did not (figure 6.12).
Electricity—competition is possible,but not as easyAccess to a reliable electricity supply at a rea-sonable price is vital for most firms—fromsmall factories in rural areas to multina-
130 WORLD DEVELOPMENT REPORT 2005
No separateregulator
Cumulative annual growth of phone mainlinesin developing countries
Separateregulator
Liberalized
Not liberalized
5.4
6.7
4.6
5.2
Note: Data cover years 1996–2001.Source: Qiang, Pitt, and Ayers (2004).
Figure 6.10 Liberalization and good regulation accel-erate the growth of phone connections
Monopoly Partialcompetition
Days
of d
elay
Competition
Algeria
Bangladesh
Kenya
IndiaBelarusGuatemala
Eritrea
HondurasEthiopiaEcuadorNicaraguaZambia
0
100
200
300
Note: Data for waiting times are for fixed-line connections, and arefrom 2002 and 2003. Countries with delays longer than 40 days areshown. Competition status relates to competition in local calls.Source: International Telecommunication Union and World BankInvestment Climate Surveys.
Figure 6.9 Long delays for phone connections arecommon, especially without competition
0–6 5 64321–1–2–3–4–5 0
Year relative to start of mobile competition
2
1
4
3
7
6
5
8
Inde
x of
tele
dens
ity
Côte d’IvoireUganda
GuineaMadagascar
Tanzania
Ghana
Zambia
Note: Teledensity refers to total number of fixed and mobile connections per capita.The data are rebased so that the index of teledensity equals 1 in the year the secondmobile operator enters the market. The countries selected are all those that liberal-ized before 1998, plus Uganda, which liberalized in 1998.Source: International Telecommunication Union and World Bank staff.
Figure 6.11 Competition spurs the spread of mobile phones in Sub-Saharan Africa
08_WDR_Ch06.qxd 8/24/04 12:38 PM Page 130
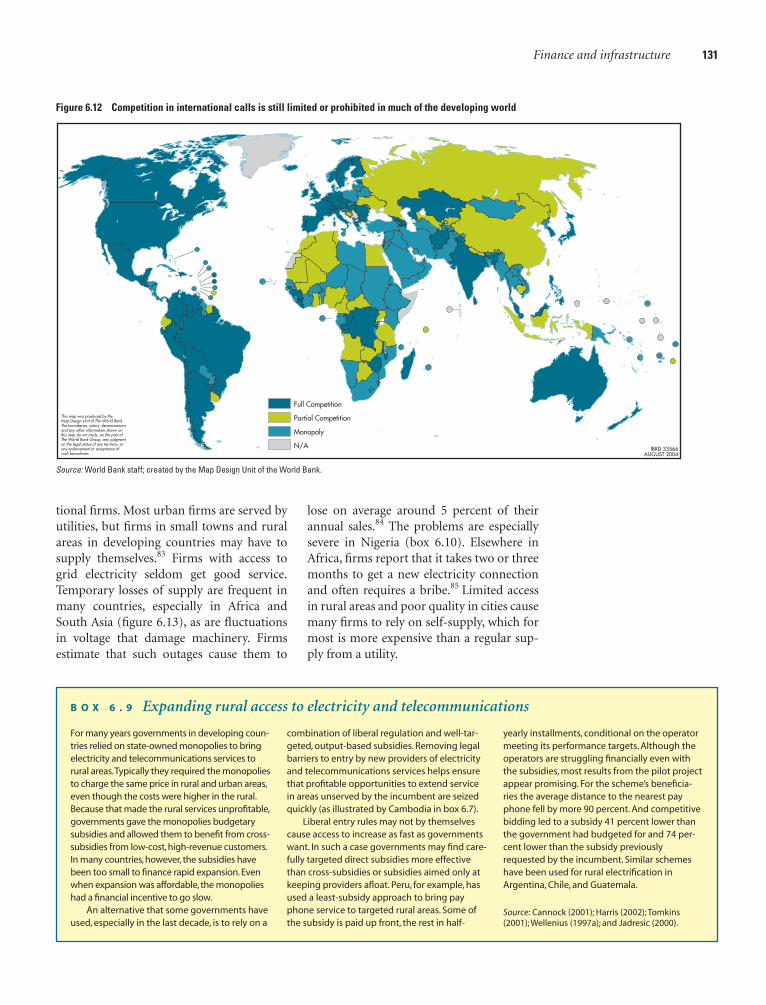
tional firms. Most urban firms are served byutilities, but firms in small towns and ruralareas in developing countries may have tosupply themselves.83 Firms with access togrid electricity seldom get good service.Temporary losses of supply are frequent inmany countries, especially in Africa andSouth Asia (figure 6.13), as are fluctuationsin voltage that damage machinery. Firmsestimate that such outages cause them to
lose on average around 5 percent of theirannual sales.84 The problems are especiallysevere in Nigeria (box 6.10). Elsewhere inAfrica, firms report that it takes two or threemonths to get a new electricity connectionand often requires a bribe.85 Limited accessin rural areas and poor quality in cities causemany firms to rely on self-supply, which formost is more expensive than a regular sup-ply from a utility.
Finance and infrastructure 131
For many years governments in developing coun-tries relied on state-owned monopolies to bringelectricity and telecommunications services torural areas.Typically they required the monopoliesto charge the same price in rural and urban areas,even though the costs were higher in the rural.Because that made the rural services unprofitable,governments gave the monopolies budgetarysubsidies and allowed them to benefit from cross-subsidies from low-cost, high-revenue customers.In many countries, however, the subsidies havebeen too small to finance rapid expansion. Evenwhen expansion was affordable, the monopolieshad a financial incentive to go slow.
An alternative that some governments haveused, especially in the last decade, is to rely on a
combination of liberal regulation and well-tar-geted, output-based subsidies. Removing legalbarriers to entry by new providers of electricityand telecommunications services helps ensurethat profitable opportunities to extend servicein areas unserved by the incumbent are seizedquickly (as illustrated by Cambodia in box 6.7).
Liberal entry rules may not by themselvescause access to increase as fast as governmentswant. In such a case governments may find care-fully targeted direct subsidies more effectivethan cross-subsidies or subsidies aimed only atkeeping providers afloat. Peru, for example, hasused a least-subsidy approach to bring payphone service to targeted rural areas. Some ofthe subsidy is paid up front, the rest in half-
yearly installments, conditional on the operatormeeting its performance targets. Although theoperators are struggling financially even withthe subsidies, most results from the pilot projectappear promising. For the scheme’s beneficia-ries the average distance to the nearest payphone fell by more 90 percent. And competitivebidding led to a subsidy 41 percent lower thanthe government had budgeted for and 74 per-cent lower than the subsidy previouslyrequested by the incumbent. Similar schemeshave been used for rural electrification inArgentina, Chile, and Guatemala.
Source: Cannock (2001); Harris (2002); Tomkins(2001); Wellenius (1997a); and Jadresic (2000).
B O X 6 . 9 Expanding rural access to electricity and telecommunications
Source: World Bank staff; created by the Map Design Unit of the World Bank.
Figure 6.12 Competition in international calls is still limited or prohibited in much of the developing world
08_WDR_Ch06.qxd 8/24/04 12:38 PM Page 131
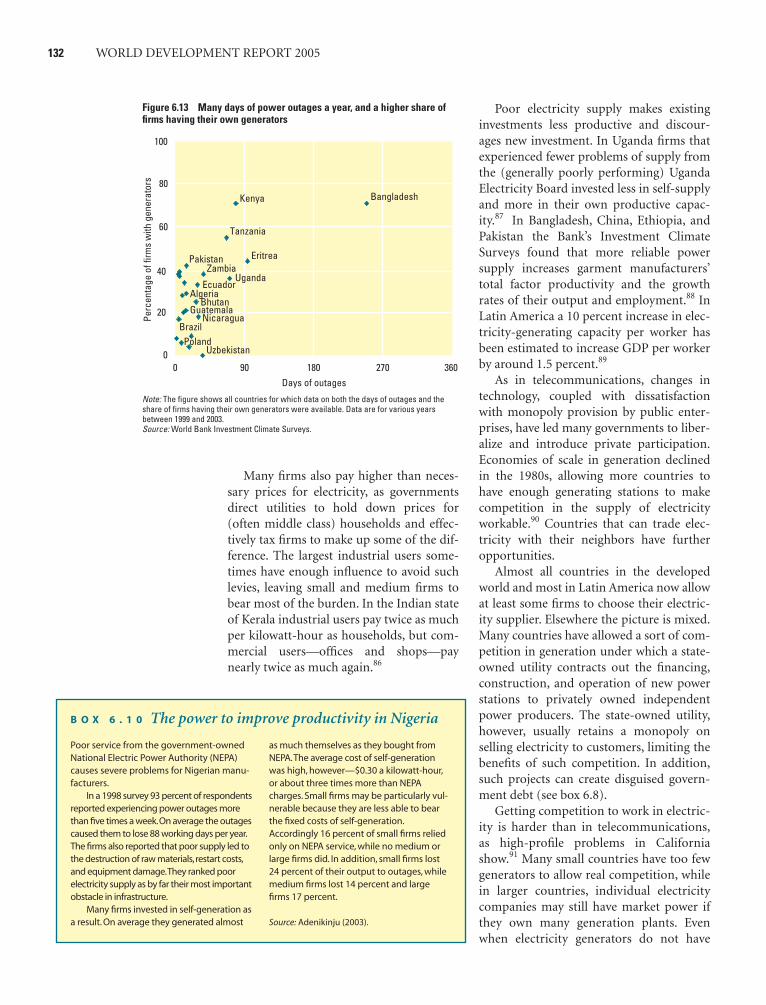
Poor electricity supply makes existinginvestments less productive and discour-ages new investment. In Uganda firms thatexperienced fewer problems of supply fromthe (generally poorly performing) UgandaElectricity Board invested less in self-supplyand more in their own productive capac-ity.87 In Bangladesh, China, Ethiopia, andPakistan the Bank’s Investment ClimateSurveys found that more reliable powersupply increases garment manufacturers’total factor productivity and the growthrates of their output and employment.88 InLatin America a 10 percent increase in elec-tricity-generating capacity per worker hasbeen estimated to increase GDP per workerby around 1.5 percent.89
As in telecommunications, changes intechnology, coupled with dissatisfactionwith monopoly provision by public enter-prises, have led many governments to liber-alize and introduce private participation.Economies of scale in generation declinedin the 1980s, allowing more countries tohave enough generating stations to makecompetition in the supply of electricityworkable.90 Countries that can trade elec-tricity with their neighbors have furtheropportunities.
Almost all countries in the developedworld and most in Latin America now allowat least some firms to choose their electric-ity supplier. Elsewhere the picture is mixed.Many countries have allowed a sort of com-petition in generation under which a state-owned utility contracts out the financing,construction, and operation of new powerstations to privately owned independentpower producers. The state-owned utility,however, usually retains a monopoly onselling electricity to customers, limiting thebenefits of such competition. In addition,such projects can create disguised govern-ment debt (see box 6.8).
Getting competition to work in electric-ity is harder than in telecommunications,as high-profile problems in Californiashow.91 Many small countries have too fewgenerators to allow real competition, whilein larger countries, individual electricitycompanies may still have market power ifthey own many generation plants. Evenwhen electricity generators do not have
132 WORLD DEVELOPMENT REPORT 2005
0 90 180Days of outages
BangladeshKenya
Tanzania
EritreaPakistanZambia
Uganda
UzbekistanPoland
BrazilNicaragua
BhutanAlgeria
Ecuador
Guatemala
Perc
enta
ge o
f firm
s w
ith g
ener
ator
s
270 3600
40
20
80
60
100
Note: The figure shows all countries for which data on both the days of outages and theshare of firms having their own generators were available. Data are for various yearsbetween 1999 and 2003.Source: World Bank Investment Climate Surveys.
Figure 6.13 Many days of power outages a year, and a higher share offirms having their own generators
Poor service from the government-ownedNational Electric Power Authority (NEPA)causes severe problems for Nigerian manu-facturers.
In a 1998 survey 93 percent of respondentsreported experiencing power outages morethan five times a week.On average the outagescaused them to lose 88 working days per year.The firms also reported that poor supply led tothe destruction of raw materials,restart costs,and equipment damage.They ranked poorelectricity supply as by far their most importantobstacle in infrastructure.
Many firms invested in self-generation asa result. On average they generated almost
as much themselves as they bought fromNEPA.The average cost of self-generationwas high, however—$0.30 a kilowatt-hour,or about three times more than NEPAcharges. Small firms may be particularly vul-nerable because they are less able to bearthe fixed costs of self-generation.Accordingly 16 percent of small firms reliedonly on NEPA service, while no medium orlarge firms did. In addition, small firms lost24 percent of their output to outages, whilemedium firms lost 14 percent and largefirms 17 percent.
Source: Adenikinju (2003).
B O X 6 . 1 0 The power to improve productivity in Nigeria
Many firms also pay higher than neces-sary prices for electricity, as governmentsdirect utilities to hold down prices for(often middle class) households and effec-tively tax firms to make up some of the dif-ference. The largest industrial users some-times have enough influence to avoid suchlevies, leaving small and medium firms tobear most of the burden. In the Indian stateof Kerala industrial users pay twice as muchper kilowatt-hour as households, but com-mercial users—offices and shops—paynearly twice as much again.86
08_WDR_Ch06.qxd 8/24/04 12:38 PM Page 132
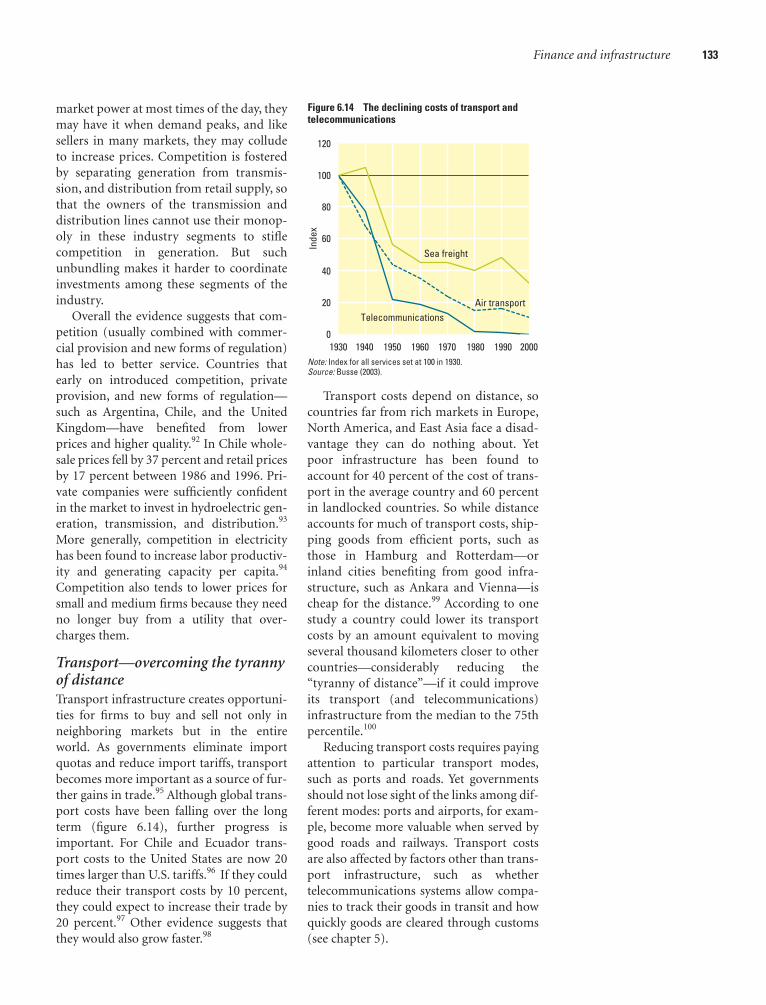
market power at most times of the day, theymay have it when demand peaks, and likesellers in many markets, they may colludeto increase prices. Competition is fosteredby separating generation from transmis-sion, and distribution from retail supply, sothat the owners of the transmission anddistribution lines cannot use their monop-oly in these industry segments to stiflecompetition in generation. But suchunbundling makes it harder to coordinateinvestments among these segments of theindustry.
Overall the evidence suggests that com-petition (usually combined with commer-cial provision and new forms of regulation)has led to better service. Countries thatearly on introduced competition, privateprovision, and new forms of regulation—such as Argentina, Chile, and the UnitedKingdom—have benefited from lowerprices and higher quality.92 In Chile whole-sale prices fell by 37 percent and retail pricesby 17 percent between 1986 and 1996. Pri-vate companies were sufficiently confidentin the market to invest in hydroelectric gen-eration, transmission, and distribution.93
More generally, competition in electricityhas been found to increase labor productiv-ity and generating capacity per capita.94
Competition also tends to lower prices forsmall and medium firms because they needno longer buy from a utility that over-charges them.
Transport—overcoming the tyrannyof distanceTransport infrastructure creates opportuni-ties for firms to buy and sell not only inneighboring markets but in the entireworld. As governments eliminate importquotas and reduce import tariffs, transportbecomes more important as a source of fur-ther gains in trade.95 Although global trans-port costs have been falling over the longterm (figure 6.14), further progress isimportant. For Chile and Ecuador trans-port costs to the United States are now 20times larger than U.S. tariffs.96 If they couldreduce their transport costs by 10 percent,they could expect to increase their trade by20 percent.97 Other evidence suggests thatthey would also grow faster.98
Finance and infrastructure 133
Transport costs depend on distance, socountries far from rich markets in Europe,North America, and East Asia face a disad-vantage they can do nothing about. Yetpoor infrastructure has been found toaccount for 40 percent of the cost of trans-port in the average country and 60 percentin landlocked countries. So while distanceaccounts for much of transport costs, ship-ping goods from efficient ports, such asthose in Hamburg and Rotterdam—orinland cities benefiting from good infra-structure, such as Ankara and Vienna—ischeap for the distance.99 According to onestudy a country could lower its transportcosts by an amount equivalent to movingseveral thousand kilometers closer to othercountries—considerably reducing the“tyranny of distance”—if it could improveits transport (and telecommunications)infrastructure from the median to the 75thpercentile.100
Reducing transport costs requires payingattention to particular transport modes,such as ports and roads. Yet governmentsshould not lose sight of the links among dif-ferent modes: ports and airports, for exam-ple, become more valuable when served bygood roads and railways. Transport costsare also affected by factors other than trans-port infrastructure, such as whethertelecommunications systems allow compa-nies to track their goods in transit and howquickly goods are cleared through customs(see chapter 5).
01930 1940 1950 1960 1970 1980 1990 2000
40
20
60
80
100
120
Inde
xTelecommunications
Air transport
Sea freight
Note: Index for all services set at 100 in 1930.Source: Busse (2003).
Figure 6.14 The declining costs of transport andtelecommunications
08_WDR_Ch06.qxd 8/24/04 12:38 PM Page 133

Ports—many types of competition. Morethan 80 percent by weight of the trade ofdeveloping countries goes through ports.101
The efficiency of those ports affectsexporters and importers directly and almostall firms indirectly. Improving one measureof port efficiency from the 25th to the 75thpercentile—achievable in part by reducingthe influence of organized crime—has beenfound to reduce shipping costs by more than12 percent.102 As with improvements inother transport infrastructure, the reductionin costs is equivalent to moving thousandsof kilometers closer to trading partners.103
Unlike the customers of electricity andtelecommunications utilities, port cus-tomers are mainly firms, not households,which makes tariff setting less politicized.Ports, however, require immobile invest-ments and often have market power, so theyface many of the challenges common toinfrastructure services. Under public own-ership and restrictions on competitionwithin and sometimes between ports, theyhave tended to be overstaffed, have restric-tive labor practices, act as a magnet for cor-ruption—and as a result offer slow andexpensive service to firms.104
To improve the efficiency of ports, gov-ernments have tried to expose them tomore competition, often while introducingprivate participation (box 6.11). Colombiaand Argentina split their national state-owned companies into several separatecompanies that compete with each other forsome services.105 Governments can also cre-ate competition within a single port in ser-vices not inherently monopolistic: differentterminals in a port can sometimes competewith each other, and different stevedoringcompanies can sometimes compete at thesame terminal.106
The combination of private participa-tion and increased competition has led tobetter services.107 In Colombia average ves-sel waiting time fell from 10 days before pri-vatization and competition to a matter ofhours afterward, throughput per hourincreased, and the ports moved to all-year,all-day operation.108 In Argentina the aver-age stay fell from 72 hours to 33, through-put per worker rose from 900 tons to 4,850,and capacity increased fivefold.109
134 WORLD DEVELOPMENT REPORT 2005
Colombia and India show two ways of con-fronting the challenges posed by port reform.
In Colombia port efficiency had becomea major issue by the early 1990s. Early pro-posals involved the reorganization ofColpuertos, the state-owned company, butnot private participation. President Gaviria,however, favored a bolder approach andraised the issue in his inaugural address in1990. His government drove the reform,with little involvement from labor groups.
Legislation to allow private participationin ports, including severance packages forworkers, passed within 60 days.The overallprogram—liquidating Colpuertos, establish-ing new policymaking and regulatory bodies,concessioning the five major ports to privatefirms, introducing competition in stevedoringin each port, and retrenching nearly 6,750workers—was completed in three years.Thecombination of competition and private par-ticipation led to impressive improvements inperformance.
India approached the task differently.Each of the 12 major ports in India is
administered by a Port Trust representingvarious interest groups. Port reform beganwith the issuance of a new policy frame-work in 1994 and guidelines for privateparticipation in 1996. Private participationwas to start with the concessioning of thecontainer terminal at Jawaharlal NehruPort, established in 1989 as a satellite portto Mumbai.
The implementation of reforms was leftto the ports, and the Jawaharlal Nehru PortTrust (the majority of whose trustees repre-sented the government or labor) chose toengage the main stakeholders in the reformprocess and to protect the interests of laborby keeping the existing port under publicownership. But they did allow a new privateterminal to compete with it.The competi-tion improved performance, withpreberthing and turnaround time fallingfrom around 11 days in 1996 to less than 3days in 2002.
Source: Navarrete (2004) and Ray (2004).
B O X 6 . 1 1 Port reform in Colombia and India
When built in the right locations (and not“roads to nowhere”), good roads can createsubstantial new opportunities for entrepre-neurs in rural areas and small towns, as illus-trated by a Moroccan government programto pave gravel roads and dirt tracks.
Upgrading the roads meant they wereusable all year round, causing less damage tothe vehicles using them.The new roadsallowed farms and other firms to move theirgoods more often and more cheaply. In somecases the time it took to get to rural marketsfell by half.The cost of shipping a truckload ofmerchandise also fell by half. In the areas ben-efiting from the road upgrading, the land ismore productive, and the volume and valueof agricultural produce is higher. As it becameeasier to ship produce quickly without dam-aging it, farmers shifted from low-value cere-als to high-value fruit. As the price of bringinggoods to the farms fell, farmers used morefertilizer. Improvements in the agriculturaleconomy spurred the growth of other busi-ness. Off-farm employment grew twice as fastas in areas not benefiting from road improve-
ment.The estimated economic rate of returnto the projects ranged from 16 to 30 percent.
As is often the case, the improvement ininfrastructure did not benefit only firms. Itmade it easier for children to go to schooland, by making the delivery of butane moreaffordable, reduced the need for womenand girls to collect firewood. After the roadimprovements, primary school enrollmentrose from 28 percent to 68 percent.
The Moroccan experience is not an iso-lated case. Recent work by the InternationalFood Policy Research Institute suggests thatUganda’s investment in rural feeder roadsconnecting farmers to otherwise remotemarkets has high returns in agriculturalgrowth and rural poverty reduction. InChina investment in rural roads is verysocially profitable. In India such investmentis the most socially productive form of pub-lic investment in reducing poverty.
Source: World Bank (1996a); Fan, Hazell, andThorat (1999); Fan, Zhang, and Rao (2004); Fan,Zhang, and Zhang (2002).
B O X 6 . 1 2 The benefits of rural roads in Morocco andelsewhere
08_WDR_Ch06.qxd 8/24/04 12:38 PM Page 134

Roads. Almost all goods are transported byroad at some stage, making a country’s roadnetwork a critical part of its infrastructureand the investment climate (box 6.12). Notsurprisingly, the extent of the network hasbeen found in many studies to be associatedwith better economic performance. In LatinAmerica a 10 percent increase in the length ofroads per worker has been estimated toincrease GDP per worker by nearly 2 per-cent.110 Not all roads are equally valuable, ofcourse; in the United States the interstateroad building of the 1950s and 1960s seemsto have significantly boosted productivity,while recent spending on roads has had onlymodest benefits.111 Even so, the evidence sug-gests that governments should pay closeattention to the extent and quality of theirroad networks. The challenges relate to plan-ning appropriate network expansion, execut-ing the required investment and mainte-nance, and working out how best to pay for it.
All the typical challenges are more diffi-cult because the transaction costs of impos-ing user fees (tolls) to fund roads are high, atleast on city streets and rural roads. Even onintercity highways, where the transactioncosts are lower, user fees remain uncom-mon.112 So prices rarely ration demand oncongested roads, cover the costs of mainte-nance, or signal that new capacity is needed.One avenue for tackling these problems isthus to increase the use of tolls. The adventof electronic tolls and related informationtechnology is making direct pricing feasibleon more roads and, in the long term, it maymake the road industry much more likeother utilities. In the near future, however,only a small proportion of roads will havetolls. Therefore, many governments focus onusing other sources of revenue linked to roaduse to pay for roads, such as use-relatedlicense fees and especially fuel taxes.
Many governments are assigning fundsfrom fuel taxes and other sources to a roadfund that operates with some autonomyfrom ministers. The funds are allocated toinvestment and maintenance projectsaccording to a set of principles establishedby political authorities. Road users may berepresented on the agency, and the agencymay consult with road users and others onthe allocation of funds. As in other areas,
Finance and infrastructure 135
designing a system that gives the managersof the road fund the information, incentives,and capability to make decisions alignedwith the public interest is crucial.
Developing countries often spend too lit-tle on maintenance compared with invest-ment, perhaps because of donors’ traditionalpreference for subsidizing capital rather thanoutputs, and perhaps because large invest-ment projects offer opportunities for politi-cians to cut more ribbons or for decision-makers to collect bigger bribes. Countriesafflicted with higher levels of corruptionseem to spend more on public investment inroads and other infrastructure, but less onmaintenance, and seem accordingly to havepoorer quality roads.113 There is no simpleanswer, but an emphasis on making decision-making more transparent can help reducecorruption and improve decisions. Govern-ments can consult on, publish, and explainthe principles for allocating funds and thedecisions implementing those principles, andthey can use open and transparent processesfor awarding contracts to do the work.
Road agencies that decide on the alloca-tion of funds need not build or maintainroads themselves. More road agencies nowcontract out such work to private firms,under output-based contracts. In Argentinathe highway authority maintains manyroads by letting long-term maintenancecontracts that require private firms to main-tain roads to a defined standard. One reviewconcludes that the program reduced theproportion of roads in poor condition from25 percent to less than 5 percent, reducingroad users’ costs by more than 10 percent.114
Improving the provision of finance andinfrastructure services in an economy canhave a big impact on the investment cli-mate—and ultimately depends on improv-ing the investment climate for providers ofthose services. Similar links exist in the labormarket, where the quality of the investmentclimate has important implications for theincentives of workers to invest in their ownskills. The effectiveness of the labor marketin connecting people with productive jobs iscritical to growth and poverty reduction.These issues are the subject of chapter 7.
08_WDR_Ch06.qxd 8/24/04 12:38 PM Page 135

136
Governments around the world share thegoal of having more and better jobs for theircitizens. Jobs are the main source of incomefor people—and the main pathway out ofpoverty for the poor. Young people domi-nate the ranks of the unemployed, with overdouble the average unemployment rate inall regions.1 And in many developing coun-tries more than half of the working popula-tion is in the informal economy, whereworking conditions can be poor.2 Demo-graphic changes over the coming decadeswill add nearly 2 billion more people todeveloping countries, compounding thechallenge of creating more and better jobs.
Crafting an investment climate that pro-vides firms with the opportunities andincentives to expand is fundamental tomeeting this challenge. Government poli-cies affecting the labor market play a criticalrole in this effort by helping to connect peo-ple to jobs. And there is room for improve-ment in most countries.
Government support for education andtraining affects the prospects for individuals—and the ability of firms to enter new mar-kets and adopt new technologies. Firm-levelsurveys show that more than 20 percent offirms in many developing countries rateinadequate skills and education of workersas a major or severe obstacle to their opera-tions (figure 7.1 top).
Regulation of labor markets is usuallyintended to help workers, but can also be asignificant constraint on firms (figure 7.1bottom). Ill-considered regulations can dis-courage firms from creating more jobs andcontribute to a swelling of the informaleconomy. When this is the case, some work-ers may benefit, but the unemployed, thelow-skilled, and those in the informal econ-omy will not be among them.
Public policy also needs to facilitate allo-cation of labor to its most productive usewhile helping workers cope with labormobility. Technological progress that leads tohigher productivity and economic growthimproves working conditions and wages, butit can also result in more rapid changes tofirms and industries. In modern economies,many firms are created and destroyed eachyear—about 20 percent in many countries—involving 10–20 percent of the workforce.
This chapter looks at opportunities forgovernments to improve policies in all threeareas as part of the effort to create a betterinvestment climate:
Workers and labor markets
7c h a p t e r
0 20 40Percent
60
Bangladesh
Estonia
Algeria
China
Zambia
Brazil
Algeria
Pakistan
Kenya
Philippines
Poland
Brazil
Skill
s an
d ed
ucat
ion
of a
vaila
ble
wor
kers
Labo
r reg
ulat
ions
Note: Percentage of firms reporting that skills and education ofavailable workers or labor regulations were a major or severeobstacle to the operation and growth of their business.Source: World Bank Investment Climate Surveys.
Figure 7.1 Firms rate skill shortages and laborregulations as serious constraints in many countries
09_WDR_Ch07.qxd 9/3/04 11:14 AM Page 136

Workers and labor markets 137
• Fostering a skilled and healthy workforcethat can contribute to a productive andprosperous society. Improving the invest-ment climate goes hand in hand withenhancing human capital. A skilled work-force is essential for firms to adopt newand more productive technologies, and abetter investment climate raises thereturns to investing in education. Govern-ments need to take the lead in makingeducation more inclusive and relevant tothe skill needs of firms, and create a soundinvestment climate for providers of edu-cation and training services.
• Crafting labor market interventions to ben-efit all workers. In many developing coun-tries labor regulation provides a high stan-dard of protection to a few workers butlimited or no protection for most of thosein the informal economy. It can also dis-courage firms from creating new jobs.Regulatory strategies need to be crafted toreflect this wider range of interests, and toensure a good fit with local circumstances.
• Helping workers cope with change in a moredynamic economy. Inadequate mecha-nisms to help workers cope with changerestrict entrepreneurship and the adapt-ability of workers. They can also increaseresistance to reforms that would benefitsociety as a whole. While a narrow tax basereduces the feasibility of creating compre-hensive social safety nets in most develop-ing countries, there are opportunities forimproving the insurance component inincome support schemes and the poolingof risks across individuals. Innovative pro-grams can also reach out to poor andinformal workers who cannot be coveredby broader insurance schemes.
Fostering a skilled and healthyworkforcePeople’s skills and health affect their ability toparticipate in society, escape poverty, copewith economic and natural risks, and con-tribute to productivity increases and growth.The availability of skilled and healthy workersalso shapes the decisions of firms to adoptnew technologies, expand, or enter new mar-kets. Education improves health throughgreater awareness and access to information.
Health strengthens the incentives and abilityto invest in education. And apart from thehuman gains, controlling diseases such asmalaria and HIV/AIDS increases the produc-tivity of workers, encouraging firms to pur-sue worthwhile opportunities in once-affected locations (box 7.1).
The links between education, health, andgrowth can create virtuous circles: goodeducation and health enable growth, whichin turn promotes further investment inthem. The circles can also be vicious: pooreducation and health reduce incentives forproductive investment and entrepreneur-ship, which limits the resources for enhanc-ing education and health.
Issues associated with the delivery ofhealth and education services were dis-cussed extensively in World DevelopmentReport 2004 and will not be revisited here.The focus instead is on the complementari-ties between the education and skills ofworkers and the investment decisions offirms—and on some of the ways educationpolicies need to evolve to equip individualswith the skills required in a more produc-tive and dynamic economy.
The skills of workers and theinvestment climateEducational attainment has improved in alldeveloping regions, particularly in East Asiaand Pacific and in the Middle East and North
Malaria and HIV/AIDS have a debilitatingimpact on people—and growth.They canalso be debilitating for the opportunitiesand incentives facing firms to investproductively, to create jobs, and to expand.
Malaria-affected regions tend to havelower worker productivity and lower percapita incomes than other regions.HIV/AIDS is also having a pervasive impact,with an estimated 40 million people livingwith HIV/AIDS worldwide, including 2.5 mil-lion children under 15. Sub-Saharan Africahad more than 80 percent of the new infec-tions and 75 percent of the deaths in 2003.Not surprisingly, almost 90 percent of firmsthere are concerned about HIV/AIDS. A sur-vey of African firms has quantified itsimpact on the region’s economic productiv-ity at around 1 percent of GDP.
HIV/AIDS erodes morale, lowers produc-tivity, weakens confidence in the future, andundermines the willingness to save andinvest. It affects the most economicallyactive age groups and reduces the quantityand quality of labor. Skilled professionalsare being lost, and shorter life expectanciesare raising the cost of training and reducingshort-term returns.
HIV/AIDS not only destroys humancapital—it also weakens the transmission ofknowledge and abilities from one genera-tion to the next.
Source: Sachs (2003); McArthur and Sachs(2001); UNAIDS (2003); Bloom and others(2003); United Nations Economic Commissionfor Africa (2000); and Bell, Devarajan, and Gers-bach (2003).
B O X 7 . 1 Malaria and HIV/AIDS cloud the investment climate
09_WDR_Ch07.qxd 9/3/04 11:14 AM Page 137
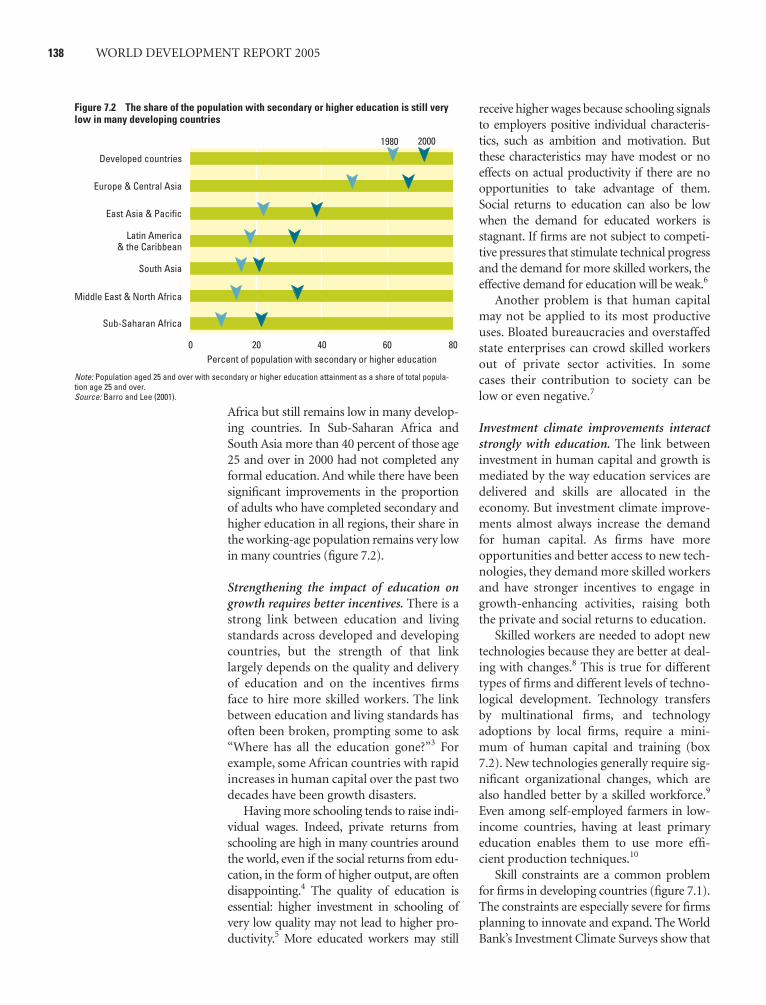
138 WORLD DEVELOPMENT REPORT 2005
806020 40Percent of population with secondary or higher education
0
South Asia
Sub-Saharan Africa
Middle East & North Africa
1980 2000
East Asia & Pacific
Europe & Central Asia
Developed countries
Latin America& the Caribbean
Note: Population aged 25 and over with secondary or higher education attainment as a share of total popula-tion age 25 and over.Source: Barro and Lee (2001).
Figure 7.2 The share of the population with secondary or higher education is still very low in many developing countries
Africa but still remains low in many develop-ing countries. In Sub-Saharan Africa andSouth Asia more than 40 percent of those age25 and over in 2000 had not completed anyformal education. And while there have beensignificant improvements in the proportionof adults who have completed secondary andhigher education in all regions, their share inthe working-age population remains very lowin many countries (figure 7.2).
Strengthening the impact of education ongrowth requires better incentives. There is astrong link between education and livingstandards across developed and developingcountries, but the strength of that linklargely depends on the quality and deliveryof education and on the incentives firmsface to hire more skilled workers. The linkbetween education and living standards hasoften been broken, prompting some to ask“Where has all the education gone?”3 Forexample, some African countries with rapidincreases in human capital over the past twodecades have been growth disasters.
Having more schooling tends to raise indi-vidual wages. Indeed, private returns fromschooling are high in many countries aroundthe world, even if the social returns from edu-cation, in the form of higher output, are oftendisappointing.4 The quality of education isessential: higher investment in schooling ofvery low quality may not lead to higher pro-ductivity.5 More educated workers may still
receive higher wages because schooling signalsto employers positive individual characteris-tics, such as ambition and motivation. Butthese characteristics may have modest or noeffects on actual productivity if there are noopportunities to take advantage of them.Social returns to education can also be lowwhen the demand for educated workers isstagnant. If firms are not subject to competi-tive pressures that stimulate technical progressand the demand for more skilled workers, theeffective demand for education will be weak.6
Another problem is that human capitalmay not be applied to its most productiveuses. Bloated bureaucracies and overstaffedstate enterprises can crowd skilled workersout of private sector activities. In somecases their contribution to society can below or even negative.7
Investment climate improvements interactstrongly with education. The link betweeninvestment in human capital and growth ismediated by the way education services aredelivered and skills are allocated in theeconomy. But investment climate improve-ments almost always increase the demandfor human capital. As firms have moreopportunities and better access to new tech-nologies, they demand more skilled workersand have stronger incentives to engage ingrowth-enhancing activities, raising boththe private and social returns to education.
Skilled workers are needed to adopt newtechnologies because they are better at deal-ing with changes.8 This is true for differenttypes of firms and different levels of techno-logical development. Technology transfersby multinational firms, and technologyadoptions by local firms, require a mini-mum of human capital and training (box7.2). New technologies generally require sig-nificant organizational changes, which arealso handled better by a skilled workforce.9
Even among self-employed farmers in low-income countries, having at least primaryeducation enables them to use more effi-cient production techniques.10
Skill constraints are a common problemfor firms in developing countries (figure 7.1).The constraints are especially severe for firmsplanning to innovate and expand. The WorldBank’s Investment Climate Surveys show that
09_WDR_Ch07.qxd 9/3/04 11:14 AM Page 138

the firms that consider a lack of skilled work-ers to be a “major” or “very severe” constraintare those upgrading their productionprocesses. Those firms are also more inclinedto invest in training their workforce (figure7.3). While large firms have the capacity toorganize internal training for their work-force, smaller firms often do not.
A sound investment climate strengthensthe incentives for individuals to obtain moreeducation. This is best exemplified by themajor surge in returns to education in the for-merly centrally planned economies duringtheir transition to market systems. Similarpatterns have emerged in other countries. InCambodia investment climate improvements,coupled with higher returns to well-trainedpeople, boosted the demand for vocationaltraining, mostly provided by private firms.
High levels of formal education are notneeded for all firms or activities. Lack ofavailability of workers with tertiary educationmay be more of a constraint for firms inhigher value-added manufacturing and ser-vices than for those in less complex industrialprocesses. For some activities, language profi-ciency may be important. For example, alarge English-speaking population has helpedIndia attract “back-office” services for foreignfirms. In many cases education to providebasic literacy and numeracy skills can becomplemented by on-the-job or vocationaltraining to enhance the productivity andhence potential wages of workers.
Creating a skilled workforceWorld Development Report 2004 discussedstrategies for improving the delivery ofbasic education. Secondary and tertiaryeducation and vocational training also mat-ter for a good investment climate. Govern-ments can help in a variety of ways.
Public funding to expand access to educa-tional opportunities. Public funding canimprove the equity of the education system byopening opportunities to those who could nototherwise afford it. Many traditionalapproaches focused on providing fundingthrough public educational institutions.Newer approaches direct resources throughindividuals so that they have greater choice,with the resulting competitive pressure on
providers sharpening the incentives to be effi-cient and responsive. Options for providingsuch support include income-contingentloans (as in Namibia)11 and voucher schemesof various kinds. For example, the Africa Edu-cational Trust provides educational vouchersin Somalia to enable disadvantaged girls andyoung ex-militiamen to attend special after-noon and evening classes.12
Improving quality assurance mechanisms.Minimum quality requirements and qualityassurance mechanisms through certification
Workers and labor markets 139
In 1996 Costa Rica beat out Brazil, Chile,Indonesia, Mexico, the Philippines, and Thai-land to become the site of Intel’s $300 mil-lion semiconductor assembly and test plant.Many factors made Costa Rica attractive toIntel, as well as other U.S. companies: its sta-ble economic and political system; its cen-tral location within the hemisphere; itsopenness and liberalized economy, includ-ing the absence of capital controls; and itsreceptive investment environment. Anotherkey factor was its educated labor force, andthe government’s commitment to invest infurther training.
Since 1948,when democracy was restored,Costa Rica has placed a strong emphasis oneducation.The government invested heavily ineducation and technology training,andadopted a bilingual English as a Second Lan-guage curriculum.Computers were introducedin elementary schools as early as 1988,and by1996 many schools were equipped with them.In response to the large investment by Inteland other U.S.companies,several educationcenters—providing technical skills in the elec-tric and electronic fields—have emerged.
Source: World Bank (2003e) and Spar (1998).
B O X 7 . 2 Why Intel chose Costa Rica as the site of amultimillion dollar plant
20
10
Shar
e of
firm
s re
porti
ng s
kill
cons
train
tsas
an
obst
acle
to b
usin
ess
0
30
60
40
Shar
e of
inno
vato
rs th
at p
rovi
de tr
aini
ng
0
80
Innovators
Non-innovators
20
Firm size
Innovators face moresevere skill constraints
Innovative firms with skillconstraints invest in training
Less than 20employees
20–100employees
More than 100employees
Note: “Innovators” are firms that have upgraded an existing product line or developed amajor new product line in the previous three years. “Skill constraints” refers to thosefirms that considered lack of adequate skills a “major” or “very severe” obstacle to theoperation and growth of their business. The left panel is based on a sample of 13,300firms in 33 developing countries. The right panel is based on a sample of 12,099 firms in29 developing economies.Source: World Bank Investment Climate Surveys.
Figure 7.3 Skill constraints and innovative firms
09_WDR_Ch07.qxd 9/3/04 11:14 AM Page 139
or accreditation schemes can foster qualityimprovements at schools and universities. Itcan also boost demand for education bystudents and increase demand for skillsfrom firms. More than 20 developing coun-tries have introduced accreditation agenciesor national evaluation systems. Experiencesuggests that quality assurance is best pro-vided by agencies that have authority overboth public and private providers, rely onexplicit standards, and publicly reportresults. Evaluation criteria are moving fromthe measurement of inputs (characteristicsof the service provider) to a stronger focuson outputs (student performance). Manycountries are also establishing nationalqualifications frameworks that allow com-parison of qualifications from different
providers according to defined competencylevels (China, Mauritius, Mexico,Uganda).13
Facilitating private provision. The marketfor private education has grown strongly inrecent years, augmenting public resourcesand providing a broader range of choices forstudents. In Brazil, for example, privateinstitutions accounted for more than 70 per-cent of higher education enrollments in2002. Strong increases have also occurred inmost regions of the world, including Africa,where the private sector is a significantsource for secondary and tertiary educationin countries such as Côte d’Ivoire, Gambia,and Ghana.14 Expanding opportunities forprivate education involves improving theinvestment climate for private providers.While private providers of education facemany of the same constraints as other firms,additional constraints can flow from poorlydefined regulatory frameworks and policiesthat discriminate in favor of public sectorproviders. The private sector may also beengaged through public-private partner-ships of various kinds. In Burkino Faso, forexample, the management of colleges ofgeneral education is being delegated to pri-vate education providers.15
Supporting lifelong learning. Lifelong learn-ing improves the adaptability and employa-bility of workers as economies undergo eco-nomic and technological change. Worldwide,annual spending on corporate trainingreached $28 billion in 2002. By the end of the1990s almost half the workers age 35–54 inthe United States were adult learners.16
Although most workers are involved in someon-the-job training, it is often not enough toenable them to adjust to major changes intechnology or to move across different jobs.Firms themselves may have difficulty inter-nalizing the returns to training investmentsbecause workers may move to other firms. Atthe same time workers’ incentives to invest intraining may be low if wages are compressedor if workers cannot finance their trainingbecause of credit market inefficiencies. In allthese cases there is a role for government tosupport training and retraining. Experiencewith schemes to meet these goals remainsmixed, however (box 7.3).
140 WORLD DEVELOPMENT REPORT 2005
Government support for the training andretraining of workers can take many forms,depending on the target group, the fundingsource, the form of training, and the modeof delivery.
In Mexico the Job Training Program forUnemployed Workers (PROBECAT) combinesshort-term training for unemployed and dis-placed workers with income support (at theminimum wage) and, more important, place-ment services from the local employmentoffices. On-the-job training was found to bemore effective than classroom training, andprivate training centers seem to outperformgovernment-run centers.
Training programs for youths, evenwhen well-targeted, tend to have a poortrack record. Earlier interventions at theschooling stage are likely to be more effec-tive than trying to later remedy education’sfailures. The experience of some LatinAmerican countries offers interestinginsights, however. The “Jovenes” programsin Argentina, Chile, Peru, and Uruguay aretargeted at disadvantaged youth—combin-ing training and work experience withother services, including psychologicaldevelopment and vocational assessment.While effective in promoting employabilityof the targeted youths, they tend to becostly. An evaluation in Argentinaestimated that at least nine years of higherearnings due to the program would berequired to show a positive net presentvalue for the groups with statistically signif-icant results. Enhanced job opportunitiesfor the targeted group also tended to be
associated with displacement of otherworkers.
A growing number of countries arefunding enterprise-based training andretraining through compulsory levies onfirms rather than relying on general taxrevenues. Brazil’s National Industrial Train-ing Service (SENAI) funds training from acompulsory contribution from industriesof 1 percent of payroll. SENAI has beenassociated with an increase in the provi-sion of training, especially among mediumand large firms. Singapore’s Skills Develop-ment Fund relies on a levy of 1 percent onpayroll for low-wage workers, andreimburses the levies by the amount oftraining that firms provide. The number ofindividuals trained has tripled since theFund’s inception in 1979.
While these schemes can facilitate amore systematic, structured approach toenterprise training, many firms, especiallysmall ones, may not have the capacity toprovide training to their workers.Trainingfunds are also difficult to manage in coun-tries with weak administrative capacity andwhere public provision tends to be supply-driven.To address these concerns, Kenyahas established a voucher scheme for train-ing services that allows the trainee tochoose among providers and courses.
Source: Middleton, Ziderman, and Adams(1993); Calderon-Madrid and Belem (2001);Betcherman, Olivas, and Dar (2003); Aedo andNúñez (2001); and de Ferranti and others(2003).
B O X 7 . 3 Tackling skill imbalances through public supportfor training and retraining programs
09_WDR_Ch07.qxd 9/3/04 11:14 AM Page 140
Crafting interventions to benefit all workersGovernments intervene in worker–firmrelations on three main fronts. They inter-vene in the wage-setting process, they regu-late working conditions, and they controlthe hiring and firing of workers. Theseinterventions are theoretically justified bythe (perceived or effective) inability oflaissez-faire conditions to deliver efficientand equitable outcomes. Efficiency argu-ments stress information problems and aneed to improve the matching of labordemand with supply. There may also beequity arguments if there is unequal bar-gaining power between employers andworkers, discrimination against vulnerablegroups, or incomplete or imperfect insur-ance of workers against risks.
Beyond the core labor standards—theminimum framework for a sound labormarket (box 7.4)—government interven-tions need to strike a balance between sev-eral interests. It has been common to por-tray the tension as primarily between theinterests of firms and workers. But thisignores the broader range of interestsinvolved. Workers in the informal economyand the unemployed can have very differentinterests from those currently employed inthe formal economy. And consumers andpotential recipients of tax-funded servicesalso have a stake in the outcome. Where the
balance between these interests is struckwill be influenced by social preferences ineach country. But as in other areas of gov-ernment intervention, approaches can devi-ate from the socially optimal level becauseof factors such as rent-seeking by particularinterest groups and a failure to adaptapproaches to local circumstances (seechapter 2). Indeed, as in other areas of regu-lation, labor regulation in many developingcountries mimics or exceeds that in devel-oped countries,17 benefits only part of thepopulation because of widespread infor-mality, and imposes a disproportionateburden on those firms that do comply(chapter 5).
From an investment climate perspec-tive, the question is how labor marketinterventions influence the opportunitiesand incentives for firms to invest produc-tively, create jobs, and expand. Firm-levelsurveys show that labor regulations can bea major or severe constraint on firm oper-ations in many developing countries (seefigure 7.1). Regulations can reduce incen-tives to make new investments, adjust theorganization of work to take advantage ofnew technologies or opportunities, or hiremore workers. Some curtailment of thoseincentives can be justified by social goalsbeyond those reflected in the core laborstandards including, for example, the pro-motion of workplace safety. But ill-conceived approaches can exacerbate
Workers and labor markets 141
The international community, acting throughconventions elaborated through theInternational Labour Organisation (ILO), hasidentified four core labor standards as the mini-mum for all countries, whatever their stage ofdevelopment: eliminating all forms of forced orcompulsory labor, abolishing child labor, provid-ing equal opportunity and nondiscrimination inemployment, and ensuring the freedom of asso-ciation and the right to collective bargaining.The past decades have witnessed an accelera-tion in the number of countries that havesigned these conventions, particularly that ban-ning the worst forms of child labor.
The economic effects of enforcing core laborstandards depend on the interventions andsociopolitical circumstances. Ensuring thefreedom of association and collective bargaining
can go a long way toward promoting labor mar-ket efficiency and better economic performance.And there are obvious economic and social rea-sons for banning slavery and all forms of forcedlabor. Unfortunately, child labor and differentforms of explicit or implicit discrimination, whilegenerally perceived as violations of human rights,are still widespread in many developing countries.
Child labor in particular still looms large inthe developing world, where one child in sixbetween the ages of 5 and 17 is at work. Childlabor hinders human development, reducingfuture earnings for the children and aggregategrowth for the economy. For example, children inIndia perform tasks that require no particularskills and develop no human capital. Cheap childlabor, if combined with poor investment condi-tions, reduces the incentives for firms to invest in
new technology that has higher productivitypotential but requires more skilled workers.
Reforms that promote stronger economicgrowth are fundamental to combating childlabor. In Vietnam strong economic growth in the1990s led to a significant rise in poor families’wealth, reducing the number of children in theworkforce by 28 percent. Improving the deliveryof education is generally more effective thanbanning child labor. Such bans are generally notenforced in many developing countries, andwhere they are, can also force children intomore dangerous, hidden forms of work (prosti-tution), especially where parents have no choicebut to use child labor to survive.
Source: ILO (2003b); Burra (1995); Edmonds (2004);Krueger (1996); Brown (2000); OECD (2000a); Martinand Maskus (2001); and Miles (2002).
B O X 7 . 4 The core labor standards
09_WDR_Ch07.qxd 9/3/04 11:14 AM Page 141

poverty by contributing to unemploymentand swelling the size of the informal andunprotected economy. If a society’s goal isto advance the interests of all workers—rather than just those who currently benefitfrom regulated employment—governmentsneed to confront these difficult and oftensensitive tradeoffs.
Striking a balance between promotingjob creation by firms and protecting existingjobs or workers is particularly contentiousduring periods of economic reforms—whenthe long-term benefits of increased employ-ment and wages are often clouded by short-term concerns for the job and wage securityof those affected during the transition. Suc-cessful reforms bring about higher wagesand better working conditions—as well ashigher employment and lower unemploy-ment and informality in the long run.18
There are, however, short-term costs due tochanges in job characteristics and greaterlabor mobility in a modern, productive
economy. This reinforces the importance oflooking at labor market policies in the con-text of broader strategies, including effortsto foster a more skilled and adaptable work-force and to help workers cope with change.
Governments can take three steps toensure labor market interventions benefitall workers:
• Encourage wage adaptability and ensureworkers are properly compensated fortheir work
• Ensure workplace regulations reflect agood institutional fit
• Balance workers’ preference for employ-ment stability with firms’ need to adjustthe workforce.
Encouraging wage adaptabilityGovernments intervene in the wage-settingprocess by establishing rules for wage bar-gaining and for industrial relations. Theseinterventions can reduce negotiation costs ifthey do not reinforce the monopoly power ofthe parties or impose rigidities in wageadjustments. Many governments also setwage floors in an attempt to reduce the num-ber of working poor, but setting the floors toohigh can reduce the jobs available for low-skilled workers and the opportunities forlow-tech firms to emerge in the formal sector.
Wage bargaining benefits from a clear policyframework. The dialogue between freelyelected (and representative) associations ofworkers and employers can reduce uncer-tainty and transaction costs and improveinformation flows.19 Collective bargainingoffers a platform for involving bothemployers and workers in discussions withgovernment about structural reforms. Con-sider the tripartite negotiations promotingmacroeconomic and structural reforms inseveral western European countries in thepast decade. Also consider the pivotal roleof unions in promoting political opennessand democracy in other countries, as withSolidarity in Poland and black labor unionsin South Africa. But unions can sometimesact as monopolists, improving wages andconditions for their members at the expenseof nonunionized workers and broader soci-ety (box 7.5).
142 WORLD DEVELOPMENT REPORT 2005
Trade unions can play an important role inrepresenting the interests of workers.Theirimpact on wages and economic conditionsvaries greatly across countries and regions,however, and depends largely on the eco-nomic and social context.Wage premiumsfor unionized work tend to be fairly small indeveloped countries but quite high in coun-tries or sectors with weak competition inoutput markets and large rents. Availableestimates suggest high wage premiums incountries such as Ghana (21–28 percent)and South Africa (10–24 percent) but muchlower premiums in countries such as SouthKorea (2 to 4 percent).
Union members also tend to enjoylonger job tenure and receive more trainingthan their nonunionized counterparts. And ina number of countries employers favor deal-ing with unions, because highly representa-tive unions can reduce industrial unrest.
The effect of unions on productivity isless clear cut and depends on market condi-tions and industrial relations. In Mexicounions have attempted to protect low-skilled jobs at the expense of higherproductivity. In Guatemala unionization isassociated with lower productivity of coffeefarmers. However, greater participation ofworkers in some aspects of company man-agement in Brazil contributed to better pro-ductivity and profitability.The effect was
greater in unionized firms because unionsfacilitated communication between man-agement and workers.
Given the reductions in union member-ship in recent years, and the growing size ofthe informal economy, unions in manydeveloping countries have started toexpand their engagement with the informalsector. A union in Argentina operates ahealth insurance and unemployment fundthat also covers unregistered andunprotected agricultural workers. In thePhilippines unions initiated loan schemesfor poor areas. In Ghana an agriculturalworkers’ union includes self-employed ruralworkers as members; it supports themthrough revolving loans and facilitates theiraccess to other forms of institutional credit.In India a union helps unorganized and self-employed workers to obtain licenses.
Associations of informal workers havealso been created, with some taking a highprofile in defending informal workers’ rights.Examples include the Ghana Private RoadTransport Union, the Cissin-Natanga Women’sAssociation in Burkina Faso, and the SelfEmployed Women’s Association in India.
Source: Aidt and Tzannatos (2002); Harrison andLeamer (1997); Maloney and Ribeiro (2001);Urízar and Lee (2003); Menezes Filho and oth-ers (2002), OECD (1997a); and Ratnam (1999).
B O X 7 . 5 The role and impact of unions
09_WDR_Ch07.qxd 9/3/04 11:14 AM Page 142

In industries where regulation sheltersfirms from competition, unions are likely tobargain for a share of the rents. An unstablepolitical environment also tends to reduceincentives for unions to “invest” in wagerestraint in exchange for expected better eco-nomic outcomes in the future.20 High unionwage premiums and bigger drags on produc-tivity are indeed found in countries and sec-tors lacking competitive pressure. Invest-ment climate improvements that enhanceeconomic stability and competition in out-put markets are likely to lead unions tobehave in ways more conducive to strongereconomic growth and job creation.21
Enhancing wage adaptability. Governmentscan foster wage adaptability by promotingpluralism of representation in wage bar-gaining. They can also reinforce the linksbetween wage agreements and firm perfor-mance either through improving coordina-tion among social partners or throughmore decentralized negotiations.
• Improving coordination. Some developedcountries with a tradition of collectivebargaining have reinforced coordinationamong the different levels of wage nego-tiation (national, sectoral, firm). In someof them, such as Denmark, Italy, andPortugal, nationwide agreements now fixonly the basic wage increase, leaving tothe firm-level negotiation furtherincreases consistent with a firm’s perfor-mance. Unions have also been part of thedesign and implementation of largestructural changes in many countries. InMexico and Israel, as well as in theNetherlands, Ireland, and Italy, unionshave participated in the design of adjust-ment programs, including actions in thelabor market, and agreed on social pactsthat facilitated macroeconomic stabiliza-tion. In Kenya, following the abolition ofprice controls in the mid-1990s, govern-ment guidelines on wages were removed,giving employers and workers greaterlatitude in wage negotiations.
• Decentralizing negotiations. Following theexperience of other developed coun-tries—such as Australia, New Zealand,and the United Kingdom—some emerg-
ing and transition economies have rein-forced wage responsiveness by shiftingwage bargaining to the firm. In the BalticStates, the Czech Republic, and Hungary,unionization is low in newly created pri-vate firms, especially small ones, and wagebargaining mostly takes place at the firmlevel.22 Along the same lines, the wage-bargaining system in Peru was reformedin 1992, increasing direct negotiation byrelaxing the collective negotiationprocess, introducing voluntary arbitra-tion as an alternative to state administra-tive decisions, and eliminating stateapproval of agreements. The reform alsoincreased collective autonomy by protect-ing the unions’ right to registration, andstrengthened union pluralism by allowingmore than one union to exist in a firm.23
Reassessing minimum wages. The main goalof setting minimum wages is to promotedecent jobs and reduce poverty amongworkers. But its effectiveness in many devel-oping countries is questionable. Minimumwages represent a high proportion of theaverage wages in these countries, and anyfurther increase shifts the wage distributionupward, punishing rather than helping theworkers intended to be supported—young,low-skilled, and female workers. Whenenforcement is weak, as is often the case, ahike in the minimum wage encourages evenmore underreporting of wages andstrengthens incentives for firms and jobs toremain in the informal economy.
The minimum wage cuts the lower endof the wage distribution and makes firmsand jobs with low productivity levels unvi-able, at least in the formal sector. The levelof the minimum wage affects firms, jobs,and income distribution:
• In developed countries minimum wagestend to be relatively low (although insome cases may approach 50 percent ofthe median wage) with only a modestimpact on low-tech firms and the employ-ment of low-productivity workers.24
• In several low-income countries mini-mum wages are close to, if not higherthan, the average income per capita (fig-ure 7.4).25 At these levels many private
Workers and labor markets 143
09_WDR_Ch07.qxd 9/3/04 11:14 AM Page 143

firms, especially those in low-tech activi-ties, cannot afford to comply. The poorcontinue to work in informal activitiesfor only a fraction of the mandated min-imum wage.
• In middle-income countries, the mini-mum wage is generally about half themedian in the formal sector. Its coverageand enforcement tend to be low, but itsimpact on low-productivity firms andjobs can be large. In Latin America thelargest proportion of workers who earnless than the minimum wage is found incountries where it is comparatively high(figure 7.4). Examples include Paraguay,where the majority of workers earn lessthan two-thirds of the minimum wage;Nicaragua (40 percent of workers belowthe minimum); and Colombia (25 per-cent).26
Noncompliance with the minimumwage is also concentrated among the mostvulnerable workers. Youths and other work-ers lacking skills or work experience mayhave little chance of being hired at the min-imum wage when it is set much higher thantheir productivity potential. In backwardareas the national minimum wage may beclose to the underlying local average wage,severely affecting labor demand from smalland medium firms that rely largely on low-skilled workers.27 Despite low compliance,
the minimum wage can act as a strong paysignal for the informal sector, implying thathikes in the minimum wage can have distri-butional implications that go beyond theformal sector—the income of the low-paidmight increase in both segments of theeconomy, but their employment prospectsmight decline.28
Given these effects, a growing number ofcountries are reassessing minimum wagesto expand opportunities for low-skilledworkers and encourage formalization. Theyhave done so mainly by reducing indexationof the minimum wage and by having lowersubminima for some groups (young work-ers) or for subnational labor markets. Forexample, the erosion of the minimum wagein Mexico in the 1990s is credited withboosting female employment. Submini-mum apprenticeship wages are estimated tohave significantly increased job opportuni-ties for young graduates in Chile.29
Ensuring workplace regulationsreflect a good institutional fit Promoting health and safety conditions inthe workplace, regulating working time,and encouraging paid leave have beenmajor achievements in all societies. As inmost other areas, improvements in workingconditions in developed countries evolvedgradually, hand in hand with more general
144 WORLD DEVELOPMENT REPORT 2005
4 6Log of GDP per capita(PPP constant dollars)
Ratio
of y
early
min
imum
wag
eto
GDP
per
cap
ita
8 100
1
2
3
4
0 25 50Level of minimum wage relative
to wage of median worker (percent)
Minimum wages in many low-income countriesare high relative to income per capita
High levels of the minimum wage leadto high evasion in Latin America
Nicaragua
Colombia
RB de VenezuelaCosta Rica
PanamaPeru
ChileBrazilSalvador
HondurasBolivia
ArgentinaUruguayMexico
Com
plia
nce:
wor
kers
that
ear
n le
ss th
anth
e m
inim
um w
age
(per
cent
)
75 1000
10
20
30
40
Note: In the left panel each dot represents one country/year observation. Data refer to the period 1980–2000. Per capita income is expressed in constant dol-lars adjusted for purchasing power parity (PPP). The wage used in the right panel is the median wage for workers between 26 and 40 years of age, who workfor more than 30 hours per week during the reference period of the surveys.Source: Left panel: Rama and Artecona (2002). Right panel: IDB based on countries’ official data.
Figure 7.4 The minimum wage is very high in many developing countries and, at high levels, leads to weak compliance
09_WDR_Ch07.qxd 9/3/04 11:14 AM Page 144
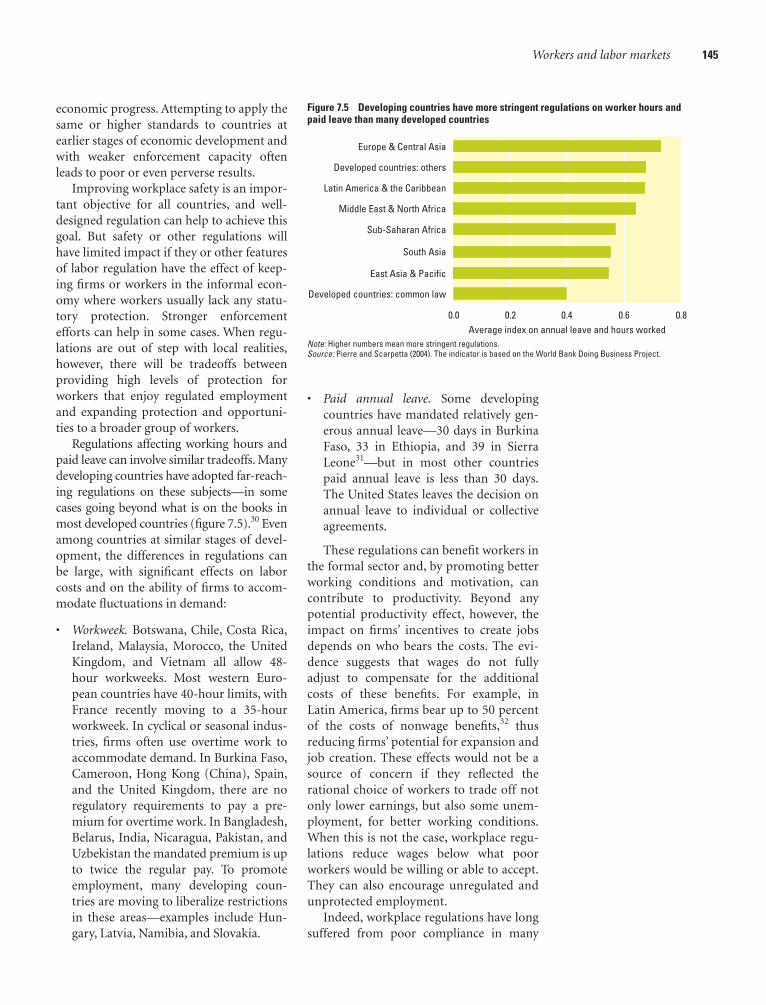
Workers and labor markets 145
economic progress. Attempting to apply thesame or higher standards to countries atearlier stages of economic development andwith weaker enforcement capacity oftenleads to poor or even perverse results.
Improving workplace safety is an impor-tant objective for all countries, and well-designed regulation can help to achieve thisgoal. But safety or other regulations willhave limited impact if they or other featuresof labor regulation have the effect of keep-ing firms or workers in the informal econ-omy where workers usually lack any statu-tory protection. Stronger enforcementefforts can help in some cases. When regu-lations are out of step with local realities,however, there will be tradeoffs betweenproviding high levels of protection forworkers that enjoy regulated employmentand expanding protection and opportuni-ties to a broader group of workers.
Regulations affecting working hours andpaid leave can involve similar tradeoffs. Manydeveloping countries have adopted far-reach-ing regulations on these subjects—in somecases going beyond what is on the books inmost developed countries (figure 7.5).30 Evenamong countries at similar stages of devel-opment, the differences in regulations canbe large, with significant effects on laborcosts and on the ability of firms to accom-modate fluctuations in demand:
• Workweek. Botswana, Chile, Costa Rica,Ireland, Malaysia, Morocco, the UnitedKingdom, and Vietnam all allow 48-hour workweeks. Most western Euro-pean countries have 40-hour limits, withFrance recently moving to a 35-hourworkweek. In cyclical or seasonal indus-tries, firms often use overtime work toaccommodate demand. In Burkina Faso,Cameroon, Hong Kong (China), Spain,and the United Kingdom, there are noregulatory requirements to pay a pre-mium for overtime work. In Bangladesh,Belarus, India, Nicaragua, Pakistan, andUzbekistan the mandated premium is upto twice the regular pay. To promoteemployment, many developing coun-tries are moving to liberalize restrictionsin these areas—examples include Hun-gary, Latvia, Namibia, and Slovakia.
• Paid annual leave. Some developingcountries have mandated relatively gen-erous annual leave—30 days in BurkinaFaso, 33 in Ethiopia, and 39 in SierraLeone31—but in most other countriespaid annual leave is less than 30 days.The United States leaves the decision onannual leave to individual or collectiveagreements.
These regulations can benefit workers inthe formal sector and, by promoting betterworking conditions and motivation, cancontribute to productivity. Beyond anypotential productivity effect, however, theimpact on firms’ incentives to create jobsdepends on who bears the costs. The evi-dence suggests that wages do not fullyadjust to compensate for the additionalcosts of these benefits. For example, inLatin America, firms bear up to 50 percentof the costs of nonwage benefits,32 thusreducing firms’ potential for expansion andjob creation. These effects would not be asource of concern if they reflected therational choice of workers to trade off notonly lower earnings, but also some unem-ployment, for better working conditions.When this is not the case, workplace regu-lations reduce wages below what poorworkers would be willing or able to accept.They can also encourage unregulated andunprotected employment.
Indeed, workplace regulations have longsuffered from poor compliance in many
0.0 0.2 0.4Average index on annual leave and hours worked
0.6 0.8
Developed countries: common law
East Asia & Pacific
South Asia
Sub-Saharan Africa
Middle East & North Africa
Latin America & the Caribbean
Developed countries: others
Europe & Central Asia
Note: Higher numbers mean more stringent regulations.Source: Pierre and Scarpetta (2004). The indicator is based on the World Bank Doing Business Project.
Figure 7.5 Developing countries have more stringent regulations on worker hours andpaid leave than many developed countries
09_WDR_Ch07.qxd 9/3/04 11:14 AM Page 145

developing countries. And while recentprogress toward global integration is some-times thought to result in a lowering ofstandards, experience suggests that this isnot necessarily the case (box 7.6).
Balancing employment stability withfirms’ need to adjust the workforceProbably the most contentious governmentintervention in the labor market is the regu-lation of the hiring and firing of workers—generally referred to as employment protec-tion legislation. Regulatory intervention maybe justified to protect workers from arbitraryaction and to provide some stability inemployment, which can be particularlyimportant in the absence of effective socialsafety nets. To the extent job protection leadsto long-lasting work relationships, it mayalso encourage firms to provide training.
But as elsewhere, governments need tobalance these potential benefits against thelikely costs. By affecting the cost of work-force reorganization, employment protec-tion legislation can strongly influence thecost of doing business, especially the oppor-tunities and incentives for firms to adoptnew technologies and to expand. Moderneconomies require a continuous process offirms’ retooling and firm turnover to chan-nel resources to their most productive uses.In countries for which data are available,gross rates of job creation and destructioneach range between 5 and 20 percent,adding up to a total job turnover of up to 40percent (figure 7.6). A significant part of thisjob turnover (often 30–50 percent) is due tothe entry and exit of firms, an importantfactor for output and productivity growth(figure 7.7).33 Onerous employment protec-tion legislation can discourage job creationbecause firms will be reluctant to hire work-ers if they face significant costs in adjustingthe workforce to changes in demand. Aswith other areas of labor regulation, onerousrequirements in this area can also contributeto the adoption of informal employmentarrangements, where workers will receive nostatutory protection.
Regulating hiring and firing. The protectionoffered to regular workers and the condi-tions for temporary employment vary con-siderably across countries (figure 7.8).Countries in Latin America and in EasternEurope and Central Asia tend to offer thestrongest employment protection for regu-lar workers.34 Common law developedcountries tend to have the least statutory
146 WORLD DEVELOPMENT REPORT 2005
Differences in labor regulations and theirenforcement might give a cost advantage ininternationally traded goods to countries withweak regulations,and new technologies allowlabor services to be directly subcontracted toworkers in countries with less onerous regula-tion.This has led to concerns that multinationalfirms may be exploiting weak labor regulationor putting pressure on governments not toenforce existing regulations.
Evidence of noncompliance with laborregulations abounds in developing countries,but there is no clear indication that this isrelated to greater integration in the worldmarket.This is true whether integration ismeasured by export market shares, revealedcomparative advantages, FDI, or trade prices.Even in export processing zones—which areoften used by governments to attract invest-ment by providing firms with a more favor-able policy environment (chapter 8)—it is notclear that enforcement of labor regulation issystematically lower than what is observedoutside the zones. Of 73 zones reviewed in arecent study, in only 6 was there any deliber-ate attempt by government to restrict work-ers’ rights.
Indeed, a body of evidence suggeststhat multinational firms tend to providebetter working conditions and pay higherwages than alternative local employment.The World Bank’s Investment Climate Sur-veys also suggests that foreign-owned firmstend to have a larger share of workers withpermanent contracts and tend to providemore training for their workers.
Multinational firms concerned withmaintaining their corporate reputations arealso increasingly adopting codes of conductthat reflect global norms on a range ofissues, including labor practices (chapter 9).Compliance with codes is monitored bybuyers or by independent auditors.
Poor working environment conditions are,however,the reality for many workers at theend of the supply chain.Only recently havesome multinational firms revised their purchas-ing practices and improved compliance withlabor standards by local subcontractors.
Source: OECD (2000a); Krumm and Kharas(2003); Basu (1999); Maskus (1997); Brown,Deardorff, and Stern (2003); World Bank and IFC(2003); OECD (2001); and Raworth (2004).
B O X 7 . 6 Labor regulation and global integration
0
Estonia
Brazil
W. G
ermany
Colombia
France
Chile U.S.
Argentina
Latvi
a
10
Job
crea
tion/
dest
ruct
ion
aspe
rcen
t of t
otal
em
ploy
men
t
Empl
oym
ent g
row
th (p
erce
nt)
20
0
2
6
4
8
Mexico
Job creationJob destruction
Employment growth
Hungary
Note: Data for Brazil, Colombia, and Chile refer to manufacturing. Data are from firms that have 20 or more employeesand cover different periods during the 1990s.Source: Bartelsman and others (2004).
Figure 7.6 High job turnover in developed and developing countries in the 1990s
09_WDR_Ch07.qxd 9/3/04 11:14 AM Page 146
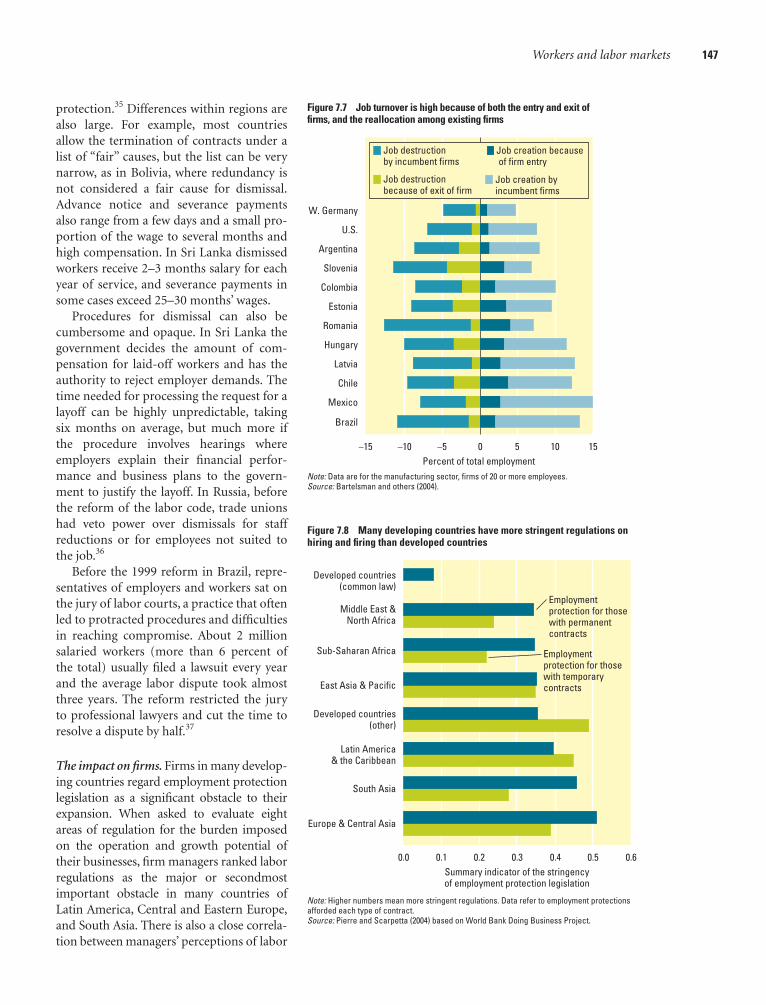
protection.35 Differences within regions arealso large. For example, most countriesallow the termination of contracts under alist of “fair” causes, but the list can be verynarrow, as in Bolivia, where redundancy isnot considered a fair cause for dismissal.Advance notice and severance paymentsalso range from a few days and a small pro-portion of the wage to several months andhigh compensation. In Sri Lanka dismissedworkers receive 2–3 months salary for eachyear of service, and severance payments insome cases exceed 25–30 months’ wages.
Procedures for dismissal can also becumbersome and opaque. In Sri Lanka thegovernment decides the amount of com-pensation for laid-off workers and has theauthority to reject employer demands. Thetime needed for processing the request for alayoff can be highly unpredictable, takingsix months on average, but much more ifthe procedure involves hearings whereemployers explain their financial perfor-mance and business plans to the govern-ment to justify the layoff. In Russia, beforethe reform of the labor code, trade unionshad veto power over dismissals for staffreductions or for employees not suited tothe job.36
Before the 1999 reform in Brazil, repre-sentatives of employers and workers sat onthe jury of labor courts, a practice that oftenled to protracted procedures and difficultiesin reaching compromise. About 2 millionsalaried workers (more than 6 percent ofthe total) usually filed a lawsuit every yearand the average labor dispute took almostthree years. The reform restricted the juryto professional lawyers and cut the time toresolve a dispute by half.37
The impact on firms. Firms in many develop-ing countries regard employment protectionlegislation as a significant obstacle to theirexpansion. When asked to evaluate eightareas of regulation for the burden imposedon the operation and growth potential oftheir businesses, firm managers ranked laborregulations as the major or secondmostimportant obstacle in many countries ofLatin America, Central and Eastern Europe,and South Asia. There is also a close correla-tion between managers’ perceptions of labor
Workers and labor markets 147
–15 –10 –5 0Percent of total employment
5 10 15
Brazil
Mexico
Chile
Latvia
Hungary
Romania
Estonia
Colombia
Slovenia
Argentina
U.S.
W. Germany
Job creation byincumbent firms
Job destructionby incumbent firms
Job destructionbecause of exit of firm
Job creation because of firm entry
Note: Data are for the manufacturing sector, firms of 20 or more employees.Source: Bartelsman and others (2004).
Figure 7.7 Job turnover is high because of both the entry and exit offirms, and the reallocation among existing firms
Employmentprotection for thosewith permanentcontracts
Employmentprotection for those with temporarycontracts
Europe & Central Asia
South Asia
Latin America& the Caribbean
Developed countries(other)
East Asia & Pacific
Sub-Saharan Africa
Middle East &North Africa
Developed countries(common law)
0.0 0.1 0.2 0.3 0.4 0.5Summary indicator of the stringencyof employment protection legislation
0.6
Note: Higher numbers mean more stringent regulations. Data refer to employment protectionsafforded each type of contract.Source: Pierre and Scarpetta (2004) based on World Bank Doing Business Project.
Figure 7.8 Many developing countries have more stringent regulations onhiring and firing than developed countries
09_WDR_Ch07.qxd 9/3/04 11:14 AM Page 147
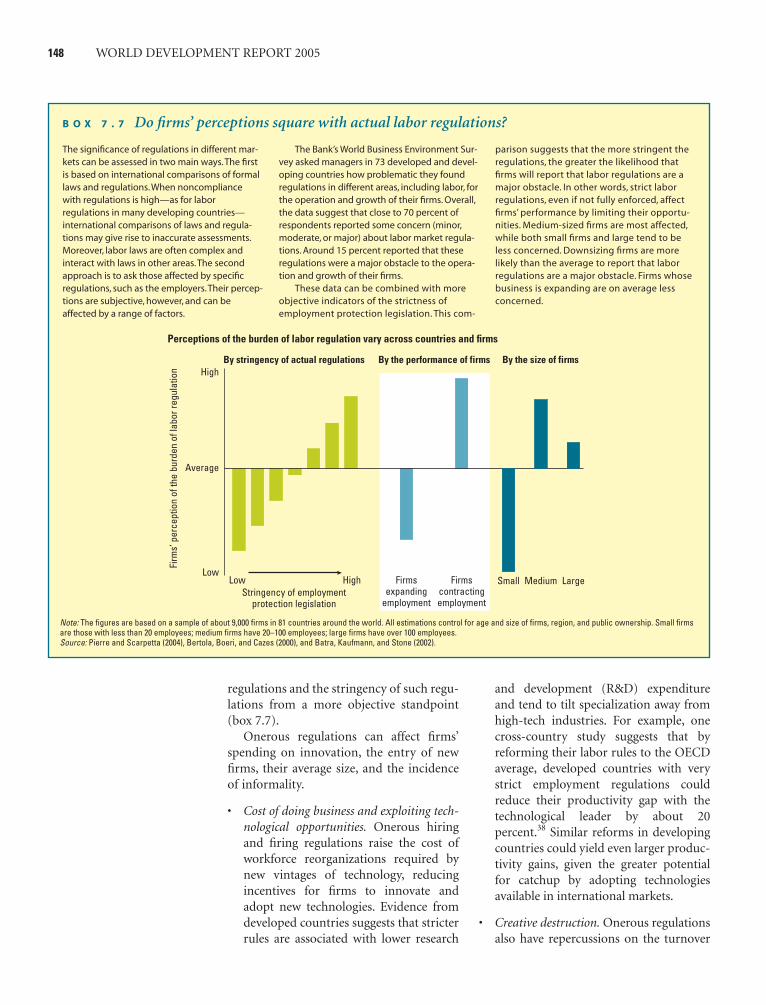
148 WORLD DEVELOPMENT REPORT 2005
regulations and the stringency of such regu-lations from a more objective standpoint(box 7.7).
Onerous regulations can affect firms’spending on innovation, the entry of newfirms, their average size, and the incidenceof informality.
• Cost of doing business and exploiting tech-nological opportunities. Onerous hiringand firing regulations raise the cost ofworkforce reorganizations required bynew vintages of technology, reducingincentives for firms to innovate andadopt new technologies. Evidence fromdeveloped countries suggests that stricterrules are associated with lower research
and development (R&D) expenditureand tend to tilt specialization away fromhigh-tech industries. For example, onecross-country study suggests that byreforming their labor rules to the OECDaverage, developed countries with verystrict employment regulations couldreduce their productivity gap with thetechnological leader by about 20percent.38 Similar reforms in developingcountries could yield even larger produc-tivity gains, given the greater potentialfor catchup by adopting technologiesavailable in international markets.
• Creative destruction. Onerous regulationsalso have repercussions on the turnover
The significance of regulations in different mar-kets can be assessed in two main ways.The firstis based on international comparisons of formallaws and regulations.When noncompliancewith regulations is high—as for laborregulations in many developing countries—international comparisons of laws and regula-tions may give rise to inaccurate assessments.Moreover, labor laws are often complex andinteract with laws in other areas.The secondapproach is to ask those affected by specificregulations, such as the employers.Their percep-tions are subjective, however, and can beaffected by a range of factors.
The Bank’s World Business Environment Sur-vey asked managers in 73 developed and devel-oping countries how problematic they foundregulations in different areas, including labor, forthe operation and growth of their firms. Overall,the data suggest that close to 70 percent ofrespondents reported some concern (minor,moderate, or major) about labor market regula-tions. Around 15 percent reported that theseregulations were a major obstacle to the opera-tion and growth of their firms.
These data can be combined with moreobjective indicators of the strictness ofemployment protection legislation. This com-
parison suggests that the more stringent theregulations, the greater the likelihood thatfirms will report that labor regulations are amajor obstacle. In other words, strict laborregulations, even if not fully enforced, affectfirms’ performance by limiting their opportu-nities. Medium-sized firms are most affected,while both small firms and large tend to beless concerned. Downsizing firms are morelikely than the average to report that laborregulations are a major obstacle. Firms whosebusiness is expanding are on average lessconcerned.
B O X 7 . 7 Do firms’ perceptions square with actual labor regulations?
LowLow
Firm
s’ p
erce
ptio
n of
the
burd
en o
f lab
or re
gula
tion
Average
High
HighStringency of employment
protection legislation
By stringency of actual regulations By the performance of firms By the size of firms
Firmsexpanding
employment
Firmscontractingemployment
Small Medium Large
Note: The figures are based on a sample of about 9,000 firms in 81 countries around the world. All estimations control for age and size of firms, region, and public ownership. Small firmsare those with less than 20 employees; medium firms have 20–100 employees; large firms have over 100 employees.Source: Pierre and Scarpetta (2004), Bertola, Boeri, and Cazes (2000), and Batra, Kaufmann, and Stone (2002).
Perceptions of the burden of labor regulation vary across countries and firms
09_WDR_Ch07.qxd 9/3/04 11:14 AM Page 148
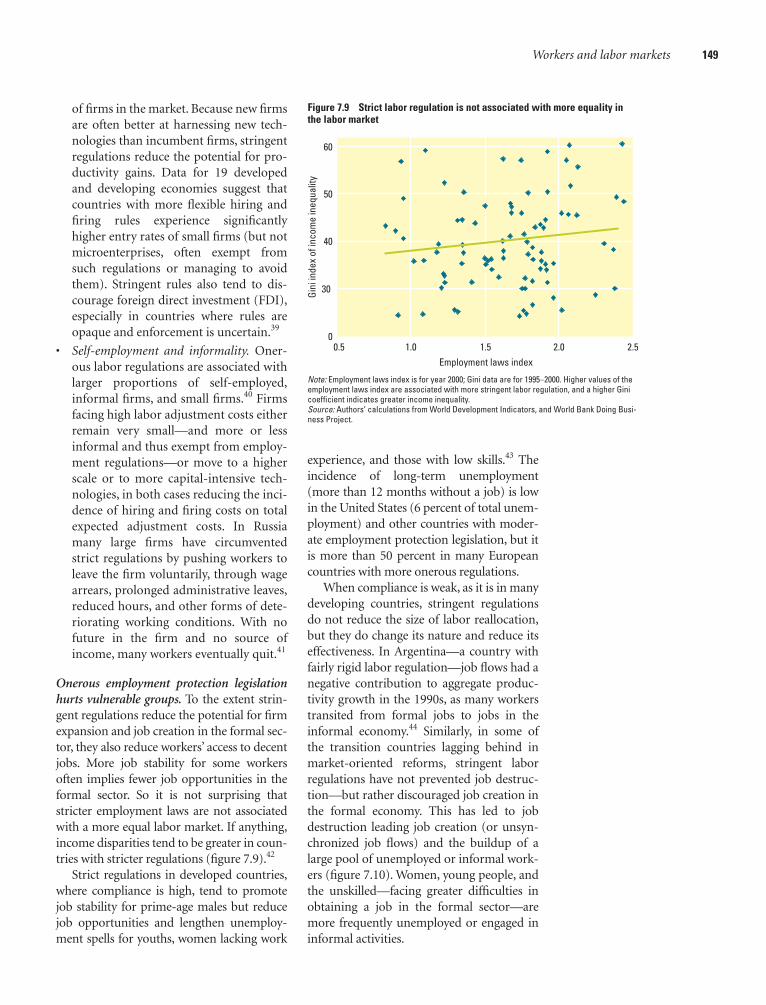
of firms in the market. Because new firmsare often better at harnessing new tech-nologies than incumbent firms, stringentregulations reduce the potential for pro-ductivity gains. Data for 19 developedand developing economies suggest thatcountries with more flexible hiring andfiring rules experience significantlyhigher entry rates of small firms (but notmicroenterprises, often exempt fromsuch regulations or managing to avoidthem). Stringent rules also tend to dis-courage foreign direct investment (FDI),especially in countries where rules areopaque and enforcement is uncertain.39
• Self-employment and informality. Oner-ous labor regulations are associated withlarger proportions of self-employed,informal firms, and small firms.40 Firmsfacing high labor adjustment costs eitherremain very small—and more or lessinformal and thus exempt from employ-ment regulations—or move to a higherscale or to more capital-intensive tech-nologies, in both cases reducing the inci-dence of hiring and firing costs on totalexpected adjustment costs. In Russiamany large firms have circumventedstrict regulations by pushing workers toleave the firm voluntarily, through wagearrears, prolonged administrative leaves,reduced hours, and other forms of dete-riorating working conditions. With nofuture in the firm and no source ofincome, many workers eventually quit.41
Onerous employment protection legislationhurts vulnerable groups. To the extent strin-gent regulations reduce the potential for firmexpansion and job creation in the formal sec-tor, they also reduce workers’ access to decentjobs. More job stability for some workersoften implies fewer job opportunities in theformal sector. So it is not surprising thatstricter employment laws are not associatedwith a more equal labor market. If anything,income disparities tend to be greater in coun-tries with stricter regulations (figure 7.9).42
Strict regulations in developed countries,where compliance is high, tend to promotejob stability for prime-age males but reducejob opportunities and lengthen unemploy-ment spells for youths, women lacking work
experience, and those with low skills.43 Theincidence of long-term unemployment(more than 12 months without a job) is lowin the United States (6 percent of total unem-ployment) and other countries with moder-ate employment protection legislation, but itis more than 50 percent in many Europeancountries with more onerous regulations.
When compliance is weak, as it is in manydeveloping countries, stringent regulationsdo not reduce the size of labor reallocation,but they do change its nature and reduce itseffectiveness. In Argentina—a country withfairly rigid labor regulation—job flows had anegative contribution to aggregate produc-tivity growth in the 1990s, as many workerstransited from formal jobs to jobs in theinformal economy.44 Similarly, in some ofthe transition countries lagging behind inmarket-oriented reforms, stringent laborregulations have not prevented job destruc-tion—but rather discouraged job creation inthe formal economy. This has led to jobdestruction leading job creation (or unsyn-chronized job flows) and the buildup of alarge pool of unemployed or informal work-ers (figure 7.10). Women, young people, andthe unskilled—facing greater difficulties inobtaining a job in the formal sector—aremore frequently unemployed or engaged ininformal activities.
Workers and labor markets 149
0.5 1.0 1.5Employment laws index
Gini
inde
x of
inco
me
ineq
ualit
y
2.0 2.50
30
50
40
60
Note: Employment laws index is for year 2000; Gini data are for 1995–2000. Higher values of theemployment laws index are associated with more stringent labor regulation, and a higher Ginicoefficient indicates greater income inequality.Source: Authors’ calculations from World Development Indicators, and World Bank Doing Busi-ness Project.
Figure 7.9 Strict labor regulation is not associated with more equality inthe labor market
09_WDR_Ch07.qxd 9/3/04 11:14 AM Page 149

norms. Colombia and Peru liberalized theiremployment protection in the 1990s, mov-ing their legislation closer to the standardsof the (still quite regulated) Europeandeveloped countries. The reforms led to ahigher response of employment to outputgrowth, with speedier employment adjust-ment (figure 7.11) but also positive employ-ment effects. In Colombia the reform alsocontributed to increased compliance withlabor legislation by lowering the costs offormal production. A recent study on Indiasuggests that amendments to the strictemployment regulation in one state(Andhra Pradesh) in the 1980s allowed 1.8million urban poor to find jobs in manufac-turing and service companies in the nextdecade.45 Italy and Spain also experiencedsizable positive effects on employment aftersome easing of their restrictive firing regu-lations in the past decade.46 Similarly, aftermore than a decade of debate, both Egyptand Morocco revised their labor codes eas-ing contract termination for economic rea-sons. In Kenya since the mid-1990s employ-ers no longer have to seek permission fromthe government to dismiss workers.
150 WORLD DEVELOPMENT REPORT 2005
Reducing labor adjustment costs and for-malizing work relations. Reforming govern-ments have adopted two main strategies toreduce labor adjustment costs. The firstfocuses on reducing the burden of adjust-ment for workers hired under regularemployment contracts by bringing stan-dards more in line with international
01990 1992 1994 1996 1998 2000
8
4
12
16Pe
rcen
t of t
otal
em
ploy
men
tJob destruction
Job creation
01991 1992 1993 1994 1995 1996 1997 1998 1999 2000 2001
8
4
12
16
Perc
ent o
f tot
al e
mpl
oym
ent
Estonia Russia
Synchronized job flows Less synchronized job flows
Job destruction
Job creation
01993 1994 1995 1996 1997 1998 2000
8
4
12
16
Perc
ent o
f tot
al e
mpl
oym
ent
Job destruction
Job creation
01994 1995 1996 1997 1998 1999
8
4
12
16
Perc
ent o
f tot
al e
mpl
oym
ent
Job destruction Netemploymentloss
Job creation
Slovenia Romania
Source: Bartelsman and others (2004) and Brown and Earl (2004).
Figure 7.10 Unsynchronized job creation and destruction can give rise to unemployment or underemployment
01988 1989 1990 1991 1992 1993 1994 1995 1996
12
10
8
14
16
Perc
ent o
f tot
al e
mpl
oym
ent
Job destruction
Job creation
Labormarketreform
Source: Bartelsman and others (2004).
Figure 7.11 Since the labor reform of 1990, there hasbeen higher job turnover in Colombia
09_WDR_Ch07.qxd 9/3/04 11:14 AM Page 150

A second strategy focuses on liberalizingfixed-term or temporary contracts, anapproach pursued by several countries inWestern Europe, Latin America, and Centraland Eastern Europe. Surveys in many devel-oping countries show that firms facing strictregulation of regular contracts make greateruse of temporary employment to foster theadaptability of their workforce. In 1991 Perurevised its labor law by lengthening the max-imum duration of temporary contracts.The number of workers on term contractsshot up, and young and informal workersbenefited the most. Poland, Russia, andSlovakia have also recently increased theduration of term contracts and expandedtheir applicability.47
But liberalizing temporary contracts, whileleaving in place strict regulations on regularcontracts, reinforces the inequality in thelabor market. Firms will have stronger incen-tives to hire more workers at the entry leveland employ them for a limited period, with-out giving them a regular position thereafter.This increases job turnover but not necessar-ily overall employment or productivity,because the additional hires will be accompa-nied by additional layoffs at the end of thetemporary contracts, and there will be little orno development of internal human capital.48
The effects of reforming labor regula-tions are likely to differ depending on initialconditions and on the sequencing of thereforms in product and labor markets(chapter 3). For example, stringent employ-ment protection legislation can influencethe outcomes of trade liberalization byshifting more jobs to the informal econ-omy.49 Colombia’s trade liberalization wasassociated with increased informal employ-ment in industries with the largest tariffcuts, but once labor market reforms wereintroduced, this pattern was reversed. Simi-larly, Indian states with less stringent laborregulations experienced stronger growth inthe formal sector after trade liberalizationthan those with stricter labor regulations.50
Helping workers cope withchangeInvestment climate improvements that helpcreate a modern, productive economy facili-tate the reallocation of labor across firms and
sectors in response to changes in technology,demand, and other conditions. While thisreallocation of labor benefits society as awhole, workers may need to change jobs sev-eral times in the course of their working lives.This has long been a feature of work in theinformal economy, but can be painful forworkers who have grown accustomed to morestable employment in protected industries.Helping workers cope with these changes notonly benefits the individuals concerned, butcan also enhance economic efficiency insofaras it enables better matches between workerabilities and the requirements of new jobs. Itcan also reduce resistance to investment cli-mate improvements. In many developingcountries, inadequate or nonexistent socialinsurance mechanisms mean that unem-ployed workers cannot afford to remain with-out income and are forced to accept the firstjob that comes their way, even if it is not agood or productive one (figure 7.12).
Improving government policies in theseareas requires three interrelated actions:
• Helping workers affected by large-scalerestructurings
• Reinforcing social insurance mecha-nisms
• Reaching out to the large share of work-ers in the rural and informal economies.
Workers and labor markets 151
0
50
40
30
20
10
90
80
70
60
Shar
e of
cou
ntrie
s in
the
grou
p
100
Severancepay
UI savingsaccounts
Unemploymentassistance
Unemploymentinsurance (UI)
Publicworks
Low-income
High-income
Lower-middle-income
Upper-middle-income
Note: Based on the presence of the following programs: unemployment insurance, unemployment assistance,unemployment insurance savings accounts, mandated severance pay, and public works programs.Source: Vodopivec (2004).
Figure 7.12 Developing countries, particularly low-income ones, offer much weakerand less diverse protection against unemployment risks than developed countries
09_WDR_Ch07.qxd 9/3/04 11:14 AM Page 151

Helping workers cope with large-scale restructuringsThere is often strong pressure to compensategroups directly threatened by structuralreforms, such as workers in previously pro-tected industries. Typically not poor, thesegroups are very vocal and could representconcentrated opposition to reforms thatbenefit society as a whole. Providing one-time compensation to them may be a sociallyefficient way to allow reforms to move ahead.
Workers affected by large-scale dismissalscan also face particular difficulties. They maybe specialized in activities that may not behighly demanded in the broader economy,and may be concentrated in specific locations,making it more difficult to regain employ-ment locally. This was the case for most tran-sition economies, where many one-companytowns and certain rural areas experienced acollapse in labor demand and major surges inunemployment and underemployment.
The traditional approach to dealing withlarge dismissals is to promote voluntarydepartures with generous severance pay.51
This can reduce worker opposition and thesocial impact of restructuring or downsizing.The challenge is to set severance pay at a levelthat will be acceptable to workers yet befinancially feasible. Setting severance pay attoo high a level can lead to high short-termcosts and the adverse selection of the bestemployees leaving first. It can also slow oreven stop the process of firm restructuring. InGhana downsizing was halted because thegovernment could not afford the severancepayments. In the 1990s Pakistan made sever-ance payments to workers affected by the pri-vatization of industrial units that includedfive months’ salary for each year of service—much higher than international norms. Theagreement set a precedent for the later priva-tization of public utilities, delaying reforms.52
Governments can also provide specificretraining programs to help workers regainemployment, but when these programsoperate in a context of weak labor demand itis difficult to identify the best training curric-ula and to motivate workers to participate. Inmany cases a small proportion of eligibleworkers takes these courses, which oftencome too late, after workers have already left,as was the case with the retraining
Bangladesh provided for jute workers.53 Tomake schemes more effective, early interven-tion and effective targeting are essential, asare efforts to tailor approaches to local cir-cumstances. Particularly when labor demandis weak, removing impediments to job cre-ation through investment climate improve-ments plays a critical role.
Reinforcing social insurance topromote labor mobilityA variety of strategies can be adopted tohelp workers cope with the income risksassociated with external or domestic shocksas well as the demands of a more flexiblelabor market. Sound macroeconomic poli-cies and public support for education arethe best risk prevention instruments. Socialprotection programs can also mitigate theimpact of risks while encouraging efficientlabor reallocation and entrepreneurship.Even when public resources to finance theseschemes are limited, as in the case of mostdeveloping countries, much can be done toimprove their effectiveness by reinforcinginsurance principles and better targeting.
The policy mix best suited to each coun-try depends on the factors driving eco-nomic insecurity and the cost-effectivenessof alternative options.54 However, interna-tional experience highlights the importanceof four broader measures:
• Reducing economic volatility. Many devel-oping countries remain vulnerable toexternal shocks. When a negative aggre-gate shock hits the economy, capital—often the most mobile factor of produc-tion—tends to leave the country, whilelabor tends to bear the brunt of theadjustment in either real wage cuts orunemployment and underemployment.Export diversification can reduce expo-sure to large fluctuations in externaldemand, and deeper capital markets andstronger financial systems can help miti-gate the impact. The welfare benefits fromreducing macroeconomic volatility indeveloping countries can be substantial.55
• Moving away from procyclical fiscal policy.The exposure of workers to shocks iscompounded by the fact that govern-ments often lack the discipline to pro-
152 WORLD DEVELOPMENT REPORT 2005
09_WDR_Ch07.qxd 9/3/04 11:14 AM Page 152

mote countercyclical financing for socialprograms. Many governments tend toadopt an expansionary fiscal stance ingood times and a contractionary stancein bad. Mounting budget deficits inrecessions thus create pressures to reducepublic spending on social protection(among other things) just when the needfor it is increasing. Greater fiscal disci-pline and better diversification of the fis-cal revenue base are essential to ensuringresources are available to cushion thenecessary labor adjustment process.
• Removing market distortions. Beyondmacroeconomic policies, the most effec-tive strategy for risk prevention and mit-igation is to develop a sound investmentclimate where firms have opportunitiesand incentives to invest productively andcreate jobs. Investment climate improve-ments allow for stronger job creation inthe formal sector and expand taxresources available for social programs.Improving the operation of financialmarkets also expands opportunities forfirms to insure themselves against tem-porary shocks without resorting to wageor employment cuts.56
• Supporting workers’ adaptability. In addi-tion to improving the coverage and qual-ity of education, governments canimprove the ability and willingness ofworkers to move to more productive andrewarding jobs by supporting training,counseling, and placement services. Whilethe effectiveness of these programs ismixed, especially in countries with limitedadministrative capacity, when well-targetedthey can complement skill enhancementsand income support measures.
These broader measures can be accompa-nied by social insurance schemes. Beyondenhancing the welfare of the unemployed,these schemes improve the investment cli-mate by facilitating the allocation of labor tomore productive uses and encouraging entre-preneurship. They do so in three main ways.First, they can stimulate riskier but more pro-ductive jobs, industries, and portfoliochoices.57 For example, lack of access toinsurance among poor rural householdspushes them to take up low-risk activities
with lower returns, reducing their incomepotential by an estimated 25 percent in ruralTanzania and 50 percent in a sample of ruralvillages in India.58 Similarly, uninsured riskcan lead to the use of outdated but less riskyproduction technologies, such as holdinglivestock as a form of precautionary savings.Second, uninsured shocks that reduce indi-vidual consumption below the thresholdneeded to maintain productivity can give riseto “dynamic poverty traps.” This happenswhen families are forced to sell productiveassets needed to support their microenterprisesor other ventures.59 Third, unemployment-related benefits can provide resources toincrease the effectiveness of the job search orto enter self-employment.60
Expanding and improving social insur-ance schemes can involve reinforcing self-insurance among workers in the formaleconomy through severance pay arrange-ments and increasing the pooling of risksacross workers.
Reinforcing self-insurance among formalworkers. Mandatory severance pay provisionsare the main form of insurance againstunemployment for workers in the formal sec-tor in most developing countries. Generallyeasy to administer, the provisions exchangeresources in the event of unemployment foran “insurance premium.” Whether the sever-ance pay premium is paid by the workers ornot has implications for the overall laborcosts for firms and hence their incentive forhiring workers in the first place. Even whenworkers bear the costs, the schemes offer onlya limited pooling of unemployment riskbecause they are firm-specific and becausebenefits generally evolve with job tenurerather than the risk of unemployment.61
Severance pay provisions also sufferfrom noncompliance in many countries,increasing worker resistance to leaving ajob. Required disbursements of severancepayments tend to increase when financialresources are lacking because the firm isexperiencing difficulties—and the resourcesmay simply not be available if the firm goesbankrupt. Noncompliance looms particu-larly large among small firms and amonglow-skilled workers who have few alterna-tive instruments to smooth consumption.62
Workers and labor markets 153
09_WDR_Ch07.qxd 9/3/04 11:14 AM Page 153

To tackle these shortcomings, some coun-tries have introduced pre-funding orbrought payments more in line with inter-national norms. Colombia moved toward afunded system under individual savingsaccounts in 1990, and Chile introduced asocial insurance component to its system in2002 (box 7.8).
Increasing the pooling of risks across work-ers. Experience in developed countries sug-gests that unemployment insurance benefitsare the next natural step to pooling unem-ployment risks and facilitating efficientlabor allocation.63 Following this model,most transition countries have introducedunemployment insurance schemes since theearly 1990s. The schemes have been themain source of income for workers affectedby labor reallocation during the transition.64
The clear welfare gains for workers affectedby job losses need to be weighed against thecosts of these schemes, including theirimpact on economic efficiency. Both thecosts and the impact depend largely on theability to monitor eligibility requirements tominimize moral hazard and make sure thatworkers have incentives to actively search fora new job.65 Effective enforcement is diffi-cult in developing countries, which gener-ally have weak public employment servicesor none, coupled with a large informal econ-
omy that offers many opportunities forundeclared paid work. In Argentina, forexample, the administration of unemploy-ment benefits was found to involve signifi-cant leakage of benefits to those who havefound jobs in the informal economy.66
Even when countries have the requiredadministrative capacity, unemploymentbenefits should provide only a fraction ofthe previous wage—and they should beshort-lived—to provide incentives forrecipients to seek a new job. Poland intro-duced a generous and open-ended unem-ployment insurance scheme in the early1990s, offering it to all job seekers irrespec-tive of whether they had lost a job. Not sur-prisingly, the number of claimants soared,making the system financially unviable andcontributing to the buildup of a large poolof long-term unemployed. The scheme,later reformed to reduce disincentiveeffects, now provides a low flat benefit for alimited duration. The Czech Republic, bycontrast, opted for less generous, short-lived benefits (only six months) and, partlybecause of this, had lower unemploymentin the early phases of the transition.
Reaching out to workers in the ruraland informal economiesMost of the programs discussed so far fail toreach workers in the rural and informal
154 WORLD DEVELOPMENT REPORT 2005
In 1990 Colombia introduced fully funded sev-erance-pay savings accounts, requiringemployers to deposit a percentage of wagesinto guaranteed individual accounts availableto workers in the event of job separation (lim-ited access to funds while employed was alsoforeseen). The reform reduced labor marketdistortions and promoted job creation.Employers shifted most of the cost ofseverance payments onto wages, but the totalcompensation of workers (wages plusdeposits to their savings accounts) rose. Inaddition, because the reform removed the dis-cretionary nature of severance payments, bothjob separations and hiring increased.
By transforming uncertain and conditionalpayments to unconditional paymentsmonitored by the government, the reform alsoenhanced the insurance function of severancepay. Before the reform, few firms actually
provided severance pay (for example, firmsabout to go bankrupt could simply not pay sev-erance or could negotiate a package substan-tially below what was owed in severance pay-ments).The prefunding requirement increasedthe likelihood that the legal entitlement to sev-erance pay would actually be carried out.Thenew severance-pay savings accounts alsoreduce transfers from other governmentprograms as well as from relatives.
In 2002 Chile introduced a new unemploy-ment insurance system that combined socialinsurance with self-insurance. Employers andemployees both contribute to individual savingsaccounts, but an additional contribution fromemployers and a small public subsidy are allo-cated to a solidarity fund.The new program iseffectively a funded system, with individualaccounts managed by an administrator selectedthrough a competitive tender.
To stimulate reemployment, benefit recipi-ents first draw resources from their ownaccounts, and upon their depletion, from thesolidarity account.Withdrawals from individualaccounts are triggered by separation from theemployer, regardless of the reason. Insufficientresources in individual accounts triggerwithdrawals from the solidarity fund if theclaimant meets the criteria for unemploymentinsurance (such as not working and being avail-able and searching for job).Withdrawals are lim-ited to two every five years. Benefits are linkedto past earnings, with a declining schedule.Workers can also move any unused savings fromtheir individual accounts to their old-age pen-sion accounts on retirement.
Source: Vodopivec (2004); Kugler (2002); andAcevedo and Eskenazi (2003).
B O X 7 . 8 Reforming severance pay in Colombia and Chile
09_WDR_Ch07.qxd 9/3/04 11:14 AM Page 154
economies, which in many developingcountries account for the majority of thepopulation. They typically rely on supportfrom employers or private transfers to copewith income losses. Rural employers oftenpay workers a fixed wage when they areemployed, regardless of seasonal and otherfluctuations in demand, or provide loans toworkers who face unexpected expenses.67
Given the informality of the employmentarrangement, employers have a lot of dis-cretion. Poor households also rely on theirown savings and private transfers to copewith shocks. In Indonesia, the Philippines,and Russia, private transfers account forbetween 2 percent and 41 percent ofincome for net receivers and between 1 per-cent and 8 percent of income for netgivers.68 A study in Kyrgyzstan found thatprivate transfers are provided to 12 percentof households and account for more thanone-third of the incomes of the householdswho receive them.69
These forms of private risk-coping pro-vide only limited help to poor and informalworkers, and can force people to resort tounproductive strategies including sellingproductive assets, withdrawing childrenfrom school, and cutting back medicalexpenditures.70 The most promising strat-egy for improving their situation is throughinvestment climate improvements thatexpand job opportunities in the formaleconomy and contribute to greater tax rev-enues to fund the provision of educationand other services. But governments canalso complement private risk-sharing withtargeted public support. Three main strate-gies have been adopted in developing coun-tries that can also contribute to betterinvestment conditions: workfare programs,social funds, and conditional cash transfers.
Workfare programs as social protectionschemes. In South Asia workfare programsstarted as “food-for-work” schemes, inwhich workers were paid for their laborwith food aid from donor countries. Work-fare programs have gradually moved to“cash for work,” operated by a variety ofagencies, including local and state govern-ments and nongovernmental organizations(NGOs). They are increasingly viewed as
insurance—not emergency—programs forinformal and rural workers. The schemesgenerally transfer income to poor house-holds by providing unskilled manual work-ers with short-term employment on pro-jects such as road construction andmaintenance, irrigation infrastructure,reforestation, and soil conservation.
Workfare programs have often smoothedconsumption and kept poor people in con-tact with the labor market.71 Well-designedprograms build much-needed infrastruc-ture and so reduce the tradeoff betweenpublic spending on income transfers and ondevelopment. The Maharashtra Employ-ment Guarantee Scheme in India, operatingfor more than three decades, has createdconsiderable irrigation, infrastructure, andrural roads in the state of Maharashtra.72
Workfare programs have also helped manysmall private contractors emerge and grow.
A key feature of successful workfare pro-grams is the ability to target participantsthrough self-selection processes. In Argentinathe Trabajar program kept the wage ratebelow the minimum wage, encouraging thepoor to self-select into the program. In thePhilippines, in contrast, the program wagewas much higher than the agricultural marketwage, attracting a substantial number of non-poor into the program. Kenya, Malawi, Mali,and Senegal also paid wages above the marketwage rates, undermining the self-targetingdesign and diverting jobs away from the verypoor.73 Self-selection of participants can beaccompanied by targeting to the poorest areasto ensure that programs also promote localdevelopment. In South Africa a demand-dri-ven approach to the allocation of funds forworkfare programs in the mid-1990s wasfound to favor more developed and betterconnected communities at the expense ofsome of the neediest communities.74
Social funds to improve opportunities—andthe investment climate—in poor areas.Social funds, introduced in Bolivia in thelate 1980s, have become one of the maintools of community-led poverty reduction.They finance small projects in poor com-munities. Early programs focused on pro-viding temporary work opportunities whilealso financing better access to basic services.
Workers and labor markets 155
09_WDR_Ch07.qxd 9/3/04 11:14 AM Page 155

response to economic crisis (Colombia) or anatural disaster (the earthquake in Turkey).In others they address long-term humandevelopment goals, such as school enroll-ments in Nicaragua.
As with any transfer program, condi-tional cash transfers can be problematicwhen the increased demand for services isnot met by increased supply (schools orclinics) or when the targeting is not suffi-ciently robust. However, evaluations showthat they can raise school enrollment andattendance rates and improve child healthand nutrition.77 The Mexican programOportunidades increased primary schoolattendance by more than 2 percent and sec-ondary enrollment by more than 8 percent,while increasing health visits by some 20percent. Likewise, Brazil’s Bolsa Escolareduced school dropout rates from 5.6 per-cent to 0.4 percent.78 The programs alsotend to be better targeted than general sub-sidies because of proxy means testing andgeographic targeting. They are also trans-parent about who receives the transfers, andthe level of benefits and the number of ben-eficiaries can easily be adjusted to takeaccount of changing circumstances.
Creating a better investment climate is fun-damental to improving the lives of people,including in their capacities as workers. Aninvestment climate that benefits all mem-bers of society looks beyond the protectionof existing jobs and confronts the challengeof creating opportunities for those in theinformal economy, the unemployed, andyoung people joining the workforce for thefirst time. Labor market policies that meetthis test play a critical role in the investmentclimate by helping to connect people toopportunities.
This and previous chapters in Part IIfocused on delivering the basics of a soundinvestment climate. Part III considerswhether there is something extra that gov-ernments might do—beyond the basics—toimprove the investment climates of theirsocieties.
156 WORLD DEVELOPMENT REPORT 2005
Recent programs give greater emphasis toservice delivery and connecting communi-ties—which generally identify and partlyfinance projects—with local governments.Social funds in developing countries nowabsorb close to $10 billion per year in for-eign and domestic financing.
A recent review of social funds in Arme-nia, Bolivia, Honduras, Nicaragua, Peru, andZambia offers a fairly positive assessment oftheir effectiveness in providing income sup-port and promoting local development.75
Evidence suggests that spending was highlyprogressive, with poor districts and poorhouseholds receiving more per capita sup-port than wealthier districts or households.76
Schools and health centers that receivedfunds have enjoyed equal or greater access tostaff and inputs and greater participation bylocal communities than other institutions.The effects on poor households can also besizable. Investments in school infrastructurewere estimated to have increased primaryenrollment rates, especially in Armenia,Nicaragua, and Zambia.
Conditional cash transfers to preservehuman capital and health. Conditional cashtransfers are another way to combine incomesupport with local development. Theybelong to a family of transfer programs thatcombine close targeting with capital accu-mulation by making income support condi-tional on either basic needs triggers, such asutility offset payments (in some transitioneconomies), or behavioral changes, such asthe continued school enrollment of childrenor attendance at health clinics. They typicallyaddress chronic poverty rather than idiosyn-cratic risks of job loss.
The focus of conditional cash transfers onhuman capital formation makes them suit-able to address poverty and local develop-ment at the same time. In Mexico Oportu-nidades (formerly Progresa) reached 2.3million families in 1999. In Brazil (BolsaEscola and PETI) and Jamaica (PATH), con-ditional cash transfers are used largely to pro-mote the health and education of children. Insome countries the transfers are a quick
09_WDR_Ch07.qxd 9/3/04 11:14 AM Page 156

GOVERNMENTS CAN GO BEYOND THE BASICS of a sound investmentclimate by conferring special policy privileges on particular firms oractivities or by drawing on the growing body of international rulesand standards that deal with investment climate issues. This partlooks at the role these measures might play in creating a betterinvestment climate.
Chapter 8—Selective interventions reviews international experiencewith a variety of strategies and highlights the special challenges ofeach.
Chapter 9—International rules and standards looks at how thesemeasures might contribute to better investment climates, and thechallenges they can present for developing countries.
Going Beyond the Basics?
IIIP A R T
10_WDR_PO3_Ch08.qxd 8/24/04 11:55 AM Page 157

10_WDR_PO3_Ch08.qxd 8/24/04 11:55 AM Page 158

159
The approaches to improving the investmentclimate discussed in Part II can benefit allfirms and activities in the economy. Giventhe breadth of that agenda, some firms oractivities may benefit from improvementsearlier than others—as with infrastructure ina particular region, or regulatory reformsaffecting a particular activity. As stressed inchapter 3, policy perfection isn’t needed toignite significant growth and poverty reduc-tion. The key is to address important con-straints in a way that gives firms confidenceto invest—and to sustain a process of ongo-ing improvements. But beyond the sequenc-ing of reforms, beyond delivering the basicsof a good investment climate, can govern-ments accelerate growth by providing specialand more selective support to particularfirms or activities? Possibly.
Governments have been experimentingwith such selective interventions for a longtime. In the 14th and 15th centuries, Englishmonarchs encouraged further processing ofthe wool industry.1 After World War II manydeveloping countries pursued “infant indus-try” strategies to support local industries byerecting import barriers—with nominal tar-iff rates for consumer goods exceeding 250percent in Argentina, Brazil, and Chile.2 Inthe 1960s and 1970s several East Asiancountries undertook selective interventionsto support export-oriented industries—prompting an ongoing and sometimesheated debate on the desirability, efficacy,and replicability of such strategies.3
The experiments continue to this day,with governments pursuing a wide varietyof strategies and approaches. They vary intheir special efforts—to accelerate researchand development or regional development,to promote foreign direct investment (FDI)or exports, to help small or rural firms, to
target specific industries or activities. Theyvary in their policy instruments, too, frommarket restrictions, to special tax or regula-tory privileges, to information-based strate-gies, to enclave approaches or “clusters,” todirected or subsidized credit, to public risk-sharing. Some interventions have an eco-nomic rationale—externalities or othermarket failures.4 Some may be regarded as aform of “second best” response given slowprogress in addressing the basics.5 Yet oth-ers seek to accelerate growth by fosteringparticular industries. Whatever the ratio-nale, all such schemes must navigate the het-erogeneous and self-interested requests offirms, rent-seeking pressures, and othersources of potential policy failure.
This chapter begins by examining someof the general lessons in undertaking selec-tive interventions. It then looks at emerg-ing practices aimed at several commonobjectives of such interventions: integrat-ing firms in the informal and ruraleconomies, unleashing the growth poten-tial of smaller firms, taking advantage ofinternational openness, and climbing thetechnology ladder.
The allure—and traps—of selective interventionsIf specific activities or industries that aresure to deliver strong benefits could beidentified and targeted cost effectively,growth might be ignited or acceleratedwithout addressing the often difficult chal-lenges in improving the basics of a goodinvestment climate. Such strategies alsohold great political appeal. Governmentsoften feel under pressure to be seen as pro-moting economic development, and firmsbenefiting from preferential treatment wel-come their special privileges.6 That is why
Selective interventions
8c h a p t e r
10_WDR_PO3_Ch08.qxd 8/24/04 11:55 AM Page 159
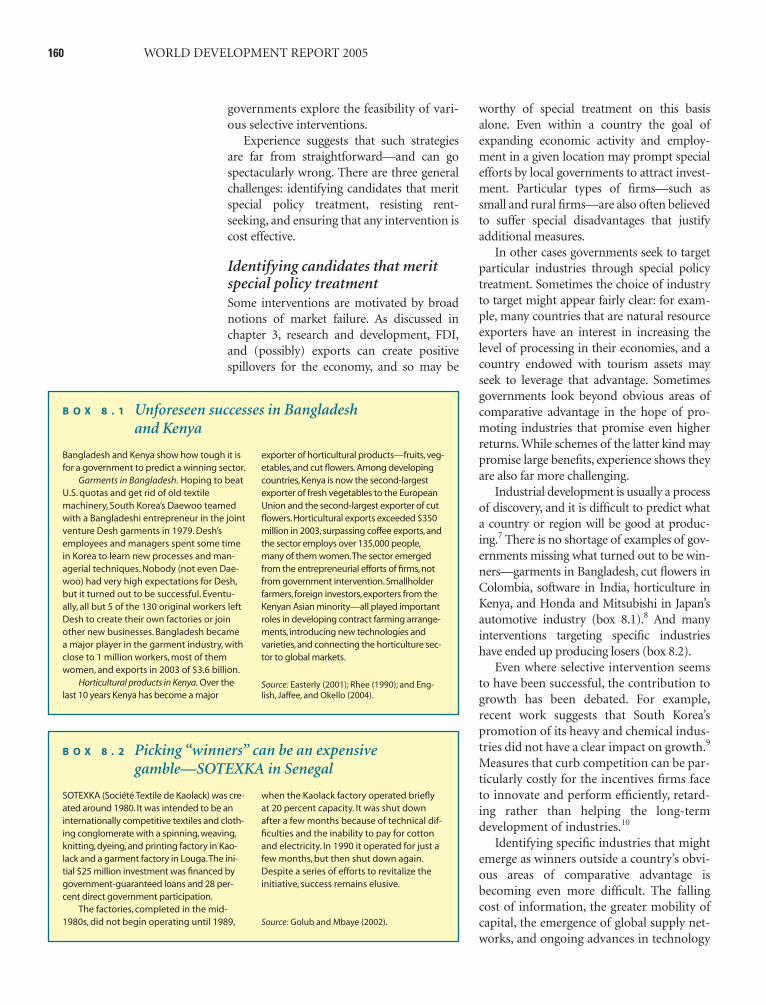
governments explore the feasibility of vari-ous selective interventions.
Experience suggests that such strategiesare far from straightforward—and can gospectacularly wrong. There are three generalchallenges: identifying candidates that meritspecial policy treatment, resisting rent-seeking, and ensuring that any intervention iscost effective.
Identifying candidates that meritspecial policy treatmentSome interventions are motivated by broadnotions of market failure. As discussed inchapter 3, research and development, FDI,and (possibly) exports can create positivespillovers for the economy, and so may be
worthy of special treatment on this basisalone. Even within a country the goal ofexpanding economic activity and employ-ment in a given location may prompt specialefforts by local governments to attract invest-ment. Particular types of firms—such assmall and rural firms—are also often believedto suffer special disadvantages that justifyadditional measures.
In other cases governments seek to targetparticular industries through special policytreatment. Sometimes the choice of industryto target might appear fairly clear: for exam-ple, many countries that are natural resourceexporters have an interest in increasing thelevel of processing in their economies, and acountry endowed with tourism assets mayseek to leverage that advantage. Sometimesgovernments look beyond obvious areas ofcomparative advantage in the hope of pro-moting industries that promise even higherreturns. While schemes of the latter kind maypromise large benefits, experience shows theyare also far more challenging.
Industrial development is usually a processof discovery, and it is difficult to predict whata country or region will be good at produc-ing.7 There is no shortage of examples of gov-ernments missing what turned out to be win-ners—garments in Bangladesh, cut flowers inColombia, software in India, horticulture inKenya, and Honda and Mitsubishi in Japan’sautomotive industry (box 8.1).8 And manyinterventions targeting specific industrieshave ended up producing losers (box 8.2).
Even where selective intervention seemsto have been successful, the contribution togrowth has been debated. For example,recent work suggests that South Korea’spromotion of its heavy and chemical indus-tries did not have a clear impact on growth.9
Measures that curb competition can be par-ticularly costly for the incentives firms faceto innovate and perform efficiently, retard-ing rather than helping the long-termdevelopment of industries.10
Identifying specific industries that mightemerge as winners outside a country’s obvi-ous areas of comparative advantage isbecoming even more difficult. The fallingcost of information, the greater mobility ofcapital, the emergence of global supply net-works, and ongoing advances in technology
160 WORLD DEVELOPMENT REPORT 2005
Bangladesh and Kenya show how tough it isfor a government to predict a winning sector.
Garments in Bangladesh. Hoping to beatU.S. quotas and get rid of old textilemachinery, South Korea’s Daewoo teamedwith a Bangladeshi entrepreneur in the jointventure Desh garments in 1979. Desh’semployees and managers spent some timein Korea to learn new processes and man-agerial techniques. Nobody (not even Dae-woo) had very high expectations for Desh,but it turned out to be successful. Eventu-ally, all but 5 of the 130 original workers leftDesh to create their own factories or joinother new businesses. Bangladesh becamea major player in the garment industry, withclose to 1 million workers, most of themwomen, and exports in 2003 of $3.6 billion.
Horticultural products in Kenya. Over thelast 10 years Kenya has become a major
exporter of horticultural products—fruits,veg-etables,and cut flowers.Among developingcountries,Kenya is now the second-largestexporter of fresh vegetables to the EuropeanUnion and the second-largest exporter of cutflowers.Horticultural exports exceeded $350million in 2003,surpassing coffee exports,andthe sector employs over 135,000 people,many of them women.The sector emergedfrom the entrepreneurial efforts of firms,notfrom government intervention.Smallholderfarmers, foreign investors,exporters from theKenyan Asian minority—all played importantroles in developing contract farming arrange-ments, introducing new technologies andvarieties,and connecting the horticulture sec-tor to global markets.
Source: Easterly (2001); Rhee (1990); and Eng-lish, Jaffee, and Okello (2004).
B O X 8 . 1 Unforeseen successes in Bangladesh and Kenya
SOTEXKA (Société Textile de Kaolack) was cre-ated around 1980. It was intended to be aninternationally competitive textiles and cloth-ing conglomerate with a spinning, weaving,knitting, dyeing, and printing factory in Kao-lack and a garment factory in Louga.The ini-tial $25 million investment was financed bygovernment-guaranteed loans and 28 per-cent direct government participation.
The factories, completed in the mid-1980s, did not begin operating until 1989,
when the Kaolack factory operated brieflyat 20 percent capacity. It was shut downafter a few months because of technical dif-ficulties and the inability to pay for cottonand electricity. In 1990 it operated for just afew months, but then shut down again.Despite a series of efforts to revitalize theinitiative, success remains elusive.
Source: Golub and Mbaye (2002).
B O X 8 . 2 Picking “winners” can be an expensive gamble—SOTEXKA in Senegal
10_WDR_PO3_Ch08.qxd 8/24/04 11:55 AM Page 160
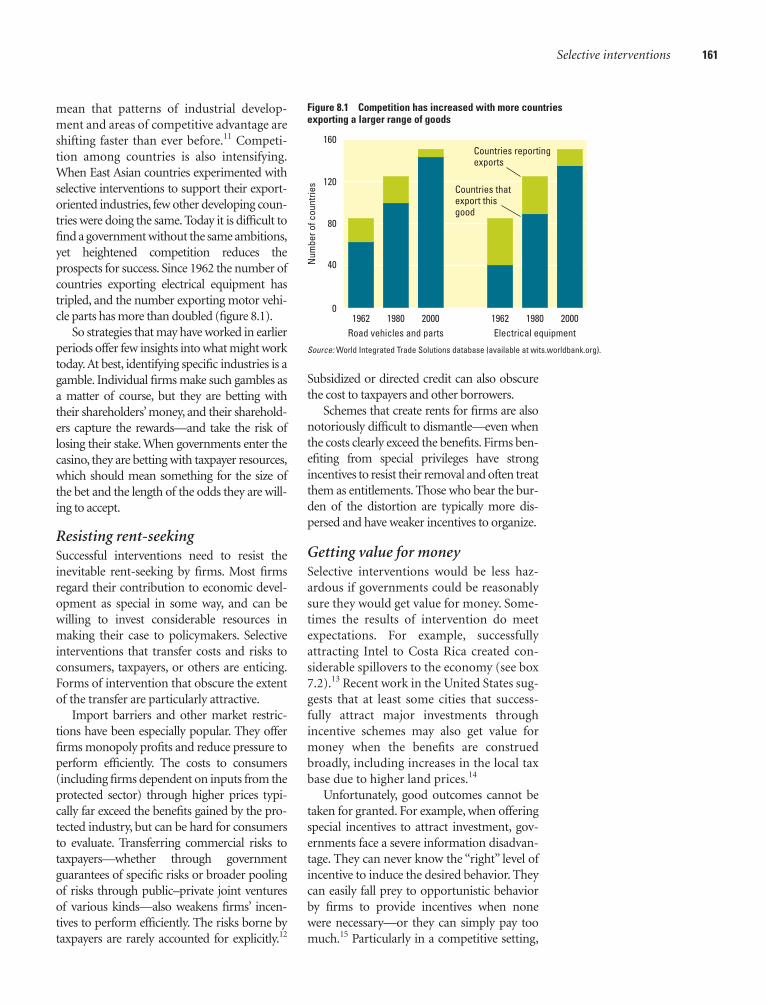
mean that patterns of industrial develop-ment and areas of competitive advantage areshifting faster than ever before.11 Competi-tion among countries is also intensifying.When East Asian countries experimented withselective interventions to support their export-oriented industries, few other developing coun-tries were doing the same. Today it is difficult tofind a government without the same ambitions,yet heightened competition reduces theprospects for success. Since 1962 the number ofcountries exporting electrical equipment hastripled, and the number exporting motor vehi-cle parts has more than doubled (figure 8.1).
So strategies that may have worked in earlierperiods offer few insights into what might worktoday. At best, identifying specific industries is agamble. Individual firms make such gambles asa matter of course, but they are betting withtheir shareholders’ money, and their sharehold-ers capture the rewards—and take the risk oflosing their stake. When governments enter thecasino, they are betting with taxpayer resources,which should mean something for the size ofthe bet and the length of the odds they are will-ing to accept.
Resisting rent-seekingSuccessful interventions need to resist theinevitable rent-seeking by firms. Most firmsregard their contribution to economic devel-opment as special in some way, and can bewilling to invest considerable resources inmaking their case to policymakers. Selectiveinterventions that transfer costs and risks toconsumers, taxpayers, or others are enticing.Forms of intervention that obscure the extentof the transfer are particularly attractive.
Import barriers and other market restric-tions have been especially popular. They offerfirms monopoly profits and reduce pressure toperform efficiently. The costs to consumers(including firms dependent on inputs from theprotected sector) through higher prices typi-cally far exceed the benefits gained by the pro-tected industry, but can be hard for consumersto evaluate. Transferring commercial risks totaxpayers—whether through governmentguarantees of specific risks or broader poolingof risks through public–private joint venturesof various kinds—also weakens firms’ incen-tives to perform efficiently. The risks borne bytaxpayers are rarely accounted for explicitly.12
Subsidized or directed credit can also obscurethe cost to taxpayers and other borrowers.
Schemes that create rents for firms are alsonotoriously difficult to dismantle—even whenthe costs clearly exceed the benefits. Firms ben-efiting from special privileges have strongincentives to resist their removal and often treatthem as entitlements. Those who bear the bur-den of the distortion are typically more dis-persed and have weaker incentives to organize.
Getting value for moneySelective interventions would be less haz-ardous if governments could be reasonablysure they would get value for money. Some-times the results of intervention do meetexpectations. For example, successfullyattracting Intel to Costa Rica created con-siderable spillovers to the economy (see box7.2).13 Recent work in the United States sug-gests that at least some cities that success-fully attract major investments throughincentive schemes may also get value formoney when the benefits are construedbroadly, including increases in the local taxbase due to higher land prices.14
Unfortunately, good outcomes cannot betaken for granted. For example, when offeringspecial incentives to attract investment, gov-ernments face a severe information disadvan-tage. They can never know the “right” level ofincentive to induce the desired behavior. Theycan easily fall prey to opportunistic behaviorby firms to provide incentives when nonewere necessary—or they can simply pay toomuch.15 Particularly in a competitive setting,
Selective interventions 161
0
40
80
Num
ber o
f cou
ntrie
s 120
160
20001980196220001980Electrical equipmentRoad vehicles and parts
1962
Countries thatexport thisgood
Countries reportingexports
Source: World Integrated Trade Solutions database (available at wits.worldbank.org).
Figure 8.1 Competition has increased with more countriesexporting a larger range of goods
10_WDR_PO3_Ch08.qxd 8/24/04 11:55 AM Page 161

pressures on politicians to overbid may con-tribute to the “winner’s curse” that can afflictbidders in any auction.16 Governments canalso fail to get value for money when theincentive is paid up front or takes the form ofthe provision of specific infrastructure andthe firm does not deliver as expected—as theU.S. city of Indianapolis recently discovered(see box 8.9).
Nor are the costs limited to forgone taxrevenues or specific public investments.Schemes that involve market restrictionstransfer costs to consumers, and thoseinvolving directed credit transfer costs toother borrowers. Selective interventions canalso create distortions that ripple throughproduct and factor markets. Indeed, manydistortions in countries’ investment cli-mates today are the legacies of earlier effortsto intervene selectively.
Overall lessons of experienceBefore looking at particular strategies, it isuseful to spell out some general lessons. Intheory, selective interventions can yieldpositive social outcomes. In practice, casesof unambiguous success are rare, and thereare many examples of costly failures, even indeveloped countries with abundant techni-cal expertise and well-established checks onrent-seeking. Selective interventions thattarget specific industries outside a country’sobvious areas of comparative advantage aremost clearly a gamble. But a review of inter-national experience reveals no sure-firestrategies even for less ambitious schemes,suggesting that the analogy applies morebroadly. The potential size of the reward isobviously one factor governments need toconsider. But what determines the odds ofsuccess in realizing those benefits in a cost-effective way? Three factors stand out:
• Breadth of focus of the intervention.Given the dynamic nature of industrialdevelopment, the narrower the focus ofthe intervention in terms of specificfirms or industries, the longer the oddsof success. Thus measures to encourageFDI or technological progress in gen-eral involve fewer risks than thosefocusing narrowly on a specific firm orindustry.
• Relationship with the basics of a soundinvestment climate. Given the many fac-tors that shape the incentives for firms toinvest productively, the more a schemetries to substitute for inadequacies in thebasics of a sound investment climate,rather than build on them, the longer theodds of success.
• Quality of governance. Selective interven-tions do not necessarily require moreexpertise or resources than more basicmeasures—indeed, many demand less.But selective interventions are more vul-nerable to rent-seeking by firms and offi-cials, and the weaker the restraints on suchbehavior, the longer the odds of success.
When positive outcomes cannot beassured, the size of the bet matters. Schemesinvolving large budget outlays, transferringsubstantial risks to taxpayers, or creatingserious market distortions involve greaterstakes than measures focusing on the dis-semination of information—although eventhose can be costly. Beyond such calcula-tions, what else might governments do toreduce the risks inherent with selectiveinterventions? International experience sug-gests six basic guidelines for the design andimplementation of any such scheme:
1. Have a clear objective and rationale.Unless a clear objective is stated, it will beimpossible to judge whether a scheme ismeeting its intended goal at all, let alone costeffectively. Often multiple (and sometimesconflicting) goals are pursued simultane-ously.17 Schemes with vague objectives orrationales can also mask the conferral of ben-efits on politically influential groups withoutbroader social benefit.
2. Focus on the sources of problems, not thesymptoms. Many obstacles facing firms stemfrom government failures in other areas—weak protection of property rights, red tape,corruption, dysfunctional infrastructure poli-cies, or government crowding out credit mar-kets. Progress in addressing the underlyingcauses promises a broader and more sustain-able impact than targeted measures that mayintroduce new distortions or simply distractattention from dealing with those causes.
162 WORLD DEVELOPMENT REPORT 2005
10_WDR_PO3_Ch08.qxd 8/24/04 11:55 AM Page 162
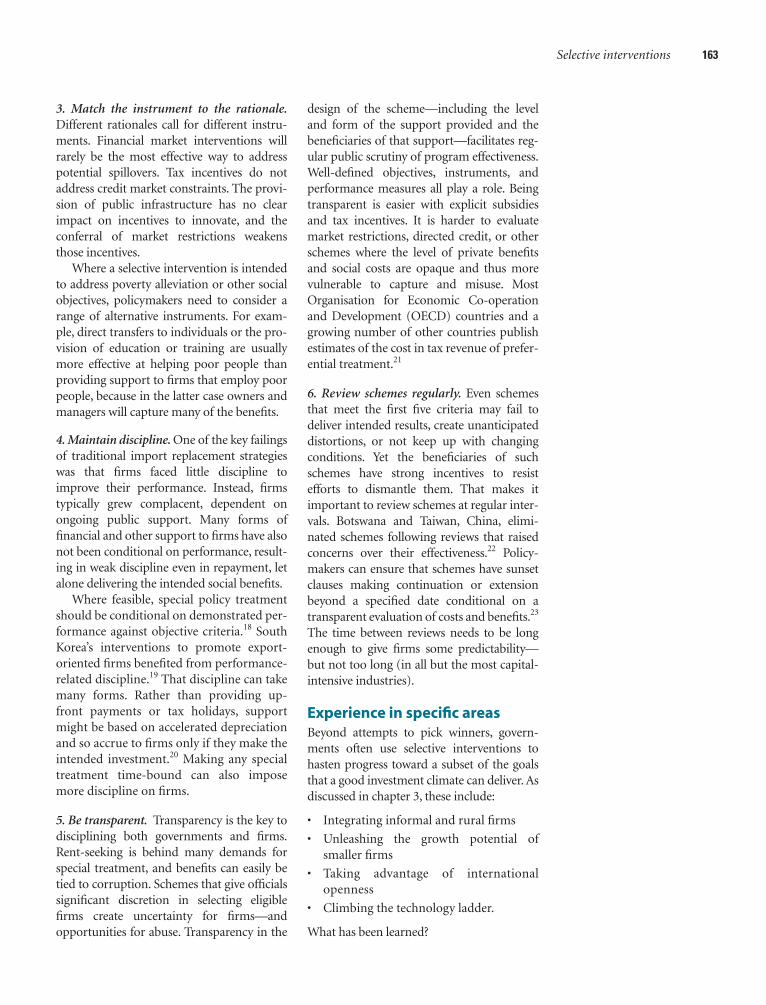
3. Match the instrument to the rationale.Different rationales call for different instru-ments. Financial market interventions willrarely be the most effective way to addresspotential spillovers. Tax incentives do notaddress credit market constraints. The provi-sion of public infrastructure has no clearimpact on incentives to innovate, and theconferral of market restrictions weakensthose incentives.
Where a selective intervention is intendedto address poverty alleviation or other socialobjectives, policymakers need to consider arange of alternative instruments. For exam-ple, direct transfers to individuals or the pro-vision of education or training are usuallymore effective at helping poor people thanproviding support to firms that employ poorpeople, because in the latter case owners andmanagers will capture many of the benefits.
4. Maintain discipline. One of the key failingsof traditional import replacement strategieswas that firms faced little discipline toimprove their performance. Instead, firmstypically grew complacent, dependent onongoing public support. Many forms offinancial and other support to firms have alsonot been conditional on performance, result-ing in weak discipline even in repayment, letalone delivering the intended social benefits.
Where feasible, special policy treatmentshould be conditional on demonstrated per-formance against objective criteria.18 SouthKorea’s interventions to promote export-oriented firms benefited from performance-related discipline.19 That discipline can takemany forms. Rather than providing up-front payments or tax holidays, supportmight be based on accelerated depreciationand so accrue to firms only if they make theintended investment.20 Making any specialtreatment time-bound can also imposemore discipline on firms.
5. Be transparent. Transparency is the key todisciplining both governments and firms.Rent-seeking is behind many demands forspecial treatment, and benefits can easily betied to corruption. Schemes that give officialssignificant discretion in selecting eligiblefirms create uncertainty for firms—andopportunities for abuse. Transparency in the
design of the scheme—including the leveland form of the support provided and thebeneficiaries of that support—facilitates reg-ular public scrutiny of program effectiveness.Well-defined objectives, instruments, andperformance measures all play a role. Beingtransparent is easier with explicit subsidiesand tax incentives. It is harder to evaluatemarket restrictions, directed credit, or otherschemes where the level of private benefitsand social costs are opaque and thus morevulnerable to capture and misuse. MostOrganisation for Economic Co-operationand Development (OECD) countries and agrowing number of other countries publishestimates of the cost in tax revenue of prefer-ential treatment.21
6. Review schemes regularly. Even schemesthat meet the first five criteria may fail todeliver intended results, create unanticipateddistortions, or not keep up with changingconditions. Yet the beneficiaries of suchschemes have strong incentives to resistefforts to dismantle them. That makes itimportant to review schemes at regular inter-vals. Botswana and Taiwan, China, elimi-nated schemes following reviews that raisedconcerns over their effectiveness.22 Policy-makers can ensure that schemes have sunsetclauses making continuation or extensionbeyond a specified date conditional on atransparent evaluation of costs and benefits.23
The time between reviews needs to be longenough to give firms some predictability—but not too long (in all but the most capital-intensive industries).
Experience in specific areasBeyond attempts to pick winners, govern-ments often use selective interventions tohasten progress toward a subset of the goalsthat a good investment climate can deliver. Asdiscussed in chapter 3, these include:
• Integrating informal and rural firms
• Unleashing the growth potential ofsmaller firms
• Taking advantage of internationalopenness
• Climbing the technology ladder.
What has been learned?
Selective interventions 163
10_WDR_PO3_Ch08.qxd 8/24/04 11:55 AM Page 163
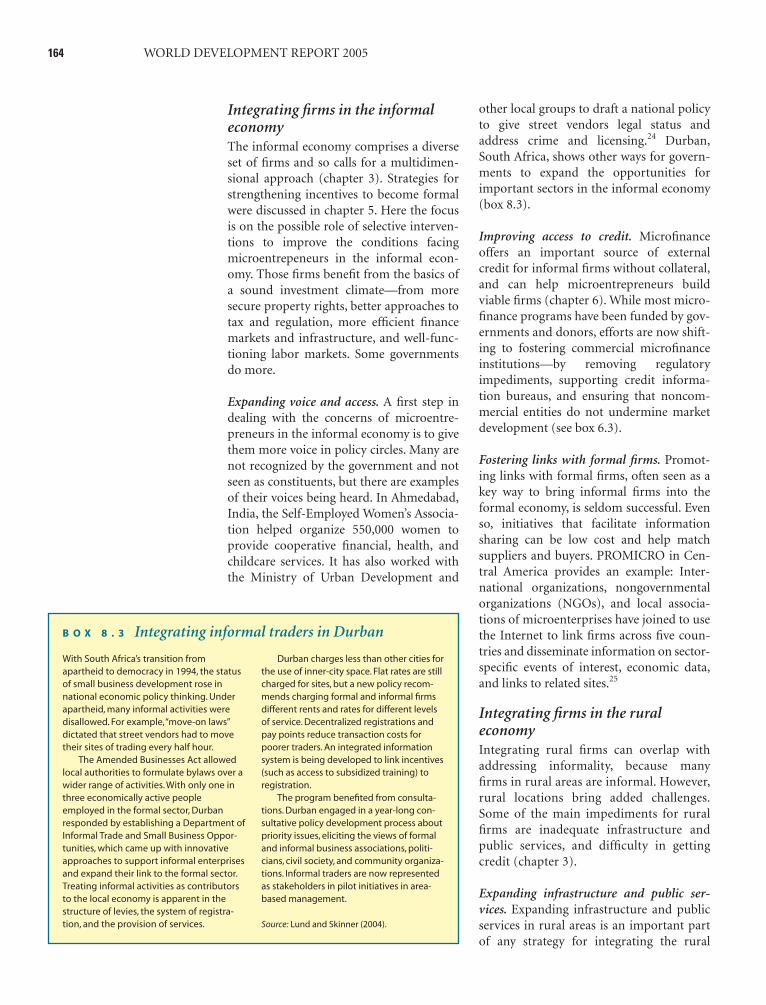
Integrating firms in the informaleconomyThe informal economy comprises a diverseset of firms and so calls for a multidimen-sional approach (chapter 3). Strategies forstrengthening incentives to become formalwere discussed in chapter 5. Here the focusis on the possible role of selective interven-tions to improve the conditions facingmicroentrepeneurs in the informal econ-omy. Those firms benefit from the basics ofa sound investment climate—from moresecure property rights, better approaches totax and regulation, more efficient financemarkets and infrastructure, and well-func-tioning labor markets. Some governmentsdo more.
Expanding voice and access. A first step indealing with the concerns of microentre-preneurs in the informal economy is to givethem more voice in policy circles. Many arenot recognized by the government and notseen as constituents, but there are examplesof their voices being heard. In Ahmedabad,India, the Self-Employed Women’s Associa-tion helped organize 550,000 women toprovide cooperative financial, health, andchildcare services. It has also worked withthe Ministry of Urban Development and
other local groups to draft a national policyto give street vendors legal status andaddress crime and licensing.24 Durban,South Africa, shows other ways for govern-ments to expand the opportunities forimportant sectors in the informal economy(box 8.3).
Improving access to credit. Microfinanceoffers an important source of externalcredit for informal firms without collateral,and can help microentrepreneurs buildviable firms (chapter 6). While most micro-finance programs have been funded by gov-ernments and donors, efforts are now shift-ing to fostering commercial microfinanceinstitutions—by removing regulatoryimpediments, supporting credit informa-tion bureaus, and ensuring that noncom-mercial entities do not undermine marketdevelopment (see box 6.3).
Fostering links with formal firms. Promot-ing links with formal firms, often seen as akey way to bring informal firms into theformal economy, is seldom successful. Evenso, initiatives that facilitate informationsharing can be low cost and help matchsuppliers and buyers. PROMICRO in Cen-tral America provides an example: Inter-national organizations, nongovernmentalorganizations (NGOs), and local associa-tions of microenterprises have joined to usethe Internet to link firms across five coun-tries and disseminate information on sector-specific events of interest, economic data,and links to related sites.25
Integrating firms in the ruraleconomyIntegrating rural firms can overlap withaddressing informality, because manyfirms in rural areas are informal. However,rural locations bring added challenges.Some of the main impediments for ruralfirms are inadequate infrastructure andpublic services, and difficulty in gettingcredit (chapter 3).
Expanding infrastructure and public ser-vices. Expanding infrastructure and publicservices in rural areas is an important partof any strategy for integrating the rural
164 WORLD DEVELOPMENT REPORT 2005
With South Africa’s transition fromapartheid to democracy in 1994, the statusof small business development rose innational economic policy thinking. Underapartheid, many informal activities weredisallowed. For example,“move-on laws”dictated that street vendors had to movetheir sites of trading every half hour.
The Amended Businesses Act allowedlocal authorities to formulate bylaws over awider range of activities. With only one inthree economically active peopleemployed in the formal sector, Durbanresponded by establishing a Department ofInformal Trade and Small Business Oppor-tunities, which came up with innovativeapproaches to support informal enterprisesand expand their link to the formal sector.Treating informal activities as contributorsto the local economy is apparent in thestructure of levies, the system of registra-tion, and the provision of services.
Durban charges less than other cities forthe use of inner-city space. Flat rates are stillcharged for sites, but a new policy recom-mends charging formal and informal firmsdifferent rents and rates for different levelsof service. Decentralized registrations andpay points reduce transaction costs forpoorer traders. An integrated informationsystem is being developed to link incentives(such as access to subsidized training) toregistration.
The program benefited from consulta-tions. Durban engaged in a year-long con-sultative policy development process aboutpriority issues, eliciting the views of formaland informal business associations, politi-cians, civil society, and community organiza-tions. Informal traders are now representedas stakeholders in pilot initiatives in area-based management.
Source: Lund and Skinner (2004).
B O X 8 . 3 Integrating informal traders in Durban
10_WDR_PO3_Ch08.qxd 8/24/04 11:55 AM Page 164
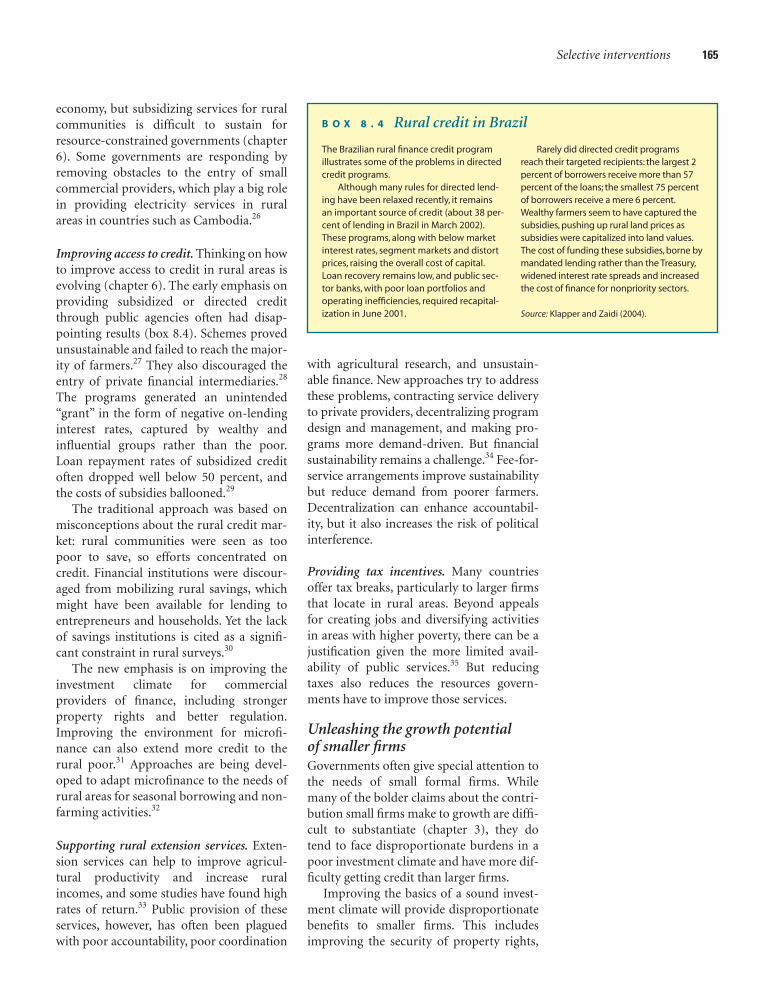
economy, but subsidizing services for ruralcommunities is difficult to sustain forresource-constrained governments (chapter6). Some governments are responding byremoving obstacles to the entry of smallcommercial providers, which play a big rolein providing electricity services in ruralareas in countries such as Cambodia.26
Improving access to credit. Thinking on howto improve access to credit in rural areas isevolving (chapter 6). The early emphasis onproviding subsidized or directed creditthrough public agencies often had disap-pointing results (box 8.4). Schemes provedunsustainable and failed to reach the major-ity of farmers.27 They also discouraged theentry of private financial intermediaries.28
The programs generated an unintended“grant” in the form of negative on-lendinginterest rates, captured by wealthy andinfluential groups rather than the poor.Loan repayment rates of subsidized creditoften dropped well below 50 percent, andthe costs of subsidies ballooned.29
The traditional approach was based onmisconceptions about the rural credit mar-ket: rural communities were seen as toopoor to save, so efforts concentrated oncredit. Financial institutions were discour-aged from mobilizing rural savings, whichmight have been available for lending toentrepreneurs and households. Yet the lackof savings institutions is cited as a signifi-cant constraint in rural surveys.30
The new emphasis is on improving theinvestment climate for commercialproviders of finance, including strongerproperty rights and better regulation.Improving the environment for microfi-nance can also extend more credit to therural poor.31 Approaches are being devel-oped to adapt microfinance to the needs ofrural areas for seasonal borrowing and non-farming activities.32
Supporting rural extension services. Exten-sion services can help to improve agricul-tural productivity and increase ruralincomes, and some studies have found highrates of return.33 Public provision of theseservices, however, has often been plaguedwith poor accountability, poor coordination
with agricultural research, and unsustain-able finance. New approaches try to addressthese problems, contracting service deliveryto private providers, decentralizing programdesign and management, and making pro-grams more demand-driven. But financialsustainability remains a challenge.34 Fee-for-service arrangements improve sustainabilitybut reduce demand from poorer farmers.Decentralization can enhance accountabil-ity, but it also increases the risk of politicalinterference.
Providing tax incentives. Many countriesoffer tax breaks, particularly to larger firmsthat locate in rural areas. Beyond appealsfor creating jobs and diversifying activitiesin areas with higher poverty, there can be ajustification given the more limited avail-ability of public services.35 But reducingtaxes also reduces the resources govern-ments have to improve those services.
Unleashing the growth potential of smaller firmsGovernments often give special attention tothe needs of small formal firms. Whilemany of the bolder claims about the contri-bution small firms make to growth are diffi-cult to substantiate (chapter 3), they dotend to face disproportionate burdens in apoor investment climate and have more dif-ficulty getting credit than larger firms.
Improving the basics of a sound invest-ment climate will provide disproportionatebenefits to smaller firms. This includesimproving the security of property rights,
Selective interventions 165
The Brazilian rural finance credit programillustrates some of the problems in directedcredit programs.
Although many rules for directed lend-ing have been relaxed recently, it remainsan important source of credit (about 38 per-cent of lending in Brazil in March 2002).These programs, along with below marketinterest rates, segment markets and distortprices, raising the overall cost of capital.Loan recovery remains low, and public sec-tor banks, with poor loan portfolios andoperating inefficiencies, required recapital-ization in June 2001.
Rarely did directed credit programsreach their targeted recipients: the largest 2percent of borrowers receive more than 57percent of the loans; the smallest 75 percentof borrowers receive a mere 6 percent.Wealthy farmers seem to have captured thesubsidies, pushing up rural land prices assubsidies were capitalized into land values.The cost of funding these subsidies, borne bymandated lending rather than the Treasury,widened interest rate spreads and increasedthe cost of finance for nonpriority sectors.
Source: Klapper and Zaidi (2004).
B O X 8 . 4 Rural credit in Brazil
10_WDR_PO3_Ch08.qxd 8/24/04 11:55 AM Page 165

reducing red tape, improving the efficiencyof tax administration, curbing corruption,improving the functioning of finance mar-kets, and strengthening infrastructure. Somegovernments go beyond this by providingspecial benefits to smaller firms.
Improving access to credit. The disadvan-tages smaller firms face in getting creditstem from information asymmetries, areexacerbated by weak property rights, andare further compounded when govern-ments create other distortions in financialmarkets (chapter 6). Instead of addressingthese problems, many governments comeup with special schemes to provide directedor subsidized credit to small firms. Theseschemes have a poor track record in devel-oping countries. Loans tend to go to politi-cally connected firms. Weak repayment dis-cipline jeopardizes sustainability. Andsubsidized credit crowds out potentialproviders of credit on a commercial basis.36
Nor do subsidized loans help most firmsgrow faster.37 A survey of small firms inSouth Korea found that subsidized creditwas no more valuable than commercialcredit, mainly because of narrow eligibilitycriteria and delays in obtaining the funds.38
Efforts to expand access to finance will alsohave little impact when other investmentclimate concerns reduce the incentives forfirms to reinvest their own resources.39
Providing business development services.Small firms are often assumed to face spe-cial difficulty in obtaining access to businessdevelopment services—training, consult-ing, marketing, technology transfer, andbusiness links—tailored to their needs. Tra-ditionally, governments or donors createdpublic institutions, or arranged for NGOsto deliver these services to firms for free orat highly subsidized rates. The efforts weregenerally found to be ineffective, with lowtake-up rates, cost overruns, and difficultiesin tailoring services to the needs of clients.These efforts also deterred the emergence ofcommercial providers of these services.More market-friendly approaches are nowbeing explored that aim to increase out-reach to currently underserved sectors withself-sustained and cost-effective pro-
grams.40 However, experience highlights thepossible conflicts in trying to achieve out-reach and sustainability simultaneously,41
and the cost-effectiveness of the newerapproaches has not yet been evaluated.42
Fostering industry clusters. Agglomerationeconomies associated with proximity to otherfirms can stimulate productivity upgradingand growth.43 Efforts to stimulate thoseeconomies through industry clusters gainedmomentum in the 1990s as a way of helpingsmall firms grow and upgrade throughsharing complementarities.44 A recent studyidentified more than 500 such initiatives,mainly in developed and transitioneconomies.45 But governments have diffi-culty identifying sectors where clusters willsucceed,46 and the heterogeneity of clustersmakes it difficult to come up with recipes forsuccessful intervention.47 In clusters of low-productivity firms there is also a tradeoffbetween strengthening individual firms andreinforcing their synergies, and opportunis-tic behavior by firms can undermine collec-tive services.48
Experience shows that cluster initiativesneed to be private sector–driven and thatpublic support cannot substitute for lack ofprivate commitment. A review of U.S. Agencyfor International Development (USAID)experience in cluster development in 26countries concluded that large amounts ofpublic funding weakened local ownership ofprojects.49 The success of cluster initiativesdepends on firms being able to work togetherfor their common interests. Overcoming ani-mosities among firms can be challenging, as adonor-driven initiative in the Mongoliancashmere sector discovered. In that case,however, the realization of benefits from newmarkets built further trust in the process andled to the sector’s expansion.50
Providing market privileges. Some coun-tries erect regulatory barriers to shieldsmaller firms from too much competitionfrom larger firms. But regulatory barriersalso discourage firms from growing. Con-sider the reservation of market segments forsmall firms in India. In addition to limitingparticipation by larger and more efficientfirms—to the detriment of consumers—the
166 WORLD DEVELOPMENT REPORT 2005
10_WDR_PO3_Ch08.qxd 8/24/04 11:55 AM Page 166
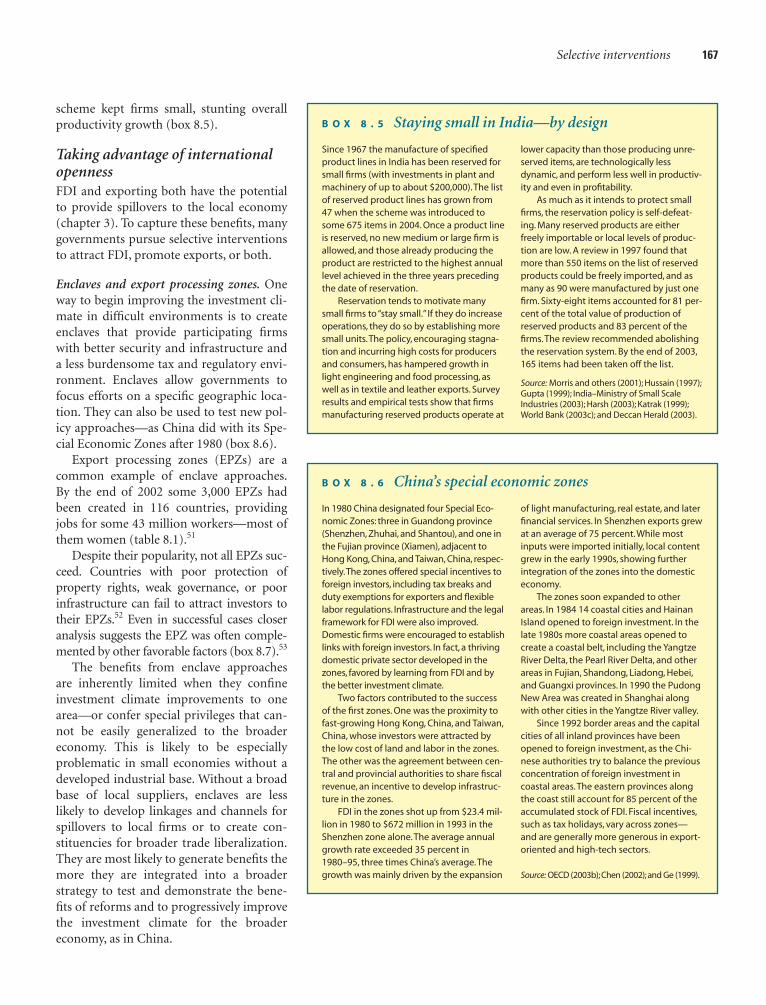
Selective interventions 167
scheme kept firms small, stunting overallproductivity growth (box 8.5).
Taking advantage of internationalopennessFDI and exporting both have the potentialto provide spillovers to the local economy(chapter 3). To capture these benefits, manygovernments pursue selective interventionsto attract FDI, promote exports, or both.
Enclaves and export processing zones. Oneway to begin improving the investment cli-mate in difficult environments is to createenclaves that provide participating firmswith better security and infrastructure anda less burdensome tax and regulatory envi-ronment. Enclaves allow governments tofocus efforts on a specific geographic loca-tion. They can also be used to test new pol-icy approaches—as China did with its Spe-cial Economic Zones after 1980 (box 8.6).
Export processing zones (EPZs) are acommon example of enclave approaches.By the end of 2002 some 3,000 EPZs hadbeen created in 116 countries, providingjobs for some 43 million workers—most ofthem women (table 8.1).51
Despite their popularity, not all EPZs suc-ceed. Countries with poor protection ofproperty rights, weak governance, or poorinfrastructure can fail to attract investors totheir EPZs.52 Even in successful cases closeranalysis suggests the EPZ was often comple-mented by other favorable factors (box 8.7).53
The benefits from enclave approachesare inherently limited when they confineinvestment climate improvements to onearea—or confer special privileges that can-not be easily generalized to the broadereconomy. This is likely to be especiallyproblematic in small economies without adeveloped industrial base. Without a broadbase of local suppliers, enclaves are lesslikely to develop linkages and channels forspillovers to local firms or to create con-stituencies for broader trade liberalization.They are most likely to generate benefits themore they are integrated into a broaderstrategy to test and demonstrate the bene-fits of reforms and to progressively improvethe investment climate for the broadereconomy, as in China.
Since 1967 the manufacture of specifiedproduct lines in India has been reserved forsmall firms (with investments in plant andmachinery of up to about $200,000).The listof reserved product lines has grown from47 when the scheme was introduced tosome 675 items in 2004. Once a product lineis reserved, no new medium or large firm isallowed, and those already producing theproduct are restricted to the highest annuallevel achieved in the three years precedingthe date of reservation.
Reservation tends to motivate manysmall firms to “stay small.” If they do increaseoperations, they do so by establishing moresmall units.The policy, encouraging stagna-tion and incurring high costs for producersand consumers, has hampered growth inlight engineering and food processing, aswell as in textile and leather exports. Surveyresults and empirical tests show that firmsmanufacturing reserved products operate at
lower capacity than those producing unre-served items, are technologically lessdynamic, and perform less well in productiv-ity and even in profitability.
As much as it intends to protect smallfirms, the reservation policy is self-defeat-ing. Many reserved products are eitherfreely importable or local levels of produc-tion are low. A review in 1997 found thatmore than 550 items on the list of reservedproducts could be freely imported, and asmany as 90 were manufactured by just onefirm. Sixty-eight items accounted for 81 per-cent of the total value of production ofreserved products and 83 percent of thefirms.The review recommended abolishingthe reservation system. By the end of 2003,165 items had been taken off the list.
Source: Morris and others (2001); Hussain (1997);Gupta (1999); India–Ministry of Small ScaleIndustries (2003); Harsh (2003); Katrak (1999);World Bank (2003c); and Deccan Herald (2003).
B O X 8 . 5 Staying small in India—by design
In 1980 China designated four Special Eco-nomic Zones: three in Guandong province(Shenzhen, Zhuhai, and Shantou), and one inthe Fujian province (Xiamen), adjacent toHong Kong, China, and Taiwan, China, respec-tively.The zones offered special incentives toforeign investors, including tax breaks andduty exemptions for exporters and flexiblelabor regulations. Infrastructure and the legalframework for FDI were also improved.Domestic firms were encouraged to establishlinks with foreign investors. In fact, a thrivingdomestic private sector developed in thezones, favored by learning from FDI and bythe better investment climate.
Two factors contributed to the successof the first zones. One was the proximity tofast-growing Hong Kong, China, and Taiwan,China, whose investors were attracted bythe low cost of land and labor in the zones.The other was the agreement between cen-tral and provincial authorities to share fiscalrevenue, an incentive to develop infrastruc-ture in the zones.
FDI in the zones shot up from $23.4 mil-lion in 1980 to $672 million in 1993 in theShenzhen zone alone.The average annualgrowth rate exceeded 35 percent in1980–95, three times China’s average.Thegrowth was mainly driven by the expansion
of light manufacturing, real estate, and laterfinancial services. In Shenzhen exports grewat an average of 75 percent.While mostinputs were imported initially, local contentgrew in the early 1990s, showing furtherintegration of the zones into the domesticeconomy.
The zones soon expanded to otherareas. In 1984 14 coastal cities and HainanIsland opened to foreign investment. In thelate 1980s more coastal areas opened tocreate a coastal belt, including the YangtzeRiver Delta, the Pearl River Delta, and otherareas in Fujian, Shandong, Liadong, Hebei,and Guangxi provinces. In 1990 the PudongNew Area was created in Shanghai alongwith other cities in the Yangtze River valley.
Since 1992 border areas and the capitalcities of all inland provinces have beenopened to foreign investment, as the Chi-nese authorities try to balance the previousconcentration of foreign investment incoastal areas.The eastern provinces alongthe coast still account for 85 percent of theaccumulated stock of FDI. Fiscal incentives,such as tax holidays, vary across zones—and are generally more generous in export-oriented and high-tech sectors.
Source: OECD (2003b);Chen (2002);and Ge (1999).
B O X 8 . 6 China’s special economic zones
10_WDR_PO3_Ch08.qxd 8/24/04 11:55 AM Page 167

Promoting exports. To encourage exporting,governments often provide duty exemptionand drawback systems, provide exportcredit, and support trade promotion activi-ties. Because benefits granted on the condi-tion of meeting export targets can distortinternational trade flows, they are beingphased out under World Trade Organiza-tion (WTO) rules (box 8.8). Duty drawbacksystems and export subsidies helped expandEast Asian exports, but many countries haveembarked on similar strategies with littlesuccess.54 These programs often requireburdensome procedures and paperworkthat increase costs and create opportunitiesfor corruption. The problems can be espe-cially severe in countries with weak tax andcustoms administrations.
Information asymmetries in interna-tional markets are sometimes used to justifygovernment support for trade promotionactivities. Many countries have createdtrade promotion organizations to conductmarket research, organize trade fairs, pro-
vide advice on trade logistics, and, in somecases, administer export incentives. With afew exceptions (Australia, Finland, Ireland,New Zealand, and Singapore), the resultsappear to have been modest. One clear les-son is that export promotion activities can-not substitute for progress on more funda-mental obstacles to successful exporting,including a poor climate for firms todevelop world-class products and weaktransport infrastructure.55
Providing incentives to attract FDI. In themid-1990s more than 100 countries offeredfiscal incentives to attract FDI, a trend thatcontinues.56 A recent survey of 45 develop-ing countries found that 85 percent offeredsome kind of tax holiday or reduction ofcorporate income tax for foreign invest-ment.57 The incentives can be substantial(table 8.2). In Tunisia incentives for FDIamounted to almost 20 percent of total pri-vate investment.58 In Vietnam it was esti-mated that the revenue loss from incentivesreached 0.7 percent of GDP.59 The packageIndia offered Ford in 1997 was estimated tocost $420,000 per job.60 Incentive packagesoften include tax incentives, special regula-tory exemptions, subsidies, and publicfunding of related infrastructure.
Do these incentives actually influencethe decisions of firms? The answer seems tobe sometimes. Firms tend to assess invest-ment opportunities, including relevant gov-
168 WORLD DEVELOPMENT REPORT 2005
Table 8.1 Export processing zones have proliferated into the thousands
1975 1986 1995 1997 2002
Countries with EPZs 25 47 73 93 116EPZs 79 176 500 845 3,000Employment (millions) .. .. .. 22.5 43
China ... .. .. 18 30Other countries with available figures 0.8 1.9 .. 4.5 13
Note: .. = not available.Source: ILO (2003a).
Despite their popularity, not all EPZs meetexpectations. Experience in Mauritius and theDominican Republic throw light on twocommon issues.
Mauritius—More than just EPZsMauritius used EPZs as part of a successful strat-egy to spur export-led growth and diversify itseconomy. EPZ status was granted to firms inde-pendent of location. Manufactured exportsgrew at 5.9 percent a year between 1991 and2001, and accounted for 73 percent of merchan-dise exports in 2002. Employment in the EPZsranges between 80,000 and 90,000. Many work-ers and managers trained in the foreign sectorlater created their own businesses. Economicgrowth in 1980–2002 averaged 5.5 percent,accompanied by substantial improvements inhuman development indicators.
What accounted for the impressive perfor-mance? Certainly, the EPZs played a role. Butseveral complementary factors also seem tohave been important. Mauritius enjoyed fairlystable macroeconomic conditions and high lev-els of political stability, contributing to the secu-rity of property rights. It also enjoyed preferen-tial access to the apparel markets in the EU andU.S. And the diversity of its population, with Chi-nese and French minorities and an Indian major-ity, helped attract investments from Hong Kongand mediate investments in India.
Dominican Republic—The elusive questfor backward linkagesLike many countries, the Dominican Republichoped to build backward linkages from its EPZsto its local industries, so that local firms wouldbecome exporters themselves.The Industrial
Linkages Program, developed in the late 1980sand early 1990s, had the goal of developingbackward linkages to 40 local manufacturersand $80 million of local value-added.
Progress has been disappointing. By 1993only 12 local suppliers participated in backwardlinkages, with local value-added of just $4 million.Local value-added has remained low. In 2002,only 55 of 720 EPZ firms purchased raw materialsfrom local firms, a decline from 61 the previousyear.Why? Local manufacturers, isolated fromcompetitive pressures by import substitutionpolicies, showed no interest in assuming newrisks to meet the standards of the EPZs.
Source: For Mauritius, Subramanian and Roy (2003);Moran (2002); Rodrik (1999); and World Bank(2004k). For Dominican Republic, Schrank (2001)and Consejo Nacional de Zonas Francas deExportación (2002).
B O X 8 . 7 Export processing zones in Mauritius and the Dominican Republic
10_WDR_PO3_Ch08.qxd 8/24/04 11:55 AM Page 168

ernment policies, as a package. The level oftax and other obligations can influence thatpackage but rarely will be enough to cancelout other factors, including more funda-mental concerns about policy stability, thequality of infrastructure, and the quality ofa workforce. Indeed, the Bank’s InvestmentClimate Surveys show that unreliable powersupply, weak contract enforcement, corrup-tion, and crime can impose costs severaltimes greater than taxes (chapter 1).
The weight applied to any one factorvaries between industries and even betweenfirms in a single industry. Incentives willtypically carry less weight when firms are inextractive industries or intend to serve thelocal market. In such cases firms will usuallyhave identified the market for other reasonsand cannot pursue the same opportunityelsewhere. Investments in manufacturing,especially in export-oriented sectors, mightbe more responsive to tax incentives.61 Buttax holidays are only rarely the decisive fac-tor. A survey of 191 companies with plansto expand operations found that only 18percent in manufacturing and 9 percent inservices considered grants and incentives tobe influential in their choice of location.62
Of 75 Fortune 500 companies surveyed,only four identified them as influential.63
When alternative locations are otherwiseclosely matched, however, differences in taxobligations can influence decisions at themargin.
Selective interventions 169
Selective interventions to promote firms oractivities may distort international trade andharm other countries.To address these concernsinternational agreements impose restrictions ontrade-distorting policies. Restrictions on exportsubsidies date from 1947 in Article 16 of theGeneral Agreement on Tariffs and Trade (GATT).The Uruguay Round of multilateral trade negoti-ations, which led to the creation of the WTO in1995, set new limits on what governments cando to support domestic industries, promoteexports, or affect the consequences of foreigninvestment:
Subsidies. The Agreement on Subsidies andCountervailing Measures prohibits subsidiescontingent on meeting certain export targets oron using domestic rather than imported goods.Other subsidies to specific firms or industries
may be challenged at the Dispute SettlementBody by other WTO members if they hurt theirinterests.
Trade-related investment measures. TheAgreement on Trade-Related Investment Mea-sures (TRIMs) imposes limits on measures aimedat extracting benefits from FDI.The agreementincludes a list of measures inconsistent with theprinciples of national treatment and the GATTprohibition of quantitative restrictions, includ-ing local content and trade-balancing require-ments.
Intellectual property rights. The Agreement onTrade-Related Aspects of Intellectual PropertyRights (TRIPs) strengthens the rules and enforce-ment of intellectual property rights. Practicessuch as compulsory licensing and reverse engi-neering are limited by the agreement.
Services. Under the General Agreement onTrade in Services (GATS), countries commit ser-vices to national treatment and market accessaccording to their own schedule, leaving roomto accommodate their policy goals.
The Doha Round of multilateral trade negoti-ations, launched in 2001, includes proposals tonegotiate a tightening of disciplines in the use ofagriculture subsidies and antidumping measures.
The above arrangements include specialand differential treatment for developing coun-tries. For example, the prohibition of export sub-sidies is waived for countries with a GDP percapita below $1,000.
Source: World Bank (2004d); Hoekman, Mattoo, andEnglish (2002); Hoekman, Michalopoulos, and Winters(2003); and GATT.
B O X 8 . 8 The WTO and selective intervention
Table 8.2 Effective reductions in corporate tax rates due to fiscal incentives (percent)
Philippines Malaysia Thailand
Effective tax rate (before incentives) 47 30 46
Reduction in effective rate due to:
Tax holiday 19 0 28
Indirect tax concessions 7 8 11
Effective tax rate (after incentives) 21 22 7
Source: Chalk (2001).
Do governments get value for moneywhen they offer special incentives? Thecosts and benefits need to be assessed ineach case. If the firm would have made thesame investment without the incentive, orwith a lower level of incentive, the answerwould be no.64 Certainly the cost per jobcreated can be high, as the examples illus-trate (figure 8.2). However, governmentsare rarely interested only in the jobs associ-ated with the immediate investment; theyusually expect broader benefits in spilloversto local firms. Governments often also hopethat winning a major investment will signalto the broader universe of investors thattheir country is a good place to do business.But experience suggests that these benefitscannot be taken for granted.
The design of the incentive package canalso influence the net return to thecountry.65 Incentive schemes that involveup-front subsidies or the provision ofhighly specific infrastructure are generally
10_WDR_PO3_Ch08.qxd 8/24/04 11:55 AM Page 169

riskier than tax incentives, because if the firmfails to deliver, the infrastructure may be ofless value to other firms (box 8.9). Tax incen-tives have the advantages of being reasonablytransparent and conditional on incomeearned—if the investment does not proceedor the firm chooses to relocate the govern-ment’s exposure will be limited. Providingtax incentives based on accelerated deprecia-tion can strengthen the link between theincentive and actual investment.
It may not be necessary to offer tax holi-days of long duration. Because of the dis-count rates firms apply when evaluating
investment opportunities, benefits occur-ring in the future are of declining influence,and firms tend to apply bigger discount ratesto projects in countries they perceive to beriskier. Often more important than the levelof tax rates is their predictability. Firms mayprefer to pay a fixed rate for a definite periodthan pay no taxes now and an uncertainamount in the future—Chile and Colombiaoffer this option to foreign investors.66
A better strategy is to improve the qual-ity of the overall investment climate, thusreducing the pressure to compete on taxes.Tackling bottlenecks of particular concernto foreign investors (customs administra-tion, property rights security) will likely domore to make a location attractive—andwill benefit local firms, too. The same prin-ciples apply not only to efforts to attractforeign investment, but also to subnationalgovernments that compete for investmentwithin a country (box 8.10).
Promoting inward investment. Govern-ments also try to attract FDI throughinvestment promotion agencies (IPAs).There are now at least 160 national andmore than 250 subnational IPAs, comparedwith only a handful two decades ago.67
These agencies play a variety of rolesincluding the following:68
• Information dissemination. Collationand presentation of information on thelocal economy.
• Image building. Promoting the percep-tion that the country is an attractive loca-tion for investment through activitiessuch as advertising and public relations.
• Investment facilitation. Helping investorsthrough administrative procedures andclearances needed to set up and operatebusiness establishments. In some casesIPAs serve as one-stop shops (chapter 5).
• Investment generation. Identifying anddirectly targeting firms in sectors thatmight be attractive for foreign invest-ment through direct mailings, telephonecampaigns, and presentations to individ-ual investors.
• Investor monitoring and aftercare. Assist-ing firms already established to continueand expand their operations. This is
170 WORLD DEVELOPMENT REPORT 2005
Governments often offer subsidy packagesto firms that promise to create jobs andbring new technology. Experience in theU.S. city of Indianapolis shows that theexpected benefits can remain elusive.
Local and state governments grantedup-front subsidies worth over $300 millionto build an advanced aircraft maintenancecenter for United Airlines. The deal wasnegotiated during an economic slowdownin the early 1990s, and the authorities con-sidered the subsidy was worth the promiseto create 5,000 high-paying jobs. Thatnumber was never achieved, however, andthe company walked away in 2003 after
recession hit the industry and felt pressureto cut costs.
The result: high sunk costs for state andlocal governments in highly specificinfrastructure, resources that could have beenused for other priorities. In all likelihood, newtenants for the facilities would come only ifnew subsidies are offered. More than 80 firmshad been contacted to take over the mainte-nance center in the 18 months following itsclosure.Yet the facility’s size and technologi-cal sophistication imply high operating costs,a hard sell in a distressed industry.
Source: O’Malley (2004) and Uchitelle (2003).
B O X 8 . 9 Rolling the dice in Indianapolis
0
50
0
1,000
Thou
sand
s of
dol
lars
per
job
crea
ted
Perc
ent o
f GDP
per
cap
ita
150
100
200
Brazil3 plants(1995–6)
GermanyVW
(1997)
U.S.7 plants(1980s)
Total budgetary cost(right axis)
Cost perjob (leftaxis)
2,000
Note: Percent of GDP per capita is PPP adjusted.Source: McKinsey Global Institute (2003).
Figure 8.2 Incentives can be costly
10_WDR_PO3_Ch08.qxd 8/24/04 11:55 AM Page 170

emerging as an important function insecond-generation reforms.
• Policy advocacy. Identifying issues thatinhibit investment and advocating pol-icy changes that might stimulate devel-opment. IPAs often act as champions ofreform in lobbying other governmentagencies to correct observed problems.This function, potentially the mosteffective in attracting FDI, usually repre-sents only a small part of the budget(figure 8.3).69
There is some evidence that IPAs canhelp countries attract FDI. One study foundthat FDI increases by about 0.25 percent forevery 1 percent increase in the IPA’s budget.IPAs appear to be more successful in coun-tries where the investment climate is alreadyamenable to foreign investors: increases inthe budget of an IPA increased FDI nearlytwice as much in countries with the mostfavorable investment climates than in coun-tries with the least favorable.70 Success sto-ries in investment promotion have beencostly in per capita terms, however, espe-cially at the image building stage (table 8.3).
Fostering spillovers from FDI. Beyondattracting investment, governments oftenmake special efforts to increase the likeli-hood of positive spillovers to the broadereconomy. Governments often look to FDIto help develop local industry and promotetechnology transfer, but local suppliers andpartners may not develop automatically. Inthe past governments used import restric-
tions and local content or joint venturerequirements to promote the likelihood ofFDI spillovers. Difficulties with thoseapproaches have led more recent efforts tofocus on incentives to encourage the desiredbehavior from foreign investors.71
Local content requirements have beenused to ensure that foreign investors useinputs from local firms. Because the evi-dence suggests that local firms benefit fromsupplying foreign-owned firms (see chapter5), this might seem to be a way of increasingthe benefits from FDI. Unfortunately, suchrestrictions also increase the costs of FDI,reducing the foreign investors’ incentives toenter and expand production (box 8.11).Local content requirements in the automo-bile sectors in Chile and Australia alsoresulted in large inefficiencies.72 Local con-tent requirements are also inconsistent withinternational trade rules and so are beingphased out (see box 8.9).
Another approach has been to requireforeign investors to participate in joint
Selective interventions 171
10
20
30
Perc
ent o
f tot
al b
udge
t
0
40
Investment generationInvestor services
Image building
Policy advocacy
Source: Morisset and Andrews-Johnson (2003).
Figure 8.3 Policy advocacy by investment promotion agenciesreceives a small share of budget
Table 8.3 IPAs are not cheap
Annual FDI promotion budget Population Per capita budget
($ million) (millions 1999) ($)
Singapore (EDB) 45.0 3.2 14.06
Ireland (IDA 1999) 41.0 3.7 11.16
Costa Rica (CINDE) 11.0 3.5 3.14
Mauritius (MEDIA 1996) 3.1 1.2 2.58
Dominican Republic (IPC) 8.8 8.4 1.05
Malaysia (MIDA) 15.0 22.7 0.66
Source: Velde (2001).
Without specific efforts to influence locationchoices, firms tend to prefer to locate in areaswith stronger investment climates and to con-centrate to take advantage of product or factormarkets. Agglomeration economies help explainthe concentration of industrial activity in mostcountries, with the effects reinforced by andreinforcing the urbanization around the world.To help spur agglomeration economies, buildtheir industrial base, or create jobs, many subna-tional governments or cities compete for invest-ment in much the same way as their nationalcounterparts. As with competition for interna-tional investment, the broader investment cli-
mate is essential for success, including the secu-rity of property rights, adequacy of infrastruc-ture, a skilled labor force, and the like.
Subnational governments also often extendspecial incentive schemes. At least 20 U.S. stateswere interested in the Mercedes-Benz plant thatfinally located in Vance, Alabama, with a $153million incentive package in 1993. More than250 European locations competed for a BMWplant that went to Leipzig with $224 million inincentives in 2001. A recent study found thatrevenue forgone by state and localgovernments in the United States due to fiscalincentives was up to $50 billion. In the mid-
1990s some Brazilian states also joined the com-petition for automobile plants, offering incen-tive packages in the range of $54,000 to$340,000 per job.
Most of the issues associated with attractinginvestment at the national level apply to subna-tional governments as well.This includes the dif-ficulty in assessing whether any incentivesoffered are necessary or cost-effective. Similardesign issues can arise as well.
Source: Yusuf (2003); Scott and Storper (2003); Charl-ton (2003); Christiansen, Oman, and Charlton (2003);and Peters and Fisher (2004).
B O X 8 . 1 0 Competing to attract investment within countries
10_WDR_PO3_Ch08.qxd 8/24/04 11:55 AM Page 171

ventures with local partners. In some casesthese requirements have been used to bene-fit specific local firms by allowing them toparticipate in a lucrative foreign invest-ment, but they are also intended to increasetechnological spillovers. As with othermandatory measures, however, they havecosts. They may deter rather than encour-age investment, and they can make foreignfirms wary about using advanced or sensi-tive processes, reducing rather than enhanc-ing spillovers.
Because foreign investors in the automo-bile sector in China were required to have alocal partner, major international firms werereluctant to use up-to-date processes. As aresult, manufacturing methods laggedbehind industry standards by about 10years.73 Similarly, Kodak was required tohave local joint venture partners in itsinvestments in China but allowed to haveone wholly owned subsidiary. It invested sixtimes more in the wholly owned firm than itdid in the average joint venture partner. Itswholly owned subsidiary ended up produc-ing its most advanced film and camera tech-nologies, while the joint ventures producedconventional film under the Kodak label.74
Another strategy is to work with foreignaffiliates and local firms to overcome infor-mation and cultural barriers. These pro-grams are often combined with incentivesto help the domestic suppliers meet theproduction standards demanded by foreigninvestors. This approach has been followedin economies such as Ireland, Malaysia, Sin-gapore, and Taiwan, China (box 8.12).75
Climbing the technology ladderTechnological progress plays an importantrole in economic growth, leading manygovernments to encourage innovation(chapter 3). But innovation is not limited toactivities that might merit a patent. Itincludes more modest advances and theimplementation of better business processes.
172 WORLD DEVELOPMENT REPORT 2005
Singapore and Ireland illustrate the potentialimpact of well-designed programs to fosterspillovers from FDI.
Singapore’s Local Industry UpgradingProgramTo promote technology and skill transfers fromforeign firms to local suppliers, Singapore’s Eco-nomic Development Board (EDB) offered orga-nizational and financial support. An engineer ormanager from the foreign firm was paid by theEDB for two to three years to select and assistlocal suppliers.Thirty-two partnerships werecreated between 1986 and 1994 involving 180domestic suppliers.The electronics industry wasthe biggest sector, followed by services. Produc-tivity of suppliers in the early stages rose by anaverage 17 percent, and value added per workerincreased by 14 percent.The program was link-
ing 670 local businesses with 30 foreignaffiliates and 11 large local businesses and gov-ernment agencies in 1999.
Ireland’s National Linkage ProgramIreland’s Industrial Development Agency (IDA)led a consortium of agencies that identifiedpotential linkages in a range of sectors, devel-oped a group of domestic suppliers, and offeredbuyer support and development services.Theprogram targeted “winner” companies inselected sectors and worked with them to enter subcontracting arrangements with multi-national firms. Between 1985 and 1992, foreignaffiliates increased their local purchases of rawmaterials by half (from 438 to 811 million Irishpounds) and their purchases of services by onethird (from 980 million to 1.46 billion Irishpounds). In the electronics industry, local sourc-
ing increased from 9 to 19 percent during thatperiod. More than 200 foreign firms and 83domestic firms participated. Suppliers saw salesrise by 83 percent, productivity by 36 percent,and employment by 33 percent—and somebecame international subcontractors.The pur-chase of Irish materials and services by foreignaffiliates supported by IDA in 2001 reached€5.49 billion and €5.12 billion respectively.
The programs in Singapore and Ireland sharetwo characteristics. First, they are market-based,creating fewer distortions than imposed localcontent requirements. Second, they combinepolicy advocacy, proximity to suppliers, and spe-cific linkage opportunities.Their goal is to reducethe risks perceived by suppliers and buyers.
Source: Battat, Frank, and Shen (1996); UNCTAD(2001b); and Ireland–IDA (2002).
B O X 8 . 1 2 Successful “linkage programs” in Singapore and Ireland
In 1985 computer production in Mexico wasprotected by import quotas. Local contentrequirements were set at 25 percent forminicomputers and 35 percent for micro-computers for the first year, rising to 50 per-cent and 60 percent in the third and fourthyears. Foreign ownership was allowed as aminority share in joint ventures with localfirms.The market was dominated by jointventures involving two U.S. firms, Apple (58percent) and Hewlett-Packard (18 percent).
High protection meant computer pricesin Mexico were 74 percent higher for Appleand 61 percent higher for HP models thanin the United States. Both firms were assem-bling computers at volumes well below theefficient scale of 20,000 units annually.Theperverse incentives of this policy surfacedwhen IBM presented the Mexican govern-ment with a proposal to invest in a whollyowned export-oriented facility to produce
between 100,000 and 180,000 computers ayear.
The proposal triggered strong opposi-tion from domestic suppliers.Theirargument was that the large investmentwould create a monopoly, crowding outdomestic players—but the prediction wasnot fulfilled when the IBM proposal wasaccepted. Indeed, competition increased asother foreign firms, including Apple and HP,also invested in wholly owned large facili-ties.The share of imports in the final prod-uct decreased and the component industrygained technological upgrading.With theseinvestments, computer exports surged from$21 million in 1985 to $252 million in 1989,and $9.6 billion in 2001.
Source: Moran (1998) and OECD InternationalTrade by Commodity Statistics Database.
B O X 8 . 1 1 Fixing the FDI strategy for Mexico’s computerindustry
10_WDR_PO3_Ch08.qxd 8/24/04 11:55 AM Page 172

It also involves lots of adaptation and adop-tion—countries don’t need to invent every-thing afresh. This underlines the impor-tance of reducing barriers to trade andFDI—and to the competition that providesincentives for firms to improve their pro-ductivity.
As countries move closer to the techno-logical frontier, governments often seek toencourage original innovation in theireconomies, including local R&D. To do so,governments have experimented with arange of selective interventions. The cost-effectiveness of these schemes has not beenevaluated in all cases, but their impact islikely to depend on the adequacy of otheraspects of the investment climate critical toinnovation, including a skilled labor force,competitive pressure, and the protection ofintellectual property rights. Without thoseelements, it is not clear that governmentinterventions can do much to increase R&D.
Providing tax incentives, grants, and finan-cial market interventions. Many govern-ments provide tax deductions to encourageprivate R&D. Some developed countriesoffer tax credits, full expensing of R&D, andeven double deductions of some R&Dspending (table 8.4). Although theseschemes are not too costly, they have theirweaknesses. Firms may claim R&D deduc-tions for spending barely linked to any realR&D. Firms also tend to choose projectswith the highest rates of private return, notthose with the largest spillover effects.76 Inthe United States almost 80 percent of taxreturns claiming R&D credits are audited,with an average downward adjustment of20 percent of the claimed credits.77 Whilesome studies of Pakistan and Canada foundevidence that R&D incentives were cost-effective, others are more skeptical.78
The use of R&D tax incentives, grants, ora combination of both varies from countryto country (figure 8.4). Grants are preferredby governments that want to influence thetype of R&D, but this raises more difficul-ties in governments “picking winners” thanbroadly based tax incentives. Interestingly,Sweden and Finland, two countries withhigh levels of private R&D, do not offersubstantial direct or tax support.79 Some
Selective interventions 173
Table 8.4 Fiscal incentives for R&D in selected developing countries
R&D depreciation R&D capital depreciation Tax credit Country rate rate rate
Brazil 100% 100% None
India 100% 100% None
South Korea 100% 18–20% 10–25%
Mexico 100% 3 years’ straight-line Nonedepreciation
South Africa 100% 25% None
Taiwan, China 100% Same as other investment 15–20%
Malaysia 200% Same as other investment None
Note: Depreciation methods of 100 percent or more indicate full expensing of R&D.Source: Mani (2001a) and de Ferranti and others (2003).
0 5 10 15Share of total industry R&D (percent)
20 25
United States (1999)
Netherlands (1997)
Japan (1997)
France (1997)
Canada (1995)
Australia (1997) GrantsTax credits
Source: OECD (2003f).
Figure 8.4 Grants make up the lion’s share of public funding for privateR&D in many developed countries
countries have also used financial marketinterventions to encourage firms to pursueR&D, including directed credit schemes(South Korea) and venture capital funds(Malaysia).80
Other strategies for supporting local R&D. Tosupport innovation, the public sector canundertake R&D activities directly—on itsown or with private partners. The experienceis mixed, however (box 8.13). The govern-ment is seldom in a good position to judgethe types of research that would help firms orhave market potential. There is also a debateabout whether public R&D would crowd outor complement private efforts. A review ofthe econometric evidence finds mixed results,but concludes overall that well-designedefforts can be complementary.81
Fostering high-tech industrial clusters hasalso met with mixed results. Following the
10_WDR_PO3_Ch08.qxd 8/24/04 11:55 AM Page 173

success of the Hsinchu Science Park in Tai-wan, China, and the Magnet Program inIsrael, some governments created scienceparks and business incubators.82 But innov-ative clusters require a dynamic interplay ofentrepreneurship, R&D institutions, skilledlabor, capital, and infrastructure. Withoutthese factors, government-led initiatives areunlikely to succeed.83 For example, top-quality infrastructure in such science cen-ters as Tsukuba Science City (Japan) andDaeduck (South Korea) failed to turn into
high-tech clusters—both remain as isolatedresearch centers.84
Recent work on national innovation sys-tems emphasizes the importance of collab-oration between industry and universities.Governments can foster links between uni-versities and firms by strengthening prop-erty rights for universities and encouragingprivate contracts.85
So the possibility exists for governments tointervene selectively in ways that contributeto growth and poverty reduction. Experi-ence shows, however, that such strategies arenot straightforward, and that the likelihoodof success is greater when they complementrather than attempt to substitute for broaderinvestment climate improvements. Schemesthat meet the guidelines suggested at thebeginning of this chapter reduce the risk ofselective interventions going astray.
Another strategy governments can adoptto complement the basics of a sound invest-ment climate is to draw on the growingbody of international rules and standards inthis area. The strengths and weaknesses ofsuch strategies are discussed in chapter 9.
174 WORLD DEVELOPMENT REPORT 2005
Many governments have established R&Dcenters to promote the technologicalupgrading of firms.The support of theIndustrial Technology Research Institute inTaiwan, China, helped spin off the first inte-grated circuit manufacturer. However,attempts to create partnerships betweenR&D centers and private firms do not alwaysmeet expectations.
In the Philippines the Department ofScience and Technology had little interac-tion with industry. Its staff did not have veryhigh qualifications and were not in touch
with international technological advances.In India the network of publicly fundedresearch organizations under the Council ofScientific and Industrial Research had littlecontact with industry. Latin America has itsown cautionary tales. Competing agendasbetween different government agencies inBrazil and Argentina made public–privatepartnerships in R&D ineffective.
Source: UNCTAD (2003c); de Ferranti and others(2003); and Mani (2001b).
B O X 8 . 1 3 Public-private partnerships for R&D
10_WDR_PO3_Ch08.qxd 8/24/04 11:55 AM Page 174

175
The approaches to delivering the basics of asound investment climate discussed in PartII of the Report rest mainly on domesticlaws, policies, and institutions. In recentdecades the volume and range of interna-tional rules and standards dealing withinvestment climate issues has shot up dra-matically. Can these arrangements helpgovernments improve the investment cli-mates of their societies?
Arrangements that reduce regulatory bar-riers to international trade and investmentcan improve investment climates in obviousways—such as by expanding market size,reducing costs, facilitating the diffusion oftechnology, and enhancing competitionwithin an economy (chapter 5). Arrange-ments that foster closer regional integrationcan be especially important for smallereconomies (chapter 3). But this chapter takesa broader view and considers the potentialadvantages—and tradeoffs—in using inter-national arrangements as part of a strategyfor improving the investment climate. Itfocuses on three possible contributions:
• Enhancing the credibility of governmentpolicies and commitments to reducerisks faced by firms.
• Harmonizing rules and standards toreduce costs in international transactions.
• Addressing the spillover effects policiesin one country can have on others.
International arrangements and the investment climateInternational arrangements affecting theinvestment climate have a long history. In the12th century cities in northern Europe joinedto form the Hanseatic League to protect com-merce.1 At least since the 1920s internationallaw has recognized limits on the ability of gov-ernments to expropriate foreign property.2
The number of international arrangementsdealing with investment climate issues hasgrown dramatically in recent decades. Thereare now more than 2,200 bilateral investmenttreaties, 200 regional cooperation arrange-ments, and some 500 multilateral conventionsand instruments. These arrangements covermost areas of the investment climate—fromproperty rights protection, taxation, andcorruption, to regulation in areas as diverse as banking, shipping, telecommunications,labor, and the environment.
When considering particular arrange-ments, the detail of the specific rule or stan-dard obviously matters. Some arrangements(or provisions within broader arrange-ments) focus on the process of internationalcooperation—such as facilitating coopera-tion between national regulatory agencies onenforcement issues. Many others deal withthe substantive rules that form part of theinvestment climate facing firms directly, andso in principle could be implemented by gov-ernments acting unilaterally. For example,governments can unilaterally provide guar-antees against expropriation, liberalize theirtrade and investment regimes, protect intel-lectual property rights, and regulate to safe-guard their environment in the absence ofinternational commitments. When makingjudgments on their domestic policies andrules in each area, governments need to con-sider the costs and benefits of alternativeapproaches. International arrangements caninfluence the calculation in several ways:
• Entering an international obligation ona particular issue increases the costs ofpolicy reversal and so enhances policycredibility. This can improve the invest-ment climate by reducing the risks facingfirms. But the tradeoff is forgone policyflexibility on the issue in question.
International rules and standards
9c h a p t e r
11_WDR_Ch09.qxd 8/23/04 4:16 PM Page 175

• Adopting common or harmonized rules orstandards on some issues can reduce transac-tion costs in international trade and invest-ment, and so facilitate exports or inwardinvestment. It can also signal compliancewith high international standards. But therecan be tradeoffs in adopting approaches that are less customized to local circum-stances, and in foregoing the benefits from adegree of competition between approaches.
• Pursuing collaborative approaches onsome policy issues may be necessary toaddress spillover effects that nationalpolicies can have on other countries. Inthese cases there can be tensions betweennational sovereignty and internationalcollaboration as well as over the mostappropriate form of cooperation.
Beyond the substantive effect of particularinternational obligations, calculations may beinfluenced by two broader considerations:
• Accepting international obligations onsome issues may be necessary to obtainbenefits in other areas as part of a broadernegotiation. For example, the potentialbenefits from joining an international“club,” such as the World Trade Organiza-tion (WTO), the European Union (EU),
or the North American Free Trade Agree-ment (NAFTA), may lead governments tooffer policy commitments on a range ofmatters that, considered alone, might beless appealing. In these cases governmentsneed to evaluate the package of rights andobligations as a whole.
• Entering international commitments canbe used as part of a strategy for pursuingor sustaining domestic policy reforms.Entering commitments to reduce the riskof policy reversal is one manifestation ofthis, but governments can also use inter-national norms to help build consensusfor new policy approaches.3
Given the many tradeoffs in this area,international arrangements vary not only intheir content, but also in the level of com-mitment and in the scope of their participa-tion (box 9.1). These tradeoffs need to beconsidered in the context of particular pro-posals. But it is useful to review some of thebroader tensions and tradeoffs in the threeareas of particular importance from aninvestment climate perspective: enhancingcredibility; fostering harmonization; andaddressing international spillovers.
Enhancing credibilityThe impact of particular government poli-cies, laws, and regulations in supporting pro-ductive investment is ultimately determinedby their credibility (chapter 2). Can firms relyon them with confidence when making theirinvestment decisions? Credibility can beundermined by many things, including thepressures governments face to pursue short-term political goals at the expense of longer-term benefits to society. Governments canenhance the credibility of their policy com-mitments through domestic institutions,such as enshrining key protections in consti-tutions and creating independent judiciaries(chapter 2). When domestic institutions areat early stages of development their impacton credibility may be weak, however, increas-ing uncertainty and risk for firms. Enteringspecific contractual commitments with firmsmay complement these efforts, but they needto be negotiated firm by firm, limiting theimpact on the broader investment climate.
Entering international arrangements onparticular policy issues can enhance credi-
176 WORLD DEVELOPMENT REPORT 2005
The role and impact of any particular inter-national rule, norm, or standard is affectedby the mechanisms for securing complianceand by the scope of participation in thearrangement.
Compliance mechanisms. At one end ofthe spectrum norms may be expressed asformal treaty obligations, and violating themmay expose defaulting governments tosanctions of various kinds. In some cases thearrangement includes detailed mechanismsfor dealing with allegations of noncompli-ance (WTO Dispute Panels). At the other endof the spectrum, norms may be no morethan a statement of common intent or aspi-ration, influencing governments mainlythrough reputation effects, such as Declara-tions by the Asia-Pacific Economic Coopera-tion (APEC). In between is a rich menu ofhybrid approaches that seek to leverage thereputation concerns of governments. Forexample, the OECD Guidelines for Multina-tional Enterprises involve no formal obliga-tions but contain a mechanism for reporting
allegations of noncompliance.The OECDCorporate Governance Principles go furtherby providing a mechanism for governmentsto voluntarily have their complianceassessed by an independent third party.
Participation. Some arrangements arebilateral—such as the more than 2,200 bilat-eral investment treaties concluded since1959. Others are regional—examplesinclude the EU, NAFTA, the Common Marketof the South (MERCOSUR), APEC, and NewPartnership for Africa’s Development(NEPAD). Still others are multilateral, and socould have global adherence—examplesinclude various U.N.–sponsoredarrangements and the WTO. Arrangementswith a large number of parties have thepotential for broader impact but can alsoinvolve arduous and protractednegotiations. For example, the UruguayRound of multilateral trade negotiationsinvolved active negotiations over nearlyeight years, and negotiations for the U.N.Convention on the Law of the Sea took nine.
B O X 9 . 1 Evaluating rules and standards—compliancemechanisms and participation
11_WDR_Ch09.qxd 8/23/04 4:16 PM Page 176

bility by increasing the costs of reneging onthe commitment.4 The price of such credi-bility is forgone policy flexibility. While fewgovernments today would claim the right toexpropriate private property without com-pensation, the prudence of entering bindingcommitments on many other policy issues isless straightforward. Reflecting these trade-offs, international instruments provide amenu of approaches to calibrate the formand extent of commitment to particular pol-icy issues. Traditional approaches focused ongovernment-to-government treaty obliga-tions, but two other models are rising inprominence for investment climate issues.The first involves a lower level of commit-ment, through voluntary compliance, andrests mainly on leveraging governments’concerns about their reputations. The sec-ond involves a higher level of commitmentby allowing private firms to enforce theobligations against the government directlythrough binding international arbitration.
Traditional government-to-government treaty obligationsTraditional approaches involve governmentsentering reciprocal commitments, with defaultby one party creating the possibility of sanc-tions at the initiative of other government par-ties. For example, the WTO provides a mecha-nism for governments to “bind” import tariffs
at particular levels, with any subsequent tariffincrease creating an obligation to providecompensation. Dispute settlement mecha-nisms under the WTO facilitate the enforce-ment of these obligations and thus enhancethe credibility of government trade policycommitments. Similarly, bilateral investmenttreaties (BITs) include commitments not toexpropriate property without compensation,prohibit discrimination between investors,and provide a range of other obligations (box9.2). The number of countries participating inBITs has grown steadily since 1960 (figure 9.1).
International rules and standards 177
0
20
10
30
Num
ber o
f cou
ntrie
s w
ith B
ITs
in e
ach
deca
de
40
50
1990s1980s1970s1960s
African countriesDeveloping countries in Asia & PacificLatin America & the CaribbeanCentral & Eastern European countriesDeveloped countries
Source: UNCTAD (2000b).
Figure 9.1 Participation in bilateral investment treaties (BITs) has shot up in recent years
The first bilateral investment treaty (BIT) datesfrom 1959 (Germany–Pakistan), and the numberhas since proliferated. By the end of 2002 BITscovered around 22 percent of the stock of foreigndirect investment (FDI) in developing countries.
At the center of most BITs are obligationsnot to expropriate property without compensa-tion. BITs also typically include provisions gov-erning the repatriation of profits and the trans-fer of funds.They also include standards ofnondiscrimination on admission, establishment,and post-establishment phases of investment. Inaddition, they provide mechanisms for settlingdisputes between the two contracting states,and often also between an investor of one stateand the government of the host state.
Assurances of this kind can contribute to theinvestment climate of the host country,and there issome evidence that investors rely on those assur-ances. Indeed, in some cases a BIT is a preconditionfor obtaining political risk insurance from bilateral
agencies.Despite this,empirical studies have notfound a strong link between the conclusion of a BITand subsequent investment inflows.Why?
Several factors may be at work. First, as high-lighted in chapter 2, firms make their investmentdecisions based on an assessment of opportuni-ties as a package, and treaty protections alonewill rarely be decisive. A BIT addresses only onepart of firms’ investment equation, and so by itselfis not enough to overcome problems with infra-structure or other parts of the investment climate.Indeed, given the costs and delays associated withenforcing treaty obligations, BITs are not a com-plete solution even to the issues they address.Second, the negotiation of BITs is often driven bygovernments seeking to foster closer diplomaticties, rather than immediate interest frominvestors.To the extent this is so, there need be nodirect connection between signing a treaty andsubsequent investment activity.Third, there is evi-dence that many investors are not aware that a
BIT is in place at the time of considering an invest-ment, and indeed investors may remain obliviousuntil some issue arises when its provisions may berelevant. If so, promoting wider understanding ofBITs might enhance investor responses.
For all these reasons, the impact of BITs oninvestment flows should not be over sold.Well-crafted treaties can nevertheless form a usefulpart of strategies to address policy risks than canstifle private investment.They can be particularlyvaluable for countries with weak domestic institu-tions—including the many countries where firmslack confidence in the courts to uphold theirproperty rights (chapter 4). Indeed China signednearly 100 BITs in the 1980s and 1990s, at a timewhen its constitution did not provide protectionsfor private property rights.
Source: Dolzer and Stevens (1995); World Bank(2003b); Hallward-Driemeier (2003); UNCTAD(2003e); and UNCTAD (1998).
B O X 9 . 2 BITs—enhancing credibility one bit at a time?
11_WDR_Ch09.qxd 8/23/04 4:16 PM Page 177

Joining a regional economic cooperationarrangement can also enhance policy credi-bility. For example, in return for access to afairly liberal internal market, the EUrequires member states to comply with arange of policy requirements. The prize ofaccess to a larger market provides incentivesfor governments to improve their policiesto meet EU requirements, and the desire toremain in good standing encourages gov-ernments to sustain those policies. Similarfactors can be seen at work as NAFTA opensto new members.
In these cases it can be difficult to disen-tangle several complementary effects. First,access to a larger market can itself enhanceinvestment opportunities. Second, the pol-icy improvements undertaken as a condi-tion of joining the club can improve theinvestment climate. Third, there is theimpact on credibility through reduced like-lihood of reversing policy reforms in waysthat might jeopardize continuing member-ship of the arrangement. Indicators of acountry’s “investment profile”—whichfocus on perceived risk to investment—sug-gest that the impact on credibility may besignificant (see figure 9.2).
The impact of an international treaty oneach party’s policy credibility will depend onthe specific provisions of the agreement—
and on the parties’ incentives to enforce theagreement. Agreements between parties thatdemand high levels of mutual compliancewill have a bigger impact on credibility thanagreements involving those with lowerexpectations.
Arrangements with voluntarycompliance mechanismsGiven the tradeoffs between commitmentand flexibility, international arrangementson some issues do not impose binding treatyobligations. These arrangements may never-theless enhance credibility if they leveragegovernments’ interest in improving or pre-serving their reputations. For example, theOECD Corporate Governance Principles donot impose binding obligations—govern-ments can ignore them with impunity. Theydo, however, include a mechanism thatallows governments to submit their domes-tic laws and policies to scrutiny by an inde-pendent third party. Governments inter-ested in signaling to investors that theyapply high regulatory standards in this areahave incentives to submit their policies toscrutiny—and to attain high standards.Countries including Brazil, Georgia, India,the Philippines, Poland, and Turkey havesubjected their policies to such assessments.5
A similar model is being adopted by theNew Partnership for Africa’s Development(NEPAD; box 9.3).
As with arrangements resting on moretangible sanctions, the attitudes of otherparticipants toward compliance make a dif-ference—low standards of compliance willlower the impact on credibility. Arrange-ments that maintain high membershipstandards will thus deliver stronger benefitsthan more permissive schemes. When com-pliance depends on reputation alone, thetransparency and integrity of the monitor-ing mechanism is critical to success.
Arrangements giving private firmsdirect recourse to governmentsTraditionally the remedy for foreigninvestors who believed they had beenharmed by an action of the host govern-ment was to pursue their claim against thegovernment before local courts. Investorsoften felt this was inadequate, with con-
178 WORLD DEVELOPMENT REPORT 2005
41992 1994 1996 1998 2000 2002
8
6
10
12
Inve
stm
ent p
rofil
e
OtherLatinAmerica
Mexico
Note: The NAFTA agreement between Canada, Mexico, and theUnited States went into effect in 1994. “Other Latin America” is anaverage of 18 other Latin American countries. The ICRG investmentprofile index reflects factors affecting risk to investment, includingcontract viability/expropriation, profits repatriation, and paymentdelays. The maximum value of the index is 12.Source: Authors calculations based on the International CountryRisk Guide database.
Figure 9.2 NAFTA and Mexico’s investment profile
11_WDR_Ch09.qxd 8/23/04 4:16 PM Page 178

cerns that the local court might be biased infavor of the host government or otherwisenot provide an effective remedy. The imme-diate response was for investors to enlist thesupport of their home government to pur-sue the firm’s interests through diplomaticchannels. This also had its limits and weak-nesses. The fate of the firm’s claim oftendepended on diplomatic and political rela-tions between the two governments. Insome cases claims might be ignored. In oth-ers what was essentially a commercial dis-pute became politicized, sometimes culmi-nating in interminable negotiations—andsometimes in the use of armed force.6
When the rights and obligations of theinvestor and the host government are set outin contracts, one option is for the parties toagree to submit any contractual disputes tointernational arbitration by a neutral party.This approach has a long history in interna-tional commerce, and is supported by arange of international conventions and insti-tutions.7 In 1966 the International Centre forSettlement of Investment Disputes (ICSID)was established by international conventionto specialize in investment disputes betweenhost governments and foreign investors.8
The convention has since been ratified by140 countries. Under ICSID firms from onemember state can pursue their investmentdisputes against other member statesthrough binding international arbitration,without the need to involve their home gov-ernment. The governments can pursueinvestors directly as well. The parties areresponsible for appointing the arbitratorsand abiding by the decision. Typically theinvestor and the host state each choose anarbitrator, and the parties have to agree on athird arbitrator. Sitting in a neutral venue,the arbitrators hear evidence and render anaward. ICSID provides the procedural rulesand a small secretariat to support the arbi-trators and the parties.
As with other forms of arbitration,ICSID’s jurisdiction rests on the consent ofthe parties, often given through clausesinserted in investment contracts. In the 1990sit became common for BITs to include provi-sions for governments to give their prior con-sent to ICSID jurisdiction, thus eliminatingthe need for case-by-case agreement. Similar
provisions are included in NAFTA. This hasexpanded access to ICSID jurisdiction, andthe volume of cases submitted to ICSID hasgrown strongly in recent years—more thanhalf the 129 cases it has registered since itsinception were filed in the last five years.9
The use of BITs and other agreementsthat include prior consent to ICSID juris-diction creates a new source of discipline onhost governments—and a potentially pow-erful tool to enhance the credibility of theircontractual and policy commitments. Gov-ernments and firms can both benefit. Gov-ernments benefit from a commitmentdevice that can address concerns frominvestors, and thus help them attract moreinvestment at lower cost, and also reducethe risk of any later dispute becomingpoliticized. Firms benefit from reducedrisks and a more reliable mechanism forprotecting their rights if the relationshipwith the host government deteriorates.While ICSID is designed to encourage for-eign investment, domestic firms can benefitfrom the halo effect provided by strongerconstraints on arbitrary government action.
As with effective courts (chapter 4), thebenefits from an effective system of interna-tional dispute settlement are not measured inthe number of cases heard, but in the incen-tives it creates for the parties to adhere totheir commitments. The threat of possiblesanctions that might later be imposed by anarbitration panel can deter governmentsfrom reneging on their commitments andgive the parties an incentive to come to anegotiated solution.
International rules and standards 179
As part of an effort to improve the quality ofgovernance in Africa, the New Partnershipfor Africa’s Development was created in2001 by regional governments. It putsenhancing government credibility front andcenter. An African Peer Review Mechanismis the core instrument.
NEPAD includes principles to improvepolitical governance and economicreform—and to promote competition, trade,investment, macroeconomic and politicalstability, and sustainable development.Thepeer review mechanism enhances the trans-parency and accountability of participating
governments. Each participating countrysubmits to peer review and ongoing moni-toring.The country is evaluated oneconomic and political grounds accordingto a set of standards that include democracyand political governance, economic gover-nance and management, corporate gover-nance, and socioeconomic development.The review is to be undertaken by expertsappointed by an independent panel, withthe results made public.
Source: Funke and Nsouli (2003) and NEPADofficial documents.
B O X 9 . 3 NEPAD and its peer review mechanism
11_WDR_Ch09.qxd 8/23/04 4:16 PM Page 179
Despite the potential advantages, thesystem of investor-state dispute settlementhas raised several debates. Does it imposetoo much discipline on governments? Doesthat discipline encroach on governments’regulatory prerogatives? And is the processsufficiently transparent?
Too much discipline? Some governmentshave recently been subjected to claims fromfirms for substantial damages as a result ofalleged breaches of contractual or treatycommitments. The sums actually awardedby arbitration panels, if any, depend onfindings of liability and on the losses experi-enced by firms, but for large infrastructureor resource investments the sums might besubstantial. Is this too heavy a burden toplace on governments? The main alterna-tives would be to return to an approach thatled to the politicization of investment dis-putes, or to allow governments to ignoretheir commitments with impunity. Whilethe second path might appear attractive forgovernments in the short term, the conse-quence would be that no firm could rely ona government’s commitments, and this riskwill be reflected in investment decisions(chapter 2).
Encroaching on regulatory prerogatives?Most BITs and similar agreements includea prohibition against expropriation with-out compensation, and there is generalconsensus that prohibitions against out-right seizure of property are appropriate.There is concern, however, about how pro-hibitions against “indirect” expropriationmight affect a government’s regulatoryprerogatives. It is clear that some govern-ments have used arbitrary regulation ortaxation to achieve a result equivalent toexpropriation, and most observers agreethat such behavior should be caught by theprohibition. But concern has beenexpressed that the provisions might beinterpreted to restrict legitimate regulatoryaction by host governments, or that eventhe potential for such claims might inducea “regulatory chill.” Similar issues havebeen debated under guarantees againstexpropriation contained in national con-stitutions, where the result has been to pre-serve legitimate regulatory prerogatives
(chapter 4). Arbitration panels have so fartended to interpret the treaty provisionsequally cautiously,10 and can also deterfrivolous claims by the threat of sanctions.
Sufficient transparency? Investor–state dis-pute resolution involves agreement by theparties (including ratification by govern-ments of relevant treaties), and both partiesare equally involved in determining thecomposition of the arbitration panel. Arbi-tration evolved from diplomatic and com-mercial practice, where it was customary forproceedings to be confidential. This has ledsome observers to question whether thearrangements are sufficiently transparent,particularly when matters of broad publicinterest are involved. While practice underdifferent arbitration regimes varies, ICSIDhas always promoted transparency, andefforts are underway to further increase theopportunities for public participation indispute proceedings, making the proceduremore analogous to a court hearing. ICSIDalso has a procedure for challenging awards.As the system evolves, there will likely bepressures for even greater transparency(box 9.4).
Fostering harmonizationIn the normal course of events each countryor jurisdiction tends to develop its ownrules and standards on particular issues toreflect local customs, conditions, and prior-ities. This adaptation is an important partof ensuring a good institutional fit—andone reason to be cautious in uncriticallytransplanting regulatory systems fromother countries (chapter 2). A mixture ofadaptation and experimentation can alsolead to the discovery of new and better waysof achieving particular policy goals. Institu-tional competition between jurisdictionscan also encourage governments to attainhigher standards.11
Divergent approaches to some regulatoryissues, however, can increase the costs ofinternational trade and investment transac-tions. If goods or services need to meet dif-ferent standards and regulatory require-ments in every country, customization candrive up the costs of production and distrib-ution and reduce competition. Diverse
180 WORLD DEVELOPMENT REPORT 2005
11_WDR_Ch09.qxd 8/23/04 4:16 PM Page 180

approaches can also increase the costs for-eign firms face when evaluating alternativeinvestment locations, perhaps deterringthem from pursuing investments in coun-tries with unfamiliar arrangements. Beyondreducing transaction costs, adoption ofinternational standards can also facilitatedomestic policy reform when local interestgroups have conflicting preferences.12 Adop-tion of international standards can also sig-nal to firms, consumers, and other groupsthe application of high regulatory standards.
The tensions between local customiza-tion and international harmonization playout in proposals to develop common inter-national rules and standards on a wide rangeof issues relevant to the investment climate.Efforts to develop uniform standards to easeinternational commerce have long been afocus of private bodies such as the Interna-tional Chamber of Commerce.13 Comple-mentary efforts at the intergovernmentallevel include those of the United NationsCommission on International Trade Law14
(UNCITRAL) and a variety of other inter-national agencies. In francophone Africa, forexample, harmonization of business law isbeing facilitated by the Organisation pourl’Harmonisation en Afrique du Droit desAffaires (OHADA, box 9.5). The possibleareas for cooperative action range fromdeveloping a common set of internationalrules on contract law to harmonizing inter-national accounting standards. Clearly thecosts and benefits of each approach need tobe considered case by case.
To be effective, common internationalstandards do not always require bindingtreaty obligations. Countries, or even firms,can voluntarily adopt common norms, withthe incentives to comply driven by reputa-tion. Some international agencies have alsodeveloped “model laws” to encourage conver-gence on common approaches, but leavingcountries the freedom to adapt approaches tolocal circumstances; the UNCITRAL modellaw on international commercial arbitration,for example, has been adopted by more than35 jurisdictions.
There can also be alternative strategies forachieving the same end. For example, ratherthan adopting identical rules in each jurisdic-tion, participating governments may agree, inmutual recognition schemes, to accept in
International rules and standards 181
The recent rise in the number of investment disputes brought beforeICSID arbitration panels has put investor-state arbitration in thespotlight.
Arbitration proceedings were traditionally confidential, but ICSID’srules require making a dispute public and encourage parties to publishinformation about the dispute and its outcome. Concerns about the trans-parency of international arbitration between investors and states are alsoleading to procedures that more closely resemble those of judicialproceedings. For example, in a recent case brought against the UnitedStates under NAFTA, the parties agreed to use an amicus curiae (friend ofthe court) procedure allowing nondisputing parties to make submissionsto the arbitration panel.The U.S. government has also modified its modelBIT agreement, incorporating provisions for greater transparency in newagreements.The Chile–U.S. Free Trade Agreement contains a requirementthat arbitration panels conduct the hearings open to the public and dis-close key documents.
The acceptability of investor-state arbitration also depends on the per-ceived fairness of the results.The state party prevailed in half of the 24 dis-putes that went to final award between 1987 and 2003.
Cases brought to ICSID,1987–2003 Under NAFTA Under BITs
Cases registered 10 87Cases concluded (including settlement) 6 31Final awards rendered 6 18Cases in which investor prevailed 2 10Cases in which state prevailed 4 8Average duration (from constitution of
tribunal or ad hoc committee), months 29.5 28.2
Note: Data through February 2003.Source: ICSID Web site, World Bank staff, and official texts of the mentionedagreements.
B O X 9 . 4 The evolving system of investor-state dispute settlement
The Organisation pour l’Harmonisation enAfrique du Droit des Affaires (OHADA),established in 1993, promotes the harmo-nization of business law in Africa. It has 16member states: Benin, Burkina Faso,Cameroon, Central African Republic,Comoros, Congo, Côte d’Ivoire, Gabon,Guinea, Guinea-Bissau, Equatorial Guinea,Mali, Niger, Senegal, Chad, and Togo.
Under OHADA, the texts of “UniformActs” are endorsed by a Council of Ministersand then made directly applicable in eachmember country. So far the harmonizationprocess has resulted in uniform acts in sixareas: general commercial law, companies,securities, debt recovery, bankruptcy andinsolvency, and arbitration. A Senegalese
firm investing in Togo will thus be dealingwith many of the same regulatory require-ments as in its own country, and a foreigninvestor familiar with the laws in one coun-try can apply the same understanding toother OHADA countries.The result shouldbe lower transaction costs and reduceduncertainty.
The OHADA Treaty also establishes aCommon Court of Justice and Arbitration,which acts as an advisory body to the Coun-cil of Ministers, serves as an appeal body tofoster common interpretations of the Uni-form Acts, and supports the resolution ofcommercial disputes.
Source: Ba (2000) and OHADA official documents.
B O X 9 . 5 Harmonizing business law in Africa—OHADA
11_WDR_Ch09.qxd 8/23/04 4:16 PM Page 181

their jurisdiction goods or services that meetthe regulatory requirements of another par-ticipating jurisdiction. This approach hasdone much to facilitate commerce within theEU, between the EU and some nonmemberstates, and between Australia and NewZealand. Similar approaches could have wideapplication across a range of investment cli-mate issues.
A more ambitious form of harmoniza-tion is to agree not only on common rulesbut also to delegate responsibility foradministering them to a common regula-tory body. This presents opportunities forgreater consistency in interpretation, loweradministrative costs, and possibly enhancedcredibility for participating governments. Inpractice supranational regulatory bodies aremore often proposed than implemented, inpart because of concerns over national sov-ereignty. There are exceptions. For example,OHADA has a common court to foster con-sistent interpretations of harmonized busi-ness laws, and the Eastern CaribbeanTelecommunications Authority regulatestelecommunications in five small countriesin the Caribbean. Progress usually requires agovernance framework that gives each par-ticipating government effective voice—anda high level of trust between participants.
The advantages and disadvantages of har-monization proposals also depend on thenumber of countries participating in thearrangement. Multilateral approaches offer
the largest benefit, but increase the challengeof developing approaches that will meet theinterests of all participating governments.They can also involve protracted negotia-tions. Reflecting these tradeoffs, the numberof regional economic cooperation arrange-ments has grown strongly in recent years(figure 9.3).
For the liberalization of trade and invest-ment, there is an ongoing debate overwhether regional arrangements are buildingblocks or stumbling blocks to a liberal multi-lateral system.15 Proposals that focus on theharmonization of standards tend to posefewer concerns of this kind, although therecan be other tradeoffs. For example, harmo-nizing standards at the regional level canreduce transaction costs for intraregionaltrade and investment, but harmonizing stan-dards with major capital exporters or exportmarkets outside the region might offer evengreater benefits.
Addressing internationalspilloversMany international arrangements, existingand proposed, seek to address internationalspillovers of some kind—where actions inone country can have effects on others.
The clearest cases involve environmentalprotection. For example, emissions or efflu-ents from industries in one country mayharm the environment in other countries.When this happens, international coopera-tion may be needed to mitigate the negativeexternality and achieve an efficient out-come. Indeed, there has been a growingvolume of international rules on variousmatters affecting the environment since the1970s.16 Not all environmental issues havean international dimension, however, andthus warrant international action. Forexample, when the adverse effects of pollu-tion are contained within a country’s bor-ders, the case for overriding the sovereigntyof that government is weak.17
Outside environmental protection, thereare also many areas where the argument forinternational cooperation can be strong.This is the case with international efforts tocombat corruption, for example, which canseriously undermine investment climates(box 9.6).
182 WORLD DEVELOPMENT REPORT 2005
0
50
100
150
Cum
ulat
ive
num
ber o
f agr
eem
ents
200
20001975 1980 1985 1990 19951950 1955 1960 1965 1970Note: Agreements reported to the WTO.Source: WTO Web site.
Figure 9.3 Regional economic cooperation agreements proliferated in the 1990s
11_WDR_Ch09.qxd 8/23/04 4:16 PM Page 182

International rules and standards 183
When spillovers are less tangible, or thebenefits less evenly shared, the case forinternational cooperation can be morecomplex. Take competition policy. There isgrowing understanding of the importanceof adopting cooperative approaches to theinvestigation and prosecution of interna-tional cartels, which can impose large costson countries. In the 1990s about 40 interna-tional cartels were prosecuted in the EU andUnited States alone. The average interna-tional price increases due to those cartelsare estimated to have been around 20–40percent. It was also found that many ofthese cartels specifically targeted developingcountries without appropriate national leg-islation in place. The imports of 12cartelized products by developing countriesin 2000 alone exceeded $10 billion.18 Evenwhen the argument for action is strong,however, there is room for debate about thebest form of that action. Should it be lim-ited to coordination between national agen-cies? Should efforts focus on providingtechnical assistance to help national govern-ments establish effective national regimes?Or is a multilateral agreement on competi-tion policy required?19 The last optioncould have significant implications fordeveloping countries, most of which havenot yet established competition agencies.
Proposals to develop new internationalrules to address issues associated with com-petition for investment between countriescan be even more problematic. Competi-tion between governments to attract orretain investment plays an important role indriving investment climate improvements(chapter 3). But it has led to concerns thatthere may be a “race to the bottom” in taxrates, environmental regulation, or othermatters. As discussed in chapter 5, the theo-retical support for such races is mixed, andso far the dire predictions of some com-mentators do not seem to be taking place.Indeed, in some cases the race seems to beto the top rather than the bottom. But theconcern illustrates some of the tensions andpractical challenges for international coop-eration on matters where countries canhave divergent perspectives.
Take tax harmonization. Countries thatprefer high tax rates may favor international
National antibribery laws date from at leastthe Law of Moses in the 9th century BCE.The first attempt to address bribery on aninternational level came in the 1976 OECDGuidelines for Multinational Enterprises.This foreshadowed the most significant stepto date, the ratification of a multilateral con-vention committing parties to make thebribery of a foreign official by one of its citi-zens a criminal offense.
The OECD Convention on CombatingBribery of Foreign Public Officials in Interna-tional Business Transactions, signed in 1997by all 30 OECD member countries and 5nonmember countries (Argentina, Brazil, Bul-garia, Chile, and Slovenia), went into force in1999.The Convention provides guidelinesand a monitoring mechanism to improvedomestic antibribery laws and outlines areaswhere coordinated action to reduce corrup-tion should be taken.To ensure the partieslive up to their agreement, the Conventionestablishes procedures to monitor compli-
ance.Transparency Internationalcomplements official monitoring with aseries of public reports on each country’sprogress in stemming the bribery of foreignofficials.
An even more ambitious effort to fosterinternational cooperation is the U.N. Con-vention against Corruption, signed in 2003by 106 countries and entering into force in2005. It stems from two previous U.N.arrangements—the U.N. Declarationagainst Corruption and Bribery in Interna-tional Commercial Transactions and the U.N.Convention on Transnational OrganizedCrime—and complements the OECD con-vention. It addresses cross-border issuesassociated with recovering assets, freezingaccounts, and seizing foreign property ofcorrupt officials.
Source: Official texts of Conventions,Transparency International (2004), and Braith-waite and Drahos (2000).
B O X 9 . 6 International cooperation to combatcorruption
rules on taxes with the goal of slowing themovement of firms to countries that preferlower taxes—but the latter countries haveno incentives to cooperate. Such differencesin perspective have stymied progress inreaching agreement on these matters, evenbetween countries at similar levels of devel-opment, such as in the EU.20 The prospectsof achieving a truly global accord on mini-mum tax rates that incorporates countrieswith even more divergent perspectivesseems a distant prospect at best.
When these differences exist, the chal-lenge extends beyond the feasibility ofnegotiating an agreement. Even if uniforminternational tax rates could be agreed onand enforced, countries could simply shiftcompetition for investment to other dimen-sions of their investment climate policies,such as the provision of infrastructure orthe enforcement of a host of other regula-tions.21 Indeed, given the breadth of policyareas that influence the investment deci-sions of firms, efforts to curb competitionwould need to cover a vast field—leavinglittle scope for sovereign states to reflect dif-ferences in social preferences or in levels ofdevelopment. Without evidence that suchcompetition is leading to real welfare losses,
11_WDR_Ch09.qxd 8/23/04 4:16 PM Page 183

the case for intruding on the prerogatives ofnational governments seems weak.
An alternative strategy is to leverage theconcerns firms have for their reputations.As discussed in chapter 2, a growing num-ber of initiatives aim to address concernsabout international economic integrationby targeting firms directly, rather than gov-ernments. Many of these initiatives emanatefrom the nongovernmental sector (box 9.7).
Future challengesInternational rules and standards can beexpected to do more in shaping investmentclimates as the intensity of interactionsbetween governments and cross-bordertrade and investment expand. As this briefsurvey highlighted, progress in that direc-tion will need to grapple with several gen-eral tradeoffs.
Measures to enhance the credibility ofgovernment commitments can be especially
important for countries with domesticinstitutions at an early stage of develop-ment. Stronger commitment devices offergreater benefits, but they also involve for-feiting more policy autonomy—and soneed to be considered carefully. To be sus-tainable, measures that curb domestic pol-icy autonomy must also be accepted aslegitimate, reinforcing the importance ofefforts to enhance transparency.
Measures to reduce costs through inter-national harmonization offer many benefitsbut involve several tensions. There is thetension between harmonization and cus-tomization—taking local circumstancesinto account. There is the tension betweenharmonization and competition—wheresome degree of competition between stan-dards can be an important part of the learn-ing process. There is the tension betweenmultilateral and other approaches, and inthe latter case between harmonization with
184 WORLD DEVELOPMENT REPORT 2005
Efforts to promote international cooperation onmatters related to the investment climate arenot limited to arrangements between govern-ments.There has been a growing trend todevelop international norms applicable to firmsdirectly, without the intermediation of states.Particularly in the area of corporate socialresponsibility, many of these initiatives alsospring from the nongovernmental sector.
These codes of corporate conduct outlinebasic principles of behavior for firms, includingcorruption and respect for environmental andlabor norms. Not legally binding, the codes typi-cally depend on the reputation concerns ofmajor firms that operate in more than one coun-try, with compliance often reinforced throughthird-party inspection and transparencyarrangements. Examples of such initiativesinclude the Global Reporting Initiative, the U.N.Global Compact, the Equator Principles, the Pub-lish What You Pay Initiative, and TransparencyInternational’s Business Principles for Counter-ing Bribery.
These mechanisms may help firms adoptinghigh standards to signal their compliance and toburnish their reputations, thus complementingnational laws and policies.The proliferation ofnew codes and arrangements can, however, cre-ate confusion about acceptable standards.Because these initiatives affect mainly multina-tional firms that have an interest in enhancing
or maintaining their international reputations,they will also have less impact on the behaviorof other firms.
A recent survey showed that many firmstake standards of corporate social responsibilityinto account when making location and produc-tion decisions—and suggests that those ema-
nating from the nongovernmental sector wereoften as influential as those developed by inter-national agencies (see figure).
Source: Jorgensen and others (2003); Smith andFeldman (2003); UNCTAD (2001a); Berman andWebb (2003).
B O X 9 . 7 Privatizing international cooperation on corporate social responsibility
0 20 40
ISO14000
Global Reporting Initiative
World Business Council forSustainable Development
ILO Core Conventions
U.N. Global Compact
OECD Guidelines
Ethical Trading Initiative
Percent of firms
Note: Percentage of firms that indicated standards influenced their business. Standards emanating from intergovern-mental initiatives are in dark blue, those by nongovernmental organizations are in light green. The International Organi-zation for Standardization (ISO), striped in this figure, is a nongovernmental organization, but has members drawn frompublic and private sectors. ILO stands for International Labour Organisation.
Standards are influencing business
11_WDR_Ch09.qxd 8/23/04 4:16 PM Page 184

neighbors and harmonization with majormarkets or sources of capital. Given thetradeoffs involved, the preferred approachwill often vary from issue to issue—therewill be no universal models.
Measures to address internationalspillovers also need to reflect the divergentperspectives of countries at different levelsof development. Care needs to be taken notto curtail the policy space of emergingnations without a compelling rationale. At aminimum the voices of developing coun-tries need to be heard when framing theseinitiatives.
While the emerging network of interna-tional rules and standards can help govern-ments improve the investment climates oftheir societies, a critical challenge is toensure the arrangements reflect the inter-ests of developing countries. Uniformglobal rules may be appropriate for somematters, but differences in priorities andcapabilities need to be reflected in others(box 9.8).
The international community has aresponsibility to help ensure that new inter-national rules and standards reflect the per-spectives of developing countries. The bestway to do so is to ensure that developingcountries have the opportunity to partici-pate fully in the development of thosearrangements. Recognizing this, multilat-eral and bilateral donors mobilized morethan $700 million in technical assistance tosupport developing country participationin the Doha Round of multilateral tradenegotiations.22 Given the increasing role ofinternational arrangements in the invest-ment climate area, similar support may
need to be mobilized across a range of newareas. Other ways that the internationalcommunity can help developing countriesimprove the investment climates of theirsocieties are the subject of chapter 10.
International rules and standards 185
Proposals to develop a multilateral agree-ment on investment have a long history.Thefirst attempt was in 1929 at the Paris Confer-ence on the Treatment of Foreigners.Theexperiment was repeated again in the 1948Havana Charter. In 1959 two private initia-tives were combined as the Abs-ShawcrossDraft Convention on Investment Abroad. In1967 the OECD produced a Draft Conven-tion on the Protection of Foreign Property.In 1995–98 the OECD attempted to developa Multilateral Agreement on Investment.Investment issues were proposed for inclu-sion in the Doha Round of the WTOlaunched in 2001. In each case the proposalfailed to find sufficient support.
Looking back, each proposal had itsown features and encountered differentobstacles. But there are basic challenges inconstructing an agreement that includesinvestment protection provisions (along thelines of BITs) and market-openingprovisions, that meets the interests of capi-tal exporters and importers, and thatreflects the interests of both developed anddeveloping countries.
For a developing country, a multilateralagreement that provides high standards ofprotection for investment should havemany attractions as a tool to reinforce thecredibility of government policies. A multi-lateral agreement would also reduce thetransaction costs associated with negotiat-ing scores of BITs, and reduce inconsisten-cies between those agreements. Recent
experience under NAFTA, however, suggeststhat proposals in this area need to placespecial emphasis on clarifying the interac-tions between prohibitions on indirectexpropriation and domestic regulation—and enhancing the transparency ofinvestor-state dispute settlement mecha-nisms.The treatment of restrictions on for-eign capital flows may also be subject todebate (chapter 5). In principle it should bepossible to craft an agreement that meetsthese interests, but the same agreementwould need to meet the interests of devel-oped countries, which will typically placegreater emphasis on market-opening mea-sures, including between themselves.
A broad negotiating forum providesopportunities to trade concessions across arange of subject areas, but it can alsoinvolve complex negotiations that can eas-ily be derailed. Another option could be todevelop or expand regional agreementswith effective investment provisions. NAFTAcould be an example. However, thisapproach offers little help to low-incomecountries in other regions, which wouldstand to gain the most from effective com-mitment devices. And creating a regionalinvestment agreement covering only devel-oping countries would likely offer only lim-ited benefits because it would exclude theprincipal sources of investment capital.
Source: Ferrarini (forthcoming); Henderson(2000);World Bank (2003b); Parra (2000); andWarner (2000).
B O X 9 . 8 A multilateral agreement on investment?
11_WDR_Ch09.qxd 8/23/04 4:16 PM Page 185

11_WDR_Ch09.qxd 8/23/04 4:16 PM Page 186
IMPROVING INVESTMENT CLIMATES IN DEVELOPING COUNTRIES candeliver huge development dividends for the countries concerned, andcontribute to a more inclusive, balanced, and peaceful world.
Chapter 10—How the international community can help suggeststhree things that the international community can do to helpdeveloping countries improve their investment climates.
How the InternationalCommunity Can Help
IVP A R T
12_WDR_PO4_Ch10.qxd 8/24/04 2:50 PM Page 187

12_WDR_PO4_Ch10.qxd 8/24/04 2:50 PM Page 188

189
Improving the investment climates of theirsocieties is first and foremost the responsi-bility of host governments, both at thenational and subnational levels. They holdthe levers—through their policies andbehaviors—to make a huge difference in theopportunities and incentives that firmshave to contribute to growth and povertyreduction. But the international commu-nity can lend a hand.
The case for providing that help is com-pelling. There is the imperative of improv-ing the conditions of nearly half the world’speople that live on less than $2 a day—andthe 1.2 billion that barely survive on lessthan $1 a day.1 Indeed, recognizing theimportance of growth in developing coun-tries, the international community has com-mitted to the Millennium DevelopmentGoals—the first of which is to halve by 2015the proportion of people living on less than$1 a day.2 There are also more pragmatic
motives. Demographic changes over thenext 30 years will add nearly 2 billion morepeople to developing countries, which willbecome home to 7 billion of the world’s 8billion people.3 Improving the opportuni-ties for young people is fundamental to cre-ating a more peaceful and balanced world—to addressing the roots of political instabilityand conflict, and to addressing the pressuresfor migration.
The development payoffs from support-ing better investment climates can be particu-larly strong. For example, the manufacturingvalue added unleashed by investment climateimprovements in even a single country canfar exceed the development assistance pro-vided worldwide (figure 10.1).
This chapter highlights three ways theinternational community can help improvethe investment climates in developingcountries:
• By removing policy distortions in devel-oped countries that harm the investmentclimates in developing countries
• By providing more, and more effective,assistance to the design and implementa-tion of investment climate improve-ments, and better leveraging support pro-vided directly to firms and transactions
• By tackling the substantial knowledgeagenda to help policymakers broadenand accelerate investment climateimprovements.
Removing distortions indeveloped countriesDeveloping countries are not alone in grap-pling with investment climate improve-ments. Developed countries have distortedtheir own investment climates, imposingsignificant costs on their societies but often
How the internationalcommunity can help
10c h a p t e r
1970 1975 1980 1985 1990 1995 2000
Billi
ons
of 1
995
dolla
rs
0
100
200
300
400
500
India
China
South Korea
Global net officialdevelopment finance
Note: Data for China, India, and South Korea show manufacturing value added.Source: OECD online database and World Bank (2004k).
Figure 10.1 Manufacturing value added in a single country can far exceed net globalofficial development finance
12_WDR_PO4_Ch10.qxd 8/24/04 2:50 PM Page 189

also harming the investment climates ofdeveloping countries. Why? Because of thesame clientelist politics that can plaguedeveloping countries. They maintain tariffand nontariff barriers to trade and providesupport and export subsidies to theirindustries that distort incentives in theirdomestic markets and reduce opportuni-ties for productive investment in develop-ing countries.
The magnitude of these distortions canbe staggering. While average import tariffshave been declining as a result of successiverounds of multilateral trade negotiations,tariffs on individual products can stillexceed 100 percent—and in some casesreach 500 percent. Tariffs also tend to esca-late on semi-processed and fully processedproducts, contributing to effective rates ofprotection that can far exceed the nominaltariffs involved.4 Nontariff barriers andother distortions are also pervasive. In agri-culture, for example, OECD countries pro-vided $311 billion of subsidies to theirfarmers in 2001—nearly four-and-a-halftimes the amount allocated to official devel-opment finance.5
The impact of these distortions ondeveloping countries is substantial. Tariffescalation is particularly harmful because itreduces opportunities for developing coun-tries to diversify away from commodities byexpanding into higher-value-added prod-ucts. It has been estimated that removingthe various distortions imposed by devel-oped countries could deliver gains to devel-oping countries of $85 billion in 2015—ormore than four times the developmentassistance currently provided for invest-ment climate improvements.6 Expandingmarket access opportunities for productsfrom developing countries would be espe-cially beneficial for poverty reductionbecause agricultural and labor-intensivegoods usually face import tariffs twice ashigh as those for other products.
The benefits are not limited to trade ingoods. Service trade is a growing source ofopportunities for many people in develop-ing countries—and is delivering benefits tofirms and consumers in developed coun-tries as well. Service industries in OECDcountries already benefit from protection
equivalent to tariffs of 10 to 30 percent.7
The mutual gains from trade make a strongcase for removing these restrictions—rather than responding to protectionisturges that penalize developing countriesfor progress.
Providing more, and moreeffective, assistanceAs highlighted throughout this Report,improving the investment climates of theirsocieties involves many challenges for gov-ernments. The international communitycan help by providing development assis-tance to help design and implement thoseimprovements. Those efforts can be com-plemented by support provided directly tofirms and transactions. The internationalcommunity has long been active in bothareas, but there are opportunities to dobetter.
Development assistance to support thedesign and implementation of investmentclimate improvements can take manyforms. According to estimates prepared forthis Report, assistance provided by majorbilateral and multilateral donors for invest-ment climate improvements averaged $21.1billion per year between 1998 and 2002—orabout 26 percent of all development assis-tance.8 The bulk of that assistance went toinfrastructure development, followed bypolicy-based support and technical assis-tance. Most of that support was provided inthe form of loans (table 10.1).
Support provided directly to firms andtransactions also has the potential to con-tribute to or complement investment climateimprovements. That support accounted foran average of $3.1 billion per year of devel-opment assistance between 1998 and 2002,and a further $26.4 billion of support inother forms.
Supporting investment climate improvementsAssistance for the investment climate hasbenefited from recent improvements in theplanning and delivery of development assis-tance generally. There is a growing empha-sis on improving the effectiveness, not justthe volume, of assistance. There is a sharper
190 WORLD DEVELOPMENT REPORT 2005
12_WDR_PO4_Ch10.qxd 8/24/04 2:50 PM Page 190

focus on poverty reduction, as reflected incommitments to the Millennium Develop-ment Goals. There is greater recognition ofthe key role of government policy in ensur-ing that aid is effective, leading to greaterselectivity across countries.9 There aregreater efforts to ensure country ownership,putting governments in the driver’s seatthrough Country Development Strategiesand Poverty Reduction Strategies.10 There isa greater focus on results, which has led tonew initiatives that link support to demon-strated performance. These initiativesinclude efforts to link support to perfor-mance at the country level, such as the out-come-oriented benchmarks for budget sup-port piloted by the EU and the MillenniumChallenge Account initiative launched bythe United States.11 Results-focused effortsalso include initiatives at the program orproject level, such as linking the disburse-ment of support to the actual delivery ofoutputs rather than the financing ofinputs.12 Finally, there is a growing empha-sis on development knowledge, includingresearch on global public good issues,knowledge sharing, and more rigorousimpact evaluation.
Development assistance to support invest-ment climate reforms can cover the fullgamut of issues discussed in this Report, fromimproving governance to supporting devel-oping country participation in the negotia-
tion of new international rules and standards.Many of the lessons of experience in manag-ing reform processes—including in relationto priority setting and consensus building—and in designing particular interventions areas relevant to donors as they are to develop-ing country governments. The key is thus tofocus on addressing important constraints,which need to be identified in each case, andto support a process for ongoing improve-ments (chapter 3). The international com-munity can also draw on a growing body ofexperience in designing and implementingassistance in each area of support.
Policy-based support. Support to policyreforms can take many forms. Policy-basedor programmatic support can play an impor-tant role, and accounted for an average of $7billion per year during 1998–2002—or 33percent of development assistance for invest-ment climate improvements.13
The focus of this support has changed overtime, reflecting the evolution of importantconstraints and the emergence of new issues.In the 1980s the main focus was on macroeco-nomic stability, reducing price and exchangerate controls, liberalizing financial sectors,and reforming public enterprises. By the1990s emphasis began to shift to microeco-nomic and institutional reforms to build orimprove markets. By the end of the 1990s thepriority areas were improving the business
How the international community can help 191
Table 10.1 Support for investment climate reforms and to firms and transactions: annual averages 1998–2002 (billions of 2001 dollars)
Development assistance Other assistance
Concessional Total grants Non-concessional Grants loans and loans loans Guarantees
Support to investment climate reforms
Policy-based support 1.5 5.5 7.0 n.a. n.a.
Technical assistance 1.7 1.0 2.7 n.a. n.a.
Investment in infrastructure 1.7 9.7 11.4 3.2 3.0
4.9 16.2 21.1
Support to firms and transactions
Development assistance 1.1 2.0 3.1 n.a. n.a.
Other support n.a. n.a. 0.0 13.4 6.8
6.0 18.2 24.2 16.6 9.8
Note: n.a. = not applicable. “Policy-based support” includes quick disbursing operations such as structural adjustment, balance of payment, and general and sectoralprogrammatic assistance; policies supported under such operations may have been from several sectors. “Technical assistance” includes projects providing technicalassistance, training, and other capacity building assistance for legal reform, privatization, research and scientific institutions, and employment policy and administration;finance and banking, trade and tourism and industry, export promotion, mining and construction; and infrastructure policy, administration, and regulation. “Infrastruc-ture” includes physical investments in energy, telecommunications, and transport. “Development assistance to support firms and transactions” includes financial (suchas lines of credit) and nonfinancial support (such as business development services) provided directly or indirectly to small private firms. “Other support” includes non-concessional loans and guarantees provided by international development finance institutions and export credit agencies for periods exceeding one year.Source: Authors’ calculations using OECD CRS data, data gathered by IFC using the methodology defined in IFC (2002) and Migliorisi and Galmarini (2004).
12_WDR_PO4_Ch10.qxd 8/24/04 2:50 PM Page 191

environment, establishing the conditions forprivate participation in infrastructure, andhelping to support global integration.14
Investment climate improvements are, attheir heart, about improving the quality ofgovernance and policymaking, and oftenneed to confront resistance from those whobenefit from the status quo (chapters 2 and3). In the 1980s and 1990s the internationaldevelopment community used conditional-ity attached to international assistance as away to encourage policy reforms. Whileoften controversial, it proved useful on occa-sion and indeed was sometimes sought bygovernments to lock in policy commitmentsand deal with resistance from local interestgroups.15 Too often, however, external actorswere perceived to be driving country strate-gies, and when the government was not fullycommitted, the promised reforms oftennever materialized. New laws were passed tomeet conditionality requirements but notimplemented. New regulatory agencies wereestablished on paper but not staffed or givenpolitical support. When the sustainability ofreforms was in doubt, they lacked credibilityto firms, and so elicited a limited investmentresponse.16
Drawing on this experience, newapproaches—among them the Comprehen-sive Development Framework—considerthat the way aid is delivered can be as impor-tant as the content of aid in determining itseffectiveness. More emphasis is being placedon ensuring country ownership and engag-ing a broader group of actors in society tohelp build consensus for better policyapproaches17—processes especially impor-tant to the effectiveness and sustainability ofinvestment climate improvements. As part ofthis effort, the consultative processes thathave proven effective in supporting invest-ment climate improvements (chapter 3) areincreasingly being integrated into the processof formulating and implementing PovertyReduction Strategies and donor CountryAssistance Strategies.18 Further progress inthis direction holds great promise.
Technical assistance. Technical assistancecan be one of the most potent ways of help-ing governments improve their investmentclimates. In its many forms it can help cat-
alyze policy improvements, bring world-class expertise to bear on the design of par-ticular reforms, and strengthen the capabil-ities of policymakers and regulators. Whilesome technical assistance may be embodiedin other forms of support, estimates pre-pared for this Report suggest that technicalassistance for investment climate improve-ments averaged $2.7 billion per year from1998 to 2002—or just 13 percent of devel-opment assistance for investment climateimprovements over that period. The sup-port ranged from around $200 million ayear in East Asia and Pacific to $600 millionper year in the regions of Sub-SaharanAfrica, Europe and Central Asia, and LatinAmerica and Caribbean.
As with any form of assistance, the qual-ity, not the volume, determines effectiveness.In this context donor agencies have beengrappling with three main challenges inincreasing the effectiveness of technical assis-tance for investment climate improvements.
• Supply- vs. demand-driven approaches.Donors eager to support reforms can easilyfall prey to supply-driven approaches.Indeed, the bookshelves of many ministriesin developing countries are lined withreports presenting detailed proposals forthe design and implementation of reformsnever implemented. To counter this ten-dency, more donors are testing demand forassistance and requiring beneficiaries tocofinance or otherwise provide evidence ofserious commitment to reform.
• Specialist expertise and scale. Technicalassistance on many investment climateissues involves the mobilization of exper-tise on highly specialized topics—fromthe design of land registries and corpo-rate governance regimes to the regulationof ports. Many technical assistance pro-jects in this area are also relatively smallin size, averaging $1.1 million eachbetween 1998 and 2002. Both factors canincrease the design and supervision costsof technical assistance projects relative toother forms of assistance.
• Institutional fit. When recommending thedesign of particular policy frameworks orregulatory regimes, too little emphasis canbe given to questions of institutional fit—
192 WORLD DEVELOPMENT REPORT 2005
12_WDR_PO4_Ch10.qxd 8/24/04 2:50 PM Page 192

ensuring that proposals are well adaptedto local conditions. Indeed, advisers fromdonor countries very often propose solu-tions that bear a striking resemblance tothose adopted in their home country—regardless of where they are recommend-ing them.19 It may be understandable thatadvisers will be influenced by theapproaches they are most familiar with,but the uncritical transplant of modelsfrom other countries can lead to poor orperverse results (chapter 2).
One practical response to all three chal-lenges is to rely more heavily on multidonortechnical assistance facilities, which alreadyplay an important role in several areas of theinvestment climate (box 10.1). Concernsabout institutional fit can also be addressed byexpanding the analysis and dissemination ofalternative policy approaches with an empha-sis on underlying design principles and trade-offs. Ensuring that advisors engage effectivelywith local stakeholders who would beinvolved in administering and complyingwith the policy framework can also help. End-ing the tying of aid for technical assistancecould also play a role by expanding the pool ofexpertise available and reducing concerns thatadvice might be tainted by the commercialinterests of firms from the donor country.20
Public investment in infrastructure. Publicinvestment in infrastructure can improvethe investment climate, and the interna-tional development community has longbeen an important source of externalfinancing for these investments. Support inthis area accounted for an average of $11.4billion per year from 1998 to 2002, oraround 54 percent of development assis-tance for the investment climate.
To deliver sustainable benefits, however,investments have to be made in the context ofa sound policy framework—often difficultwhen the government is both the regulatorand the service provider. Reflecting this,strategies for improving infrastructure areshifting away from an exclusive focus on pub-lic sector providers to creating an effectiveinvestment climate for commercial providersof those services (chapter 6). This has impor-tant implications for the international com-
munity’s role in supporting public sectorinvestment, particularly with shifting bound-aries between public and private provision ofa range of services.
Experience shows that when governmentscreate an effective policy and regulatory envi-ronment, many infrastructure services can beprovided better by private firms. Indeed,engaging private participation in infrastruc-ture provision has been an important part ofinvestment climate improvement strategiesin most countries. The international develop-ment community thus has to ensure that pro-posed public investments complement ratherthan distract attention from efforts to create abetter investment climate for infrastructureproviders. Although the appetite for privateinfrastructure investment in developingcountries has fallen from its peak in the late1990s, the challenge of striking an appropri-ate balance remains, particularly for telecom-munications, ports, and power supply.
Supporting firms and transactionsIn addition to helping governments improvetheir investment climates, bilateral and mul-tilateral agencies provide substantial support
How the international community can help 193
Multidonor facilities for technical assistanceleverage resources and expertise and facilitatelearning by participating donors,especiallyimportant where the frontiers of knowledgeare moving quickly,as with the investmentclimate.They can bring specialist expertise tobear on the design and implementation ofprojects.They can also reduce sensitivitiesassociated with technical advice coming fromdonor governments whose firms may have aninterest in any resulting commercial opportu-nities.Examples in the investment climatearea include the Foreign Investment AdvisoryService, the Global Corporate GovernanceForum,and the Public–Private InfrastructureAdvisory Facility (PPIAF).
PPIAF, established in 1999, illustrates theapproach. PPIAF aims to improve the qualityof infrastructure in developing countriesthrough private sector involvement. Itsmain products include technical advice,capacity building, and the identification anddissemination of good practices. Participat-ing donors include the Asian DevelopmentBank, Canada, France, Germany, Italy, Japan,
the Netherlands, Norway, Sweden, Switzer-land, the United Kingdom, United States,United Nations Development Programme(UNDP), and the World Bank.
By the end of March 2004, PPIAF hadprovided grants of more than $70 millionfor 310 activities in 88 countries. Itsupported the drafting of 32 sets of lawsand regulations, the execution of 45 trans-actions, the formulation of 14 sector reformstrategies, the establishment or strengthen-ing of 28 institutions, and the training ofmore than 1,500 regulators and officials. Italso supported 80 international andnational workshops with over 9,000 partici-pants, along with the preparation of numer-ous toolkits and case studies to assist in thedissemination of emerging lessons of expe-rience.To ensure that assistance is demand-driven, PPIAF requires recipients of country-specific assistance to provide somecofinancing or other credible evidence ofcommitment to the project.
Source: PPIAF (2003) and World Bank staff.
B O X 1 0 . 1 Multidonor technical assistance facilities andthe investment climate
12_WDR_PO4_Ch10.qxd 8/24/04 2:50 PM Page 193

directly to firms and transactions. Whenthat support takes the form of grants orconcessional loans, which is often the casewith schemes aimed at helping smallerfirms, it is treated as a form of developmentassistance. Far more substantial support isprovided to the execution of particulartransactions through commercial loans andguarantees that are not treated as forms ofdevelopment assistance. How might bothtypes of direct support contribute to invest-ment climate improvements?
Development assistance to support smallerfirms. The main forms of support to firmsfunded from development assistance arefinancial services (lines of credit or microfi-nance) and business development services,both of which tend to be directed to smallfirms and microenterprises. Bilateral andmultilateral agencies provided an average of$3.1 billion a year for this support from1998 to 2002—or more than the amountallocated to technical assistance to improvethe broader investment climate.
There are two main debates in this area.The first is whether small firms in the for-mal economy merit special attention in thisway. As discussed in chapter 3, while manyof the bolder claims linking small firms toeconomic growth are difficult to substanti-ate, small firms do tend to face dispropor-
tionate burdens in a poor investment cli-mate, and have more difficulty obtainingaccess to finance.
The second debate is whether the supportprovided is actually cost-effective. As dis-cussed in chapter 8, schemes aimed at provid-ing special support to small firms have tendedto have disappointing results. The first gener-ation of schemes for delivering businessdevelopment services used substantial donorfunds with little impact. Newer, more market-friendly approaches might avoid some ofthese pitfalls, but have not yet been fully eval-uated. The provision of subsidized or directedcredit for small firms has also had mixedresults, whether implemented by nationalgovernments or by international donors.21
Schemes tend to be difficult to sustain, retardthe development of credit markets, and crowdout commercial providers. That is why gov-ernments (and donors) are shifting theiremphasis from the provision of financial ser-vices to creating a better investment climatefor commercial providers of these services(chapter 6). This applies to schemes directedto small firms in the formal sector, andincreasingly even to microfinance (box 10.2).
The guidelines suggested in chapter 8for selective interventions by governmentsare equally applicable to schemes fundedby donors and international agencies:Have a clear objective and rationale, focuson the sources of the problems rather thanthe symptoms, match the instrument tothe rationale, impose discipline, be trans-parent, and review regularly.
Other support provided to firms. Developedcountries and international agencies pro-vide substantial support to firms and trans-actions on nonconcessional terms that isnot regarded as development assistance.This includes private sector lending byinternational financial institutions andloans and guarantees provided by nationalexport credit agencies. Support of this kindaveraged $26.4 billion per year between1998 and 2002. While there are difficultiescomparing the value of grants, conces-sional loans, nonconcessional loans, andguarantees, the nominal value of this sup-port was nearly ten times the amount ofdevelopment assistance provided for tech-
194 WORLD DEVELOPMENT REPORT 2005
Microfinance is important for poor house-holds and entrepreneurs. Early ventures,subsidized by governments, donors, andNGOs, provided important demonstrationeffects.There is now a growing consensusthat for microfinance to be sustainable andachieve its full potential, it needs to be com-mercial.This means that donors and NGOsneed to be careful not to unwittingly hinderdevelopment of a commercial market.UNDP’s experience in Bangladeshepitomizes a donor knowing when to stop.
The microfinance sector in Bangladeshserves more than 10 million clients inroughly 70 percent of poor households. Ofthe many microfinance institutions in thecountry, only the two largest are fully self-sufficient. Most of the others are small,highly subsidized, and poorly performing
programs supported by the government,NGOs, and donors.
Between 1996 and 2001, UNDPBangladesh implemented 14empowerment projects with microfinancecomponents, with interest rates set withoutregard to financial sustainability.Theschemes attracted many clients, at theexpense of other microfinance providers.When this and other problems in the pro-gram’s administration were revealedthrough a review in 2002, UNDP Bangladeshtook swift action to close down all 14 pro-jects. Shutting down programs is not easyfor donors, but UNDP Bangladesh demon-strated that good donor practice oftendemands such decisions.
Source: Brusky (2003).
B O X 1 0 . 2 Knowing when to stop: UNDP’s microfinanceactivities in Bangladesh
12_WDR_PO4_Ch10.qxd 8/24/04 2:50 PM Page 194

nical assistance for investment climateimprovements.
Support in this area is often justified bydeficiencies in the investment climates indeveloping countries—and by the benefitsthat investment can bring through jobs andthe transfer of expertise and technology. Suchsupport can also complement broader invest-ment climate improvements when it helps tomobilize a supply response and tests anddemonstrates investment climate improve-ments. Transactions that support the provi-sion of better infrastructure, financial, oreducation services can also contributedirectly to investment climate improvements.
The criteria applied when providing thissupport vary among agencies. In addition tocommercial criteria, they typically focus onthe direct impact of the project on the localeconomy and, in the case of bilateral agen-cies—which account for almost two-thirds ofthis support—the benefits to their nationalfirms.22 One way to strengthen the develop-ment impact of this support is to more fullyrecognize the potential contribution to thebroader investment climate. For example,transactions can be used to create precedentsfor applying transparent competitive biddingarrangements, for clarifying policy frame-works, and for supporting a more competi-tive business environment. Internationalfinancial institutions and a growing numberof bilateral agencies apply tests of this kind,but there is scope for broadening theapproach.
Tackling the substantialknowledge agendaThe last 50 years saw tremendous progress inour understanding of macroeconomics, boththeoretically and empirically. Consensus isgrowing on macroeconomic indicators thatindicate the health of the economy. The chal-lenge now is to make similar progress on themicroeconomic determinants of economicperformance—to provide practical guidanceto policymakers.
Understanding the microeconomic deter-minants of growth and productivity has gar-nered much interest in recent years. There isgrowing acknowledgment of the limits ofcross-country regressions and generic char-
acterizations of “institutions.” The emphasisis moving to understanding the differentexperiences between and within countriesand how various factors influence the perfor-mance of different types of firms—a chal-lenge, given the lack of comparable data onkey microeconomic measures.
There is progress. New instruments—including the ones drawn on in this Report—quantify an increasing range of costs, risks,and barriers facing firms. A wider range ofpolicy areas and corresponding institutions isbeing examined to understand their impacton incentives. New firm-level data are pro-viding fresh insights into firm dynamics.Early results from this work are encouraging,suggesting great promise for ongoing work inthis direction. But a huge knowledge agendalies ahead, and warrants priority attention asan integral part of efforts to accelerate andbroaden improvements to investment cli-mates in developing countries.
Better dataAnalysis, understanding, and appropriatepolicy responses depend first on reliableinformation. Yet policymakers in developingcountries are often operating in the darkwhen it comes to their investment climates.There are opportunities to help in three mainareas: national statistics, cross-country data,and synergies with poverty assessments.
National statistics. As noted in chapter 3,substantial efforts are required to improvenational statistical systems including on suchbasic measures as the share of private invest-ment in GDP. Work on building the capacityof statistical agencies in developing countrieshas increased in recent years, includingthrough multipartner initiatives.23 These andrelated initiatives need to give due weight toinvestment climate issues to help govern-ments monitor the performance of their pri-vate sectors, identify emerging trends andproblems, and evaluate the impact of alterna-tive policy approaches.
Cross-country data. The international com-munity is well placed to develop more stan-dardized measures of the investment climateto facilitate comparisons across countries.Recent developments in quantifying many
How the international community can help 195
12_WDR_PO4_Ch10.qxd 8/24/04 2:50 PM Page 195

aspects of the investment climate—includingthe Bank’s Investment Climate Surveys andthe Doing Business Project—are importantsteps forward in understanding how invest-ment climate policies and behaviors influ-ence growth and poverty. In addition toinforming analysis, these measures provide auseful tool for governments to benchmarkperformance and monitor progress. They canalso act as catalysts for reform.
Building up a body of consistent data overtime can provide insights into the criticallinks between policy settings and growthprocesses. Many of the measures are new,however, so changes from a baseline cannotyet be measured. As they build up over time,their explanatory power will increase. Of par-ticular promise is the ability to test more rig-orously the impact of different policyapproaches. Being able to better evaluate theimpact of policies should encourage moreexperimentation and competition betweenapproaches. Evaluations of pilot programscan identify the ones succeeding—the ones tobe scaled up.
There are also benefits in expanding thecoverage of these data across severaldimensions:
• To include the impact on a broaderrange of firms, including those in theinformal and rural economies
• To include the impact on particular sec-tors and on particular supply chains
• To grapple with the measurement ofcritical but hard-to-quantify variables,such as policy uncertainty and competi-tive pressure.
Synergies with poverty assessments. Thereare opportunities to build synergiesbetween approaches for assessing invest-ment climates and for assessing poverty. Forexample, questions on access to infrastruc-ture and finance, and the security of prop-erty rights can be included more systemati-cally in household surveys. The samplingstrategies for household and firm surveysmight also be linked.
Better data of this kind can advanceunderstanding of many key areas of eco-nomic policy. But care needs to be taken not
to focus policy discussions only on topics ormeasures most easily quantified. There is theold joke about the person looking for his lostkeys under the streetlight, not because hedropped them there, but because that waswhere he could see.
A large research agendaA field as broad as the investment climategenerates a huge research agenda, but fourlarger themes warrant close attention.
The ecology of firms and growth processes.There is growing understanding of theprocesses by which firms are born andevolve, including creative destruction, basedmostly on experience in developed coun-tries. Early research provides insights intohow similar processes play out in develop-ing countries. But there is a need to deepenand broaden understanding of thesedynamics, including the important role offirms in the informal and rural economies,and the impact of international economicintegration.
The design of regulatory strategies. Regula-tion plays a central role in addressing mar-ket failures, reconciling the interests offirms with broader social goals, and shapingthe investment climate. To date most of ourunderstanding of regulatory policies andstrategies is based on experience in devel-oped countries, and most of that workfocuses on regulation within relatively nar-row fields, such as infrastructure, finance,product safety, or the labor market. Muchless attention has been given to how regula-tory strategies might be tailored to differentinstitutional environments, particularlythose in low-income countries. There arealso opportunities to explore lessons ofexperience on this question that cut acrossfields of regulation.
The linkages between the investment climateand migration. The quality of a country’sinvestment climate not only affects flows ofcapital—it can influence flows of people,too. The movement can be from rural areasto urban, from one city to another, or fromone country to another. Today the world’s
196 WORLD DEVELOPMENT REPORT 2005
12_WDR_PO4_Ch10.qxd 8/24/04 2:50 PM Page 196

How the international community can help 197
migrants from developing countries totalnearly 175 million.24 The $90 billion ormore in remittances they send to their fami-lies every year is now the second largestsource of private capital (after FDI) for poorcountries.25 Understanding the linkagesbetween investment climate conditions andmigration flows will become more impor-tant as the world deals with major demo-graphic shifts over the coming decades.
The political economy of investment cli-mate improvements. This Report has high-lighted the importance of understandingthe political economy considerations thatinfluence investment climate policies.While the subject has attracted significantattention, little is known about the condi-tions under which governments choose topursue sound policies in these areas,including the implications of alternativepolitical structures and processes. There arealso opportunities to deepen understand-ing on strategies for controlling rent-seek-ing and on the dynamics of reformprocesses more generally.
Beyond data and formal researchEven within the bounds of current datasources, there are opportunities toadvance understanding of many areas ofthe investment climate. Country studiescan help illuminate many importantdesign and implementation details thatremain beyond the reach of cross-countryanalyses. Country studies can also includemore rigorous evaluations of recent policyexperiments to understand their impactson firm performance, productivity, growth,and poverty. There are also opportunitiesto expand recent efforts to identify anddisseminate emerging lessons of experi-ence in the design and implementation ofinvestment climate improvements. Thiscan help policymakers understand therich menu of options they can choosefrom in a field as broad—and central—asthe investment climate.
Working together on these themes, theinternational community can do much tocreate a better investment climate—foreveryone—and so contribute to a more bal-anced, inclusive, and stable world.
12_WDR_PO4_Ch10.qxd 8/24/04 2:50 PM Page 197

This Report draws on a wide range of World Bank documentsand on numerous outside sources. Background papers, casestudies and notes were prepared by Graham Bannock, EricBartelsman, Anthony Burns, Charles Byaruhanga, MarthaChen, David Christianson, Jacqueline Coolidge, RamonClarete, Luc De Wulf, Juan Carlos Echeverry Victor Endo, SaulEstrin, Simon Evenett, David Finnegan, Peter Fortune, MarcoGalmarini, Peter Holmes, Matthew Gamser, Johana GilHubert, Lars Grava, John Haltiwanger, Ashley Hubka, DavidIrwin, Renana Jhabvala, Mariell Juhlin, Stepan Jurajda, ShaminKhan, Sheng Lei, Frances Lund, Raymond Mallon, KatarínaMathernová, Gregor Mackinnon, Pradeep Mehta, KlausMeyer, Stefano Migliorisi, Winnie Mitullah, Reema Nanavaty,Camilo Navarrete, Anders Olofsgard, Gaelle Pierre, John Pre-ston, Amit Ray, Fernando José Salas, Cerstin Sander, MauricioSanta María, Caroline Skinner, Aleksander Surdej, SandaUtnina, Dirk Willem te Velde, Brendan Vickers, ElishaWasukira, Simon White, Yao Yu, Pu Yufei, and Rita Zaidi.
Background papers for the Report are available either onthe World Wide Web http://econ.worldbank.org/wdr/wdr2005/library/ or through the World Development Reportoffice. The views expressed in these papers are not necessarilythose of the World Bank or of this Report.
Many people inside and outside the World Bank gave com-ments to the team. Valuable comments and contributions wereprovided by Alberto Agbonyitor, Daron Acemoglu, SadiqAhmed, Asya Akhlaque, Ian Alexander, Zoubida Allaoua,Magdi Amin, Paul Amos, Jim Anderson, Jock Anderson, DougAndrew, Yaw Ansu, Andreas Antoniou, Robert Bacon, JosephBattat, Simon Bell, Najy Benhassine, Philip Benoit, LorenzoBertolini, Subhash Bhatnagar, Freddy Bob-Jones, MilanBrahmbhatt, David Bridgeman, Harry Broadman, PenelopeBrook, Jose Edgardo Campos, Gerry Caprio, MitaChakraborty, Vandana Chandra, Shaohua Chen, PascaleMarie-Claude Chabrillat, William Cobbett, Louise Cord,Robert Cull, Angus Deaton, Asli Demirguc-Kunt, Jean-JacquesDethier, Simeon Djankov, Antonio Estache, Marcel Fafchamps,Pablo Fajnzylber, Shahrokh Fardoust, Edgardo M. Favaro,Alexander Fleming, Olivier Floris, Francis Fo, Ricardo Fuentes,Ahmed Galal, Matthew Gamser, Sushma Ganguly, Alan Gelb,Coralie Gevers, Indermit Gill, Sylvie Gregoire, Hannes Holm-steinn Gissurarson, Judith Goans, Ian Goldin, Susan Gold-mark, Carlos Gomez, Charles Griffin, Pierre Guislain, NaomiHalewood, Jonathan Halpern, Kristin Hallberg, Clive Harris,Syed Hashemi, Joel Hellman, Rasmus Heltberg, John Hodges,
Patrick Honohan, Robert Hornick, Catherine Hunt, GiuseppeIarossi, Gregory Ingram, Naoko Ishii, Roumeen Islam, JohnBesant Jones, Marc Juhel, William Kalema, Daniel Kaufmann,Philip Keefer, Christine Kessides, Mumtaz Hassan Khaleque,Anupam Khanna, Homi Kharas, R. Shyam Khemani, SunitaKikeri, Stephen Knack, Mihaly Kopanyi, Peter Lanjouw, Eliza-beth Littlefield, Lili Liu, Frannie Leautier, Danny Leipziger,Anat Lewin, Syed Mahmood, William Maloney, Ali Mansoor,Jean-Michel Marchat, Marie-Françoise Marie-Nelly, KeithMaskus, Aaditya Mattoo, Caralee McLiesh, Taye Mengistae,Pradeep Mitra, Andrew Morrison, Fergus Murphy, MamtaMurthi, Mohammad Mustapha, Mustapha Kamel Nabli, JohnNasir, Roger Nellist, Richard Newfarmer, Francis Ng, PaulNoumba Um, Anders Olofsgard, Jacques Ould-Aoudia, Anto-nio Parra, Guillermo Perry, Axel Peuker, Gaelle Pierre, MiriaPigato, Tony Polatajko, Sanjay Pradhan, Christine Zhen-WeiQiang, Brice Quesnel, Firas Raad, Vijaya Ramachandran, Mar-tin Ravallion, Francesca Recanatini, Gerry Rice, Neil Roger,Christian Rogg, Etienne Rolland-Piegue, Jan Rutkowski, Cer-stin Sander, Cecilia Sager, Jamal Saghir, Amartya Sen, MauriceSchiff, Robert Schware, Luis Serven, Anne Simpson, KenSokoloff, Nicholas Stern, Margrete Stevens, Andrew Stone,Gary Stuggins, Uma Subramanian, Victor Sulla, Gwen Swin-burn, Vito Tanzi, Giovanni Tanzillo, Dirk Willem te Velde,Francis Teal, Simon Thomas, Nigel Twose, Marilou Uy, RudolfV. Van Puymbroeck, Dirk Willem te Velde, Milan Vodopivec,Shuilin Wang, John Wilson, Peter Woicke, James D. Wolfen-sohn, Colin Xu, and Tarik Yousef.
Other valuable assistance was provided by Jean-PierreDjomalieu, Endy Djonokusumo, Jocelyn Dytang, InesGarcia-Thoumi, Gytis Kanchas, Jimena Luna, Polly Means,Nacer Mohamed Megherbi, Christopher Neal, and Jean GrayPonchamni.
The team wishes to thank the many individuals who partic-ipated in workshops held in Berlin, Dar-es-Salaam, London,New Delhi, Shanghai, and Washington D.C.; in videoconfer-ences with Brazil, Egypt, Guatemala, Honduras, Japan,Lebanon, Nicaragua, Russia, and Serbia and Montenegro; andin on-line discussions of the draft report. The World Bank’sexternal affairs staff around the world provided valuable sup-port to the consultation process.
Despite efforts to compile a comprehensive list, some whocontributed may have been inadvertently omitted. The teamapologizes for any oversights and reiterates its gratitude to allwho contributed to this Report.
Bibliographical note
198
13_WDR_Bibnotes.qxd 8/24/04 3:06 PM Page 198

199
Overview
1. For further details on these data sources, see Box 1.2 andTables A1 and A2 in the Selected Indicators section at the back ofthe book.
2. See Box 1.5.3. Johnson, McMillan, and Woodruff (2002b).4. Hall and Jones (1999); Parente and Prescott (2000); Easterly
and Levine (2001); and Bosworth and Collins (2003).5. Schumpeter (1942).6. See Figure 1.13.7. OECD (2002b); Carlson and Payne (2003).8. Dollar, Hallward-Driemeier, and Mengistae (2003a).9. Minot and Goletti (2000) and Winters, McCulloch, and
McKay (2004).10. Hoekman, Kee, and Olarreaga (2001).11. See Box 6.12.12. Field (2002).13. See Figure 1.18.14. World Bank (2004b).15. See Figure 1.4.16. See Table 2.1.17. World Economic Forum (2004).18. Londoño and Guerrero (2000).19. Box 5.13.20. Bartelsman and others (2004).21. World Bank (2004d).22. Migliorisi and Galmarini (2004).
Chapter 1
1. Chermak (1992).2. Acemoglu, Johnson, and Robinson (2002); Levine (1997);
Kaufmann, Kraay, and Mastruzzi (2003); La Porta and others(1999); Glaeser and Shleifer (2002); and Glaeser and others (2004).
3. Acemoglu and Johnson (2003); Rodrik, Subramanian, andTrebbi (2002); and Knack and Keefer (1995a).
4. Burgess and Venables (2003).5. Pritchett (2004).6. World Bank (2004b).7. Erb, Harvey, and Viskanta (2000).8. Calculated from the World Business Environment Survey data.9. World Bank (2004b).10. Malthus (1798).
11. Maddison (1995).12. De Long (2000). In terms of pure purchasing parity, and
looking at how large a bundle of 1900 era goods could be boughtwith today’s incomes, Thailand’s per capita income is 50 percentgreater than that of the U.S. in 1900, and Mexico and Uruguay notquite double it.
13. Pritchett (1997).14. Pritchett (2002) and Hausmann and Rodrik (2003).15. Easterly (2001); Aghion and Durlauf (2004); and Haus-
mann, Pritchett, and Rodrik (2004).16. Tanzi and Davoodi (1998).17. Sala-i-Martin and Vila-Artadi (2002) and Easterly, Devara-
jan, and Pack (2001).18. Bosworth and Collins (2003).19. Krugman (1997).20. Barro and Sala-i-Martin (2003); Bosworth and Collins
(2003); Easterly and Levine (2001); Hall and Jones (1999); Klenowand Rodríguez-Clare (1997); and Young (1995).
21. Solow (1957); Jones (2002); and Barro and Sala-i-Martin(2003). More recent work still acknowledges the importance oftechnology, but broadens the view of total factor productivity toinclude concepts of institutions and social capital, concepts closelyrelated to the investment climate. See Hall and Jones (1999) andAcemoglu and Johnson (2003).
22. Jovanovic (1995).23. Parente and Prescott (2000).24. Hall and Jones (1999) and Acemoglu, Johnson, and Robin-
son (2001).25. Hicks (1935).26. Baumol (2002).27. Schumpeter (1942).28. A similar result was found in Carlin and others (2001) using
an earlier round of survey data in the same countries. See also Bas-tos and Nasir (2003).
29. Haltiwanger (2000) and Bartelsman, Scarpetta, andSchivardi (2003).
30. Scarpetta and Bartelsman (2003).31. Potential endogeneity is controlled for using lagged values.32. Desai and Mitra (2004) and Caballero, Engel, and Micco
(2004).33. World Bank (2002d).34. Kraay (2003).
Endnotes
14_WDR_Endnotes.qxd 8/24/04 1:54 PM Page 199
35. While the overall trends are undisputed, the exact levels ofpoverty are a matter of some debate due to differences in method-ologies in calculating them. For example, household surveys ornational accounts, expenditure or consumption-based measures,and the challenge of measuring nonmonetary transactions. SeeChen and Ravallion (2004); Ravallion (2003a); and Deaton (2002).
36. Bourguignon (2004).37. Dollar and Kraay (2002).38. Bourguignon (2004).39. World Bank (2003m); Midlarsky (1999); and Fearon and
Laitin (2003).40. Fields and Pfeffermann (2003).41. OECD (2002b); Carlson and Payne (2003); and India
National Sample Survey Organisation.42. World Bank (2004i).43. Dollar, Hallward-Driemeier, and Mengistae (2003a) and
Hallward-Driemeier, Iarossi, and Sokoloff (2002).44. Lanjouw and Stern (1998).45. United Nations (2002b).46. ILO (2002b).47. Schneider (2002); Chen, Jhabvala, and Lund (2002);
Charmes (2000); Mead and Liedholm (1998); Jhabvala, Sudarshan,and Unni (2004); and ILO (2002b).
48. Minot and Goletti (2000).49. Winters, McCulloch, and McKay (2004).50. Despite these benefits for poor people, many countries
restrict the sale of second-hand clothing. See Dougherty (2004)and Tranberg Hansen (2000).
51. Hoekman, Kee, and Olarreaga (2001). Country-level studiesprovide additional evidence that greater competitive disciplinereduced markups in Chile, Colombia, Côte d’Ivoire, Mexico,Morocco, and Turkey. See Roberts and Tybout (1996); Harrison(1994); and Levinsohn (1993).
52. ESMAP (2002).53. Field (2002).54. Palmade (2004). For further discussion of taxes in develop-
ing countries see chapter 5.55. World Bank (2003p).
Chapter 2
1. Appearing before the U.S. Senate Armed Services Committeein 1953, Wilson—a former president of GM—actually said, “[F]oryears I have thought that what was good for our country was goodfor General Motors and vice versa.”
2. Litvin (2003).3. Hufbauer and Goodrich (2003a) and Hufbauer and Goodrich
(2003b).4. Rajan and Zingales (2003) cite examples in Mexico, Brazil,
and Japan.5. Stigler (1971) and Peltzman (1976).6. Sutton (1976).7. World Bank (1997).8. Murphy, Shleifer, and Vishny (1993).9. Klitgaard (2000).10. Reinikka and Svensson (1999) and Transparency Interna-
tional Bangladesh (2002).11. Adserà, Boix, and Payne (2003).
12. Klitgaard (1998).13. Van Rijckeghem and Weder (2001).14. Laffont and Tirole (1991).15. Hellman and others (1999).16. Wintrobe (1998).17. Robinson and Verdier (2002); Robinson (1998); Herbst
(2000); and Bates (1981).18. On poorly defined property rights, see Barzel (2002); on red
tape, see De Soto (2000); on labor markets, see Golden (1997); onfinance, see Rajan and Zingales (2003); on infrastructure, see WorldBank (2003p).
19. Patronage and clientelism are often associated with “per-sonal voting,” whereby promises made by policymakers may onlybe credible to groups with whom they have personal relationships:Keefer (2002).
20. See, for example, Morris and Shepsle (1990) and Keefer andKhemani (2003).
21. Khemani (2004) and Desai and Olofsgård (2003).22. Faccio (2003).23. Fisman (2001).24. Hellman and Kaufmann (2003).25. For a review of the effects of political finance on state cap-
ture, see Kaufmann (2002). For evidence of efforts to reform cam-paign finance laws in transition economies, see World Bank(2000c).
26. Keefer (2002) and Keefer (2003).27. Mukherjee (2002) and World Bank (2000a).28. Dixit and Pindyck (1994). The option theory of investment
highlights how uncertainty raises the threshold value a projectmust meet before firms will be willing to commit due to the loss ofthe option of waiting. However, uncertainty does not necessarilyalways decrease investment. Uncertainty that raises the probabilityof a bad outcome will lower the expected benefits. But if increaseduncertainty rises with the marginal revenue product of the invest-ment, then the expected profitability can increase. See Serven(1997) and Caballero (1991).
29. Pattillo (1998) and Darku (2001).30. Smith (1997a).31. Gaston and Wei (2002).32. Keynes (1936).33. Thaler (1993); Thaler (2000); Rabin (1998); Kagel and Roth
(1995); Camerer, Loewenstein, and Rabin (2003); and Kahnemanand Tversky (2000).
34. Henisz and Delios (2003) review investment patterns byJapanese firms in 49 countries and find that market entry strategieswere heavily influenced by perceptions of policy uncertainty.
35. Hnatkovska and Loayza (2004) and Ramey and Ramey(1995).
36. Svensson (1998); Paunovic (2000); and Rodrik (1991).37. North (1993).38. North and Weingast (1989).39. See, for example, Henisz (2000); Stasavage (2002); and
Falaschetti (2003).40. Cukierman (1992); Majone (1996); and Levy and Spiller (1994).41. Olofsgård (2004). Also see McCubbins and Lupia (1998).42. Haber, Razo, and Maurer (2003).43. Perkins (2000).
200 WORLD DEVELOPMENT REPORT 2005
14_WDR_Endnotes.qxd 8/24/04 1:54 PM Page 200

44. On the various definitions of trust and social capital, seeFukuyama (2001); Coleman (1988); and Putnam, Leonardi, andNanetti (1993).
45. It is also not inevitable that communal, family- or kinship-based relationships will instill trust and create the basis for richercivic-associational life. In post-World War II Italy, citizens wereunwilling to coordinate in establishing businesses, schools, hospi-tals, or other voluntary organizations. Organized life tended todepend on the initiative of centralized, distant authority: thechurch and the state. Banfield (1958); Piore and Sabel (1984); andFukuyama (1995).
46. Olivier de Sardan (1999).47. Alesina and others (2003b).48. Henisz and Zelner (forthcoming) and Kubler (2001).49. Kay (2003).50. For experience in the transition economies, see Center for
Policy Studies (2003) and The Economist (2003b).51. The Pew Global Attitudes Project (2003).52. Muller (2002).53. Examples include proposals to abolish joint-stock compa-
nies in England after the bankruptcies of 1860s and to nationalizelarge parts of corporate American by the New Dealers, see Mick-lethwait and Wooldridge (2003).
54. Micklethwait and Wooldridge (2003).55. Stiglitz (1989).56. OECD (2003g).57. Stiglitz (1999b).
Chapter 3
1. Maloney (2004).2. Johnson, McMillan, and Woodruff (2002b).3. Reid and Gatrell (2003).4. Rodrik and Subramanian (2004).5. Cao, Qian, and Weingast (1999).6. Saavedra (2003). See also Blanchard and Giavazzi (2003);
Bineswaree and Freund (2004); and Klapper, Laeven, and Rajan(2003).
7. World Economic Forum (2004).8. World Bank (2004b).9. World Bank (2002c) and Commonwealth Secretariat (2003).10. Blanchard and Giavazzi (2003).11. ILO (2002b).12. Chen, Jhabvala, and Lund (2002).13. ILO (2002b) and Ellis (2003). See also box 1.12.14. Galal (2004).15. Hallward-Driemeier and Stone (2004).16. Mitullah (2004); Lund and Skinner (2004); and Chen, Jhab-
vala, and Lund (2002).17. Field (2002) and Bannock and others (2004).18. Stern, Dethier, and Rogers (2004).19. Lanjouw and Stern (1998).20. Reardon and others (1998).21. Lanjouw and Shariff (1999).22. Foster and Rosenzweig (2004).23. World Bank (2004k) and Chandra and Rajaratnam (2004).24. Similar results are found in EBRD (1999) and Batra, Kauf-
mann, and Stone (2002).
25. Christianson (2004).26. Despite the attention to this issue, credit is not always the
binding constraint on small and medium enterprises: McMillanand Woodruff (2002).
27. Baldwin (2003) provides a recent survey of the large litera-ture on growth and openness.
28. Aitken, Hanson, and Harrison (1997).29. The copious literature on this topic is summarized in Tybout
(2003) and Keller (2001).30. Hoekman, Kee, and Olarreaga (2001); Roberts and Tybout
(1996); Harrison (1994); and Levinsohn (1993).31. For a recent illustration see Hufbauer and Goodrich (2003b).32. Bayoumi, Coe, and Helpman (1999) and de Ferranti and
others (2003).33. Tybout (2003).34. Fernandes (2003) for Colombia; Muendler (2002) for Brazil;
and Pavcnik (2003) for Chile. Using industry-level data for India,Aghion and others (2003) find similar results for India.
35. Fernandes (2003).36. Aghion and others (2003).37. Hu and Jefferson (2002); Aitken and Harrison (1999); and
Djankov and Murrell (2002).38. Blalock and Gertler (2003); Smarzynska (2002); and Kugler
(2001).39. Görg and Strobl (2001) and Blomström and Kokko (1998).40. For countries with low skill levels, the returns from acquir-
ing foreign technology are higher. In India returns from technologypurchase are 44 times higher than the rate of return of domesticR&D; in scientific sectors the rate of return for technology pur-chase is 166 percent, but for domestic R&D the rate is 1 percent. SeeBasant and Fikkert (1996).
41. Coe and Helpman (1995) and Coe, Helpman, and Hoffmais-ter (1997).
42. The level of absorption may depend on human capital andthe stock of domestic R&D. See, for example, Crespo, Martin, andVelazquez (2002).
43. Lederman and Maloney (2003).44. UNCTAD (2003c) and de Ferranti and others (2003).45. Fernandez and Rodrik (1991).46. Krueger (2000); Tommasi (2002); and Hausmann, Pritchett,
and Rodrik (2004).47. Woo-Cumings (2001).48. Parente and Prescott (2000).49. Berglof and Roland (2000).50. Cao, Qian, and Weingast (1999) and Yeung (2003).51. North and Weingast (1989).52. Boix (2003).53. Kingdon (1995).54. Consumers International (www.consumersinternational.org)
and Transparency International (www.transparency.org).55. Cabanero-Verzosa and Mitchell (2003).56. Georgian Opinion Research Business International
(GORBI) (2002)57. Yufei and others (2004).58. Smith (1997a).59. Sidak and Baumol (1995) and Hempling, Rose, and Burns
(2004).
Endnotes 201
14_WDR_Endnotes.qxd 8/24/04 1:54 PM Page 201
60. Kostrzeva (2003).61. Wedel (2002).62. OECD (1999a).63. Argy and Johnson (2003).64. OECD (1999b) and OECD (2002c).65. OECD (2000b) and OECD (2002c).66. Kirkpatrick and Parker (2003) and Lee (2002).67. Stanchev (2003).68. Regobeth and Ahortor (2003).69. Stanchev (2003).70. Zeruolis (2003) and Vilpisauskas (2003).71. Environmental Resources Management (2004).
Chapter 4
1. Murdoch and Sandler (2002).2. World Bank (2003m).3. Johnson, McMillan, and Woodruff (2002b).4. Besley (1995) and World Bank (2003f).5. Erb, Harvey, and Viskanta (2000).6. Torstensson (1994) and Knack and Keefer (1995b).7. Keefer (2004).8. World Bank (2003n).9. Jimenez (1984).10. Lanjouw and Levy (2002).11. Friedman, Jimenez, and Mayo (1988).12. Feder and others (1988).13. Do and Iyer (2003).14. Base line data from Bank project cited in Baharoglu (2002).15. Feder and others (1988).16. Field (2002).17. World Bank (2003n).18. Macours (2003).19. World Bank (2003n).20. Adlington (2002).21. Deininger (2002).22. International Institute for Environment and Development
(2001).23. Siamwalla (1993) and Stanfield and others (1990).24. United Nations–Habitat (2003) and Baharoglu (2002).25. Yahya (2002) and Botswana–Ministry of Lands (2002).26. Fleisig and De la Peña (2003).27. IFC and CIDA (2001).28. World Bank (2002b).29. Greif (1989) and Fafchamps (2004).30. Klein (1992).31. World Bank (2003a) and Jappelli and Pagano (1999).32. Jappelli and Pagano (1999).33. Fafchamps (2004).34. Milgrom, North, and Weingast (1990).35. Mnookin and Kornhauser (1979).36. Galanter and Krishnan (2003).37. Williamson (1996).38. Cristini and Moya (2001) and Castelar-Pinheiro and Cabral
(2001).39. Laevan and Woodruff (2003).40. Castelar-Pinheiro (1998); Sereno, de Dios, and Capuano
(2001); and Herrero and Henderson (2001).41. Johnson, McMillan, and Woodruff (2002a) and Broadman
and others (2004).42. Bigsten and others (2000) and Fafchamps and Minten
(2001).43. Djankov and others (2003b).44. Djankov and others (2003b).45. World Bank (2003f).46. Messick (1999) and Burki and Perry (1998).47. Chengappa (1999).48. On Tanzania, see Kahkonen and others (2001). On Bolivia,
see Fleisig and De la Peña (2003).49. Inter-American Development Bank (2002).50. Ahmadi (1999).51. UNCTAD (2003a). See also chapter 9.52. World Bank (2003d).53. Volkov (2002).54. Polinsky and Shavell (2000).55. Stone and Ward (2000).56. Schärf (2001).57. Greenwood and others (1998) and Waller and Sanfacon
(2000).58. McDonald (1994).59. Sherman and others (1998).60. Villadeces and others (2000) and Mockus (2002).61. Buvinic and Morrison (2000).62. Frye and Zhuravskaya (2000).63. Rossiter (1961).64. Mattei (2000) and Shavell (2004).65. Chifor (2002).66. Vernon (1971).67. Wells Jr. and Gleason (1995).68. West (2001).69. For a review of strategies employed by investors in private
infrastructure projects, see Smith (1997a).70. Van der Walt (1999).71. Stephenson (2003).
Chapter 5
1. Coase (1960) and Pigou (1932).2. Acemoglu, Johnson, and Robinson (2001).3. Pistor and others (2003).4. Pistor and others (2003).5. Pistor (2000).6. Berkowitz, Pistor, and Richard (2003).7. Alesina and others (2003a) and Nicoletti and Scarpetta (2003).8. Numbers based upon estimates presented in Alesina and oth-
ers (2003a).9. World Bank (2003a).10. Costs are median costs for each group, calculated for firms
that report applying for basic activity license in the past three years.Data is from the Investment Climate Survey for Tanzania.
11. World Bank (2003g).12. Schneider (2002).13. Flores and Mikhnew (2004).14. OECD (2003a).15. World Bank (2004b).16. Winston (1993) and OECD (1997b).17. Guasch and Hahn (1999) and Guasch and Spiller (1999)
summarize studies for developing countries.
202 WORLD DEVELOPMENT REPORT 2005
14_WDR_Endnotes.qxd 8/24/04 1:54 PM Page 202

18. Fernandes (2003) for Colombia; Muendler (2002) for Brazil;Pavcnik (2003) for Chile; and Aghion and Burgess (2003) for India.
19. Bartelsman and others (2004). The countries were Brazil,Chile, Colombia, Hungary, Latvia, Mexico, Romania, Slovenia, andVenezuela. Increases exceeded 10 percent in Brazil, Chile, and Mex-ico and exceeded 20 percent in Colombia, Hungary, and Venezuela.
20. Akiyama and others (2003).21. Akiyama and others (2003).22. See, for example, McMillan, Rodrik, and Welch (2002).23. Lawson and Meyenn (2000) describe the program. Data are
from Grameen Telecom’s Web site (www.grameen-info.org/grameen/gtelecom/) from February 2004.
24. La Porta and López-de-Silanes (2001).25. World Bank (2004d).26. Evenett (2004).27.These are based upon the recommendations in UNCTAD (2003d).28. See www.internationalcompetitionnetwork.org, “Advocacy
and Competition Policy” ICN Conference, Naples, Italy, 2002.29. Khemani (2002) and Kovacic (1997).30. Kee and Hoekman (2003).31. The Economist (2002c).32. The U.S. did, however, levy a temporary income tax in 1862
during the civil war. See www.irs.ustreas.gov/.33. Ebrill and others (2001).34. Lewis (2004).35. For a review of efficiency arguments in taxation, see Dia-
mond and Mirlees (1971); Stiglitz and Dasgupta (1971); Ebrill andothers (2001); Sandmo (1976); and Slemrod (1990). For a discus-sion of the pragmatic considerations driving tax system design indeveloping countries, see Tanzi and Zee (2001).
36. In 2000/01, corporate income taxes accounted for 14 percentof tax revenues in low-income countries, 12 percent of revenues inlower middle-income countries, and 9 percent of revenues in uppermiddle-income countries. Direct taxes on goods and servicesaccounted for 41 percent, 42 percent, and 37 percent of revenuesrespectively. Taxes on international trade accounted for 18 percent,14 percent and 8 percent of revenues respectively. Data are averagesfor 60 developing countries for which comparable data were avail-able and calculated based on data from IMF (2003); OECD(2002d); and Dobrinsky (2002).
37. Mitra and Stern (2003) discuss corporate tax revenues in thetransition economies.
38.Gauthier and Gersovitz (1997) and Gauthier and Reinikka (2001).39. Taxes on goods and services increased on average as a per-
cent of GDP between the mid-1990s and 2000-2001 among allincome groups, while taxes on international trade fell among allgroups. Calculations were based upon data from IMF (2003);OECD (2002d); and Dobrinsky (2002).
40. Elstrodt, Lenero, and Urdapilleta (2002).41. Djankov and others (2002).42. Ebrill and others (2001) show that the largest 10 percent of
firms account for about 90 percent of turnover in Georgia, Pak-istan, Sri Lanka, and Uganda.
43. Das-Gupta, Engelschalk, and Mayville (1999).44. Taliercio Jr. (2003b).45. Bird and Engelschalk (2003) discuss this in greater detail.46. In practice, the autonomy of an agency depends upon many
factors, including the agency’s legal position, its governance struc-
ture, and its financing mechanisms. For further details, seewww1.worldbank.org/publicsector/tax/autonomy.html.
47. Bird (2003).48. Taliercio Jr. (2003b).49. Taliercio Jr. (2003b).50. Taliercio Jr. (2001).51. Taliercio Jr. (2001); Taliercio Jr. (2003a); and Taliercio Jr.
(2003b).52. See Das-Gupta, Engelschalk, and Mayville (1999) and Bird
(2003).53. Das-Gupta, Engelschalk, and Mayville (1999).54. Taliercio Jr. (2003b).55. Fjeldstad (2002) and World Bank (2004e).56. Gill (2003) and Engelschalk, Melhem, and Weist (2000).57. Bird and Engelschalk (2003).58. Bird (2003); Engelschalk, Melhem, and Weist (2000); and
Bird and Engelschalk (2003).59. Gill (2003).60. Bird (2003).61. APEC Committee on Trade and Investment (2003).62. World Bank (2004d), Table 2.9.63. World Bank (2004d), Table 1.9. The gains are estimated to be
between $114 billion (in 1997 US$) and $265 billion dependingupon assumptions about the dynamic effects.
64. Dollar, Hallward-Driemeier, and Mengistae (2003a).65. Engelschalk, Melhem, and Weist (2000) discuss computeriz-
ing customs and tax administration in greater detail.66. De Wulf (2003).67. De Wulf and Finateu (2002).
Chapter 6
1. Rajan and Zingales (2003).2. Harris (2003); World Bank (1994b); World Bank (2004j); and
World Bank (2003p).3. King and Levine (1993); Levine, Loayza, and Beck (2000);
Beck, Levine, and Loayza (2000); Bandiera and others (2000); andDemirgüç-Kunt and Maksimovic (1998).
4. Caprio and Honohan (2003).5. Li, Squire, and Zou (1998).6. Rajan and Zingales (2003).7. Easterly, Islam, and Stiglitz (2000).8. Dehejia and Gatti (2002).9. Stiglitz and Rothschild (1976) and Stiglitz and Weiss (1981).10. Rajan and Zingales (2003).11. Barth, Caprio Jr., and Levine (2001); Clarke and Cull (2002);
La Porta, López-de-Silanes, and Shleifer (2002); and Sapienza(2004).
12. Beck, Cull, and Afeikhena (2003); Beck, Crivelli, and Sum-merhill (2003); and Omran (2003).
13. Berger and others (forthcoming); Demirgüç-Kunt and Mak-simovic (forthcoming); and Berger, Hasan, and Klapper (2004).
14. Schreiner and Yaron (2001).15. Townsend and Yaron (2001).16. Harvey (1991) and World Bank (2001f).17. World Bank (1994a).18. Vittas and Je Cho (1995).19. Klapper and Zaidi (2004) and World Bank (1989).20. Caprio and Demirgüç-Kunt (1998) and World Bank (1989).
Endnotes 203
14_WDR_Endnotes.qxd 8/24/04 1:54 PM Page 203

21. In Nigeria, for example, 15 percent of guaranteed loans werereported to be in arrears; see Njoku and Obasi (1991).
22. Management Systems International (1996) and Magno andMeyer (1988).
23. Graham Bannock and Partners Ltd (1997).24. Black and Strahan (2002); Cetorelli and Strahan (2002);
Beck, Demirgüç-Kunt, and Levine (2003); Cetorelli (2003); andBerger, Hasan, and Klapper (2004).
25. Demirgüç-Kunt, Laeven, and Levine (2003).26. Berger and others (forthcoming).27. Barth, Caprio Jr., and Levine (2004) and Demirgüç-Kunt,
Laeven, and Levine (2003), respectively.28. Unite and Sullivan (2003).29. Clarke and others (2003); Clarke and others (forthcoming);
and Escude and others (2001).30. Faulkender and Petersen (2003).31. Carmichael and Pomerleano (2002).32. Impavido (2001) and Impavido, Musalem, and Tressel
(2003).33. Ekmekcioglu (2003).34. Shah (1997) and Srinivas, Whitehouse, and Yermo (2000).35. Impavido (2001).36. Deepthi and others (2003).37. Black, Jang, and Kim (2003); Johnson and others (2000); La
Porta and others (1997); La Porta and others (1998); and Stiglitz(1999a).
38. Shleifer and Wolfenzohn (2002).39. Demirgüç-Kunt and Maksimovic (1998); Demirgüç-Kunt
and Maksimovic (1999); Giannetti (2003); Claessens and Laeven(2003); Allayanis, Brown, and Klapper (2003); and Esty and Meg-ginson (2003).
40. Bae and Goyal (2003).41. For example, in Mexico domestic credit to the private sector as
a percentage of GDP was only 12.6 percent in 2002, as compared to35 percent in Brazil and 141 percent in the U.S. (IMF-IFS statistics).
42. Berkowitz and White (2002).43. Pistor, Raiser, and Gelfer (2000).44. Claessens and Laeven (2003).45. Durnev and Kim (2003); Gompers and Metrick (2001); Joh
(2003); Klapper and Love (forthcoming); and La Porta and others(1998).
46. McKinsey & Company (2002) and Aggarwal, Klapper, andWysocki (2003).
47. Levitt (1998); Frost, Gordon, and Hayes (2002); Hail andLuez (2003); and Lee and Ng (2002).
48. Rajan and Zingales (2003).49. Glaeser, Johnson, and Shleifer (2001).50. Miller (2003).51. Galindo and Miller (2001) and Love and Mylenko (2003).52. World Bank (2003a).53. A recent cross-country study finds that about 50 percent of
small firms report financing constraints in countries without acredit bureau as compared to 27 percent in countries with a bureau,and that 28 percent of firms are able to obtain a bank loan in coun-tries without a bureau versus 40 percent of firms in countries witha bureau. Love and Mylenko (2003).
54. Barron and Staten (2003); Bailey, Chun, and Wong (2003);Padilla and Pagano (2000); and Castelar-Pinheiro and Moura (2003).
55. Chami, Khan, and Sharma (2003).56. Barth, Caprio Jr., and Levine (2004) and Beck, Demirgüç-
Kunt, and Levine (2003).57. Stigler and Becker (1977); Stigler (1975); and Rajan and Zin-
gales (2003).58. Stigler (1971).59. Barth, Caprio Jr., and Levine (2001) and Barth, Caprio Jr.,
and Levine (2004).60. Martinez Peria and Schmukler (2001).61. Calomiris and Powell (2001).62. Saunders and Wilson (2002).63. Caprio and Honohan (2003).64. Stiglitz and Yusuf (2001).65. Caprio and Honohan (2003).66. Levy-Yeyati, Martinez Peria, and Schmukler (2004).67. Beck, Demirgüç-Kunt, and Levine (2003).68. See, for example, Tanzi and Davoodi (1997); Tanzi and
Davoodi (1998); and Devarajan, Swaroop, and Zou (1996).69. For discussions of the problem and the history of private
infrastructure, see Gómez-Ibáñez (2003); Gómez-Ibáñez andMeyer (1993); Klein and Roger (1994); Levy and Spiller (1994);Levy and Spiller (1996); Smith (1997b); Spiller and Savedoff(1999); and Willig (1999). The problems are greatest wheninvestors are asked to make large one-off investments and smallerwhen a series of small investments creates a “repeated game” thatencourages the government not to expropriate the investor.
70. See Wodon, Ajwad, and Siaens (2003). See also Clarke andWallsten (2003); Estache, Foster, and Wodon (2002); and WorldBank (1994b).
71. For empirical evidence of the effect of various features of theinvestment climate on infrastructure, see Bergara, Henisz, andSpiller (1998); Henisz (2002); Henisz and Zelner (2001); Weder andSchiffer (2000); and Zhang, Parker, and Kirkpatrick (2002).
72. See Lamech and Saeed (2003) for selected evidence on prior-ities of investors in electricity in developing countries.
73. Phillips (1993); Smith (1997a); and Smith (1997b).74. For a collection of published contracts, see http://rru.worldbank.
org/contracts/.75. See, for example, Klein and Hadjimichael (2003).76. Dollar, Hallward-Driemeier, and Mengistae (2003a). Time
to get a new telephone connection is used as a proxy for the qualityof telecommunications services generally.
77. Röller and Waverman (2001).78. Calderón and Servén (2003).79. International Telecommunication Union data from SIMA
database for 2001.80. World Bank Investment Climate Surveys.81. Rossotto and others (2003) citing Telegeography, and Inter-
national Telecommunication Union data.82. Wallsten (2001); Wallsten (2003); Bortolotti and others
(2002); Boylaud and Nicoletti (2001); Galal and others (1994);Ramamurti (1996); Ros (1999); Wellenius (1997b); Winston(1993); and Fink, Mattoo, and Rathindran (2002).
83. Komives, Whittington, and Wu (2003) and Clarke and Wall-sten (2003).
84. World Bank Investment Climate Surveys.85. World Bank Investment Climate Surveys and Batra, Kauf-
mann, and Stone (2002).
204 WORLD DEVELOPMENT REPORT 2005
14_WDR_Endnotes.qxd 8/24/04 1:54 PM Page 204

86. World Energy Council (2001).87. Reinikka and Svensson (2002).88. Dollar, Hallward-Driemeier, and Mengistae (2003a).89. Calderón and Servén (2003).90. Hunt and Shuttleworth (1996).91. See, for example, Besant-Jones and Tenenbaum (2001).92. Pollitt (2003); Newbery and Pollitt (1997); and Galal and
others (1994).93. World Bank (2004j), citing Spiller in Gilbert and Kahn (1996).94. Zhang, Parker, and Kirkpatrick (2002).95. Limão and Venables (2001).96. Clark, Dollar, and Micco (2002).97. Limão and Venables (2001).98. Radelet and Sachs (1998).99. Limão and Venables (2001). Infrastructure includes telecom-
munications as well as paved roads, unpaved roads, and railways—each having a weight of 25 percent in an index.
100. Limão and Venables (2001).101. World Bank (2004j).102. Clark, Dollar, and Micco (2002).103. Inter-American Development Bank (2001).104. Estache and Carbajo (1996) and Gaviria (1998), for example.105. Estache and Carbajo (1996); Trujillo and Serebrisky (2003);
and Gaviria (1998).106. World Bank and PPIAF (2003) discusses these options.107. Galal and others (1994).108. Gaviria (1998).109. Trujillo and Serebrisky (2003).110. Calderón and Servén (2003).111. Fernald (1999).112. Gómez-Ibáñez and Meyer (1993) and www.worldbank.
org/html/fpd/transport/roads_ss.htm.113. Tanzi and Davoodi (1997) and Tanzi and Davoodi (1998).114. Liautaud (2001).
Chapter 7
1. ILO (2004).2. Schneider (2002). See also ILO (2002a).3. Pritchett (2001); Easterly (2001); and Topel (1999).4. One more year of schooling is estimated to raise wages by 7-
10 percent in many countries. See Psacharopoulos and Patrinos(2002).
5. Recent studies focusing on OECD countries-where differ-ences in the quality of education are relatively smaller than acrossdeveloping countries-suggest strong positive effects of enhance-ment of human capital on GDP per capita growth. See Bassaniniand Scarpetta (2002) and De La Fuente and Doménech (2002).
6. Rosenzweig (1995)shows for India that schooling returns arehigh when the returns to learning are also high.
7. Pritchett (2001) and Pissarides (2000).8. Acemoglu and Shimer (1999). For empirical evidence for the
United States, see Abowd and others (2001) and Nestoriak (2004).9. Bresnahan, Brynjolfsson, and Hitt (2002).10. Van de Walle (2003).11. Nicholls (1998).12. World Bank (2003e).13. IFC (2001); World Bank (2002a); World Bank (2003e); and
El-Khawas, DePietro-Jurand, and Holm Nielsen (1998).
14. Tooley (1999).15. IFC (2001).16. Data are from the U.S. Department of Education.17. While one might expect a positive relation between the level
of mandated labor protection and income across countries (that is,labor protection is a normal good), the relationship is, in fact, neg-ative across a large group of countries.
18. Bourguignon and Goh (2003); de Ferranti and others(2000); Gill, Maloney, and Sanchez-Paramo (2002); Devarajan,Dollar, and Holmgren (2001); Rodrik (1997); Freeman (1994);Matusz and Tarr (1999); Rama (2003); and World Bank (2002d).
19. For a review of the role of unions see Aidt and Tzannatos(2002); Brown (2000); and Boeri, Brugiavini, and Calmfors (2001).
20. Aidt and Tzannatos (2002) and Forteza and Rama (2002).21. Calmfors (1993).22. Haltiwanger, Scarpetta, and Vodopivec (2003).23. Eslava and others (2003).24. In Colombia, for every percentage point rise in the mini-
mum wage, employment falls by 0.15 percentage points: Maloneyand Núñez (2004). For Indonesia, see Alatas and Cameron (2003).
25. This is possible because of noncompliance in the informaleconomy and exemption for certain workers.
26. The relationship between compliance and the level of theminimum wage is not one-to-one, and depends on the overallinstitutional climate and respect for laws.
27. In Poland the national minimum wage accounts for over 80percent of the going market wage in less developed areas, con-tributing to high unemployment among low skilled workers, WorldBank (2001b).
28. For more details on the role of the minimum wage as a pricesignal for the informal sector in Latin America, see Maloney andNúñez (2004), and World Bank (2004g).
29. See Feliciano (1998) for Mexico, and Gill, Montenegro, andDömeland (2002) for the experience of Latin American countriesthat have introduced apprentice wages.
30. The index of condition of employment reported in figure 7.5is the normalized sum of maximum number of hours in the work-week, overtime work, night shifts, holidays, hours of work, vacationdays, and whether paid time off for holidays is mandatory. For moredetails, see Djankov and others (2003a) and World Bank (2003a).
31. The 39 days in Sierra Leone refer to a worker with 20 years ofservice.
32. Heckman and Pagés (2004) estimate that workers absorbbetween 52 and 90 percent of the cost associated with nonwagebenefits in Latin America. Mondino and Montoya (2004) forArgentina, and MacIsaac and Rama (1997) for Ecuador suggest thatcompliance with labor regulations implies an increase in labor costswith possible disemployment effects.
33. In most countries, worker turnover is even larger than jobturnover, because workers not only move directly from one job toanother, but also between employment and unemployment andinactivity. See Alogoskoufis and others (1995).
34. Heckman and Pagés (2004), using an alternative measure ofjob security that takes into account the monetary transfer to bepaid to dismissed workers, confirm that such transfers tend to belarger in Latin America than in industrial countries.
35. The synthetic indicator of employment protection for workerswith permanent contracts is the normalized sum of: (a) procedural
Endnotes 205
14_WDR_Endnotes.qxd 8/24/04 1:54 PM Page 205
inconveniences; (b) notice and severance payments; (c) standardsof and penalties for “unfair” dismissals; and (d) procedures for col-lective dismissals. Indicators of employment protection for tempo-rary contracts refer to: (a) the “objective” reasons under which theycould be offered; and (b) the maximum cumulated duration of thecontract. See Djankov and others (2003a) and World Bank (2003a).
36. World Bank (2003j).37. World Bank (2002a).38. These results are from econometric analyses based on
industry-level data and controlling for other main drivers of pro-ductivity or entry rates. In particular, see Nicoletti and others(2001) for the evidence on the relationship between R&D and laborregulations, and Scarpetta and others (2002) and Scarpetta andTressel (2004) for evidence of the impact of employment protec-tion on productivity and entry rates.
39. Görg (2002) and Dewit, Gorg, and Montagna (2003) for evi-dence of the effects of employment protection on FDI.
40. See Nicoletti and others (2001) on self-employment; Nico-letti and others (2001) for the evidence on firm size; and Scarpettaand others (2002) for the evidence on size of entrant firms andpost-entry expansion. Christianson (2004) suggests strict labor reg-ulations in South Africa push small and medium size firms towardmore capital-intensive technologies.
41. Nonpayment of contractual obligations, or wage arrears,spread to nearly 60 percent of all workers in Russia in 1998 and,despite declining, continued to affect a significant share of theworkforce in the following years, see World Bank (2003j).
42. See Pagés and Montenegro (1999) and Montenegro andPagés (2004) for Latin America. Djankov and others (2003a) sug-gest that an increase of 1 point in the employment laws index(ranging from 0.76 to 2.40) is associated with an increase in theshare of the unofficial economy in GDP of 6.7 percentage pointsand an increase in the share of unofficial employment of 13.8 per-centage points.
43. Addison and Teixeria (2001) and Nickell and Layard (1999).44. Cavalcanti (2003) and Mondino and Montoya (2004).45. Besley and Burgess (2004).46. Kugler and Pica (2003) for evidence in Italy.47. Pierre and Scarpetta (2004). Evidence from South Africa also
suggests that more than 90 percent of large firms are reported tomake greater use of temporary workers to increase flexibility of theworkforce: see Chandra and others (2001). See also Saavedra andTorero (2004) for Peru, and World Bank (2003a) for other coun-tries.
48. Dolado, García-Serrano, and Jimeno (2001); Blanchard andLandier (2001); and Hopenhayn (2004).
49. Agénor (1996) argues that the effectiveness of structuraladjustment programs in developing countries is affected by thespecific characteristics of their labor markets.
50. Goldberg and Pavcnik (2003) for Colombia, and Aghion andothers (2003) for India.
51. Winter-Ebmer (2001).52. Kikeri (1998).53. Winter-Ebmer (2001) and Kikeri (1998).54. See Holzmann and Jorgensen (2001) and World Bank
(2001c). See also World Commission on the Social Dimension ofGlobalization (2004).
55. de Ferranti and others (2000) suggest that had Latin Amer-
ica and the Caribbean been able to diversify their idiosyncraticaggregate volatility in the 1990s, they would have enjoyed a 7 per-cent higher consumption.
56. Bigsten and others (2003) suggests that in African countrieswith underdeveloped credit and insurance markets, firms cannotinsure against temporary demand shocks and have to adjust wagesand employment.
57. Acemoglu and Shimer (1999) suggest that moderate levels ofunemployment benefits help improve job matches, with positiveeffects on productivity and output growth.
58. Tanzanian households with limited liquid assets (livestock)tend to grow proportionally more sweet potatoes, a low return andlow risk crop, than wealthier households, see Dercon (1996). In theIndian ICRISAT villages, reducing rainfall timing variability(through some mechanism of insurance) is estimated to have alarge effect on farm profits of the poor households, see Rosenzweigand Binswanger (1993).
59. See, for example, Ravallion (2003b) and World Bank (2002d).60. Klasen and Woolard (2001) suggest that the absence of
unemployment benefits in South Africa forces the unemployed tobase their location decisions on the availability of economic sup-port—generally available in rural areas, often in parental house-holds—rather than on the availability of job openings.
61. de Ferranti and others (2000) suggest that trade liberaliza-tion and greater competition in Latin American countries havereduced the possibility of de facto pooling unemployment risk viaseverance pay over a greater population by subsidizing potentiallybankrupt firms through higher prices.
62. In Slovenia, unpaid claims amount to more than one-thirdof total severance pay provisions: Vodopivec (2004). In Peru, poorworkers are less likely to be entitled to severance pay, and also lesslikely to receive it in case of dismissal: MacIsaac and Rama (2001).
63. Gruber (1997) finds that in the absence of unemployment insur-ance, average consumption expenditures would fall by 22 percent.
64. More than two-thirds of the households with at least oneunemployed worker received such benefits in Hungary and Polandin the mid-1990s, see Vodopivec (2004).
65. Martin and Grubb (2001).66. Mazza (1999).67. World Bank (1995b).68. Tabor (2002).69. Cox, Jimenez, and Jordan (1994) estimate that poverty inci-
dence would be 25 percent higher among those receiving transfershad they not received them.
70. Informal transfers are estimated to offer less than 10 percentof the size of typical income shocks in bad periods in India; and lessthan 3 percent in the Sahel region, following the 1984 drought,Morduch (1999a).
71. Ravallion (2003b), Ravallion and Datt (1995); Subbarao(1997); Teklu and Asefa (1999); Jalan and Ravallion (2003); andChirwa, Zgovu, and Mvula (2002).
72. Gaiha (2000).73. Subbarao, Ahmed, and Teklu (1995) for the Philippines and
World Bank (2002d) for African countries.74. Haddad and Adato (2001) find little relationship between
the district level share of public works activity and the relativepoverty, unemployment, and infrastructure need in a sample of 101public works projects in the Western Cape of South Africa.
206 WORLD DEVELOPMENT REPORT 2005
14_WDR_Endnotes.qxd 8/24/04 1:54 PM Page 206

75. Rawlings, Sherburne-Benz, and Van Domelen (2003).76. The percentage of beneficiaries beneath the national poverty
line ranged from 71 percent in Zambia to 55 percent in Nicaragua.77. Rawlings and Rubio (2002).78. Sedlacek, Ilahi, and Gustafsson-Wright (2000) and Bour-
guignon, Ferreira, and Leite (2002).
Chapter 8
1. Chang (2002).2. Taylor (1996).3. Recent publications show that the debate continues. Skeptical
views on the role of industrial policy in East Asian growth includeNoland and Pack (2003); Pack (2000); and Smith (2000). More pos-itive views are expressed in Lall (2003); Lall (2000); and Amsdenand Chu (2003). Wong and Ng (2001) stand somewhere inbetween. See also Hernandez (2004).
4. The potential for positive spillovers from FDI, exporting andR&D provides an economic rationale for selective interventions infavor of these activities. Proponents of selective interventions alsopoint to other possible market failures that might justify specialtreatment: different learning economies for each technology, seeLall (2000); coordination of competing investments, see Chang(1999); and helping latecomers achieve economies of scale inmature industries, see Amsden and Chu (2003).
5. Lipsey and Lancaster (1956).6. Reid and Gatrell (2003); Wolman (1988); and Kokko (2002).7. Hausmann and Rodrik (2003).8. References on Bangladesh, Colombia, and India are from
Hausmann and Rodrik (2003); on Japan from World Bank (1993);and on Kenya from English, Jaffee, and Okello (2004).
9. Noland and Pack (2003).10. WTO (2003) reviews literature on government efforts to
restrict competition in East Asia and concludes that cartelizationdid not improve economic performance in Japan, and had negativeconsequences in Korea.
11. For example, see World Bank (2004d); Noland and Pack(2003); Mody (1999); Wong and Ng (2001); and Lall (2000).
12. Irwin (2004).13. Rodríguez-Clare (2001).14. Greenstone and Moretti (2003).15. Reid and Gatrell (2003) describe the case of an automotive
company that threatened to relocate to a different U.S. city unless itreceived various incentives—which led an incentive package of$322.5 million. While 4,900 jobs were promised in 1997, in 2001the company announced that it would reduce the number ofemployees to 3,600. The authors suggest the threat to relocate wasmotivated by opportunism.
16. Thaler (1993).17. The technology policy in India’s ninth five-year plan (1997-
2002) included the following objectives: (a) optimal utilization ofscience and technology to control population growth, improvefood security, literacy, and so forth; (b) support best scientists andbe at the forefront of selected research fields; (c) concentrate ontechnological capabilities that can be commercially successful; (d)promote environmentally friendly technologies and the like; (e)develop innovative capabilities in education system; (f) increaseresources for R&D in private firms; (g) promote strategic sectorssuch as atomic energy and space. Cited by Mani (2001b).
18. Cardenas, Ocampo, and Thorp (2003) mention how notionsof performance-based and time-bound support were absent fromthe post-World War II import substitution strategies in LatinAmerica.
19. Jones and Sakong (1980).20. Shah (1995a).21. OECD (2003c). Non-OECD countries include Argentina,
Bolivia, Cambodia, Chile, Kenya, and South Africa.22. UNCTAD (2002a) and Noland and Pack (2003).23. OECD (2003e).24. Chen and others (2004).25. ILO (2002b).26. PPIAF and World Bank (2002).27. World Bank (2003i).28. Charitonenko and Campion (2003) and Yaron, Benjamin,
and Piprek (1997).29. Morduch (1999b).30. Adams (1988).31. Yaron, Benjamin, and Piprek (1997).32. World Bank (2003i).33. Anderson and Feder (2003).34. Alex, Zijp, and Byerlee (2002) and Anderson and Feder
(2003).35. Glaeser (2001).36. Batra and Mahmood (2003).37. Klein and Hadjimichael (2003).38. Nugent and Yhee (2002).39. Johnson, McMillan, and Woodruff (2002a).40. Hallberg (2000) and Batra and Mahmood (2003).41. Hallberg and Konishi (2003).42. Batra and Mahmood (2003).43. Scott and Storper (2003).44. Porter (1998) discusses the cluster literature. Clusters are
defined as “geographically proximate group of interconnectedcompanies, suppliers, service providers and associated institutionsin a particular field, linked by externalities of various types.” Porter(2003).
45. Sölvell, Lindqvist, and Ketels (2003).46. World Bank (2003b).47. For example, Altenburg and Meyer-Stamer (1999) identify
three types of clusters in Latin America: “survival clusters of SMEs,more advanced and differentiated mass production clusters, andclusters around transnational corporations.”
48. Altenburg and Meyer-Stamer (1999).49. The Mitchell Group Inc. (2003).50. The Mitchell Group Inc. (2003).51. Includes workers in export processing zones, special eco-
nomic zones, economic and technological development zones, andmaquiladoras (firms in Mexico that process or assemble importedcomponents that are then exported).
52. Madani (1999) mentions at least 18 Sub-Saharan Africancountries with some type of EPZ initiative. Political unrest haltedthe development of EPZ in Togo, and civil war in Liberia and SierraLeone. Macroeconomic distortions hindered EPZ development inKenya. Infrastructure and bureaucratic burden posed obstacles tothe development of EPZ in Senegal and Ghana. The success storiesof Mauritius and Madagascar are anomalies in the region.
53. Subramanian and Roy (2003).
Endnotes 207
14_WDR_Endnotes.qxd 8/24/04 1:54 PM Page 207
54. Jenkins and Kuo (2000); Panagariya (2000); Radelet (1999);and Harrold, Jayawickrama, and Bhattasali (1996).
55. English and De Wulf (2002).56. UNCTAD (1996); Christiansen, Oman, and Charlton
(2003); and Easson (2001).57. UNCTAD (2000c).58. Morisset (2003b).59. Fletcher (2002).60. UNCTAD (2002b).61. Wells and others (2001) and Bergsman (1999).62. MIGA (2002).63. Wunder (2001b).64. In Thailand a 1984 study from the Ministry of Finance
found that, in aggregate, the share of investment that would havetaken place even in the absence of incentives was 70 percent. Citedby Halvorsen (1995).
65. Zee, Stotsky, and Ley (2002) and Shah (1995a).66. Wells and others (2001).67. UNCTAD (2002b).68. Morisset (2003a).69. Morisset and Andrews-Johnson (2003).70. Morisset and Andrews-Johnson (2003). The authors mea-
sure the investment climate using the Heritage Foundation’s Indexof Economic Freedom, a composite measure that aggregates mea-sures of macroeconomic stability, openness, taxation, and otherfactors.
71. UNCTAD (2003b).72. Pursell (2001) and UNCTAD (2003b).73. Moran (2001).74. Moran (2001).75. Battat, Frank, and Shen (1996).76. Zee, Stotsky, and Ley (2002).77. Hall and Van Reenen (1999).78. Shah and Baffes (1995) and Shah (1995b) found R&D
incentives cost effective in Pakistan and Canada, respectively. How-ever, Hall and Van Reenen (1999) review the literature of tax incen-tives in the OECD and are more skeptical. Their review of studies oftax credits in the U.S. concludes that on average it producedroughly a dollar-for-dollar increase in reported R&D spendingsince their introduction in 1981.
79. OECD (2003f).80. Kim (1997) and Yusuf (2003). Yet heavy regulation and gov-
ernment funding may have constrained the development of privateventure capitalists. Israel is a counter-example; jump-starting aventure capital sector that was successful enough in attracting pri-vate capital to render public support unnecessary.Trajtenberg(2002).
81. David, Hall, and Toole (2000).82. Wallsten (2004) mentions that in the U.S. alone, there were
135 science parks in 1998. He finds that they are not a major sourceof high-tech employment. Literature evaluating science parks is notvery developed, and few studies look at their cost-effectiveness. deFerranti and others (2003).
83. Feser (2002).84. Yusuf (2003).85. de Ferranti and others (2003).
Chapter 9
1. Braithwaite and Drahos (2000) and Dollinger (1970).2. For example, in 1928 the Permanent Court of the Interna-
tional Court of Justice ruled that compensation was payable for theexpropriation by Poland of private property belonging to a Germanfirm in the Chorzow Factory Case. The court stated that “there canbe no doubt that the expropriation . . . is a derogation from therules generally applied in regard to the treatment of foreigners andthe principle of respect for vested rights.”
3. Putnam (1988); Ederington (2001); Staiger and Tabellini(1999); and Conconi and Perroni (2003).
4. Dixit and Nalebuff (1991); and Persson and Tabellini (2000).5. Under the auspices of the joint World Bank-IMF initiatives
on the Financial Sector Assessment Program and the Reports onthe Observance of Standards and Codes (ROSC), the OECD Princi-ples are used as a benchmark in assessing corporate governanceinstitutional frameworks and practices.
6. Shihata (1986) cites the example of the “Jecker” claim, whenan investment dispute was used by France for armed conflict inMexico in 1861–62.
7. For example, UNCITRAL Arbitration Rules, the 1958 NewYork Convention on the Recognition and Enforcement of ForeignArbitral Awards, and the International Court of Arbitration of theInternational Chamber of Commerce. For a review of internationalcommercial arbitration, see Paulsson (1996).
8. For background on ICSID, see Shihata (1986). Informationon ICSID can be found on its Web site (www.worldbank.org/icsid/)and in ICSID Review-Foreign Investment Law Journal, publishedby the Johns Hopkins University Press.
9. ICSID (2003).10. Recent cases have been based on interpretations of NAFTA,
rather than BITs, although similar issues can arise. The cases arediscussed in UNCTAD (2003e) and Hallward-Driemeier (2003).For those considered under ICSID jurisdiction, see alsowww.worldbank.org/icsid/cases/awards.htm.
11. Weingast (1995). For a skeptical view on the benefits of har-monization relative to competition, see Stephan (1999). For areview of the tradeoffs in the area of financial services, see White(1996).
12. Putnam (1988); see also Maggi and Rodríguez-Clare (1998).13. The International Chamber of Commerce dates from 1919,
and has been involved in promoting harmonization of various con-tractual terms to facilitate international trade (www.iccwbo.org).
14. UNCITRAL is a subsidiary body of the General Assembly ofthe United Nations, and was established in 1966 with the generalmandate to further the progressive harmonization and unificationof the law of international trade. UNCITRAL has since prepared awide range of conventions, model laws, and other instrumentsdealing with the substantive law that governs trade transactions orother aspects of business law having an impact on internationaltrade (www.uncitral.org).
15. Hoekman and others (2004); Schiff and Winters (2003); andBhagwati (2002).
16. Multilateral arrangements on environmental issues datefrom the 1972 U.N. Stockholm Conference.
17. Siebert (2003).
208 WORLD DEVELOPMENT REPORT 2005
14_WDR_Endnotes.qxd 8/24/04 1:54 PM Page 208

18. World Bank (2003b); WTO (2003); and Clarke and Evenett(2003b).
19. Hoekman and Mavroidis (2002) and Clarke and Evenett(2003a).
20. The tax harmonization debate in the EU has been ongoingfor many years. Recent analytical work suggests that the benefitsfrom tax coordination in the EU may be negligible, see Mendozaand Tesar (2003).
21. For example, although the national government in Brazilprohibited the states from exempting firms from the value-addedtax, the states were able to get around this using various mecha-nisms, including lending enterprises amounts equal to the tax theyowed on highly subsidized terms, see Tendler (2002).
22. OECD (2003d) and OECD and WTO (2003).
Chapter 10
1. World Bank (2003b).2. The G7 (Group of 7) has also endorsed the importance of
investment climate improvements; see communiqué issued in Sep-tember 2003. The importance of investment climate improvementsin achieving the Millenium Development Goals is also highlightedin the report of the United Nations Commission on the Private Sec-tor and Development (2004).
3. United Nations (2002b).4. World Bank (2004d); UNCTAD (2000a); and UNCTAD and
WTO (2000).5. IMF estimations from OECD PSE (Producer Support Esti-
mate); OECD (2002a); and OECD DAC (2003).6. Estimates based on dynamic gains in real income (relative to
base year of 1997) using the Global Trade Analysis Project (GTAP)database. They are based on a “pro-poor” scenario in which highincome countries reduce tariffs and eliminate tariff peaks. Agricul-ture has a maximum tariff of 10 percent, with an average tariff of 5percent, and manufacturing has a maximum tariff of 5 percentwith a 1 percent average tariff. Further, export subsidies are elimi-nated, domestic subsidies decoupled, and specific tariffs, tariff ratequotas, and antidumping duties and sanctions eliminated. SeeWorld Bank (2004d).
7. Hoekman (2000).8. Development assistance data is based on OECD DAC (2004)
and includes support provided as Official Development Finance(ODF). For this Report, Official Assistance provided to the subsetof more advanced developing countries and territories has beenexcluded. Commitment data in the OECD Creditor Reporting Sys-tem (CRS) was mapped to specific categories of assistance (policy-based support, capacity building, and infrastructure). For a discus-sion of the methodology and associated caveats see Migliorisi andGalmarini (2004).
9. World Bank (1998a).10. World Bank (2004a).
11. The approach piloted by the EU (for example, in BurkinaFaso) is based on outcome indicators that are agreed beforehandwith the recipient government; see Zongo and others (2000). Theapproach adopted under the Millennium Challenge Accountfocuses on country selectivity based on three main criteria: rulingjustly, encouraging economic freedom, and investing in people; formore details see www.mca.gov.
12. For a discussion of output-based aid and its applications seeBrook and Smith (2001).
13. About one-third of the policy-based support during theperiod was for financial sector-related operations, reflectingresponses to financial crises. The crises also explain the increase inpolicy-based lending, which had been trending downward.
14. An evaluation of World Bank adjustment lending shows thatbetween 1996 and 1999 about 40 percent of investment climateconditionality related to business environment, a third to privatiza-tion and public enterprise reforms, and one-quarter to supportingprivate participation in infrastructure. World Bank (2001a).
15. Devarajan, Dollar, and Holmgren (2001) and World Bank(1998a).
16. McMillan, Rodrik, and Welch (2002).17. World Bank (2003k) and Wolfensohn (1998).18. IDA and IMF (2003) and World Bank (2003l). The experi-
ence has not been uniformly adopted across all countries preparingPRSPs; see World Bank (2004h).
19. Pistor (2000).20. Technical Assistance is not subject to the 2001 OECD Devel-
opment Assistance Committee recommendation for its members tountie Official Development Assistance to Least Developed Coun-tries; see OECD DAC (2001). However, countries including theUnited Kingdom have already untied the provision of all develop-ment assistance, and similar proposals are being discussed in theEU and by the OECD. See European Commission (2004a) andUnited Kingdom - DFID (2001).
21. Batra and Mahmood (2003).22. A recent review of donor support for private sector develop-
ment observed: “One may question the sincerity of those donorswho claim to be working towards [private sector development] indeveloping countries, but whose instruments in the main center onthe promotion of exports and investments by their own private sec-tors. This is not to say that the involvement of the donor’s privatesector should be condemned by definition, but rather that it isfacile to claim that investments and exports contribute by defini-tion to recipient country PSD, let alone to poverty reduction.” SeeSchulpen and Gibbon (2002).
23. In particular, the Partnership in Statistics for Developmentin the 21st Century (PARIS21), (www.paris21.org).
24. United Nations (2002a).25. World Bank (2004c).
Endnotes 209
14_WDR_Endnotes.qxd 8/24/04 1:54 PM Page 209

210
The word processed describes informally reproduced works thatmay not be commonly available through libraries.
Abowd, John M., John Haltiwanger, Julia Lane, and Kristin San-dusky. 2001. “Within and Between Changes in Human Capital,Technology, and Productivity.” U.S. Census Bureau. Washington,D.C. Processed.
Acemoglu, Daron. 2001. “Directed Technical Change.” Cambridge,Mass.: National Bureau of Economic Research Working Paper 8287.
Acemoglu, Daron, and Simon Johnson. 2003. “Unbundling Institu-tions.” Cambridge, Mass.: National Bureau of EconomicResearch Working Paper Series 9934.
Acemoglu, Daron, Simon Johnson, and James A. Robinson. 2001.“The Colonial Origins of Comparative Development: An Empir-ical Investigation.” American Economic Review 91(5):1369–401.
————. 2002. “Reversal of Fortune: Geography and Institutionsin the Making of the Modern World Income Distribution.”Quarterly Journal of Economics 117(4):1231–94.
Acemoglu, Daron, and Robert Shimer. 1999. “Efficient Unemploy-ment Insurance.” Journal of Political Economy 107(5):893–28.
Acevedo, Germán C., and Patricio A. Eskenazi. 2003. “The ChileanUnemployment Insurance: A New Model of Income SupportAvailable for Unemployed Workers.” Paper presented at theInternational Workshop on Severance Pay Reform: TowardUnemployment Savings and Retirement Accounts. Vienna.November 7.
Acs, Zoltan J., and David B. Audretsch. 1987. “Innovation, MarketStructure and Firm Size.” Review of Economics and Statistics69(4):567–74.
Adams, Dale W. 1988. “The Conundrum of Successful Credit Pro-jects in Floundering Rural Financial Markets.” Economic Devel-opment and Cultural Change 36(2):355–67.
Addison, John T., and Paulino Teixeria. 2001. “The Economics ofEmployment Protection.” Bonn: Institute for the Study of LaborDiscussion Paper 381.
Adenikinju, Adeola F. 2003. “Electric Infrastructure Failures inNigeria: A Survey-Based Analysis of the Costs and AdjustmentResponses.” Energy Policy 31(14):1519–30.
Adlington, Gavin. 2002. “Land Workshop Material.” Paper pre-sented at the Regional Workshop on Land Issues in Europe andthe CIS. Budapest, Hungary. April 3.
Adserà, Alicia, Carles Boix, and Mark Payne. 2003. “Are you BeingServed? Political Accountability and Quality of Government.”Journal of Law, Economics, and Organization 19(2):445–90.
Aedo, Cristián, and Sergio Núñez. 2001. The Impact of TrainingPolicies in Latin America and the Caribbean: The Case of ‘Pro-grama Joven’. Washington, D.C.: Inter-American DevelopmentBank. Available on line at http://www.ilo.org/public/english/region/ampro/cinterfor/temas/youth/doc/aedo/aedo.pdf.
Agarwal, Manish, Ian Alexander, and Bernard Tenenbaum. 2003.“The Delhi Electricity Discom Privatizations: Some Observa-tions and Recommendations for Future Privatizations in Indiaand Elsewhere.” Washington, D.C.: World Bank, Energy andMining Sector Board Discussion Paper 8.
Agénor, Pierre. 1996. “The Labor Market and Economic Adjust-ment.” IMF Staff Papers 43(2):261–335.
Aggarwal, Reena, Leora Klapper, and Peter D. Wysocki. 2003. “Port-folio Preferences of Foreign Institutional Investors.” Washington,D.C.: World Bank Policy Research Working Paper Series 3101.
Aghion, Philipe, Robin Burgess, Stephen Redding, and FabrizioZilibotti. 2003. “The Unequal Effects of Liberalization: Theoryand Evidence from India.” Centre for Economic Policy Research.London. Processed.
Aghion, Philippe, and Robin Burgess. 2003. “Liberalization andIndustrial Performance: Evidence from India and the UK.” Har-vard University. Cambridge, Mass. Processed.
Aghion, Philippe and Steven Durlauf. Forthcoming. “Handbook ofEconomic Growth.” Amsterdam: North Holland.
Ahluwalia, Montek. 2002. “Economic Reforms in India Since 1991:Has Gradualism Worked?” Journal of Economic Perspectives16(3):67–88.
Ahmadi, Justice A. M. 1999. “ADR Programmes in India.” InUSAID and World Bank, eds., Background Material on ADR.Washington, D.C.: World Bank, Legal Institutions ThematicGroup.
Aidt, Toke, and Zafiris Tzannatos. 2002. Unions and Collective Bar-gaining—Economic Effects in a Global Environment. Washington,D.C.: World Bank.
Aitken, Brian, Gordon H. Hanson, and Ann E. Harrison. 1997.“Spillovers, Foreign Investment, and Export Behavior.” Journal ofInternational Economics 43(1-2):103–32.
References
15_WDR_References.qxd 8/24/04 3:07 PM Page 210
Aitken, Brian J., and Ann E. Harrison. 1999. “Do Domestic FirmsBenefit from Direct Foreign Investment? Evidence fromVenezuela.” American Economic Review 89(3):605–18.
Akiyama, Takamasa, John Baffes, Donald Larson, and PanayotisVarangis. 2003. “Commodity Market Reforms in Africa: SomeRecent Experience.” Economic Systems 27(1):83–115.
Alatas, Vivi, and Lisa Cameron. 2003. “The Impact of MinimumWages on Employment in a Low Income Country: An EvaluationUsing the Difference-in-Differences Approach.” Washington,D.C.: World Bank Policy Research Working Paper Series 2985.
Alesina, Alberto, Silvia Ardagna, Giuseppe Nicoletti, and FabioSchiantarelli. 2003a. “Regulation and Investment.” Cambridge,Mass.: National Bureau of Economic Research Working PaperSeries 9560.
Alesina, Alberto, Arnaud Devleeschauwer, William Easterly, SergioKurlat, and Rômain Wacziarg. 2003b.“Fractionalization.” Journalof Economic Growth 8(2):155–94.
Alex, Gary, Willem Zijp, and Derek Byerlee. 2002. “Rural Extensionand Advisory Services: New Directions.” Washington, D.C.:World Bank, Rural Development Strategy Background Paper 9.
Allayanis, George, Gregory W. Brown, and Leora F. Klapper. 2003.“Capital Structure, Foreign Debt and Financial Risk: Evidencefrom East Asia.” Journal of Finance 58(6):2667–709.
Alogoskoufis, George, Charles R. Bean, Giuseppe Bertola, DanielCohen, Juan José Dolado, and Gilles Saint-Paul. 1995. Unemploy-ment: Choices for Europe. Monitoring European Integration. Lon-don: Centre for Economic Policy Research.
Altenburg, Tilman, and Jorg Meyer-Stamer. 1999.“How to PromoteClusters: Policy Experiences from Latin America.” World Devel-opment 27(9):1693–713.
Amsden, Alice H., and Wan-wen Chu. 2003. Beyond Late Develop-ment: Taiwan’s Upgrading Policies. Cambridge, Mass.: MIT Press.
Anderson, Jock R., and Gershon Feder. 2003. “Rural Extension Ser-vices.” Washington, D.C.: World Bank Policy Research WorkingPaper Series 2976.
APEC Committee on Trade and Investment. 2003. Guide to theInvestment Regimes of the APEC Economies, 5th ed. Singapore:Asian Pacific Economic Co-operation Secretariat (APEC).
Argy, Steven, and Matthew Johnson. 2003. Mechanisms for Improv-ing the Quality of Regulations: Australia in an International Con-text. Melbourne: Productivity Commission.
Ariyoshi, Akira, Karl Habermeier, Bernard Laurens, Inci Otker-Robe, Jorge Ivan Canales-Krijenko, and Andrei Kirilenko. 2000.“Capital Controls: Country Experiences with their Use and Lib-eralization.” Washington, D.C.: International Monetary FundOccasional Paper 190.
Arora, Ashish, Marco Ceccagnoli, and Wesley M. Cohen. 2003.“R&D and the Patent Premium.” Cambridge, Mass.: NationalBureau of Economic Research Working Paper Series 9431.
Aw, Bee Yan, Sukkyun Chung, and Mark J. Roberts. 2000. “Produc-tivity and Turnover in the Export Market: Micro-level Evidencefrom the Republic of Korea and Taiwan (China).” World BankEconomic Review 14(1):65–90.
Ayyagari, Meghana, Thorsten Beck, and Asli Demirgüç-Kunt. 2002.“Small and Medium Enterprises across the Globe: A New Data-
base.” Washington, D.C.: World Bank Policy Research WorkingPaper Series 3127.
Ba, Seydou. 2000. “How Can Effective Strategies Be Developed forLaw and Justice Programs? Are There Models for Legal ReformPrograms? An Example of OHADA.” Paper presented at theComprehensive Legal and Juridical Development Conference.Washington, D.C. May 6.
Bae, Kee-Hong, and Vidhan K. Goyal. 2003. “Property Rights Pro-tection and Bank Loan Pricing.” Korea University and HongKong University of Science and Technology. Seoul. Processed.
Baharoglu, Deniz. 2002. “World Bank Experience in Land Manage-ment and The Debate on Tenure Security.” Washington, D.C.:World Bank, Urban and Local Government Background Series16.
Bailey, Andre, Suzi Chun, and Jeffery Wong. 2003. “Wanted: AsianCredit Bureaus.” The McKinsey Quarterly, July 9.
Baker, Joanne. 1996. Conveyancing Fees in a Competitive Market.Sydney: Law Foundation of New South Wales for the JusticeResearch Centre.
Baldwin, Richard E, and Paul Krugman. 2004. “Agglomeration,Integration, and Tax Harmonisation.” European EconomicReview 48(1):1–23.
Baldwin, Richard E. 2003. “Openess and Growth: What’s theEmpirical Relationship?” Cambridge, Mass.: National Bureau ofEconomic Research Working Paper Series 9578.
Bandiera, Oriana, Gerard Caprio, Patrick Honohan, and FabioSchiantarelli. 2000. “Does Financial Reform Raise or Reduce Sav-ings?” Review of Economics and Statistics 82(2):239–63.
Banfield, Edward C. 1958. The Moral Basis of a Backward Society.Glencoe, Ill.: Free Press.
Banks, Arthur. 2001. Cross-national Time-series Data Archive. Bing-hamton, N.Y.: Center for Comparative Political Research at theState University of New York.
Bannock Consulting. 2001. Best Practices in “One Stop Shops” forSME Development. Bulgaria Reform of Administrative Barriers toSME Development. London, UK: Bannock Consulting.
Bannock, Graham, Matthew Gamser, and Mariell Juhlin. 2004.“The Importance of the Enabling Environment for Business andEconomic Growth: A 10 Country Comparison of Central Europeand Africa.” Case Study Commissioned by the UK Departmentfor International Development for the 2005 World DevelopmentReport.
Barro, Robert, and Xavier Sala-i-Martin. 2003. Economic Growth.Cambridge, Mass.: MIT Press.
Barro, Robert J., and Jong-Wha Lee. 2001. “International Data onEducational Attainment: Updates and Implications.” Oxford Eco-nomic Papers 53(3):541–63.
Barron, John M., and Michael Staten. 2003. “The Value of Compre-hensive Credit Reports: Lessons from the U.S. Experience.” InMargaret Miller, ed., Credit Reporting Systems and the Interna-tional Economy. Cambridge, Mass.: MIT Press.
Bartelsman, Eric, John Haltiwanger, and Stefano Scarpetta. 2004.“Microeconomic Evidence of Creative Destruction in Industrialand Developing Countries.” Background paper for the WDR2005.
References 211
15_WDR_References.qxd 8/24/04 3:07 PM Page 211
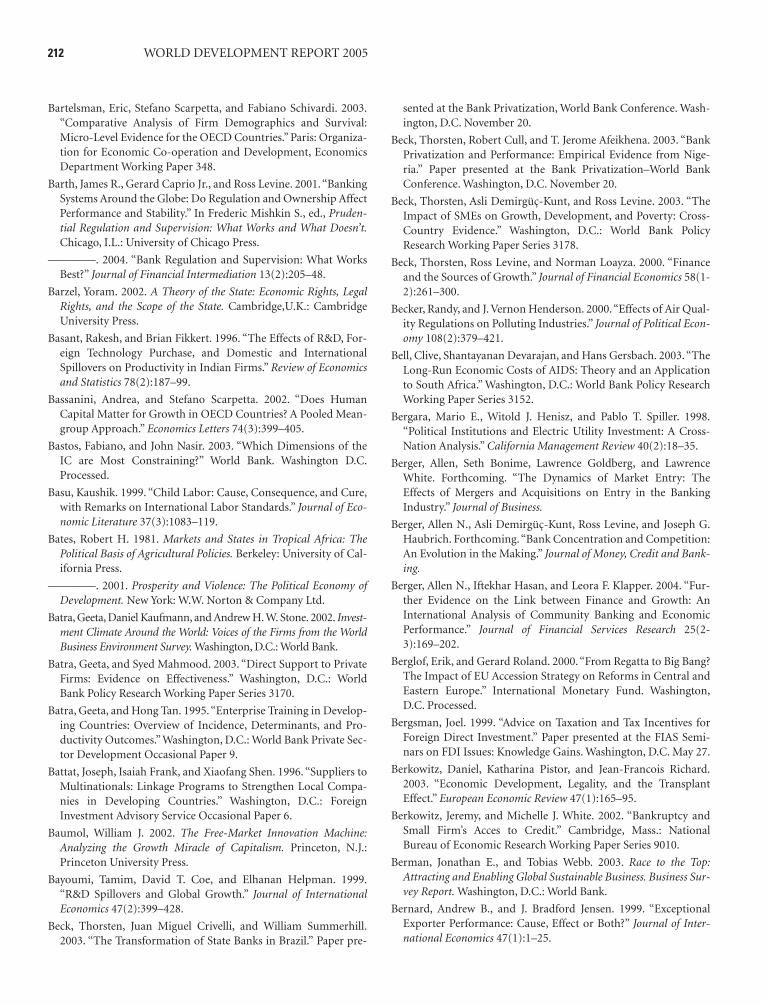
Bartelsman, Eric, Stefano Scarpetta, and Fabiano Schivardi. 2003.“Comparative Analysis of Firm Demographics and Survival:Micro-Level Evidence for the OECD Countries.” Paris: Organiza-tion for Economic Co-operation and Development, EconomicsDepartment Working Paper 348.
Barth, James R., Gerard Caprio Jr., and Ross Levine. 2001. “BankingSystems Around the Globe: Do Regulation and Ownership AffectPerformance and Stability.” In Frederic Mishkin S., ed., Pruden-tial Regulation and Supervision: What Works and What Doesn’t.Chicago, I.L.: University of Chicago Press.
————. 2004. “Bank Regulation and Supervision: What WorksBest?” Journal of Financial Intermediation 13(2):205–48.
Barzel, Yoram. 2002. A Theory of the State: Economic Rights, LegalRights, and the Scope of the State. Cambridge,U.K.: CambridgeUniversity Press.
Basant, Rakesh, and Brian Fikkert. 1996. “The Effects of R&D, For-eign Technology Purchase, and Domestic and InternationalSpillovers on Productivity in Indian Firms.” Review of Economicsand Statistics 78(2):187–99.
Bassanini, Andrea, and Stefano Scarpetta. 2002. “Does HumanCapital Matter for Growth in OECD Countries? A Pooled Mean-group Approach.” Economics Letters 74(3):399–405.
Bastos, Fabiano, and John Nasir. 2003. “Which Dimensions of theIC are Most Constraining?” World Bank. Washington D.C.Processed.
Basu, Kaushik. 1999. “Child Labor: Cause, Consequence, and Cure,with Remarks on International Labor Standards.” Journal of Eco-nomic Literature 37(3):1083–119.
Bates, Robert H. 1981. Markets and States in Tropical Africa: ThePolitical Basis of Agricultural Policies. Berkeley: University of Cal-ifornia Press.
————. 2001. Prosperity and Violence: The Political Economy ofDevelopment. New York: W.W. Norton & Company Ltd.
Batra, Geeta, Daniel Kaufmann, and Andrew H. W. Stone. 2002. Invest-ment Climate Around the World: Voices of the Firms from the WorldBusiness Environment Survey. Washington, D.C.: World Bank.
Batra, Geeta, and Syed Mahmood. 2003. “Direct Support to PrivateFirms: Evidence on Effectiveness.” Washington, D.C.: WorldBank Policy Research Working Paper Series 3170.
Batra, Geeta, and Hong Tan. 1995.“Enterprise Training in Develop-ing Countries: Overview of Incidence, Determinants, and Pro-ductivity Outcomes.” Washington, D.C.: World Bank Private Sec-tor Development Occasional Paper 9.
Battat, Joseph, Isaiah Frank, and Xiaofang Shen. 1996. “Suppliers toMultinationals: Linkage Programs to Strengthen Local Compa-nies in Developing Countries.” Washington, D.C.: ForeignInvestment Advisory Service Occasional Paper 6.
Baumol, William J. 2002. The Free-Market Innovation Machine:Analyzing the Growth Miracle of Capitalism. Princeton, N.J.:Princeton University Press.
Bayoumi, Tamim, David T. Coe, and Elhanan Helpman. 1999.“R&D Spillovers and Global Growth.” Journal of InternationalEconomics 47(2):399–428.
Beck, Thorsten, Juan Miguel Crivelli, and William Summerhill.2003. “The Transformation of State Banks in Brazil.” Paper pre-
sented at the Bank Privatization, World Bank Conference. Wash-ington, D.C. November 20.
Beck, Thorsten, Robert Cull, and T. Jerome Afeikhena. 2003. “BankPrivatization and Performance: Empirical Evidence from Nige-ria.” Paper presented at the Bank Privatization–World BankConference. Washington, D.C. November 20.
Beck, Thorsten, Asli Demirgüç-Kunt, and Ross Levine. 2003. “TheImpact of SMEs on Growth, Development, and Poverty: Cross-Country Evidence.” Washington, D.C.: World Bank PolicyResearch Working Paper Series 3178.
Beck, Thorsten, Ross Levine, and Norman Loayza. 2000. “Financeand the Sources of Growth.” Journal of Financial Economics 58(1-2):261–300.
Becker, Randy, and J. Vernon Henderson. 2000.“Effects of Air Qual-ity Regulations on Polluting Industries.” Journal of Political Econ-omy 108(2):379–421.
Bell, Clive, Shantayanan Devarajan, and Hans Gersbach. 2003. “TheLong-Run Economic Costs of AIDS: Theory and an Applicationto South Africa.” Washington, D.C.: World Bank Policy ResearchWorking Paper Series 3152.
Bergara, Mario E., Witold J. Henisz, and Pablo T. Spiller. 1998.“Political Institutions and Electric Utility Investment: A Cross-Nation Analysis.” California Management Review 40(2):18–35.
Berger, Allen, Seth Bonime, Lawrence Goldberg, and LawrenceWhite. Forthcoming. “The Dynamics of Market Entry: TheEffects of Mergers and Acquisitions on Entry in the BankingIndustry.” Journal of Business.
Berger, Allen N., Asli Demirgüç-Kunt, Ross Levine, and Joseph G.Haubrich. Forthcoming.“Bank Concentration and Competition:An Evolution in the Making.” Journal of Money, Credit and Bank-ing.
Berger, Allen N., Iftekhar Hasan, and Leora F. Klapper. 2004. “Fur-ther Evidence on the Link between Finance and Growth: AnInternational Analysis of Community Banking and EconomicPerformance.” Journal of Financial Services Research 25(2-3):169–202.
Berglof, Erik, and Gerard Roland. 2000. “From Regatta to Big Bang?The Impact of EU Accession Strategy on Reforms in Central andEastern Europe.” International Monetary Fund. Washington,D.C. Processed.
Bergsman, Joel. 1999. “Advice on Taxation and Tax Incentives forForeign Direct Investment.” Paper presented at the FIAS Semi-nars on FDI Issues: Knowledge Gains. Washington, D.C. May 27.
Berkowitz, Daniel, Katharina Pistor, and Jean-Francois Richard.2003. “Economic Development, Legality, and the TransplantEffect.” European Economic Review 47(1):165–95.
Berkowitz, Jeremy, and Michelle J. White. 2002. “Bankruptcy andSmall Firm’s Acces to Credit.” Cambridge, Mass.: NationalBureau of Economic Research Working Paper Series 9010.
Berman, Jonathan E., and Tobias Webb. 2003. Race to the Top:Attracting and Enabling Global Sustainable Business. Business Sur-vey Report. Washington, D.C.: World Bank.
Bernard, Andrew B., and J. Bradford Jensen. 1999. “ExceptionalExporter Performance: Cause, Effect or Both?” Journal of Inter-national Economics 47(1):1–25.
212 WORLD DEVELOPMENT REPORT 2005
15_WDR_References.qxd 8/24/04 3:07 PM Page 212

Bernstein, Peter L. 1996. Against the Gods: The Remarkable Story ofRisk. New York: John Wiley & Sons.
Bertola, Giuseppe, Tito Boeri, and Sandrine Cazes. 2000. “Employ-ment Protection in Industrialized Countries: The Case for NewIndicators.” International Labour Review 139(1):57–72.
Besant-Jones, John, and Bernard Tenenbaum. 2001. “The Califor-nia Power Crisis: Lessons for Developing Countries.” Washing-ton, D.C.: World Bank, Energy and Mining Sector Board Discus-sion Paper 1.
Besley, Timothy. 1995. “Property Rights and Investment Incentives:Theory and Evidence from Ghana.” Journal of Political Economy103(5):903–37.
Besley, Timothy, and Robin Burgess. 2004. “Can Labor RegulationHinder Economic Performance? Evidence from India.” QuarterlyJournal of Economics 119(1):91–134.
Betcherman, Gordon, Karina Olivas, and Amit Dar. 2003. “Impactsof Active Labor Market Programs: New Evidence from Evalua-tions with Particular Attention to Developing and TransitionCountries.” Washington, D.C.: World Bank, Social ProtectionNetwork Paper Series 402.
Bhagwati, Jagdish. 2002. Free Trade Today. Princeton, N.J.: Prince-ton University Press.
Bhatnagar, Subnash, and Rajeb Chawla. 2004. “Bhoomi: OnlineDelivery of Land Titles in Karnataka, India.” Ahmedabad IndianInstitute of Management and Government of Karnataka.Ahmedabad, India and Karnataka, India. Processed.
Biers, Dan, and Sadanard Dhume. 2000. “In India, a Bit of Califor-nia.” Far Eastern Economic Review 163(44):38–40.
Biggs, Tyler. 2003. “Is Small Beautiful and Worthy of Subsidy? Liter-ature Review.” World Bank. Washington, D.C. Processed.
Biggs, Tyler, Vijaya Ramachandran, and Manju Kedia Shah. 1998.“The Determinants of Enterprise Growth in Sub-Saharan Africa:Evidence from the Regional Program on Enterprise Develop-ment.” Washington, D.C.: World Bank, Regional Program forEnterprise Development Discussion Paper 103.
Biggs, Tyler, Manju Kedia Shah, and Pradeep Srivastava. 1995.“Technological Capabilities and Learning in African Enter-prises.” Washington, D.C.: World Bank, Africa DepartmentSeries, Technical Paper 288.
Bigsten, Arne, Paul Collier, Stefano Dercon, Marcel Fafchamps,Bernard Gauthier, Jan Willem Gunning, Abena Oduro, Remco Oos-tendorp, Cathy Patillo, Måns Soderbom, Francis Teal, and AlbertZeufack. 2000. “Contract Flexibility and Dispute Resolution inAfrican Manufacturing.” Journal of Development Studies 36(4):1–37.
————. 2003. “Risk Sharing in Labor Markets.” World Bank Eco-nomic Review 17(3):349–66.
Bineswaree, Bolasky, and Caroline Freund. 2004. “Trade, Regula-tions and Growth.” Washington, D.C.: World Bank PolicyResearch Working Paper Series 3255.
Binswanger, Hans P., Klaus Deininger, and Gershon Feder. 1995.“Power, Distortions, Revolt, and Reform in Agricultural LandRelations.” In Jere Behrman and T. N. Srinivasan, eds., Handbookof Development Economics vol. 3B. Amsterdam: Elsevier B.V.
Bird, Richard M. 2003. “Administrative Dimensions of TaxReform.” University of Toronto. Toronto, Canada. Processed.
Bird, Richard M., and Michael Engelschalk. 2003. “Tax Policy andTax Administration: Lessons from the Last Decade.” World Bank.Washington, D.C. Processed.
Black, Bernard, Hansung Jang, and Woochan Kim. 2003. “DoesCorporate Governance Affect Firms’ Market Values? Evidencefrom Korea.” Stanford, C.A.: Stanford Law and EconomicsSchool, Olin Working Paper 237.
Black, Sandra E. 1999. “Investigating the Link Between Competi-tion and Discrimination.” Monthly Labor Review, December.
Black, Sandra E., and Philip E. Strahan. 2002. “Entrepreneurshipand Bank Credit Availability.” Journal of Finance 57(6):2807–33.
Blalock, Garrick, and Paul Gertler. 2003.“Technology From ForeignDirect Investment and Welfare Gains Through the SupplyChain.” University of California. Berkeley, C.A. Processed.
Blanchard, Olivier. 1986. “Investment, Output, and the Cost ofCapital: A Comment.” Brookings Papers on Economic Activity0(1):153–58.
Blanchard, Olivier, and Francesco Giavazzi. 2003. “MacroeconomicEffects of Regulation and Deregulation in Goods and LaborMarkets.” Quarterly Journal of Economics 118(3):879–907.
Blanchard, Olivier J., and Augustin Landier. 2001. “The PerverseEffects of Partial Labor Market Reform: Fixed-term Contracts inFrance.” Economic Journal 112(480):214–44.
Blomström, Magnus, and Ari Kokko. 1998.“Multinational Corpora-tions and Spillovers.” Journal of Economic Surveys 12(3):247–77.
Bloom, David E., Lakshmi. R. Bloom, Davod Steven, and MarkWeston. 2003. Business and HIV/AIDS: Who Me? Geneva: WorldEconomic Forum.
Boeri, Tito, Agar Brugiavini, and Lars Calmfors, eds. 2001. The Roleof Unions in the Twenty-First Century. New York: Oxford Univer-sity Press.
Boix, Carles. 2003. Democracy and Redistribution. New York : Cam-bridge University Press.
Bortolotti, Bernardo, Juliet D’Souza, William L. Megginson, andMarcella Fantini. 2002. “Privatization and the Sources of Perfor-mance Improvement in the Global Telecommunications Indus-try.” Telecommunications Policy 26(5-6):243–68.
Bosworth, Barry, and Susan M. Collins. 2003. “The Empirics ofGrowth: An Update.” The Brookings Institution. Washington,D.C. Processed.
Botswana–Ministry of Lands, Housing and Environment. 2002.Botswana National Land Policy. Gaborone: Natural ResourcesServices Ltd. for the Ministry of Lands, Housing and Environ-ment. Department of Lands.
Bourguignon, Francois. 2000. “Crime, Violence, and InequitableDevelopment.” In Joseph Stiglitz, ed., Annual World Bank Confer-ence on Development Economics. Washington, D.C.: World Bank.
————. 2004. “The Poverty-Growth-Inequality Triangle.” Paperpresented at the Indian Council for Research on InternationalEconomic Relations Conference. New Delhi, India. February 4.
Bourguignon, Francois, Francisco Ferreira, and P. G. Leite. 2002.Ex-ante Evaluation of Conditional Cash Transfer Programs: TheCase of Bolsa Escola. Washington, D.C.: World Bank.
Bourguignon, Francois, and C. Goh. 2003. Trade and Labor Mar-ket Vulnerability in Korea, Indonesia, and Thailand: Evaluating
References 213
15_WDR_References.qxd 8/24/04 3:07 PM Page 213
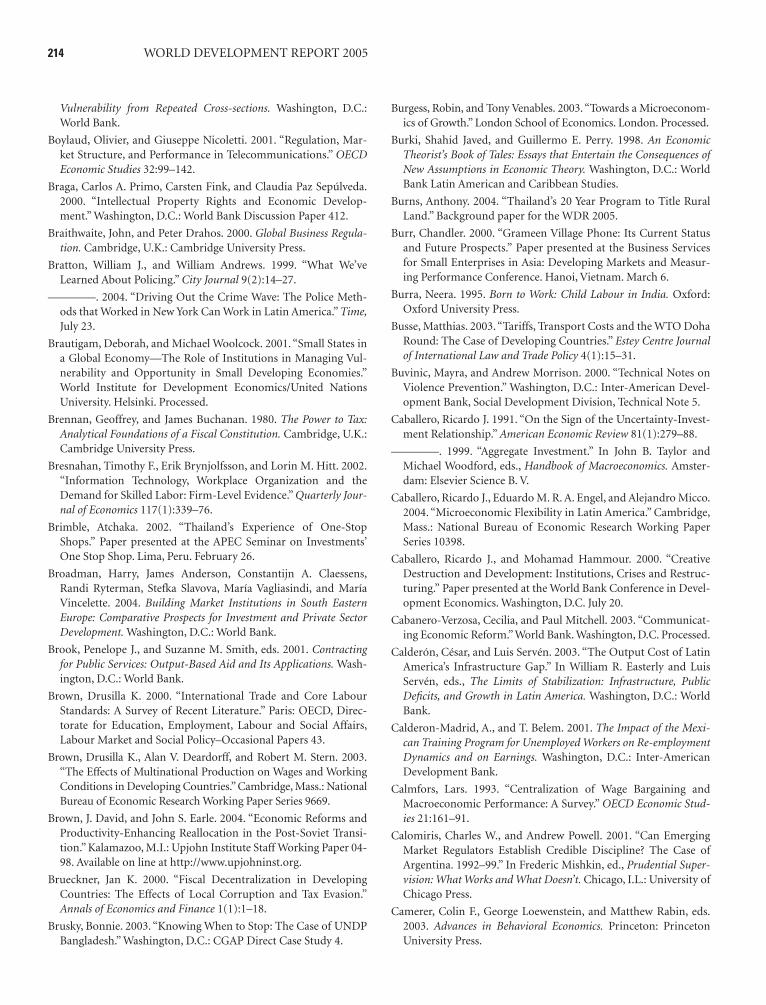
Vulnerability from Repeated Cross-sections. Washington, D.C.:World Bank.
Boylaud, Olivier, and Giuseppe Nicoletti. 2001. “Regulation, Mar-ket Structure, and Performance in Telecommunications.” OECDEconomic Studies 32:99–142.
Braga, Carlos A. Primo, Carsten Fink, and Claudia Paz Sepúlveda.2000. “Intellectual Property Rights and Economic Develop-ment.” Washington, D.C.: World Bank Discussion Paper 412.
Braithwaite, John, and Peter Drahos. 2000. Global Business Regula-tion. Cambridge, U.K.: Cambridge University Press.
Bratton, William J., and William Andrews. 1999. “What We’veLearned About Policing.” City Journal 9(2):14–27.
————. 2004. “Driving Out the Crime Wave: The Police Meth-ods that Worked in New York Can Work in Latin America.” Time,July 23.
Brautigam, Deborah, and Michael Woolcock. 2001. “Small States ina Global Economy—The Role of Institutions in Managing Vul-nerability and Opportunity in Small Developing Economies.”World Institute for Development Economics/United NationsUniversity. Helsinki. Processed.
Brennan, Geoffrey, and James Buchanan. 1980. The Power to Tax:Analytical Foundations of a Fiscal Constitution. Cambridge, U.K.:Cambridge University Press.
Bresnahan, Timothy F., Erik Brynjolfsson, and Lorin M. Hitt. 2002.“Information Technology, Workplace Organization and theDemand for Skilled Labor: Firm-Level Evidence.” Quarterly Jour-nal of Economics 117(1):339–76.
Brimble, Atchaka. 2002. “Thailand’s Experience of One-StopShops.” Paper presented at the APEC Seminar on Investments’One Stop Shop. Lima, Peru. February 26.
Broadman, Harry, James Anderson, Constantijn A. Claessens,Randi Ryterman, Stefka Slavova, María Vagliasindi, and MaríaVincelette. 2004. Building Market Institutions in South EasternEurope: Comparative Prospects for Investment and Private SectorDevelopment. Washington, D.C.: World Bank.
Brook, Penelope J., and Suzanne M. Smith, eds. 2001. Contractingfor Public Services: Output-Based Aid and Its Applications. Wash-ington, D.C.: World Bank.
Brown, Drusilla K. 2000. “International Trade and Core LabourStandards: A Survey of Recent Literature.” Paris: OECD, Direc-torate for Education, Employment, Labour and Social Affairs,Labour Market and Social Policy–Occasional Papers 43.
Brown, Drusilla K., Alan V. Deardorff, and Robert M. Stern. 2003.“The Effects of Multinational Production on Wages and WorkingConditions in Developing Countries.” Cambridge, Mass.: NationalBureau of Economic Research Working Paper Series 9669.
Brown, J. David, and John S. Earle. 2004. “Economic Reforms andProductivity-Enhancing Reallocation in the Post-Soviet Transi-tion.” Kalamazoo, M.I.: Upjohn Institute Staff Working Paper 04-98. Available on line at http://www.upjohninst.org.
Brueckner, Jan K. 2000. “Fiscal Decentralization in DevelopingCountries: The Effects of Local Corruption and Tax Evasion.”Annals of Economics and Finance 1(1):1–18.
Brusky, Bonnie. 2003. “Knowing When to Stop: The Case of UNDPBangladesh.” Washington, D.C.: CGAP Direct Case Study 4.
Burgess, Robin, and Tony Venables. 2003. “Towards a Microeconom-ics of Growth.” London School of Economics. London. Processed.
Burki, Shahid Javed, and Guillermo E. Perry. 1998. An EconomicTheorist’s Book of Tales: Essays that Entertain the Consequences ofNew Assumptions in Economic Theory. Washington, D.C.: WorldBank Latin American and Caribbean Studies.
Burns, Anthony. 2004. “Thailand’s 20 Year Program to Title RuralLand.” Background paper for the WDR 2005.
Burr, Chandler. 2000. “Grameen Village Phone: Its Current Statusand Future Prospects.” Paper presented at the Business Servicesfor Small Enterprises in Asia: Developing Markets and Measur-ing Performance Conference. Hanoi, Vietnam. March 6.
Burra, Neera. 1995. Born to Work: Child Labour in India. Oxford:Oxford University Press.
Busse, Matthias. 2003. “Tariffs, Transport Costs and the WTO DohaRound: The Case of Developing Countries.” Estey Centre Journalof International Law and Trade Policy 4(1):15–31.
Buvinic, Mayra, and Andrew Morrison. 2000. “Technical Notes onViolence Prevention.” Washington, D.C.: Inter-American Devel-opment Bank, Social Development Division, Technical Note 5.
Caballero, Ricardo J. 1991. “On the Sign of the Uncertainty-Invest-ment Relationship.” American Economic Review 81(1):279–88.
————. 1999. “Aggregate Investment.” In John B. Taylor andMichael Woodford, eds., Handbook of Macroeconomics. Amster-dam: Elsevier Science B. V.
Caballero, Ricardo J., Eduardo M. R. A. Engel, and Alejandro Micco.2004. “Microeconomic Flexibility in Latin America.” Cambridge,Mass.: National Bureau of Economic Research Working PaperSeries 10398.
Caballero, Ricardo J., and Mohamad Hammour. 2000. “CreativeDestruction and Development: Institutions, Crises and Restruc-turing.” Paper presented at the World Bank Conference in Devel-opment Economics. Washington, D.C. July 20.
Cabanero-Verzosa, Cecilia, and Paul Mitchell. 2003. “Communicat-ing Economic Reform.” World Bank. Washington, D.C. Processed.
Calderón, César, and Luis Servén. 2003. “The Output Cost of LatinAmerica’s Infrastructure Gap.” In William R. Easterly and LuisServén, eds., The Limits of Stabilization: Infrastructure, PublicDeficits, and Growth in Latin America. Washington, D.C.: WorldBank.
Calderon-Madrid, A., and T. Belem. 2001. The Impact of the Mexi-can Training Program for Unemployed Workers on Re-employmentDynamics and on Earnings. Washington, D.C.: Inter-AmericanDevelopment Bank.
Calmfors, Lars. 1993. “Centralization of Wage Bargaining andMacroeconomic Performance: A Survey.” OECD Economic Stud-ies 21:161–91.
Calomiris, Charles W., and Andrew Powell. 2001. “Can EmergingMarket Regulators Establish Credible Discipline? The Case ofArgentina. 1992–99.” In Frederic Mishkin, ed., Prudential Super-vision: What Works and What Doesn’t. Chicago, I.L.: University ofChicago Press.
Camerer, Colin F., George Loewenstein, and Matthew Rabin, eds.2003. Advances in Behavioral Economics. Princeton: PrincetonUniversity Press.
214 WORLD DEVELOPMENT REPORT 2005
15_WDR_References.qxd 8/24/04 3:07 PM Page 214
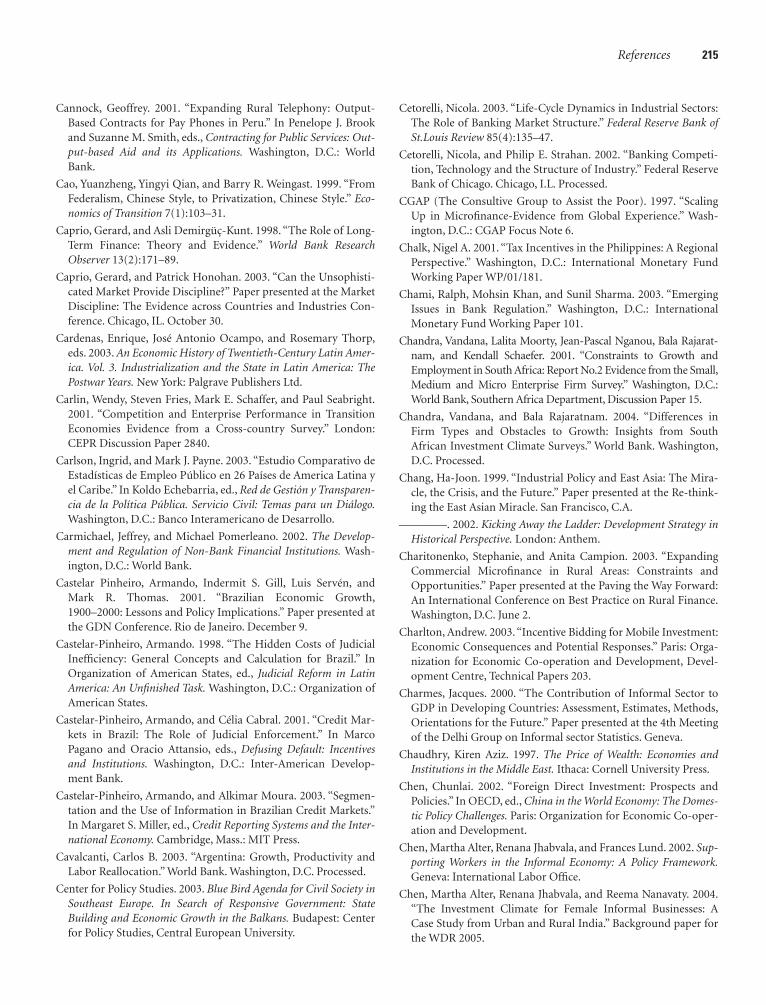
Cannock, Geoffrey. 2001. “Expanding Rural Telephony: Output-Based Contracts for Pay Phones in Peru.” In Penelope J. Brookand Suzanne M. Smith, eds., Contracting for Public Services: Out-put-based Aid and its Applications. Washington, D.C.: WorldBank.
Cao, Yuanzheng, Yingyi Qian, and Barry R. Weingast. 1999. “FromFederalism, Chinese Style, to Privatization, Chinese Style.” Eco-nomics of Transition 7(1):103–31.
Caprio, Gerard, and Asli Demirgüç-Kunt. 1998. “The Role of Long-Term Finance: Theory and Evidence.” World Bank ResearchObserver 13(2):171–89.
Caprio, Gerard, and Patrick Honohan. 2003. “Can the Unsophisti-cated Market Provide Discipline?” Paper presented at the MarketDiscipline: The Evidence across Countries and Industries Con-ference. Chicago, IL. October 30.
Cardenas, Enrique, José Antonio Ocampo, and Rosemary Thorp,eds. 2003. An Economic History of Twentieth-Century Latin Amer-ica. Vol. 3. Industrialization and the State in Latin America: ThePostwar Years. New York: Palgrave Publishers Ltd.
Carlin, Wendy, Steven Fries, Mark E. Schaffer, and Paul Seabright.2001. “Competition and Enterprise Performance in TransitionEconomies Evidence from a Cross-country Survey.” London:CEPR Discussion Paper 2840.
Carlson, Ingrid, and Mark J. Payne. 2003. “Estudio Comparativo deEstadísticas de Empleo Público en 26 Países de America Latina yel Caribe.” In Koldo Echebarria, ed., Red de Gestión y Transparen-cia de la Política Pública. Servicio Civil: Temas para un Diálogo.Washington, D.C.: Banco Interamericano de Desarrollo.
Carmichael, Jeffrey, and Michael Pomerleano. 2002. The Develop-ment and Regulation of Non-Bank Financial Institutions. Wash-ington, D.C.: World Bank.
Castelar Pinheiro, Armando, Indermit S. Gill, Luis Servén, andMark R. Thomas. 2001. “Brazilian Economic Growth,1900–2000: Lessons and Policy Implications.” Paper presented atthe GDN Conference. Rio de Janeiro. December 9.
Castelar-Pinheiro, Armando. 1998. “The Hidden Costs of JudicialInefficiency: General Concepts and Calculation for Brazil.” InOrganization of American States, ed., Judicial Reform in LatinAmerica: An Unfinished Task. Washington, D.C.: Organization ofAmerican States.
Castelar-Pinheiro, Armando, and Célia Cabral. 2001. “Credit Mar-kets in Brazil: The Role of Judicial Enforcement.” In MarcoPagano and Oracio Attansio, eds., Defusing Default: Incentivesand Institutions. Washington, D.C.: Inter-American Develop-ment Bank.
Castelar-Pinheiro, Armando, and Alkimar Moura. 2003. “Segmen-tation and the Use of Information in Brazilian Credit Markets.”In Margaret S. Miller, ed., Credit Reporting Systems and the Inter-national Economy. Cambridge, Mass.: MIT Press.
Cavalcanti, Carlos B. 2003. “Argentina: Growth, Productivity andLabor Reallocation.” World Bank. Washington, D.C. Processed.
Center for Policy Studies. 2003. Blue Bird Agenda for Civil Society inSoutheast Europe. In Search of Responsive Government: StateBuilding and Economic Growth in the Balkans. Budapest: Centerfor Policy Studies, Central European University.
Cetorelli, Nicola. 2003. “Life-Cycle Dynamics in Industrial Sectors:The Role of Banking Market Structure.” Federal Reserve Bank ofSt.Louis Review 85(4):135–47.
Cetorelli, Nicola, and Philip E. Strahan. 2002. “Banking Competi-tion, Technology and the Structure of Industry.” Federal ReserveBank of Chicago. Chicago, I.L. Processed.
CGAP (The Consultive Group to Assist the Poor). 1997. “ScalingUp in Microfinance-Evidence from Global Experience.” Wash-ington, D.C.: CGAP Focus Note 6.
Chalk, Nigel A. 2001. “Tax Incentives in the Philippines: A RegionalPerspective.” Washington, D.C.: International Monetary FundWorking Paper WP/01/181.
Chami, Ralph, Mohsin Khan, and Sunil Sharma. 2003. “EmergingIssues in Bank Regulation.” Washington, D.C.: InternationalMonetary Fund Working Paper 101.
Chandra, Vandana, Lalita Moorty, Jean-Pascal Nganou, Bala Rajarat-nam, and Kendall Schaefer. 2001. “Constraints to Growth andEmployment in South Africa: Report No.2 Evidence from the Small,Medium and Micro Enterprise Firm Survey.” Washington, D.C.:World Bank, Southern Africa Department, Discussion Paper 15.
Chandra, Vandana, and Bala Rajaratnam. 2004. “Differences inFirm Types and Obstacles to Growth: Insights from SouthAfrican Investment Climate Surveys.” World Bank. Washington,D.C. Processed.
Chang, Ha-Joon. 1999. “Industrial Policy and East Asia: The Mira-cle, the Crisis, and the Future.” Paper presented at the Re-think-ing the East Asian Miracle. San Francisco, C.A.
————. 2002. Kicking Away the Ladder: Development Strategy inHistorical Perspective. London: Anthem.
Charitonenko, Stephanie, and Anita Campion. 2003. “ExpandingCommercial Microfinance in Rural Areas: Constraints andOpportunities.” Paper presented at the Paving the Way Forward:An International Conference on Best Practice on Rural Finance.Washington, D.C. June 2.
Charlton, Andrew. 2003. “Incentive Bidding for Mobile Investment:Economic Consequences and Potential Responses.” Paris: Orga-nization for Economic Co-operation and Development, Devel-opment Centre, Technical Papers 203.
Charmes, Jacques. 2000. “The Contribution of Informal Sector toGDP in Developing Countries: Assessment, Estimates, Methods,Orientations for the Future.” Paper presented at the 4th Meetingof the Delhi Group on Informal sector Statistics. Geneva.
Chaudhry, Kiren Aziz. 1997. The Price of Wealth: Economies andInstitutions in the Middle East. Ithaca: Cornell University Press.
Chen, Chunlai. 2002. “Foreign Direct Investment: Prospects andPolicies.” In OECD, ed., China in the World Economy: The Domes-tic Policy Challenges. Paris: Organization for Economic Co-oper-ation and Development.
Chen, Martha Alter, Renana Jhabvala, and Frances Lund. 2002. Sup-porting Workers in the Informal Economy: A Policy Framework.Geneva: International Labor Office.
Chen, Martha Alter, Renana Jhabvala, and Reema Nanavaty. 2004.“The Investment Climate for Female Informal Businesses: ACase Study from Urban and Rural India.” Background paper forthe WDR 2005.
References 215
15_WDR_References.qxd 8/24/04 3:07 PM Page 215
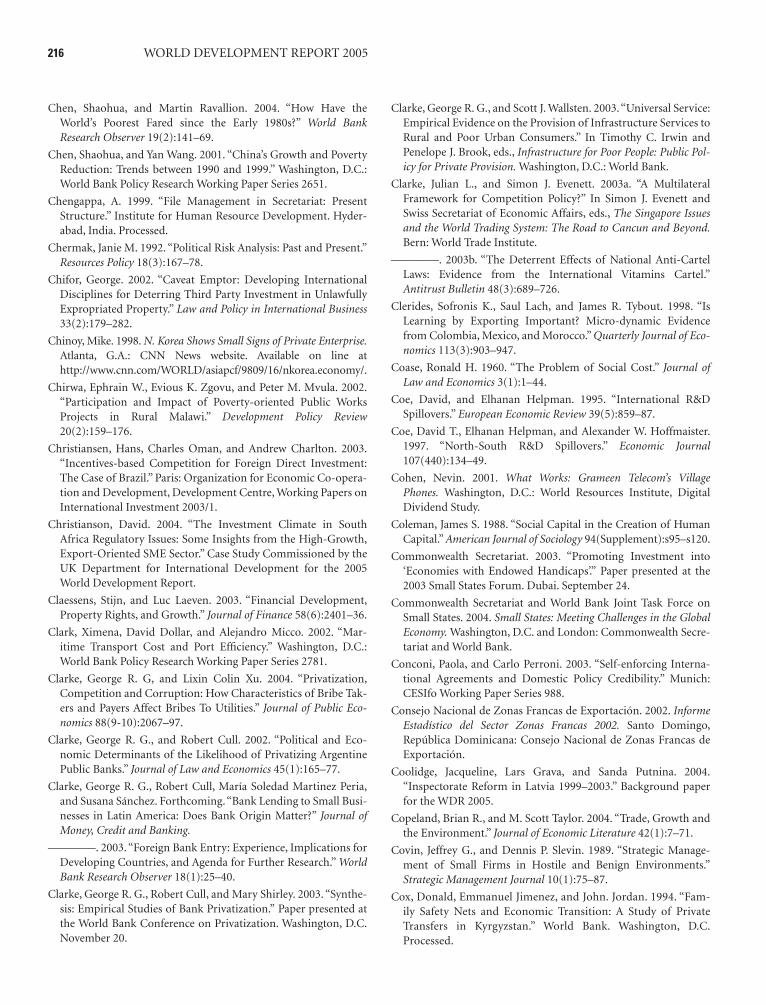
Chen, Shaohua, and Martin Ravallion. 2004. “How Have theWorld’s Poorest Fared since the Early 1980s?” World BankResearch Observer 19(2):141–69.
Chen, Shaohua, and Yan Wang. 2001. “China’s Growth and PovertyReduction: Trends between 1990 and 1999.” Washington, D.C.:World Bank Policy Research Working Paper Series 2651.
Chengappa, A. 1999. “File Management in Secretariat: PresentStructure.” Institute for Human Resource Development. Hyder-abad, India. Processed.
Chermak, Janie M. 1992. “Political Risk Analysis: Past and Present.”Resources Policy 18(3):167–78.
Chifor, George. 2002. “Caveat Emptor: Developing InternationalDisciplines for Deterring Third Party Investment in UnlawfullyExpropriated Property.” Law and Policy in International Business33(2):179–282.
Chinoy, Mike. 1998. N. Korea Shows Small Signs of Private Enterprise.Atlanta, G.A.: CNN News website. Available on line athttp://www.cnn.com/WORLD/asiapcf/9809/16/nkorea.economy/.
Chirwa, Ephrain W., Evious K. Zgovu, and Peter M. Mvula. 2002.“Participation and Impact of Poverty-oriented Public WorksProjects in Rural Malawi.” Development Policy Review20(2):159–176.
Christiansen, Hans, Charles Oman, and Andrew Charlton. 2003.“Incentives-based Competition for Foreign Direct Investment:The Case of Brazil.” Paris: Organization for Economic Co-opera-tion and Development, Development Centre, Working Papers onInternational Investment 2003/1.
Christianson, David. 2004. “The Investment Climate in SouthAfrica Regulatory Issues: Some Insights from the High-Growth,Export-Oriented SME Sector.” Case Study Commissioned by theUK Department for International Development for the 2005World Development Report.
Claessens, Stijn, and Luc Laeven. 2003. “Financial Development,Property Rights, and Growth.” Journal of Finance 58(6):2401–36.
Clark, Ximena, David Dollar, and Alejandro Micco. 2002. “Mar-itime Transport Cost and Port Efficiency.” Washington, D.C.:World Bank Policy Research Working Paper Series 2781.
Clarke, George R. G, and Lixin Colin Xu. 2004. “Privatization,Competition and Corruption: How Characteristics of Bribe Tak-ers and Payers Affect Bribes To Utilities.” Journal of Public Eco-nomics 88(9-10):2067–97.
Clarke, George R. G., and Robert Cull. 2002. “Political and Eco-nomic Determinants of the Likelihood of Privatizing ArgentinePublic Banks.” Journal of Law and Economics 45(1):165–77.
Clarke, George R. G., Robert Cull, María Soledad Martinez Peria,and Susana Sánchez. Forthcoming.“Bank Lending to Small Busi-nesses in Latin America: Does Bank Origin Matter?” Journal ofMoney, Credit and Banking.
————. 2003. “Foreign Bank Entry: Experience, Implications forDeveloping Countries, and Agenda for Further Research.” WorldBank Research Observer 18(1):25–40.
Clarke, George R. G., Robert Cull, and Mary Shirley. 2003. “Synthe-sis: Empirical Studies of Bank Privatization.” Paper presented atthe World Bank Conference on Privatization. Washington, D.C.November 20.
Clarke, George R. G., and Scott J. Wallsten. 2003.“Universal Service:Empirical Evidence on the Provision of Infrastructure Services toRural and Poor Urban Consumers.” In Timothy C. Irwin andPenelope J. Brook, eds., Infrastructure for Poor People: Public Pol-icy for Private Provision. Washington, D.C.: World Bank.
Clarke, Julian L., and Simon J. Evenett. 2003a. “A MultilateralFramework for Competition Policy?” In Simon J. Evenett andSwiss Secretariat of Economic Affairs, eds., The Singapore Issuesand the World Trading System: The Road to Cancun and Beyond.Bern: World Trade Institute.
————. 2003b. “The Deterrent Effects of National Anti-CartelLaws: Evidence from the International Vitamins Cartel.”Antitrust Bulletin 48(3):689–726.
Clerides, Sofronis K., Saul Lach, and James R. Tybout. 1998. “IsLearning by Exporting Important? Micro-dynamic Evidencefrom Colombia, Mexico, and Morocco.” Quarterly Journal of Eco-nomics 113(3):903–947.
Coase, Ronald H. 1960. “The Problem of Social Cost.” Journal ofLaw and Economics 3(1):1–44.
Coe, David, and Elhanan Helpman. 1995. “International R&DSpillovers.” European Economic Review 39(5):859–87.
Coe, David T., Elhanan Helpman, and Alexander W. Hoffmaister.1997. “North-South R&D Spillovers.” Economic Journal107(440):134–49.
Cohen, Nevin. 2001. What Works: Grameen Telecom’s VillagePhones. Washington, D.C.: World Resources Institute, DigitalDividend Study.
Coleman, James S. 1988. “Social Capital in the Creation of HumanCapital.” American Journal of Sociology 94(Supplement):s95–s120.
Commonwealth Secretariat. 2003. “Promoting Investment into‘Economies with Endowed Handicaps’.” Paper presented at the2003 Small States Forum. Dubai. September 24.
Commonwealth Secretariat and World Bank Joint Task Force onSmall States. 2004. Small States: Meeting Challenges in the GlobalEconomy. Washington, D.C. and London: Commonwealth Secre-tariat and World Bank.
Conconi, Paola, and Carlo Perroni. 2003. “Self-enforcing Interna-tional Agreements and Domestic Policy Credibility.” Munich:CESIfo Working Paper Series 988.
Consejo Nacional de Zonas Francas de Exportación. 2002. InformeEstadístico del Sector Zonas Francas 2002. Santo Domingo,República Dominicana: Consejo Nacional de Zonas Francas deExportación.
Coolidge, Jacqueline, Lars Grava, and Sanda Putnina. 2004.“Inspectorate Reform in Latvia 1999–2003.” Background paperfor the WDR 2005.
Copeland, Brian R., and M. Scott Taylor. 2004. “Trade, Growth andthe Environment.” Journal of Economic Literature 42(1):7–71.
Covin, Jeffrey G., and Dennis P. Slevin. 1989. “Strategic Manage-ment of Small Firms in Hostile and Benign Environments.”Strategic Management Journal 10(1):75–87.
Cox, Donald, Emmanuel Jimenez, and John. Jordan. 1994. “Fam-ily Safety Nets and Economic Transition: A Study of PrivateTransfers in Kyrgyzstan.” World Bank. Washington, D.C.Processed.
216 WORLD DEVELOPMENT REPORT 2005
15_WDR_References.qxd 8/24/04 3:07 PM Page 216
Crespo, Jorge, Carmela Martin, and Francisco Javier Velazquez.2002.“International Technology Diffusion Through Imports andIts Impact on Economic Growth.” Madrid: European EconomyGroup Working Paper 12.
Cristini, Marcela, and Ramiro A. Moya. 2001. “The Importance ofan Effective Legal System for Credit Markets: The Case ofArgentina.” In Marco Pagano and Orazio Attansio, eds., DefusingDefault: Incentives and Institutions. Washington, D.C.: Inter-American Development Bank.
Cukierman, Alex. 1992. Central Bank Strategy, Credibility, and Inde-pendence: Theory and Evidence. Cambridge, Mass.: MIT Press.
CUTS Center for Competition, Investment and Economic Regula-tion, eds. 2003. Pulling Our Socks Up: A Study of CompetitionRegimes of Seven Developing Countries of Africa and Asia underthe 7-UP Project. Jaipur, India: Jaipur Printers.
Darku, Alexander Bilson. 2001. “Private Investment, Uncertaintyand Irreversibility in Uganda.” African Finance Journal 3(1):1–25.
Das-Gupta, Arindam, Michael Engelschalk, and William Mayville.1999. “An Anti-corruption Strategy for Revenue Administra-tion.” World Bank, Washington, D.C.: PREM Note 33.
David, Paul A., Bronwyn H. Hall, and Andrew A. Toole. 2000.“Is Pub-lic R&D a Complement or Substitute for Private R&D? A Review ofthe Econometric Evidence.” Research Policy 29(4-5):497–529.
de Carvalho, Antonio Gledson. 2003. “Effects of Migration to Spe-cial Corporate Governance Levels of Bovespa.” University of SaoPaulo, Economics Department. Sao Paulo. Processed.
de Ferranti, David, Guillermo E. Perry, Indermit S. Gill, J. LuisGuasch, William F. Maloney, Carolina Sanchez-Paramo, andNorbert Schady. 2003. Closing the Gap in Education and Technol-ogy. Washington, D.C.: World Bank.
de Ferranti, David, Guillermo E. Perry, Indermit S. Gill, and LuisServen. 2000. Securing Our Future in a Global Economy. Washing-ton, D.C.: World Bank.
De La Fuente, A., and R. Doménech. 2002. “Human Capital inGrowth Regressions, How Much Difference Does Data QualityMake?” London: CEPR Discussion Paper 3587.
De Long, J. Bradford. 2000. “Cornucopia: The Pace of EconomicGrowth in the Twentieth Century.” Cambridge, Mass.: NationalBureau of Economic Research Working Paper Series 7602.
De Long, J. Bradford. 2003. “India since Independence: An AnalyticGrowth Narrative.” In Dani Rodrik, ed., In Search of Prosperity.Princeton: Princeton University Press.
De Mooij, Ruud A., and Sjef Ederveen. 2001. “Taxation and ForeignDirect Investment.” CPB Netherlands Bureau for Economic Pol-icy Analysis: CPB Discussion Paper 003.
————. 2002. “Taxation and Foreign Direct Investment: A Meta-Analysis.” CPB Netherlands Bureau for Economic Policy Analy-sis: CPB Report 2002/1.
De Soto, Hernando. 2000. The Mystery of Capital: Why CapitalismTriumphs in the West and Fails Everywhere Else. New York: BasicBooks.
De Wulf, Luc. 2004. “Tradenet in Ghana: Best Practice in the Use ofInformation Technology.” Background paper for the WDR 2005.
————. 2003. “Uganda: Issues and Lessons in Customs Reform.”World Bank. Washington, D.C. Processed.
De Wulf, Luc, and Emile Finateu. 2002. “Best Practices in CustomsAdministration Reform — Lessons from Morocco.” Washington,D.C.: World Bank PREM notes 67.
Deaton, Angus. 2002. “Counting the World’s Poor: Problems andPossible Solutions.” World Bank Research Observer 16(2):125–47.
Deccan Herald. 2003.“Will China Challenge India?” Deccan Herald,February 3.
Deepthi, Fernando, Leora Klapper, Victor Sulla, and Dimitri Vittas.2003. “The Global Growth of Mutual Funds.” Washington, D.C.:World Bank Policy Research Working Paper Series 3055.
Dehejia, Rajeev H., and Roberta Gatti. 2002. “Child Labor: TheRole of Income Variability and Access to Credit in a Cross Sec-tion of Countries.” Washington, D.C.: World Bank PolicyResearch Working Paper Series 2767.
Deininger, Klaus. 2002. “Agrarian Reforms in Eastern EuropeanCountries: Lessons from International Experience.” Journal ofInternational Development 14(7):987–1003.
Deininger, Klaus, Songquing Jin, Berham Andrew, SamuelGebre-Selassie, and Berhanu Nega. 2003. “Tenure Security andLand-Related Investment: Evidence from Ethiopia.” Washing-ton, D.C.: World Bank Policy Research Working Paper Series2991.
Demirgüç-Kunt, Asli, Thorsten Beck, and Vojislav Maksimovic.Forthcoming. “Bank Competition, Financing Obstacles andAccess to Credit.” Journal of Money Credit and Banking.
Demirgüç-Kunt, Asli, Luc Laeven, and Ross Levine. 2003. “TheImpact of Bank Regulations, Concentration and Institutions onBank Margins.” Washington, D.C.: World Bank Policy ResearchWorking Paper Series 3030.
Demirgüç-Kunt, Asli, and Vojislav Maksimovic. 1998. “Law,Finance and Firm Growth.” Journal of Finance 53(6):2107–37.
————. 1999. “Institutions, Financial Markets and Firm DebtMaturity.” Journal of Financial Economics 54(3):295–336.
Demombynes, Gabriel, and Berk Özler. 2002. “Crime and LocalInequality in South Africa.” Washington, D.C.: World Bank Pol-icy Research Working Paper Series 2925.
Demsetz, Harold. 1967. “Toward a Theory of Property Rights.”American Economic Review 57(May 1967):347–58.
Dercon, Stefan. 1996. “Risk, Crop Choice, and Savings: Evidencefrom Tanzania.” Economic Development and Cultural Change44(3):458–513.
Desai, Padma, and Pritha Mitra. 2004. “Why Do Some CountriesRecover So Much More Easily Than Others?” Paper presented atthe Festschrift in Honor of Guillermo A. Calvo. Washington,D.C.
Desai, Raj M. 2004. “Political Influence and Firm Innovation:Micro-Level Evidence from Developing Countries.” Backgroundpaper for the WDR 2005.
Desai, Raj M., and Anders F. Olofsgård. 2003. “A Political Model ofthe Soft Budget Constraint: Evidence from TransitionsEconomies.” Georgetown University, School of Foreign ServiceWorking Paper. Washington, D.C.
Devarajan, Shantayanan, David Dollar, and Torgny Holmgren.2001. Aid and Reform in Africa Lessons from Ten Case Studies.Washington, D.C.: World Bank.
References 217
15_WDR_References.qxd 8/24/04 3:07 PM Page 217

Devarajan, Shantayanan, Vinaya Swaroop, and Heng-fu Zou. 1996.“The Composition of Public Expenditure and EconomicGrowth.” Journal of Monetary Economics. 37(2):313–44.
Devereux, Michael P., Rachael Griffith, and Alexander Klemm.2002. “Corporate Income Tax Reforms and International TaxCompetition.” Economic Policy: A European Forum 0(35):449–88.
Dewit, G., H. Gorg, and C. Montagna. 2003. “Should I Stay orShould I Go? A Note on Employment Protection, DomesticAnchorage, and FDI.” Bonn, Germany: Institute for the Study ofLabor, Discussion Paper 845.
Diamond, Peter A., and James A. Mirlees. 1971. “Optimal Taxationand Public Production I: Production Efficiency.” American Eco-nomic Review 61(1):8–27.
Diop, Chimere. 2003. “Support to Private Sector and Trade Devel-opment: Lessons Learned.” Paper presented at the InternationalConference on Trade and Investment. Dakhar. April 23.
Dixit, Avinash, and Barry Nalebuff. 1991. “Making Strategies Cred-ible.” In Richard Zeckhauser, ed., Strategy and Choice. Cam-bridge, Mass.: MIT Press.
Dixit, Avinash K., and Robert S. Pindyck. 1994. Investment UnderUncertainty. Princeton, N.J.: Princeton University Press.
Djankov, Simeon, Rafael La Porta, Florencio López-de-Silanes,Andrei Shleifer, and Juan Botero. 2003a. “The Regulation ofLabor.” Cambridge, Mass.: National Bureau of EconomicResearch Working Paper Series 9756.
Djankov, Simeon, Rafael La Porta, Florencio López-de-Silanes, andAndrei Shliefer. 2003b. “Courts.” Quarterly Journal of Economics118(2):453–518.
Djankov, Simeon, Ira Lieberman, Joyita Mukherjee, and TatianaNenova. 2002. “Going Informal: Benefits and Costs.” WorldBank. Washington, D.C. Processed.
Djankov, Simeon, and Peter Murrell. 2002. “Enterprise Restructur-ing in Transition: A Quantitative Survey.” Journal of EconomicLiterature 40(3):739–792.
Do, Quy-Toan, and Lakshmi Iyer. 2003. “Land Rights and Eco-nomic Development: Evidence from Vietnam.” Washington,D.C.: World Bank Policy Research Working Paper Series 3120.
Dobrinsky, Rumen. 2002. “Tax Structures in TransitionsEconomies: A Comparative Perspective vis-a-vis EU MemberStates.” Paper presented at the Oesterreichische National BankEast-West Conference. Vienna. November 3.
Doig, Alan, and Stephen Riley. 1998. “Corruption and AnticorruptionStrategies: Issues and Case Studies from Developing Countries.” InUNDP, ed., Corruption and Integrity Improvement Initiatives in Devel-oping Countries. New York: United Nations Development Program.
Dolado, Juan José, Carlos García-Serrano, and Juan F. Jimeno. 2001.“Drawing Lessons from the Boom of Temporary Employment inSpain.” Madrid: Fundación de Estudios de Economía Aplicada2001–11. Available on line at http://www.fedea.es/.
Dollar, David, Mary Hallward-Driemeier, and Taye Mengistae.2003a. “Investment Climate and Firm Performance in Develop-ing Countries.” World Bank. Washington D.C. Processed.
————. 2003b.“Investment Climate, Infrastructure and Trade: AComparison of Latin America and Asia.” World Bank. Washing-ton, D.C. Processed.
Dollar, David, and Aart Kraay. 2002. “Growth is Good for the Poor.”Journal of Economic Growth 7(3):195–225.
Dollar, David, Anqing Shi, Shuilin Wang, and L. Colin. Xu. 2004.Improving City Competitiveness through the Investment Climate:Ranking 23 Chinese Cities. Washington, D.C.: World Bank.
Dollinger, Philippe. 1970. The German Hansa. Stanford, Ca.: Stan-ford University Press.
Dolzer, Rudolf, and Margrete Stevens. 1995. Bilateral InvestmentTreaties. The Hague: Martinus Nijhoff Publishers.
Domberger, Simon, and Avrom Sherr. 1989. “The Impact of Com-petition on Pricing and Quality of Legal Services.” InternationalReview of Law and Economics 9(1):41–56.
Dougherty, Carter. 2004. “Trade Theory versus Used Clothes inAfrica.” The New York Times, June 3.
Dowell, Glen, Stuart Hart, and Bernard Yeung. 2000. “Do Corpo-rate Global Environmental Standards Create or Destroy MarketValue?” Management Science 46(8):1059–74.
Dubash, Navroz K., and Sudhir Chella Rajan. 2001. “The Politics ofPower Sector Reform in India.” World Resources Institute. Wash-ington, D.C. Processed.
Durnev, Art, and E. Han Kim. 2003. “To Steal or Not to Steal: FirmAttributes, Legal Environment, and Valuation.” Paper presentedat the 14th Annual Conference on Financial Economics andAccounting (FEA). San Diego. October 31.
Dyer, Geoff. 2001a. “Brazil’s Pitch for Market Credibility.” FinancialTimes, February 27.
————. 2001b. “UBS Warburg Leads Brasil IPO.” FinancialTimes, February 22.
Easson, Alex. 2001. “Tax Incentives for Foreign Direct Investment,Part I: Recent Trends and Countertrends.” Bulletin for Interna-tional Fiscal Documentation 55(7):266–74.
Easterly,William. 2001. The Elusive Quest for Growth: Economists’ Adven-tures and Misadventures in the Tropics. Cambridge, Mass.: MIT Press.
Easterly, William, Shantayanan Devarajan, and Howard Pack. 2001.“Is Investment in Africa Too Low or Too High? Macro and MicroEvidence.” Journal of African Economies 10(suplement):81–108.
Easterly, William, and Ross Levine. 2001. “It’s Not Factor Accumu-lation: Stylized Facts and Growth Models.” World Bank EconomicReview 15(2):177–219.
————. 2003. “Tropics, Germs and Crops: How EndowmentsInfluence Economic Development.” Journal of Monetary Eco-nomics 50(1):3–39.
Easterly, William R., Roumeen Islam, and Joseph E. Stiglitz. 2000.“Shaken and Stirred: Explaining Growth Volatility.” In BorisPleskovic and Nicholas Stern, eds., Annual World Bank Confer-ence on Development Economics. Washington, D.C.: World Bank.
Easterly, William R., and Luis Servén, eds. 2003. The Limits of Stabi-lization: Infrastructure, Public Deficits, and Growth in Latin Amer-ica. Washington, D.C.: World Bank.
EBRD (European Bank for Reconstruction and Development).1999. Transition Report 1999: Ten Years of Transition. London,U.K.: European Bank for Reconstruction and Development.
Ebrill, Liam, Michael Keen, Jean-Paul Bodin, and Victoria Sum-mers. 2001. The Modern VAT. Washington, D.C.: InternationalMonetary Fund.
218 WORLD DEVELOPMENT REPORT 2005
15_WDR_References.qxd 8/24/04 3:07 PM Page 218

Economic and Social Research Foundation (ESRF). 2002. Competi-tion Law and Policy—A Tool for Development in Tanzania. Jaipur,India: CUTS Center for International Trade, Economics andEnvironment.
Ederington, Josh. 2001. “International Coordination of Trade andDomestic Policies.” American Economic Review 91(5):1580–39.
Edmonds, Eric V. 2004. “Does Child Labor Decline with ImprovingEconomic Status?” Cambridge, Mass.: National Bureau of Eco-nomic Research Working Paper Series 10134.
Edwards, Sebastian. 1999. “How Effective Are Capital Controls?”Journal of Economic Perspectives 13(4):65–84.
Ekmekcioglu, Rengin. 2003. “Development of Factoring Market inTurkey.” Paper presented at the Factoring Industry as a Key Toolfor SME Development in EU Accession Countries Conference.Warsaw. October 23.
El-Khawas, Elaine, Robin DePietro-Jurand, and Lauritz HolmNielsen. 1998. Quality Assurance in Higher Education: RecentProgress; Challenges Ahead. Report 21199. Washington, D.C.:World Bank, Human Development Network.
Ellis, Amanda. 2003. Engendering Private Sector Development.Washington, D.C.: World Bank.
Elstrodt, Heinz-Peter, Pablo Ordorica Lenero, and EduardoUrdapilleta. 2002. “Micro Lessons for Argentina.” The McKinseyQuarterly 2002(2):1–8.
Engelschalk, Michael, Samia Melhem, and Dana Weist. 2000.“Computerizing Tax and Customs Administrations.” Washing-ton, D.C.: World Bank PREM Note 44.
English, Philip, and Luc De Wulf. 2002. “Export Development Poli-cies and Institutions.” In Bernard M. Hoekman, Philip English,and Aaditya Mattoo, eds., Development, Trade, and the WTO: AHandbook. Washington, D.C.: World Bank.
English, Philip, Steven Jaffee, and Julius Okello. 2004. “ExportingOut of Africa: The Kenya Horticulture Success Story.” Paper pre-sented at the Scaling Up Poverty Reduction: A Global LearningProcess Conference. Shanghai. May 25.
Environmental Resources Management. 2004. Contracting OutUtility Regulatory Functions. Washington, D.C.: EnvironmentalResources Management for the World Bank.
Erb, Claude B., Campbell R. Harvey, and Tadas E. Viskanta. 2000.“The Risk and Expected Returns of African Equity Investment.”In Paul Collier and Catherine Pattillo, eds., Investment and Riskin Africa. London: McMillan.
Escude, Guillermo, Tamara Burdisso, Marcelo Catena, LaudraD’Amato, George McCandless, and Thomas E. Murphy. 2001.“Las MIP y MES y el Mercado de Credito en la Argentina.”Buenos Aires: Banco Central de la República Argentina, Docu-mento de Trabajo 15.
Eslava, Marcela, John Haltiwanger, Adriana Kugler, and MauriceKugler. 2003. “Have Market Reforms Changed the Evolution ofProductivity and Profitability in Colombia?” Paper presented atthe IASE–National Bureau of Economic Research Conference on“Productivity Dynamics”. Santiago de Chile.
ESMAP. 2002. Rural Electrification and Development in the Philip-pines: Measuring the Social and Economic Benefits. Washington,D.C.: Energy Assistance Management Assistance Programme.
Estache, Antonio, and José Carbajo. 1996. “Competing PrivatePorts—Lessons from Argentina.” Washington, D.C.: World Bank,Public Policy for the Private Sector Note 100.
Estache, Antonio, Vivien Foster, and Quentin Wodon. 2002.Accounting for Poverty in Infrastructure Reforms: Learning fromLatin America’s Experience. Washington, D.C.: World Bank.
Esty, Benjamin C., and William L. Megginson. 2003. “CreditorRights, Enforcement, and Debt Ownership Structure: Evidencefrom the Global Syndicated Loan Market.” Journal of Financialand Quantitative Analysis 38(1):37–59.
Etounga-Manguelle, Daniel D. 2000. “Does Africa Need a CulturalAdjustment Program?” In Lawrence E. Harrison and SamuelHuntington, eds., Culture Matters: How Values Shape HumanProgress. New York: Basic Books.
European Commission. 2004a. Proposal for a Regulation of theEuropean Parliament and of the Council: On the Access to Com-munity External Assistance. Brussels: European Commission.
————. 2004b. Report on Competition in Professional Services.Brussels: European Commission.
Evenett, Simon J. 2004. “Competition Law and the Investment Cli-mate in Developing Countries.” Case Study Commissioned bythe UK Department for International Development for the 2005World Development Report.
Faccio, Mara. 2003. “Politically Connected Firms.” University ofNashville. Nashville, Tenn. Processed.
Fafchamps, Marcel. 2004. Market Institutions and Sub-SaharanAfrica: Theory and Evidence. Cambridge, Mass.: MIT Press.
Fafchamps, Marcel, and Bart Minten. 2001. “Property Rights in aFlea Market Economy.” Economic Development and CulturalChange 49(2):229–68.
Fairbairn, I. J., and Worrell DeLisle. 1996. South Pacific andCaribbean Island Economies: A Comparative Study. Brisbane:Foundation for Development Cooperation.
Falaschetti, Dino. 2003. “Credible Commitments and Investment:Does Opportunistic Ability or Incentive Matter?” EconomicInquiry 41(4):660–74.
Fan, Shenggen, Peter Hazell, and Sukhadeo Thorat. 1999. “Linkagesbetween Government Spending, Growth, and Poverty in RuralIndia.” Washington, D.C.: IFPRI Research Report 110. Availableon line at www.ifpri.org.
Fan, Shenggen, Linxiu Zhang, and Xiaobo Zhang. 2002. “Growth,Inequality and Poverty in Rural China.” Washington, D.C.: IFPRIResearch Report 125. Available on line at www.ifpri.org.
Fan, Shenggen, Xiaobo Zhang, and Neetha Rao. 2004. “Public Expen-diture, Growth, and Poverty Reduction In Rural Uganda.”Washing-ton, D.C.: IFPRI, Development Strategy and Governance Division(DSGD), Discussion Paper 4. Available on line at www.ifpri.org.
Faulkender, Michael, and Mitchell A. Petersen. 2003.“Does the Sourceof Capital Affect Capital Structure?” Cambridge, Mass.: NationalBureau of Economic Research Working Paper Series 9930.
Fearon, James D., and David Laitin. 2003. “Ethnicity, Insurgencyand Civil War.” American Political Science Review 91(1):75–90.
Feder, Gershon, Tongroj Onchan, Yongyuth Chalamwong, andChira Hongladarom. 1988. Land Policies and Farm Productivityin Thailand. Baltimore: John Hopkins University Press.
References 219
15_WDR_References.qxd 8/24/04 3:07 PM Page 219
Feliciano, Zadia M. 1998. “Does Minimum Wage Affect Employ-ment in Mexico?” Eastern Economic Journal 24(2):165–80.
Fernald, John G. 1999. “Roads to Prosperity? Assessing the LinkBetween Public Capital and Productivity.” American EconomicReview 89(3):619–38.
Fernandes, Ana M. 2003. “Trade Policy, Trade Volumes and PlantLevel Productivity in Colombian Manufacturing Industries.”Washington, D.C.: World Bank Policy Research Working PaperSeries 3064.
Fernandez, Raquel, and Dani Rodrik. 1991. “Resistance to Reform:Status Quo Bias in the Presence of Individual-Specific Uncer-tainty.” American Economic Review 81(5):1146–53.
Ferrarini, Benno. Forthcoming. “A Multilateral Framework forInvestment?” In Simon J. Evenett and Swiss Secretariat of Eco-nomic Affairs (eds.) The Singapore Issues and the World TradingSystem: The Road to Cancun and Beyond. Bern: World TradeInstitute.
Feser, Edward. 2002.“The Relevance of Clusters for Innovation Pol-icy in Latin America and the Caribbean.” University of Califor-nia, Background paper prepared for the World Bank, LAC group.Chapel Hill. Processed.
Field, Erica. 2002. “Entitled to Work: Urban Property Rights andLabor Supply in Peru.” Princenton, N.J.: Princeton University,Princeton Law and Public Affairs Working Paper 02-1.
Fields, Gary S., and Guy Pfeffermann, eds. 2003. Pathways Out ofPoverty. Washington, D.C.: World Bank.
Fink, Carsten, Aaditya Mattoo, and Randeep Rathindran. 2002.“Liberalizing Basic Telecommunications: The Asian Experience.”HWWA-Institut fïr Wirtschaftsforschung-Hamburg: HWWADiscussion Paper 163.
Fisman, Raymond. 2001.“Estimating the Value of Political Connec-tions.” American Economic Review 91(4):1095–102.
Fjeldstad, Odd-Helge. 2002. “Fighting Fiscal Corruption: The Caseof the Tanzania Revenue Authority.” Chr. Michelsen Institute.Bergen, Norway. Processed.
Fleisig, Heywood, and Nuria De la Peña. 2003. Law, Legal Institu-tions, and Development: Lessons of the 1990s for Property Rights,Secured Transactions, Business Registration, and Contract Enforce-ment. Washington, D.C.: Center for the Economic Analysis ofLaw.
Fleisig, Heywood W. 1998. How Problems in the Framework forSecured Transactions Limit Access to Credit. Washington, D.C.:Center for the Economic Analysis of Law.
Fletcher, Kevin. 2002. “Tax Incentives in Cambodia, Laos PDR, andVietnam.” Paper presented at the IMF Conference on ForeignDirect Investment: Opportunities and Challenges for Cambodia,Laos PDR and Vietnam. Hanoi. August 16.
Flores, Gonzalo, and Andrei Mikhnew. 2004. “Improving the Busi-ness Environment for SMEs.” World Bank. Washington, D.C.Processed.
Fombad, Manga. 1999. “Curbing Corruption in Africa: SomeLessons from Botswana’s Experience.” International Social Sci-ence Journal 51(2):241–54.
Forteza, Alvaro, and Martín Rama. 2002. “Labor Market “Rigidity”and the Success of Economic Reforms across More Than One
Hundred Countries.” Washington, D.C.: World Bank PolicyResearch Working Paper Series 2521.
Foster, Andrew D., and Mark R. Rosenzweig. 2004. “AgriculturalProductivity Growth, Rural Economic Diversity and EconomicReforms: India 1970–2000.” Economic Development and CulturalChange 52(3):509–42.
Frankel, Jeffrey A. 2003. “The Environment and Globalization.”Cambridge Mass.: National Bureau of Economic Research Work-ing Paper Series 10090.
Freeman, Richard. 1994. A Global Labor Market? Differences in WagesAmong Countries in the 1980s. Washington, D.C.: World Bank.
Friedman, Joseph, Emmanuel Jimenez, and Stephen K. Mayo. 1988.“The Demand for Tenure Security in Developing Countries.”Journal of Development Economics 29(2):185–98.
Frost, Carol, Elizabeth Gordon, and Andrew Hayes. 2002. “StockExchange Disclosure and Market Liquidity: An Analysis of 50International Exchanges.” Paper presented at the 13th AnnualConference on Financial Economics and Accounting joint withThe 5th Maryland Finance Symposium. College Park, MD.November 15.
Frye, Timothy, and Ekaterina Zhuravskaya. 2000. “Rackets, Regula-tion, and the Rule of Law.” Journal of Law, Economics and Organi-zations 16(2):478–502.
Fuchs, Victor R, Alan B. Krueger, and James M. Poterba. 1998.“Economist’s Views about Parameters, Values and Policies: Sur-vey Results in Labor and Public Economics.” Journal of EconomicLiterature 36(3):1387–425.
Fukuyama, Francis. 1995. Trust: The Social Virtues and the Creationof Prosperity. New York: Free Press.
————. 2001. “Social Capital, Civil Society and Development.”Third World Quarterly 22(1):7–20.
Fundación Paz Ciudadana. 2001. Plan Cuadrante: la Gran Reforma.Santiago de Chile: Fundación Paz Ciudadana. Available on line athttp://www.pazciudadana.cl/haciendo/doc/plan_cuadrante.PDF.
————. 2002. Plan Comuna Segura, Compromiso 100. Santiago deChile: Fundación Paz Ciudadana. Available on line athttp://www.pazciudadana.cl/haciendo/doc/comuna_segura.PDF.
Funke, Norbert, and Saleh Nsouli. 2003. “The New Partnership forAfrica’s Development (NEPAD): Opportunities and Challenges.”Washington, D.C.: International Monetary Fund Working Paper03/69.
Gaiha, R. 2000. Rural Public Works and the Poor: A Review of theEmployment Guarantee Scheme in Maharashtra. India: Universityof Delhi, Faculty of Management Studies.
Galal, Ahmed. 2004. “The Economics of Formalization: PotentialWinners and Losers from Formalization in Egypt.” Cairo: TheEgyptian Center for Economic Studies Working Paper 95.
Galal, Ahmed, Leroy Jones, Pankaj Tandon, and Ingo Vogelsang.1994. Welfare Consequences of Selling Public Enterprises: AnEmpirical Analysis. New York: Oxford University Press.
Galanter, Marc, and Jayanth Krishnan. 2003. “Debased Informal-ism: Lok Adalats and Legal Rights in Modern India.” In Erik G.Jensen and Thomas C. Heller, eds., Beyond Common Knowledge:Empirical Approaches to the Rule of Law. Stanford, C.A.: StanfordUniversity Press.
220 WORLD DEVELOPMENT REPORT 2005
15_WDR_References.qxd 8/24/04 3:07 PM Page 220

Galindo, Arturo, and Margaret J. Miller. 2001. “Can Credit Reg-istries Reduce Credit Constraints? Empirical Evidence on theRole of Credit Registries in Firm Investment Decisions.” Paperpresented at the Annual Meetings of the Inter-American Devel-opment Bank. Santiago de Chile. March 16.
Gallup, John Luke, Jeffrey D. Sachs, and Andrew D. Mellinger. 1999.“Geography and Economic Development.” InternationalRegional Science Review 22(2):179–232.
Gaston, Gelos R., and Shang-Jin Wei. 2002. “Transparency andInternational Investor Behavior.” Cambridge, Mass.: NationalBureau of Economic Research Working Paper Series 9260.
Gauthier, Bernard, and Mark Gersovitz. 1997. “Revenue Erosionthrough Exemption and Evasion in Cameroon, 1993.” Journal ofPublic Economics 64(3):407–24.
Gauthier, Bernard, and Ritva Reinikka. 2001. “Shifting Tax BurdensThrough Exemptions and Evasion: An Empirical Investigation ofUganda.” Washington, D.C.: World Bank Policy Research Work-ing Paper Series 2735.
Gaviria, Juan. 1998. “Port Privatization and Competition inColombia.” Washington, D.C.: World Bank, Public Policy for thePrivate Sector, Note 167.
Ge, Wei. 1999. “Special Economic Zones and the Opening of theChinese Economy: Some Lessons for Economic Liberalization.”World Development 27(7):1267–85.
Georgian Opinion Research Business International (GORBI). 2002.Legal Reform Monitoring Study. Tbilisi, Georgia: Georgian Opin-ion Research Business International. Available on line atwww.gorgi.com.
Ghatak, Maitreesh, and Timothy W. Guinnane. 1999. “The Eco-nomics of Lending with Joint Liability: Theory and Practice.”Journal of Development Economics 60(1):195–228.
Giannetti, Mariassunta. 2003. “Do better Institutions MitigateAgency Problems? Evidence from Corporate Finance Choices.”Journal of Financial and Quantitative Analysis 38(1):185–212.
Gilbert, Richard J., and Edward P. Kahn, eds. 1996. InternationalComparisons of Electricity Regulation. Cambridge, U.K.: Cam-bridge University Press.
Gill, Indermit S., William F. Maloney, and Carolina Sanchez-Paramo. 2002. Trade Liberalization and Labor Reform in LatinAmerica and the Caribbean in the 1990s. Washington, D.C.:World Bank.
Gill, Indermit S., Claudio E. Montenegro, and Dörte Dömeland.2002. Crafting Labor Policy: Techniques and Lessons from LatinAmerica. New York: Oxford University Press.
Gill, Jit B. S. 2003. The Nuts and Bolts of Revenue AdministrationReform. Washington, D.C.: World Bank.
Gillespie, Kate, Liesl Riddle, Edward Sayre, and David Sturges.1999. “Diaspora Interest in Homeland Investment.” Journal ofInternational Business Studies 30(3):623–34.
Gissurarson, Hannes H. 2000. “Overfishing: The Icelandic Solu-tion.” Sussex: The Institute of Economic Affairs, Studies on theEnvironment 17.
Glaeser, Edward L., Simon Johnson, and Andrei Shleifer. 2001.“Coase Versus the Coasians.” Quarterly Journal of Economics116(3):853–99.
Glaeser, Edward L. 2001. “The Economics of Location-Based TaxIncentives.” Cambridge, Mass.: Harvard Institute of EconomicResearch, Discussion Paper 1932.
Glaeser, Edward L., and Andrei Shleifer. 2002. “Legal Origins.”Quarterly Journal of Economics 117(4):1193–229.
Glaeser, Edward L., Rafael La Porta, Florencio López-de-Silanes,and Andrei Shleifer. 2004. “Do Institutions Cause Growth?”Cambridge, Mass.: National Bureau of Economic ResearchWorking Paper Series 10568.
Goldberg, Pinelopi K., and Nina Pavcnik. 2003. “The Response ofthe Informal Sector to Trade Liberalization.” Journal of Develop-ment Economics 72(2):463–96.
Golden, Miriam A. 1997. Heroic Defeats: The Politics of Job Loss.Cambridge, U.K.: Cambridge University Press.
Golub, Stephen, and Ahmadou Aly Mbaye. 2002. “Obstacles andOpportunities for Senegal’s International Competitiveness: CaseStudies of the Peanut Oil, Fishing and Textile Industries.” Wash-ington, D.C.: World Bank Africa Region Working Paper Series37.
Golub, Stephen S. 2003. “Measures of Restrictions on Inward For-eign Direct Investment for OECD Countries.” Paris: Organiza-tion for Economic Co-operation and Development, EconomicsDepartment Working Papers 357.
Gómez-Ibáñez, José A. 2003. Regulating Infrastructure: Monopoly,Contracts, and Discretion. Cambridge, Mass.: Harvard UniversityPress.
Gómez-Ibáñez, José A, and John R. Meyer. 1993. Going Private, TheInternational Experience with Transport Privatization. Washing-ton, D.C.: Brookings Institution.
Gompers, Paul A., and Andrew Metrick. 2001. “InstitutionalInvestors and Equity Prices.” Quarterly Journal of Economics116(1):229–59.
Gordon, Roger, and James R. Hines. 2002. “International Taxation.”In Alan J. Auerbach and Martin Feldstein, eds., Handbook of Pub-lic Economics, Vol. 4. Amsterdam: Elsevier B. V.
Görg, H. 2002. “Fancy a Stay at the ‘Hotel California’? ForeignDirect Investment, Taxation and Firing Costs.” Bonn: Institutefor the Study of Labor, Discussion Working Paper 665.
Görg, Holger, and Eric Strobl. 2001. “Multinational Companies andProductivity Spillovers: A Meta-analysis.” Economic Journal111(475):F723–F739.
Graham Bannock and Partners Ltd. 1997. Credit Guarantee Schemesfor Small Business Lending: A Global Perspective. London: Gra-ham Bannock and Partners Ltd.
Graham, Carol, and Stefano Pettinato. 2001. “Frustrated Achievers:Winners, Losers, and Subjective Well Being in New MarketEconomies.” Washington, D.C.: Brookings Institution, Center onSocial and Economic Dynamics Working Paper Series 21.
Graham, Edward M. 2000. Fighting the Wrong Enemy: Anti-GlobalActivists and Multinational Enterprises. Washington, D.C.: Insti-tute for International Economics.
Greenstone, Michael. 2002. “The Impact of Environmental Regula-tions on Industrial Activity: Evidence from the 1970 and 1977Clean Air Act Amendments and the Census of Manufactures.”Journal of Political Economy 110(6):1175–1219.
References 221
15_WDR_References.qxd 8/24/04 3:07 PM Page 221

Greenstone, Michael, and Enrico Moretti. 2003. “Bidding forIndustrial Plants: Does Winning a ‘Million Dollar Plant’ IncreaseWelfare?” Cambridge, Mass.: National Bureau of EconomicResearch Working Paper Series 9844.
Greenwood, Peter W., Karyn E. Model, C. Peter Rydell, and James R.Chiesa. 1998. Diverting Children from a Life of Crime: MeasuringCots and Benefits. Santa Monica, CA: Rand Corporation.
Greif, Avner. 1989. “Reputation and Coalitions in Medieval Trade:Evidence on the Maghribi Traders.” Journal of Economic History49(4):857–82.
Gruber, Jonathan. 1997.“Consumption Smoothing Effects of Unem-ployment Insurance.” American Economic Review 87(1):192–205.
Guasch, J. Luis, and Robert W. Hahn. 1999. “The Costs and Benefitsof Regulation: Implications for Developing Countries.” WorldBank Research Observer 14(1):137–58.
Guasch, J. Luis, and Pablo Spiller. 1999. Managing the RegulatoryProcess: Design, Concepts, Issues, and the Latin American andCaribbean story. Washington, D.C.: World Bank.
Gupta, S. P. 1999. Interim Report of the Study Group on Developmentof Small Enterprises. New Delhi: Planning Commission Villageand Small Industries Division, Government of India.
Haber, Stephen, Armando Razo, and Noel Maurer. 2003. The Poli-tics of Property Rights: Political Instability, Credible Commitments,and Economic Growth in Mexico, 1876–1929. Cambridge, U.K.:Cambridge University Press.
Haddad, L., and M. Adato. 2001. “How Efficient do Public WorksPrograms Transfer Benefits to the Poor? Evidence from SouthAfrica.” Washington, D.C.: International Food Policy ResearchInstitute Discussion Paper 108.
Hail, Luzi, and Christian Luez. 2003. “International Differences inCost of Capital: Do Legal Institutions and Securities RegulationMatter?” Brussels: European Corporate Governance Institute(ECGI)–Law Working Paper 15.
Hall, Bronwyn H., and John Van Reenen. 1999. “How Effective areFiscal Incentives for R&D? A Review of the Evidence.” ResearchPolicy 29(4-5):449–69.
Hall, Robert E., and Charles I. Jones. 1999. “Why Do Some Coun-tries Produce so much more Output per Worker than Others?”Quarterly Journal of Economics 114(1):83–116.
Hallberg, Kristin, and Yasuo Konishi. 2003. “Bringing SMEs intoGlobal Markets.” In Gary S. Fields and Guy Pfeffermann, eds.,Pathways out of Poverty: Private Firms and Economic Mobility inDeveloping Countries. Boston, Mass.: Kluwer Adademic Publish-ers for the International Finance Corporation.
Hallberg, Kristin. 2000. “A Market-Oriented Strategy For Small andMedium-Scale Enterprises.” Washington, D.C.: InternationalFinance Corporation Discussion Paper 40.
Hallward-Driemeier, Mary. 2003. “Do Bilateral Treaties Attract For-eign Direct Investment? Only a Bit...and They Could Bite.” WorldBank. Washington, DC. Processed.
Hallward-Driemeier, Mary, Giuseppe Iarossi, and Kenneth L.Sokoloff. 2002. “Exports and Manufacturing Productivity in EastAsia: A Comparative Analysis with Firm-Level Data.” Cam-bridge, Mass.: National Bureau of Economic Research WorkingPaper Series 8894.
Hallward-Driemeier, Mary, and David Stewart. 2004. “How DoInvestment Climate Conditions Vary Across Countries andTypes of Firms?” Background paper for the WDR 2005.
Hallward-Driemeier, Mary, and Andrew H. W. Stone. 2004. “TheInvestment Climate for Informal Firms.” Background paper forthe WDR 2005.
Hallward-Driemeier, Mary, L. Colin. Xu, and Scott Wallsten. 2003.“The Investment Climate and the Firm: Firm-Level Evidencefrom China.” Washington, D.C.: World Bank Policy ResearchWorking Paper Series 3003.
Haltiwanger, John. 2000. “Aggregate Growth: What Have weLearned from Microeconomic Evidence.” Paris: Organization forEconomic Co-operation and Development Economics Depart-ment Working Paper 267.
Haltiwanger, John, Stefano Scarpetta, and Milan Vodopivec. 2003.“How Institutions Affect Labor Market Outcomes: Evidencefrom Transition Economies.” Paper presented at the 2003 WorldBank Economists’ Forum. Washington, D.C. April 10.
Halvorsen, Robert. 1995. “Fiscal Incentives for Investment in Thai-land.” In Anwar Shah, ed., Fiscal Incentives for Investment andInnovation. New York: Oxford University Press.
Harris, Clive. 2002. “Private Rural Power: Network Expansion Usingan Output-Based Scheme in Guatemala.” Washington, D.C.:World Bank, Private Sector and Infrastructure Network, Note 245.
————. 2003. “Private Participation in the Infrastructure ofDeveloping Countries: Trends, Impacts, and Policy Lessons.”Washington, D.C.: World Bank Working Paper 5.
Harrison, Ann E. 1994. “Productivity, Imperfect Competition andTrade Reform: Theory and Evidence.” Journal of InternationalEconomics 36(1-2):53–73.
Harrison, Ann E., and Edward Leamer. 1997. “Labor Markets inDeveloping Countries: An Agenda for Research.” Journal of LaborEconomics 15(3):S1–S19.
Harrold, Peter, Malathi Jayawickrama, and Deepak Bhattasali. 1996.“Practical Lessons for Africa from East Asia in Industrial andTrade Policies.” Washington, D.C.: World Bank Africa TechnicalDepartment Series 310.
Harsch, Ernest. 2002. “Making Regional Integration a Reality: NewStrategies Aim for Public Involvement, Practical Results.” AfricaRecovery 16(2-3):10–10.
Harsh, Vivek. 2003. Small Scale Industries and Reservation Policy.Anand-Gujarat, India: Institute of Rural Management. Availableon line at http://www.irma.ac.in/pub/network/9-3doc2.html.
Hart, David M. 2003.“Entrepreneurship Policy: What It Is and WhereIt Came From.” In David M.Hart, ed., Emergence of Entrepreneur-ship Policy: Governance, Start-Ups, and Growth in the U.S. Knowl-edge Economy. Cambridge, U.K.: Cambridge University Press.
Harvey, Charles. 1991. “On the Perverse Effects of Financial SectorReform in Anglophone Africa.” South African Journal of Econom-ics 59(3):258–86.
Haufler, Andreas. 2001. Taxation in a Global Economy. Cambridge,U.K.: Cambridge University Press.
Hausmann, Ricardo, Lant Pritchett, and Dani Rodrik. 2004.“Growth Accelerations.” Cambridge, Mass.: National BureauEconomic Research Working Paper Series 10566.
222 WORLD DEVELOPMENT REPORT 2005
15_WDR_References.qxd 8/24/04 3:07 PM Page 222
Hausmann, Ricardo, and Dani Rodrik. 2003. “Economic Develop-ment As Self-Discovery.” Journal of Development Economics72(2):603–33.
Head, Keith, and John Reis. 1998. “Immigration and Trade Cre-ation: Econometric Evidence from Canada.” Canadian Journal ofEconomics 31(1):47–62.
Heckman, James, and Carmen Pagés. 2004. Law and Employment:Lessons from the Latin America and the Caribbean. Cambridge,Mass.: National Bureau of Economic Research.
Hellman, Joel S., Geraint Jones, Daniel Kaufmann, and MarkSchankerman. 1999. “Measuring Governance and State Capture:The Role of Bureaucrats and Firms in Shaping the Business Envi-ronment.” London, U.K.: European Bank for Reconstruction andDevelopment Working Paper 51.
Hellman, Joel S., and Daniel Kaufmann. 2003. “The Inequality ofInfluence.” World Bank. Washington, D.C. Processed.
Hempling, Scott, Kenneth Rose, and Robert E. Burns. 2004. TheRegulatory Treatment of Embedded Costs Exceeding Market Prices:Transition to a Competitive Electric Generation Market. Colum-bus, O.H.: National Regulatory Research Institute.
Henderson, David. 2000. The MAI Affair: A Story and its Lessons.London: Royal Institute of International Affairs.
Henisz, Witold J. 2000. “The Institutional Environment for Eco-nomic Growth.” Economics and Politics 12(1):1–31.
————. 2002. “The Institutional Environment for InfrastructureInvestment.” Industrial and Corporate Change 11(2):355–89.
Henisz, Witold J., and A. Delios. 2003. “Policy Uncertainty and theSequence of Entry by Japanese Firms, 1980–1998.” Journal ofInternational Business Studies 34(3):227–41.
Henisz, Witold J., and Bennet A. Zelner. Forthcoming. “Legitimacy,Interest Group Pressures and Change in Emergent Institutions:The Case of Foreign Investors and Host Country Governments.”Academy of Management Review.
Henisz, Witold J., and Bennet A. Zelner. 2001. “The InstitutionalEnvironment for Telecommunications Investment.” Journal ofEconomics & Management Strategy 10(1):123–47.
Herbst, Jeffrey I. 2000. States and Power in Africa: ComparativeLessons in Authority and Control. Princeton, N.J.: Princeton Uni-versity Press.
Hernandez, Zenaida. 2004. “The Debate on Industrial Policy in EastAsia: In Search for Lessons.” Background paper for the WDR 2005.
Herrero, Alvaro, and Keith Henderson. 2001. “The Cost of Resolv-ing Small Business Conflicts: The Case of Peru.” Inter-AmericanDevelopment Bank, Sustainable Development Department, BestPractices Series. Washington, D.C. Processed.
Herzberg, Benjamin. 2004. “Investment Climate Reform: Going theLast Mile: The Bulldozer Initiative in Bosnia and Herzegovina.”World Bank. Washington, D.C. Processed.
Hess, Ulrich, and Leora Klapper. 2003. “The Use of New Products,Processes and Technology for the Delivery of Rural and Microfi-nance Loans in India.” World Bank. Washington, D.C. Processed.
Hettige, Hemamala, Mainul Huq, Sheoli Pargal, and DavidWheeler. 1995. “Determinants of Pollution Abatement in Devel-oping Countries: Evidence from South East Asia.” World Devel-opment 24(12):1891–904.
Hicks, John R. 1935. “Annual Survey of Economic Theory: TheTheory of Monopoly.” Econometrica 3(1):1–20.
Hines, James R. Jr. 1999. “Lessons from Behavioral Responses toInternational Taxation.” National Tax Journal 52(2):305–23.
Hnatkovska, Viktoria, and Norman A. Loayza. 2004. “Volatility andGrowth.” Washington, D.C.: World Bank Policy Research Work-ing Paper Series 3184.
Hoekman, Bernard. 2000. “The Next Round of Services TradeNegotiations: Identifying Priorities and Options.” Federal ReserveBank of St.Louis Review 82(4):31–48.
Hoekman, Bernard, Hiau Looi Kee, and Marcelo Olarreaga. 2001.“Markups, Entry Regulations, and Trade: Does Country SizeMatter?” Washington, D.C.: World Bank Policy Research Work-ing Paper Series 2662.
Hoekman, Bernard, Aadita Mattoo, and Philip English, eds. 2002.Development, Trade, and the WTO: A Handbook. Washington,D.C.: World Bank.
Hoekman, Bernard, and Petros C. Mavroidis. 2002. “EconomicDevelopment, Competition Policy, and the WTO.” Washington,D.C.: World Bank Policy Research Report Working Paper Series2917.
Hoekman, Bernard, Constantine Michalopoulos, and Alan L. Win-ters. 2003. “More Favorable and Differential Treatment of Devel-oping Countries: Toward a New Approach in the World TradeOrganization.” Washington, D.C.: World Bank Policy ResearchWorking Paper Series 3107.
Hoekman, Bernard, and others. 2004. Leveraging Trade for Develop-ment: The World Bank Research Agenda. Washington, D.C.:World Bank.
Hoff, Karla. 2003. “Paths of Institutional Development: A Viewfrom Economic History.” World Bank Research Observer18(2):205–26.
Hoff, Karla, and Joseph E. Stiglitz. 2004. “After the Big Bang? Obsta-cles to the Emergence of the Rule of Law in Post-CommunistSocieties.” American Economic Review 94(3):753–63.
Hofstede, Geert. 1984. Culture’s Consequences: International Differ-ences in Work Related Values. Beverly Hills, C.A.: Sage Publications.
Holmgren, Torgny, Louis Kasekende, Michael Atingi-Ego, andDaniel Ddamulira. 2001. “Uganda.” In Shantayanan Devarajan,David Dollar, and Torgny Holmgren, eds., Aid and Reform inAfrica: Lessons from ten Case Studies. Washington, D.C.: WorldBank.
Holzmann, Robert, and Steer Jorgensen. 2001. “Social Risk Man-agement: A New Conceptual Framework for Social Protectionand Beyond.” International Tax and Public Finance 8(4):529–56.
Hopenhayn, Hugo. 2004. “Labor Market Policies and EmploymentDuration: The Effects of Labor Market Reform in Argentina.” InJames Heckman and Carmen Pagés, eds., Law and Employment:Lessons from the Latin America and the Caribbean. Cambridge,Mass.: National Bureau of Economic Research.
Hu, Albert G. Z, and Gary H. Jefferson. 2002. “FDI Impact andSpillover: Evidence from China’s Electronic and Textile Indus-tries.” World Economy 25(8):1063–76.
Hubka, Ashley, and Rita Zaidi. 2004. “Innovations in Microfi-nance.” Background paper for the WDR 2005.
References 223
15_WDR_References.qxd 8/24/04 3:07 PM Page 223

Hufbauer, Gary Clyde, and Ben Goodrich. 2003a. “Next Move inSteel: Revocation or Retaliation.” Washington, D.C.: Institute forInternational Economics, International Economics Policy BriefsPB03-10.
————. 2003b. “Steel Policy: The Good, the Bad and the Ugly.”Washington, D.C.: Institute for International Economics, Inter-national Economics Policy Briefs PB03-1.
Hunt, Sally, and Graham Shuttleworth. 1996. Competition andChoice in Electricity. New York: John Wiley & Sons.
Hussain, Abid. 1997. Report of the Expert Committee on Small Enter-prises. New Delhi: Government of India, Ministry of Industry.
ICSID. 2003. “Disputes before the Centre.” News from ICSID20(1):2–2.
IDA, and IMF. 2003. Poverty Reduction Strategy Papers—DetailedAnalysis of Progress in Implementation. Washington, D.C.: Inter-national Development Association and International MonetaryFund.
IFC. 2001. Investing in Private Education: IFC’s Strategic Directions.Washington, D.C.: International Finance Corporation, Healthand Education Group.
————. 2002. The Private Sector Financing Activities of Interna-tional Financial Institutions (2001Update). Washington, D.C.:International Finance Corporation.
IFC, and CIDA. 2001. Financial Leasing in Russia: Market Survey2000–2001. Washington, D.C.: International Finance Corpora-tion and Canadian International Development Agency.
ILO (International Labour Organisation). 2002a. “Compendium ofOfficial Statistics on Employment in the Informal Sector.” Geneva:International Labor Organization, STAT Working Paper 1.
————. 2002b. Women and Men in the Informal Economy: A Sta-tistical Picture. Geneva: International Labor Organization.
————. 2003a. Employment and Social Policy in Respect of ExportProcessing Zones (EPZs). Geneva: International Labor Organiza-tion Governing Body.
————. 2003b. Investing in Every Child—An Economic Study ofthe Costs and Benefits of Eliminating Child Labor. Geneva: Inter-national Labor Organization.
————. 2004. Global Employment Trends. Geneva: InternationalLabor Organization.
IMF (International Monetary Fund). 2003. Government FinanceStatistics. Washington, D.C.: International Monetary Fund.
————. 2004. World Economic Outlook. Washington, D.C.: Inter-national Monetary Fund.
IMF, and IDA. 2003. Joint Staff Assessment of the Poverty ReductionStrategy Paper Annual Progress Report. Washington, D.C.: Interna-tional Monetary Fund and International Development Association.
Impavido, Gregorio. 2001. Assessment of Implementation of the IAISInsurance Supervisory Principles. Washington, D.C.: World Bank.
Impavido, Gregorio, Alberto R. Musalem, and Thierry Tressel.2003. “The Impact of Contractual Savings Institutions on Secu-rities Markets.” Washington, D.C.: World Bank Policy ResearchWorking Papers Series 2948.
India–Ministry of Finance. 2003. Economic Survey 2002–2003. NewDelhi: India–Ministry of Finance.
India–Ministry of Small Scale Industries. 2003. Annual Report2002–2003. New Delhi: India–Ministry of Small Scale Industries.
Inglehart, Ronald and others. 2000. World Values Surveys and Euro-pean Values Surveys, 1981–1984, 1990–1993, and 1995–1997. AnnArbor, MI: Inter University Consortium for Political and SocialResearch [distributor].
Inter-American Development Bank. 2001. Economic and SocialProgress in Latin America 2001 Report. Washington, D.C.: Inter-American Development Bank.
————. 2002. Evaluation of MIF Projects: Alternative CommercialDispute Resolution Methods. Washington, D.C.: Inter-AmericanDevelopment Bank, Office of Evaluation and Oversight.
International Institute for Environment and Development. 2001.From Abundance to Scarcity—The Closing of the Frontier:Addressing Land Issues in West & Central Africa. London: Inter-national Institute for Environment and Development, DrylandsProgram.
Ireland–IDA. 2002. IDA Annual Report 2002: Enriching Ireland.Dublin: Industrial Development Agency.
Irwin, Timothy C. 2004. “Accounting for Public-Private Partner-ships: How Should Governments Report Guarantees and Long-term Purchase Contracts.” Background paper for the WDR 2005.
Iyigun, Murat F., and Dani Rodrik. 2003. “On the Efficacy ofReforms: Policy Tinkering, Institutional Change, and Entrepre-neurship.” Cambridge, Mass.: National Bureau of EconomicResearch Working Paper Series 10455.
Jadresic, Alejandro. 2000. “Promoting Private Investment in RuralElectrification: The Case of Chile.” Washington, D.C.: WorldBank Viewpoint Note 214.
Jaffe, Adam B., Steven R. Peterson, Paul R. Portney, and Robert N.Stavins. 1995. “Environmental Regulation and the Competitive-ness of U.S. Manufacturing: What Does the Evidence Tell Us?”Journal of Economic Literature 33(1):132–63.
Jalan, Jyotsna, and Martin Ravallion. 2003. “Estimating the BenefitIncidence of an Anti-Poverty Program by Propensity-ScoreMatching.” Journal of Business and Economic Statistics 21(1):19–30.
Jappelli, Tullio, and Marco Pagano. 1999. “Information Sharing,Lending and Defaults: Cross-Country Evidence.” Salerno, Italy:Centro Studi in Economia e Finanza, Working Paper 22.
Jenkins, Glenn P., and Chun-Yan Kuo. 2000. “Promoting Export-Oriented Foreign Direct Investment in Developing Countries:Tax and Customs.” Cambridge, Mass.: Harvard Institute forInternational Development Consulting Assistance on EconomicReform II 65.
Jhabvala, Renana, Ratna M. Sudarshan, and Jeemol Unni, eds. 2004.Informal Economy Centre Stage: New Structures of Employment.New Delhi: Sage Publications India.
Jimenez, Emmanuel. 1984. “Tenure Security and Urban Squatting.”Review of Economic and Statistics 66(4):556–67.
Joh, Sung Wook. 2003. “Corporate Governance and Firm Prof-itability: Evidence from Korea before the Economic Crisis.” Jour-nal of Financial Economics 68(2):287–322.
Johnson, Simon, Peter Boone, Alasdir Breach, and Eric Friedman.2000. “Corporate Governance in the Asian Financial Crisis.”Journal of Financial Economics 58(1-2):141–86.
224 WORLD DEVELOPMENT REPORT 2005
15_WDR_References.qxd 8/24/04 3:07 PM Page 224
Johnson, Simon, John McMillan, and Christopher Woodruff.2002a. “Courts and Relational Contracts.” Journal of Law, Eco-nomics and Organization 18(1):221–77.
————. 2002b. “Property Rights and Finance.” American Eco-nomic Review 92(5):1335–56.
Jones, Charles I. 2002. Introduction to Economic Growth. New York:W. W. Norton and Company.
Jones, Leroy, and Il Sakong. 1980. Government, Business and Entre-preneurship in Economic Development: The Korean Case. Cam-bridge, Mass.: Harvard University Press.
Jorgensen, Helle Bank, Michael Peder Pruzan-Jorgensen, MargaretJungk, and Aaron Cramer. 2003. Strengthening Implementation ofCorporate Social Responsibility in Global Supply Chains. Washing-ton, D.C.: World Bank and International Finance Corporation.
Jovanovic, Boyan. 1995. “Learning and Growth.” Cambridge, Mass.:National Bureau of Economic Research Working Paper Series5383.
Kabeer, N. 2003. Gender Mainstreaming in Poverty Eradication andthe Millennium Development Goals: A Handbook for Policy-mak-ers and other Stakeholders. London: Commonwealth Secretariat.
Kagel, John H., and Alvin E. Roth, eds. 1995. The Handbook ofExperimental Economics. Princeton, N.J.: Princeton UniversityPress.
Kahkonen, Satu, Young Lee, Patrick Meagher, and Haji Semboja.2001. “Contracting Practices in an African Economy: IndustrialFirms and Suppliers in Tanzania.” College Park, MD: Universityof Maryland, IRIS Center Working Paper 242.
Kahneman, Daniel, and Amos Tversky, eds. 2000. Choices, Valuesand Frames. Cambridge, UK: Press Syndicate of the University ofCambridge.
Kaminsky, Graciela L., Carmen M. Reinhart, and Carlos A. Végh.2003. “The Unholy Trinity of Financial Contagion.” Journal ofEconomic Perspectives 17(4):51–74.
Kapur, Devesh. 2001. “Diasporas and Technology Transfers.” Jour-nal of Human Development 2(2):265–86.
Katrak, Homi. 1999. “Small-Scale Enterprise Policy in DevelopingCountries: An Analysis of India’s Reservation Policy.” Journal ofInternational Development 11(5):701–15.
Kaufmann, Daniel. 2002. “Rethinking Governance: EmpiricalLessons Challenge Orthodoxy.” World Bank. Washington, D.C.Processed.
————. 2003. “Governance Redux: The Empirical Challenge.”World Bank. Washington, D.C. Processed.
Kaufmann, Daniel, Aart Kraay, and Massimo Mastruzzi. 2003.“Governance Matters III: Governance Indicators for 1996–2002.”Washington, D.C.: World Bank Policy Research Report Series3106.
Kay, John. 2003. The Truth About Markets: Their Genius, Their Lim-its, and Their Follies. London: Allen Lane.
Kee, Hiau Looi, and Bernard Hoekman. 2003. “Imports, Entry, andCompetition Law as Market Disciplines.” Washington, D.C.:World Bank Policy Research Working Paper Series 3031.
Keefer, Philip. 2002. “The Political Economy of Corruption inIndonesia.” World Bank. Washington, D.C. Processed.
————. 2003. “The Political Economy of Public Spending Deci-sions in the Dominican Republic.” World Bank. Washington,D.C. Processed.
————. 2004. “A Review of the Political Economy of Gover-nance: From Property Rights to Voice.” Washington, D.C.: WorldBank Policy Research Working Paper Series 3315.
Keefer, Philip, and Stuti Khemani. 2003. “Democracy, PublicExpenditures, and the Poor.” Washington, D.C.: World Bank Pol-icy Research Working Paper Series 3154.
Keller, Wolfgang. 2001.“International Technology Diffusion.” Cam-bridge, Mass.: National Bureau of Economic Research WorkingPaper Series 8573.
Keller, Wolfgang, and Arik Levinson. 2002. “Pollution AbatementCosts and Foreign Direct Investment Inflows to U.S. States.”Review of Economics and Statistics 84(4):691–703.
Keynes, John M. 1936. General Theory of Employment, Interest andMoney. London: MacMillan and Co. Ltd.
Khemani, R. S. 2002. “Competition Policy, Economic Adjustmentand Competitiveness.” In Ijaz Nabi and Manjula Luthria, eds.,Building Competitive Firms: Incentives and Capabilities. Washing-ton, D.C.: World Bank.
Khemani, Stuti. 2004. “Political Cycles in a Developing Economy:Effects of Elections in the Indian States.” Journal of DevelopmentEconomics 73(1):125–54.
Kikeri, Sunita. 1998. “Privatization and Labor: What Happens toWorkers when Governments Divest?” Washington, D.C.: WorldBank Technical Paper 396.
Kim, Linsu. 1997. Imitation to Innovation: The Dynamics of Korea’sTechnological Learning. Cambridge, Mass.: Harvard BusinessSchool Press.
King, Robert G., and Ross Levine. 1993. “Finance and Growth:Schumpeter Might be Right.” Quarterly Journal of Economics108(3):717–37.
Kingdon, John W. 1995. Agendas, Alternatives, and Public Policies.New York: Longman.
Kirkpatrick, Colin, and David Parker. 2003. “Regulatory ImpactAssessment: Developing its Potential for Use in DevelopingCountries.” Manchester, UK: Centre on Regulation and Compe-tition, Working Paper Series 56.
Klapper, Leora, and Elke Kraus. 2002. “Credit Information Infra-structure and Political Economy Issues.” World Bank. Washing-ton, D.C. Processed.
Klapper, Leora, Luc Laeven, and Raghuram G. Rajan. 2003. “Busi-ness Environment and Firm Entry: Evidence from InternationalData.” Cambridge, Mass.: National Bureau of EconomicResearch Working Paper Series 10380.
Klapper, Leora F., and Inessa Love. Forthcoming. “Corporate Gov-ernance, Investor Protection, and Performance in EmergingMarkets.” Journal of Corporate Finance.
Klapper, Leora F., and Rida Zaidi. 2004. “A Survey of GovernmentRegulation and Intervention in Financial Markets.” Backgroundpaper for the WDR 2005.
Klasen, Stephan. 1999. “Does Gender Inequality Reduce Growthand Development? Evidence from Cross-country Regressions.”
References 225
15_WDR_References.qxd 8/24/04 3:07 PM Page 225

Washington, D.C.: World Bank Policy Research Report on Gen-der and Development Working Paper Series 7.
Klasen, Stephan, and Francesca Lamanna. 2003. “The Impact ofGender Inequality in Education and Employment on EconomicGrowth in the Middle East and North Africa.” University ofMunich. Munich. Processed.
Klasen, Stephan, and Ingrid Woolard. 2001. “Surviving Unemploy-ment without State Support: Unemployment and HouseholdFormation in South Africa.” Bonn, Germany: Institute for theStudy of Labor, Discussion Working Paper 237.
Klein, Daniel B. 1992. “Promise Keeping in the Great Society: AModel of Credit Information Sharing.” Economics and Politics4(2):117–36.
Klein, Michael U., and Bita Hadjimichael. 2003. The Private Sectorin Development: Entrepreneurship, Regulation, and CompetitiveDisciplines. Washington, D.C.: World Bank.
Klein, Michael U., and Neil Roger. 1994. “Back to the Future: ThePotential in Infrastructure and Privatization.” In RichardO’Brian, ed., Finance and the International Economy Vol. 8: TheAMEX Bank Review Prize Essays: In Memory of Robert Marjolin.New York: Oxford University Press.
Klenow, Peter, and Andrés Rodríguez-Clare. 1997.“Economic Growth:A Review Essay.” Journal of Monetary Economics 40(3):597–617.
Klitgaard, Robert. 1998. “International Cooperation Against Cor-ruption.” Finance and Development 35(1):3–6.
————. 2000. “Subverting Corruption.” Finance and Develop-ment 37(2):2–5.
Knack, Stephen, and Philip Keefer. 1995a. “Institutions and Eco-nomic Performance: Cross-Country Tests Using AlternativeInstitutional Measures.” Economics and Politics 7(3):207–227.
————. 1995b. “Institutions and Economic Performance: Cross-Country Tests Using Alternative Institutional Measures.” Eco-nomics and Politics 7(3):207–27.
Kokko, Ari. 2002. “Globalization and FDI Incentives.” Paper pre-sented at the World Bank ABCDE–Europe Conference. Oslo,Norway. June 22.
Komives, Kristin, Dale Whittington, and Xun Wu. 2003. “Infra-structure Coverage and the Poor: A Global Perspective.” In Tim-othy C. Irwin and Penelope J. Brook, eds., Infrastructure for PoorPeople: Public Policy for Private Provision. Washington, D.C.:World Bank.
Kostrzeva, Karina. 2003. “New Quality of Law-drafting Process andPublic Administration in Poland Concerning the Harmonizationwith EU Legislation.” Paper presented at the Regulatory ImpactAssessment Conference. American University of Bulgaria. Febru-ary 27.
Kovacic, William E. 1997. “Getting Started: Creating New Competi-tion Policy Institutions in Transition Economies.” Brooklyn Jour-nal of International Law 23(2):1197–225.
Kraay, Aart. 1999. “Exports and Economic Performance: Evidencefrom a Panel of Chinese Enterprises.” Revue d’Economie duDeveloppement 0(1-2):183–207.
————. 2003. “What Can Cross-Country Regressions Tell UsAbout the Determinants of Pro-Poor Growth?” World Bank.Washington, D.C. Processed.
Krueger, Anne. 1996. “Observations on International Labor Stan-dards and Trade.” Cambridge, Mass.: National Bureau of Eco-nomic Research Working Paper Series 5632.
————, ed. 2000. Economic Policy Reform: The Second Stage.Chicago, IL: University of Chicago Press.
Krugman, Paul. 1997. The Age of Diminished Expectations: U.S. Eco-nomic Policy in the 1990s. Cambridge, Mass.: MIT Press.
Krumm, Kathie, and Homi Kharas. 2004. “Overview.” In KathieKrumm and Homi Kharas, eds., East Asia Integrates: A Trade Pol-icy Agenda for Shared Growth. Washington, D.C.: World Bankand Oxford University Press.
Kubler, Dorothea. 2001. “On the Regulation of Social Norms.” Jour-nal of Law, Economics, and Organization 17(2):449–76.
Kugler, Adriana. 2002. “From Severance Pay to Self-Insurance:Effects of Severance Payments Savings Accounts in Colombia.”Bonn, Germany: Institute for the Study of Labor DiscussionPaper 434.
Kugler, Adriana, and Giovanni Pica. 2003. “Effects of EmploymentProtection and Product Market Regulations on the Italian LaborMarket.” Bonn, Germany: Institute for the Study of Labor, Dis-cussion Paper 948.
Kugler, Maurice. 2001. “Externalities from Foreign Direct Invest-ment: The Sectoral Pattern of Spillovers and Linkages.” Univer-sity of Southampton. Southampton. Processed.
La Porta, Rafael, Florencio López-de Silanes, Andrei Shleifer, andRobert Vishny. 1997. “Legal Determinants of External Finance.”Journal of Finance 52(3):1131–50.
La Porta, Rafael, and Florencio López-de-Silanes. 2001. “CreditorProtection and Bankruptcy Law Reform.” In Stijn Claessens,Simeon Djankov, and Ashoka Mody, eds., Resolution of FinancialDistress: An International Perspective on the Design of BankruptcyLaws. Washington DC: World Bank.
La Porta, Rafael, Florencio López-de-Silanes, and Andrei Shleifer.2002. “Government Ownership of Banks.” Journal of Finance57(1):265–301.
La Porta, Rafael, Florencio López-de-Silanes, Andrei Shleifer, andRobert Vishny. 1998.“Law and Finance.” Journal of Political Econ-omy 106(6):1113–55.
————. 1999.“The Quality of Government.” Journal of Law, Eco-nomics, and Organization 15(1):222–79.
Laevan, Luc, and Christopher Woodruff. 2003. “The Quality of theLegal System, Firm Ownership, and Firm Size.” Washington,D.C.: World Bank Policy Research Working Paper Series 3246.
Laffont, Jean-Jacques, and Jean Tirole. 1991. “The Politics of Gov-ernment Decision Making: A Theory of Regulatory Capture.”Quarterly Journal of Economics 106(4):1089–127.
Lal, Sumir. 2004. “Can Good Economics Ever Be Good Politics?Case Study of the Power Sector in India.” World Bank. Wasing-ton, D.C. Processed.
Lall, Sanjaya. 2000. “Selective Industrial and Trade Policies inDeveloping Countries: Theoretical and Empirical Issues.”Oxford, U.K.: Queen Elizabeth House Working Paper Series 48.
————. 2003. “Reinventing Industrial Strategy: The Role ofGovernment Policy in Building Industrial Competitiveness.”Oxford, U.K.: Queen Elizabeth House Working Paper Series 111.
226 WORLD DEVELOPMENT REPORT 2005
15_WDR_References.qxd 8/24/04 3:07 PM Page 226
Lamech, Ranjit, and Kazim Saeed. 2003. “What InternationalInvestors Look for When Investing in Developing Countries:Results from a Survey of International Investors in the PowerSector.” Washington, D.C.: World Bank Energy and Mining Sec-tor Board Paper Series 6.
Lanjouw, Jean O., and Philip I. Levy. 2002. “Untitled: A Study ofFormal and Informal Property Rights in Urban Ecuador.” Eco-nomic Journal 112(482):986–1019.
Lanjouw, Peter, and A. Shariff. 1999. “Rural Poverty and Non-FarmEmployment in India: Evidence from Survey Data.” Charles Uni-versity. Prague. Processed.
Lanjouw, Peter, and Nicholas Stern. 1998. Economic Development inPalanpur over Five Decades. Oxford and New York: Oxford Uni-versity Press.
Lawson, Cina, and Natalie Meyenn. 2000. “Bringing Cellular PhoneService to Rural Areas: Grameen Telecom and Village Pay phonesin Bangladesh.” Washington, D.C.: World Bank Public Policy forthe Private Sector Note 205.
Lax, David A., and James K. Sebenis. 1986. The Manager as Negotia-tor: Bargaining for Co-operation and Competitive Gain. NewYork: Free Press.
Lederman, Daniel, and William F. Maloney. 2003. “R&D and Devel-opment.” Washington, D.C.: World Bank Policy Research Work-ing Paper Series 3024.
Lederman, Daniel, and Laura Saenz. 2003. “Innovation and Devel-opment Around the World 1960–2000.” World Bank. Washing-ton, D.C. Processed.
Lee, Charles, and David Ng. 2002. “Corruption and InternationalValuation: Does Virtue Pay?” Cornell University. Cornell.Processed.
Lee, Norman. 2002. “Developing and Applying Regulatory ImpactAssessment Methodologies in Low and Middle Income Coun-tries.” Manchester, U.K.: Centre on Regulation and Competition,Working Paper Series 30.
Lee, Sang M., and Suzzane J. Peterson. 2000. “Culture, Entrepre-neurial Orientation, and Global Competitiveness.” Journal ofWorld Business 35(4):401–16.
Leite, Carlos, and Jens Weidmann. 1999.“Does Mother Nature Cor-rupt? Natural Resources, Corruption, and Economic Growth.”Washington, D.C.: International Monetary Fund Working PaperWP/99/85. Available on line athttp://www.imf.org/external/pubs/cat/wp1_sp.cfm?s_year=1997&e_year=2001&brtype=default.
Levi, Margaret. 1988. Of Rule and Revenue. Berkeley: University ofCalifornia Press.
Levine, Ross. 1997. “Financial Development and EconomicGrowth: Views and Agenda.” Journal of Economic Literature35(2):688–726.
Levine, Ross, Norman Loayza, and Thorsten Beck. 2000. “FinancialIntermediation and Growth: Causality and Causes.” Journal ofMonetary Economics 46(1):31–77.
Levinsohn, James. 1993. “Testing the Imports-as-Market-DisciplineHypothesis.” Journal of International Economics 35(1-2):1–22.
Levitt, Arthur. 1998. “The Importance of High Quality AccountingStandards.” Accounting Horizons 12:79–82.
Levy, Brian, and Pablo T. Spiller. 1994. “The Institutional Founda-tions of Regulatory Commitment: A Comparative Analysis ofTelecommunications Regulation.” Journal of Law, Economics, andOrganization 10(2):201–46.
————, eds. 1996. Regulations, Institutions, and Commitment:Comparative Studies of Telecommunications. Cambridge, U.K.:Cambridge University Press.
Levy-Yeyati, Eduardo, María Soledad Martinez Peria, and Sergio L.Schmukler. 2004. “Market Discipline in Emerging Economies:Beyond Bank Fundamentals.” In William C. Hunter, George G.Kaufman, Claudio Borio, and Kostas Tsatsaronis, eds., MarketDiscipline across Countries and Industries. Cambridge, Mass.:MIT Press.
Lewis, William W. 2004. The Power of Productivity: Wealth, Povertyand the Threat to Global Stability. Chicago: University of ChicagoPress.
Li, Hongyi, Lyn Squire, and Heng-fu Zou. 1998. “Explaining Inter-national and Intertemporal Variations in Income Inequality.”Economic Journal 108(406):26–43.
Li, Shaomin, Shuhe Li, and Weiying Zhang. 1999. “Cross-regionalCompetition and Privatization in China.”MOCT-MOST 9(1):75–8.
Liautaud, Gerard. 2001. “Maintaining Roads: Experience with Out-put-Based Contracts in Argentina.” In Penelope J. Brook andSuzanne M. Smith, eds., Contracting for Public Services: Output-based Aid and Its Applications. Washington, D.C.: World Bank.
Libecap, Gary D. 1994. Contracting for Property Rights. Cambridge,U.K..: Cambridge University Press.
Lifsher, Marc. 2001. “If He Can Fight Crime There, He’ll Fight ItAnywhere.” Wall Street Journal, March 8. Page: A18.
Limão, Nuno, and Anthony J. Venables. 2001. “Infrastructure, Geo-graphical Diadvantage, Tansport Costs, and Trade.” World BankEconomic Review 15(3):451–79.
Lin, Justin Yifu. 1992. “Rural Reforms and Agricultural Growth inChina.” American Economic Review 82(1):34–51.
Lipsey, Richard, and Kevin Lancaster. 1956. “The General Theory ofSecond Best.” Review of Economic Studies 25(1):11–32.
List, John A., Daniel L. Millimet, Per G. Fredricksson, and W. War-ren McHone. 2003. “Effects of Environmental Regulations onManufacturing Plant Births: Evidence from a Propensity ScoreMatching Estimator.” Review of Economics and Statistics85(4):944–52.
Litvin, Daniel. 2003. Empires of Profit: Commerce, Conquest andCorporate Responsibility. New York: Texere.
Liu, Jin-Tan, Meng-Wen Tsou, and James K. Hammitt. 1999.“Export Activity and Productivity: Evidence from the TaiwanElectronics Industry.” Weltwirtschaftliches Archiv 135(4):675–91.
Lobo, Albert, and Suresh Balakrishnan. 2002. Report Card on Ser-vice of Bhoomi Kiosks: An Assessment of Benefits by Users of theComputerized Land Records System in Karnataka. Bangalore,India: Public Affairs Centre.
Londoño, Juan Luis, and Rodrigo Guerrero. 2000. “Violencia enAmerica Latina: Epidemiología y Costos.” In Rodrigo Guerrero,Alejandro Gaviria, and Juan Luis Londoño, eds., Asalto al Desar-rollo: Violencia en América Latina. Washington, D.C.: Inter-American Development Bank.
References 227
15_WDR_References.qxd 8/24/04 3:07 PM Page 227

López, Humberto. 2003. Pro Growth, Pro Poor: Is there a Trade off?Washington, D.C.: World Bank.
Love, Inessa, and Nataliya Mylenko. 2003. “Credit Reporting andFinancing Constraints.” Washington, D.C.: World Bank PolicyResearch Working Paper Series 3142.
Lovei, Laszlo, and Alastair McKechnie. 2000. “The Costs of Corrup-tion for the Poor.” Washington, D.C.: World Bank Public Policyfor the Private Sector Note 207.
Lumpkin, G. T., and Gregory G. Dess. 1996. “Clarifying the Entre-preneurial Orientation Construct and Linking It to Perfor-mance.” Academy of Management Review 21(1):135–72.
Lund, Frances, and Caroline Skinner. 2004. “The Investment Cli-mate for the Informal Economy: A Case of Durban, SouthAfrica.” Background paper for the WDR 2005.
Luthria, Manjula, and Keith E. Maskus. 2004. “Protecting IndustrialInventions, Authors’ Rights, and Traditional Knowledge: Rele-vance, Lessons, and Unresolved Issues.” In Keith E. Krumm andHomi Kharas, eds., East Asia Integrates: A Trade Policy for SharedGrowth. Washington, D.C.: World Bank and Oxford UniversityPress.
MacIsaac, Donra, and Martin Rama. 1997. “Determinants ofHourly Earnings in Ecuador: The Role of Labor Market Regula-tions.” Journal of Labor Economics 15(3):136–65.
MacIsaac, Donra, and Martin Rama. 2001. “Mandatory SeverancePay: Its Coverage and Effects in Peru.” Washington, D.C.: WorldBank Policy Research Working Paper Series 2626.
Macours, Karen. 2003.“Insecurity of Property Rights and Matchingin Land Rental Markets in Latin America.” PhD thesis. Universityof California at Berkeley.
Madani, Dorsati. 1999. “A Review of the Role and Impact of ExportProcessing Zones.” Washington, D.C.: World Bank PolicyResearch Working Paper Series 2238.
Maddison, Angus. 1995. Monitoring the World Economy. Paris:Organization for Economic Co-operation and Development.
————. 2003. The World Economy: Historical Statistics. Paris:Organization for Economic Co-operation and Development.
Maggi, Giovanni, and Andres Rodríguez-Clare. 1998. “The Value ofTrade Agreements in the Presence of Political Pressures.” Journalof Political Economy 106(3):574–601.
Magno, Marife T., and Richard L. Meyer. 1988. “GuaranteeSchemes: An Alternative to the Supervised Credit Program.”Paper presented at the Financial Intermediation in the Rural Sec-tor: Research Results and Policy Issues Conference. Manila,Philippines. September 26.
Majone, Giandomenico. 1996. “Temporal Consistency and PolicyCredibility: Why Democracies Need Non-Majoritarian Institu-tions.” Florence: European University Institute Robert Schu-mann Center Working Paper 57.
Mallon, Raymond. 2004. “Managing Investment Climate Reforms:Vietnam Case Study.” Background paper for the WDR 2005.
Maloney, William F. 2004. “Informality Revisited.” World Develop-ment 32(7):1159–78.
Maloney, William F., and Jairo Núñez. 2004.“Measuring the Impactof Minimum Wages: Evidence from Latin America.” In JamesHeckman and Carmen Pagés, eds., Law and Employment: Lessons
from Latin America and the Caribbean. Cambridge, Mass.:National Bureau of Economic Research.
Maloney, William F., and Eduardo Pontual Ribeiro. 2001. “Employ-ment and Wage Effects of Mexican Unions—A Case of ExtremeEfficient Bargaining.” World Bank. Washington, D.C. Processed.
Malthus, Thomas. 1798. Essays on the Principle of Population. Lon-don: J. Johnson.
Management Systems International. 1996. Case Study of Impact onSub-Borrower Enterprises in Tow PRE Projects, Philippines. Wash-ington, D.C.: Office of Program Review, Bureau of Private Enter-prise, USAID.
Mani, Sunil. 2001a. “Globalization, Markets for Technology and theRelevance of Innovation Policies in Developing Countries.”Nairobi: African Technology Policy Studies Network SpecialPaper 2.
————. 2001b. “Role of Government in Promoting Innovationin the Enterprise Sector: An Analysis of the Indian Experience.”Maastricht, The Netherlands: United Nations University Insti-tute for New Technologies Discussion Paper 2001-3.
Martin, John P., and David Grubb. 2001. “What Works and forWhom: A Review of OECD Countries’ Experiences with ActiveLabour Market Policies.” Swedish Economic Policy Review18(2):9–56.
Martin, Will, and Keith E. Maskus. 2001. “Core Labor Standardsand Competitiveness: Implications for Global Trade Policy.”Review of International Economics 9(2):317–28.
Martinez Peria, María Soledad, and Sergio Schmukler. 2001. “DoDepositors Punish Banks for ‘Bad’ Behaviour?: Market Disci-pline, Deposit Insurance, and Banking Crisis?” Journal of Finance56(3):1029–51.
Maskus, Keith E. 1997. “Should Core Labor Standards be ImposedThrough International Trade Policy?” Washington, D.C.: WorldBank Policy Research Working Paper Series 1817.
————. 2002. Benefiting from Intellectual Property Protection.Washington, D.C.: World Bank.
Mattei, Ugo. 2000. Basic Principles of Property Law: A ComparativeLegal and Economic Introduction. Westport, Conn: GreenwoodPress.
Matusz, Steven J., and David Tarr. 1999. “Adjusting to Trade PolicyReform.” Washington, D.C.: World Bank Policy Research Work-ing Paper Series 2142.
Maxfield, Sylvia, and Ben Ross Schneider. 1997. Business and theState in Developing Countries. Ithaca, N.Y.: Cornell UniversityPress.
Mazza, Jacqueline. 1999. “Unemployment Insurance: Case Studiesand Lessons for Latin America and the Caribbean.” Washington,D.C.: Inter-American Development Bank, Technical StudyRE2/SO2.
McArthur, John W., and Jeffrey D. Sachs. 2001. “Institutions andGeography: Comment on Acemoglu, Johnson and Robinson(2000).” Cambridge, Mass.: National Bureau of EconomicResearch Working Paper Series 8114.
McCubbins, Marthew, and Arthur Lupia. 1998. “Political Credibil-ity and Economic Reform.” World Bank. Washington, D.C.Processed.
228 WORLD DEVELOPMENT REPORT 2005
15_WDR_References.qxd 8/24/04 3:07 PM Page 228

McDonald, G. J. 1994. “Testimony Given to the U.S. Senate.” InRonald G. Slaby, Renée Wilson-Brewer, and Kimberly Dash, eds.,Aggressors, Victims and Bystanders: Thinking and Acting to Pre-vent Violence. Newton, Mass.: Education Development Center.
McGrath, Rita G., Ian C. MacMillan, and Sari Scheinberg. 1992.“Elitists, Risk-Takers, and Rugged Individualists? An ExploratoryAnalysis of Cultural Differences Between Entrepreneurs andNon-Entrepreneurs.” Journal of Business Venturing 7(2):115–135.
McKinsey & Company. 2002. McKinsey Global Investor Opinion Surveyon Corporate Governance. Washington, D.C.: McKinsey & Company.
McKinsey Global Institute. 2003. New Horizons: MultinationalCompany Investment in Developing Economies. San Francisco,C.A.: McKinsey & Company.
McMillan, John. 2002. Reinventing the Bazaar: A Natural History ofMarkets. New York: W.W. Norton and Company.
McMillan, John, and Christopher Woodruff. 2002. “The CentralRole of Entrepreneurs in Transition Economies.” Journal of Eco-nomic Perspectives 16(3):153–70.
McMillan, Margaret, Dani Rodrik, and Karen Horn Welch. 2002.“When Economic Reform Goes Wrong: Cashews in Mozam-bique.” Cambridge, Mass.: National Bureau of EconomicResearch Working Paper Series 9117.
Mead, Donald C., and Carl Liedholm. 1998. “The Dynamics ofMicro and Small Enterprises in Developing Countries.” WorldDevelopment 26(1):61–74.
Megginson, William L., and Jeffry M. Netter. 2001. “From State toMarket: A Survey of Empirical Studies on Privatization.” Journalof Economic Literature 39(2):321–89.
Mendoza, Enrique G., and Linda L. Tesar. 2003.“Winners and Losers ofTax Competition in the European Union.” Cambridge, Mass.:National Bureau of Economic Research Working Paper Series 10051.
Menezes Filho, N., H. Zylberstajn, J. P. Chahad, and E. Pazello. 2002.“Unions and the Economic Performance of Brazilian Establish-ments.” Washington, D.C.: Inter-American Development Bank,Research Network Working Paper R464.
Messick, Richard. 1999. “Reducing Court Delays: Five Lessons fromthe United States.” Washington, D.C.: World Bank, Poverty Reduc-tion and Economic Management Network (PREM) Note 34.
Micklethwait, John, and Adrian Wooldridge. 2003. The Company: AShort History of a Revolutionary Idea. New York: Modern Library.
Middleton, John, Adrian Ziderman, and Arvil van Adams. 1993.Skills for Productivity: Vocational Education and Training inDeveloping Countries. Washington, D.C.: World Bank.
Midlarsky, Manus I. 1999. The Evolution of Inequality: War, StateSurvival, and Democracy in Comparative Perspective. Stanford,C.A.: Stanford University Press.
MIGA (Multilateral Investment Guarantee Agency). 2002. ForeignDirect Investment Survey. Washignton, D.C.: Multilateral Invest-ment Guarantee Agency.
Migliorisi, Stefano, and Marco Galmarini. 2004. “Donor Assistanceto Investment Climate Reforms.” Background paper for theWDR 2005.
Miles, Rebecca. 2002. “Employment and Unemployment in Jordan:the Importance of the Gender System.” World Development30(3):413–27.
Milgrom, Paul R., Douglas C. North, and Barry R. Weingast. 1990.“The Role of Institutions in the Revival of Trade: The Law Mer-chant, Private Judges, and the Champagne Fairs.” Economics andPolitics 2(1):1–23.
Miller, Danny. 1983. “The Correlates of Entrepreneurship in ThreeTypes of Firms.” Management Science 29(7):770–91.
Miller, Danny, and Peter H. Friesen. 1982. “Innovation in Conserv-ative and Entrepreneurial Firms: Two Models of StrategicMomentum.” Strategic Management Journal 3(1):1–25.
Miller, Margaret. 2003. “Credit Reporting Systems around theGlobe: The State of the Art in Public Credit Registries and Pri-vate Credit Reporting Firms.” In Margaret Miller, ed., CreditReporting Systems and the International Economy. Cambridge,Mass.: MIT Press.
Minot, Nicholas, and Francesco Goletti. 2000. Rice Market Liberal-ization and Poverty in Vietnam. Washington, D.C.: InternationalFood Policy Research Institute, Research Report 114.
Miralles, Dennis R. 2002. “Government Administrative Practices asObstacles in Investment.” Paper presented at the APEC Seminaron Investments’ One Stop Shop. Lima, Peru.
Mitra, Pradeep, and Nicholas Stern. 2003. “Tax Systems in Transi-tion.” Washington, D.C.: World Bank Policy Research WorkingPaper Series 2947.
Mitullah, Winnie V. 2004. “Street Vending in African Cities: A Syn-thesis of Empirical Findings From Kenya, Cote D’ivoire, Ghana,Zimbabwe, Uganda and South Africa.” Background paper for theWDR 2005.
Mnookin, Robert, and William Kornhauser. 1979. “Bargaining inthe Shadow of the Law: The Case of Divorce.” Yale Law Journal88:950–97.
Mockus, Antanas. 2002. “Cultura Ciudadana: Programa Contra laViolencia en Santa Fe de Bogotá, Colombia, 1995–1997.” Wash-ington, D.C.: Inter-American Development Bank, SustainableDevelopment Department, Technical Paper 127.
Mody,Ashoka. 1999.“Industrial Policy After the East Asian Crisis: FromOutward Orientation to New Internal Capabilities?” Washington,D.C.: World Bank Policy Research Working Paper Series 2112.
Mondino, Guillermo, and Silvia Montoya. 2004. “The Effects ofLabor Market Regulations on Employment Decisions by Firms:Empirical Evidence for Argentina.” In James Heckman and Car-men Pagés, eds., Law and Employment: Lessons from the LatinAmerica and the Caribbean. Cambridge, Mass. and Chicago, I.L.:National Bureau of Economic Research and University of Chicago.
Montenegro, Claudio E., and Carmen Pagés. 2004. “Who Benefitsfrom Labor Market Regulations? Chile 1960–1998.” In JamesHeckman and Carmen Pagés, eds., Law and Employment: Lessonsfrom the Latin America and the Caribbean. Cambridge, Mass.:National Bureau of Economic Research.
Montiel, Peter, and Carmen M. Reinhart. 1999. “Do Capital Con-trols and Macroeconomic Policies Influence the Volume andComposition of Capital Flows? Evidence from the 1990s.” Jour-nal of International Money and Finance 18(4):519–35.
Moore, Mick. 1998. “Death Without Taxes: Democracy, StateCapacity, and Aid Dependence in The Fourth World.” In MarkRobinson and Gordon White, eds., The Democratic Developmen-
References 229
15_WDR_References.qxd 8/24/04 3:07 PM Page 229

tal State: Political and Institutional Design. New York: OxfordUniversity Press.
Moran, Theodore H. 1998. Foreign Direct Investment and Develop-ment. Washington, D.C.: Institute for International Economics.
————. 2001. Parental Supervision: The New Paradigm for For-eign Direct Investment and Development. Washington, D.C.: Insti-tute for International Economics.
————. 2002. Beyond Sweatshops: Foreign Direct Investment andGlobalization in Developing Countries. Washington, D.C.: Brook-ings Institution.
Morduch, Jonathan. 1997.“The Microfinance Revolution.” HarvardUniversity. Cambridge, Mass. Processed.
————. 1999a. “Between the State and the Market: Can InformalInsurance Patch the Safety Net?” World Bank Research Observer14(2):187–207.
————. 1999b.“The Microfinance Promise.” Journal of EconomicLiterature 37(4):1569–614.
Morduch, Jonathan, Elizabeth Littlefield, and Syed Hashemi. 2003.“Is Microfinance an Effective Strategy to Reach the MillenniumDevelopment Goals?” Washington, D.C.: CGAP Focus Note 24.
Morisset, Jacques. 2003a. “Does a Country Need a PromotionAgency to Attract Foreign Direct Investment? A Small AnalyticalModel Applied to 58 Countries.” Washington, D.C.: World BankPolicy Research Working Paper Series 3028.
————. 2003b. “Tax Incentives: Using Tax Incentives to AttractForeign Direct Investment.” Washington, D.C.: World Bank Pri-vate Sector and Infrastructure Network Viewpoint Note 253.
Morisset, Jacques, and Kelly Andrews-Johnson. 2003. “The Effec-tiveness of Promotion Agencies at Attracting Foreign DirectInvestment.” Washington, D.C.: Foreign Investment AdvisoryService Occasional Paper 16.
Morris, Fiorina, and Kenneth Shepsle. 1990. “A Positive Theory ofNegative Voting.” In John A. Ferejohn and James J. Kuklinski,eds., Information and Democratic Processes. Urbana,I.L.: Univer-sity of Illinois Press.
Morris, Sebastian, Rakesh Basant, Keshab Das, K. Ramachandran,and Abraham Koshy. 2001. The Growth and Transformation ofSmall Firms in India. New Delhi: Oxford University Press.
Muendler, Marc-Andreas. 2002. “Trade, Technology, and Produc-tivity: A Study of Brazilian Manufacturers.” University of Cali-fornia, San Diego. San Diego, CA. Processed.
Mukherjee, Amitabba. 2002. “Lessons from Armenia’s Institutionaland Governance Review.” Washington, D.C.: World Bank, PublicSector, PREM Note 76.
Muller, Jerry Z. 2002. The Mind and the Market: Capitalism in Mod-ern European Thought. New York: Anchor Books.
Mulligan, Casey. 2002. “Capital Tax Incidence: First Impressionsfrom the Time Series.” Cambridge, Mass.: National Bureau ofEconomic Research Working Paper Series 9374.
Murdoch, James C., and Todd Sandler. 2002. “Economic Growth,Civil Wars, and Spatial Spillovers.” Journal of Conflict Resolution46(1):91–110.
Murphy, Kevin M., Andrei Shleifer, and Robert W. Vishny. 1993.“Why is Rent-Seeking so Costly to Growth?” American EconomicReview 83(2):409–14.
Mwangi, Anthony. 2003. “Final Report on the Survey on CustomsReform and Modernization in Mozambique.” World Bank.Washington, D.C. Processed.
Mwangi, Ester, Paul Ongugo, and Jane Njuguna. 2000. “Decentral-izing Institutions for Forest Conservation in Kenya: ComparativeAnalysis of Resource Conservation Outcomes under NationalPark and Forest Reserve Regimes in Mt. Elgon Forest Ecosystem.”Paper presented at the 8th Conference of the International Asso-ciation for the Study of Common Property. Bloomington, Indi-ana. May 31.
Narayan, Deepa, Robert Chambers, Meera Kaul Shah, and PattiPetesch. 2000. Voices of the Poor: Crying Out for Change. Wash-ington, D.C.: World Bank.
Nathan Associates Inc. 2003. Intellectual Property and DevelopingCountries: An Overview. Arlington, VA: Nathan Associates Inc.
Navarrete, Camilo. 2004. “Managing Investment Climate Reforms:Colombian Ports Sector Reform Case Study.” Background paperfor the WDR 2005.
Nestoriak, Nicole. 2004. “Endogenous Technology and Local LaborMarket Skill.” University of Maryland. College Park, M.D.Processed.
Newbery, David, and Michael Pollitt. 1997. “The Restructuring andPrivatization of Britain’s Central Electricity Generating Board(CEGB)—Was it Worth it?” Journal of Industrial Economics45(3):269–303.
Newell, Richard G., James N. Sanchirico, and Suzi Kerr. 2002. “AnEmpirical Analysis of New Zealand’s ITQ Markets.” Paper pre-sented at the Fisheries on the Global Economy (IIFET) Confer-ence. Wellington. August 19.
Nicholls, J. 1998. “Student Financing in the Developing World:Applying Income-contingent Approaches to Cost Recovery.”University of Melbourne, Department of Science and MathsEducation. Melbourne, Australia. Processed.
Nicholson, Michael W. 2003. “Quantifying Antitrust Regimes.” Fed-eral Trade Commission. Washington, D.C. Processed.
Nickell, Stephen, and Richard Layard. 1999. “Labor Market Institu-tions and Economic Performance.” In Orley Ashenfelter and DavidCard, eds., Handbook of Labor Economics. Amsterdam: Elsevier B.V.
Nicoletti, Giuseppe, Robert Haffner, Stephen Nickell, Stefano Scar-petta, and Gylfi Zoega. 2001. “European Integration, Liberaliza-tion and Labor-Market Performance.” In Giuseppe Bertola, TitoBoeri, and Giuseppe Nicoletti, eds., Welfare and Employment in aUnited Europe. Cambridge, Mass.: MIT Press.
Nicoletti, Giuseppe, and Stefano Scarpetta. 2003. “Regulation, Pro-ductivity and Growth: OECD Evidence.” Economic Policy18(36):9–51.
Njoku, J. E., and P. C. Obasi. 1991. “Loan Repayment and its Deter-minants Under the Agricultural Credit Guarantee Scheme inImo State, Nigeria.” Savings and Development 2:167–80.
Noland, Marcus, and Howard Pack. 2003. Industrial Policy in an Eraof Globalization: Lessons from Asia. Washington, D.C.: Institutefor International Economics.
North, Douglass C. 1993. “Institutions and Credible Commit-ment.” Journal of Institutional and Theoretical Economics149(1):11–23.
230 WORLD DEVELOPMENT REPORT 2005
15_WDR_References.qxd 8/24/04 3:08 PM Page 230

North, Douglass C., and Barry R. Weingast. 1989. “Constitutionsand Commitment: The Evolution of Institutions GoverningPublic Choice in Seventeenth-century England.” Journal of Eco-nomic History 49(4):803–32.
Norton, Seth W. 2002. “Population Growth, Economic Freedom,and the Rule of Law.” Montana: The Property and EnvironmentResearch Center (PERC) Policy Series 24. Available on line athttp://www.perc.org/pdf/ps24.pdf.
Nugent, Jeffrey B., and Seung-Jae Yhee. 2002. “Small and MediumEnterprises in Korea: Achievements, Constraints and PolicyIssues.” Small Business Economics 18(1-3):85–119.
O’Malley, Chris. 2004. “New Hope for a United Base.” The Indi-anapolis Star, April 30.
Oates, Wallace E. 2001. “Fiscal Competition and Harmonization?Some Reflections.” National Tax Journal 54(3):507–12.
OECD. 1997a. Employment Outlook—1997. Paris: Organization forEconomic Co-operation and Development.
————. 1997b. Regulatory Reform. Paris: Organization for Eco-nomic Co-operation and Development.
————. 1999a. Regulatory Reform in Japan. Paris: Organizationfor Economic Co-operation and Development.
————. 1999b. Regulatory Reform in Mexico. Paris: Organizationfor Economic Co-operation and Development.
————. 2000a. International Trade and Core Labour Standards.Paris: Organization for Economic Co-operation and Develop-ment.
————. 2000b. Regulatory Reform in Korea. Paris: Organizationfor Economic Co-operation and Development.
————. 2001. Codes of Corporate Conduct: Expanded Review oftheir Contents. Paris: Organization for Economic Co-operationand Development.
————. 2002a. Agricultural Policies in OECD Countries: Monitor-ing and Evaluation 2002. Paris: Organization for Economic Co-operation and Development.
————. 2002b. Highlights of Public Sector Pay and Employment:2002 Update. Paris: Organization for Economic Co-operationand Development.
————. 2002c. Regulatory Policies in OECD Countries: FromInterventionism to Regulatory Governance. Paris: Organizationfor Economic Co-operation and Development.
————. 2002d. Revenue Statistics 1965–2001:2002 Edition. Paris:Organization for Economic Co-operation and Development.
————. 2003a. OECD Economic Surveys: Chile. Paris: Organiza-tion for Economic Co-operation and Development.
————. 2003b. OECD Investment Policy Reviews—China:Progress and Reform Challenges. Paris: Organization for Eco-nomic Co-operation and Development.
————. 2003c. “OECD/World Bank Budget Practices and Proce-dures Database”. Paris, Organization for Economic Co-operationand Development. Available on line at http://ocde.dyndns.org/.
————. 2003d. Overview of Donor and Agency Policies inTrade-related Technical Assistance and Capacity Building.Paris: Organization for Economic Co-operation and Develop-ment.
————. 2003e. Public Sector Transparency and InternationalInvestment Policy. Paris: Organization for Economic Co-opera-tion and Development.
————. 2003f. Tax Incentives for Research and Development:Trends and Issues. Paris: Organization for Economic Co-opera-tion and Development.
————. 2003g. The E-Government Imperative. Paris: Organiza-tion for Economic Cooperation and Development.
OECD, and WTO. 2003. Second Joint WTO/OECD Report on Trade-related Technical Assistance and Capacity Building. Paris andGeneva: World Trade Organization and Organization for Eco-nomic Co-operation and Development.
OECD DAC. 2001. DAC Recommendation on Untying OfficialDevelopment Assistance to the Least Developed Countries. Paris:Organization for Economic Co-operation and Development.Development Assistance Committee.
————. 2003. Development Cooperation Report 2002. Paris:Organization for Economic Co-operation and Development.Development Assistance Committee.
————. 2004. Development Cooperation Report 2003. Paris:Organization for Economic Co-operation and Development.Development Assistance Committee.
Olivier de Sardan, J. P. 1999. “A Moral Economy of Corruption inAfrica.” Journal of Modern African Studies 37(1):25–52.
Olofsgård, Anders F. 2004. “The Political Economy of Reform:Institutional Change as a Tool for Political Credibility.” Back-ground paper for the WDR 2005.
Omran, Mohammed. 2003. “Privatization, State-Ownership, andBank Performance in Egypt.” Paper presented at the Bank Priva-tization, World Bank Conference. Washington, D.C. November20.
Open Society Institute. 2002. Corruption and Anti-Corruption Pol-icy in Lithuania. Monitoring the EU Accession Process: Corruptionand Anti-Corruption Policy. New York: Open Society Institute(OSI).
Ostrom, Elinor. 2000. “Collective Action and the Evolution ofSocial Norms.” Journal of Economic Perspectives 14(3):137–58.
Pack, Howard. 2000. “Industrial Policy: Growth Elixir or Poison.”World Bank Research Observer 15(1):47–67.
Padilla, A. Jorge, and Marco Pagano. 2000. “Sharing Default Infor-mation as a Borrower Discipline Device.” European EconomicReview 44(10):1951–80.
Pagés, Carmen, and Claudio E. Montenegro. 1999. “Job Securityand the Age Composition of Employment: Evidence from Chile.”Washington, D.C.: Inter-American Development Bank, Office ofthe Chief Economist Working Paper Series 398.
Palmade, Vincent. 2004. “The Importance of Sector Level Perspec-tive: Findings and Methodology of the McKinsey Global Insti-tute.” World Bank. Washington, D.C. Processed.
Panagariya, Arvind. 2000. “Evaluating the Case for Export Subsi-dies.” Washington, D.C.: World Bank Policy Research WorkingPaper Series 2276.
————. 2003. “India in the 1980s and 1990s: A Triumph ofReforms.” Paper presented at the Tale of Two Giants: India’s and
References 231
15_WDR_References.qxd 8/24/04 3:08 PM Page 231

China’s Experience with Reform and Growth Conference. NewDelhi. November 14.
Parente, Stephen L., and Edward C. Prescott. 2000. Barriers toRiches. Cambridge, Mass.: MIT Press.
Parra, Antonio. 2000. “Applicable Substantive Law in ICSID Arbi-trations Initiated under Investment Treaties.” Paper presented atthe New Trends in Governing Law Conference. Washington, D.C.November 2.
Pattillo, Catherine. 1998. “Investment, Uncertainty, and Irre-versibility in Ghana.” IMF Staff Papers 45(3):522–53.
Paulsson, Jan. 1996. “Dispute Resolution.” In Robert Pritchard, ed.,Economic Development, Foreign Investment and Law. London,The Hague, and Boston: International Bar Association.
Paunovic, Igor. 2000. “Growth and Reforms in Latin America andthe Caribbean in the 1990s.” Santiago de Chile: United NationsEconomic Commission for Latin America and the Caribbean(ECLAC), Economic Development Division, Serie ReformasEconómicas 70.
Pavcnik, Nina. 2003. “Trade Liberalization, Exit, and ProductivityImprovements: Evidence from Chilean Plants.” Review of Eco-nomic Studies 69(238):245–76.
Peltzman, Sam. 1976. “Toward a more General Theory of Regula-tion.” Journal of Law and Economics 19(2):211–40.
Pender, John, Berhanu Gebremedhin, Samuel Benin, and SimeonEhui. 2001. “Strategies for Sustainable Agricultural Developmentin the Ethiopian Highlands.” American Journal of AgriculturalEconomics 83(5):1231–40.
Perkins, Dwight. 2000. “Law, Family Ties, and the East Asian Way ofBusiness.” In Lawrence Harrison and Samuel Huntington, eds.,Culture Matters: How Values Shape Human Progress. New York:Basic Books.
Persson, Torsten, and Guido Tabellini. 2000. “Double-edged Incen-tives: Institutions and Policy Coordination.” In Gene M. Gross-man and Kenneth S. Rogoff, eds., Handbook of International Eco-nomics Vol. 3. Amsterdam; New York and Oxford: Elsevier,North-Holland.
Peters, Alan, and Peter Fisher. 2004. “The Failures of EconomicDevelopment Incentives.” Journal of the American Planning Asso-ciation 70(1):27–37.
Philipsen, Niels J. 2003. “Overview of the Commission’s Stocktak-ing Exercise.” Paper presented at the Liberal Professions Confer-ence. Brussels. October 28.
Phillips, Charles F. Jr. 1993. The Regulation of Public Utilities: The-ory and Practice (Third Edition). Arlington, V.A.: Public UtilitiesReports.
Pierre, Gaëlle, and Stefano Scarpetta. 2004. “Do Employers’ Percep-tions Square with Actual Labor Regulations?” Background paperfor the WDR 2005.
————. 2004. “How Labor Market Policy Can Combine Work-ers’ Protection and Job Creation.” Background paper for theWDR 2005.
Pigou, Arthur C. 1932. The Economics of Welfare, 4th Edition. Lon-don: MacMillan and Co. Ltd.
Piore, Michael J., and Charles F. Sabel. 1984. The Second IndustrialDivide: Possibilities for Prosperity. New York: Basic Books.
Pissarides, Christopher. 2000. “Human Capital and Growth: A Syn-thesis Report.” Paris: OECD Development Centre, TechnicalPaper 168.
Pistor, Katharina, Yoram Keinan, Jan Kleinheisterkamp, and MarkD. West. 2003. “Evolution of Corporate Law and the TransplantEffect.” World Bank Research Observer 18(1):89–112.
Pistor, Katherina. 2000. “Patterns of Legal Change: Shareholder andCreditor Rights in Transition Economies.” European BusinessOrganization Law Review 1(1):59–108.
Pistor, Katherina, Martin Raiser, and Stanislav Gelfer. 2000. “Lawand Finance in Transition Economies: Lessons from Six Coun-tries.” Economics of Transition 8(2):325–68.
Polinsky, Mitchell A., and Steven Shavell. 2000. “The EconomicTheory of Public Enforcement of Law.” Journal of Economic Lit-erature 38(1):45–76.
Pollitt, Michael G. 2003. “Electricity Reform in Chile andArgentina: Lessons for Developing Countries.” Paper presentedat the Cambridge-MIT Institute Electricy Power AutumnResearch Seminar. Cambridge, Mass. November 7.
Porter, Michael E. 1998. “Clusters and Competition: New Agendasfor Companies, Governments, and Institutions.” In Michael E.Porter, ed., On Competition. Cambridge, Mass.: Harvard Busi-ness Review.
————. 2000. “Attitudes, Values, Beliefs, and the Microeconom-ics of Prosperity.” In Lawrence E. Harrison and Samuel P. Hunt-ington, eds., Culture Matters: How Values Shape Human Progress.New York, N.Y.: Basic Books.
————. 2003. “The Economic Performance of Regions.”Regional Studies 37(6-7):549–78.
Pound, Roscoe. 1959. Jurisprudence vol. III. Saint Paul, Minnesota:West Publishing Company.
PPIAF. 2003. FY2003 Annual Report. Washington, D.C.: Public-Pri-vate Infrastructure Advisory Facility, World Bank.
PPIAF, and World Bank. 2002. Private Solutions for Infrastructure inCambodia. Washington, D.C.: World Bank.
Pritchett, Lant. 1997. “Divergence, Big Time.” Journal of EconomicPerspectives 11(3):3–17.
————. 2001. “Where Has All the Education Gone?” World BankEconomic Review 15(3):367–91.
————. 2002. “Understanding Patterns of Economic Growth:Searching for Hills among Plateaus, Mountains, and Plains.”World Bank Economic Review 14(2):231–50.
————. 2003. “Who is Not Poor? Proposing a Higher Interna-tional Standard for Poverty.” Washington, D.C.: Center forGlobal Development Working Paper 33.
————. 2004. “Reform is Like a Box of Chocolates: Understand-ing the Growth Disappointments and Surprises.” KennedySchool of Government, Harvard University. Cambridge, Mass.Processed.
Psacharopoulos, George, and Harry Anthony Patrinos. 2002.“Returnsto Investment in Education: A Further Update.” Washington, D.C.:World Bank Policy Research Working Paper Series 2881.
Pursell, Gary. 2001. “Australian Experience with Local Content Pro-grams in the Auto Industry: Some Lessons for India and OtherDeveloping Countries.” Journal of World Trade 35(2):379–94.
232 WORLD DEVELOPMENT REPORT 2005
15_WDR_References.qxd 8/24/04 3:08 PM Page 232

Putnam, Robert D. 1988. “Diplomacy and Domestic Politics: TheLogic of Two-Level Games.” International Organization42(3):427–60.
Putnam, Robert D., Robert Leonardi, and Raffaella Y. Nanetti. 1993.Making Democracy Work: Civic Traditions in Modern Italy.Princeton, N.J.: Princeton University Press.
Qian, Yingyi. 2003. “How Reform Worked in China.” In DaniRodrik, ed., In Search of Prosperity: Analytic Narratives on Eco-nomic Growth. Princeton, N.J.: Princeton University Press.
Qiang, Christine Zhen-Wei, Alexander Pitt, and Seth Ayers. 2004.“Contribution of Information and Communication Technolo-gies to Growth.” Washington, D.C.: World Bank Working Paper24.
Rabin, Matthew. 1998. “Psychology and Economics.” Journal of Eco-nomic Literature 36(1):11–46.
Radelet, Steven. 1999. “Manufactured Exports, Export Platforms,and Economic Growth.” Cambridge, Mass.: Harvard Institute forInternational Development Consulting Assistance on EconomicReform II 43.
Radelet, Steven, and Jeffery Sachs. 1998. “Shipping Costs, Manufac-tured Exports, and Economic Growth.” Paper presented at theAmerican Economic Association Annual Meeting. Chicago, I.L.January 8.
Rajan, Raghuram G., and Luigi Zingales. 2003. Saving Capitalismfrom the Capitalists: Unleashing the Power of Financial Markets toCreate Wealth and Spread Opportunity. New York: Crown Busi-ness.
Rama, Martin. 2002. “The Gender Implications of Public SectorDownsizing: The Reform Program of Vietnam.” World BankResearch Observer 17(2):167–89.
————. 2003. “Globalization and Workers in Developing Coun-tries.” Washington, D.C.: World Bank Policy Research WorkingPaper Series 2958.
Rama, Martin, and Raquel Artecona. 2002. “A Database of LaborMarket Indicators Across Countries.” World Bank. Washington,D.C. Processed.
Ramamurti, Ravi. 1996. “The New Frontier of Privatization.” InRavi Ramamurti, ed., Privatizing Monopolies: Lessons from theTelecommunications and Transport Sectors in Latin America. Bal-timore, M.D.: Johns Hopkins University Press.
Ramey, Garey, and Valerie A. Ramey. 1995. “Cross-Country Evi-dence on the Link Between Volatility and Growth.” AmericanEconomic Review 85(5):1138–51.
Ratnam, V. 1999. Trade Unions in the Informal Sector: Finding theirBearings. Nine Country Papers. Geneva: International LaborOrganization.
Rauch, James E., and Vitor Trindade. 2002. “Ethnic Chinese Net-works in International Trade.” The Review of Economics and Sta-tistics 84(1):116–30.
Ravallion, Martin. 2003a. “Measuring Aggregate Welfare in Devel-oping Countries: How Well do National Accounts and SurveysAgree?” Review of Economics and Statistics 85(3):645–52.
————. 2003b. “Targeted Transfers in Poor Countries: Revisitingthe Trade-offs and Policy Options.” Washington, D.C.: WorldBank Policy Research Working Paper Series 3048.
Ravallion, Martin, and Gaurav Datt. 1995. “Is Targeting through aWork Requirement Efficient?: Some Evidence from Rural India.”In D. van de Walle and K. Nead, eds., Public Spending and thePoor: Theory and Evidence. Baltimore, M.D.: Johns Hopkins Uni-versity Press for the World Bank.
Rawlings, Laura B., Lynne. Sherburne-Benz, and Julie Van Dome-len. 2003. Evaluating Social Funds: A Cross-country Analysis ofCommunity Investments. Washington, D.C.: World Bank.
Rawlings, Laura B., and Gloria M. Rubio. 2002. Evaluating theImpact of Conditional Cash Transfer Programs: Lessons from LatinAmerica. Washington, D.C.: World Bank.
Raworth, Kate. 2004. Trading Away our Rights: Women Working inGlobal Supply Chains. Oxford: Oxfam International.
Ray, Amit S. 2004. “Managing Port Reforms in India: Case Study ofJawaharlal Nehru Port Trust (JNPT) Mumbai.” Backgroundpaper for the WDR 2005.
Reardon, Thomas, Kostas Stamoulis, María Elena Cruz, ArsenioBalisacan, Julio Berdegue, and Kimseyinga Savadogo. 1998.“Diversification of Household Incomes into Non-Farm Sources:Patterns, Determinants and Effects.” Paper presented at theIFPRI Conference: Strategies for Stimulating Growth of theRural Non-Farm Economy in Developing Countries. ArlieHouse, V.A. May 17.
Recanatini, Francesca, and Randi Ryterman. 2001. “Disorganiza-tion of Self-organization? The Emergence of Business Associa-tions in a Transition Economy.” World Bank. Washington, D.C.Processed.
Regobeth, Christian, and Kofi Ahortor. 2003. “Regulatory Impacton Ghana.” Paper presented at the Regulatory Impact Assess-ment: Strengthening Regulation Policy and Practice Conference.Centre on Regulation and Competition, Manchester, U.K.November 23.
Reid, Neil, and Jay D. Gatrell. 2003. “Uncertainty, Incentives, andthe Preservation of an Industrial Icon: The Case of Toledo Jeep.”In Nicholas Phelps and Philip Raines, eds., The New Competitionfor Inward Investment: Companies, Institutions and TerritorialDevelopment. Cheltenham, U.K.: Edward Elgar.
Reinikka, Ritva, and Jakob Svensson. 1999. “Confronting Competi-tion: Investment Response and Constraints in Uganda.” Wash-ington, D.C.: World Bank Policy Research Working Paper Series2242.
————. 2002. “Coping with Poor Public Capital.” Journal ofDevelopment Economics 69(1):51–69.
Reynolds, Paul D., William D. Bygrave, Erkko Autio, and others.2004. Global Entrepreneurship Monitor Global 2003 ExecutiveReport. http://www.gemconsortium.org/: Global Entrepreneur-ship Monitor.
Rhee, Yung Whee. 1990. “The Catalyst Model of Development:Lessons from Bangladesh’s Success with Garment Exports.”World Development 18(2):333–46.
Roberts, Mark J., and James R. Tybout, eds. 1996. Industrial Evolu-tion in Developing Countries. Washington, D.C.: Oxford Univer-sity Press for the World Bank.
Robinson, James A. 1998. “Theories of ‘Bad Policy’.” Journal of Pol-icy Reform 2(1):1–46.
References 233
15_WDR_References.qxd 8/24/04 3:08 PM Page 233
Robinson, James A., and Thierry Verdier. 2002. “The Political Econ-omy of Clientelism.” Paris: Centre for Economic Policy Research,Discussion Paper Series 3205. Available on line athttp://www.cepr.org/pubs/new-dps/dp_papers.htm.
Rodríguez-Clare, Andrés. 2001. “Costa Rica’s Development Strat-egy Based on Human Capital and Technology: How it Got There,the Impact of Intel, and Lessons for Other Countries.” Journal ofHuman Development 2(2):311–24.
Rodrik, Dani. 1991. “Policy Uncertainty and Private Investment inDeveloping Countries.” Journal of Development Economics36(2):229–42.
————. 1997. Has Globalization Gone Too Far? Washington,D.C.: Institute for International Economics.
————. 1999. The New Global Economy and Developing Coun-tries: Making Openness Work. Washington, D.C.: Overseas Devel-oping Council.
Rodrik, Dani, and Arvind Subramanian. 2004. “From ‘HinduGrowth’ to Productivity Surge: The Mystery of the IndianGrowth Transition.” Harvard University. Cambridge, Mass.Processed.
Rodrik, Dani, Arvind Subramanian, and Francesco Trebbi. 2002.Institutions Rule: The Primacy of Institutions over Geography andIntegration in Economic Development. Cambridge, Mass: HarvardUniversity.
Röller, Lars-Hendrik, and Leonard Waverman. 2001. “Telecommu-nications Infrastructure and Economic Development: A Simul-taneous Approach.” American Economic Review 91(4):909–23.
Ros, Augustin J. 1999. “Does Ownership or Competition Matter?The Effects of Telecommunications Reform on Network Expan-sion and Efficiency.” Journal of Regulatory Economics15(1):65–92.
Rosen, Harvey. 1995. Public Finance, 4th Edition. Chicago, I.L.:Irwin Publishers.
Rosenzweig, Mark R. 1995. “Why Are There Returns to Schooling?”American Economic Review 85(2):153–58.
Rosenzweig, Mark R., and Hans P. Binswanger. 1993. “Wealth,Weather Risk and the Composition and Profitability of Agricul-tural Investments.” Economic Journal 103(416):56–78.
Ross, Michael L. 2001. “Does Oil Hinder Democracy?” World Poli-tics 53(3):325–61.
Rossiter, Clinton, ed. 1961. The Federalist Papers. New York City:New American Library.
Rossotto, Carlo Maria, Anat Lewin, Carlos Gomez, and BjõrnWellenius. 2003.“Competition in International Voice Communi-cations.” World Bank, Policy Paper of the Global Informationand Communications Technology Department, Policy Division.Washington, D.C. Processed.
Saavedra, Jaime, and Máximo Torero. 2004.“Labor Market Reformsand Their Impact on Formal Labor Demand and Job MarketTurnover: The Case of Peru.” In James Heckman and CarmenPagés, eds., Law and Employment: Lessons from Latin Americaand the Caribbean. Cambridge, M.A. and Chicago, I.L.: NationalBureau of Economic Research and University of Chicago.
Saavedra, Jaime. 2003.“Labor Markets during the 1990’s.” In Pedro-Pablo Kuczynski and John Williamson, eds., After the Washington
Consensus: Restarting Growth and Reform in Latin America.Washington, D.C.: Institute for International Economics.
Sachs, Jeffrey, and Andrew M. Warner. 2001. “The Curse of NaturalResources.” European Economic Review 45(4-6):827–38.
Sachs, Jeffrey D. 2003. “Institutions Don’t Rule: Direct Effects ofGeography On Per Capita Income.” Cambridge, Mass.: NationalBureau of Economic Research Working Paper Series 9490.
Sader, Frank. 2003. “Do ‘One-Stop’ Shops Work?” World Bank.Washington, D.C. Processed.
Sala-i-Martin, Xavier, and Elsa Vila-Artadi. 2002. “EconomicGrowth and Investment in the Arab World.” New York: Colum-bia University, Department of Economics Discussion PaperSeries 0203-08.
Samuel, Benin, and John Pender. 2002. “Impacts of Land Redistrib-ution on Land Management and Productivity in the EthiopianHighlands.” Addis Ababa: International Livestock Research Insti-tute, Working Paper 43.
Sander, Cerstin. 2004. “Less is More: Better Compliance andIncreased Revenues by Streamlining Business Registration inUganda.” Case Study Commissioned by the UK Department forInternational Development for the 2005 World DevelopmentReport.
Sandmo, Agnar. 1976. “Optimal Taxation: An Introduction to theLiterature.” Journal of Public Economics 6(1-2):37–54.
Sapienza, Paola. 2004. “The Effect of Government Ownership onBank Lending.” Journal of Financial Economics 72(2):357–84.
Saunders, Anthony, and Berry Wilson. 2002. “An Analysis of BankCharter Value and Its Risk-Constraining Incentives.” Journal ofFinancial Services Research 19(2-3):185–95.
Scarpetta, Stefano, and Eric Bartelsman. 2003. “Firm Dynamics inDeveloping Countries.”World Bank. Washington, D.C. Processed.
Scarpetta, Stefano, Philip Hemmings, Thierry Tressel, and JaejoonWoo. 2002. “The Role of Policy and Institutions for Productivityand Firm Dynamics: Evidence from Micro and Industry Data.”Paris: OECD Economics Department Working Paper 329. Avail-able on line at http://www.olis.oecd.org/olis/2002doc.nsf/linkto/eco-wkp(2002)15.
Scarpetta, Stefano, and Thierry Tressel. 2004. “Boosting Productiv-ity via Innovation and Adoption of New Technologies: Any Rolefor Labor Market Institutions?” Washington, D.C.: World BankWorking Research Paper Series 3273.
Schärf, Wilfried. 2001. “Community Justice and Community Polic-ing in Post-Apartheid South Africa.” IDS Bulletin 32(1):74–82.
Schiff, Maurice, and L. Alan Winters. 2003. Regional Integration andDevelopment. Washington, D.C. and Oxford: World Bank andOxford University Press.
Schmukler, Sergio. 2003. “Financial Globalization: Gain and Painfor Developing Countries.” World Bank. Washington DC.Processed.
Schneider, Friedrich. 2002. “Size and Measurement of the InformalEconomy in 110 Countries Around the World.” Paper presentedat the Workshop of Australian National Tax Centre, ANU. Can-berra, Australia. July 17.
Schor, Adriana. Forthcoming. “Productivity, Embodied Technologyand Heterogeneous Responses to Tariff Reduction: Evidence
234 WORLD DEVELOPMENT REPORT 2005
15_WDR_References.qxd 8/24/04 3:08 PM Page 234

from Brazilian Manufacturing Firms.” Journal of DevelopmentEconomics.
Schrank, Andrew. 2001. “Export Processing Zones: Free MarketIslands or Bridges to Structural Transformation.” DevelopmentPolicy Review 19(2):223–42.
Schreiner, Mark, and Jacob Yaron. 2001. Development Finance Insti-tutions: Measuring their Subsidy. Washington, D.C.: World Bank.
Schulpen, Lau, and Peter Gibbon. 2002. “Private Sector Develop-ment: Policies, Practices and Problems.” World Development30(1):1–15.
Schumpeter, Joseph. 1942. Capitalism, Socialism and Democracy.New York: Harper & Row.
Scott, Allen J., and Michael Storper. 2003. “Regions, Globalization,Development.” Regional Studies 37(6-7):579–93.
Sedlacek, Guilherme, Nadeem Ilahi, and Emily Gustafsson-Wright.2000. “Targeted Conditional Transfer Programs in Latin Amer-ica: An Early Survey.” World Bank Report Prepared for theRegional Study on “Securing our Future”. Washington, D.C.Processed.
Sereno, Lourdes Ma, Emmanuel de Dios, and Joseph J. Capuano.2001. “Justice and the Social Cost of Doing Business: The Case ofPhilippines.” World Bank. Manila, Philippines. Processed.
Serven, Luis. 1997. “Uncertainty, Instability, and Irreversible Invest-ment : Theory, Evidence, and Lessons for Africa.” Washington,D.C.: World Bank Policy Research Working Paper Series 1722.
Shah, Anwar, ed. 1995a. Fiscal Incentives for Investment and Innova-tion. New York: Oxford University Press.
————. 1995b. “Research and Development Investment, Indus-trial Structure, Economic Performance, and Tax Policies.” InAnwar Shah, ed., Fiscal Incentives for Investment and Innovation.New York: Oxford University Press.
Shah, Anwar, and John Baffes. 1995. “Do Tax Policies StimulateInvestment in Physical and R&D Capital?” In Anwar Shah, ed.,Fiscal Incentives for Investment and Innovation. New York: OxfordUniversity Press.
Shah, Hemant. 1997. “Toward Better Regulation of Private PensionFunds.” Washington, D.C.: World Bank Policy Research WorkingPaper Series 1791.
Shavell, Steven. 2004. Foundations of Economic Analysis of Law.Cambridge, Mass.: Harvard University Press.
Sherman, Lawrence W., Denise C. Gottfredson, Doris L. MacKen-zie, John Eck, Peter Reuter, and Shawn D. Bushway. 1998. Pre-venting Crime: What Works, What Doesn’t, What’s Promising: AReport to the U.S. Congress. Washington, D.C.: National Instituteof Justice.
Shihata, Ibrahim. 1986. “Towards a Greater Depolitization ofInvestment Disputes: The Roles of ICSID and MIGA.” ICSIDReview–Foreign Investment Law Journal 1(1):1–25.
Shirley, Mary, and Patrick Walsh. 2000. “Public versus Private Own-ership: The Current State of the Debate.” Washington, D.C.:World Bank Policy Research Working Paper Series 2420.
Shleifer, Andrei, and Daniel Wolfenzohn. 2002.“Investor Protectionand Equity Markets.” Journal of Financial Economics 66(1):3–27.
Siamwalla, Ammar. 1993. “The Thai Rural Credit System and Ele-ments of a Theory: Public Subsidies, Private Information, and
Segmented Markets.” In Avishay Braverman, Karla Hoff, andJoseph E. Stiglitz, eds., The Economics of Rural Organization: The-ory, Practice, and Policy. New York: Oxford University Press forthe World Bank.
Sidak, Gregory J., and William J. Baumol. 1995. Transmission Pric-ing and Stranded Costs in the Electric Power Industry. Washington,D.C.: AEI Press.
Siebert, Horst, ed. 2003. Global Governance: An Architecture for theWorld Economy. Berlin, Heidelberg, New York: Springer.
Slemrod, Joel. 1990. “Optimal Taxation and Optimal Tax Systems.”Journal of Economic Perspectives 4(1):157–78.
Smarzynska, Beata. 2002.“Does Foreign Direct Investment Increasethe Productivity of Domestic Firms? In Search of Spilloversthrough Backward Linkages.” Washington, D.C.: World BankPolicy Research Working Paper Series 2923.
Smith, Gare, and Dan Feldman. 2003. Company Codes of Conductand International Standards: An Analytical Comparison, Part Iand II. Washington, D.C.: World Bank and International FinanceCorporation.
Smith, Heather. 2000. Industry Policy in Taiwan and Korea in the1980s: Winning with the Market. Northampton, Mass.: EdwardElgar Publishing.
Smith, Warrick. 1997a. “Covering Political and Regulatory Risks:Issues and Options for Private Infrastructure Arrangements.” InTimothy Irwin, Michael Klein, Guillermo E. Perry, and MateenThobani, eds., Dealing with Public Risk in Private Infrastructure.Washington, D.C.: World Bank.
————. 1997b. “Utility Regulators: The Independence Debate.”Washington, D.C.: World Bank, Public Policy for the Private Sec-tor Note 127.
Solow, Robert. 1957. “Technical Change and the Aggregate Produc-tion Function.” Review of Economics and Statistics 39(3):312–30.
Sölvell, Örjan, Göran Lindqvist, and Christian Ketels. 2003. TheCluster Initiative Greenbook. Stockholm: Ivory Tower AB.
Spar, Deborah. 1998. “Attracting High Technology Investment:Intel’s Costa Rica Plant.” Washington, D.C.: World Bank, ForeignInvestment Advisory Service, Occasional Paper 11.
Spiller, Pablo, and Cezley I. Sampson. 1996.“Regulating Telecommuni-cations in Jamaica.” In Brian Levy and Pablo T. Spiller, eds., Regula-tions, Institutions, and Commitment: Comparative Studies ofTelecommunications. Cambridge, U.K.: Cambridge University Press.
Spiller, Pablo T., and William Savedoff. 1999. “Commitment andGovernance in Infrastructure.” In Federico Basañes, EvamaríaUribe, and Robert Willig, eds., Can Privatization Deliver? Infra-structure for Latin America. Washington, D.C.: Inter-AmericanDevelopment Bank.
Srinivas, P. S., Edward Whitehouse, and Juan Yermo. 2000. “Regu-lating Private Pension Funds’ Structure, Performance and Invest-ments: Cross-country Evidence.” Washington, D.C.: World BankSocial Protection Discussion Paper 113.
Staiger, Robert W., and Guido Tabellini. 1999. “Do GATT RulesHelp Governments Make Domestic Commitments?” Economicsand Politics 11(2):109–44.
Stanchev, Krassen. 2003. “Applicable RIA Instruments in an Imma-ture Administrative Environment: The Bulgarian Experience.”
References 235
15_WDR_References.qxd 8/24/04 3:08 PM Page 235
Paper presented at the Regulatory Impact Assessment: Best Prac-tices and Lesson-drawing in Europe Conference. Sofia, Bulgaria.February 27.
Stanfield, David, Edgar Nesman, Mitchell Seligson, and AlexanderColes. 1990. “The Honduran Land Titling and RegistrationExperience.” University of Wisconsin, Land Tenure Center.Madison, Wisconsin. Processed.
Stasavage, David. 2002. “Private Investment and Political Institu-tions.” Economics and Politics 14(1):41–63.
Stephan, Paul B. 1999. “The Futility of Unification and Harmoniza-tion of International Commercial Law.” Virginia Journal of Inter-national Law 39(3):743–97.
Stephenson, Matthew. 2003. “When the Devil Turns: The PoliticalFoundations of Independent Judicial Review.” Journal of LegalStudies 32(1):59–90.
Stern, Nicholas, Jean-Jacques Dethier, and Halsey Rogers. 2004.“Growth and Empowerment: Making Development Happen.”World Bank. Washington, D.C. Processed.
Stern, Nicholas H. 2002. A Strategy for Development. Washington,D.C.: World Bank.
Stigler, George. 1975. The Citizen and the State: Essays on Regula-tion. Chicago, I.L.: University of Chicago Press.
Stigler, George, and Gary S. Becker. 1977. “De Gustibus Non EstDisputandum.” American Economic Review 67(2):76–90.
Stigler, George J. 1971. “The Theory of Economic Regulation.” BellJournal of Economics and Management Science 2(1):3–21.
Stiglitz, Joseph E. 1989. “Markets, Market Failures, and Develop-ment.” American Economic Review 79(2):197–203.
Stiglitz, Joseph E. 1999a. “Bankruptcy Laws: Some Elementary Eco-nomic Principles.” Paper presented at the Annual World BankConference on Development Economics. Paris. June 21.
————. 1999b. “On Liberty, the Right to Know, and Public Dis-course: The Role of Transparency in Public Life.” Paper pre-sented at the Oxford Amnesty Lecture. Oxford, U.K. January 27.
Stiglitz, Joseph E., and Partha Dasgupta. 1971. “Differential Taxa-tion, Public Goods and Economic Efficiency.” Review of Eco-nomic Studies 38(114):151–74.
Stiglitz, Joseph E., and Michael Rothschild. 1976.“Equilibrium in Com-petitive Insurance Markets: The Economics of Markets with Imper-fect Information.” Quarterly Journal of Economics 90(4):629–49.
Stiglitz, Joseph E., and Andrew Weiss. 1981. “Credit Rationing inMarkets with Imperfect Information.” American EconomicReview 71(3):393–410.
Stiglitz, Joseph E., and Shahid Yusuf, eds. 2001. Rethinking the EastAsian Miracle. Washington, D.C.: World Bank and Oxford Uni-versity Press.
Stijns, Jean-Philippe C. 2000. “Natural Resource Abundance andEconomic Growth Revisited.” University of California. Berkeley,Calif. Processed.
Stoica, Christina I., and Valeriu Stoica. 2002. “Romania’s LegalRegime for Security Interests in Personal Property.” Law in Tran-sition Spring: 62–6.
Stone, Christopher E., and Heather H. Ward. 2000. “DemocraticPolicing: A Framework for Action.” Policing and Society10(1):11–12.
Subbarao, Kalanidhi. 1997. “Public Works as an Anti-poverty Pro-gram: An Overview of Cross-country Experience.” AmericanJournal of Agricultural Economics 79(2):678–83.
Subbarao, Kalanidhi, Ahhtes Ahmed, and Tesfaye Teklu. 1995.“Philippines: Social Safety Net Programs: Targeting, Cost-effec-tiveness and Options for Reform.” Washington, D.C.: WorldBank Poverty and Social Policy Discussion Paper 77.
Subramanian, Arvind, and Devesh Roy. 2003. “Who Can Explainthe Mauritian Miracle?: Meade, Romer, Sachs, or Rodrik?” InDani Rodrik, ed., In Search of Prosperity: Analytic Narratives onEconomic Growth. Princeton, N.J.: Princeton University Press.
Sutton, John. 2002. “Rich Trades, Scarce Capabilities: IndustrialDevelopment Reconsidered.” Economic and Social Review33(1):1–22.
Sutton, Willie. 1976. Where the Money Was: The Memoirs of a BankRobber. New York: Viking Press.
Svensson, Jakob. 1998. “Investment, Property Rights and PoliticalInstability: Theory and Evidence.” European Economic Review42(7):1317–41.
Tabor, Steven R. 2002. “Assisting the Poor with Cash: Design andImplementation of Social Transfer Programs.” Washington, D.C.:World Bank Social Protection Discussion Paper Series 0223.
Taliercio Jr., Robert. 2001. “Raising Revenues and Raising Hackles:The Problem of Semi-Autonomous Tax Agencies in DevelopingCountries.” World Bank. Washington, D.C. Processed.
————. 2003a.“Administrative Reform as Credible Commitment:The Impact of Autonomy of Revenue Authority Performance inLatin America.” World Bank. Washington, D.C. Processed.
————. 2003b. “Designing Performance: The Semi-Autonomous Revenue Authority Model in Africa and LatinAmerica.” World Bank. Washington, D.C. Processed.
Tan, Eng Pheng. 2004. “The Singapore E-Government Experience.”Paper presented at the I Foro Internacional: Hacia una SociedadDigital. Panamá City, Panamá. April 6.
Tanzi, Vito. 1995. “Fiscal Federalism and Decentralization: AReview of Some Efficiency and Macroeconomic Aspects.” Paperpresented at the World Bank Conference on Development Eco-nomics. Washington, D.C.
Tanzi, Vito, and Hamid Davoodi. 1997. “Corruption, Public Invest-ment, and Growth.” Washington, D.C.: International MonetaryFund Working Paper WP/97/139.
————. 1998. “Roads to Nowhere: How Corruption in PublicInvestment Hurts Growth.” Washington, D.C.: InternationalMonetary Fund Economic Issues 12.
Tanzi, Vito, and Howell H. Zee. 2001. “Tax Policy for DevelopingCountries.” Washington, D.C.: International Monetary Fund,Economic Issues 27.
Taylor, Alan M. 1996. “On the Costs of Inward Looking Develop-ment: Historical Perspectives on Price Distortions, Growth, andDivergence in Latin America from the 1930s to the 1980s.” Cam-bridge, Mass.: National Bureau of Economic Research WorkingPaper Series 5432.
Teklu, Tesfaye, and Sisay Asefa. 1999. “Who Participates in Labor-Intensive Public Works in Sub-saharan Africa? Evidence fromRural Botswana and Kenya.” World Development 27(2):431–38.
236 WORLD DEVELOPMENT REPORT 2005
15_WDR_References.qxd 8/24/04 3:08 PM Page 236

Tendler, Judith. 2002. “The Economic Wars Between the States.”Paper presented at the OECD/State Government of Ceará Meet-ing on Foreign Direct Investment and Regional Development.Fortaleza, Brasil. December 12.
Thaler, Richard H. 1993. The Winner’s Curse: Paradoxes and Anom-alies of Economic Life. Princeton, N.J.: Princeton University Press.
————. 2000. “From Homo Economicus to Homo Sapiens.”Journal of Economic Perspectives 14(1):133–41.
The Economist. 1999. “Sweatshop Wars.” The Economist, February25.
————. 2001. “How Countries go High-Tech.” The Economist,December 28.
————. 2002a. “Digging Deep: Anglo American Offers AIDSDrugs to All Its Employees.” The Economist, August 8.
————. 2002b. “Enlisting Gamblers.” The Economist, September26.
————. 2002c. Globalisation—Making Sense of an IntegratingWorld. London, UK: Economist Books.
————. 2003a. “Into Africa: Investing in Angola.” The Economist,June 12.
————. 2003b. “Never Had it so Good.” The Economist, Septem-ber 11.
————. 2003c. “The Diaspora is ‘Discovered’.” The Economist,February 23.
The Mitchell Group Inc. 2003. Promoting Competitiveness in Prac-tice: An Assessment of Cluster-based Approaches. Washington,D.C.: The Mitchell Group Inc., prepared for the U.S. Agency forInternational Development.
The Pew Global Attitudes Project. 2003. Views of a Changing World.Washington, D.C.: The Pew Research Center for the People & thePress. Available on line at http://people-press.org/reports/pdf/185.pdf.
Tiebout, Charles M. 1956. “A Pure Theory of Local Expenditures.”Journal of Political Economy 64(5):416–24.
Tomkins, Ray. 2001. “Extending Rural Electrification: A Survey ofInnovative Schemes.” In Penelope J. Brook and Suzanne M.Smith, eds., Contracting for Public Services: Output-based Aid andIts Applications. Washington, D.C.: World Bank.
Tommasi, Mariano. 2002. “Crisis, Political Institutions, and PolicyReform: It is not the Policy, it is the Polity, Stupid.” Paper pre-sented at the Annual World Bank Conference on DevelopmentEconomics. Oslo. June 22.
Tooley, James. 1999. The Global Education Industry: Lessons fromPrivate Education in Developing Countries. London, U.K.: IEAEducation and Training Unit in association with the Interna-tional Finance Corporation.
Topalova, Petia. 2003. “Trade Liberalization and Firm Productivity:The Case of India.” Massachusetts Institute of Technology. Cam-bridge, Mass. Processed.
Topel, Robert. 1999. “Labor Markets and Economic Growth.” InOrley Ashenfelter and David Card, eds., Handbook of Labor Eco-nomics (Volume 3C). Amsterdam: Elsevier Science B.V.
Tornell, Aaron, and Philip R. Lane. 1999. “The Voracity Effect.”American Economic Review 89(1):22–46.
Torstensson, Johan. 1994. “Property Rights and Economic Growth:An Empricial Study.” Kyklos 47(2):231–47.
Townsend, Robert M., and Jacob Yaron. 2001. “The Credit Risk-Contingency System of an Asian Development Bank.” FederalReserve Bank of Chicago Economic Perspectives 25(3):31–48.
Trajtenberg, Manuel. 2002. “Government Support for CommercialR&D: Lessons from the Israeli Experience.” Innovation Policy andthe Economy 2(1):79–134.
Tranberg Hansen, Karen. 2000. Salaula: The World of SecondhandClothing in Zambia. Chicago: University of Chicago Press.
Transition. 2003. “Russia’s Unpopular Billionaires on Forbes’ List.”Transition 14:14–15.
Transparency International. 2004. Global Corruption Report. Berlin:Transparency International.
Transparency International Bangladesh. 2002. Corruption inBangladesh: A Household Survey. Dakka: Transparency Interna-tional Bangladesh. Available on line at http://www.ti-bangladesh.org/.
Treisman, Daniel. 2000. “The Causes of Corruption: A Cross-National Study.” Journal of Public Economics 76(3):399–457.
Tropin, Mitchell. 2003. Transfer Pricing: Special Report. Washing-ton, D.C.: Tax Management, Bureau of National Affairs.
Trujillo, Lourdes, and Tomas Serebrisky. 2003. “Market Power:Ports: A Case Study of Postprivatization Mergers.” Washington,D.C.: World Bank Public Policy for the Private Sector Note 260.
Tullock, Gordon. 1983. Economics of Income Distribution. Boston:Kluwer-Nijhoff.
Tybout, James R. 2003. “Plant- and Firm-Level Evidence on ‘New’Trade Theories.” In E. Kwan Choi and James Harrigan, eds., Hand-book of International Trade. Malden, Mass.: Blackwell Publishers.
Uchitelle, Louis. 2003. “States Pay for Jobs, but it Doesn’t AlwaysPay Off.” The New York Times, November 10.
UNAIDS. 2003. AIDS Epidemic Update 2003. New York: JointUnited Nations Programme on HIV/AIDS.
UNCTAD. 1996. Incentives and Foreign Direct Investment. Geneva,New York: United Nations Conference on Trade and Development.
————. 1998. Bilateral Investment Treaties in the Mid-1990s.New York and Geneva: United Nations Conference on Trade andDevelopment.
————. 2000a. A Positive Agenda for Developing Countries: Issuesfor Future Trade Negotiations. New York and Geneva: UnitedNations Conference on Trade and Development.
————. 2000b. Bilateral Investment Treaties 1959–1999. NewYork and Geneva: United Nations Conference on Trade andDevelopment. Available on line at http://www.unctad.org/en/docs/poiteiiad2.en.pdf.
————. 2000c. “Tax Incentives and Foreign Direct Investment: AGlobal Survey.” Geneva: United Nations Conference on Tradeand Development ASIT Advisory Studies 16. Available on line athttp://www.unctad.org/en/docs//iteipcmisc3_en.pdf.
————. 2001a. Social Responsibility. New York and Geneva:United Nations Conference on Trade and Development. Avail-able on line at http://www.unctad.org/en/docs//psiteiitd22.en.pdf.
References 237
15_WDR_References.qxd 8/24/04 3:08 PM Page 237

————. 2001b. World Investment Report 2001: Promoting Link-ages. Geneva: United Nations Conference on Trade and Develop-ment. Available on line at http://www.unctad.org/Templates/WebFlyer.asp?intItemID=2434&lang=1.
————. 2002a. Investment Policy Review. Botswana. Geneva:United Nations Conference on Trade and Development. Avail-able on line at http://www.unctad.org/Templates/WebFlyer.asp?intItemID=2811&lang=1.
————. 2002b. World Investment Report 2002: Transnational Cor-porations and Export Competitiveness. Geneva: United NationsConference on Trade and Development. Available on line athttp://www.unctad.org/Templates/WebFlyer.asp?intItemID=2399&lang=1.
————. 2003a. Dispute Settlement: Investor-state. Geneva: UnitedNations Conference on Trade and Development.
————. 2003b. Foreign Direct Investment and PerformanceRequirements: New Evidence from Selected Countries. New Yorkand Geneva: United Nations Conference on Trade and Develop-ment. Available on line at http://www.unctad.org/Templates/webflyer.asp?docid=4378&intItemID=1397&lang=1.
————. 2003c. Investment and Technology Policies for Competi-tiveness: Review of Successful Country Experiences. New York andGeneva: United Nations Conference on Trade and DevelopmentTechnology for Development Series. Available on line athttp://www.unctad.org/en/docs//iteipc20032_en.pdf.
————. 2003d. “Model Law on Competition.” Geneva, Switzer-land: United Nations Conference on Trade and DevelopmentSeries on Issues in Competition Law and PolicyTD/B/RBP/CONF.5/7/Rev.1.
————. 2003e. World Investment Report 2003: FDI Policies forDevelopment National and International Perspectives. Geneva:United Nations Conference on Trade and Development. Avail-able on line at http://www.unctad.org/Templates/WebFlyer.asp?intItemID=2979&lang=1.
UNCTAD, and WTO. 2000. The Post-Uruguay Round Tariff Envi-ronment for Developing Country Exports: Tariff Peaks and TariffEscalation. Geneva: United Nations Conference on Trade andDevelopment and World Trade Organization.
Unite, Angelo A., and Michael J. Sullivan. 2003. “The Effect ofForeign Entry and Ownership Structure on the PhilippineDomestic Banking Sector.” Journal of Banking and Finance27(12):2323–45.
United Kingdom–DFID. 2001. Untying Aid. London: Departmentfor International Development.
————. 2004. What is Pro-Poor Growth and Why Do We Need toKnow? London: Department for International Development.
United Nations. 2000. The World’s Women 2000: Trends and Statis-tics. New York: United Nations. Available on line athttp://unstats.un.org/unsd/demographic/ww2000/.
————. 2002a. International Migration Report 2002. New York:United Nations Department of Economic and Social Affairs Pop-ulation Division.
————. 2002b. World Population Prospects: The 2002 RevisionPopulation Database. New York: United Nations Department ofEconomic and Social Affairs Population Division.
United Nations–Habitat. 2003. The Challenge of Slums: GlobalReport on Human Settlements 2003. London: Earthscan Publica-tions Limited.
United Nations Commission on the Private Sector and Develop-ment. 2004. Report to the Secretary-General of the United Nations.Unleashing Entrepreneurship: Making Business Work for the Poor.New York: United Nations Development Program.
United Nations Economic Commission for Africa. 2000.“HIV/AIDS and Economic Development in Sub-SaharanAfrica.” Paper presented at the African Development Forum2000, AIDS: The Greatest Leadership Challenge. Addis Ababa,Ethiopia. December 3.
Urízar H., Carmen, and Sigfrido Lee. 2003. “The Effects of Unionson Productivity: Evidence from Large Coffee Producers inGuatemala.” Washington, D.C.: Inter-American DevelopmentBank, Research Department Working Paper R-473.
Van de Walle, Dominique. 2003. “Are Returns to Investment Lowerfor the Poor? Human and Physical Capital Interactions in RuralVietnam.” Review of Development Economics 7(4):636–53.
Van der Walt, A. J. 1999. “Reducing Regulatory Risk in Infrastruc-ture by Requiring Compensation for Regulatory Takings: AComparative Perspective.” Paper presented at the Private Infra-structure for Development, International Conference. Rome,Italy. September 10.
Van Rijckeghem, Caroline, and Beatrice Weder. 2001. “BureaucraticCorruption and the Rate of Temptation: Do Wages in the CivilService Affect Corruption, and by How Much?” Journal of Devel-opment Economics 65(2):307–31.
Varshney, Ashutoth. 1998. “Mass Politics or Elite Politics? India’sEconomic Reforms in Comparative Perspective.” Journal of PolicyReform 2(4):301–35.
Velde, Dirk Willem te. 2001. Policies Towards Foreign Direct Invest-ment in Developing Countries: Emerging Best-practices and Out-standing Issues. London: Overseas Development Institute.
Vernon, Raymond. 1971. Sovereignty at Bay: The MultinationalSpread of U.S. Enterprises. New York: Basic Books.
Villadeces, Andrés, Peter Cummings, Victoria E. Espitia, Thomas D.Koepsell, Barbara McKnight, and Arthur L. Kellermann. 2000.“Effect of a Ban on Carrying Firearms on Homicide Rates in TwoColombian Cities.” Journal of the American Medical Association283:1205–9.
Vilpisauskas, Ramunas. 2003. “The Introduction of RegulatoryImpact Assessment in Lithuania: From Contributing to EUAccession to Improving the Performance of Public Administra-tion.” Paper presented at the Politics of Regulatory ImpactAssessment: Best Practices and Lesson-drawing in Europe Con-ference. Sofia, Bulgaria. February 27.
Vittas, Dimitri, and Yoon Je Cho. 1995. “Credit Policies: Lessonsfrom East Asia.” Washington, D.C.: World Bank Policy ResearchWorking Paper Series 1458.
Vodopivec, Milan. 2004. Income Support for the Unemployed: Issuesand Options. Washington, D.C.: World Bank.
Volkov, Vadim. 2002. Violent Entrepreneurs: The Use of Force in theMaking of Russian Capitalism. New York: Cornell UniversityPress.
238 WORLD DEVELOPMENT REPORT 2005
15_WDR_References.qxd 8/24/04 3:08 PM Page 238

Waelde, Thomas W., and George Ndi. 1996.“Stabilizing InternationalInvestment Commitments: International Law versus ContractInterpretation.” Texas International Law Journal 31(2):216–67.
Waller, Irwin, and Daniel Sanfacon. 2000. “Investing Wisely inCrime Prevention: International Experiences.” Washington,D.C.: Department of Justice, Office of Justice Programs, Bureauof Justice Assistance, Monograph 1.
Wallsten, Scott. 2001. “An Econometric Analysis of Telecom Com-petition, Privatization, and Regulation in Africa and Latin Amer-ica.” Journal of Industrial Economics 49(1):1–19.
————. 2003. “Privatizing Monopolies in Developing Countries:The Real Effects of Exclusivity Periods.” Washington, D.C.: AEI-Brookings Joint Center for Regulatory Studies 03-17.
————. 2004. “The Role of Government in Regional TechnologyDevelopment: The Effects of Science Parks and Public VentureCapital.” In Timothy Bresnahan and Alfonso Gambardella, eds.,Building High-Tech Clusters: Sillicon Valley and Beyond. Cam-bridge, U.K.: Cambridge University Press.
Warner, Mark A. 2000. “The Potential for Restraint Through anInternational Charter for FDI.” In Paul Collier and CatherinePatillo, eds., Investment and Risk in Africa. Basingtone: McMillan.
Webb-Vidal, Andy. 2001. “New York Supercop Takes a Crack atCaracas.” Financial Times, March 22.
Wedel, Paul. 2002. Southeast Asia Competitiveness Programs: Thai-land. Bangkok: Kenan Institute Asia.
Weder, Beatrice, and Mirjam Schiffer. 2000. “Catastrophic PoliticalRisk versus Creeping Expropriation: A Cross-Country Analysisof Risks in Private Infrastructure Financing in Emerging Mar-kets.” University of Basel. Basel, Switzerland. Processed.
Weingast, Barry R. 1995. “The Economic Role of Political Institu-tions: Market-Preserving Federalism and Economic Develop-ment.” Journal of Law, Economics, and Organization 11(1):1–31.
Weiss, Ricardo. 2002. “Advances in Corporate Governance inBrazil.” Institutional Investor 36(9): B16–B16.
Wellenius, Bjõrn. 1997a. “Extending Telecommunications Serviceto Rural Areas—The Chilean Experience: Awarding SubsidiesThrough Competitive Bidding.” Washington, D.C.: World BankPublic Policy for the Private Sector Note 105.
————. 1997b. “Telecommunications Reform-How to Succeed.”Washington, D.C.: World Bank Public Policy for the Private Sec-tor Note 130.
Wells Jr., Louis T., and Eric S. Gleason. 1995. “Is Foreign Infrastruc-ture Investment Still Risky?” Harvard Business ReviewSept.–Oct.:44–54.
Wells, Louis T. Jr., Nancy J. Allen, Jacques Morisset, and Neda Pir-nia. 2001. “Using Tax Incentives to Compete for Foreign Invest-ment: Are They Worth the Cost?” Washington, D.C.: ForeignInvestment Advisory Service Occasional Paper 15.
West, Gerard T. 2001. “Comment on Securitizing Political RiskInsurance.” In Theodore H. Moran, ed., International PoliticalRisk Management: Exploring New Frontiers. Washington, D.C.:World Bank–MIGA.
Westphal, Larry E. 2002. “Technology Strategies for EconomicDevelopment in a Fast Changing Global Economy.” Economics ofInnovation and New Technology 11(4-5):275–320.
Wheeler, David. 2001. “Racing to the Bottom? Foreign Investmentand Air Pollution in Developing Countries.” Journal of Environ-ment and Development 10(3):225–45.
White, Lawrence J. 1996. “Competition versus Harmonization: AnOverview of International Regulation of Financial Services.” InClaude E. Barfield, ed., International Financial Markets: Harmo-nization Versus Competition. Washington, D.C.: AEI Press.
Wild, Volker. 1997. Profit Not For Profit’s Sake: History & BusinessCulture of African Entrepreneurs in Zimbabwe. Harare, Zim-babwe: Baobab Books.
Williamson, Oliver E. 1996. “The Institutions and Governance ofEconomic Development and Reform.” In Oliver E. Williamson,ed., Mechanisms of Governance. New York: Oxford UniversityPress.
Willig, Robert. 1999.“Economic Principles to Guide Post-privatizationGovernance.” In Federico Basañes, Evamaría Uribe, and RobertWillig, eds., Can Privatization Deliver? Infrastructure for Latin Amer-ica. Washington, D.C.: Inter-American Development Bank.
Wilson, James Q. 1991. On Character. Washington, D.C.: AmericanEnterprise Institute.
Wilson, John Douglas. 1999. “Theories of Tax Competition.”National Tax Journal 52(2):269–304.
Winston, Clifford. 1993. “Economic Deregulation: Days of Reckon-ing for Microeconomists.” Journal of Economic Literature31(3):1263–89.
Winter-Ebmer, Rudolph. 2001. “Long-term Consequences of anInnovative Redundancy-retraining Project: The Austrian SteelFoundation.” Washington, D.C.: World Bank Social ProtectionDiscussion Paper 0103.
Winters, Alan, Neil McCulloch, and Andrew McKay. 2004. “TradeLiberalization and Poverty: The Evidence so Far.” Journal of Eco-nomic Literature 42(1):72–115.
Wintrobe, Ronald. 1998. The Political Economy of Dictatorship.Cambridge: Cambridge University Press.
Wodon, Quentin, Mohamed Ihsan Ajwad, and Corinne Siaens.2003. “Lifeline or Means-testing? Electric Utility Subsidies inHonduras.” In Penelope J. Brook and Timothy C. Irwin, eds.,Infrastructure for Poor People: Public Policy for Private Provision.Washington, D.C.: World Bank.
Wolfensohn, James D. 1998. The Other Crisis: Address to the Boardof Governors. Washington, D.C.: World Bank.
Wolman, Harold. 1988. “Local Economic Development Policy:What Explains the Divergence Between Policy Analysis andPolitical Behavior.” Journal of Urban Affairs 10(1):19–28.
Wong, Poh-Kam, and Chee-Yueng Ng, eds. 2001. Industrial Policy,Innovation and Economic Growth: The Experience of Japan andthe Asian NIEs. Singapore: Singapore University Press.
Woo-Cumings, Meredith. 2001. “Miracle as Prologue: The Stateand the Reform of the Corporate Sector in Korea.” In Joseph E.Stiglitz and Shahid Yusuf, eds., Rethinking East Asia. Washington,D.C.: Oxford University Press for the World Bank.
World Bank. 1989. World Development Report 1989. Financial Sys-tems and Development. New York: Oxford University Press.
————. 1993. The East Asian Miracle: Economic Growth andPublic Policy. New York: Oxford University Press.
References 239
15_WDR_References.qxd 8/24/04 3:08 PM Page 239
————. 1994a. Mexico: Agricultural Sector Memorandum. Wash-ington, D.C.: World Bank, Natural Resources and Poverty Divi-sion, Latin America and Caribbean Regional Office, CountryDepartment II.
————. 1994b. World Development Report 1994: Infrastructurefor Development. New York: Oxford University Press.
————. 1995a. World Bank Policy Research Report. Bureaucrats inBusiness: The Economics and Politics of Government Ownership.New York: Oxford University Press.
————. 1995b. World Development Report 1995: Workers in anIntegrating World. New York: Oxford University Press.
————. 1996a. Morocco-Socioeconomic Influence of Rural Roads:Fourth Highway Project. Washington, D.C.: World Bank, Opera-tions Evaluation Department.
————. 1996b. World Development Report 1996: From Plan toMarket. New York: Oxford University Press.
————. 1997. World Development Report 1997: The State in aChanging World. New York: Oxford University Press.
————. 1998a. Assessing Aid: What Works, What Doesn’t andWhy. New York: Oxford University Press.
————. 1998b. Project Appraisal Document: Ghana Trade andInvestment Gateway Project. Washington, D.C.: World Bank.
————. 2000a. Bolivia: From Patronage to a Profesional State.Washington, D.C.: World Bank.
————. 2000b. Chad/Cameroon Petroleum Development andPipeline Project (Annex 11). Washington, D.C.: World Bank.Available on line at http://www.worldbank.org/afr/ccproj/pro-ject/pro_document.htm.
————. 2000c. Reforming Public Institutions and StrengtheningGovernance. Washington, D.C.: World Bank, Public SectorGroup, Poverty Reduction and Economic Management (PREM)Network.
————. 2001a. Adjustment Lending Retrospective. Washington,D.C.: World Bank, Operations Policy and Country Services.
————. 2001b. Poland Labor Market Study: The Challenge of JobCreation. Washington, D.C.: World Bank.
————. 2001c. Social Protection Sector Strategy: From Safety Netto Springboard. Washington, D.C.: World Bank.
————. 2001d. Uganda. Country Assistance Evaluation: Policy,Participation, People. Washington, D.C.: World Bank, OperationsEvaluation Department.
————. 2001e. “World Bank Group Activities in the ExtractiveIndustries.” World Bank. Washington, D.C. Processed.
————. 2001f. World Bank Policy Research Report 2001. Financefor Growth: Policy Choices in a Volatile World. New York: OxfordUniversity Press.
————. 2001g. World Bank Policy Research Report 2001: Engen-dering Development Through Gender Equality In Rights, ResourcesAnd Voice. New York: Oxford University Press.
————. 2002a. Brazil Jobs Report 24480-BR. Washington, D.C:World Bank.
————. 2002b. “Review of Leasing Across Selected Middle Eastand North Africa Countries.” World Bank. Washington, D.C.Processed.
————. 2002c. World Bank Group Work in Low Income CountriesUnder Stress: A Task Force Report. Washington, D.C.: World Bank.
————. 2002d. World Bank Policy Research Report 2002. Global-ization, Growth, and Poverty: Building an Inclusive World Econ-omy. New York: Oxford University Press.
————. 2003a. Doing Business in 2004—Understanding Regula-tion. Washington, D.C.: World Bank.
————. 2003b. Global Economic Prospects and the DevelopingCountries: Investing to Unlock Global Opportunities. Washington,D.C.: World Bank.
————. 2003c. India: Sustaining Reform, Reducing Poverty.Report 25797-IN. Washington, D.C.: World Bank.
————. 2003d. Jamaica: The Road to Sustained Growth. Report26088-JM. Washington, D.C.: World Bank.
————. 2003e. Lifelong Learning in the Global Knowledge Econ-omy: Challenges for Developing Countries. A World Bank Report.Washington, D.C.: World Bank.
————. 2003f. Nicaragua Land Policy and Administration:Toward a More Secure Property Rights Regime. Report 26683-NI.Washington, D.C.: World Bank.
————. 2003g. Peru. Microeconomic Constraints to Growth: TheEvidence from the Manufacturing Sector. Washington, D.C.:World Bank.
————. 2003h. “Productivity and Investment Climate Survey”.Washington, D.C., World Bank.
————. 2003i. Rural Financial Services: Implementing the Bank’sStrategy to Reach the Rural Poor. Report 26030. Washington, D.C.:World Bank, Agriculture and Rural Development Department.
————. 2003j. The Russian Labor Market: Moving from Crisis toRecovery. Washington, D.C.: World Bank.
————. 2003k. Towards Country-Led Development: A Multi-partner Evaluation of the Comprehensive Development Frame-work. Synthesis Report. Washington, D.C.: World Bank.
————. 2003l. World Bank Group Private Sector DevelopmentStrategy Implementation Progress Report. Washington, D.C.:World Bank.
————. 2003m. World Bank Policy Research Report 2003. Break-ing the Conflict Trap: Civil War and Development Policy. NewYork: Oxford University Press.
————. 2003n. World Bank Policy Research Report 2003. LandPolicies for Growth and Poverty Reduction. New York: OxfordUniversity Press.
————. 2003o. World Development Report 2003: SustainableDevelopment in a Dynamic World. New York: Oxford UniversityPress.
————. 2003p. World Development Report 2004: Making ServicesWork for Poor People. New York: Oxford University Press.
————. 2004a. 2003 Annual Review of Development Effectiveness:The Effectiveness of Bank Support for Policy Reform. Report 28290.Washington, D.C.: World Bank Operations Evaluation Department.
————. 2004b. Doing Business in 2005: Removing Obstacles toGrowth. Washington, D.C.: World Bank.
————. 2004c. Global Development Finance 2004: HarnessingCyclical Gains for Development. Washington, D.C.: World Bank.
240 WORLD DEVELOPMENT REPORT 2005
15_WDR_References.qxd 8/24/04 3:08 PM Page 240

————. 2004d. Global Economic Prospects 2004: Realizing theDevelopment Promise of the Doha Agenda. Washington, D.C.:World Bank.
————. 2004e. Investment Climate Assessment: Enterprise Perfor-mance and Growth In Tanzania. Washington, D.C: World Bank.
————. 2004f. MENA Development Report: Gender and Develop-ment in the Middle East and North Africa Region: Women in thePublic Sphere. Washington, D.C.: World Bank.
————. 2004g. “Minimum Wages in Latin America and theCaribbean: The Impact on Employment, Inequality andPoverty.” World Bank Office of the Chief Economist for LAC.Washington, D.C. Processed.
————. 2004h. The Poverty Reduction Strategy Initiative: AnIndependent Evaluation of the World Bank’s Support Through2003. Washington, D.C: World Bank.
————. 2004i. Towards a Private Sector Development Strategy forCambodia. Washington, D.C.: World Bank.
————. 2004j. World Bank Policy Research Report 2004. Reform-ing Infrastructure: Privatization, Regulation, and Competition.New York: Oxford University Press.
————. 2004k. World Development Indicators. Washington, D.C.:World Bank.
World Bank, and IFC. 2003. Race to the Top: Attracting and EnablingGlobal Sustainable Business. Washington, D.C.: World Bank andInternational Finance Corporation.
World Bank, and PPIAF. 2003. Port Reform Toolkit: Effective Deci-sion Support for Policymakers. Washington, D.C.: World Bank.
World Commission on the Social Dimension of Globalization.2004. A Fair Globalization—Creating Opportunities for All.Geneva: International Labor Organization.
World Economic Forum. 2002. Global Competitiveness Report2001/02. Geneva, Switzerland: World Economic Forum.
————. 2004. The Global Competitiveness Report 2003–2004.Geneva: World Economic Forum.
World Energy Council. 2001. Pricing Energy in Developing Coun-tries. London, U.K.: World Energy Council. Available on line athttp://www.worldenergy.org.
Wrong, Michela. 2001. In the Footsteps of Mr. Kurtz: Living on theBrink of Disaster in Mobutu’s Congo. New York: Harper CollinsPublishers.
WTO. 2003. Working Group on the Interaction between Trade andCompetition Policy. Study on Issues Relating to a Possible Multilat-eral Framework on Competition Policy: Note by the Secretariat.Geneva: World Trade Organization.
Wunder, Haroldene F. 2001a. “Tanzi (1987): A Retrospective.”National Tax Journal 54(4):763–70.
————. 2001b. “The Effect of International Tax Policy on Busi-ness Location Decisions.” Tax Notes International 24:1331–55.
Yahya, Saad S. 2002. “The Certificate of Rights Story in Botswana.”In Geoffrey Payne, ed., Land, Rights & Innovation: ImprovingTenure Security for the Urban Poor. London: ITDG Publishing.
Yaron, Jacob, McDonald P. Benjamin, and Gerda L. Piprek. 1997.“Rural Finance: Issues, Design, and Best Practices.” Washington,D.C.: World Bank Environmentally and Socially Sustainable
Development Studies and Monographs Series 14.
Yergin, Daniel, and Joseph Stanislaw. 2002. The CommandingHeights : The Battle for the World Economy. New York: Simon &Schuster.
Yeung, Godfrey. 2003. “Scramble for FDI: The Experience of Guan-dong Province in Southern China.” In Nicholas A. Phelps andPhilip Raines, eds., The New Competition for Inward Investment:Companies, Institutions and Territorial Development. Cheltenham,U.K. and Northhampton, Mass.: Edward Elgar Publishing.
Young, Alwyn. 2000. “Gold into Base Metals: Productivity Growthin the People’s Republic of China during the Reform Period.”Journal of Political Economy 111(6):1220–61.
————. 2003. “The Razor’s Edge: Distortions and IncrementalReform in the People’s Republic of China.” Cambridge, Mass.:National Bureau of Economic Research Working Paper Series7828.
Young, Alwyn. 1995. “The Tyranny of Numbers: Confronting theStatistical Realities of the East Asian Growth Experience.” Quar-terly Journal of Economics 110(3):641–80.
Yufei, Pu, Sheng Lei, and Yao Yu. 2004. “Policy Reform on Invest-ment Climate: Case Analysis of Hangzhou.” Background paperfor the WDR 2005.
Yusuf, Shahid. 2003. Innovative East Asia: The Future of Growth.Washington, D.C.: World Bank.
Zee, Howell H., Janet G. Stotsky, and Eduardo Ley. 2002. “TaxIncentives for Business Investment: A Primer for Policy Makersin Developing Countries.” World Development 30(9):1497–516.
Zeruolis, Darius. 2003. “The Politics of Impact Assessment acrossthe Government and in Euro-institutions. Lessons from Lithua-nia.” Paper presented at the Regulatory Impact Assessment: BestPractices and Lesson-drawing in Europe Conference. Sofia, Bul-garia. February 27.
Zhang, Yin-Fang, David Parker, and Colin Kirkpatrick. 2002. “Elec-tricity Sector Reform in Developing Countries: An EconometricAssessment of the Effects of Privatization, Competition, andRegulation.” Manchester: University of Manchester, Centre onRegulation and Competition, Institute for Development Policyand Management Working Paper 13.
Zongo, Tersius, Siaka Coulibaly, Gilles Hervio, Javier Nino Perez,and Stefan Emblad. 2000. Conditionality Reform: The BurkinaFaso Pilot Case. Brussels: SPA Task Team on Contractual Rela-tionships and Selectivity.
Background Papers for the WDR 2005Bartelsman, Eric, John Haltiwanger, and Stefano Scarpetta. “Micro-
economic Evidence of Creative Destruction in Industrial andDeveloping Countries.”
Burns, Anthony. “Thailand’s 20 Year Program to Title Rural Land.”
Byaruhanga, Charles. “Managing Investment Climate Reforms:Case Study of Uganda Telecommunications.”
Chen, Martha Alter, Renana Jhabvala, and Reema Nanavaty. “TheInvestment Climate for Female Informal Businesses: A CaseStudy from Urban and Rural India.”
Clarete, Ramon L. “Customs Valuation Reform in the Philippines.”
References 241
15_WDR_References.qxd 8/24/04 3:08 PM Page 241

Coolidge, Jacqueline, Lars Grava, and Sanda Putnina, “InspectorateReform in Latvia, 1999–2003.”
De Wulf, Luc.“Tradenet in Ghana: Best Practice of the Use of Infor-mation Technology.”
Desai, Raj M. “ Political Influence and Firm Innovation: Micro-Level Evidence from Developing Countries.”
Echeverry, Juan Carlos, and Mauricio Santa María. “The PoliticalEconomy of Labor Reform in Colombia.”
Endo, Victor. “Managing Investment Climate Reforms: The PeruUrban Land Reform Case Study Draft No.2.”
Finnegan, David. “Tanzania’s Commercial Court.”
Gil Hubert, Johana. “The Mexican Credit Reporting IndustryReform: A Case Study. “
Hallward-Driemeier, Mary, and Andrew H. W. Stone. “The Invest-ment Climate for Informal Firms.”
Hallward-Driemeier, Mary, and David Stewart. “How Do Invest-ment Climate Conditions Vary Across Countries and Types ofFirms?”
Hernandez, Zenaida. “The Debate on Industrial Policy in East Asia:In Search for Lessons.”
Hubka, Ashley, and Rita Zaidi. “Innovations in Microfinance.”
Irwin, Timothy. “Accounting for Public-Private Partnerships: HowShould Governments Report Guarantees and Long-term Pur-chase Contracts.”
Jurajda, Stepan, and Katarína Mathernová. “How to Overhaul theLabor Market: Political Economy of Recent Czech and SlovakReforms.”
Khan, Shamin Ahmad. “Business Registration Reforms in Pak-istan.”
Klapper, Leora F., and Rida Zaidi. “A Survey of Government Regu-lation and Intervention in Financial Markets.”
Lund, Frances, and Caroline Skinner. “The Investment Climate forthe Informal Economy: A Case of Durban, South Africa.”
Mallon, Raymond. “Managing Investment Climate Reforms: Viet-nam Case Study.”
Migliorisi, Stefano, and Marco Galmarini. “Donor Assistance toInvestment Climate Reforms.”
Mitullah, Winnie V.“Street Vending in African Cities: A Synthesis ofEmpirical Findings From Kenya, Cote D’Ivoire, Ghana, Zim-babwe, Uganda and South Africa.”
Navarrete, Camilo. “Managing Investment Climate Reforms:Colombian Ports Sector Reform Case Study.”
Olofsgård, Anders F. “The Political Economy of Reform: Institu-tional Change as a Tool for Political Credibility.”
Pierre, Gaëlle, and Stefano Scarpetta. “Do Employers’ PerceptionsSquare with Actual Labor Regulations?.”
Pierre, Gaëlle, and Stefano Scarpetta. “How Labor Market PolicyCan Combine Workers’ Protection and Job Creation.”
Ray, Amit S. “Managing Port Reforms in India: Case Study of Jawa-harlal Nehru Port Trust (JNPT) Mumbai.”
Salas, Fernando José. “Mexican Deregulation: Smart Tape on RedTape.”
Surdej, Aleksander. “Managing Labor Market Reforms: Case Studyof Poland.”
Yufei, Pu, Sheng Lei, and Yao Yu. “Policy Reform on InvestmentClimate—Case Analysis of Hangzhou.”
Case studies commissioned by the U.K.Department for International Developmentfor the 2005 World Development ReportBannock, Graham, Matthew Gamser and Mariell Juhlin. “The
Importance of the Enabling Environment for Business and Eco-nomic Growth: A 10 Country Comparison of Central Europeand Africa.”
Christianson, David. “The Investment Climate in South Africa—Regulatory Issues: Some Insights from the High-Growth,Export-Oriented SME Sector.”
Estrin, Saul and Klaus Meyer. “Lessons for Development from Lon-don Business School’s Centre for New and Emerging Markets(CNEM) Research Project ‘Investment in Emerging Marketing’.”
Evenett, Simon J. “Competition Law and the Investment Climate inDeveloping Countries.”
Fortune, Peter. “Investment Climate Reform in Ukraine.”
Gamser, Matthew. “Improving the Business Trade LicensingReform Environment.”
Holmes, Peter. “Some Lessons from the CUTS 7-Up: ComparativeCompetitive Policy Project.”
Irwin, David. “Creating FDI Friendly Environments in South Asia.”
Mackinnon, Gregor. “Lessons from CBC Business EnvironmentSurveys 1999, 2001, 2003.”
Mehta, Pradeep. “Investment for Development Project (IFD)—Civil Society Perceptions.”
Preston, John. “Investment Climate Reform: Competition Policyand Economic Development: Some Country Experiences.”
Sander, Cerstin. “Migrant Remittances and the Investment Climate:Exploring the Nexus.”
Sander, Cerstin. “Less is More: Better Compliance and IncreasedRevenues by Streamlining Business Registration in Uganda.”
Velde, Dirk Willem te . “OECD (UK & EU) Home Country Mea-sures and FDI in Developing Countries; A Preliminary Analysis.”
Vickers, Brendan. “Investment Climate Reform in South Africa.”
White, Simon. “Donor Experiences in Supporting Reforms to theInvestment Climate for Small Enterprise Development.”
242 WORLD DEVELOPMENT REPORT 2005
15_WDR_References.qxd 8/24/04 3:08 PM Page 242

Measuring the investment climate 244Introduction
Table A1. Investment climate indicators: World Bank InvestmentClimate Surveys
Table A2. Investment climate indicators: expert polls and othersurveys
Technical notes
Selected world development indicators 253Introduction
Classification of economies by region and income
Table 1. Key indicators of development
Table 2. Poverty and income distribution
Table 3. Economic activity
Table 4. Trade, aid, and finance
Table 5. Key indicators for other economies
Technical notes
Selected Indicators
16_WDR_SWDI.qxd 8/24/04 3:26 PM Page 243

Firms evaluating alternative investment options, governmentsinterested in improving their investment climates, and econo-mists seeking to understand the role of different factors inexplaining economic performance—all have grappled withdefining and measuring the investment climate. The numberof organizations working in this area has expanded the vari-ables available. For example, The PRS Group’s InternationalCountry Risk Guide and Business Environment Risk Intelli-gence give measures on various sources of country risk basedon evaluations of international experts (additional examplesand their websites are in a table at the end of the technicalnotes). The World Economic Forum looks at a wider range offactors thought to affect competitiveness based on relativelysmall samples of mostly multinational firms. The WorldwideGovernance Research Indicators Dataset draw on sources from18 different organizations to create six governance indicators,including “rule of law,” “government effectiveness” and “con-trol of corruption.”While these and related variables have con-tributed to cross-country analysis, such broad assessments donot translate easily into diagnoses of specific problems or cap-ture the nuances of different institutional settings.
To complement and extend these efforts, the World Bank,working with client governments and others, recently pio-neered new measures of the investment climate. The Invest-ment Climate Surveys measure specific constraints facingfirms, and relate them to measures of firm performance,growth, and investment. The Doing Business Project collectscountry level data on the details of a set of regulations. TheReport draws on both sets of data and presents selections fromthese databases in the following tables.
Challenges in measuring the investment climateAll efforts to develop more specific insights and related datahave to contend with five main challenges:
• Multidimensional nature of the concept being measured.Stability and corruption are important, but so are
approaches to regulation and access to modern telecom-munications services. The many factors can also interactin various ways. The lack of secure property rights canlead to difficulties in getting finance on reasonable terms.And the level of taxes affects the ability of governments toprovide public services, including those that benefitfirms. Similarly, the level of corruption is not only a directcost to firms but can also lead to deep distortions acrossthe policymaking apparatus of government. Reducingsuch details into a single measure misses the insights froma more disaggregated analysis, and hides the degree ofvariation within a country.
• Some dimensions are inherently difficult to measure. Cer-tain investment climate constraints are relatively easy toidentify and measure, such as the reliability of the powersupply or the time it takes to register a business. Othersare more sensitive, such as issues dealing with corruption,and can lead to underreporting. Other dimensions areharder to quantify such as competitive pressures and pol-icy related risks. However, omitting important dimen-sions because the measurements have not been perfectedwould give a distorted assessment. Alternatively, the col-lection of the wider set of information can be pursued,with the evaluation of the responses taking into accountthe nature of the subject matter being reported.
• Differences in perspective across firms and activities. Even asingle dimension of the investment climate can affectfirms or activities in different ways. For example, defi-ciencies in port and customs infrastructure can be amajor impediment to firms engaged in exporting andhave only more limited and indirect effects on otherfirms. Similarly, some firms may benefit from govern-ment-mandated monopolies, while other firms lose bybeing denied the opportunity to compete or by payinghigher prices for products from the protected industry.Burdens that represent fixed costs also result in a dispro-portionate burden on smaller firms. In addition, somevariables that may impose a burden on firms may provide
244
Measuring the investment climate
16_WDR_SWDI.qxd 8/24/04 3:26 PM Page 244

other social benefits. Examples include levying taxes toimprove public services or meet other social goals, or reg-ulations to safeguard the environment or consumers.Simply relying on opinions from firms could lead toquestionable policy advice. But even objective responsescan vary by type of respondent. Ideally measures wouldcapture the range of perspectives and evaluations of con-straints.
• Differences between locations within countries. Investmentclimate conditions are not uniform in each country, withsignificant differences often evident across locations. Thisis most obviously the case in large countries with federalstructures, where sub-national governments may differ intheir policies and behaviors. But it also true with morecentralized governments, where there are often importantdifferences within the country in matters like infrastruc-ture provision and even the enforcement of national lawsand regulations.
• The experience on the ground does not always reflect formalpolicies. The policies as they exist on the books are notalways implemented. In some countries, the gap betweenthe formal policy and its implementation is substantial.Variations in the degree of discretion officials have, theresources put into implementation and the political willto enforce existing regulations can have a big impact. Thedistinction can be important in determining the priori-ties and expected benefits of reform initiatives.
In grappling with these issues, objective and perception baseddata each can make a contribution. Objective measures haveadvantages of allowing more precise and consistent bench-marking of conditions. But for some factors, subjective indica-tors may be the only effective way to reflect differences acrosslocations or types of firms. As investment decisions ultimatelydepend on subjective judgments, measures that reflect firmperceptions add additional insights.
The World Bank’s new measuresThe table illustrates how Investment Climate Surveys and theDoing Business Project address these challenges, providingcomplementary sources of indicators. Together, they providenew insights in the investment climates of a growing numberof countries.
The WDR team also adapted the Investment Climate Sur-vey methodology to surveys of micro and informal firms in 11countries. These comprise Bangladesh, Brazil, Cambodia,
Guatemala, India, Indonesia, Kenya, Pakistan, Senegal, Tanza-nia, and Uganda.
Additional information and access to these datasets can beobtained at:
econ.worldbank.org/wdr/wdr2005
iresearch.worldbank.org/ics
rru.worldbank.org/DoingBusiness.
Measuring the investment climate 245
New investment climate measures from the World Bank
Investment Climate Doing Surveys Business Project
Country coverage Launched in 2001, this Report Initially covering 130 draws on over 26,000 firms countries in 2003, in 53 countries. Each year additional countries an additional 15–20 surveys are being added.are fielded.
Investment climate The standard questionnaire Beginning with 5 areas dimensions covered of 82 questions covers of regulation (business
regulations, governance, registration, insolvency, access to finance, and contract enforcement, infrastructure services. It hiring and firing workers also collects data on firm and accessing credit), productivity, investment, and additional topics are employment decisions. being added.
Types of variables Covers both objective and Objective measures of perception data. The the number of objective data includes the procedures, the time to time to complete processes compete them, and the and monetary costs of fees and costs various disruptions and associated with regulations. In addition, compliance. respondents give perceptions of potential constraints and assessments of risks and competition.
Whose perspective Surveys cover a diverse Use a single, defined, range of sizes and activities, hypothetical firm and with random samples of transaction. Judgments several hundred firms. Data based on assessment is gathered through face-to- of up to 5 local experts face interviews conducted (lawyers, accountants).with senior managers and accountants.
Differences within Samples cover multiple A single indicator is a country locations within each given for the largest
country. city in the country. For some large countries, additional cities are available.
Basis of assessment Indicators are based on the Indicators measure experience reported by firms, formal regulatory providing ranges of how requirements.policies are implemented in practice.
16_WDR_SWDI.qxd 8/31/04 12:01 PM Page 245
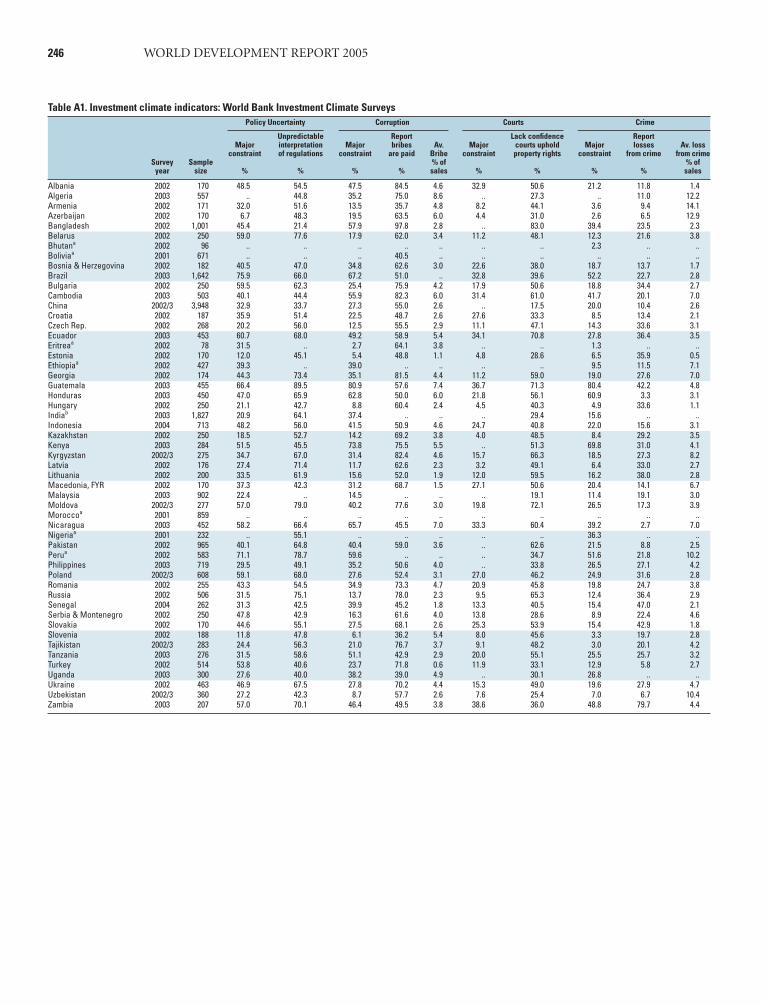
246 WORLD DEVELOPMENT REPORT 2005
Table A1. Investment climate indicators: World Bank Investment Climate SurveysPolicy Uncertainty Corruption Courts Crime
Unpredictable Report Lack confidence Report Major interpretation Major bribes Av. Major courts uphold Major losses Av. loss
constraint of regulations constraint are paid Bribe constraint property rights constraint from crime from crimeSurvey Sample % of % of
year size % % % % sales % % % % sales
Albania 2002 170 48.5 54.5 47.5 84.5 4.6 32.9 50.6 21.2 11.8 1.4Algeria 2003 557 .. 44.8 35.2 75.0 8.6 .. 27.3 .. 11.0 12.2Armenia 2002 171 32.0 51.6 13.5 35.7 4.8 8.2 44.1 3.6 9.4 14.1Azerbaijan 2002 170 6.7 48.3 19.5 63.5 6.0 4.4 31.0 2.6 6.5 12.9Bangladesh 2002 1,001 45.4 21.4 57.9 97.8 2.8 .. 83.0 39.4 23.5 2.3Belarus 2002 250 59.0 77.6 17.9 62.0 3.4 11.2 48.1 12.3 21.6 3.8Bhutana 2002 96 .. .. .. .. .. .. .. 2.3 .. ..Boliviaa 2001 671 .. .. .. 40.5 .. .. .. .. .. ..Bosnia & Herzegovina 2002 182 40.5 47.0 34.8 62.6 3.0 22.6 38.0 18.7 13.7 1.7Brazil 2003 1,642 75.9 66.0 67.2 51.0 .. 32.8 39.6 52.2 22.7 2.8Bulgaria 2002 250 59.5 62.3 25.4 75.9 4.2 17.9 50.6 18.8 34.4 2.7Cambodia 2003 503 40.1 44.4 55.9 82.3 6.0 31.4 61.0 41.7 20.1 7.0China 2002/3 3,948 32.9 33.7 27.3 55.0 2.6 .. 17.5 20.0 10.4 2.6Croatia 2002 187 35.9 51.4 22.5 48.7 2.6 27.6 33.3 8.5 13.4 2.1Czech Rep. 2002 268 20.2 56.0 12.5 55.5 2.9 11.1 47.1 14.3 33.6 3.1Ecuador 2003 453 60.7 68.0 49.2 58.9 5.4 34.1 70.8 27.8 36.4 3.5Eritreaa 2002 78 31.5 .. 2.7 64.1 3.8 .. .. 1.3 .. ..Estonia 2002 170 12.0 45.1 5.4 48.8 1.1 4.8 28.6 6.5 35.9 0.5Ethiopiaa 2002 427 39.3 .. 39.0 .. .. .. .. 9.5 11.5 7.1Georgia 2002 174 44.3 73.4 35.1 81.5 4.4 11.2 59.0 19.0 27.6 7.0Guatemala 2003 455 66.4 89.5 80.9 57.6 7.4 36.7 71.3 80.4 42.2 4.8Honduras 2003 450 47.0 65.9 62.8 50.0 6.0 21.8 56.1 60.9 3.3 3.1Hungary 2002 250 21.1 42.7 8.8 60.4 2.4 4.5 40.3 4.9 33.6 1.1Indiab 2003 1,827 20.9 64.1 37.4 .. .. .. 29.4 15.6 .. ..Indonesia 2004 713 48.2 56.0 41.5 50.9 4.6 24.7 40.8 22.0 15.6 3.1Kazakhstan 2002 250 18.5 52.7 14.2 69.2 3.8 4.0 48.5 8.4 29.2 3.5Kenya 2003 284 51.5 45.5 73.8 75.5 5.5 .. 51.3 69.8 31.0 4.1Kyrgyzstan 2002/3 275 34.7 67.0 31.4 82.4 4.6 15.7 66.3 18.5 27.3 8.2Latvia 2002 176 27.4 71.4 11.7 62.6 2.3 3.2 49.1 6.4 33.0 2.7Lithuania 2002 200 33.5 61.9 15.6 52.0 1.9 12.0 59.5 16.2 38.0 2.8Macedonia, FYR 2002 170 37.3 42.3 31.2 68.7 1.5 27.1 50.6 20.4 14.1 6.7Malaysia 2003 902 22.4 .. 14.5 .. .. .. 19.1 11.4 19.1 3.0Moldova 2002/3 277 57.0 79.0 40.2 77.6 3.0 19.8 72.1 26.5 17.3 3.9Moroccoa 2001 859 .. .. .. .. .. .. .. .. .. ..Nicaragua 2003 452 58.2 66.4 65.7 45.5 7.0 33.3 60.4 39.2 2.7 7.0Nigeriaa 2001 232 .. 55.1 .. .. .. .. .. 36.3 .. ..Pakistan 2002 965 40.1 64.8 40.4 59.0 3.6 .. 62.6 21.5 8.8 2.5Perua 2002 583 71.1 78.7 59.6 .. .. .. 34.7 51.6 21.8 10.2Philippines 2003 719 29.5 49.1 35.2 50.6 4.0 .. 33.8 26.5 27.1 4.2Poland 2002/3 608 59.1 68.0 27.6 52.4 3.1 27.0 46.2 24.9 31.6 2.8Romania 2002 255 43.3 54.5 34.9 73.3 4.7 20.9 45.8 19.8 24.7 3.8Russia 2002 506 31.5 75.1 13.7 78.0 2.3 9.5 65.3 12.4 36.4 2.9Senegal 2004 262 31.3 42.5 39.9 45.2 1.8 13.3 40.5 15.4 47.0 2.1Serbia & Montenegro 2002 250 47.8 42.9 16.3 61.6 4.0 13.8 28.6 8.9 22.4 4.6Slovakia 2002 170 44.6 55.1 27.5 68.1 2.6 25.3 53.9 15.4 42.9 1.8Slovenia 2002 188 11.8 47.8 6.1 36.2 5.4 8.0 45.6 3.3 19.7 2.8Tajikistan 2002/3 283 24.4 56.3 21.0 76.7 3.7 9.1 48.2 3.0 20.1 4.2Tanzania 2003 276 31.5 58.6 51.1 42.9 2.9 20.0 55.1 25.5 25.7 3.2Turkey 2002 514 53.8 40.6 23.7 71.8 0.6 11.9 33.1 12.9 5.8 2.7Uganda 2003 300 27.6 40.0 38.2 39.0 4.9 .. 30.1 26.8 .. ..Ukraine 2002 463 46.9 67.5 27.8 70.2 4.4 15.3 49.0 19.6 27.9 4.7Uzbekistan 2002/3 360 27.2 42.3 8.7 57.7 2.6 7.6 25.4 7.0 6.7 10.4Zambia 2003 207 57.0 70.1 46.4 49.5 3.8 38.6 36.0 48.8 79.7 4.4
16_WDR_SWDI.qxd 8/24/04 3:26 PM Page 246
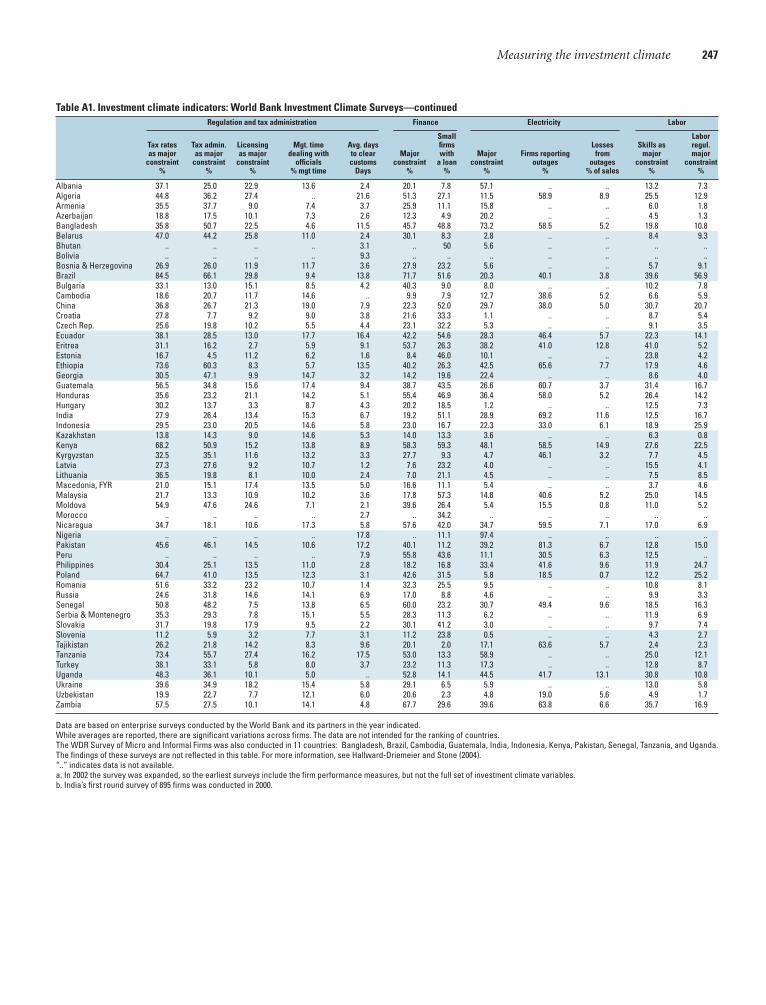
Measuring the investment climate 247
Table A1. Investment climate indicators: World Bank Investment Climate Surveys—continuedRegulation and tax administration Finance Electricity Labor
Small LaborTax rates Tax admin. Licensing Mgt. time Avg. days firms Losses Skills as regul. as major as major as major dealing with to clear Major with Major Firms reporting from major major
constraint constraint constraint officials customs constraint a loan constraint outages outages constraint constraint% % % % mgt time Days % % % % % of sales % %
Albania 37.1 25.0 22.9 13.6 2.4 20.1 7.8 57.1 .. .. 13.2 7.3Algeria 44.8 36.2 27.4 .. 21.6 51.3 27.1 11.5 58.9 8.9 25.5 12.9Armenia 35.5 37.7 9.0 7.4 3.7 25.9 11.1 15.8 .. .. 6.0 1.8Azerbaijan 18.8 17.5 10.1 7.3 2.6 12.3 4.9 20.2 .. .. 4.5 1.3Bangladesh 35.8 50.7 22.5 4.6 11.5 45.7 48.8 73.2 58.5 5.2 19.8 10.8Belarus 47.0 44.2 25.8 11.0 2.4 30.1 8.3 2.8 .. .. 8.4 9.3Bhutan .. .. .. .. 3.1 .. 50 5.6 .. .. .. ..Bolivia .. .. .. .. 9.3 .. .. .. .. .. .. ..Bosnia & Herzegovina 26.9 26.0 11.9 11.7 3.6 27.9 23.2 5.6 .. .. 5.7 9.1Brazil 84.5 66.1 29.8 9.4 13.8 71.7 51.6 20.3 40.1 3.8 39.6 56.9Bulgaria 33.1 13.0 15.1 8.5 4.2 40.3 9.0 8.0 .. .. 10.2 7.8Cambodia 18.6 20.7 11.7 14.6 .. 9.9 7.9 12.7 38.6 5.2 6.6 5.9China 36.8 26.7 21.3 19.0 7.9 22.3 52.0 29.7 38.0 5.0 30.7 20.7Croatia 27.8 7.7 9.2 9.0 3.8 21.6 33.3 1.1 .. .. 8.7 5.4Czech Rep. 25.6 19.8 10.2 5.5 4.4 23.1 32.2 5.3 .. .. 9.1 3.5Ecuador 38.1 28.5 13.0 17.7 16.4 42.2 54.6 28.3 46.4 5.7 22.3 14.1Eritrea 31.1 16.2 2.7 5.9 9.1 53.7 26.3 38.2 41.0 12.8 41.0 5.2Estonia 16.7 4.5 11.2 6.2 1.6 8.4 46.0 10.1 .. .. 23.8 4.2Ethiopia 73.6 60.3 8.3 5.7 13.5 40.2 26.3 42.5 65.6 7.7 17.9 4.6Georgia 30.5 47.1 9.9 14.7 3.2 14.2 19.6 22.4 .. .. 8.6 4.0Guatemala 56.5 34.8 15.6 17.4 9.4 38.7 43.5 26.6 60.7 3.7 31.4 16.7Honduras 35.6 23.2 21.1 14.2 5.1 55.4 46.9 36.4 58.0 5.2 26.4 14.2Hungary 30.2 13.7 3.3 8.7 4.3 20.2 18.5 1.2 .. .. 12.5 7.3India 27.9 26.4 13.4 15.3 6.7 19.2 51.1 28.9 69.2 11.6 12.5 16.7Indonesia 29.5 23.0 20.5 14.6 5.8 23.0 16.7 22.3 33.0 6.1 18.9 25.9Kazakhstan 13.8 14.3 9.0 14.6 5.3 14.0 13.3 3.6 .. .. 6.3 0.8Kenya 68.2 50.9 15.2 13.8 8.9 58.3 59.3 48.1 58.5 14.9 27.6 22.5Kyrgyzstan 32.5 35.1 11.6 13.2 3.3 27.7 9.3 4.7 46.1 3.2 7.7 4.5Latvia 27.3 27.6 9.2 10.7 1.2 7.6 23.2 4.0 .. .. 15.5 4.1Lithuania 36.5 19.8 8.1 10.0 2.4 7.0 21.1 4.5 .. .. 7.5 8.5Macedonia, FYR 21.0 15.1 17.4 13.5 5.0 16.6 11.1 5.4 .. .. 3.7 4.6Malaysia 21.7 13.3 10.9 10.2 3.6 17.8 57.3 14.8 40.6 5.2 25.0 14.5Moldova 54.9 47.6 24.6 7.1 2.1 39.6 26.4 5.4 15.5 0.8 11.0 5.2Morocco .. .. .. .. 2.7 .. 34.2 .. .. .. .. ..Nicaragua 34.7 18.1 10.6 17.3 5.8 57.6 42.0 34.7 59.5 7.1 17.0 6.9Nigeria .. .. .. .. 17.8 .. 11.1 97.4 .. .. .. ..Pakistan 45.6 46.1 14.5 10.6 17.2 40.1 11.2 39.2 81.3 6.7 12.8 15.0Peru .. .. .. .. 7.9 55.8 43.6 11.1 30.5 6.3 12.5 ..Philippines 30.4 25.1 13.5 11.0 2.8 18.2 16.8 33.4 41.6 9.6 11.9 24.7Poland 64.7 41.0 13.5 12.3 3.1 42.6 31.5 5.8 18.5 0.7 12.2 25.2Romania 51.6 33.2 23.2 10.7 1.4 32.3 25.5 9.5 .. .. 10.8 8.1Russia 24.6 31.8 14.6 14.1 6.9 17.0 8.8 4.6 .. .. 9.9 3.3Senegal 50.8 48.2 7.5 13.8 6.5 60.0 23.2 30.7 49.4 9.6 18.5 16.3Serbia & Montenegro 35.3 29.3 7.8 15.1 5.5 28.3 11.3 6.2 .. .. 11.9 6.9Slovakia 31.7 19.8 17.9 9.5 2.2 30.1 41.2 3.0 .. .. 9.7 7.4Slovenia 11.2 5.9 3.2 7.7 3.1 11.2 23.8 0.5 .. .. 4.3 2.7Tajikistan 26.2 21.8 14.2 8.3 9.6 20.1 2.0 17.1 63.6 5.7 2.4 2.3Tanzania 73.4 55.7 27.4 16.2 17.5 53.0 13.3 58.9 .. .. 25.0 12.1Turkey 38.1 33.1 5.8 8.0 3.7 23.2 11.3 17.3 .. .. 12.8 8.7Uganda 48.3 36.1 10.1 5.0 .. 52.8 14.1 44.5 41.7 13.1 30.8 10.8Ukraine 39.6 34.9 18.2 15.4 5.8 29.1 6.5 5.9 .. .. 13.0 5.8Uzbekistan 19.9 22.7 7.7 12.1 6.0 20.6 2.3 4.8 19.0 5.6 4.9 1.7Zambia 57.5 27.5 10.1 14.1 4.8 67.7 29.6 39.6 63.8 6.6 35.7 16.9
Data are based on enterprise surveys conducted by the World Bank and its partners in the year indicated. While averages are reported, there are significant variations across firms. The data are not intended for the ranking of countries.The WDR Survey of Micro and Informal Firms was also conducted in 11 countries: Bangladesh, Brazil, Cambodia, Guatemala, India, Indonesia, Kenya, Pakistan, Senegal, Tanzania, and Uganda.The findings of these surveys are not reflected in this table. For more information, see Hallward-Driemeier and Stone (2004).“..” indicates data is not available.a. In 2002 the survey was expanded, so the earliest surveys include the firm performance measures, but not the full set of investment climate variables. b. India’s first round survey of 895 firms was conducted in 2000.
16_WDR_SWDI.qxd 8/31/04 12:02 PM Page 247

248
Table A2. Investment climate indicators: expert polls and other surveysWorld Bank’s Doing Business Project
Intensity Transparency RegionalStarting a Enforcing a Registering Resolving Investment of local of gov’t disparities ofbusiness contract property insolvency Profile competition policymaking bus. environ.
Days Procedures Days Procedures Days Procedures Years ICRG WEF index WEF index WEF indexJan-04 Jan-04 Jan-04 Jan-04 Jan-04 Jan-04 Jan-04 2003 2003/4 2003/4 2003/4
Albania 47 11 390 39 47 7 4 8 .. .. ..Algeria 26 14 407 49 52 16 3.5 8 3.5 3.6 2.7Angola 146 14 1011 47 335 8 4.7 8.5 2.4 2.5 2.8Argentina 32 15 520 33 44 5 2.8 5 4.4 2 2.8Armenia 25 10 195 24 18 4 1.9 8 .. .. ..Australia 2 2 157 11 7 5 1 10 5.4 5.6 5.1Austria 29 9 374 20 32 3 1 12 5.1 4 5.1Azerbaijan 123 14 267 25 61 7 2.7 9 .. .. ..Bangladesh 35 8 365 29 .. .. 4 5.25 4.8 3 2.9Belarus 79 16 250 28 231 7 5.8 5.5 .. .. ..Belgium 34 4 112 27 132 2 0.9 11.5 5.6 3.9 3.8Benin 32 8 570 49 50 3 3.1 .. .. .. ..Bhutan 62 11 275 20 44 4 .. .. .. ..Bolivia 59 15 591 47 92 7 1.8 9.5 3.8 3 3Bosnia & Herzegovina 54 12 330 36 331 7 3.3 .. .. .. ..Botswana 108 11 154 26 69 4 2.2 11.5 4.1 5.1 3.8Brazil 152 17 566 25 42 14 10 7.5 5.2 3.6 2.1Bulgaria 32 11 440 34 19 9 3.3 11.5 4.6 2.7 3Burkina Faso 135 13 458 41 107 8 4 9 .. .. ..Burundi 43 11 512 51 94 5 4 .. .. .. ..Cambodia 94 11 401 31 56 7 .. .. .. .. ..Cameroon 37 12 585 58 93 5 3.2 6.5 4.1 4.4 2.8Canada 3 2 346 17 20 6 0.8 12 5.5 4.5 4.1Central African Rep. 14 10 660 45 69 3 4.8 .. .. .. ..Chad 75 19 526 52 44 6 10 .. 3.6 2.5 2.3Chile 28 10 305 28 31 6 5.6 11 5.6 4.5 3.3China 41 12 241 25 32 3 2.4 7.5 5.3 4.2 3.3
Hong Kong, China 11 5 211 16 56 3 1.1 11.5 5.6 5.4 5.2Colombia 43 14 363 37 23 7 3 9.25 4.6 4 2.8Congo, Dem. Rep. 155 13 909 51 106 8 5.2 6 .. .. ..Congo, Rep. 67 8 560 47 103 6 3 8.5 .. .. ..Costa Rica 77 11 550 34 21 6 3.5 8.5 4.7 3.9 3.7Côte d’Ivoire 58 11 525 25 340 7 2.2 6 .. .. ..Croatia 49 12 415 22 956 5 3.1 9 4.6 3.1 2.8Czech Rep. 40 10 300 22 122 4 9.2 12 5.1 3.5 3.2Denmark 4 4 83 15 42 6 3.4 11.5 5.5 5.2 5Dominican Rep. 78 10 580 29 107 7 3.5 8.5 4.5 3.4 3.3Ecuador 92 14 388 41 21 12 4.3 6 3.5 2.5 2.9Egypt, Arab Rep. 43 13 410 55 193 7 4.2 6.5 4.4 3.4 3.6El Salvador 115 12 275 41 52 5 4 6 5 4 3.3Eritrea .. .. .. .. .. .. .. .. .. ..Estonia 72 6 150 25 65 4 3 10 5.3 4.2 2.7Ethiopia 32 7 420 30 56 15 2.4 7 3.6 3 2.2Finland 14 3 240 27 14 3 0.9 12 5.4 5.5 4.3France 8 7 75 21 193 10 1.9 12 5.4 4.4 4.2Gambia, The .. .. .. .. .. .. .. 8.5 4.2 4.7 3.4Georgia 25 9 375 18 39 8 3.2 .. .. .. ..Germany 45 9 184 26 41 4 1.2 12 5.5 4.5 4.8Ghana 85 12 200 23 382 7 1.9 7 4.3 4.3 3Greece 38 15 151 14 23 12 2 11 5.1 3.6 3Guatemala 39 15 1459 37 55 5 4 11 4.1 2 2.7Guinea 49 13 306 44 104 6 3.8 6.5 .. .. ..Haiti 203 12 368 35 195 5 5.7 5 4 2.7 1.5Honduras 62 13 545 36 36 7 3.7 8 3.4 2.9 3.5Hungary 52 6 365 21 79 4 2 12 4.9 3.9 2.3Iceland .. .. .. .. .. .. .. 11 5.3 5.3 4.3India 89 11 425 40 67 6 10 8 5.6 4.1 2.5Indonesia 151 12 570 34 33 6 6 4.5 4 3.6 3.6Iran, Islamic Rep. 48 9 545 23 36 9 4.5 6 .. .. ..Ireland 24 4 217 16 38 5 0.4 12 5.2 4.2 3.8Israel 34 5 585 27 144 7 4 9 5.6 4.2 5Italy 13 9 1390 18 27 8 1.2 12 5.3 3.9 2.6Jamaica 31 7 202 18 54 5 1.1 9.5 4.9 3.5 4Japan 31 11 60 16 14 6 0.5 12 5.5 3.9 4.5Jordan 36 11 342 43 22 8 4.3 9.5 5.2 4.4 3.4Kazakhstan 25 9 400 41 52 8 3.3 7.5 .. .. ..Kenya 47 12 360 25 39 7 4.5 9 5.2 3.6 2.8Korea, Rep. 22 12 75 29 11 7 1.5 9.5 5.3 4.4 3.8Kuwait 35 13 390 52 75 8 4.2 11 .. .. ..Kyrgyz Rep. 21 8 492 46 15 7 3.5 .. .. .. ..Lao PDR 198 9 443 53 135 9 5 .. .. .. ..Latvia 18 7 189 23 62 10 1.1 11 5 4.1 3.6Lebanon 46 6 721 39 25 8 4 9 .. .. ..Lesotho 92 9 285 49 101 6 2.6 .. .. .. ..Lithuania 26 8 154 17 3 3 1.2 11 5.1 3.8 3Luxembourg .. .. .. .. .. .. .. 12 4.4 5.3 5.1Macedonia, FYR 48 13 509 27 74 6 3.7 .. 4.3 3.8 3.7Madagascar 44 13 280 29 .. .. .. 8 4.2 3.5 1.9Malawi 35 10 277 16 118 6 2.6 8 4.2 4 2.9Malaysia 30 9 300 31 143 4 2.3 8.5 5.3 5 3.9
16_WDR_SWDI.qxd 8/24/04 3:26 PM Page 248

249
Table A2. Investment climate indicators: expert polls and other surveys—continuedWorld Bank’s Doing Business Project
Intensity Transparency RegionalStarting a Enforcing a Registering Resolving Investment of local of gov’t disparities ofbusiness contract property insolvency Profile competition policymaking bus. environ.
Days Procedures Days Procedures Days Procedures Years ICRG WEF index WEF index WEF indexJan-04 Jan-04 Jan-04 Jan-04 Jan-04 Jan-04 Jan-04 2003 2003/4 2003/4 2003/4
Mali 42 13 340 28 44 5 3.6 7.5 3.8 3.5 2.5Malta .. .. .. .. .. .. .. 11.5 5 4.8 5.5Mauritania 82 11 410 28 49 4 8 .. .. .. ..Mauritius .. .. .. .. .. .. .. .. 4.9 4.5 4.4Mexico 58 8 421 37 74 5 1.8 11.5 4.9 3.7 2.5Moldova 30 10 280 37 81 5 2.8 6.5 .. .. ..Mongolia 20 8 314 26 10 4 4 8 .. .. ..Morocco 11 5 240 17 82 3 1.8 9 4.4 4.2 2.5Mozambique 153 14 580 38 33 7 5 8.5 3.2 3.4 2.1Myanmar .. .. .. .. .. .. 4 .. .. ..Namibia 85 10 270 31 28 9 1.0 10 4.4 4.2 3Nepal 21 7 350 28 .. .. 5 .. .. .. ..Netherlands 11 7 48 22 5 4 1.7 12 5.6 4.8 5.1New Zealand 12 2 50 19 2 2 2 11.5 5.7 5.2 4.9Nicaragua 45 9 155 18 65 7 2.2 6 3.2 2.9 2.9Niger 27 11 330 33 49 5 5 7.5 .. .. ..Nigeria 44 10 730 23 274 21 1.5 3.5 4.7 3.5 2.9Norway 23 4 87 14 1 1 0.9 11.5 5.1 3.8 3.9Oman 34 9 455 41 16 4 7 11.5 .. .. ..Pakistan 24 11 395 46 49 5 2.8 4.5 5 3.5 2.8Panama 19 7 355 45 44 7 2 9.5 4.5 2.8 3.4Papua New Guinea 56 8 295 22 72 4 2.8 8 .. .. ..Paraguay 74 17 285 46 48 7 3.9 8.5 4.1 2.2 3.3Peru 98 10 441 35 31 5 3.1 7.5 4.6 2.9 2.2Philippines 50 11 380 25 33 8 5.6 10 5 3.7 2.5Poland 31 10 1000 41 204 7 1.4 11 4.8 2.9 2.8Portugal 78 11 320 24 83 5 2.5 12 5 3.7 2.8Puerto Rico 7 7 270 43 .. .. 3.8 .. .. .. ..Romania 28 5 335 43 170 8 4.6 8.5 3.6 2.6 2.8Russian Federation 36 9 330 29 37 6 1.5 9 4 2.5 2.3Rwanda 21 9 395 29 354 5 .. .. .. .. ..Saudi Arabia 64 12 360 44 4 4 2.8 11 .. .. ..Senegal 57 9 485 36 114 6 3 8 4.3 3.9 2.6Serbia & Montenegro 51 11 1028 36 186 6 2.6 8 4.1 4.1 2.8Sierra Leone 26 9 305 58 58 8 2.5 6.5 .. .. ..Singapore 8 7 69 23 9 3 0.8 12 5.4 6.2 5.8Slovak Rep. 52 9 565 27 22 5 4.7 12 4.7 3.4 2.2Slovenia 61 10 1003 25 391 6 3.6 10 4.9 4.2 3.4South Africa 38 9 277 26 20 6 2 10.5 5.3 4.3 2.9Spain 108 7 169 23 20 4 1 12 5.5 4.2 3.9Sri Lanka 50 8 440 17 63 8 2.2 8.5 4.7 3.7 3.4Sweden 16 3 208 23 2 1 2 12 5.5 5.2 4.1Switzerland 20 6 170 22 16 4 4.6 11.5 5.1 5.3 4.7Syrian Arab Rep. 47 12 672 48 23 4 4.1 6.5 .. .. ..Tajikistan .. .. .. .. .. .. .. .. .. .. ..Tanzania 35 13 242 21 61 12 3 7.5 4.7 4.1 2.6Thailand 33 8 390 26 2 2 2.6 8.5 5.3 4.3 4.1Togo 53 13 535 37 212 6 3 7.5 .. .. ..Trinidad & Tobago .. .. .. .. .. .. .. 11.5 4.8 3.9 4.3Tunisia 14 9 27 14 57 5 1.3 8 4.5 5.1 3.4Turkey 9 8 330 22 9 8 2.9 7.5 4.7 3.4 2.2Turkmenistan .. .. .. .. .. .. .. .. .. .. ..Uganda 36 17 209 15 48 8 2.1 8.5 4.4 3.9 2.7Ukraine 34 15 269 28 93 9 2.6 6 4.1 2.2 2.7United Arab Emirates 54 12 614 53 9 3 5.1 11.5 .. .. ..United Kingdom 18 6 288 14 21 2 1 12 6 5 4.3United States 5 5 250 17 12 4 3 12 5.9 4.9 5.2Uruguay 45 11 620 39 66 8 2.1 10.5 4.3 3.3 3.9Uzbekistan 35 9 368 35 97 12 4 .. .. .. ..Venezuela, RB 116 13 445 41 34 8 4 5.5 3.8 2.1 3.3Vietnam 56 11 404 37 78 5 5.5 7.5 4.9 4.3 2.8Yemen, Rep. 63 12 360 37 21 6 3 8 .. .. ..Zambia 35 6 274 16 70 6 2.7 6 4.1 4.5 2.8Zimbabwe 96 10 350 33 30 4 2.2 2.5 3.6 2.6 3.5World 50.8 9.9 388.3 31.2 81.4 6.2 3.2 8.8 4.7 3.9 3.4Low income 65.8 10.8 416.0 34.5 99.6 6.8 3.9 6.8 4.2 3.6 2.7Middle income 50.0 10.6 422.1 32.6 80.4 6.5 3.4 8.7 4.6 3.5 3.1
Lower middle income 50.0 11.3 424.9 33.1 66.4 7.0 3.4 7.8 4.5 3.4 3.0Upper middle income 49.9 9.5 417.2 31.8 104.2 5.6 3.3 10.0 4.8 3.7 3.3
Low & middle income 57.5 10.7 419.2 33.5 89.3 6.6 3.6 7.9 4.4 3.6 3.0East Asia & Pacific 72.9 9.9 373.8 31.0 59.4 5.2 4.2 7.2 5.0 4.2 3.4Europe & Central Asia 41.7 9.9 389.0 30.2 120.3 6.7 3.3 9.2 4.6 3.3 2.8Latin America & Carib. 73.5 12.0 471.7 35.1 56.8 6.9 3.6 8.1 4.4 3.1 3.1Middle East & N. Africa 39.3 10.2 412.6 37.3 48.3 6.7 3.7 8.1 4.4 4.1 3.1South Asia 46.8 9.3 375.0 30.0 55.8 5.8 4.8 6.6 5.0 3.6 2.9Sub-Saharan Africa 63.2 11.2 434.2 35.2 114.2 6.9 3.6 7.2 4.2 3.8 2.9
High income 27.2 7.0 280.2 23.2 49.9 4.7 2.0 11.4 5.4 4.7 4.4
The aggregates are unweighted averages. See p. 255 for country groupings.“..” indicates data is not available.
16_WDR_SWDI.qxd 8/24/04 3:26 PM Page 249

Technical notes
Table A1. Investment climate indicators: WorldBank’s Investment Climate Survey of FirmsInvestment Climate Surveys have been implemented in over 53countries since 2001. A standardized questionnaire is used toensure comparability of responses. It was refined based onextensive field testing and reviews by academics and officialsfrom census departments. The World Bank works with partneragencies in each country to implement the survey and to con-duct the interviews. In most countries, national statisticaloffices assist with the sampling. The sampling focuses on man-ufacturing establishments according to their contribution toGDP. The samples are stratified by size to ensure sufficient cov-erage of larger firms. The 27 countries in Eastern Europe andCentral Asia were conducted jointly with the European Bankfor Reconstruction and Development under the name of Busi-ness Environment and Enterprise Performance Surveys II(BEEPS II). In five countries in this region the World Bankextended the samples to gather additional information on firmperformance. The Asia Development Bank is a partner in anumber of countries in Asia.
For each of the 8 sets of variables, the first column reportson the perception of senior managers of whether the issue rep-resents a problem for the operation and growth of their busi-ness. They were given a five-point scale, ‘no obstacle,’ ‘minorobstacle,’ ‘moderate obstacle,’ ‘major obstacle’ and ‘very severeobstacle.’ This is followed by more specific information on theissue, including objective measures in terms of monetary andtime costs.
Policy uncertainty constraint measures the share of seniormanagers that ranked “economic and regulatory policy uncer-tainty” as a major or very severe constraint. Unpredictableinterpretation of regulations reports the share of senior man-agers that disagreed with the statement that the interpretationof regulations by officials was predictable.
Corruption constraint measures the share of senior man-agers that ranked “corruption” as a major or very severe con-straint. Report bribes are paid is the share of senior managersthat report that establishments like theirs can sometimes berequired to make gifts or informal payments to public officialsto “get things done” or are paid to pass inspections, get licensesor permits, get a public utility connection or to get a govern-ment contract. The average bribe paid is the average size of thebribe as a percentage of sales for those firms that identify thatbribes are paid to “get things done”.
Courts constraint measures the share of senior managersthat ranked “courts and dispute resolution systems” as amajor or very severe constraint. Lack confidence in courtsto uphold property rights is the share of managers that dis-agreed with the statement: “I am confident that the judicialsystem will enforce my contractual and property rights inbusiness disputes.”
Crime constraint measures the share of senior managersthat ranked “crime, theft and disorder” as a major or verysevere constraint. Report losses from crime is the share offirms reporting a loss to the establishment due to theft, vandal-ism or arson in the previous year. The average loss from crimeis the loss as a share of sales for those reporting a crime.
Tax rate constraint measures the share of senior managersthat ranked “tax rates” as a major or very severe constraint. Taxadministration constraint measures the share of senior man-agers that ranked “tax administration” as a major or very severeconstraint. Licensing constraint measures the share of seniormanagers that ranked “business licenses and permits”as a majoror very severe constraint. Management time dealing with offi-cials with regard to requirements imposed by government regu-lations [e.g. taxes, customs, labor regulations, licensing and reg-istration etc.] in a given week. Average days to clear customs isthe time to clear an imported good through customs.
Finance constraint is the average of the shares of seniormanagers that ranked “access to finance” or “cost of finance” asa major or very severe constraint. Small firms with a loan isthe share of firms with less than 20 employees that have a loanfrom a formal financial intermediary.
Electricity constraint measures the share of senior man-agers that ranked “electricity” as a major or severe constraint.Firms reporting outages is the share of firms that report los-ing sales due to power interruptions and outages during theprevious year. Losses from outages is the average value of saleslost due to power interruptions and outages is expressed as ashare of sales for those reporting outages.
Skills constraint measures the share of senior managersthat ranked “skills of available workers”as a major or severeconstraint. Labor regulations constraint measures the shareof senior managers that ranked “labor regulations” as a majoror severe constraint.
Table A2. Investment climate indicators: expert polls and other surveysThe World Bank’s Doing Business ProjectThe Doing Business Project collects information on the num-ber of calendar days, the number of procedures and the costs ittakes to complete various business transactions. The first twoare reported here. It uses a defined hypothetical case to stan-dardize comparisons and report the time if all proceduresmandated by law are followed and are completed within theofficially designated time for each step.
Days to start up a business refers to the number of calen-dar days needed to complete all the required procedures forlegally operating a business. The number of procedures is alsoreported. If a procedure can be speeded up at additional cost,the fastest procedure, independent of cost, is chosen. Timeneeded to gather information about the registration proce-dures is not included. The hypothetical firm is a domestic lim-ited liability company of 50 employees.
250 WORLD DEVELOPMENT REPORT 2005
16_WDR_SWDI.qxd 8/24/04 3:26 PM Page 250

Days to enforce a contract are the number of calendar daysfrom the moment a plaintiff files the lawsuit in court until themoment of final determination and, in appropriate cases, pay-ment. The number of procedures is also reported. The stan-dardized hypothetical case is one involving an unpaid checkworth 50 percent of per capita GDP and is assessed by locallawyers based on official times each procedure should take.
The time and number of procedures to register propertylooks at the requirements to officially register property in aperi-urban area.
Resolving insolvency measures the number of calendardays from the moment of filing for insolvency in court untilthe moment of actual resolution of distressed assets. The hypo-thetical case is a hotel whose only asset is real estate.
International Country Risk GuideThe PRS Group’s International Country Risk Guide (ICRG) col-lects information on various components of risk, groupingthem into a number of indices. Lower numbers indicate higherrisk on a scale of 1 to 12. Reported here is the investment profilethat combines assessments of contract viability/expropriation,the ability to repatriate profits and payment delays.
Global Competitiveness ReportThe World Economic Forum’s Global CompetitivenessReport ranks 102 countries using their Executive OpinionSurvey, with samples averaging 76 respondents per country.Answers are scored on a seven point scale. Transparency ofgovernment policymaking is based on “Firms in your coun-try are usually informed clearly and transparently by thegovernment on changes in policies and regulations affectingyour industry (1 = never informed, 7 = always fully andclearly informed). Intensity of local competition is “compe-tition in the local market is (1 = limited in most industriesand price-cutting is rare, 7 = intense in most industries asmarket leadership changes over time). Regional disparitiesin quality of business environment is “differences amongregions within your country in the quality of the businessenvironment (human resources, infrastructure and otherfactors) are (1 = large and persistent, 7 = modest).
Other institutions provide additional measures of theinvestment climate. The following table provides examples,focusing on measures of risk and competition.
The WDR thanks the PRS Group and the World EconomicForum for making their data available.
Measuring the investment climate 251
Other sources of investment climate–related indicators—selected examples
Index Publisher Sample Assessment
Business Risk Service Business Environment Risk Intelligence Country risk in 50 countries based on Assessments by in-house expertswww.beri.com evaluation of 3 sub-categories.
Updated trimestrally.
Country Credit Ratings Euromoney Institutional Investor Credit ratings of 151 countries based Surveys of outside financial and www.euromoneyplc.com on nine areas of country risk. Updated investment analysts.
semi-annually.
Country Risk Indicators World Markets Research Center Country risk in 186 countries based Assessments by in-house expertswww.wmrc.com on evaluation of 6 risk factors.
Updated daily.
Country Risk Service Economist Intelligence Unit Country risk in 100 emerging Assessments by in-house expertswww.eiu.com economies and 6 regions based on
evaluation of 13 risk attributes. Updated monthly.
Economic Freedom of the World Fraser Institute Freedom from government regulation Assessments by in-house experts www.freetheworld.com in 123 countries covering 8 areas. and existing surveys, including GCR
Updated annually. and ICRG.
FDI Confidence Index A. T. Kearney Attractiveness of 62 countries to FDI. Surveys of 1,000 multinational www.atkearney.com Updated annually. company CEOs
Global Competitiveness Report World Economic Forum Competitiveness of 102 countries. Surveys of executives of local and www.weforum.org Updated annually. global companies
Global Risk Service Global Insight Country risk in 117 countries based Assessments by in-house expertswww.globalinsight.com on an evaluation of 51 risk attributes.
Updated quarterly.
Index of Economic Freedom Heritage Foundation Freedom from government regulation Assessments by in-house expertswww.heritage.org in 142 countries, based on evaluation
of 10 factors. Updated annually.
International Country Risk Guide Political Risk Services International Country risk in 140 countries based Assessments by in-house expertswww.prsgroup.com on evaluation of 22 variables in 3
sub-categories. Updated monthly.
World Competitiveness Yearbook International Institute for Management Competitiveness of 51 countries, 9 Compiled from international and Development sub-national regions. Updated regional organizations and private www.imd.ch annually. institutes, executive opinion surveys
Worldwide Governance Indicators World Bank Governance indicators for 199 Aggregation of existing surveys and www.worldbank.org/ countries covering six dimensions of indicators.wbi/governance/data governance. Updated biennially.
16_WDR_SWDI.qxd 8/24/04 3:26 PM Page 251

16_WDR_SWDI.qxd 8/24/04 3:26 PM Page 252

253
In this year’s edition, development data are presented in fourtables presenting comparative socioeconomic data for morethan 130 economies for the most recent year for which dataare available and, for some indicators, for an earlier year. Anadditional table presents basic indicators for 75 economieswith sparse data or with populations of less than 1.5 million.
The indicators presented here are a selection from morethan 800 included in World Development Indicators 2004.Published annually, World Development Indicators reflects acomprehensive view of the development process. Its openingchapter reports on the Millennium Development Goalswhich grew out of agreements and resolutions of world con-ferences organized by the United Nations (UN) in the pastdecade, and reaffirmed at the Millennium Summit in Sep-tember 2000 by member countries of the UN. The other fivemain sections recognize the contribution of a wide range offactors: human capital development, environmental sustain-ability, macroeconomic performance, private sector devel-opment and the investment climate, and the global links thatinfluence the external environment for development. WorldDevelopment Indicators is complemented by a separatelypublished database that gives access to over 1,000 data tablesand 800 time-series indicators for 225 economies andregions. This database is available through an electronic sub-scription (WDI Online) or as a CD-ROM.
Data sources and methodologySocioeconomic and environmental data presented here aredrawn from several sources: primary data collected by theWorld Bank, member country statistical publications,research institutes, and international organizations such asthe United Nations and its specialized agencies, the Interna-tional Monetary Fund (IMF), and the OECD (see the DataSources following the Technical notes for a complete listing).Although international standards of coverage, definition,and classification apply to most statistics reported by coun-tries and international agencies, there are inevitably differ-ences in timeliness and reliability arising from differences in
the capabilities and resources devoted to basic data collec-tion and compilation. For some topics, competing sources ofdata require review by World Bank staff to ensure that themost reliable data available are presented. In some instances,where available data are deemed too weak to provide reliablemeasures of levels and trends or do not adequately adhere tointernational standards, the data are not shown.
The data presented are generally consistent with those inWorld Development Indicators 2004. However, data have beenrevised and updated wherever new information has becomeavailable. Differences may also reflect revisions to historicalseries and changes in methodology. Thus data of differentvintages may be published in different editions of WorldBank publications. Readers are advised not to compile dataseries from different publications or different editions of thesame publication. Consistent time-series data are availableon World Development Indicators 2004 CD-ROM andthrough WDI Online.
All dollar figures are in current U.S. dollars unless other-wise stated. The various methods used to convert fromnational currency figures are described in the Technicalnotes.
Because the World Bank’s primary business is providinglending and policy advice to its low- and middle-incomemembers, the issues covered in these tables focus mainly onthese economies. Where available, information on the high-income economies is also provided for comparison. Readersmay wish to refer to national statistical publications andpublications of the Organisation for Economic Co-opera-tion and Development (OECD) and the European Union formore information on the high-income economies.
Changes in the System of National AccountsThis edition of the Selected World Development Indicators,as in last year’s edition, uses terminology in line with the1993 System of National Accounts (SNA). For example, inthe 1993 SNA gross national income replaces gross nationalproduct. See the technical notes for tables 1 and 3.
Selected world development indicators
16_WDR_SWDI.qxd 8/24/04 3:26 PM Page 253

254 WORLD DEVELOPMENT REPORT 2005
Most countries continue to compile their nationalaccounts according to the 1968 SNA, but more and more areadopting the 1993 SNA. A few low-income countries still useconcepts from older SNA guidelines, including valuationssuch as factor cost, in describing major economic aggregates.
Classification of economies and summarymeasuresThe summary measures at the bottom of each table includeeconomies classified by income per capita and by region. GNIper capita is used to determine the following income classifi-cations: low-income, $765 or less in 2003; middle-income,$766 to $9,385; and high-income, $9,386 and above. A fur-ther division at GNI per capita $3,035 is made betweenlower-middle-income and upper-middle-income economies.See the table on classification of economies at the end of thisvolume for a list of economies in each group (includingthose with populations of less than 1.5 million).
Summary measures are either totals (indicated by t if theaggregates include estimates for missing data and nonre-porting countries, or by an s for simple sums of the dataavailable), weighted averages (w), or median values (m) cal-culated for groups of economies. Data for the countriesexcluded from the main tables (those presented in Table 1a)have been included in the summary measures, where dataare available, or by assuming that they follow the trend ofreporting countries. This gives a more consistent aggregatedmeasure by standardizing country coverage for each periodshown. Where missing information accounts for a third ormore of the overall estimate, however, the group measure isreported as not available. The section on Statistical methodsin the Technical notes provides further information on aggre-gation methods. Weights used to construct the aggregates arelisted in the technical notes for each table.
From time to time an economy’s classification is revisedbecause of changes in the above cutoff values or in the econ-omy’s measured level of GNI per capita. When such changesoccur, aggregates based on those classifications are recalcu-lated for the past period so that a consistent time series ismaintained.
Terminology and country coverageThe term country does not imply political independence butmay refer to any territory for which authorities report sepa-rate social or economic statistics. Data are shown foreconomies as they were constituted in 2003, and historicaldata are revised to reflect current political arrangements.Throughout the tables, exceptions are noted.
Technical notesBecause data quality and intercountry comparisons are oftenproblematic, readers are encouraged to consult the Technicalnotes, the table on Classification of Economies by Incomeand Region, and the footnotes to the tables. For more exten-sive documentation see World Development Indicators 2004.
Readers may find more information on the WDI 2004,and orders can be made online, by phone, or fax as follows:
For more information and to order online:http://www.worldbank.org/data/wdi2002/index.htm.
To order by phone or fax: 1-800-645-7247 or 703-661-1580;Fax 703-661-1501
To order by mail: The World Bank, P.O. Box 960, Herndon,VA 20172-0960, U.S.A.
16_WDR_SWDI.qxd 8/24/04 3:26 PM Page 254

Classification of economies by region and income, FY2005
East Asia and the Pacific Latin America and the Caribbean South Asia High income OECDAmerican Samoa UMC Antigua and Barbuda UMC Afghanistan LIC AustraliaCambodia LIC Argentina UMC Bangladesh LIC AustriaChina LMC Barbados UMC Bhutan LIC BelgiumFiji LMC Belize UMC India LIC CanadaIndonesia LMC Bolivia LMC Maldives LMC DenmarkKiribati LMC Brazil LMC Nepal LIC FinlandKorea, Dem. Rep. LIC Chile UMC Pakistan LIC FranceLao PDR LIC Colombia LMC Sri Lanka LMC GermanyMalaysia UMC Costa Rica UMC GreeceMarshall Islands LMC Cuba LMC Sub-Saharan Africa IcelandMicronesia, Fed. Sts. LMC Dominica UMC Angola LIC IrelandMongolia LIC Dominican Republic LMC Benin LIC ItalyMyanmar LIC Ecuador LMC Botswana UMC JapanNorthern Mariana Islands UMC El Salvador LMC Burkina Faso LIC Korea, Rep.Palau UMC Grenada UMC Burundi LIC LuxembourgPapua New Guinea LIC Guatemala LMC Cameroon LIC NetherlandsPhilippines LMC Guyana LMC Cape Verde LMC New ZealandSamoa LMC Haiti LIC Central African Republic LIC NorwaySolomon Islands LIC Honduras LMC Chad LIC PortugalThailand LMC Jamaica LMC Comoros LIC SpainTimor-Leste LIC Mexico UMC Congo, Dem. Rep. LIC SwedenTonga LMC Nicaragua LIC Congo, Rep. LIC SwitzerlandVanuatu LMC Panama UMC Côte d’Ivoire LIC United KingdomVietnam LIC Paraguay LMC Equatorial Guinea LIC United States
Peru LMC Eritrea LICEurope and Central Asia St. Kitts and Nevis UMC Ethiopia LIC Other high incomeAlbania LMC St. Lucia UMC Gabon UMC AndorraArmenia LMC St. Vincent and the Gambia, The LIC ArubaAzerbaijan LMC Grenadines UMC Ghana LIC Bahamas, TheBelarus LMC Suriname LMC Guinea LIC BahrainBosnia and Herzegovina LMC Trinidad and Tobago UMC Guinea-Bissau LIC BermudaBulgaria LMC Uruguay UMC Kenya LIC BruneiCroatia UMC Venezuela, RB UMC Lesotho LIC Cayman IslandsCzech Republic UMC Liberia LIC Channel IslandsEstonia UMC Middle East and North Africa Madagascar LIC CyprusGeorgia LMC Algeria LMC Malawi LIC Faeroe IslandsHungary UMC Djibouti LMC Mali LIC French PolynesiaKazakhstan LMC Egypt, Arab Rep. LMC Mauritania LIC GreenlandKyrgyz Republic LIC Iran, Islamic Rep. LMC Mauritius UMC GuamLatvia UMC Iraq LMC Mayotte UMC Hong Kong, ChinaLithuania UMC Jordan LMC Mozambique LIC Isle of ManMacedonia, FYR LMC Lebanon UMC Namibia LMC IsraelMoldova LIC Libya UMC Niger LIC KuwaitPoland UMC Morocco LMC Nigeria LIC LiechtensteinRomania LMC Oman UMC Rwanda LIC Macao, ChinaRussian Federation LMC Saudi Arabia UMC São Tomé and Principe LIC MaltaSerbia and Montenegro LMC Syrian Arab Republic LMC Senegal LIC MonacoSlovak Republic UMC Tunisia LMC Seychelles UMC Netherlands AntillesTajikistan LIC West Bank and Gaza LMC Sierra Leone LIC New CaledoniaTurkey LMC Yemen, Rep. LIC Somalia LIC Puerto RicoTurkmenistan LMC South Africa LMC QatarUkraine LMC Sudan LIC San MarinoUzbekistan LIC Swaziland LMC Singapore
Tanzania LIC SloveniaTogo LIC Taiwan, ChinaUganda LIC United Arab EmiratesZambia LIC Virgin Islands (U.S.)Zimbabwe LIC
This table classifies all World Bank member economies, and all other economies with populations of more than 30,000. Economies are divided among income groups according to 2003 GNI percapita, calculated using the World Bank Atlas method. The groups are: low income (LIC), $765 or less; lower middle income (LMC), $766–3,035; upper middle income (UMC), $3,036–9,385; andhigh income, $9,386 or more.Source: World Bank data.
255
16_WDR_SWDI.qxd 8/24/04 3:26 PM Page 255

256
Table 1. Key indicators of developmentPopulation Gross national PPP
income (GNI) a gross nationalincome (GNI) b
Millions Avg. Density Billions Per capita Billions Per capita Gross Life Under-5 Adult Carbon annual people per of dollars dollars of dollars dollars domestic expectancy mortality Literacy dioxide
% growth sq. km product at birth rate rate emissionsper capita Per % of people Millions% growth Years 1,000 15 and above of tons
2003 1990–2003 2003 2003 2003 2003 2003 2002–2003 2002 2002 2002 2000
Albania 3.2 –0.3 116 6 1,740 15 4,700 6.9 74 24 99 c 2.9Algeria 31.8 1.9 13 60 1,890 189 d 5,940 d 5.2 71 49 69 89.4Angola 13.5 2.8 11 10 740 26 d 1,890 d 1.4 47 260 .. 6.4Argentina 38.4 1.3 14 140 3,650 419 10,920 3.3 74 19 97 138.2Armenia 3.1 –1.1 108 3 950 12 3,770 11.9 75 35 99 c 3.5Australia 19.9 1.2 3 431 21,650 563 28,290 1.2 79 6 .. 344.8Austria 8.1 0.3 97 215 26,720 239 29,610 0.6 79 5 .. 60.8Azerbaijan 8.2 1.1 95 7 810 28 3,380 10.5 65 96 .. 29.0Bangladesh 138.1 1.7 1,061 55 400 258 1,870 3.5 62 73 41 29.3Belarus 9.9 –0.2 48 16 1,590 59 6,010 6.1 68 20 100 59.2Belgium 10.3 0.3 342 267 25,820 299 28,930 1.0 79 6 .. 102.2Benin 6.7 2.7 61 3 440 7 1,110 2.9 53 151 40 1.6Bolivia 9.0 2.4 8 8 890 22 2,450 –0.8 64 71 87 c 11.1Bosnia & Herzegovina 4.1 –0.6 82 6 1,540 26 6,320 3.0 74 18 95 19.3Botswana 1.7 2.3 3 6 3,430 14 7,960 4.0 38 110 79 3.9Brazil 176.6 1.4 21 479 2,710 1,322 7,480 –1.4 69 37 86 c 307.5Bulgaria 7.8 –0.8 71 17 2,130 60 7,610 4.9 72 16 99 42.3Burkina Faso 12.1 2.4 44 4 300 14 d 1,180 d 4.1 43 207 .. 1.0Burundi 7.2 2.1 281 1 100 4 d 620 d –2.9 42 208 50 0.2Cambodia 13.4 2.9 76 4 310 28 d 2,060 d 5.8 54 138 69 0.5Cameroon 16.1 2.5 35 10 640 32 1,980 0.5 48 166 68 e 6.5Canada 31.6 1.0 3 757 23,930 941 29,740 0.9 79 7 .. 435.9Central African Rep. 3.9 2.1 6 1 260 4 d 1,080 d –8.8 42 180 49 e 0.3Chad 8.6 3.0 7 2 250 9 1,100 4.3 48 200 46 0.1 Chile 15.8 1.4 21 69 4,390 155 9,810 2.0 76 12 96 c 59.5China 1,288.4 1.0 138 1,417 1,100 6,435 f 4,990 f 8.4 71 38 91 c 2,790.5
Hong Kong, China 6.8 1.4 .. 173 25,430 196 28,810 2.9 80 .. .. 33.1Colombia 44.4 1.8 43 80 1,810 290 d 6,520 d 2.0 72 23 92 58.5Congo, Dem. Rep. 53.2 2.7 23 5 100 34 d 640 d 1.9 45 205 .. 2.7Congo, Rep. 3.8 3.2 11 2 640 3 710 –1.7 52 108 83 1.8Costa Rica 4.0 2.1 78 17 4,280 36 d 9,040 d 3.9 78 11 96 5.4Côte d’Ivoire 16.8 2.7 53 11 660 23 1,390 –5.6 45 191 .. 10.5 Croatia 4.5 –0.5 80 2 5,350 48 10,710 4.0 74 8 98 c 19.6Czech Rep. 10.2 –0.1 132 69 6,740 160 15,650 2.9 75 5 .. 118.8Denmark 5.4 0.4 127 182 33,750 168 31,213 0.2 77 4 .. 44.6Dominican Rep. 8.7 1.6 181 18 2,070 54 d 6,210 d –2.2 67 38 84 25.1Ecuador 13.0 1.8 47 23 1,790 45 3,440 0.9 70 29 91 c 25.5Egypt, Arab Rep. 67.6 1.9 68 94 1,390 266 3,940 1.4 69 39 .. 142.2El Salvador 6.5 1.9 315 14 2,200 32 d 4,890 d 1.8 70 39 80 6.7Eritrea 4.4 2.6 43 1 190 5 d 1,110 d 2.8 51 80 .. 0.6Estonia 1.4 –1.2 32 7 4,960 17 12,480 5.3 71 12 100 c 16.0Ethiopia 68.6 2.3 69 6 90 49 d 710 d –5.7 42 171 42 5.6Finland 5.2 0.3 17 141 27,020 141 27,100 1.7 78 5 .. 53.4France 59.7 0.4 109 1,523 g 24,770 g 1,640 27,460 –0.3 79 6 .. 362.4Georgia 5.1 –0.5 74 4 830 13 d 2,540 d 9.4 73 29 .. 6.2Germany 82.6 0.3 237 2,085 25,250 2,267 27,460 –0.1 78 5 .. 785.5Ghana 20.4 2.2 90 7 320 45 d 2,190 d 2.5 55 97 74 5.9Greece 10.7 0.4 83 147 13,720 213 19,920 4.2 78 5 97 89.6Guatemala 12.3 2.6 114 23 1,910 50 d 4,060 d –0.5 65 49 70 9.9Guinea 7.9 2.4 32 3 430 17 2,100 0.0 46 165 .. 1.3Haiti 8.4 2.0 306 3 380 14 d 1,630 d –1.8 52 123 52 1.4Honduras 7.0 2.8 62 7 970 18 d 2,580 d –0.5 66 42 80 c 4.8Hungary 10.1 –0.2 110 64 6,330 139 13,780 0.7 72 9 99 54.2India 1,064.4 1.7 358 568 530 3,068 d 2,880 d 6.4 63 90 61 c 1,070.9Indonesia 214.5 1.4 118 173 810 689 3,210 2.8 67 43 88 269.6Iran, Islamic Rep. 66.4 1.5 41 133 2,000 477 7,190 4.4 69 41 77 e 310.3Ireland 3.9 0.9 57 106 26,960 120 30,450 1.1 77 6 .. 42.2Israel 6.7 2.8 324 105 16,020 128 19,200 –0.8 79 6 95 63.1Italy 57.6 0.1 196 1,243 21,560 1,543 26,760 0.4 78 6 99 428.2Jamaica 2.6 0.8 244 7 2,760 10 3,790 1.1 76 20 88 10.8Japan 127.2 0.2 349 4,390 34,510 3,641 28,620 2.7 82 5 .. 1,184.5Jordan 5.3 4.0 60 10 1,850 23 4,290 0.5 72 33 91 15.6Kazakhstan 14.9 –0.7 6 27 1,780 92 6,170 8.7 62 99 99 121.3Kenya 31.9 2.4 56 13 390 33 1,020 –0.7 46 122 84 9.4Korea, Rep. 47.9 0.9 485 576 12,020 859 17,930 2.4 74 5 .. 427.0Kuwait 2.4 0.9 134 38 16,340 42 d 17,870 d –3.3 77 10 83 47.9Kyrgyz Rep. 5.1 1.0 26 2 330 8 1,660 3.9 65 61 .. 4.6Lao PDR 5.7 2.4 25 2 320 10 1,730 2.6 55 100 66 0.4Latvia 2.3 –1.1 37 9 4,070 24 10,130 8.1 70 21 100 c 6.0Lebanon 4.5 1.6 440 18 4,040 22 4,840 1.4 71 32 .. 15.2Lesotho 1.8 1.0 59 1 590 6 d 3,120 d 20.9 38 132 81 e ..Lithuania 3.5 –0.5 53 16 4,490 38 11,090 7.0 73 9 100 c 11.9Macedonia, FYR 2.0 0.6 81 4 1,980 14 6,720 2.5 73 26 .. 11.2Madagascar 16.9 2.9 29 5 290 13 800 6.5 55 135 .. 2.3Malawi 11.0 2.0 117 2 170 7 600 3.8 38 182 62 0.8
Note: For data comparability and coverage, see the technical notes. Figures in italics are for years other than those specified.
16_WDR_SWDI.qxd 8/24/04 3:26 PM Page 256

257
Table 1. Key indicators of development—continuedPopulation Gross national PPP
income (GNI) a gross nationalincome (GNI) b
Millions Avg. density Billions per capita Billions per capita Gross Life Under-5 Adult Carbon annual people per of dollars dollars of dollars dollars domestic expectancy mortality Literacy dioxide
% growth sq. km product at birth rate rate emissionsper capita Per % of people Millions% growth Years 1,000 15 and above of tons
2003 1990–2003 2003 2003 2003 2003 2003 2002–2003 2002 2002 2002 2000
Malaysia 24.8 2.4 75 94 3,780 222 8,940 3.2 73 8 89 c 144.4 Mali 11.7 2.5 10 3 290 11 960 3.5 41 222 19 c 0.6Mauritania 2.7 2.2 3 1 430 5 d 2,010 d 2.9 51 183 41 3.1Mexico 102.3 1.6 54 637 6,230 915 8,950 –0.1 74 29 91 c 424.0Moldova 4.2 –0.2 129 2 590 7 1,750 6.5 67 32 99 6.6Mongolia 2.5 1.3 2 1 480 4 1,800 3.4 65 71 98 c 7.5Morocco 30.1 1.7 67 40 1,320 119 d 3,950 d 3.8 68 43 51 36.5Mozambique 18.8 2.2 24 4 210 20 d 1,070 d 5.0 41 205 46 1.2Myanmar 49.4 1.5 75 .. .. h .. .. .. 57 108 85 9.1Namibia 2.0 2.8 2 4 1,870 13 6,620 –6.7 42 67 83 1.8Nepal 24.7 2.4 172 6 240 35 1,420 0.7 60 83 44 3.4Netherlands 16.2 0.6 479 427 26,310 464 28,600 –0.9 78 5 .. 138.9New Zealand 4.0 1.2 15 64 15,870 85 21,120 0.9 78 6 .. 32.1Nicaragua 5.5 2.8 45 4 730 13 d 2,400 d –0.2 69 41 77 e 3.7Niger 11.8 3.3 9 2 200 10 d 820 d 1.0 46 264 17 1.2Nigeria 135.6 2.6 149 43 320 122 900 8.3 45 201 67 36.1Norway 4.6 0.6 15 198 43,350 170 37,300 –0.2 79 4 .. 49.9Pakistan 148.4 2.4 193 69 470 306 2,060 3.3 64 101 .. 104.8Panama 3.0 1.7 40 13 4,250 19 d 6,310 d 2.3 75 25 92 6.3Papua New Guinea 5.5 2.5 12 3 510 12 d 2,240 d 0.2 57 94 .. 2.4Paraguay 5.6 2.4 14 6 1,100 27 d 4,740 d –0.3 71 30 92 e 3.7Peru 27.1 1.8 21 58 2,150 138 5,090 2.4 70 39 85 e 29.5Philippines 81.5 2.2 273 88 1,080 379 4,640 2.5 70 37 93 c 77.5Poland 38.2 0.0 125 201 5,270 437 11,450 4.9 74 9 .. 301.3Portugal 10.2 0.2 111 124 12,130 183 17,980 –0.9 76 6 93 59.8Romania 22.2 –0.3 96 51 2,310 159 7,140 5.6 70 21 97 c 86.3Russian Federation 143.4 –0.3 8 375 2,610 1,279 8,920 7.8 66 21 100 1,435.1Rwanda 8.3 1.3 334 2 220 11 d 1,290 d 2.1 40 203 69 0.6Saudi Arabia 22.5 2.7 10 187 8,530 281 d 12,850 d –1.8 73 28 78 374.3Senegal 10.0 2.4 52 6 550 17 d 1,660 d 6.0 52 138 39 4.2Serbia & Montenegro 8.1 .. 79 16 i 1,910 i .. .. 5.5 73 19 .. 39.5Sierra Leone 5.3 2.2 75 1 150 3 530 4.5 37 284 .. 0.6Singapore 4.3 2.6 6,967 90 21,230 103 24,180 –1.0 78 4 93 c 59.0Slovak Republic 5.4 0.1 110 26 4,920 72 13,420 4.8 73 9 100 c 35.4Slovenia 2.0 –0.1 98 23 11,830 38 19,240 3.5 76 5 100 14.6South Africa 45.3 1.9 37 126 2,780 465 d 10,270 d –2.0 46 65 86 327.3Spain 41.1 0.4 82 698 16,990 905 22,020 1.9 78 6 98 282.9Sri Lanka 19.2 1.3 297 18 930 72 3,730 4.3 74 19 92 10.2Sweden 9.0 0.3 22 258 28,840 238 26,620 1.2 80 3 .. 46.9Switzerland 7.3 0.7 186 293 39,880 235 32,030 –1.2 80 6 .. 39.1Syrian Arab Rep. 17.4 2.8 95 20 1,160 60 3,430 0.0 70 28 83 54.2Tajikistan 6.3 1.3 45 1 190 7 1,040 7.8 67 116 99 c 4.0Tanzania 35.9 2.6 41 10 j 290 j 22 610 3.5 43 165 77 4.3Thailand 62.0 0.8 121 136 2,190 462 7,450 6.1 69 28 93 c 198.6Togo 4.9 2.6 89 1 310 7 d 1,500 d 0.9 50 140 60 1.8Tunisia 9.9 1.5 64 22 2,240 68 6,840 4.4 73 26 73 18.4Turkey 70.7 1.8 92 197 2,790 473 6,690 4.2 70 41 87 c 221.6Turkmenistan 4.9 2.2 10 5 1,120 28 5,840 15.3 65 86 .. 34.6Uganda 25.3 2.9 128 6 240 36 d 1,440 d 0.8 43 141 69 1.5Ukraine 48.4 –0.5 83 47 970 262 5,410 10.2 68 20 100 342.8United Kingdom 59.3 0.2 246 1,680 28,350 1,639 27,650 2.1 77 7 .. 567.8United States 291.0 1.2 32 10,946 37,610 10,914 37,500 2.0 77 8 .. 5,601.5Uruguay 3.4 0.7 19 13 3,790 27 7,980 1.9 75 15 98 5.4Uzbekistan 25.6 1.7 62 11 420 44 1,720 3.0 67 65 99 118.6 Venezuela, RB 25.5 2.1 29 89 3,490 121 4,740 –10.9 74 22 93 157.7Vietnam 81.3 1.6 250 39 480 202 2,490 6.1 70 26 .. 57.5Yemen, Rep. 19.2 3.7 36 10 520 16 820 0.7 57 114 49 8.4Zambia 10.4 2.2 14 4 380 9 850 3.5 37 182 80 1.8Zimbabwe 13.1 1.9 34 6 480 28 2,180 –6.7 39 123 90 14.8World 6,271.7 s 1.4 w 48 w 34,491 t 5,500 w 51,314 t 8,180 t 1.4 w 67 w 81 w 79 w 22,994.5 tLow income 2,310.3 2.0 76 1,038 450 5,052 2,190 4.9 58 126 61 2,066.7Middle income 2,990.1 1.1 43 5,732 1,920 17,933 6,000 3.9 70 38 90 9,129.1
Lower middle income 2,655.2 1.1 47 3,934 1,480 14,617 5,510 4.5 69 40 90 7,116.3Upper middle income 334.9 1.3 26 1,788 5,340 3,317 9,900 1.7 73 22 91 2,012.0
Low & middle income 5,300.3 1.5 53 6,762 1,280 22,894 4,320 3.8 65 88 78 11,196.2East Asia & Pacific 1,854.5 1.2 117 2,011 1,080 8,675 4,680 6.8 69 42 90 3,752.3Europe & Cen. Asia 472.7 0.1 20 1,217 2,570 3,579 7,570 6.0 69 37 97 3,162.6Latin Am. & Carib. 534.2 1.6 27 1,741 3,260 3,780 7,080 –0.1 71 34 89 1,357.4Mid. East & N. Africa 311.6 2.1 28 689 2,250 1,743 5,700 1.2 69 54 69 1,227.2South Asia 1,424.7 1.8 298 726 510 3,795 2,660 5.7 63 95 59 1,220.3Sub-Saharan Africa 702.6 2.5 30 347 490 1,243 1,770 1.3 46 174 65 478.8
High income 971.4 0.7 31 27,732 28,550 28,603 29,450 1.4 78 7 .. 11,804.3
a. Preliminary World Bank estimates calculated using the World Bank Atlas method. b. Purchasing power parity; see the Technical Notes. c. National estimates based on census data. d.Theestimate is based on regression; others are extrapolated from the latest International Comparison Programme benchmark estimates. e. National estimates based on survey data. f. Estimatesbased on bilateral comparison between China and the United States (Ruoen and Kai, 1995). g.GNI and GNI per capita estimates include the French Overseas departments of French Guiana,Guadeloupe, Martinique, and Réunion. h. Estimated to be low income ($765 or less). i. Data for Kosovo is excluded. j. Data refer to mainland Tanzania only.
16_WDR_SWDI.qxd 8/24/04 3:26 PM Page 257

258
Table 2. Poverty and income distributionNational poverty lines International poverty line
Population below the poverty line (%)
Percentageshare of
Population Poverty Population Poverty income orbelow gap at below gap at consumption
Survey Survey $1 a day $1 a day $2 a day $2 a day Survey Gini Lowest Highest Economy year Rural Urban National year % % % % year index 20% 20%
Albania 2002 29.6 .. 25.4 2002 a <2.0 <0.5 11.8 2.0 2002 c,d 28.2 9.1 37.4Algeria 1998 16.6 7.3 12.2 1995 a <2.0 <0.5 15.1 3.8 1995 c,d 35.3 7.0 42.6Angola .. .. .. .. .. .. .. .. .. ..Argentina 1998 .. 29.9 .. 2001 b 3.3 0.5 14.3 4.7 2001 e,f 52.2 3.1 56.4Armenia 1998–99 44.8 60.4 53.7 1998 a 12.8 3.3 49.0 17.3 1998 c,d 37.9 6.7 45.1Australia .. .. .. .. .. .. .. 1994 e,f 35.2 5.9 41.3 Austria .. .. .. .. .. .. .. 1997 e,f 30.0 8.1 38.5Azerbaijan 2001 .. .. 49.6 2001 a 3.7 <1.0 9.1 3.5 2001 c,d 36.5 7.4 44.5Bangladesh 2000 53.0 36.6 49.8 2000 a 36.0 8.1 82.8 36.3 2000 c,d 31.8 9.0 41.3Belarus 2000 .. .. 41.9 2000 a <2.0 <0.5 <2.0 0.1 2000 c,d 30.4 8.4 39.1Belgium .. .. .. .. .. .. .. 1996 e,f 25.0 8.3 37.3Benin 1995 .. .. 33.0 .. .. .. .. .. .. ..Bolivia 1999 81.7 .. 62.7 1999 a 14.4 5.4 34.3 14.9 1999 c,d 44.7 4.0 49.1Bosnia & Herzegovina 2001–02 19.9 13.8 19.5 .. .. .. .. 2001 c,d 26.2 9.5 35.8Botswana .. .. .. 1993 a 23.5 7.7 50.1 22.8 1993 c,d 63.0 2.2 70.3Brazil 1990 32.6 13.1 17.4 2001 b 8.2 2.1 22.4 8.8 1998 e,f 59.1 2.0 64.4Bulgaria 2001 .. .. 12.8 2001 a 4.7 1.4 16.2 5.7 2001 e,f 31.9 6.7 38.9Burkina Faso 1998 51.0 16.5 45.3 1998 a 44.9 14.4 81.0 40.6 1998 c,d 48.2 4.5 60.7Burundi 1990 36.0 43.0 .. 1998 a 58.4 24.9 89.2 51.3 1998 c,d 33.3 5.1 48.0Cambodia 1997 40.1 21.1 36.1 1997 a 34.1 9.7 77.7 34.5 1997 c,d 40.4 6.9 47.6Cameroon 2001 49.9 22.1 40.2 2001 a 17.1 4.1 50.6 19.3 2001 c,d 44.6 5.6 50.9Canada .. .. .. .. .. .. .. 1998 e,f 33.1 7.0 40.4Central African Rep. .. .. .. 1993 a 66.6 38.1 84.0 58.4 1993 c,d 61.3 2.0 65.0Chad 1995–96 67.0 63.0 64.0 .. .. .. .. .. .. ..Chile 1998 .. .. 17.0 2000 b <2.0 <0.5 9.6 2.5 2000 e,f 57.1 3.3 62.2China 1998 4.6 <2.0 4.6 2001 a 16.6 3.9 46.7 18.4 2001 c,d 44.7 4.7 50.0
Hong Kong, China .. .. .. .. .. .. .. 1996 e,f 43.4 5.3 50.7Colombia 1999 79.0 55.0 64.0 1999 b 8.2 2.2 22.6 8.8 1999 e,f 57.6 2.7 61.8Congo, Dem. Rep. .. .. .. .. .. .. .. .. .. ..Congo, Rep. .. .. .. .. .. .. .. .. .. ..Costa Rica 1992 25.5 19.2 22.0 2000 b 2.0 0.7 9.5 3.0 2000 e,f 46.5 4.2 51.5Côte d’Ivoire .. .. .. 1998 a 15.5 3.8 50.4 18.9 1998 c,d 45.2 5.5 51.1Croatia .. .. .. 2000 a <2.0 <0.5 <2.0 <0.5 2001 c,d 29.0 8.3 39.6Czech Rep. .. .. .. 1996 b <2.0 <0.5 <2.0 <0.5 1996 e,f 25.4 10.3 35.9Denmark .. .. .. .. .. .. .. 1997 e,f 24.7 8.3 35.8Dominican Rep. 1998 42.1 20.5 28.6 1998 b <2.0 <0.5 <2.0 <0.5 1998 e,f 47.4 5.1 53.3Ecuador 1994 47.0 25.0 35.0 1998 b 17.7 7.1 40.8 17.7 1998 c,d 43.7 3.3 58.0Egypt, Arab Rep. 1999–00 23.3 22.5 16.7 2000 a 3.1 <0.5 43.9 11.3 1999 c,d 34.4 8.6 43.6El Salvador 1992 55.7 43.1 48.3 2000 b 31.1 14.1 58.0 29.7 2000 e,f 53.2 2.9 57.1Eritrea 1993–94 .. .. 53.0 .. .. .. .. .. .. ..Estonia 1995 14.7 6.8 8.9 1998 a <2.0 <0.5 5.2 0.8 2000 e,f 37.2 6.1 44.0Ethiopia 1999–00 45.0 37.0 44.2 1999–00 a 26.3 5.7 80.7 31.8 2000 c,d 30.0 9.1 39.4Finland .. .. .. .. .. .. .. 2000 e,f 26.9 9.6 36.7France .. .. .. .. .. .. .. 1995 e,f 32.7 7.2 40.2Georgia 1997 9.9 12.1 11.1 2001 a 2.7 0.9 15.7 4.6 2001 c,d 36.9 6.4 43.6Germany .. .. .. .. .. .. .. 2000 e,f 28.3 8.5 36.9Ghana 1998 49.9 18.6 39.5 1999 a 44.8 17.3 78.5 40.8 1999 c,d 30.0 5.6 46.6Greece .. .. .. .. .. .. .. 1998 e,f 35.4 7.1 43.6Guatemala 2000 74.5 27.1 56.2 2000 b 16.0 4.6 37.4 16.0 2000 e,f 48.3 2.6 64.1Guinea 1994 .. .. 40.0 .. .. .. .. 1994 c,d 40.3 6.4 47.2Haiti 1995 66.0 .. 65.0 .. .. .. .. .. .. ..Honduras 1993 51.0 57.0 53.0 1998 b 23.8 11.6 44.4 23.1 1999 e,f 55.0 2.7 58.9Hungary 1997 .. .. 17.3 1998 b <2.0 <0.5 7.3 1.7 1999 c,d 24.4 7.7 37.5India 1999–00 30.2 24.7 28.6 1999–00 a 34.7 8.2 79.9 35.3 1999–00 c,d 32.5 8.9 41.6Indonesia 1999 .. .. 27.1 2002 a 7.5 0.9 52.4 15.7 2002 c,d 34.3 8.4 43.3Iran, Islamic Rep. .. .. .. 1998 a <2.0 <0.5 7.3 1.5 1998 c,d 43.0 5.1 49.9Ireland .. .. .. .. .. .. .. 1996 e,f 35.9 7.1 43.3Israel .. .. .. .. .. .. .. 1997 e,f 35.5 6.9 44.3Italy .. .. .. .. .. .. .. 2000 e,f 36.0 6.5 42.0Jamaica 2000 25.1 .. 18.7 2000 a <2.0 <0.5 13.3 2.7 2000 c,d 37.9 6.7 46.0Japan .. .. .. .. .. .. .. 1993 e,f 24.9 10.6 35.7Jordan 1997 .. .. 11.7 1997 a <2.0 <0.5 7.4 1.4 1997 c,d 36.4 7.6 44.4Kazakhstan 1996 39.0 30.0 34.6 2001 a <2.0 <0.5 8.5 1.4 2001 c,d 31.3 8.2 39.6Kenya 1997 53.0 49.0 52.0 1997 a 23.0 6.0 58.6 24.1 1997 c,d 44.5 5.6 51.2Korea, Rep. .. .. .. 1998 b <2.0 <0.5 <2.0 <0.5 1998 e,f 31.6 7.9 37.5Kuwait .. .. .. .. .. .. .. .. .. ..Kyrgyz Rep. 1999 69.7 49.0 64.1 2001 a <2.0 <0.5 27.2 5.9 2001 c,d 29.0 9.1 38.3Lao PDR 1997–98 41.0 26.9 38.6 1997–98 a 26.3 6.3 73.2 29.6 1997 c,d 37.0 7.6 45.0Latvia .. .. .. 1998 a <2.0 <0.5 8.3 2.0 1998 e,f 32.4 7.6 40.3Lebanon .. .. .. .. .. .. .. .. .. ..Lesotho .. .. .. 1995 a 36.4 19.0 56.1 33.1 1995 c,d 63.2 1.5 66.5Lithuania .. .. .. 2000 a <2.0 <0.5 13.7 4.2 2000 c,d 31.9 7.9 40.0Macedonia, FYR .. .. .. 1998 a <2.0 <0.5 4.0 0.6 1998 c,d 28.2 8.4 36.7Madagascar 1999 76.7 52.1 71.3 1999 a 49.1 18.3 83.3 44.0 2001 c,d 47.5 4.9 53.5Malawi 1997–98 66.5 54.9 65.3 1997–98 a 41.7 14.8 76.1 38.3 1997 c,d 50.3 4.9 56.1
Note: For data comparability and coverage, see the technical notes. Figures in italics are for years other than those specified.
16_WDR_SWDI.qxd 8/24/04 3:26 PM Page 258

259
Table 2. Poverty and income distribution—continuedNational poverty lines International poverty line
Population below the poverty line (%)
Percentageshare of
Population Poverty Population Poverty income orbelow gap at below gap at consumption
Survey Survey $1 a day $1 a day $2 a day $2 a day Survey Gini Lowest Highest Economy year Rural Urban National year % % % % year index 20% 20%
Malaysia 1989 .. .. 15.5 1997 b <2.0 <0.5 9.3 2.0 1997 e,f 49.2 4.4 54.3Mali 1998 75.9 30.1 63.8 1994 a 72.8 37.4 90.6 60.5 1994 c,d 50.5 4.6 56.2 Mauritania 2000 61.2 25.4 46.3 2000 a 25.9 7.6 63.1 26.8 2000 c,d 39.0 6.2 45.7Mexico 1988 .. .. 10.1 2000 b 9.9 3.7 26.3 10.9 2000 e,f 54.6 3.1 59.1Moldova 1997 26.7 .. 23.3 2001 a 22.0 5.8 63.7 25.1 2001 c,d 36.2 7.1 43.7Mongolia 1995 33.1 38.5 36.3 1995 a 13.9 3.1 50.0 17.5 1998 c,d 44.0 5.6 51.2Morocco 1998–99 27.2 12.0 19.0 1999 a <2.0 <0.5 14.3 3.1 1998–99 c,d 39.5 6.5 46.6 Mozambique 1996–97 71.3 62.0 69.4 1996 a 37.9 12.0 78.4 36.8 1996–97 c,d 39.6 6.5 46.5Myanmar .. .. .. .. .. .. .. .. .. ..Namibia .. .. .. 1993 b 34.9 14.0 55.8 30.4 1993 e,f 70.7 1.4 78.7 Nepal 1995–96 44.0 23.0 42.0 1995 a 37.7 9.7 82.5 37.5 1995–96 c,d 36.7 7.6 44.8Netherlands .. .. .. .. .. .. .. 1994 e,f 32.6 7.3 40.1 New Zealand .. .. .. .. .. .. .. 1997 e,f 36.2 6.4 43.8Nicaragua 1998 68.5 30.5 47.9 2001 a 45.1 16.7 79.9 41.2 2001 e,f 55.1 3.6 59.7Niger 1989–93 66.0 52.0 63.0 1995 a 61.4 33.9 85.3 54.8 1995 c,d 50.5 2.6 53.3Nigeria 1992–93 36.4 30.4 34.1 1997 a 70.2 34.9 90.8 59.0 1996–97 c,d 50.6 4.4 55.7 Norway .. ... .. .. .. .. .. 2000 e,f 25.8 9.6 37.2Pakistan 1998–99 35.9 24.2 32.6 1998 a 13.4 2.4 65.6 22.0 1998–99 c,d 33.0 8.8 42.3Panama 1997 64.9 15.3 37.3 2000 b 7.2 2.3 17.6 7.4 2000 e,f 56.4 2.4 60.3Papua New Guinea 1996 41.3 16.1 37.5 .. .. .. .. 1996 c,d 50.9 4.5 56.5Paraguay 1991 28.5 19.7 21.8 1999 b 14.9 6.8 30.3 14.7 1999 e,f 56.8 2.2 60.2Peru 1997 64.7 40.4 49.0 2000 b 18.1 9.1 37.7 18.5 2000 e,f 49.8 2.9 53.2Philippines 1997 50.7 21.5 36.8 2000 a 14.6 2.7 46.4 17.2 2000 c,d 46.1 5.4 52.3Poland 1993 .. .. 23.8 1999 b <2.0 <0.5 <2.0 <0.5 1999 c,d 31.6 7.3 42.5Portugal .. .. .. 1994 b <2.0 <0.5 <0.5 <0.5 1997 e,f 38.5 5.8 45.9Romania 1994 27.9 20.4 21.5 2000 a 2.1 0.6 20.5 5.2 2000 c,d 30.3 8.2 38.4Russian Federation 1994 .. .. 30.9 2000 a 6.1 1.2 23.8 8.0 2000 c,d 45.6 4.9 51.3Rwanda 1993 .. .. 51.2 1983–85 a 35.7 7.7 84.6 36.7 1983–85 c,d 28.9 9.7 39.1Saudi Arabia .. .. .. .. .. .. .. .. .. ..Senegal 1992 40.4 .. 33.4 1995 a 26.3 7.0 67.8 28.2 1995 c,d 41.3 6.4 48.2Serbia & Montenegro .. .. .. .. .. .. .. .. .. ..Sierra Leone 1989 76.0 53.0 68.0 1989 a 57.0 39.5 74.5 51.8 1989 c,d 62.9 1.1 63.4Singapore .. .. .. .. .. .. .. 1998 e,f 42.5 5.0 49.0Slovak Republic .. .. .. 1996 b <2.0 <0.5 2.4 0.7 1996 e,f 25.8 8.8 34.8Slovenia .. .. .. 1998 a <2.0 <0.5 <2.0 <0.5 1998–99 e,f 28.4 9.1 35.7South Africa .. .. .. 1995 a 7.1 1.1 23.8 8.6 1995 c,d 59.3 2.0 66.5Spain .. .. .. .. .. .. .. 1990 e,f 32.5 7.5 40.3Sri Lanka 1995–96 27.0 15.0 25.0 1995–96 a 6.6 1.0 45.4 13.5 1995 c,d 34.4 8.0 42.8Sweden .. .. .. .. .. .. .. 2000 e,f 25.0 9.1 36.6Switzerland .. .. .. .. .. .. .. 1992 e,f 33.1 6.9 40.3Syrian Arab Rep. .. .. .. .. .. .. .. .. .. ..Tajikistan .. .. .. 1998 a 10.3 2.6 50.8 16.3 1998 c,d 34.7 8.0 40.0Tanzania 2000–01 38.7 .. 35.7 1993 a 19.9 4.8 59.7 23.0 1993 c,d 38.2 6.8 45.5Thailand 1992 15.5 10.2 13.1 2000 a <2.0 <0.5 32.5 9.0 2000 c,d 43.2 6.1 50.0Togo 1987–89 .. .. 32.3 .. .. .. .. .. .. ..Tunisia 1995 13.9 3.6 7.6 2000 a <2.0 <0.5 6.6 1.3 2000 c,d 39.8 6.0 47.3Turkey .. .. .. 2000 a <2.0 <0.5 10.3 2.5 2000 c,d 40.0 6.1 46.7Turkmenistan .. .. .. 1998 a 12.1 2.6 44.0 15.4 1998 c,d 40.8 6.1 47.5Uganda 1997 .. .. 44.0 .. .. .. .. 1999 c,d 43.0 5.9 49.7Ukraine 1995 .. .. 31.7 1999 b 2.9 0.6 45.7 16.3 1999 c,d 29.0 8.8 37.8United Kingdom .. .. .. .. .. .. .. 1999 e,f 36.0 6.1 44.0United States .. .. .. .. .. .. .. 2000 e,f 40.8 5.4 45.8Uruguay .. .. .. 2000 b <2.0 <0.5 3.9 0.8 2000 e,f 44.6 4.8 50.1Uzbekistan 2000 30.5 22.5 27.5 2000 a 21.8 5.4 77.5 28.9 2000 c,d 26.8 9.2 36.3Venezuela, RB 1989 .. .. 31.3 1998 b 15.0 6.9 32.0 15.2 1998 e,f 49.1 3.0 53.4Vietnam 1993 57.2 25.9 50.9 1998 a 17.7 3.3 63.7 22.9 1998 c,d 36.1 8.0 44.5Yemen, Rep. 1998 45.0 30.8 41.8 1998 a 15.7 4.5 45.2 15.0 1998 c,d 33.4 7.4 41.2Zambia 1998 83.1 56.0 72.9 1998 a 63.7 32.7 87.4 55.4 1998 c,d 52.6 3.3 56.6Zimbabwe 1995–96 48.0 7.9 34.9 1990–91 a 36.0 9.6 64.2 29.4 1995 c,d 56.8 4.6 55.7
a. Based on expenditure. b. Based on income. c. Refers to expenditure shares by percentiles of population. d. Ranked by per capita expenditure. e. Refers to income shares by percentiles ofpopulation. f. Ranked by per capita income.
16_WDR_SWDI.qxd 8/24/04 3:26 PM Page 259

260
Table 3. Economic activityValue added as % of GDP
Agricultural productivityAgr. Value added per
Gross domestic agricultural workerproduct 1995 dollars Agricultural Industry Services
External GDPHousehold General gov’t. Gross balance of implicit
Avg. final cons. final cons. capital goods and deflatorMillions annual expenditure expenditure formation services Avg. annual
of dollars % growth % of GDP % of GDP % of GDP % of GDP % growth2003 1990–2003 1988–90 2000–2002 2003 2003 2003 2003 2003 2003 2003 1990–2003
Albania 6,124 4.6 1,137 1,868 25 19 56 93 8 23 –24 26.9Algeria 65,993 2.4 1,781 1,919 11 65 24 45 8 32 14 14.7Angola 13,189 3.2 218 137 9 65 27 63 .. a 32 5 518.4Argentina 129,735 2.3 7,282 10,317 11 35 54 63 11 15 11 4.9Armenia 2,797 1.5 .. 2,827 24 38 38 85 10 20 –15 119.9Australia 518,382 3.8 24,500 36,327 4 26 71 60 18 24 –3 1.9Austria 251,456 2.1 15,593 33,828 2 32 66 58 19 22 1 1.7Azerbaijan 7,124 2.4 .. 1,029 16 54 29 60 10 52 –23 65.6Bangladesh 51,897 4.9 244 318 22 27 52 77 5 23 –6 3.8Belarus 17,493 0.6 .. 3,038 10 37 53 60 21 22 –3 252.3Belgium 302,217 2.1 30,479 57,462 1 27 72 55 21 19 4 1.8Benin 3,499 5.0 397 621 36 14 50 80 13 19 –12 7.0Bolivia 8,024 3.5 681 754 15 33 52 77 15 11 –3 7.1Bosnia & Herzegovina 6,963 17.8 .. 7,634 17 35 49 88 25 19 –32 3.5Botswana 7,388 4.7 777 575 2 48 50 28 32 25 14 9.0Brazil 492,338 2.6 2,982 4,899 6 21 73 58 20 20 2 118.9Bulgaria 19,859 –0.2 3,409 8,282 12 27 61 69 17 21 –8 75.1Burkina Faso 4,182 4.2 148 185 31 19 50 83 13 19 –15 4.7Burundi 669 –1.5 176 151 49 19 32 93 8 10 –10 12.8Cambodia 4,299 6.6 .. 422 36 28 36 80 6 22 –8 3.4Cameroon 12,449 2.7 837 1,213 45 19 37 71 12 17 –1 4.4Canada 834,390 3.2 29,425 43,064 .. .. .. 56 19 20 5 1.5Central African Rep. 1,198 1.8 383 502 61 25 14 75 13 18 –6 3.9Chad 2,648 3.0 171 211 38 17 46 81 7 45 –33 6.7Chile 72,416 5.6 4,854 6,226 9 34 57 63 11 22 3 7.0China 1,409,852 9.5 227 338 15 53 32 44 13 42 1 4.9
Hong Kong, China 158,596 3.7 .. .. 0 12 88 57 11 23 9 1.8Colombia 77,559 2.3 3,889 3,619 14 31 55 71 14 16 –2 17.8Congo, Dem. Rep. 5,600 –3.9 250 212 58 19 23 92 4 7 –3 617.0Congo, Rep. 3,510 1.8 486 469 6 61 33 35 18 23 24 7.9Costa Rica 17,482 4.8 3,721 5,270 8 29 63 69 15 18 –2 14.9Côte d’Ivoire 13,734 2.4 779 1,046 28 21 52 63 12 10 16 7.3Croatia 28,322 1.7 .. 9,741 8 29 62 61 21 27 –9 53.0Czech Republic 85,438 1.4 .. 6,382 4 40 57 53 21 28 –2 9.2Denmark 212,404 2.4 29,551 63,131 3 27 71 48 26 20 6 2.0Dominican Rep. 15,915 5.7 2,061 3,281 11 32 57 80 7 22 –9 9.1Ecuador 26,913 1.9 4,726 3,310 9 29 62 70 12 22 –4 3.9Egypt, Arab Rep. 82,427 4.5 1,000 1,316 16 34 50 72 13 17 –2 7.0El Salvador 14,396 4.0 1,619 1,678 9 32 59 88 11 17 –16 5.7Eritrea 734 4.0 .. 68 15 24 61 104 34 22 –60 10.3Estonia 8,383 1.5 .. 3,650 5 30 65 62 18 32 –12 35.5Ethiopia 6,638 4.3 .. 154 42 11 47 79 19 21 –19 5.4Finland 161,549 2.9 23,140 42,306 3 33 64 51 22 20 8 2.0France 1,747,973 1.9 30,635 59,243 3 25 72 55 24 19 2 1.5Georgia 3,937 –3.2 .. .. 21 23 56 81 10 21 –12 185.8Germany 2,400,655 1.5 16,783 33,686 1 30 69 59 19 18 4 1.6Ghana 7,659 4.3 542 571 35 25 40 83 11 19 –14 26.4Greece 173,045 2.7 10,578 13,860 7 22 70 67 16 23 –6 7.5Guatemala 24,730 3.8 1,932 2,115 22 19 58 90 5 17 –12 9.3Guinea 3,626 4.2 228 286 25 36 39 83 6 14 –4 5.2Haiti 2,745 –0.8 .. .. 27 16 57 103 .. a 21 –24 19.4Honduras 6,978 3.0 856 1,037 13 31 56 74 14 29 –17 16.2Hungary 82,805 2.4 5,133 5,625 4 31 65 67 11 24 –2 16.4India 598,966 5.8 342 401 23 26 52 65 13 24 –2 6.8Indonesia 208,311 3.5 674 748 17 44 40 69 9 16 6 15.3Iran, Islamic Rep. 136,833 4.0 2,613 3,737 11 37 53 64 10 30 –3 24.6Ireland 148,553 7.6 .. .. 3 42 54 47 15 24 15 3.8Israel 103,689 4.3 .. .. .. .. .. 60 31 16 –7 8.2Italy 1,465,895 1.6 13,990 27,064 3 29 69 60 19 20 1 3.4Jamaica 7,817 0.7 1,232 1,487 5 29 66 74 18 27 –19 18.6Japan 4,326,444 1.3 25,293 33,077 1 31 68 56 17 26 1 –0.5Jordan 9,860 4.6 1,810 1,145 2 26 72 80 23 23 –26 2.5Kazakhstan 29,749 –0.6 .. 1,753 8 39 53 59 13 26 2 120.2Kenya 13,842 1.8 265 213 17 19 64 70 19 16 –5 12.2Korea, Rep. 605,331 5.5 .. 13,747 3 35 62 55 13 29 3 4.8Kuwait 35,369 2.9 .. .. .. .. .. 56 26 9 9 2.6Kyrgyz Rep. 1,737 –1.5 .. 1,861 39 23 38 68 19 18 –4 72.2Lao PDR 2,036 6.3 462 621 51 23 26 .. .. 22 .. 28.6Latvia 9,671 –0.1 .. 2,773 5 24 71 62 18 31 –10 31.5Lebanon 19,000 4.6 .. 29,874 12 20 68 96 13 17 –26 12.2Lesotho 1,135 3.4 591 575 16 42 42 85 33 34 –52 9.5Lithuania 18,213 0.0 .. 3,431 7 34 59 64 20 21 –6 45.8Macedonia, FYR 4,705 0.1 .. 4,243 12 30 57 85 12 22 –18 48.8Madagascar 5,459 2.1 160 155 29 15 55 82 10 16 –8 16.0Malawi 1,731 3.1 77 124 38 15 48 85 20 8 –13 30.9
Note: For data comparability and coverage, see the technical notes. Figures in italics are for years other than those specified.
16_WDR_SWDI.qxd 8/24/04 3:26 PM Page 260
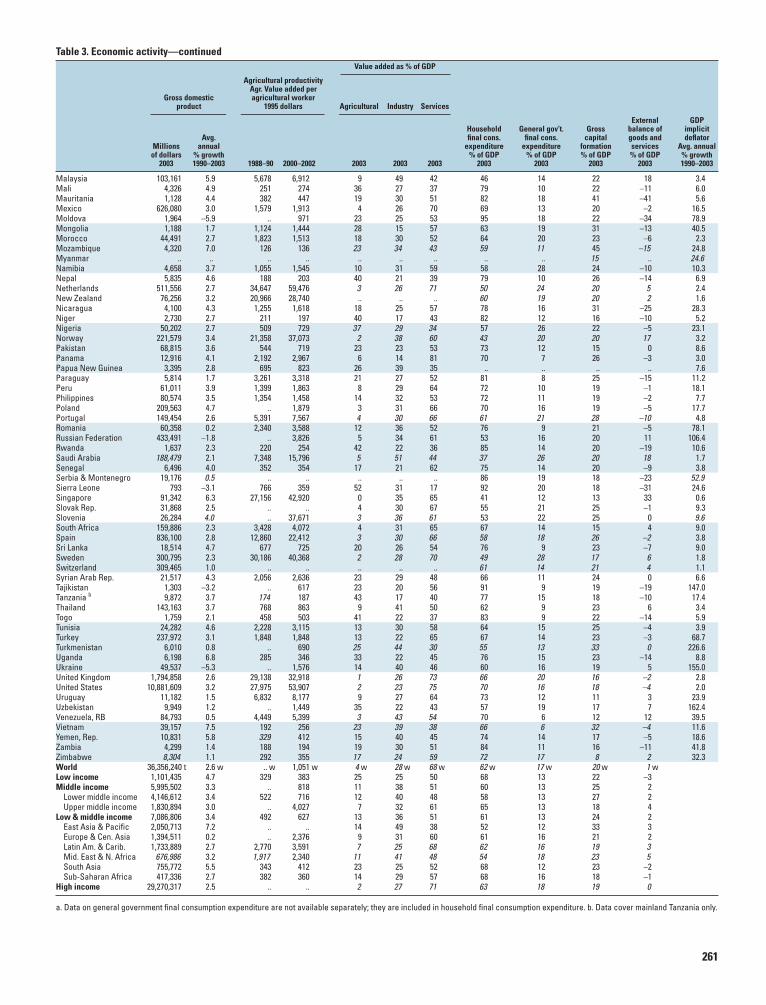
261
Table 3. Economic activity—continuedValue added as % of GDP
Agricultural productivityAgr. Value added per
Gross domestic agricultural workerproduct 1995 dollars Agricultural Industry Services
External GDPHousehold General gov’t. Gross balance of implicit
Avg. final cons. final cons. capital goods and deflatorMillions annual expenditure expenditure formation services Avg. annual
of dollars % growth % of GDP % of GDP % of GDP % of GDP % growth2003 1990–2003 1988–90 2000–2002 2003 2003 2003 2003 2003 2003 2003 1990–2003
Malaysia 103,161 5.9 5,678 6,912 9 49 42 46 14 22 18 3.4Mali 4,326 4.9 251 274 36 27 37 79 10 22 –11 6.0Mauritania 1,128 4.4 382 447 19 30 51 82 18 41 –41 5.6Mexico 626,080 3.0 1,579 1,913 4 26 70 69 13 20 –2 16.5Moldova 1,964 –5.9 .. 971 23 25 53 95 18 22 –34 78.9Mongolia 1,188 1.7 1,124 1,444 28 15 57 63 19 31 –13 40.5Morocco 44,491 2.7 1,823 1,513 18 30 52 64 20 23 –6 2.3Mozambique 4,320 7.0 126 136 23 34 43 59 11 45 –15 24.8Myanmar .. .. .. .. .. .. .. .. .. 15 .. 24.6Namibia 4,658 3.7 1,055 1,545 10 31 59 58 28 24 –10 10.3Nepal 5,835 4.6 188 203 40 21 39 79 10 26 –14 6.9Netherlands 511,556 2.7 34,647 59,476 3 26 71 50 24 20 5 2.4New Zealand 76,256 3.2 20,966 28,740 .. .. .. 60 19 20 2 1.6Nicaragua 4,100 4.3 1,255 1,618 18 25 57 78 16 31 –25 28.3Niger 2,730 2.7 211 197 40 17 43 82 12 16 –10 5.2Nigeria 50,202 2.7 509 729 37 29 34 57 26 22 –5 23.1Norway 221,579 3.4 21,358 37,073 2 38 60 43 20 20 17 3.2Pakistan 68,815 3.6 544 719 23 23 53 73 12 15 0 8.6Panama 12,916 4.1 2,192 2,967 6 14 81 70 7 26 –3 3.0Papua New Guinea 3,395 2.8 695 823 26 39 35 .. .. .. .. 7.6Paraguay 5,814 1.7 3,261 3,318 21 27 52 81 8 25 –15 11.2Peru 61,011 3.9 1,399 1,863 8 29 64 72 10 19 –1 18.1Philippines 80,574 3.5 1,354 1,458 14 32 53 72 11 19 –2 7.7Poland 209,563 4.7 .. 1,879 3 31 66 70 16 19 –5 17.7Portugal 149,454 2.6 5,391 7,567 4 30 66 61 21 28 –10 4.8Romania 60,358 0.2 2,340 3,588 12 36 52 76 9 21 –5 78.1Russian Federation 433,491 –1.8 .. 3,826 5 34 61 53 16 20 11 106.4Rwanda 1,637 2.3 220 254 42 22 36 85 14 20 –19 10.6Saudi Arabia 188,479 2.1 7,348 15,796 5 51 44 37 26 20 18 1.7Senegal 6,496 4.0 352 354 17 21 62 75 14 20 –9 3.8Serbia & Montenegro 19,176 0.5 .. .. .. .. .. 86 19 18 –23 52.9Sierra Leone 793 –3.1 766 359 52 31 17 92 20 18 –31 24.6Singapore 91,342 6.3 27,156 42,920 0 35 65 41 12 13 33 0.6Slovak Rep. 31,868 2.5 .. .. 4 30 67 55 21 25 –1 9.3Slovenia 26,284 4.0 .. 37,671 3 36 61 53 22 25 0 9.6South Africa 159,886 2.3 3,428 4,072 4 31 65 67 14 15 4 9.0Spain 836,100 2.8 12,860 22,412 3 30 66 58 18 26 –2 3.8Sri Lanka 18,514 4.7 677 725 20 26 54 76 9 23 –7 9.0Sweden 300,795 2.3 30,186 40,368 2 28 70 49 28 17 6 1.8Switzerland 309,465 1.0 .. .. .. .. .. 61 14 21 4 1.1Syrian Arab Rep. 21,517 4.3 2,056 2,636 23 29 48 66 11 24 0 6.6Tajikistan 1,303 –3.2 .. 617 23 20 56 91 9 19 –19 147.0Tanzania b 9,872 3.7 174 187 43 17 40 77 15 18 –10 17.4Thailand 143,163 3.7 768 863 9 41 50 62 9 23 6 3.4Togo 1,759 2.1 458 503 41 22 37 83 9 22 –14 5.9Tunisia 24,282 4.6 2,228 3,115 13 30 58 64 15 25 –4 3.9Turkey 237,972 3.1 1,848 1,848 13 22 65 67 14 23 –3 68.7Turkmenistan 6,010 0.8 .. 690 25 44 30 55 13 33 0 226.6Uganda 6,198 6.8 285 346 33 22 45 76 15 23 –14 8.8Ukraine 49,537 –5.3 .. 1,576 14 40 46 60 16 19 5 155.0United Kingdom 1,794,858 2.6 29,138 32,918 1 26 73 66 20 16 –2 2.8United States 10,881,609 3.2 27,975 53,907 2 23 75 70 16 18 –4 2.0Uruguay 11,182 1.5 6,832 8,177 9 27 64 73 12 11 3 23.9Uzbekistan 9,949 1.2 .. 1,449 35 22 43 57 19 17 7 162.4Venezuela, RB 84,793 0.5 4,449 5,399 3 43 54 70 6 12 12 39.5Vietnam 39,157 7.5 192 256 23 39 38 66 6 32 –4 11.6Yemen, Rep. 10,831 5.8 329 412 15 40 45 74 14 17 –5 18.6Zambia 4,299 1.4 188 194 19 30 51 84 11 16 –11 41.8Zimbabwe 8,304 1.1 292 355 17 24 59 72 17 8 2 32.3World 36,356,240 t 2.6 w .. w 1,051 w 4 w 28 w 68 w 62 w 17 w 20 w 1 wLow income 1,101,435 4.7 329 383 25 25 50 68 13 22 –3Middle income 5,995,502 3.3 .. 818 11 38 51 60 13 25 2
Lower middle income 4,146,612 3.4 522 716 12 40 48 58 13 27 2Upper middle income 1,830,894 3.0 .. 4,027 7 32 61 65 13 18 4
Low & middle income 7,086,806 3.4 492 627 13 36 51 61 13 24 2East Asia & Pacific 2,050,713 7.2 .. .. 14 49 38 52 12 33 3Europe & Cen. Asia 1,394,511 0.2 .. 2,376 9 31 60 61 16 21 2Latin Am. & Carib. 1,733,889 2.7 2,770 3,591 7 25 68 62 16 19 3Mid. East & N. Africa 676,986 3.2 1,917 2,340 11 41 48 54 18 23 5South Asia 755,772 5.5 343 412 23 25 52 68 12 23 –2Sub-Saharan Africa 417,336 2.7 382 360 14 29 57 68 16 18 –1
High income 29,270,317 2.5 .. .. 2 27 71 63 18 19 0
a. Data on general government final consumption expenditure are not available separately; they are included in household final consumption expenditure. b. Data cover mainland Tanzania only.
16_WDR_SWDI.qxd 8/24/04 3:26 PM Page 261

262
Table 4. Trade, aid, and financeMerchandise trade
exports imports External debt
HighManufactured technology Current Net private Foreign Official
exports exports account capital direct development Domestic credit% of total % of balance flows investment assistance a Total Present provided by
Millions Millions merchandise manufactured Millions Millions Millions Dollars Millions value banking sectorof dollars of dollars exports exports of dollars of dollars of dollars per capita of dollars % of GNI % of GDP
2003 2003 2002 2002 2003 2002 2002 2002 2002 2002 2002
Albania 450 1,879 86 1 –408 136 135 101 1,312 20 43.6Algeria 25,300 12,850 2 4 .. 1,023 1,065 12 22,800 42 29.1Angola 9,075 4,175 .. .. –1,431 1,420 1,312 32 10,134 120 5.5Argentina 29,349 13,813 31 7 9,559 681 785 0 132,314 66 62.4Armenia 678 1,269 61 2 –186 108 111 96 1,149 34 7.3Australia 70,358 88,618 29 16 –30,675 .. 16,364 .. .. .. 93.9Austria 96,187 97,678 82 15 –2,392 .. 886 .. .. .. 124.3Azerbaijan 2,592 2,626 6 8 –2,021 1,313 1,392 43 1,398 21 8.5Bangladesh 6,820 9,660 92 0 739 132 47 7 17,037 22 40.2Belarus 9,964 11,505 64 4 –505 227 247 4 908 7 17.5Belgium 267,179 b 250,399 b 79 b 11 9,392 .. 73,635 b .. .. .. 115.4Benin 425 765 6 0 –153 41 41 34 1,843 36 c 5.8Bolivia 1,560 1,575 17 7 –347 601 677 77 4,867 23 c 62.3Bosnia & Herzegovina 1,440 4,645 .. .. –2,096 299 293 143 2,515 34 35.8Botswana 2,480 2,085 91 0 .. 35 37 22 480 8 –29.5Brazil 73,084 50,665 54 19 –7,696 9,861 16,566 2 227,932 48 63.6Bulgaria 7,439 10,742 61 –1,648 808 600 48 10,462 79 23.7Burkina Faso 340 710 19 7 –449 8 8 40 1,580 16 c 12.4Burundi 38 155 1 2 –39 –2 0 24 1,204 110 32.1Cambodia 1,623 1,724 .. .. –64 54 54 37 2,907 68 6.0Cameroon 1,885 1,970 7 1 .. 38 86 40 8,502 57 c 15.7Canada 272,054 245,618 63 14 18,630 .. 20,501 .. .. .. 92.6Central African Rep. 130 97 .. .. .. 4 4 16 1,066 78 13.2Chad 230 852 .. .. .. 900 901 28 1,281 37 c 10.9Chile 20,875 19,320 18 3 –594 2,781 1,713 –1 41,945 62 73.9China 438,370 412,840 90 23 35,422 47,107 49,308 1 168,255 14 166.4
Hong Kong, China 224,040 d 207,168 95 d 17 17,414 .. 9,682 1 .. .. 144.5Colombia 13,010 13,744 38 7 –1,417 947 2,023 10 33,853 46 36.7Congo, Dem. Rep. 1,260 1,489 .. .. .. 32 32 16 8,726 171 0.2Congo, Rep. 2,645 1,110 .. .. –62 331 331 115 5,152 228 11.4Costa Rica 6,112 7,621 63 37 –946 602 662 1 4,834 33 36.9Côte d’Ivoire 6,059 3,750 21 3 767 117 230 65 11,816 91 20.7Croatia 6,164 14,199 73 12 –2,039 3,604 980 37 15,347 76 62.9Czech Republic 48,723 51,306 89 14 –4,485 10,382 9,323 38 26,419 46 45.8Denmark 67,887 58,749 66 22 4,991 .. 6,410 .. .. .. 156.6Dominican Rep. 5,547 7,970 34 1 –875 1,351 961 18 6,256 30 45.1Ecuador 5,988 6,534 10 7 –1,222 2,103 1,275 17 16,452 95 28.0Egypt, Arab Rep. 5,750 13,280 35 1 622 437 647 19 30,750 28 109.9El Salvador 3,136 5,763 58 6 –384 1,419 208 36 5,828 46 ..Eritrea 56 600 .. .. –223 21 21 54 528 40 148.9Estonia 5,618 7,967 72 12 –1,150 1,586 285 51 4,741 86 49.6Ethiopia 535 2,015 14 .. –70 71 75 19 6,523 63 c 61.9Finland 52,834 41,312 85 24 9,295 .. 8,156 .. .. .. 64.7France 384,662 388,373 81 21 25,744 .. 52,020 .. .. .. 105.0Georgia 444 1,058 35 38 –392 149 165 60 1,838 42 19.6Germany 748,375 493,712 86 17 53,513 .. 35,547 .. .. .. 144.7Ghana 1,945 3,225 16 3 –106 27 50 33 7,338 73 c 31.9Greece 13,040 45,379 52 10 –10,405 .. 53 .. .. .. 109.5Guatemala 2,395 6,150 35 7 –1,193 61 110 21 4,676 21 15.7Guinea 824 764 28 0 –41 0 0 32 3,401 47 12.5Haiti 330 1,200 .. .. .. 6 6 19 1,248 23 37.3Honduras 1,332 3,276 26 2 –266 100 143 64 5,395 50 34.1Hungary 42,697 47,747 86 25 –2,644 221 54 46 34,958 64 53.8India 54,740 69,743 75 5 4,656 4,944 3,030 1 104,429 17 58.5Indonesia 60,650 32,390 54 16 6,085 –6,966 –1,513 6 132,208 89 59.4Iran, Islamic Rep. 33,360 27,580 9 3 .. 816 37 2 9,154 7 45.3Ireland 92,695 52,789 88 41 –2,990 .. 24,697 .. .. .. 110.6Israel 31,577 36,430 93 20 –174 .. 1,649 115 .. .. 93.6Italy 290,231 289,017 88 9 –21,942 .. 14,699 .. .. .. 99.6Jamaica 1,215 3,815 64 0 –1,119 540 481 9 5,477 82 27.6Japan 471,934 382,959 93 24 136,215 .. 9,087 .. .. .. 312.5Jordan 3,000 5,579 68 3 –619 –31 56 103 8,094 83 89.6Kazakhstan 12,900 8,327 19 10 –69 4,431 2,583 13 17,538 80 13.0Kenya 2,395 3,735 24 10 –530 39 50 13 6,031 40 43.2Korea, Rep. 194,325 178,784 92 32 6,092 .. 1,972 –2 .. .. 101.9Kuwait 21,550 11,165 .. .. 4,192 .. 7 2 .. .. 105.8Kyrgyz Rep. 582 717 33 6 –32 –54 5 37 1,797 93 11.4Lao PDR 371 508 .. .. –82 25 25 50 2,664 85 12.3Latvia 2,896 5,248 59 4 –956 496 382 37 6,690 85 39.6Lebanon 1,458 7,035 69 3 –3,587 4,803 257 103 17,077 102 185.7Lesotho 427 914 .. .. –119 73 81 43 637 45 10.7Lithuania 7,252 9,870 58 5 –1,214 760 712 42 6,199 49 18.0Macedonia, FYR 1,336 2,206 70 1 –177 113 77 136 1,619 37 15.9Madagascar 626 843 .. .. –270 8 8 23 4,518 33 c 18.4Malawi 460 720 0 3 –174 6 6 35 2,912 51 c 21.6
Taiwan, China* 150,646 127,258 94 42 25,678 .. .. 0 .. .. ..
Note: For data comparability and coverage, see the technical notes. Figures in italics are for years other than those specified.
16_WDR_SWDI.qxd 8/24/04 3:26 PM Page 262

263
Table 4. Trade, aid, and finance—continuedMerchandise trade
exports imports External debt
HighManufactured technology Current Net private Foreign Official
exports exports account capital direct development Domestic credit% of total % of balance flows investment assistance a Total Present provided by
Millions Millions merchandise manufactured Millions Millions Millions Dollars Millions value banking sectorof dollars of dollars exports exports of dollars of dollars of dollars per capita of dollars % of GNI % of GDP
2003 2003 2002 2002 2003 2002 2002 2002 2002 2002 2002
Malaysia 100,726 81,067 79 58 7,190 4,807 3,203 4 48,557 57 154.2Mali 985 1,010 .. .. –310 102 102 42 2,803 47 c 16.5Mauritania 369 471 .. .. .. 16 12 135 2,309 56 c –8.2Mexico 165,334 178,990 84 21 –9,150 10,261 14,622 1 141,264 26 38.0Moldova 791 1,403 31 4 –92 77 111 33 1,349 78 29.1Mongolia 516 787 36 0 –105 78 78 85 1,037 69 17.1Morocco 8,701 14,158 66 11 413 15 428 21 18,601 51 c 84.5Mozambique 730 1,305 8 3 –657 381 406 112 4,609 27 c 13.4Myanmar 2,802 2,515 .. .. –309 69 129 2 6,556 .. 35.1Namibia 1,155 1,590 52 1 130 .. .. 68 .. .. 49.0Nepal 650 1,730 67 0 –165 9 10 15 2,953 31 43.2Netherlands 293,437 261,135 74 28 16,467 .. 28,534 .. .. .. 160.4New Zealand 16,505 18,559 28 10 –3,530 .. 823 .. .. .. 118.2Nicaragua 590 1,865 19 5 –888 206 174 97 6,485 77 93.0Niger 350 510 3 8 .. 0 8 26 1,797 26 c 8.5Nigeria 20,255 10,890 0 0 .. 639 1,281 2 30,476 82 26.5Norway 68,130 39,895 22 22 28,643 .. 502 .. .. .. 54.0Pakistan 11,901 13,034 85 1 3,597 379 823 15 33,672 45 43.5Panama 905 2,980 12 1 –408 180 57 12 8,298 84 90.7Papua New Guinea 2,146 1,193 2 19 286 –46 50 38 2,485 82 25.9Paraguay 1,289 2,079 15 3 376 34 –22 10 2,967 42 28.8Peru 8,864 8,494 21 2 –1,116 3,131 2,391 18 28,167 56 23.9Philippines 37,065 39,301 50 65 2,060 3,549 1,111 7 59,342 77 60.5Poland 52,285 66,887 82 3 6,178 5,075 4,131 30 69,521 37 35.8Portugal 31,172 44,821 86 7 –7,549 .. 1,790 .. .. .. 149.9Romania 17,618 24,003 81 3 –1,525 3,173 1,144 31 14,683 37 13.2Russian Federation 135,162 74,496 22 13 35,905 8,011 3,009 9 147,541 50 26.7Rwanda 60 240 3 1 –192 3 3 44 1,435 40 c 11.3Saudi Arabia 88,500 34,089 10 0 11,889 .. .. 1 .. .. 70.1Senegal 1,330 2,270 51 4 .. 94 93 45 3,918 53 c 22.6Serbia & Montenegro 2,522 7,140 .. .. –1,750 507 475 237 e 12,688 f 102 ..Sierra Leone 91 320 .. .. .. 5 5 68 1,448 103 c 48.4Singapore 144,134 d 127,898 85 d 60 18,704 .. 6,097 2 .. .. 83.5Slovak Rep. 22,035 22,318 85 3 .. 5,460 4,012 35 13,013 61 51.7Slovenia 12,738 13,812 90 5 15 .. 1,865 87 .. .. 46.0South Africa 36,452 g 38,141 g 63 g 5 –1,456 783 739 14 25,041 22 147.5Spain 151,876 200,088 78 7 –23,676 .. 36,727 .. .. .. 129.6Sri Lanka 5,060 6,455 74 1 –264 206 242 18 9,611 48 43.6Sweden 100,939 82,317 81 16 10,624 .. 11,828 .. .. .. 75.2Switzerland 100,550 96,345 93 21 26,011 .. 3,599 .. .. .. 174.4Syrian Arab Rep. 5,980 4,835 7 1 1,440 224 225 5 21,504 117 27.9Tajikistan 798 881 13 42 –41 –10 9 27 1,153 89 21.3Tanzania 990 2,120 17 2 –964 214 240 35 7,244 19 c,h 10.0Thailand 80,253 75,679 74 31 7,965 –1,992 900 5 59,212 49 116.0Togo 425 558 43 1 –169 75 75 11 1,581 92 17.0Tunisia 8,027 10,909 82 4 –844 1,625 795 49 12,625 65 74.4Turkey 46,573 67,734 84 2 –1,521 7,582 1,037 9 131,556 77 59.1Turkmenistan 3,403 2,516 7 5 –74 .. 100 8 .. .. 19.1Uganda 525 1,240 8 12 –353 149 150 26 4,100 22 c 15.4Ukraine 17,954 23,021 67 5 2,891 –576 693 10 13,555 35 27.5United Kingdom 303,890 388,282 79 31 –26,713 .. 29,179 .. .. .. 145.3United States 724,006 1,305,648 81 32 –541,834 .. 39,633 .. .. .. 246.6Uruguay 2,169 2,190 37 3 354 107 177 4 10,736 65 93.3Uzbekistan 2,936 2,576 .. .. 659 –11 65 7 4,568 38 ..Venezuela, RB 23,650 9,306 13 3 7,423 –1,639 690 2 32,563 33 15.0Vietnam 19,660 24,020 .. .. –604 759 1,400 16 13,349 35 44.8Yemen, Rep. 4,355 2,892 .. .. 340 114 114 31 5,290 40 –0.5Zambia 940 1,503 14 2 .. 186 197 63 5,969 127 46.7Zimbabwe 1,225 2,835 38 3 .. –3 26 15 4,066 .. 58.7World 7,479,592 t 7,624,797 t 78 w 21 w .. s 630,827 s 11 w .. s 179.5 wLow income 176,218 198,033 47 4 7,151 i 12,941 i 12 523,464 i 46.9Middle income 1,813,068 1,675,174 60 18 146,679 i 134,145 i 9 1,815,384 i,j 82.9
Lower middle income 1,147,024 1,066,326 60 17 98,852 i 91,104 i 8 1,147,339 i 97.9Upper middle income 666,731 608,848 60 21 47,828 i 43,041 i 12 668,045 i,j 53.0
Low & middle income 1,989,214 1,873,207 60 17 153,831 147,086 10 2,338,848 j 77.7East Asia & Pacific 746,144 676,038 79 32 47,524 54,834 4 497,354 143.8Europe & Central Asia 458,205 k 474,286 k 57 10 53,739 32,931 27 545,842 36.8Latin America & Carib. 374,300 359,950 48 16 34,544 44,682 10 727,944 46.8Middle East & N. Africa 222,781 155,327 19 2 5,359 2,653 21 189,010 72.1South Asia 79,505 102,282 77 4 5,697 4,164 5 168,349 55.3Sub-Saharan Africa 109,680 105,324 35 4 6,968 7,822 28 210,350 65.0
High income 5,491,151 5,741,481 82 23 .. 483,741 204.1
a. Regional aggregates include data for economies that are not specified elsewhere. World and income group totals include aid not allocated by country or region. b. Includes Luxembourg. c. Data are from debt sustainability analysis undertaken as part of the Heavily Indebted Poor Countries (HIPC) initiative. d. Includes re-exports. e. Aid to the states of the former Socialist FederalRepublic of Yugoslavia that is not otherwise specified is included in regional and income group aggregates. f. Data are estimates and reflect borrowing by the former Socialist Federal Republicof Yugoslavia that are not yet allocated to the successor republics. g. Data on total exports and imports refer to South Africa only. Data on export commodity shares refer to the South AfricanCustoms Union (Botswana, Lesotho, Namibia, South Africa, and Swaziland). h. GNI refers to mainaland Tanzania only. i. The aggregates reflect country groupings from Global DevelopmentFinance 2004. j. Includes data for Gibraltar not included in oher tables. k. Data include the intratrade of the Baltic states and the Commonwealth of Independent States.
16_WDR_SWDI.qxd 8/24/04 3:26 PM Page 263

264
Table 5. Key indicators for other economiesPPP
Gross national gross nationalPopulation income (GNI) a income (GNI) b
Gross Under-5 Adult Carbondensity domestic Life mortality Literacy dioxide
Avg. people Millions per Millions per product expectancy rate rate emissionsannual per of capita of capita per capita at birth Per % of people Thousands
Thousands % growth sq. km dollars dollars dollars dollars % growth Years 1,000 15 and above of tons2003 1990–2003 2003 2003 2003 2003 2003 2002–2003 2002 2002 2002 2000
Afghanistan 28,766 c 3.7 44 .. .. d .. .. .. 43 257 .. 905American Samoa 70 .. 353 .. .. e .. .. .. .. .. .. 286Andorra 69 1.8 136 .. .. f .. .. .. .. 7 .. ..Antigua & Barbuda 79 1.6 179 719 9,160 753 9,590 0.4 75 14 .. 352Aruba 97 .. 511 .. .. f .. .. .. .. .. .. 1,924Bahamas, The 317 1.6 32 4,684 15,110 5,067 16,140 –0.6 70 16 .. 1,795Bahrain 712 2.7 1,003 7,569 11,260 11,288 16,170 1.8 73 16 88 19,500Barbados 271 0.4 630 2,512 9,270 4,080 15,060 0.8 75 14 100 1,176Belize 259 2.4 11 807 3,190 1,476 5,840 1.8 74 40 77 g 780Bermuda 64 0.4 1,280 .. .. f .. .. .. .. .. .. 462Bhutan 874 2.9 19 578 660 .. .. 4.0 63 94 .. 396Brunei 356 2.5 68 .. .. f .. .. .. 77 6 .. 4,668Cape Verde 470 2.5 117 701 1,490 2,558 h 5,440 h 2.4 69 38 76 139 Cayman Islands 39 .. 150 .. .. f .. .. .. .. .. .. 286Channel Islands 149 0.3 745 .. .. f .. .. .. 79 .. .. ..Comoros 600 2.5 269 269 450 1,056 h 1,760 h 0.1 61 79 56 81Cuba 11,299 0.5 103 .. .. i .. .. .. 77 9 97 30,913Cyprus 770 0.9 83 9,373 12,320 15,042 h 19,530 h 3.3 78 6 97 g 6,423Djibouti 705 2.8 30 643 910 1,550 h 2,200 h 1.8 44 143 .. 385Dominica 71 –0.1 95 239 3,360 362 5,090 –0.7 77 15 .. 103Equatorial Guinea 494 2.6 18 437 930 .. .. 12.8 52 152 .. 205Faeroe Islands 46 –0.2 33 .. .. f .. .. .. .. .. .. 649Fiji 835 1.0 46 1,969 2,360 4,517 h 5,410 h 3.5 70 21 .. 725French Polynesia 243 1.6 66 .. .. f .. .. .. 74 .. .. 542Gabon 1,344 2.6 5 4,813 3,580 7,656 5,700 1.2 53 85 .. 3,499Gambia, The 1,421 3.3 142 442 310 2,591 h 1,820 h 6.3 53 126 .. 271Greenland 56 0.0 0 .. .. f .. .. .. 69 .. .. 557Grenada 105 0.8 308 396 3,790 702 6,710 1.4 73 25 .. 213Guam 162 1.5 295 .. .. f .. .. .. 78 .. .. 4,071Guinea-Bissau 1,489 2.9 53 202 140 983 660 –16.9 45 211 .. 264Guyana 769 0.4 4 689 900 3,035 h 3,950 h –1.0 62 72 .. 1,598Iceland 286 0.9 3 8,813 30,810 8,619 30,140 1.2 80 4 .. 2,158Iraq 24,700 2.4 56 .. .. i .. .. .. 63 125 .. 76,336Isle of Man 74 0.7 125 .. .. f .. .. .. .. .. .. ..Kiribati 96 2.2 132 84 880 .. .. 0.4 63 69 .. 26Korea, Dem. Rep. 22,612 1.0 188 .. .. d .. .. .. 62 55 .. 188,857Liberia 3,374 2.5 35 445 130 .. .. –2.3 47 235 56 399Libya 5,559 2.0 3 .. .. e .. .. .. 72 19 82 57,125Liechtenstein 33 1.3 207 .. .. f .. .. .. .. 11 .. ..Luxembourg 448 1.2 171 19,683 43,940 24,385 54,430 0.3 78 5 .. 8,482Macao, China 444 1.4 .. 6,335 14,600 j 9,624 h 21,920 h .. 79 .. 91 g 1,634Maldives 293 2.5 977 674 I 2,300 .. .. 6.1 69 77 97 498Malta 399 0.8 1,247 3,678 9,260 7,096 17,870 .. 78 5 93 2,814Marshall Islands 53 1.1 265 143 2,710 .. .. 2.0 65 66 .. ..Mauritius 1,225 1.1 603 5,012 4,090 13,789 11,260 2.1 73 19 84 2,895Mayotte 166 .. 400 .. .. e .. .. .. 60 .. .. ..Micronesia, Fed. Sts. 125 2.0 174 261 2,090 .. .. –0.1 69 24 .. ..Monaco 32 1.1 16,842 .. .. f .. .. .. .. 5 .. ..Netherlands Antilles 220 1.1 275 .. .. f .. .. .. 76 .. 97 9,929New Caledonia 225 2.2 12 .. .. f .. .. .. 74 .. .. 1,667Northern Mariana Islands 80 .. 159 .. .. e .. .. .. .. .. .. ..Oman 2,599 3.6 8 19,877 7,830 32,985 13,000 .. 74 13 74 19,775Palau 20 2.2 43 150 7,500 .. .. 1.5 70 29 .. 242Puerto Rico 3,898 0.7 439 42,057 10,950 62,674 16,320 .. 77 .. 94 8,735Qatar 624 1.9 57 .. .. f .. .. .. 75 16 .. 40,685Samoa 178 0.8 63 284 1,600 1,015 h 5,700 h 1.9 69 25 99 139San Marino 28 1.5 277 .. .. f .. .. .. .. 6 .. ..São Tomé & Principe 157 2.4 164 50 320 .. .. 2.5 66 118 .. 88Seychelles 84 1.4 186 626 7,480 1,336 15,960 –6.5 73 16 92 g 227Solomon Islands 457 2.8 16 273 600 746 h 1,630 h 0.7 69 24 .. 165Somalia 9,626 2.3 15 .. .. d .. .. .. 47 225 .. ..St. Kitts & Nevis 47 0.8 130 321 6,880 516 11,040 2.4 71 24 .. 103St. Lucia 161 1.4 263 650 4,050 839 5,220 0.8 74 19 .. 322St. Vincent & the Grenadines 109 0.2 280 361 3,300 719 6,590 2.8 73 25 .. 161Sudan 33,546 2.3 14 15,372 460 63,145 h 1,880 h 3.6 58 94 60 5,221Suriname 438 0.7 3 841 1,990 .. .. .. 70 40 .. 2,118Swaziland 1,106 2.8 64 1,492 1,350 5,359 4,850 0.6 44 149 81 381Timor-Leste 810 0.7 54 351 430 .. .. .. .. 126 .. ..Tonga 102 0.5 142 152 1,490 703 h 6,890 h 1.7 71 20 .. 121Trinidad & Tobago 1,313 0.6 256 9,538 7,260 12,405 9,450 3.1 72 20 98 26,362United Arab Emirates 4,041 6.3 48 .. .. f 78,977 h 21,040 h –5.0 75 9 77 58,913 Vanuatu 210 2.7 17 248 1,180 605 2,880 –0.2 69 42 .. 81Virgin Islands (U.S.) 112 0.6 329 .. .. f .. .. .. 78 .. .. 13,106West Bank & Gaza 3,367 4.1 .. 3,734 1,110 .. .. –5.2 73 .. .. ..
Note: For data comparability and coverage, see the technical notes. Figures in italics are for years other than those specified.a. Preliminary World Bank estimates calculated using the World Bank Atlas method. b. Purchasing power parity; see the Technical Notes. c. Estimate does not account for recent refugee flows.d. Estimated to be low income ($765 or less). e. Estimated to be upper middle income ($3,036 to $9,385). f. Estimated to be high income ($9,386 or more). g. National estimates based on censusdata. h. The estimate is based on regression; others are extrapolated from the latest Internaional Comparison Programme bencmark estimates. i. Estimated to be lower middle income ($766 to$3,035). j. Refers to GDP and GDP per capita.
16_WDR_SWDI.qxd 8/24/04 3:26 PM Page 264
Technical notesThese technical notes discuss the sources and methods used tocompile the indicators included in this edition of SelectedWorld Development Indicators. The notes follow the order inwhich the indicators appear in the tables. Note that theSelected World Development Indicators uses terminology inline with the 1993 System of National Accounts (SNA). Forexample, in the 1993 SNA gross national income replaces grossnational product. See the technical notes for tables 1 and 3 forother examples.
SourcesThe data published in the Selected World Development Indi-cators are taken from World Development Indicators 2004.Where possible, however, revisions reported since the closingdate of that edition have been incorporated. In addition, newlyreleased estimates of population and gross national income(GNI) per capita for 2003 are included in table 1.
The World Bank draws on a variety of sources for the statis-tics published in the World Development Indicators. Data onexternal debt are reported directly to the World Bank by devel-oping member countries through the Debtor Reporting Sys-tem. Other data are drawn mainly from the United Nationsand its specialized agencies, from the International MonetaryFund (IMF), and from country reports to the World Bank.Bank staff estimates are also used to improve currentness orconsistency. For most countries, national accounts estimatesare obtained from member governments through World Bankeconomic missions. In some instances these are adjusted bystaff to ensure conformity with international definitions andconcepts. Most social data from national sources are drawnfrom regular administrative files, special surveys, or periodiccensuses.
For more detailed notes about the data, please refer to theWorld Bank’s World Development Indicators 2004.
Data consistency and reliability Considerable effort has been made to standardize the data, butfull comparability cannot be assured, and care must be taken ininterpreting the indicators. Many factors affect data availabil-ity, comparability, and reliability: statistical systems in manydeveloping economies are still weak; statistical methods, cover-age, practices, and definitions differ widely; and cross-countryand intertemporal comparisons involve complex technical andconceptual problems that cannot be unequivocally resolved.Data coverage may not be complete because of special circum-stances or for economies experiencing problems (such as thosestemming from conflicts) affecting the collection and report-ing of data. For these reasons, although the data are drawnfrom the sources thought to be most authoritative, they shouldbe construed only as indicating trends and characterizingmajor differences among economies rather than offering pre-
cise quantitative measures of those differences. Discrepanciesin data presented in different editions reflect updates by coun-tries as well as revisions to historical series and changes inmethodology. Thus readers are advised not to compare dataseries between editions or between different editions of WorldBank publications. Consistent time series are available fromthe World Development Indicators 2004 CD-ROM.
Ratios and growth rates For ease of reference, the tables usually show ratios and rates ofgrowth rather than the simple underlying values. Values intheir original form are available from the World DevelopmentIndicators 2004 CD-ROM. Unless otherwise noted, growthrates are computed using the least-squares regression method(see Statistical methods below). Because this method takes intoaccount all available observations during a period, the result-ing growth rates reflect general trends that are not undulyinfluenced by exceptional values. To exclude the effects of infla-tion, constant price economic indicators are used in calculat-ing growth rates. Data in italics are for a year or period otherthan that specified in the column heading—up to two yearsbefore or after for economic indicators and up to three yearsfor social indicators, because the latter tend to be collected lessregularly and change less dramatically over short periods.
Constant price series An economy’s growth is measured by the increase in valueadded produced by the individuals and enterprises operating inthat economy. Thus, measuring real growth requires estimatesof GDP and its components valued in constant prices. TheWorld Bank collects constant price national accounts series innational currencies and recorded in the country’s original baseyear. To obtain comparable series of constant price data, itrescales GDP and value added by industrial origin to a commonreference year, currently 1995. This process gives rise to a dis-crepancy between the rescaled GDP and the sum of the rescaledcomponents. Because allocating the discrepancy would give riseto distortions in the growth rate, it is left unallocated.
Summary measures The summary measures for regions and income groups, pre-sented at the end of most tables, are calculated by simple addi-tion when they are expressed in levels. Aggregate growth ratesand ratios are usually computed as weighted averages. Thesummary measures for social indicators are weighted by popu-lation or subgroups of population, except for infant mortality,which is weighted by the number of births. See the notes onspecific indicators for more information.
For summary measures that cover many years, calculationsare based on a uniform group of economies so that the com-position of the aggregate does not change over time. Groupmeasures are compiled only if the data available for a given
Selected world development indicators 265
16_WDR_SWDI.qxd 8/24/04 3:26 PM Page 265
year account for at least two-thirds of the full group, as definedfor the 1995 benchmark year. As long as this criterion is met,economies for which data are missing are assumed to behavelike those that provide estimates. Readers should keep in mindthat the summary measures are estimates of representativeaggregates for each topic and that nothing meaningful can bededuced about behavior at the country level by working backfrom group indicators. In addition, the estimation process mayresult in discrepancies between subgroup and overall totals.
Table 1. Key indicators of developmentPopulation is based on the de facto definition, which counts allresidents, regardless of legal status or citizenship, except forrefugees not permanently settled in the country of asylum,who are generally considered part of the population of thecountry of origin.
Average annual population growth rate is the exponentialrate of change for the period (see the section on statisticalmethods below).
Population density is midyear population divided by landarea. Land area is a country’s total area excluding areas underinland bodies of water and coastal waterways. Density is calcu-lated using the most recently available data on land area.
Gross national income (GNI—formerly gross nationalproduct or GNP), the broadest measure of national income,measures total value added from domestic and foreign sourcesclaimed by residents. GNI comprises gross domestic product(GDP) plus net receipts of primary income from foreignsources. Data are converted from national currency to currentU.S. dollars using the World Bank Atlas method. This involvesusing a three-year average of exchange rates to smooth theeffects of transitory exchange rate fluctuations. (See the sectionon statistical methods below for further discussion of the Atlasmethod.)
GNI per capita is GNI divided by midyear population. It isconverted into current U.S. dollars by the Atlas method. TheWorld Bank uses GNI per capita in U.S dollars to classifyeconomies for analytical purposes and to determine borrow-ing eligibility.
PPP Gross national income, which is GNI converted intointernational dollars using purchasing power parity (PPP)conversion factors, is included because nominal exchange ratesdo not always reflect international differences in relative prices.At the PPP rate, one international dollar has the same purchas-ing power over domestic GNI that the U.S. dollar has over U.S.GNI. PPP rates allow a standard comparison of real price levelsbetween countries, just as conventional price indexes allowcomparison of real values over time. The PPP conversion fac-tors used here are derived from price surveys covering 118countries conducted by the International Comparison Pro-gram. For Organisation for Economic Co-operation andDevelopment (OECD) countries data come from the most
recent round of surveys, completed in 1999; the rest are eitherfrom the 1996 survey, or data from the 1993 or earlier roundand extrapolated to the 1996 benchmark. Estimates for coun-tries not included in the surveys are derived from statisticalmodels using available data.
PPP GNI per capita is PPP GNI divided by midyearpopulation.
Gross domestic product (GDP) per capita growth is basedon GDP measured in constant prices. Growth in GDP is con-sidered a broad measure of the growth of an economy. GDP inconstant prices can be estimated by measuring the total quan-tity of goods and services produced in a period, valuing themat an agreed set of base year prices, and subtracting the cost ofintermediate inputs, also in constant prices. See the section onstatistical methods for details of the least-squares growth rate.
Life expectancy at birth is the number of years a newborninfant would live if patterns of mortality prevailing at its birthwere to stay the same throughout its life.
Under-5 mortality rate is the probability that a newbornchild will die before reaching age 5, if the child is subject to cur-rent age specific mortality rates. The probability is expressed asa rate per 1,000.
Adult literacy rate is the percentage of persons aged 15 andabove who can, with understanding, both read and write ashort, simple statement about their everyday life. In practice,literacy is difficult to measure. To estimate literacy using such adefinition requires census or survey measurements under con-trolled conditions. Many countries estimate the number of lit-erate people from self-reported data. Some use educationalattainment data as a proxy but apply different lengths of schoolattendance or level completion. As definition and methodolo-gies of data collection differ across country—and even overtime within countries—data need to be used with caution
Carbon dioxide emissions (CO2) measures those emis-sions stemming from the burning of fossil fuels and the manu-facture of cement. These include carbon dioxide producedduring consumption of solid, liquid, and gas fuels and fromgas flaring.
The Carbon Dioxide Information Analysis Center(CDIAC), sponsored by the U.S. Department of Energy, calcu-lates annual anthropogenic emissions of CO2. These calcula-tions are derived from data on fossil fuel consumption, basedon the World Energy Data Set maintained by the UNSD, andfrom data on world cement manufacturing, based on theCement Manufacturing Data Set maintained by the U.S.Bureau of Mines. Each year the CDIAC recalculates the entiretime series from 1950 to the present, incorporating its mostrecent findings and the latest corrections to its database. Esti-mates exclude fuels supplied to ships and aircraft engaged ininternational transportation because of the difficulty of appor-tioning these fuels among the countries benefiting from thattransport.
266 WORLD DEVELOPMENT REPORT 2005
16_WDR_SWDI.qxd 8/24/04 3:26 PM Page 266
Table 2. Poverty and income distribution Survey year is the year in which the underlying data werecollected.
Rural poverty rate is the percentage of the rural populationliving below the rural poverty line. Urban poverty rate is thepercentage of the urban population living below the urbanpoverty line. National poverty rate is the percentage of thetotal population living below the national poverty line.National estimates are based on population weighted sub-group estimates from household surveys.
Population below $1 PPP a day and $2 PPP a day are thepercentages of the population living on less than $1.08 a day and$2.15 a day at 1993 international prices.As a result of revisions inPPP exchange rates, they cannot be compared with poverty ratesreported in previous editions for individual countries.
Poverty gap at $1 PPP a day and Poverty gap at $2 PPP aday is the mean shortfall below the poverty line (counting thenon-poor as having zero shortfall), expressed as a percentageof the poverty line. This measure reflects the depth of povertyas well as its incidence.
International comparisons of poverty data entail both con-ceptual and practical problems. Different countries have differ-ent definitions of poverty, and consistent comparisonsbetween countries can be difficult. Local poverty lines tend tohave higher purchasing power in rich countries, where moregenerous standards are used than in poor countries. Is it rea-sonable to treat two people with the same standard of living—in terms of their command over commodities—differentlybecause one happens to live in a better-off country? Can wehold the real value of the poverty line constant across coun-tries, just as we do when making comparisons over time?
Poverty measures based on an international poverty lineattempt to do this. The commonly used $1 a day standard,measured in 1985 international prices and adjusted to localcurrency using purchasing power parities (PPPs), was chosenfor the World Bank’s World Development Report 1990: Povertybecause it is typical of the poverty lines in low-income coun-tries. PPP exchange rates, such as those from the Penn WorldTables or the World Bank, are used because they take intoaccount the local prices of goods and services not traded inter-nationally. But PPP rates were designed not for making inter-national poverty comparisons but for comparing aggregatesfrom national accounts. Thus there is no certainty that aninternational poverty line measures the same degree of need ordeprivation across countries.
This year’s edition (like those of the last four years) uses1993 consumption PPP estimates produced by the WorldBank. The international poverty line, set at $1 a day in 1985PPP terms, has been recalculated in 1993 PPP terms at about$1.08 a day. Any revisions in the PPP of a country to incorpo-rate better price indexes can produce dramatically differentpoverty lines in local currency.
Problems also exist in comparing poverty measures withincountries. For example, the cost of living is typically higher inurban than in rural areas. So the urban monetary poverty lineshould be higher than the rural poverty line. But it is notalways clear that the difference between urban and ruralpoverty lines found in practice properly reflects the differencein the cost of living. In some countries the urban poverty linein common use has a higher real value than does the ruralpoverty line. Sometimes the difference has been so large as toimply that the incidence of poverty is greater in urban than inrural areas, even though the reverse is found when adjustmentsare made only for differences in the cost of living. As withinternational comparisons, when the real value of the povertyline varies, it is not clear how meaningful such urban-ruralcomparisons are.
The problems of making poverty comparisons do not endthere. More issues arise in measuring household living stan-dards. The choice between income and consumption as a wel-fare indicator is one issue. Income is generally more difficult tomeasure accurately, and consumption accords better with theidea of the standard of living than does income, which can varyover time even if the standard of living does not. But consump-tion data are not always available, and when they are not thereis little choice but to use income. There are still other problems.Household survey questionnaires can differ widely, for exam-ple, in the number of distinct categories of consumer goodsthey identify. Survey quality varies, and even similar surveysmay not be strictly comparable.
Comparisons across countries at different levels of develop-ment also pose a potential problem, because of differences inthe relative importance of consumption of nonmarket goods.The local market value of all consumption in kind (includingconsumption from own production, particularly important inunderdeveloped rural economies) should be included in themeasure of total consumption expenditure. Similarly, theimputed profit from production of nonmarket goods should beincluded in income. This is not always done, though such omis-sions were a far bigger problem in surveys before the 1980s.Most survey data now include valuations for consumption orincome from own production. Nonetheless, valuation methodsvary. For example, some surveys use the price in the nearestmarket, while others use the average farm gate selling price.
Wherever possible, consumption has been used as the wel-fare indicator for deciding who is poor. Where consumptiondata are unavailable, income data are used, though there is achange in this year’s edition in how income surveys are used. Inthe past, average income was adjusted to accord with con-sumption and income data from national accounts. Thisapproach was tested using data for more than 20 countries forwhich the surveys provided both income and consumptionexpenditure data. Income gave a higher mean than consump-tion but also greater income inequality. These two effects
Selected world development indicators 267
16_WDR_SWDI.qxd 8/24/04 3:26 PM Page 267
roughly canceled each other out when poverty measures basedon consumption were compared with those based on incomefrom the same survey; statistically, there was no significant dif-ference. So this year’s edition uses income data to estimatepoverty directly and no longer adjusts the income mean.
In all cases the measures of poverty have been calculatedfrom primary data sources (tabulations or household data)rather than existing estimates. Estimation from tabulationsrequires an interpolation method; the method chosen wasLorenz curves with flexible functional forms, which haveproved reliable in past work. Empirical Lorenz curves wereweighted by household size, so they are based on percentiles ofpopulation, not households.
Gini index measures the extent to which the distribution ofincome (or, in some cases, consumption expenditure) amongindividuals or households within an economy deviates from aperfectly equal distribution. A Lorenz curve plots the cumula-tive percentages of total income received against the cumula-tive number of recipients, starting with the poorest individualor household. The Gini index measures the area between theLorenz curve and a hypothetical line of absolute equality,expressed as a percentage of the maximum area under the line.Thus a Gini index of zero represents perfect equality, while anindex of 100 implies perfect inequality.
Percentage share of income or consumption is the sharethat accrues to subgroups of population indicated by quintiles.
Inequality in the distribution of income is reflected in thepercentage shares of income or consumption accruing tosegments of the population ranked by income or consump-tion levels. The segments ranked lowest by personal incomereceive the smallest shares of total income. The Gini indexprovides a convenient summary measure of the degree ofinequality.
Data on personal or household income or consumptioncome from nationally representative household surveys. Thedata in the table refer to different years between 1989 and 2002.Footnotes to the survey year indicate whether the rankings arebased on per capita income or consumption. Each distributionis based on percentiles of population—rather than of house-holds—with households ranked by income or expenditure perperson.
Where the original data from the household survey wereavailable, they have been used to directly calculate the income(or consumption) shares by quintile. Otherwise shares havebeen estimated from the best available grouped data.
The distribution data have been adjusted for householdsize, providing a more consistent measure of per capita incomeor consumption. No adjustment has been made for spatial dif-ferences in cost of living within countries, because the dataneeded for such calculations are generally unavailable. For fur-ther details on the estimation method for low and middle-income economies, see Ravallion and Chen (1996).
Because the underlying household surveys differ inmethod and in the type of data collected, the distributiondata are not strictly comparable across countries. Theseproblems are diminishing as survey methods improve andbecome more standardized, but achieving strict comparabil-ity is still impossible.
Two sources of noncomparability should be noted. First,the surveys can differ in many respects, including whether theyuse income or consumption expenditure as the living standardindicator. The distribution of income is typically more unequalthan the distribution of consumption. In addition, the defini-tions of income used usually differ among surveys. Consump-tion is usually a much better welfare indicator, particularly indeveloping countries. Second, households differ in size (num-ber of members) and in the extent of income sharing amongmembers. And individuals differ in age and consumptionneeds. Differences among countries in these respects may biascomparisons of distribution.
World Bank staff have made an effort to ensure that thedata are as comparable as possible. Wherever possible, con-sumption has been used rather than income. Income distribu-tion and Gini indexes for high-income countries are calculateddirectly from the Luxembourg Income Study database, usingan estimation method consistent with that applied for devel-oping countries.
Table 3. Economic activityGross domestic product is gross value added, at purchasers’prices, by all resident producers in the economy plus any taxesand minus any subsidies not included in the value of the prod-ucts. It is calculated without deducting for depreciation of fab-ricated assets or for depletion or degradation of naturalresources. Value added is the net output of an industry afteradding up all outputs and subtracting intermediate inputs.The industrial origin of value added is determined by theInternational Standard Industrial Classification (ISIC) revi-sion 3. The World Bank conventionally uses the U.S. dollar andapplies the average official exchange rate reported by the Inter-national Monetary Fund for the year shown. An alternativeconversion factor is applied if the official exchange rate isjudged to diverge by an exceptionally large margin from therate effectively applied to transactions in foreign currenciesand traded products.
Gross domestic product average annual growth rate is cal-culated from constant price GDP data in local currency.
Agricultural productivity refers to the ratio of agriculturalvalue added, measured in constant 1995 U.S. dollars, to thenumber of workers in agriculture.
Value added is the net output of an industry after addingup all out-puts and subtracting intermediate inputs. Theindustrial origin of value added is determined by the Interna-tional Standard Industrial Classification (ISIC) revision 3.
268 WORLD DEVELOPMENT REPORT 2005
16_WDR_SWDI.qxd 8/24/04 3:26 PM Page 268
Agriculture value added corresponds to ISIC divisions 1–5and includes forestry and fishing.
Industry value added comprises mining, manufacturing,construction, electricity, water, and gas (ISIC divisions 10–45).
Services value added correspond to ISIC divisions 50–99.Household final consumption expenditure (private con-
sumption in previous editions) is the market value of allgoods and services, including durable products (such as cars,washing machines, and home computers), purchased byhouseholds. It excludes purchases of dwellings but includesimputed rent for owner-occupied dwellings. It also includespayments and fees to governments to obtain permits andlicenses. Here, household consumption expenditure includesthe expenditures of nonprofit institutions serving house-holds, even when reported separately by the country. In prac-tice, household consumption expenditure may include anystatistical discrepancy in the use of resources relative to thesupply of resources.
General government final consumption expenditure(general government consumption in previous editions)includes all government current expenditures for purchases ofgoods and services (including compensation of employees). Italso includes most expenditures on national defense and secu-rity, but excludes government military expenditures that arepart of government capital formation.
Gross capital formation (gross domestic investment inprevious editions) consists of outlays on additions to the fixedassets of the economy plus net changes in the level of invento-ries and valuables. Fixed assets include land improvements(fences, ditches, drains, and so on); plant, machinery, andequipment purchases; and the construction of buildings,roads, railways, and the like, including commercial and indus-trial buildings, offices, schools, hospitals, and private dwellings.Inventories are stocks of goods held by firms to meet tempo-rary or unexpected fluctuations in production or sales, and“work in progress”. According to the 1993 SNA net acquisitionsof valuables are also considered capital formation.
External balance of goods and services is exports of goodsand services less imports of goods and services. Trade in goodsand services comprise all transactions between residents of acountry and the rest of the world involving a change in owner-ship of general merchandise, goods sent for processing andrepairs, non-monetary gold, and services.
The GDP implicit deflator reflects changes in prices for allfinal demand categories, such as government consumption,capital formation, and international trade, as well as the maincomponent, private final consumption. It is derived as the ratioof current to constant price GDP. The GDP deflator may alsobe calculated explicitly as a Paasche price index in which theweights are the current period quantities of output.
National accounts indicators for most developing countriesare collected from national statistical organizations and central
banks by visiting and resident World Bank missions. Data forhigh-income economies come from the Organization for Eco-nomic Co-operation and Development data files.
Table 4. Trade, aid, and financeMerchandise exports show the f.o.b. value of goods providedto the rest of the world valued in U.S. dollars.
Merchandise imports show the c.i.f. value of goods (thecost of the goods including insurance and freight) purchasedfrom the rest of the world valued in U.S. dollars. Data on mer-chandise trade come from the World Trade Organization(WTO) in its annual report.
Manufactured exports comprise the commodities in Stan-dard Industrial Trade Classification (SITC) sections 5 (chemi-cals), 6 (basic manufactures), 7 (machinery and transportequipment), and 8 (miscellaneous manufactured goods),excluding division 68.
High technology exports are products with high R&Dintensity. They include high-technology products such as inaerospace, computers, pharmaceuticals, scientific instruments,and electrical machinery.
Current account balance is the sum of net exports of goodsand services, net income, and net current transfers.
Net private capital flows consist of private debt and non-debt flows. Private debt flows include commercial bank lend-ing, bonds, and other private credits; nondebt private flows areforeign direct investment and portfolio equity investment.
Foreign direct investment is net inflows of investment toacquire a lasting management interest (10 percent or more ofvoting stock) in an enterprise operating in an economy otherthan that of the investor. It is the sum of equity capital, re-investment of earnings, other long-term capital, and short-term capital, as shown in the balance of payments. Data on thecurrent account balance, private capital flows, and foreigndirect investment are drawn from the IMF’s Balance of Pay-ments Statistics Yearbook and International Financial Statistics.
Official development assistance or official aid from thehigh-income members of the Organisation for Economic Co-operation and Development (OECD) are the main source ofofficial external finance for developing countries, but officialdevelopment assistance (ODA) is also disbursed by someimportant donor countries that are not members of OECD’sDevelopment Assistance Committee (DAC). DAC has threecriteria for ODA: it is undertaken by the official sector; it pro-motes economic development or welfare as a main objective;and it is provided on concessional terms, with a grant elementof at least 25 percent on loans.
ODA comprises grants and loans, net of repayments, thatmeet the DAC definition of ODA and are made to countriesand territories in part I of the DAC list of aid recipients. Offi-cial aid comprises grants and ODA-like loans, net of repay-ments, to countries and territories in part II of the DAC list of
Selected world development indicators 269
16_WDR_SWDI.qxd 8/24/04 3:26 PM Page 269

aid recipients. Bilateral grants are transfers in money or in kindfor which no repayment is required. Bilateral loans are loansextended by governments or official agencies that have a grantelement of at least 25 percent and for which repayment isrequired in convertible currencies or in kind.
Total external debt is debt owed to nonresidents repayablein foreign currency, goods, or services. It is the sum of public,publicly guaranteed, and private non-guaranteed long-termdebt, use of IMF credit, and short-term debt. Short-term debtincludes all debt having an original maturity of one year or lessand interest in arrears on long-term debt.
Present value of debt is the sum of short-term externaldebt plus the discounted sum of total debt service paymentsdue on public, publicly guaranteed, and private nonguaranteedlong-term external debt over the life of existing loans.
The main sources of external debt information are reportsto the World Bank through its Debtor Reporting System frommember countries that have received World Bank loans. Addi-tional information has been drawn from the files of the WorldBank and the IMF. Summary tables of the external debt ofdeveloping countries are published annually in the WorldBank’s Global Development Finance.
Domestic credit provided by banking sector includes allcredit to various sectors on a gross basis, with the exception ofcredit to the central government, which is net. The bankingsector includes monetary authorities, deposit money banks,and other banking institutions for which data are available(including institutions that do not accept transferable depositsbut do incur such liabilities as time and savings deposits).Examples of other banking institutions include savings andmortgage loan institutions and building and loan associations.Data are from the IMF’s International Finance Statistics.
Statistical methods This section describes the calculation of the least-squaresgrowth rate, the exponential (endpoint) growth rate, and theWorld Bank’s Atlas methodology for calculating the conver-sion factor used to estimate GNI and GNI per capita in U.S.dollars.
Least-squares growth rate Least-squares growth rates are used wherever there is a suffi-ciently long time series to permit a reliable calculation. Nogrowth rate is calculated if more than half the observations in aperiod are missing.
The least-squares growth rate, r, is estimated by fitting a lin-ear regression trendline to the logarithmic annual values of the
variable in the relevant period. The regression equation takesthe form
ln Xt = a + bt,
which is equivalent to the logarithmic transformation of thecompound growth equation,
Xt = Xo(1 + r)t.
In this equation, X is the variable, t is time, and a = log Xo andb = ln (1 + r) are the parameters to be estimated. If b* is theleast-squares estimate of b, the average annual growth rate, r, isobtained as [exp(b*)–1] and is multiplied by 100 to express itas a percentage.
The calculated growth rate is an average rate that is repre-sentative of the available observations over the entire period. Itdoes not necessarily match the actual growth rate between anytwo periods.
Exponential growth rate The growth rate between two points in time for certain demo-graphic data, notably labor force and population, is calculatedfrom the equation
r = ln (pn/p1)/n,
where pn and p1 are the last and first observations in the period,n is the number of years in the period, and ln is the natural log-arithm operator. This growth rate is based on a model of con-tinuous, exponential growth between two points in time. Itdoes not take into account the intermediate values of the series.Note also that the exponential growth rate does not corre-spond to the annual rate of change measured at a one-yearinterval which is given by
(pn – pn–1)/pn–1.
The Gini index The Gini index measures the extent to which the distributionof income (or, in some cases, consumption expenditure)among individuals or households within an economy deviatesfrom a perfectly equal distribution. A Lorenz curve plots thecumulative percentages of total income received against thecumulative number of recipients, starting with the poorestindividual or household. The Gini index measures the areabetween the Lorenz curve and a hypothetical line of absoluteequality, expressed as a percentage of the maximum area underthe line. Thus a Gini index of zero represents perfect equality,and an index of 100 percent implies perfect inequality.
270 WORLD DEVELOPMENT REPORT 2005
16_WDR_SWDI.qxd 8/24/04 3:26 PM Page 270

World Bank Atlas method In calculating GNI and GNI per capita in U.S. dollars for cer-tain operational purposes, the World Bank uses the Atlas con-version factor. The purpose of the Atlas conversion factor is toreduce the impact of exchange rate fluctuations in the cross-country comparison of national incomes. The Atlas conversionfactor for any year is the average of a country’s exchange rate(or alternative conversion factor) for that year and its exchangerates for the two preceding years, adjusted for the differencebetween the rate of inflation in the country and that in Japan,the United Kingdom, the United States, and the Euro Zone. Acountry’s inflation rate is measured by the change in its GDPdeflator. The inflation rate for Japan, the United Kingdom, theUnited States, and the Euro Zone, representing internationalinflation, is measured by the change in the SDR deflator. (Spe-cial drawing rights, or SDRs, are the IMF’s unit of account.)The SDR deflator is calculated as a weighted average of thethese countries’ GDP deflators in SDR terms, the weights beingthe amount of each country’s currency in one SDR unit.Weights vary over time because both the composition of theSDR and the relative exchange rates for each currency change.The SDR deflator is calculated in SDR terms first and thenconverted to U.S. dollars using the SDR to dollar Atlas conver-sion factor. The Atlas conversion factor is then applied to acountry’s GNI. The resulting GNI in U.S. dollars is divided bythe midyear population to derive GNI per capita.
When official exchange rates are deemed to be unreliable orunrepresentative of the effective exchange rate during a period,an alternative estimate of the exchange rate is used in the Atlasformula (see below).
The following formulas describe the calculation of the Atlasconversion factor for year t :
and the calculation of GNI per capita in U.S. dollars for year t:
Y$t = (Yt /Nt)/e*
t
where et* is the Atlas conversion factor (national currency tothe U.S. dollar) for year t, et is the average annual exchange rate(national currency to the U.S. dollar) for year t, pt is the GDPdeflator for year t, pt
S$ is the SDR deflator in U.S. dollar termsfor year t, Yt
$ is the Atlas GNI per capita in U.S. dollars in yeart, Yt is current GNI (local currency) for year t, and Nt is themidyear population for year t.
Alternative conversion factorsThe World Bank systematically assesses the appropriateness ofofficial exchange rates as conversion factors. An alternativeconversion factor is used when the official exchange rate isjudged to diverge by an exceptionally large margin from therate effectively applied to domestic transactions of foreign cur-rencies and traded products. This applies to only a small num-ber of countries, as shown in Primary data documentationtable in World Development Indicators 2004. Alternative con-version factors are used in the Atlas methodology and else-where in the Selected World Development Indicators as single-year conversion factors.
e ep
p
p
pe
p
p
p
pet t
t
t
tS
tS t
t
t
tS
tS t
* =
+
+
−− −
−− −
1
3 22 2
11 1
$
$
$
$
Selected world development indicators 271
16_WDR_SWDI.qxd 8/24/04 3:26 PM Page 271

16_WDR_SWDI.qxd 8/24/04 3:26 PM Page 272