A Benefit-Cost Analysis of a Worksite Nurse Practitioner ... · A Benefit-Cost Analysis of a...
21
A Benefit-Cost Analysis of a Worksite Nurse Practitioner Program: First Impressions David Chenoweth, PhD, FAWHP Nanette Martin, RN, FNP Jared Pankowski, MSEd Lawrence W. Raymond, MD, ScM From Chenoweth & Associates, Inc. and the Department of Health Education and Promotion, East Carolina University, Greenville, NC 27858 and the Division of Corporate Health and Department of Family M edicine, Carolinas HealthCare System, PO Box 32861, Charlotte, NC 28232 and the University of North Carolina at Chapel Hill, NC 27599 Address Correspondence to: David Chenoweth, Ph.D. Chenoweth & Associates, Inc. 128 St. Andrews Circle New Bern, NC 28562-2907 * Title Page (include all author information)
Transcript of A Benefit-Cost Analysis of a Worksite Nurse Practitioner ... · A Benefit-Cost Analysis of a...
A Benefit-Cost Analysis of a Worksite Nurse Practitioner
Program: First Impressions
David Chenoweth, PhD, FAWHP
Nanette Martin, RN, FNP
Jared Pankowski, MSEd
Lawrence W. Raymond, MD, ScM
From Chenoweth & Associates, Inc. and the Department of Health Education and
Promotion, East Carolina University, Greenville, NC 27858 and the Division of
Corporate Health and Department of Family Medicine, Carolinas HealthCare System, PO
Box 32861, Charlotte, NC 28232 and the University of North Carolina at Chapel Hill,
NC 27599
Address Correspondence to:
David Chenoweth, Ph.D.
Chenoweth & Associates, Inc.
128 St. Andrews Circle
New Bern, NC 28562-2907
* Title Page (include all author information)

Clinical Significance A nurse practitioner at the worksite can provide valuable health care services to enhance the health status of employees; in addition such an initiative also enhances the overall effectiveness of clinic-based health care services.
Clinical Significance
1
A Benefit-Cost Analysis of a Worksite Nurse Practitioner Program: First
Impressions
Objective: This study aimed to assess the initial impact of an on-site Nurse Practitioner (NP) initiative upon the health
care costs (HCC) among 4,284 employees and their dependents. Methods: The authors analyzed HCC by two methods.
First, they compared annualized actual values for the first six months of the start-up year (2004) with those projected for
2004 on the basis of claims paid in 2002 and 2003. Both aggregate and per-individual HCC were used as the basis for
comparison. The difference in HCC between projected and observed values for 2004 was defined as the benefit of the NP
program. In a second analysis, HCC were calculated using 2003 paid claims for Major Diagnostic Categories (MDC).
These HCC were compared with those which would have been incurred, had off-site care been utilized for the
(annualized) number of such patients cared for by the NP in 2004, with the same MDC. The cost of the NP program was
used as the denominator in calculating the benefit-to-cost ratio, using the savings in HCC estimated by the two above
methods. Results: Annualized cost of the NP program was $82, 716. Savings in HCC using the first method were
$1,313,756 per year, yielding a benefit-to-cost ratio of 15 to 1. Using the MDC analysis, the ratio was 2.4 to 1. This
difference in ratios between the two estimates may partly be attributable to effects of other initiatives, such as the wellness
program and the Nurse Health Line. The latter was begun 10 weeks prior to the NP program, is available at all times,
and is intended to minimize the need for workers and families to seek high-cost care at hospital emergency departments.
Conclusions: The first six months of a new NP initiative yielded substantial reductions in HCC which warrant further
analysis over longer periods of observation. However, the initial estimates may understate the aggregate value of the
program since it may also reduce on-site injury and illness patterns and improve productivity, end-points which were not
assessed in this initial snapshot (J Occup Environ Med 2005; 47:000-000)
Abbre viations: BP: arterial blood pressure C&A: Chenoweth & Associates CHS: Carolinas HealthCare System MDC: Major Diagnostic Category NP: Nurse Practitioner Key Words: Health care costs; Nurse practitioners; Mid-level providers; worksite clinics
* Manuscript (All Manuscript Text Pages, including, References a
2
Running Title: Worksite Nurse Practitioner
With the advent of higher medical care costs and productivity concerns increasing at more worksites in
the past decade, a growing number of companies have developed in-house medical clinics with occupational
health nurses, nurse practitioners, and other allied health professionals. These clinics exist in both mid-sized and
large organizations. According to some of these companies, on-site medical clinics make sense to them in terms
of both cost-containment and quality of health care provided to their employees.1 For example, an external audit
of one company’s on-site clinics found that employees used fewer outpatient and inpatient services when
adjusted by age, gender, and other demographics, than their peers in the community. Moreover, the company’s
database showed the costs to run the clinic are significantly less than what the health plan would have been
paying if employees were to have used community health care providers.2 Similarly, other organizations report
their health care costs have risen just 6% annually over the past four years, translating into corporate health care
spending that is 17% less than industry-related averages; another organization reported its on-site clinics saves
the company more than one million dollars per year.3
In early 2004, officials of a southeastern US industrial metal/plastics manufacturing firm and Carolinas
Healthcare System (CHS) engaged in a contract to offer nurse practitioner (NP) services at the firm’s (1)
administrative, (2) plastics, and (3) foundry locations. On June 17, 2004, a nurse practitioner was hired by CHS
and placed at the firm to begin her official duties. The NP’s official workload was distributed as follows:
• 18 hours per week devoted to plastics division employees
• 18 hours per week devoted to foundry division employees
• 4 hours per week devoted to administrative division employees
The primary goal of the NP is to provide primary care services to employees in a timely and cost-
efficient manner. The scope of her services includes writing prescriptions, administering medications, and
3
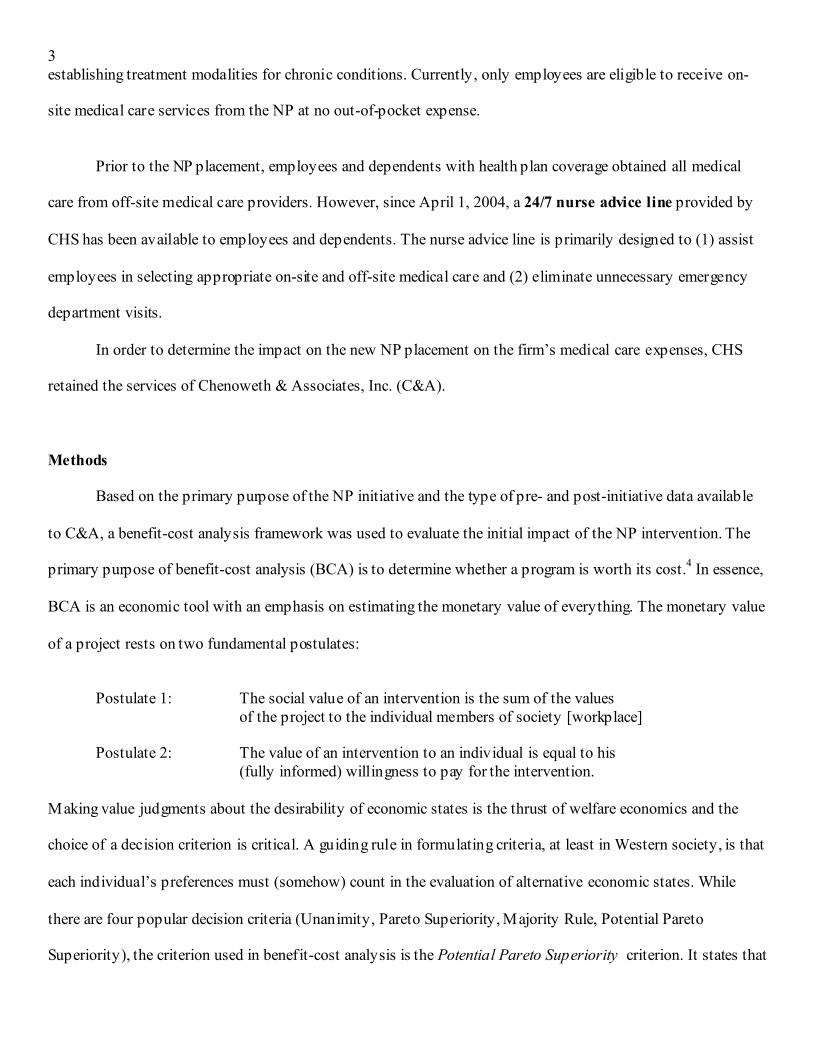
establishing treatment modalities for chronic conditions. Currently, only employees are eligible to receive on-
site medical care services from the NP at no out-of-pocket expense.
Prior to the NP placement, employees and dependents with health plan coverage obtained all medical
care from off-site medical care providers. However, since April 1, 2004, a 24/7 nurse advice line provided by
CHS has been available to employees and dependents. The nurse advice line is primarily designed to (1) assist
employees in selecting appropriate on-site and off-site medical care and (2) eliminate unnecessary emergency
department visits.
In order to determine the impact on the new NP placement on the firm’s medical care expenses, CHS
retained the services of Chenoweth & Associates, Inc. (C&A).
Methods
Based on the primary purpose of the NP initiative and the type of pre- and post-initiative data available
to C&A, a benefit-cost analysis framework was used to evaluate the initial impact of the NP intervention. The
primary purpose of benefit-cost analysis (BCA) is to determine whether a program is worth its cost.4 In essence,
BCA is an economic tool with an emphasis on estimating the monetary value of everything. The monetary value
of a project rests on two fundamental postulates:
Postulate 1: The social value of an intervention is the sum of the values of the project to the individual members of society [workplace] Postulate 2: The value of an intervention to an individual is equal to his (fully informed) willingness to pay for the intervention. Making value judgments about the desirability of economic states is the thrust of welfare economics and the
choice of a decision criterion is critical. A guiding rule in formulating criteria, at least in Western society, is that
each individual’s preferences must (somehow) count in the evaluation of alternative economic states. While
there are four popular decision criteria (Unanimity, Pareto Superiority, Majority Rule, Potential Pareto
Superiority), the criterion used in benefit-cost analysis is the Potential Pareto Superiority criterion. It states that
4
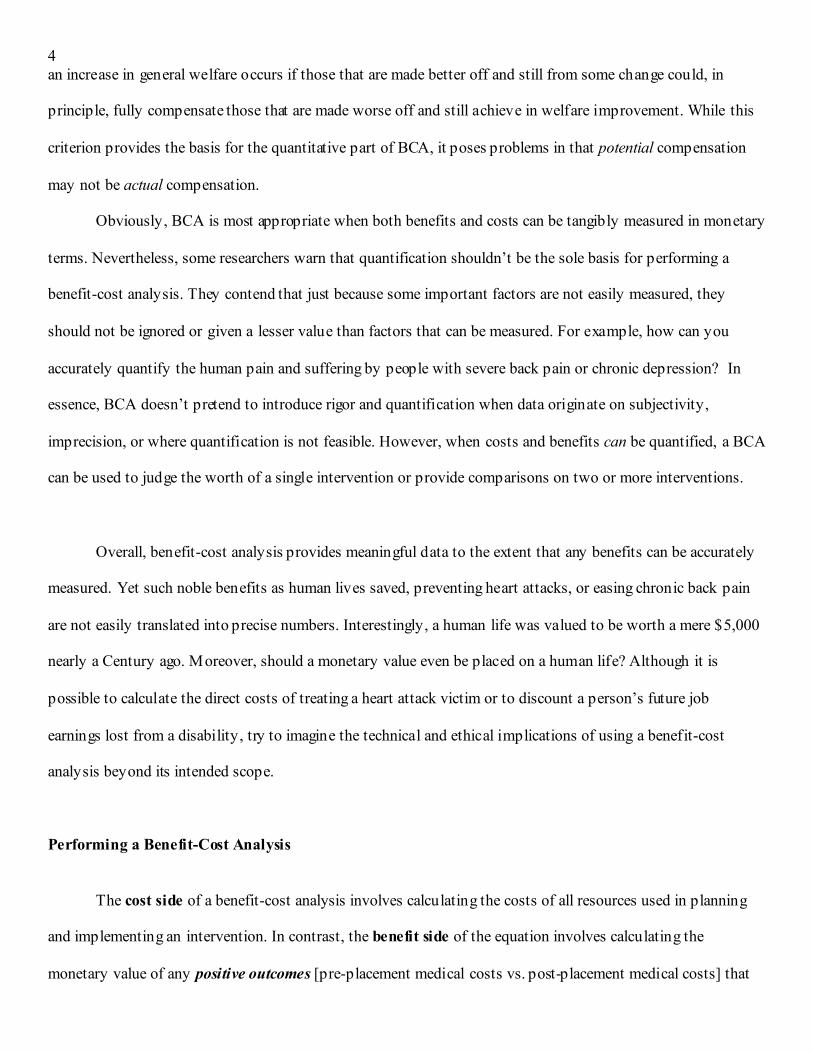
an increase in general welfare occurs if those that are made better off and still from some change could, in
principle, fully compensate those that are made worse off and still achieve in welfare improvement. While this
criterion provides the basis for the quantitative part of BCA, it poses problems in that potential compensation
may not be actual compensation.
Obviously, BCA is most appropriate when both benefits and costs can be tangibly measured in monetary
terms. Nevertheless, some researchers warn that quantification shouldn’t be the sole basis for performing a
benefit-cost analysis. They contend that just because some important factors are not easily measured, they
should not be ignored or given a lesser value than factors that can be measured. For example, how can you
accurately quantify the human pain and suffering by people with severe back pain or chronic depression? In
essence, BCA doesn’t pretend to introduce rigor and quantification when data originate on subjectivity,
imprecision, or where quantification is not feasible. However, when costs and benefits can be quantified, a BCA
can be used to judge the worth of a single intervention or provide comparisons on two or more interventions.
Overall, benefit-cost analysis provides meaningful data to the extent that any benefits can be accurately
measured. Yet such noble benefits as human lives saved, preventing heart attacks, or easing chronic back pain
are not easily translated into precise numbers. Interestingly, a human life was valued to be worth a mere $5,000
nearly a Century ago. Moreover, should a monetary value even be placed on a human life? Although it is
possible to calculate the direct costs of treating a heart attack victim or to discount a person’s future job
earnings lost from a disability, try to imagine the technical and ethical implications of using a benefit-cost
analysis beyond its intended scope.
Performing a Benefit-Cost Analysis
The cost side of a benefit-cost analysis involves calculating the costs of all resources used in planning
and implementing an intervention. In contrast, the benefit side of the equation involves calculating the
monetary value of any positive outcomes [pre-placement medical costs vs. post-placement medical costs] that
5
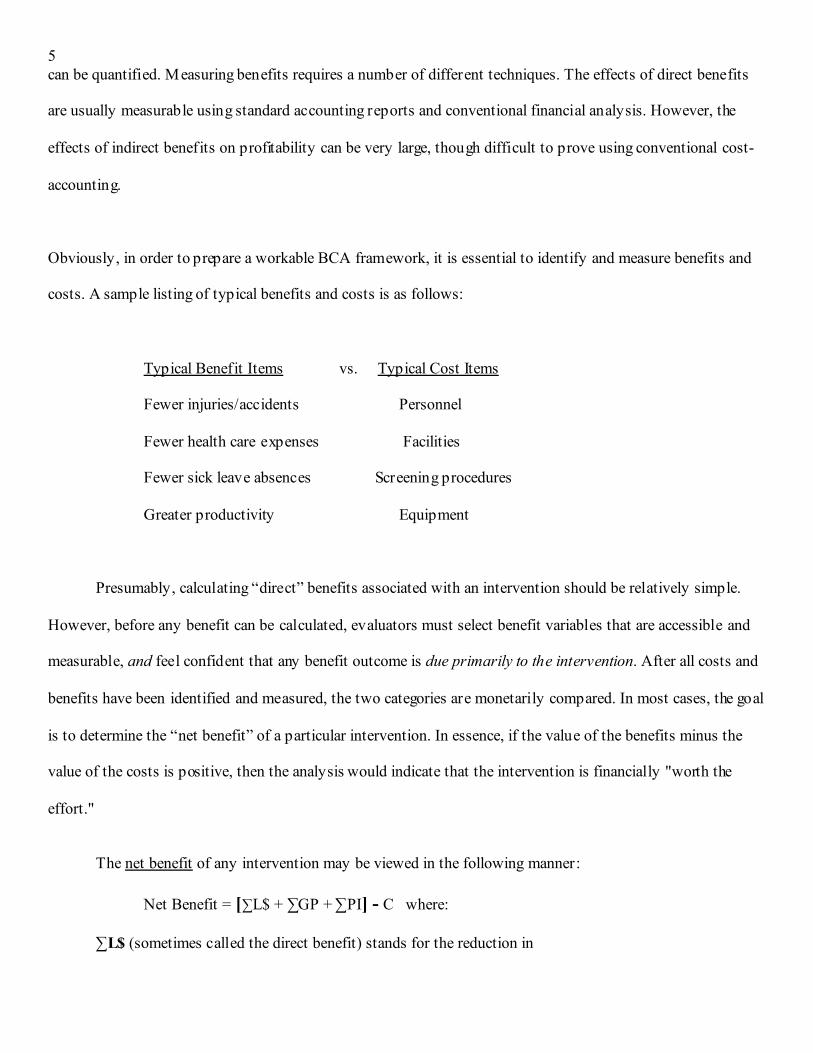
can be quantified. Measuring benefits requires a number of different techniques. The effects of direct benefits
are usually measurable using standard accounting reports and conventional financial analysis. However, the
effects of indirect benefits on profitability can be very large, though difficult to prove using conventional cost-
accounting.
Obviously, in order to prepare a workable BCA framework, it is essential to identify and measure benefits and
costs. A sample listing of typical benefits and costs is as follows:
Typical Benefit Items vs. Typical Cost Items
Fewer injuries/accidents Personnel
Fewer health care expenses Facilities
Fewer sick leave absences Screening procedures
Greater productivity Equipment
Presumably, calculating “direct” benefits associated with an intervention should be relatively simple.
However, before any benefit can be calculated, evaluators must select benefit variables that are accessible and
measurable, and feel confident that any benefit outcome is due primarily to the intervention. After all costs and
benefits have been identified and measured, the two categories are monetarily compared. In most cases, the goal
is to determine the “net benefit” of a particular intervention. In essence, if the value of the benefits minus the
value of the costs is positive, then the analysis would indicate that the intervention is financially "worth the
effort."
The net benefit of any intervention may be viewed in the following manner:
Net Benefit = [∑L$ + ∑GP + ∑PI] - C where:
∑L$ (sometimes called the direct benefit) stands for the reduction in
6
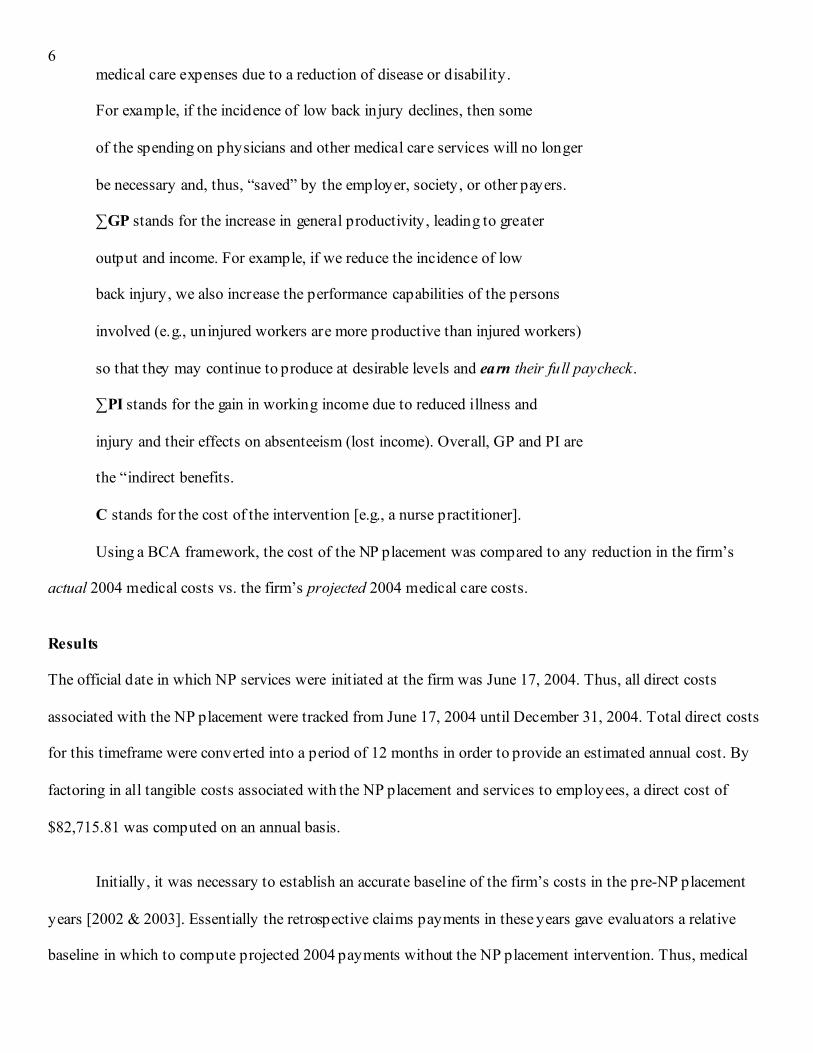
medical care expenses due to a reduction of disease or disability.
For example, if the incidence of low back injury declines, then some
of the spending on physicians and other medical care services will no longer
be necessary and, thus, “saved” by the employer, society, or other payers.
∑GP stands for the increase in general productivity, leading to greater
output and income. For example, if we reduce the incidence of low
back injury, we also increase the performance capabilities of the persons
involved (e.g., uninjured workers are more productive than injured workers)
so that they may continue to produce at desirable levels and earn their full paycheck.
∑PI stands for the gain in working income due to reduced illness and
injury and their effects on absenteeism (lost income). Overall, GP and PI are
the “indirect benefits.
C stands for the cost of the intervention [e.g., a nurse practitioner].
Using a BCA framework, the cost of the NP placement was compared to any reduction in the firm’s
actual 2004 medical costs vs. the firm’s projected 2004 medical care costs.
Results The official date in which NP services were initiated at the firm was June 17, 2004. Thus, all direct costs
associated with the NP placement were tracked from June 17, 2004 until December 31, 2004. Total direct costs
for this timeframe were converted into a period of 12 months in order to provide an estimated annual cost. By
factoring in all tangible costs associated with the NP placement and services to employees, a direct cost of
$82,715.81 was computed on an annual basis.
Initially, it was necessary to establish an accurate baseline of the firm’s costs in the pre-NP placement
years [2002 & 2003]. Essentially the retrospective claims payments in these years gave evaluators a relative
baseline in which to compute projected 2004 payments without the NP placement intervention. Thus, medical

7
care claim charges and payment data for 2002 and 2003 were provided by the firm’s benefits department whom
previously obtained these data from United HealthCare (The firm’s health plan administrator in 2004). A review
of these pre-placement data revealed yearly comparisons as shown in table 1.
Table 1
Annual Claims, Charges, and Payments
Medical, Allied Health, and Pharmacy (Combined)
2002 2003 % Change Covered Employees/Dependents 4,463 4,480 +.004% # Claims (Gross) 22,743 26,178 + 15.1% Claims per capita 5.09 5.84 + 14.7% $ Charges (Gross) $ 9,768,888 $11,327,850 +15.9% Charges per capita $ 2,188 $ 2,528 +15.5% $ Paid (Gross) $ 5,496,850 $ 6,248,719 +13.7% $ Paid per capita $ 1,231 $1,394 +13.4% Per capita=per individual covered employee/dependent
Overall, table 1 shows substantial increases in both utilization and cost patterns despite virtually no
change in the number of covered lives. Although it is important to acknowledge total [gross] claims and
charges, evaluators chose to provide per capita distributions because they reflect measurable outcomes at the
individual level. By and large, there was very little difference between gross percentage changes vs. per capita
percentage differences from 2002 to 2003.
Once the preceding pre-NP placement utilization and cost patterns were quantified, evaluators
developed an inflation index [based on the 2002 and 2003 data] to estimate 2004 patterns without the services
of a nurse practitioner. The number of covered employees and dependents differed in the two pre-placement and
first intervention years. Thus, evaluators selected per capita percentage changes from 2002 to 2003 as a
representative inflation index to use in calculating 2004 utilization and cost projections. In applying per capita
8
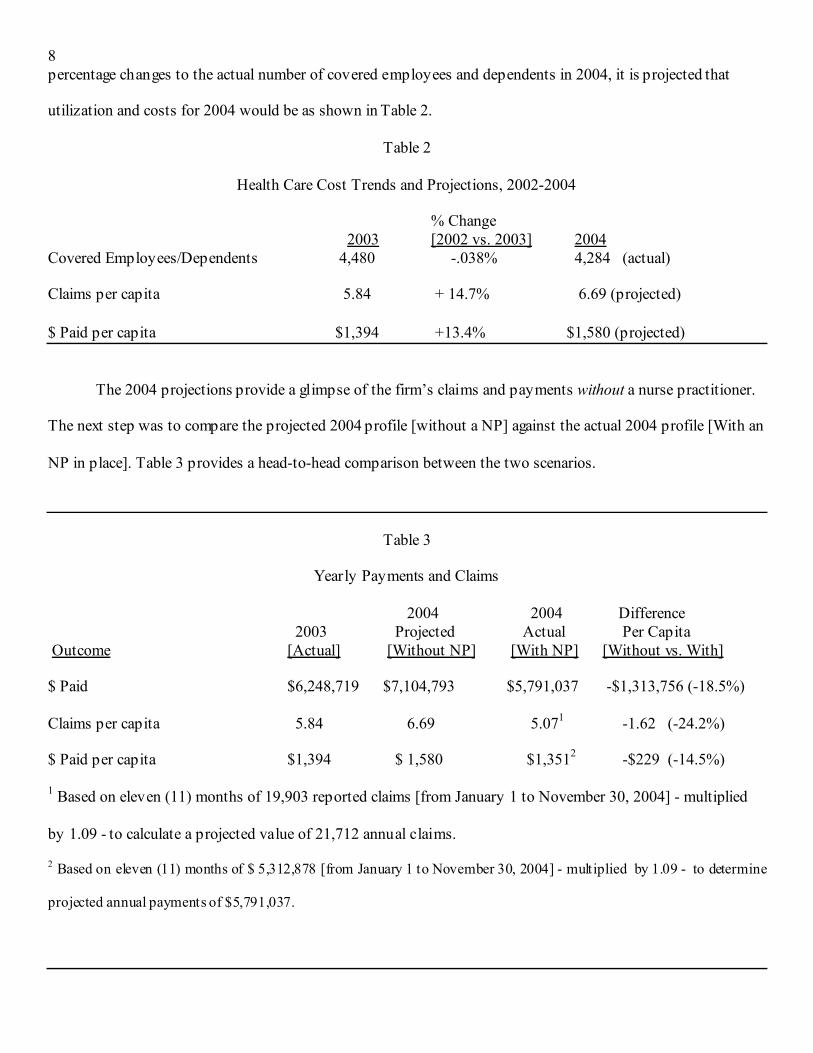
percentage changes to the actual number of covered employees and dependents in 2004, it is projected that
utilization and costs for 2004 would be as shown in Table 2.
Table 2
Health Care Cost Trends and Projections, 2002-2004
% Change 2003 [2002 vs. 2003] 2004 Covered Employees/Dependents 4,480 -.038% 4,284 (actual) Claims per capita 5.84 + 14.7% 6.69 (projected) $ Paid per capita $1,394 +13.4% $1,580 (projected) The 2004 projections provide a glimpse of the firm’s claims and payments without a nurse practitioner.
The next step was to compare the projected 2004 profile [without a NP] against the actual 2004 profile [With an
NP in place]. Table 3 provides a head-to-head comparison between the two scenarios.
Table 3
Yearly Payments and Claims
2004 2004 Difference 2003 Projected Actual Per Capita
Outcome [Actual] [Without NP] [With NP] [Without vs. With] $ Paid $6,248,719 $7,104,793 $5,791,037 -$1,313,756 (-18.5%)
Claims per capita 5.84 6.69 5.071 -1.62 (-24.2%)
$ Paid per capita $1,394 $ 1,580 $1,3512 -$229 (-14.5%)
1 Based on eleven (11) months of 19,903 reported claims [from January 1 to November 30, 2004] - multiplied
by 1.09 - to calculate a projected value of 21,712 annual claims.
2 Based on eleven (11) months of $ 5,312,878 [from January 1 to November 30, 2004] - multiplied by 1.09 - to determine
projected annual payments of $5,791,037.

9
Overall, the preceding data show projected 2004 outcomes [without NP] were considerably higher than
actual 2004 outcomes in all major categories. Percentage differences between the respective 2004 profiles are as
follows:
• Actual payments were 18.5 lower than the projected norm.
• Actual per capita claims were more than 24 % lower than the projected utilization norm
• Actual per capita payments were more than 14% lower than the projected payment norm
Projected vs Actual Cost Differences
Overall, a cost difference of $1,313,756 exists between the projected 2004 medical payments [without
the NP placement] vs. actual 2004 payments [with an NP]. Although it is possible to speculate that the
preceding cost-difference may be twice the listed amount – since the NP was in place only 6 months – it is
impossible to determine an actual annualized cost difference until an evaluation is conducted after the NP has
been in place for a full 12 months. Yet, this cost difference only reflects a direct cost difference tied exclusively
to medical care payments incurred in two different scenarios. Interestingly, the cost-difference does not factor in
other “hidden costs” such as lost productivity if employees would have to leave work to seek health care
services in off-site [community] health care settings. Nor does the cost difference factor in the number of lost
time absences avoided by employees when they [would presumably] come to work because they have on-site
health care services instead of staying home. These “hidden costs” have been studied by numerous
organizations over the past decade. For example, one organization surveyed employees using the on-site
medical clinic regarding: (1) whether they would have used an outside doctor if the corporate medical clinic
were not available, and (2) how many days per year they estimated that they came to work because there was an
on-site medical clinic when they would otherwise have stay at home. The results indicated that, on average,
employees who used the facility saved 3.3 days of absenteeism. In addition, nearly 70% of employees indicated
that they would have sought attention elsewhere, suggesting that the presence of an on-site medical center does
not induce demand.5
Benefits vs. Costs
10
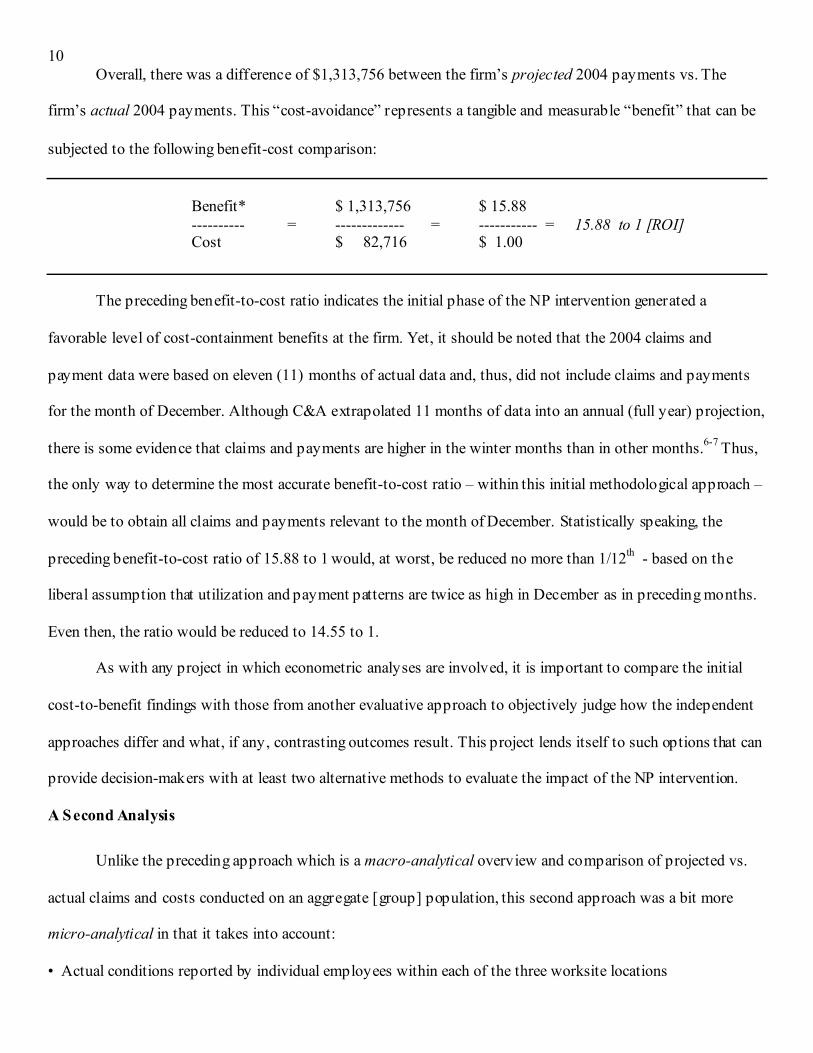
Overall, there was a difference of $1,313,756 between the firm’s projected 2004 payments vs. The
firm’s actual 2004 payments. This “cost-avoidance” represents a tangible and measurable “benefit” that can be
subjected to the following benefit-cost comparison:
Benefit* $ 1,313,756 $ 15.88 ---------- = ------------- = ----------- = 15.88 to 1 [ROI] Cost $ 82,716 $ 1.00
The preceding benefit-to-cost ratio indicates the initial phase of the NP intervention generated a
favorable level of cost-containment benefits at the firm. Yet, it should be noted that the 2004 claims and
payment data were based on eleven (11) months of actual data and, thus, did not include claims and payments
for the month of December. Although C&A extrapolated 11 months of data into an annual (full year) projection,
there is some evidence that claims and payments are higher in the winter months than in other months.6-7 Thus,
the only way to determine the most accurate benefit-to-cost ratio – within this initial methodological approach –
would be to obtain all claims and payments relevant to the month of December. Statistically speaking, the
preceding benefit-to-cost ratio of 15.88 to 1 would, at worst, be reduced no more than 1/12th - based on the
liberal assumption that utilization and payment patterns are twice as high in December as in preceding months.
Even then, the ratio would be reduced to 14.55 to 1.
As with any project in which econometric analyses are involved, it is important to compare the initial
cost-to-benefit findings with those from another evaluative approach to objectively judge how the independent
approaches differ and what, if any, contrasting outcomes result. This project lends itself to such options that can
provide decision-makers with at least two alternative methods to evaluate the impact of the NP intervention.
A Second Analysis
Unlike the preceding approach which is a macro-analytical overview and comparison of projected vs.
actual claims and costs conducted on an aggregate [group] population, this second approach was a bit more
micro-analytical in that it takes into account:
• Actual conditions reported by individual employees within each of the three worksite locations
11
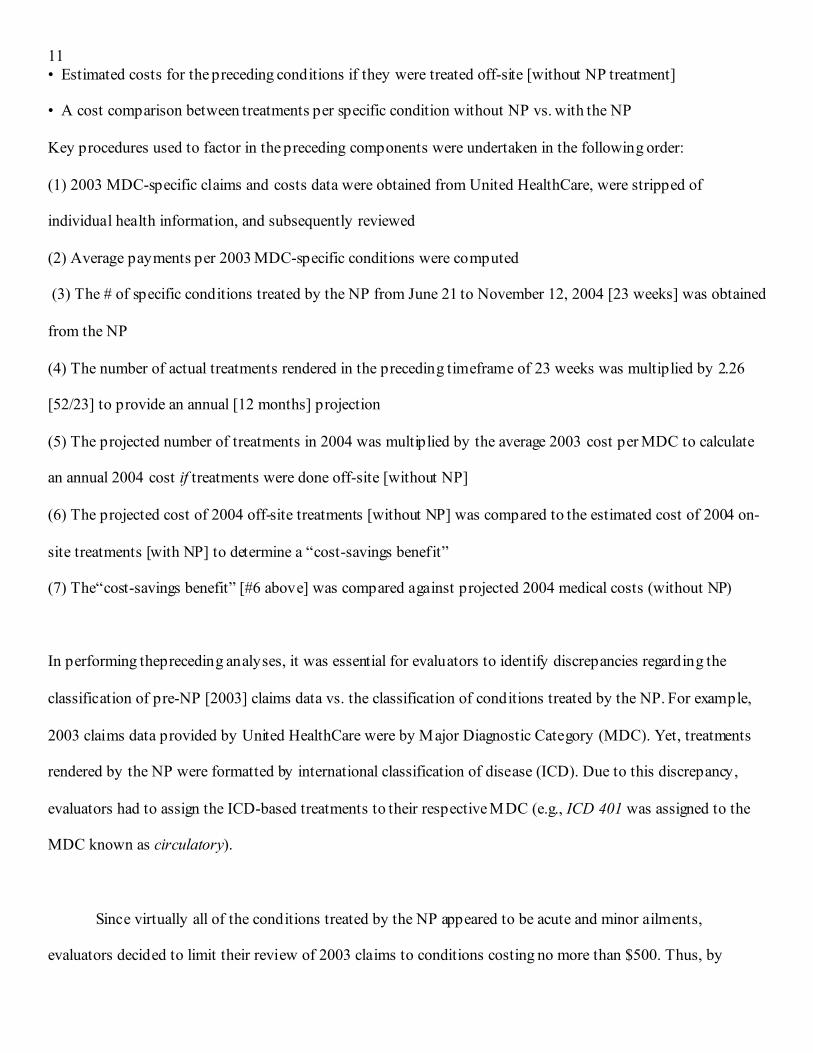
• Estimated costs for the preceding conditions if they were treated off-site [without NP treatment]
• A cost comparison between treatments per specific condition without NP vs. with the NP
Key procedures used to factor in the preceding components were undertaken in the following order:
(1) 2003 MDC-specific claims and costs data were obtained from United HealthCare, were stripped of
individual health information, and subsequently reviewed
(2) Average payments per 2003 MDC-specific conditions were computed
(3) The # of specific conditions treated by the NP from June 21 to November 12, 2004 [23 weeks] was obtained
from the NP
(4) The number of actual treatments rendered in the preceding timeframe of 23 weeks was multiplied by 2.26
[52/23] to provide an annual [12 months] projection
(5) The projected number of treatments in 2004 was multiplied by the average 2003 cost per MDC to calculate
an annual 2004 cost if treatments were done off-site [without NP]
(6) The projected cost of 2004 off-site treatments [without NP] was compared to the estimated cost of 2004 on-
site treatments [with NP] to determine a “cost-savings benefit”
(7) The“cost-savings benefit” [#6 above] was compared against projected 2004 medical costs (without NP)
In performing thepreceding analyses, it was essential for evaluators to identify discrepancies regarding the
classification of pre-NP [2003] claims data vs. the classification of conditions treated by the NP. For example,
2003 claims data provided by United HealthCare were by Major Diagnostic Category (MDC). Yet, treatments
rendered by the NP were formatted by international classification of disease (ICD). Due to this discrepancy,
evaluators had to assign the ICD-based treatments to their respective MDC (e.g., ICD 401 was assigned to the
MDC known as circulatory).
Since virtually all of the conditions treated by the NP appeared to be acute and minor ailments,
evaluators decided to limit their review of 2003 claims to conditions costing no more than $500. Thus, by

12
selecting relatively low cost claims [<$500], evaluators believed the average costs assigned to each MDC would
not be artificially inflated by a small percentage of excessively high cost claims [“outliers”]. In addition, only
the most common MDCs were included in this analysis. A review of claims data indicated that twelve (12)
different MDCs comprised over 90% of all conditions treated by the NP during the study period [June 17, 2004
to November 12, 2004.]. Table 4 shows a listing of the average payment and most common MDC conditions
treated by the NP during this timeframe, in addition to estimated payments that the firm would have borne in
2004 without the NP.
Table 4
Most Common MDCs, Average Payment per Claims, and
Approximate Cost-Savings with NP Treatment
Average Payment Estimated # Estimated
MDC per Claim (2003) Treatments (2004)4 Cost-savings5
Accid/injury/poisoning $ 111 63 $ 6,993
Circulatory $ 136 366 $49,776
Digestive $ 212 81 $17,172
Endocrine/metabolic $ 95 22 $ 2,090
F.I.H.S.1 $190 43 $ 8,170
Genito-urinary $112 34 $ 3,808
Infectious $ 69 137 $ 9,453
Musculo-skeletal $ 159 54 $ 8,586
Nervous2 $ 125 142 $17,750
Respiratory $ 135 251 $ 33,885
Skin/subcutaneous $ 195 131 $ 25,545
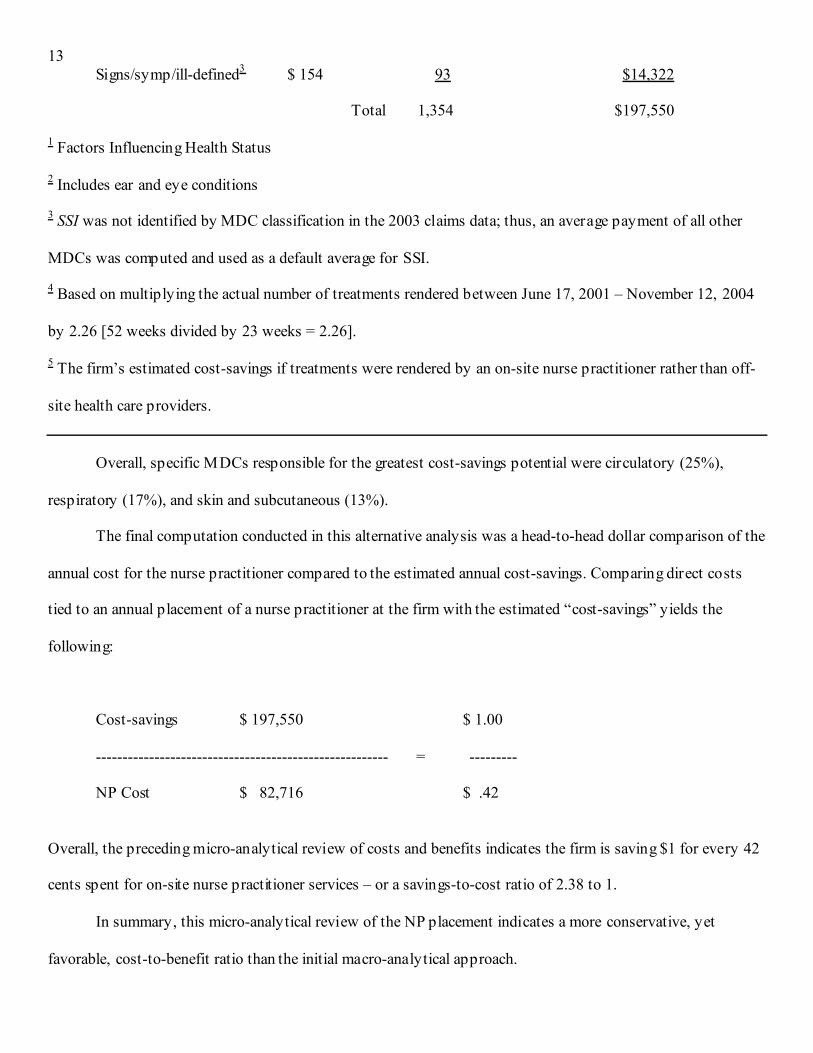
13
Signs/symp/ill-defined3 $ 154 93 $14,322
Total 1,354 $197,550
1 Factors Influencing Health Status
2 Includes ear and eye conditions
3 SSI was not identified by MDC classification in the 2003 claims data; thus, an average payment of all other
MDCs was computed and used as a default average for SSI.
4 Based on multiplying the actual number of treatments rendered between June 17, 2001 – November 12, 2004
by 2.26 [52 weeks divided by 23 weeks = 2.26].
5 The firm’s estimated cost-savings if treatments were rendered by an on-site nurse practitioner rather than off-
site health care providers.
Overall, specific MDCs responsible for the greatest cost-savings potential were circulatory (25%),
respiratory (17%), and skin and subcutaneous (13%).
The final computation conducted in this alternative analysis was a head-to-head dollar comparison of the
annual cost for the nurse practitioner compared to the estimated annual cost-savings. Comparing direct costs
tied to an annual placement of a nurse practitioner at the firm with the estimated “cost-savings” yields the
following:
Cost-savings $ 197,550 $ 1.00
------------------------------------------------------- = ---------
NP Cost $ 82,716 $ .42
Overall, the preceding micro-analytical review of costs and benefits indicates the firm is saving $1 for every 42
cents spent for on-site nurse practitioner services – or a savings-to-cost ratio of 2.38 to 1.
In summary, this micro-analytical review of the NP placement indicates a more conservative, yet
favorable, cost-to-benefit ratio than the initial macro-analytical approach.

14
Overall, the financial comparisons described and illustrated on the preceding pages reveal the following
benefit-to-cost ratios and return-on-investment percentages:
Benefit $ Cost $ R.O.I. Median ROI
Methodology # 1 $ 1,313,756 $ 82,716 15.88 to 1 -------------- ---------- ----------- 9.13 to 1 Methodology # 2 $ 197,550 $ 82,716 2.38 to 1 At a minimum, the firm’s on-site nurse practitioner generates nearly 2.4 times more than costs. In addition,
there has been a steady increase in the number of monthly on-site treatments since the inception of the NP
placement. Subsequent evaluations are planned in 2005 and 2006 to determine if this initial trend is sustained
and, if so, what impact it may have on the organization’s medical care costs.
Discussion
The quest for control of health care costs and quality is leading some employers to establish on-site
clinics and other initiatives that employ health professionals. A recent editorial in this Journal8 estimated that
lost work-days for chronic medical conditions cost United States employers 73 billion dollars per year, in
addition to costs of lost productivity as well as the out-of-pocket medical expenses which they bear. Among
strategies to cope with these increasing costs, a growing number of companies have introduced in-house
medical clinics staffed by full-time nurse practitioners, occupational health nurses, physicians and other health
professionals. However, there is little published information on the balance between the cost of such initiatives
and their benefits. Our analysis focused on the initial benefit-to-cost experience of a pilot program in which a
NP was recruited to provide on-site care for minor illnesses, as well as improve management of chronic medical
conditions of “1200” employees and “3084” dependents whose health insurance is subsidized by a three-site
plastic pipe and foundry company. The new program shows promise for yielding positive monetary results. The
size of the initial cost saving is sensitive to the method of analysis employed. That is, the annualized savings in
HCC was $1,313,756, using the projected HCC based on the actual ones for 2002 and 2003. A smaller savings
estimate ($197,550 per year) resulted from an analysis based on Major Diagnostic Categories and their mean
15
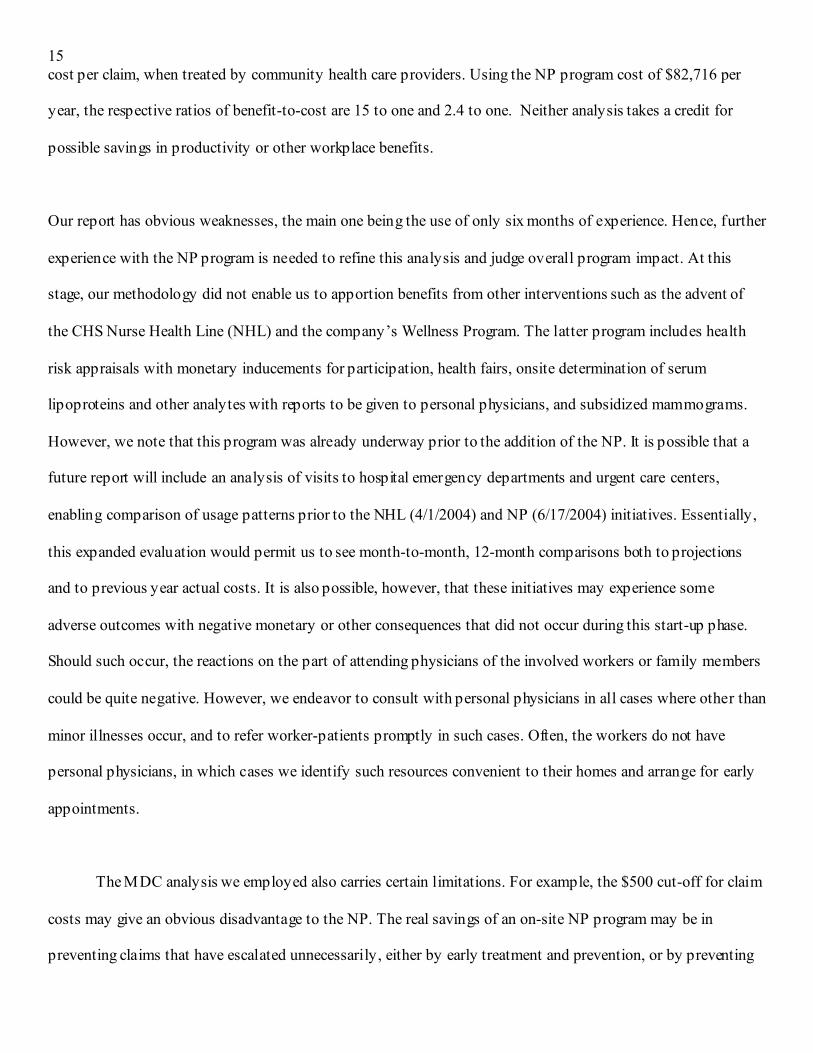
cost per claim, when treated by community health care providers. Using the NP program cost of $82,716 per
year, the respective ratios of benefit-to-cost are 15 to one and 2.4 to one. Neither analysis takes a credit for
possible savings in productivity or other workplace benefits.
Our report has obvious weaknesses, the main one being the use of only six months of experience. Hence, further
experience with the NP program is needed to refine this analysis and judge overall program impact. At this
stage, our methodology did not enable us to apportion benefits from other interventions such as the advent of
the CHS Nurse Health Line (NHL) and the company’s Wellness Program. The latter program includes health
risk appraisals with monetary inducements for participation, health fairs, onsite determination of serum
lipoproteins and other analytes with reports to be given to personal physicians, and subsidized mammograms.
However, we note that this program was already underway prior to the addition of the NP. It is possible that a
future report will include an analysis of visits to hospital emergency departments and urgent care centers,
enabling comparison of usage patterns prior to the NHL (4/1/2004) and NP (6/17/2004) initiatives. Essentially,
this expanded evaluation would permit us to see month-to-month, 12-month comparisons both to projections
and to previous year actual costs. It is also possible, however, that these initiatives may experience some
adverse outcomes with negative monetary or other consequences that did not occur during this start-up phase.
Should such occur, the reactions on the part of attending physicians of the involved workers or family members
could be quite negative. However, we endeavor to consult with personal physicians in all cases where other than
minor illnesses occur, and to refer worker-patients promptly in such cases. Often, the workers do not have
personal physicians, in which cases we identify such resources convenient to their homes and arrange for early
appointments.
The MDC analysis we employed also carries certain limitations. For example, the $500 cut-off for claim
costs may give an obvious disadvantage to the NP. The real savings of an on-site NP program may be in
preventing claims that have escalated unnecessarily, either by early treatment and prevention, or by preventing

16
trips to a hospital emergency room. Furthermore, these small claims represented a small percentage of toal
costs, thus raising doubt if an on-site NP program would, in actuality and over time, be limited to only
impacting a small subset of total claims and costs.
As an additional limitation, our experience with the NP and NHL programs may lack general
applicability, being based in three urban North Carolina locations of a single company engaged in the foundry
and plastic business, and which had on-site Occupational Health Nurses at both of its manufacturing sites. Many
of the employees of the company live at substantial distances from the worksites, driving an hour or more each
way. At times, long working hours make it difficult for individual workers to access health care off-site. Our
findings may therefore not apply to other groups of workers with different logistics and personal habits. Other
employers will need to make careful assessments of the benefits and possible disadvantages of on-site programs
similar to the ones described herein.
From the perspective of health care organizations, it may seem counter-intuitive for such an entity to help
design and implement lower-cost options for delivering such care, as well as preventive medicine measures.
However, it strikes us as essential that those entrusted with the care of the community must support efforts to
improve such care and to optimize its benefit-to-cost function. And, to do so in measurable ways. CHS
therefore plans to continue its efforts to partner with employers in this regard, including optimizing the
deployment of NP, NHL and other health professionals at all sites where they practice their expertise.
References
1 Gemigni, J. (1998) Bringing the Doctor to the (Company) Door. Business & Health, May, 24-26.
2 Boost the Value of Your Medical Director. Business & Health, August, 1999, page 37.
3 Shook, D. (2002), There’s a Doctor in the House. BusinessWeek, December 16, 2002, page 8.
4 Cascio, W. (1987). Costing Human Resources; The Financial Impact of Behavior in Organizations. 2nd
Edition, Boston: PWS Kent Publishing Company.
17
5 Pachman, J. et al. (1996).The Hidden Savings of an On-Site Corporate Medical Center. Journal of
Occupational and Environmental Medicine, 38, 10, 1047-1048.
6 Mossad, S. (2002). Upper Respiratory Tract Infections – Definition and Prevalence. The Cleveland Clinic,
Cleveland, Ohio. [www.clevelandclinicmeded.com]
7 Nease, D, Volk, R. and Cass, A. (1999). Does the Severity of Mood and Anxiety Symptoms Predict Health
Care Utilization? Journal of Family Practice. 48, 10, 769-777.
8 Brandt-Rauf P, Burton WN, McCunney RJ. (2001) Health, productivity, and occupational medicine. [Editorial]. Journal of Occupational and Environmental Medicine;43:1.

June 1, 2005 Marjory Spraycar Managing Editor Journal of Occupational & Environmental Medicine Dear Marjory: My co-authors and I are submitting the attached revised manuscript for consideration by the Journal of Occupational & Environmental Medicine. It is being submitted exclusively to JOEM and, thus, is not under review by any other journal. Thank you for your timely review and consideration. Sincerely, Dave David Chenoweth, Ph.D. (corresponding author)
* Cover Letter
Thank you. Your comments are excellent. We have addressed
and/or incorporated them into the revised version of the
manuscript.
A Benefit-Cost Analysis of a Worksite Nurse Practitioner
Program: First Impressions
David Chenoweth, PhD, FAWHP
Chenoweth & Associates, Inc.
128 St. Andrews Circle
New Bern, NC 28562-2907
* Response to Reviewers