A Bayesian phylogenetic method to estimate unknown sequence ages
30
and Evolution. All rights reserved. For permissions, please e-mail: [email protected] The Author 2010. Published by Oxford University Press on behalf of the Society for Molecular Biology Title: A Bayesian phylogenetic method to estimate unknown sequence ages For consideration as a Research Article Beth Shapiro 1 , Simon Y. W. Ho 2 , Alexei J. Drummond 3 , Marc A. Suchard 4 , Oliver G. Pybus 5 and Andrew Rambaut 6,7 1. Department of Biology, The Pennsylvania State University, University Park, PA 16801 USA 2. School of Biological Sciences, University of Sydney, Sydney NSW 2006, Australia 3. Department of Computer Science and Bioinformatics Institute, University of Auckland, Auckland, New Zealand 4. Departments of Biomathematics, Biostatistics and Human Genetics, University of California, Los Angeles, CA, 90095, United States 5. Department of Zoology, University of Oxford, Oxford OX1 3PS, United Kingdom 6. Institute of Evolutionary Biology, University of Edinburgh, Edinburgh, EH9 3JT, United Kingdom 7. Fogarty International Center, National Institutes of Health, Bethesda, MD, USA Author for correspondence: Beth Shapiro Tel: +1 814 863 9178 [email protected] MBE Advance Access published October 1, 2010
Transcript of A Bayesian phylogenetic method to estimate unknown sequence ages

and Evolution. All rights reserved. For permissions, please e-mail: [email protected] The Author 2010. Published by Oxford University Press on behalf of the Society for Molecular Biology
Title: A Bayesian phylogenetic method to estimate unknown sequence ages
For consideration as a Research Article
Beth Shapiro1, Simon Y. W. Ho2, Alexei J. Drummond3, Marc A. Suchard4 , Oliver G.
Pybus5 and Andrew Rambaut6,7
1. Department of Biology, The Pennsylvania State University, University Park, PA
16801 USA
2. School of Biological Sciences, University of Sydney, Sydney NSW 2006,
Australia
3. Department of Computer Science and Bioinformatics Institute, University of
Auckland, Auckland, New Zealand
4. Departments of Biomathematics, Biostatistics and Human Genetics, University of
California, Los Angeles, CA, 90095, United States
5. Department of Zoology, University of Oxford, Oxford OX1 3PS, United Kingdom
6. Institute of Evolutionary Biology, University of Edinburgh, Edinburgh, EH9 3JT,
United Kingdom
7. Fogarty International Center, National Institutes of Health, Bethesda, MD, USA
Author for correspondence:
Beth Shapiro
Tel: +1 814 863 9178
MBE Advance Access published October 1, 2010
Keywords: heterochronous sequences, ancient DNA, molecular clock, viral evolution,
measurably evolving populations
Running head: Bayesian estimation of unknown sequence ages
Abstract
Heterochronous data sets comprise molecular sequences sampled at different points
in time. If the temporal range of the sampled sequences is large relative to the rate of
mutation, the sampling times can directly calibrate evolutionary rates to calendar
time. Here, we extend this calibration process to provide a full probabilistic method
that utilizes temporal information in heterochronous data sets to estimate sampling
times (leaf-ages) for sequenced for which this information unavailable. Our method
is similar to relaxing the constraints of the molecular clock on specific lineages within
a phylogenetic tree. Using a combination of synthetic and empirical data sets, we
demonstrate that the method estimates leaf-ages reliably and accurately. Potential
applications of our approach include incorporating samples of uncertain or
radiocarbon-infinite age into ancient DNA analyses, evaluating the temporal signal in
a particular sequence or data set, and exploring the reliability of sequence ages that
are somehow contentious.

Introduction:
The incorporation of temporal information into molecular phylogenetic and genealogic
analyses means that evolutionary processes can be investigated on a natural timescale of
years, centuries or millennia. This is commonly achieved by one of two methods. If the
sequences of interest are sampled at effectively the same time (‘isochronous’ data) then an
evolutionary timescale can be calibrated by assigning a date, or date range, to one or more
divergence events in the tree. If data sets comprise sequences sampled at different time
points (‘heterochronous’ data), these can be calibrated by fixing the age of each sequence
(the leaves of the tree) to the known age of the specimen from which the sequence was
amplified (e.g. Rambaut 2000). Both approaches result in an estimated rate of evolution
and a corresponding phylogenetic timescale, which can then be used to test hypotheses
about the timing and nature of evolutionary and demographic events, such as dates of
divergence among lineages, or changes in population size or structure (Drummond et al.
2003).
The two major sources of heterochronous sequence data are rapidly-evolving RNA and
DNA viruses, whose high mutation rates enable the generation of phylogenetically-
informative sequence diversity within historical time-frames (Drummond, Pybus,
Rambaut 2003), and ancient DNA data isolated from preserved remains (Hofreiter et al.
2001b) that may be up to several hundred thousands of years old (Willerslev et al. 2007).
In both cases, the period over which sequences are isolated is sufficiently long relative to
the mutation rate to allow estimation of the evolutionary rate (Drummond et al. 2003).
The temporal information associated with RNA virus sequences typically represents the
day, month, or year of sample isolation and/or storage (Taubenberger et al. 1997).
Heterochronous viral data sets have been used to estimate rates of mutation for specific
viruses (Jenkins et al. 2002), to investigate rates of evolution and adaptation within hosts
(e.g. Lemey, Rambaut, Pybus 2006; Lemey et al. 2007), and to infer epidemic dynamics
within and between populations of susceptible hosts (Rambaut 2000; Pybus, Rambaut
2009).
For ancient DNA data sets, ages of the genetic sequences are most often approximated
using radiocarbon dates that are estimated from the same specimens from which the DNA
sequences are amplified (e.g. Shapiro et al. 2004; Bunce et al. 2009; Campos et al. 2010).
Dates from material associated with stratigraphic context have also been used as
calibrating information, however (e.g. Lambert et al. 2002; Valdiosera et al. 2008). For
ancient DNA sequences, leaf-ages are normally assigned some number of thousands of
years before the present (ka BP). Molecular clock analyses of these data have been used to
identify periods of population turnover (e.g. Hadly et al. 1998; Barnes et al. 2002;
Hofreiter et al. 2004) to estimate divergence times within species (e.g. Shapiro et al. 2004;
Debruyne et al. 2008; Stiller et al. 2010) and to correlate population-level changes in
genetic diversity with external events, such as climate change (e.g. Hadly et al. 2004;
Chan, Anderson, Hadly 2006; Barnett et al. 2009; Campos et al. 2010). For example, there
has been considerable debate about the relative roles of climate change associated with the
last glacial maximum (LGM; ca 21 ka BP) and the appearance and increase in human
populations (ca 14 ka BP) in the recent disappearance of the North American megafauna
(Alroy 2001; Barnosky et al. 2004; Stuart et al. 2004). Heterochronous data sets
comprising sequences directly dated to before, during and after these events allow explicit
tests of these alternative hypotheses.
Despite significant technical and chemical pre-treatment advances in Accelerator Mass
Spectrometry (AMS) radiocarbon dating (Bronk Ramsey et al. 2004), the oldest samples
for which finite radiocarbon dates can be routinely generated are around 50-55 ka BP (e.g.
Barnett et al. 2009). The period 0-55 ka BP includes several specific, large-scale
environmental events that are likely to have affected the distribution and abundance of
plant and animal species. However, there are a number of circumstances under which the
leaf ages of ancient DNA or viral sequences may be unknown, or at best, highly uncertain.
First, ancient mitochondrial DNA sequences are routinely amplified from permafrost-
preserved specimens older than the 50-55 ka BP radiocarbon limit. For example, nearly
100 of the bison sequences reported in Shapiro et al (2004) were too old to be assigned
finite radiocarbon ages, and ancient DNA sequences have been reported that are perhaps
as old as 800 ka BP (Willerslev et al 2007). In this case only censored temporal
information is often available (i.e. age > 55ka BP). Second, ancient DNA samples are
routinely recovered from situations in which the stratigraphic context provides calibrating
information (e.g. Lambert et al. 2002; Coolen, Overmann 2007; Valdiosera et al. 2008) but
only within a wide range of uncertainty, such that assigning a specific mean or median
date to such sequences is statistically inappropriate (Ho, Phillips 2009). Third, for rapidly
evolving viral sequences, the date of sampling may simply be unknown due to the loss or
absence of accurate archival information. Even if the viral sampling date is known to the
nearest year, it may be important to know the isolation date more accurately. Fourth, it
may also be important to independently verify posited sampling dates due to their extreme
age (Zhu et al. 1998; Taubenberger et al. 2005; Worobey et al. 2008) or because they are

in some way contentious (Sonoda et al. 2000; Coolen, Overmann 2007). Since frozen viral
isolates do not accumulate mutations whilst in storage, a leaf-dating method also has the
potential to identify transmitting viruses that, after a period of storage, have been released
into the environment (Worobey 2008).
Despite these obvious problems, few studies have attempted to estimate the unknown age
or sampling date of heterochronous sequences using molecular clock methods, and none
have investigated the statistical reliability of such methods. Perhaps the most similar
analysis was that undertaken by Korber et al. (1998), who validated their molecular clock
of HIV-1 by testing whether it could accurately predict the date of an ‘old’ isolate sampled
in 1959. However, in that case the approach consists of the visual inspection of the fit to a
linear regression of viral sampling date against genetic distance rather than a statistical
analysis or estimation procedure.
Here, we investigate a statistical framework for the estimation of leaf-dates using
molecular clock models when the sample age or isolation date is either unknown or highly
uncertain. Following Drummond (2002) we estimate the age of individual DNA
sequences using the temporal calibrating information from other sequences in the data set.
Methodologically, the leaf-dating method is similar to relaxing the constraints of the
molecular clock on specific lineages within a phylogenetic tree. Using a combination of
simulations and empirical analyses, we show that leaf-ages can be estimated reliably and
accurately using our approach. While the analyses presented here only perform leaf-dating
on one sequence within any given data set, the method can be readily extended to multiple
sequences within the same analysis.

Methods
We developed and implemented a leaf-dating method that estimates the age or date of
isolation of individual sequences within the Bayesian Markov chain Monte Carlo
(MCMC) framework provided by the software package BEAST (Drummond, Rambaut
2007). BEAST allows dates/times to be specified for each sequence in a sample alignment
and uses this information to estimate a timescale for the evolutionary history of the
sample. The models implemented in BEAST accomplish this by fixing the external nodes
of the tree (the leaves) to the specified dates and then sampling the times of the internal
nodes of the tree from their posterior probability distribution using MCMC. The length of
each branch in units of time is mapped to an expected number of substitutions per site
using a vector of molecular evolutionary rates. The simplest model assigns the same single
rate to every branch (the strict molecular clock model). BEAST also implements methods
that allow the evolutionary rate to vary among branches (relaxed molecular clock models)
such that the vector of rates follows a specified parametric distribution (Drummond et al.
2006). Under these models, BEAST can simultaneously infer the tree topology, the times
of the internal nodes, the rate of evolution and any parameters of the associated coalescent
and substitution models (Drummond et al. 2002). As is required in Bayesian inference, all
of these parameters are assigned one of a wide variety of possible prior probability
distributions. MCMC sampling is then used to obtain estimates of marginal posterior
probability distributions for any parameters of interest.
In previous molecular clock implementations all nodes in the tree are given dates/ages,
that is, internal nodes are treated as unknown parameters whilst the dates/ages of the tree
external nodes (leaves) are assumed to be known. To estimate the age of an individual
sequence, we extend the framework introduced above to estimate the time associated with
the sequence, that is, the sequence’s leaf-age is treated as a random variable. Thus, an
additional parameter for the age of the external node is introduced, and is treated
identically to the internal node age parameters in terms of proposals made by the MCMC
kernel. See Drummond et al. (2006) for further specifications and parameterisations of the
molecular clock models used here.
1. Synthetic data sets
To explore the ability of our leaf-dating model to recover sample ages, we first estimated
the dates of randomly chosen sequences within synthetic heterochronous data sets. We
generated sequence alignments of 1,000 nucleotides (nt) in length, each including 50 taxa
sampled at different times, by simulating sequence evolution down 1,000 random trees.
We simulated sequences using a Jukes-Cantor model of nucleotide substitution under a
strict molecular clock with a rate of 2.5×10⁻⁷ subs/site/year (Rambaut, Grassly 1997). Each
tree represents a random sample from the constant-size serial-sample coalescent model
(Rodrigo et al. 1999), with a population size equal to 105 haploid individuals. The ages of
the 50 individuals were 0, 0, 2000, 2000, …, 48000, 48000 years. The evolutionary rate
and sampling times used in these simulations are representative of those found in typical
analyses of ancient mitochondrial DNA (mtDNA) data sets.
For each of the 1,000 simulated data sets, a single leaf was chosen at random and its
known date was removed. Each data set was analysed separately in BEAST using the
method outlined above and the age of undated leaf was estimated. This procedure thus
represents a “leave-one-out cross validation” design and is an effective approach to
examining estimator performance. BEAST analyses were performed under the true model,

i.e. a strict clock, a constant-size coalescent model, and the Jukes-Cantor model of
nucleotide substitution. For each analysis, we ran a single MCMC chain for 5 million
generations, with samples drawn from the chain every 5000 generations, of which the first
10% was discarded as burn-in.
2. Empirical data sets
We selected two empirical heterochronous data sets for further validation of the leaf-
dating method, enabling us to test our approach when the true evolutionary model is
unknown: (i) a data set of partial (1404 nt) E gene sequences of Dengue-2 (DEN-2) virus
subtype II (Carrington et al. 2005) comprising 89 samples isolated between 1981 and
2002; and (ii) a data set representing 166 ancient and modern bison (Bison priscus) for
which 602 nt of mitochondrial control region sequences are available (Shapiro et al. 2004)
with radiocarbon ages calibrated using CalPal_2007_HULU (http://www.calpal-
online.de/). Sample ages within the bison data set ranged from 0 to 55,000 years old.
For both empirical data sets, we estimated the leaf-age of each sequence in the alignment
in a separate BEAST analysis. Because the youngest sampling date places a hard upper
bound on the evolutionary timescale, it is impossible to overestimate (estimated age older
than the true age) the age of the youngest sequences in each data set. We therefore
excluded the youngest sampled sequences from both data sets from the verification
procedure. However, requiring strictly positive leaf-ages is not warranted for all
problems. For example, measurable evolving viral populations may contain unknown
leaf-ages that are more recent than the youngest known age that is assumed to represent
time 0 in the tree.

For the DEN-2 analyses, we assumed a strict molecular clock, the GTR+G model of
nucleotide substitution and a constant coalescent model with a diffuse, log-normally
distributed effective population size, as was selected as the best fitting coalescent model in
the initial publication (Carrington et al. 2005). A single MCMC chain of 10 million
generations was run with samples recorded from the chain every 1000 generations,
discarding the first 10% as burn-in. For the bison analyses, we assumed a strict molecular
clock and the HKY+G model of nucleotide substitution. Previous work has shown that
simple coalescent models are insufficient to explain the complex demographic history of
bison (Shapiro et al. 2004; Drummond et al. 2005). Therefore, we performed each bison
analysis using two different flexible coalescent models: a piece-wise constant, multiple-
change process (MCP), often referred to as the Skyline (Drummond et al. 2005), with 12
groups, and a Gaussian Markov random field (GMRF) process, the Skyride (Minin,
Bloomquist, Suchard 2008). For each bison analysis, we ran a single MCMC chain for 50
million generations, with samples recorded from the chain every 5000 generations, again
discarding the first 10% as burn-in. Thus in total we performed 85 DEN-2 analyses (one
for every leaf except the youngest one) and 250 bison analyses (one for every non-
youngest leaf for each of two coalescent models). For all analyses, we evaluated parameter
mixing and convergence to the stationary distribution using Tracer v 1.4 (Rambaut,
Drummond 2007).
Results
Simulated data sets

In the simulated data sets, the true ages of the leaves ranged from 0 to 48,000 years. In
each of our 1,000 analyses, one leaf was selected at random and its known age was
removed. In forty cases, a leaf with a sample-age of zero was chosen; these were excluded
from the statistical verification analysis (see above for explanation). Of the 960 remaining
analyses, the true sequence age was recovered within the 95% highest posterior density
(HPD) interval of the leaf-age estimates 95% of the time, demonstrating that our leaf-
dating method performs well and has favorable statistical coverage properties. More
importantly, comparison of the posterior mean estimated leaf-age with the true age
revealed no significant bias in the estimates for true ages greater than or equal to 6,000
years old (Fig 1), indicating that the posterior mean leaf-age estimates are equally likely to
overestimate as to underestimate the true age. Mean square error in these estimates
decreases with increasing true age. Here, the difference in expected number of
substitutions between leaf-ages at zero and those more distant in the tree increases,
yielding on average more informative data for leaf-age estimation. Modest bias is
observed for true ages very close to or equal zero, which is wholly expected because, for
this example, the estimated dates cannot be smaller than zero, as the youngest sequence in
the data set if from a modern bison. The lower bound on unbiased estimates naturally
depends both on real times and the mutation rate.
Empirical data sets
Dengue-2.
Of the 85 sequences in this data set that were older than the youngest sampled sequence,
the true age was contained within the 95% HPD intervals of the leaf-age estimate for 79
leaves (93%; Table S1). Of the six sequences for which the real age was not included in
the HPD, only one (D2DR_1984) resulted in a significant difference in the marginal
likelihood, assessed by calculation of the Bayes factor comparing the strict clock model
and the leaf-age model (BF; the ratio of the marginal likelihoods with respect to the prior
of the two models) (Suchard, Weiss, Sinsheimer 2001). The BF strongly favors relaxing
the strict clock assumption on the branch leading to D2DR_1984 (log10 BF=3.99),
suggesting that either the age assigned to the sequence or the sequence itself is incorrect,
or that this particular sequence is evolving at a markedly different rate than the other
sequences in the DEN-2 data set.
Bison
Leaf-ages for 125 bison mtDNA control region sequences (leaf-ages were not estimated
for 41 modern bison) were estimated under two different coalescent models (the MCP and
GMRF models). Both coalescent models gave consistent results: the true age fell outside
the 95% HPD interval of the estimated leaf-age for 18 (14.4%) and 19 (15.2%) bison
sequences when assuming the GMRF and MCP coalescent models, respectively. Of these,
17 were estimated incorrectly in both analyses (Table 1). No significant correlation was
observed between the calibration age of the sequence and failure of the method to recover
the true age (Wilcoxon rank sum test with continuity correction: W=751, p=0.14).
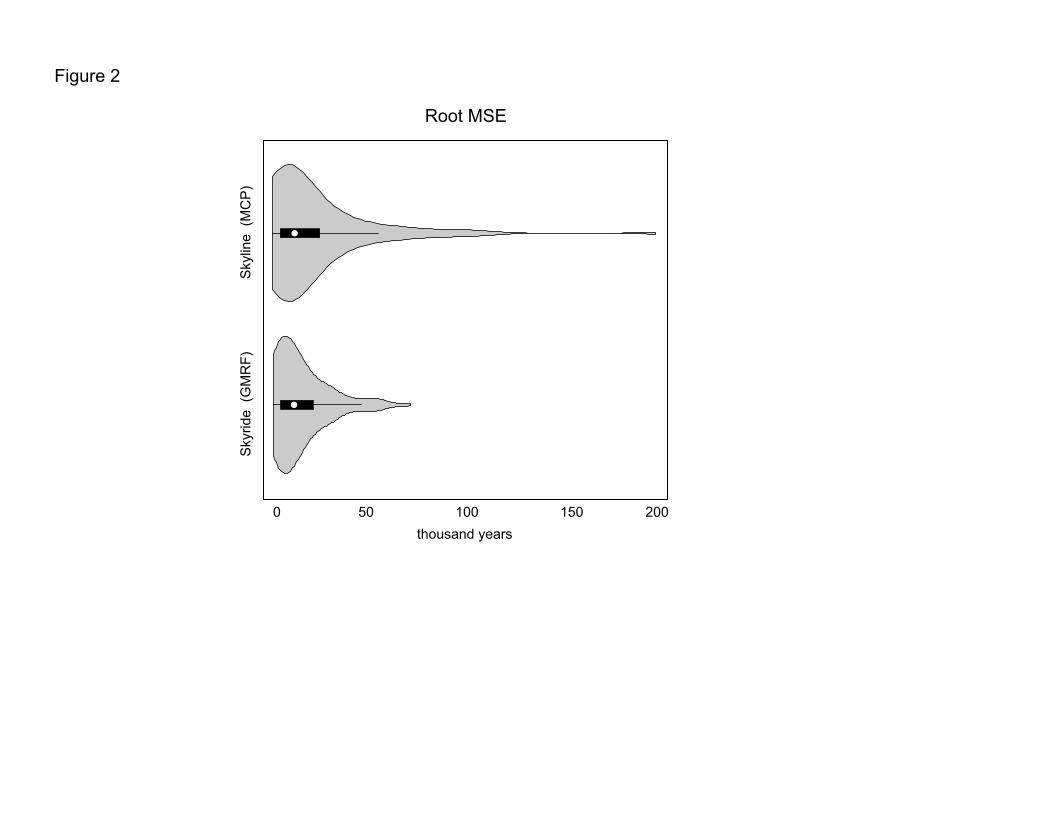
To examine differences in results between the two coalescent models, we calculated the
square root of the mean squared error (rMSE) of the leaf-age estimate for each analysis
(Table S2). The rMSE integrates both the variance and bias of an estimator and is an
effective tool with which to evaluate statistical performance when variances may differ
and there remains potential for bias. Of the sequences whose true age was contained
within the 95% HPD interval of the estimated leaf-age, the posterior average rMSE for the
analyses assuming a MCP process was 16,292 years, whereas the same statistic for the
GMRF analyses was 12,013 years. To understand this difference, we examined the
distribution of rMSE estimates (Fig 2). From the figure, average behavior is similar across
the flexible coalescent models; however, rMSE estimates under the MCP model can result
in a very long-tailed distribution, with a small number of leave-one-out analyses
generating highly skewed leaf-age estimates.
The molecular clock is a likely source of error in estimating leaf-ages (see expanded
discussion below). To explore this further, we re-ran each of the 20 bison leaf-dating
analyses for which the strict clock model failed to recover the true date, this time allowing
the evolutionary rate to be relaxed across the entire genealogy. The analyses were
performed as described above, assuming the GMRF model and the uncorrelated lognormal
relaxed clock (Drummond et al. 2006). Very similar results were obtained using the
relaxed and strict clock models (Table 1). However, when the molecular clock is relaxed
across the entire tree rather than just on the single branch, the true age is contained within
the 95% HPD intervals of the estimated leaf-age for seven of the bison sequences that
previously failed.
Discussion
Our results indicate that the leaf-age model is powerful enough to recover temporal signal
from sequence data provided that the calibrating information within other portions of the
data set is sufficient. Analysis of simulated data sets demonstrates convincingly that, when
all other sources of error are accounted for (i.e. the analysis is performed under the true
model), the leaf-age estimator is an unbiased predictor of the true age of a sequence and
has correct properties of statistical coverage. Fig 1 shows that bias is greater when the
estimated leaf age is close to its boundary (in this case, 0). Such behaviour is expected
because the variable being estimated (the sequence age) is a strictly non-negative quantity,
and as the value approaches the boundary only ages that are older than the true age can be
estimated. Implementing an estimator from a model that allows for negative leaf-ages may
circumvent this, but would be biologically meaningless when the youngest sample
included in the data set was sampled, effectively, today (such a negative leaf-age would
become the youngest sample, suggesting that all the other samples are older than
ascribed).
The results of the empirical data analyses were mixed. Our leaf-dating method performed
very well when applied to the DEN-2 data set, as the known dates of sampling fell within
the 95% HPD intervals of our estimates 93% of the time. This is extremely encouraging,
as it is almost certainly true that the evolutionary and coalescent models used in our
analyses are a gross simplification of natural processes, yet we were able to estimate leaf-
dates reliably and accurately. In addition to demonstrating the effectiveness of our leaf-
dating approach, our DEN-2 virus result also serve to validate the molecular clock
methods used, for if terminal nodes throughout the tree are estimated with accuracy then it
logically follows that the internal nodes, including the tree root, are similarly dated
correctly.
For the bison data set, the leaf-ages (as determined by radiocarbon dating) were estimated
incorrectly approximately 15% of the time (Table 1, Table S2). There was no noticeable

pattern in the age of the tips for which the leaf-dating method fails. However, in general,
the same leaf-ages, which differ significantly from their priors in all cases, are incorrectly
estimated under both coalescent models. This suggests two things: first, that the incorrect
dates likely arise from some heterogeneity in the evolutionary process that is not
accounted for in the models; and second, that the leaf-date estimates depend more on the
data than on the prior distributions assumed. The MCP process assumes that effective
population sizes change according to an exponential Markovian process (Drummond et al.
2005). In rare cases, with limited information about the root age that occurs when the
unknown dated-leaf attaches near the root, this non-stationary process can introduce
excess variability (Fig 3A); the GMRF, on the other hand, is stationary (Minin,
Bloomquist, Suchard 2008) and modestly outperforms the MCP in these situations.
Although the vast majority of bison sequence ages were estimated correctly, it is
unsatisfactory that some were not, and important to consider the possible causes of such
error. First, and most obviously, the ‘true’ ages of the specimens may have been
incorrectly reported or estimated. For example, the radiocarbon ages we used in our
analysis may be incorrect or subject to error, in particular as the age of the specimen
approaches the limits of this technique.
Second, the sequences themselves may be incorrect or be erroneous in some way. This is
particularly problematic for ancient DNA data, where the degraded nature of the samples
results in predictable patterns of DNA damage and base mis-incorporation by the
polymerases used in PCR (Hofreiter et al. 2001a; Gilbert et al. 2003; Gilbert et al. 2005;
Binladen et al. 2006). Previously, an analysis of the bison data set incorporating the post-
mortem damage (PMD) model showed that this particular aDNA data set contained very
little damage (Rambaut et al. 2009). The PMD model assumes that the probability that any
given nucleotide remained undamaged decays exponentially with age; the oldest
sequences in the bison data set demonstrated, on average, only 0.74 damaged sites, a level
that produced no qualitative change in the demographic reconstructions. In its current
implementation, the PMD model the PMD model assumes a common decay rate for every
site of every sequence (such that the probability of a site being undamaged decays
exponentially with age). A useful extension of the PMD model may be to provide a
probabilistic expectation that each individual sequence is damaged, thereby making it
possible to identify problematic sequences for additional assessment. While incorporating
both PMD models and leaf-dating in a single analysis is possible, the common decay rate
PMD model and leaf-dating are expected to be only weakly identifiable in the sampling
density of the observed sequence data, serving primarily to increase variance on the leaf-
age estimate without extracting much additional information from the data. Further, the
individual decay rate PMD model and a random leaf-age are not identifiable.
Consequently, prior assumptions will dominate inference as to whether a sequence is
damaged or incorrectly dated.
Third, some aspect of the evolutionary models used may be unrealistic and a possible
source of error. We consider each model component in turn:
(i) The phylogenetic model assumes that the sequences do not undergo recombination.
Recombination is very unlikely to be present in our ancient mtDNA bison data set, but
may be a potential cause of error in the analysis of some viruses that do recombine readily
such as HIV-1 (in which case the method introduced here may be used to detect putatively
recombinant sequences).
(ii) The coalescent prior distribution may too constraining, or unrepresentative of the tree
shapes supported by the data. However, since similar results were obtained when the bison
data set was estimated under two different coalescent models, each of which is highly
flexible, this is unlikely to be a significant cause of estimation error.
(iii) The molecular clock model did not accurately model temporal sequence evolution.
The molecular clock determines the estimated evolutionary timescale and is therefore, a
priori, the most likely source of error in estimating leaf dates. The strict molecular clock
used in our analysis does not incorporate rate heterogeneity among lineages, which is
common in many heterochronous data sets (Korsten et al. 2009; Magiorkinis et al. 2009).
If this variation is ignored then leaves attached to terminal branches that evolve unusually
rapidly or slowly will have their ages poorly estimated.
Note that the discussion above does not directly address the biological assumptions
underlying model components such as the coalescent and the molecular clock. This is
deliberate, as we wish to highlight a common misconception, In population-level analyses,
it is often assumed that it is necessary to assume neutral evolution in order to accurately
estimate divergence times using a molecular clock. If divergence times are the primary
parameters of interest, then the clock model used can be thought of as a statistical or
phenomenological description of the relationship between genetic distance and time,
rather than an explicit model of a biological process. Viewed this way, all that is important
is that the model “fits” the data well, statistically speaking. The same argument can be
applied to the coalescent model, which, when being treated as a nuisance parameter, need
only represent a suitable range of tree shapes and sizes. In such cases the assumptions of

the coalescent model (e.g. random sampling or panmixis) are not necessary conditions for
accurate date estimation. As a result, estimation of leaf-dates is likely to be highly robust
provided that the clock model used incorporates sufficient rate heterogeneity.
Although it is often not feasible to discriminate among the sources of error outlined above,
it may be possible to identify problematic sequences by evaluating the output of the leaf-
dating analysis. For example, a common problem among the small number of analyses
that fail to recover the true leaf-age is that the sequences appear to be equally or nearly
equally likely to fall in two locations in the genealogy, with each of these resulting in very
different leaf-age estimates. This pattern is seen clearly by plotting the estimated marginal
posterior distribution leaf-ages, which has an unusually high variance (Fig 3A). This result
may be due to errors within the sequence itself, which could potentially be resolved by re-
sequencing. Alternately, very precise leaf-age estimates not containing the true age may
indicate a problem with the “true” age (Fig 3B). For ancient DNA data, recovering an
additional radiocarbon date or confirming information about the stratigraphic context of
the sample can be useful to rule out this potential source of error. For viral sequences, a
re-examination of the documentation associated with the isolate may reveal an annotation
or transcription error.
While the estimated ages recovered by the leaf-dating method are often associated with
wide credible intervals, our leaf-dating method provides a means to include in molecular
clock analyses data for which little or no temporal information is known. Incorporating
additional sequence data can improve the resolution of the phylogenetic, demographic and
geographic history of the sampled sequences, and can extend significantly the temporal
range of the analysis. Additionally, estimating leaf-ages can provide an independent

means of assessing both the authenticity of heterochronous sequences and the ages to
which the sequences have been ascribed, which is often a significant concern in ancient
DNA research.
The possibility of treating leaf-ages as random variables also allows uncertainty to be
modelled explicitly. This enables the incorporation of the uncertainty associated with
layer-dating, for example in the form of a uniform prior across the age range of the source
stratum. In addition, the error in isotopic dating can be reflected by choosing an
appropriate prior distribution for the corresponding leaf-age (Ho and Phillips, 2009).
We hope that further uses for the leaf-dating method may be found. As one potential
application, consider the forensic or archaeological examination of biological tissue from
which rapidly evolving viral sequences (e.g. influenza) are recoverable – by estimating the
date of such sequences using our method it will be possible to posit a time of death.
Supplementary Material is available online:
Table S1: Results of the leaf-age analyses of 85 dengue sequences.
Table S2: Results of the leaf-age analyses of 125 bison sequences.
Acknowledgements
This work was partially supported by the NIH (R01 GM083603, R01 GM083983 and R01
GM086887), NSF (ARC 0909456), and the National Evolutionary Synthesis Center
(NESCent), NSF #EF-0423641.

Table 1: Twenty bison for which the leave-one-out analysis failed to recover the true age within the 95% HPDs of the estimated leaf-age. Bold,
italicized values are those for which the true age is recovered by the analysis.
Strict Molecular Clock Relaxed Clock
Sample ID Calibrated Age (BP) GMRF mean (95% HPD) MCP mean (95% HPD) MCP mean (95% HPD)
BS111 25920 ± 503 16566 (8826-25075) 16373 (8823-25628) 16170 (9072-23940) BS146 13662 ± 58 60806 (28641-89428) 65235 (20633-106620) 55930 (22450-84100) BS148 7326 ± 56 14091 (8284-20545) 13965 (8364-19833) 14220 (9087-20490) BS161 25181 ± 176 70688 (36052-101030) 80242 (30538-125386) 65010 (27900-94470) BS176 14232 ± 129 46145 (23488-68808) 52947 (21632-83714) 43690 (19410-66600) BS196 23123 ± 196 64575 (30175-94040) 66860 (28657-102425) 57670 (23410-86460) BS202 12381 ± 120 80369 (47807-106660) 82771 (19936-119486) 69190 (18720-94030) BS253 14753 ± 112 8530 (1769-14766) 8266 (2058-14140) 8749 (1948-15660) BS258 26606 ± 184 31004 (8346-59351) 206542 (105637-333502) 37130 (11720-69840) BS286 54134 ± 2800 83049 (64269-101972) 90412 (66629-116325) 73570 (52480-96780) BS292 40991 ± 686 67453 (43506-91413) 70453 (42618-94697) 62680 (35570-86290) BS297 12867 ± 53 62262 (41667-79291) 64290 (42197-83495) 58980 (35120-78390) BS329 32370 ± 256 67021 (40663-91504) 70817 (43050-97395) 60880 (24900-87330) BS365 51433 ± 4004 29187 (11700-46697) 28916 (11986-47484) 33140 (12550-52400) BS388 32933 ± 336 85768 (49700-113587) 117733 (52790-178806) 78570 (38190-106500) BS389 20337 ± 87 52175 (34999-72762) 52238 (33254-75360) 53000 (30760-79110) BS398 32732 ± 317 86951 (63479-108490) 99544 (60419-142781) 79330 (55530-100000) BS400 50204 ± 3427 21796 (12297-33451) 21807 (11094-33915) 23270 (10210-43990) BS405 27653 ± 195 78249 (41825-111633) 124010 (48004-207590) 68910 (25820-99180) BS478 39836 ± 261 17416 (2988-32063) 18784 (3171-36834) 18050 (3332-37250)

Figure legends
Fig 1: Relative bias in posterior mean leaf-age estimates from 960 leave-one-out analyses
of synthetic data sets with varying true leaf-ages. For true ages sufficiently distinct from
zero, the posterior mean estimator is unbiased.
Fig 2: Empirical distributions of root mean squared error (rMSE) when estimating leaf-
dates under flexible coalescent models based on a multiple change-point (MCP) process
and Gaussian Markov random field (GMRF).
Fig 3: Examples of two different leave-one-out analyses for which the true age was not
recovered within the 95% HPDs of the leaf-age estimates. In A, the analysis identifies two
similarly likely leaf-ages, whereas in B the analysis identifies a single, precise estimate
that does not coincide with the radiocarbon date of the specimen from which the sequence
was isolated. By evaluating the trace files from each leaf-age estimate, it is possible to
identify potentially erroneous sequences and to devise an appropriate strategy to
authenticate these sequences.
Literature Cited
Alroy, J. 2001. A multispecies overkill simulation of the end-Pleistocene megafaunal mass
extinction. Science 292:1893-1896.
Barnes, I, P Matheus, B Shapiro, D Jensen, A Cooper. 2002. Dynamics of Pleistocene
population extinctions in Beringian brown bears. Science 295:2267-2270.
Barnett, R, B Shapiro, I Barnes, et al. 2009. Phylogeography of lions (Panthera leo ssp.)
reveals three distinct taxa and a late Pleistocene reduction in genetic diversity.
Molecular Ecology 18:1668-1677.
Barnosky, AD, PL Koch, RS Feranec, SL Wing, AB Shabel. 2004. Assessing the causes
of late Pleistocene extinctions on the continents. Science 306:70-75.
Bennett, SN, AJ Drummond, DD Kapan, MA Suchard, JL Muñoz-Jordán, OG Pybus, EC
Holmes, DJ Gubler. In Press. Epidemic dynamics revealed in dengue evolution.
Molecular Biology and Evolution.
Binladen, J, C Wiuf, MTP Gilbert, et al. 2006. Assessing the fidelity of ancient DNA
sequences amplified from nuclear genes. Genetics 172:733-741.
Bronk Ramsey, C, TFG Higham, A Bowles, R Hedges. 2004. Improvements to the
pretreatment of bone at Oxford. Radiocarbon 46:155-163.
Bunce, M, TH Worthy, MJ Phillips, et al. 2009. The evolutionary history of the extinct
ratite moa and New Zealand Neogene paleogeography. Proceedings of the
National Academy of Sciences of the United States of America 106:20646-20651.
Campos, PF, E Willerslev, A Sher, et al. 2010. Ancient DNA analyses exclude humans as
the driving force behind late Pleistocene musk ox (Ovibos moschatus) population
dynamics. Proceedings of the National Academy of Sciences of the United States
of America 107:5675-5680.
Carrington, CV, JE Foster, OG Pybus, SN Bennett, EC Holmes. 2005. Invasion and
maintenance of dengue virus type 2 and type 4 in the Americas. J Virol 79:14680-
14687.
Chan, YL, CNK Anderson, EA Hadly. 2006. Bayesian estimation of the timing and
severity of a population bottleneck from ancient DNA. Plos Genetics 2:451-460.
Coolen, MJ, J Overmann. 2007. 217 000-year-old DNA sequences of green sulfur bacteria
in Mediterranean sapropels and their implications for the reconstruction of the
paleoenvironment. Environ Microbiol 9:238-249.

Debruyne, R, G Chu, CE King, et al. 2008. Out of America: ancient DNA evidence for a
new world origin of late quaternary woolly mammoths. Curr Biol 18:1320-1326.
Drummond, A. 2002. Computational and Statistical Inference for Molecular Evolution and
Population Genetics. Biological Sciences. Auckland, New Zealand: Univeristy of
Auckland.
Drummond, A, OG Pybus, A Rambaut. 2003. Inference of viral evolutionary rates from
molecular sequences. Advances in Parasitology, Vol 54 54:331-358.
Drummond, AJ, SYW Ho, MJ Phillips, A Rambaut. 2006. Relaxed phylogenetics and
dating with confidence. Plos Biology 4:699-710.
Drummond, AJ, GK Nicholls, AG Rodrigo, W Solomon. 2002. Estimating mutation
parameters, population history and genealogy simultaneously from temporally
spaced sequence data. Genetics 161:1307-1320.
Drummond, AJ, OG Pybus, A Rambaut, R Forsberg, AG Rodrigo. 2003. Measurably
evolving populations. Trends in Ecology & Evolution 18:481-488.
Drummond, AJ, A Rambaut. 2007. BEAST: Bayesian evolutionary analysis by sampling
trees. Bmc Evolutionary Biology 7:-.
Drummond, AJ, A Rambaut, B Shapiro, OG Pybus. 2005. Bayesian coalescent inference
of past population dynamics from molecular sequences. Molecular Biology and
Evolution 22:1185-1192.
Duffy, S, EC Holmes. 2009. Validation of high rates of nucleotide substitution in
geminiviruses: phylogenetic evidence from East African cassava mosaic viruses.
Journal of General Virology 90:1539-1547.
Firth, C, A Kitchen, B Shapiro, MA Suchard, EC Holmes, A Rambaut. In press. Using
Time-Structured Data to Estimate Evolutionary Rates of Double-Stranded DNA
Viruses. Molecular Biology and Evolution.

Gilbert, MTP, HJ Bandelt, M Hofreiter, I Barnes. 2005. Assessing ancient DNA studies.
Trends in Ecology & Evolution 20:541-544.
Gilbert, MTP, AJ Hansen, E Willerslev, L Rudbeck, I Barnes, N Lynnerup, A Cooper.
2003. Characterization of genetic miscoding lesions caused by postmortem
damage. American Journal of Human Genetics 72:48-61.
Hadly, EA, MH Kohn, JA Leonard, RK Wayne. 1998. A genetic record of population
isolation in pocket gophers during Holocene climatic change. Proceedings of the
National Academy of Sciences of the United States of America 95:6893-6896.
Hadly, EA, U Ramakrishnan, YL Chan, M van Tuinen, K O'Keefe, PA Spaeth, CJ
Conroy. 2004. Genetic response to climatic change: Insights from ancient DNA
and phylochronology. Plos Biology 2:1600-1609.
Ho, SYW, MJ Phillips. 2009. Accountiing for Calibration Uncertainty in Phylogenetic
Estimation of Evolutionary Divergence Times. Systematic Biology 58:367-380.
Hofreiter, M, V Jaenicke, D Serre, A von Haeseler, S Paabo. 2001a. DNA sequences from
multiple amplifications reveal artifacts induced by cytosine deamination in ancient
DNA. Nucleic Acids Research 29:4793-4799.
Hofreiter, M, D Serre, HN Poinar, M Kuch, S Paabo. 2001b. Ancient DNA. Nature
Reviews Genetics 2:353-359.
Hofreiter, M, D Serre, N Rohland, G Rabeder, D Nagel, N Conard, S Munzel, S Paabo.
2004. Lack of phylogeography in European mammals before the last glaciation.
Proceedings of the National Academy of Sciences of the United States of America
101:12963-12968.
Jenkins, GM, A Rambaut, OG Pybus, EC Holmes. 2002. Rates of molecular evolution in
RNA viruses: a quantitative phylogenetic analysis. J Mol Evol 54:156-165.

Korber, B, J Theiler, S Wolinsky. 1998. Limitations of a molecular clock applied to
considerations of the origin of HIV-1. Science 280:1868-1871.
Korsten, M, SYW Ho, J Davison, et al. 2009. Sudden expansion of a single brown bear
maternal lineage across northern continental Eurasia after the last ice age: a
general demographic model for mammals? Molecular Ecology 18: 1963-1969.
Lambert, DM, PA Ritchie, CD Millar, B Holland, AJ Drummond, C Baroni. 2002. Rates
of evolution in ancient DNA from Adelie penguins. Science 295:2270-2273.
Lemey, P, SLK Pond, AJ Drummond, OG Pybus, B Shapiro, H Barroso, N Taveira, A
Rambaut. 2007. Synonymous substitution rates predict HIV disease progression as
a result of underlying replication dynamics. Plos Computational Biology 3:282-
292.
Lemey, P, A Rambaut, OG Pybus. 2006. HIV evolutionary dynamics within and among
hosts. Aids Reviews 8:125-140.
Magiorkinis, G, E Magiorkinis, D Paraskevis, SYW Ho, B Shapiro, O Pybus, JP Allain, A
Hatzakis. 2009. The global spread of Hepatitis C Virus 1a and 1b: a phylodynamic
and phylogeographic analysis PLoS Med. 6:e1000198.
Minin, VN, EW Bloomquist, MA Suchard. 2008. Smooth skyride through a rough
skyline: Bayesian coalescent-based inference of population dynamics. Mol Biol
Evol 25:1459-1471.
Pybus, OG, A Rambaut. 2009. Evolutionary analysis of the dynamics of viral infectious
disease. Nature Reviews Genetics 10:540-550.
Rambaut, A. 2000. Estimating the rate of molecular evolution: incorporating non-
contemporaneous sequences into maximum likelihood phylogenies. Bioinformatics
16:395-399.

Rambaut, A, AJ Drummond. 2007. Tracer v1.4. available from
http://tree.bio.ed.ac.uk/software/tracer/.
Rambaut, A, NC Grassly. 1997. Seq-Gen: an application for the Monte Carlo simulation
of DNA sequence evolution along phylogenetic trees. Comput Appl Biosci 13:235-
238.
Rambaut, A, SYW Ho, AJ Drummond, B Shapiro. 2009. Accommodating the effect of
ancient DNA damage on inferences of demographic histories. Mol Biol Evol 26:
245-248.
Rodrigo, AG, EG Shpaer, EL Delwart, AK Iversen, MV Gallo, J Brojatsch, MS Hirsch,
BD Walker, JI Mullins. 1999. Coalescent estimates of HIV-1 generation time in
vivo. Proc Natl Acad Sci U S A 96:2187-2191.
Shapiro, B, AJ Drummond, A Rambaut, et al. 2004. Rise and fall of the Beringian steppe
bison. Science 306:1561-1565.
Sonoda, S, HC Li, L Cartier, L Nunez, K Tajima. 2000. Ancient HTLV type 1 provirus
DNA of Andean mummy. AIDS Res Hum Retroviruses 16:1753-1756.
Stiller, M, G Baryshnikov, H Bocherens, et al. 2010. Withering away--25,000 years of
genetic decline preceded cave bear extinction. Mol Biol Evol 27:975-978.
Stuart, AJ, PA Kosintsev, TF Higham, AM Lister. 2004. Pleistocene to Holocene
extinction dynamics in giant deer and woolly mammoth. Nature 431:684-689.
Suchard, MA, RE Weiss, JS Sinsheimer. 2001. Bayesian selection of continuous-time
Markov chain evolutionary models. Mol Biol Evol 18:1001-1013.
Taubenberger, JK, AH Reid, AE Krafft, KE Bijwaard, TG Fanning. 1997. Initial genetic
characterization of the 1918 "Spanish" influenza virus. Science 275:1793-1796.

Taubenberger, JK, AH Reid, RM Lourens, R Wang, G Jin, TG Fanning. 2005.
Characterization of the 1918 influenza virus polymerase genes. Nature 437:889-
893.
Valdiosera, CE, JL Garcia-Garitagoitia, N Garcia, et al. 2008. Surprising migration and
population size dynamics in ancient Iberian brown bears (Ursus arctos).
Proceedings of the National Academy of Sciences of the United States of America
105:5123-5128.
Willerslev, E, E Cappellini, W Boomsma, et al. 2007. Ancient biomolecules from deep ice
cores reveal a forested Southern Greenland. Science 317:111-114.
Worobey, M. 2008. Phylogenetic evidence against evolutionary stasis and natural abiotic
reservoirs of influenza A virus. J Virol 82:3769-3774.
Worobey, M, M Gemmel, DE Teuwen, et al. 2008. Direct evidence of extensive diversity
of HIV-1 in Kinshasa by 1960. Nature 455:661-664.
Zhu, T, BT Korber, AJ Nahmias, E Hooper, PM Sharp, DD Ho. 1998. An African HIV-1
sequence from 1959 and implications for the origin of the epidemic. Nature
391:594-597.

True Age
Rel
ativ
e Bi
as0
23
4
0
Figure 1
0 50000 100000 150000
GMRF
MCP
!
!
Root MSE
Figure 2
Sky
line
(MC
P)
Sky
ride
(GM
RF)
Root MSE
0 50 100 150 200
thousand years

1.5e-4
1.25e-4
1e-4
7.5e-5
5e-5
2.5e-5
00 10 20 30 40 50 60 70 80 90
3e-5
2.5e-5
2e-5
1.5e-5
1e-5
5e-6
00 100 200 300 400 500 600leaf age (thousands of years) leaf age (thousands of years)
sam
plin
g de
nsity
sam
plin
g de
nsity
600
500
400
300
200
100
00 5e7state
80
70
60
50
40
30
20
10
00 5e7state
leaf
age
(tho
usan
ds o
f yea
rs)
leaf
age
(tho
usan
ds o
f yea
rs)
A. BS133 B. BS490
true median age: 39,219 years
true median age: 50,204 years
Figure 3