
A-3: Update on MISO 2016 Resource Adequacy Forecast (AD14 ... · A-3: Update on MISO 2016 Resource...
34
A-3: Update on MISO 2016 Resource Adequacy Forecast (AD14-17-000) Presenters: Clair Moeller, Executive Vice President of Transmission & Technology, MISO Commissioner Eric Callisto, Public Service Commission of Wisconsin Chairman John Quackenbush, Michigan Public Service Commission
Transcript of A-3: Update on MISO 2016 Resource Adequacy Forecast (AD14 ... · A-3: Update on MISO 2016 Resource...

A-3: Update on MISO 2016 Resource Adequacy Forecast (AD14-17-000)
Presenters: Clair Moeller, Executive Vice President of Transmission & Technology, MISO
Commissioner Eric Callisto, Public Service Commission of Wisconsin
Chairman John Quackenbush, Michigan Public Service Commission


FERC Meeting2014 MISO-OMS Survey Results
Clair MoellerSeptember 18, 2014

1
• MISO is committed to keeping stakeholders fully informed about grid reliability and resource adequacy
• MISO and the Organization of MISO States (OMS) jointly developed a 10-year survey to transparently assess the potential impacts of environmental regulations and other factors
• The OMS-MISO Survey is a valuable tool that brings clarity and transparency to the crucial question of how MISO’s Resource Adequacy picture is expected to evolve going forward
Executive Summary
2
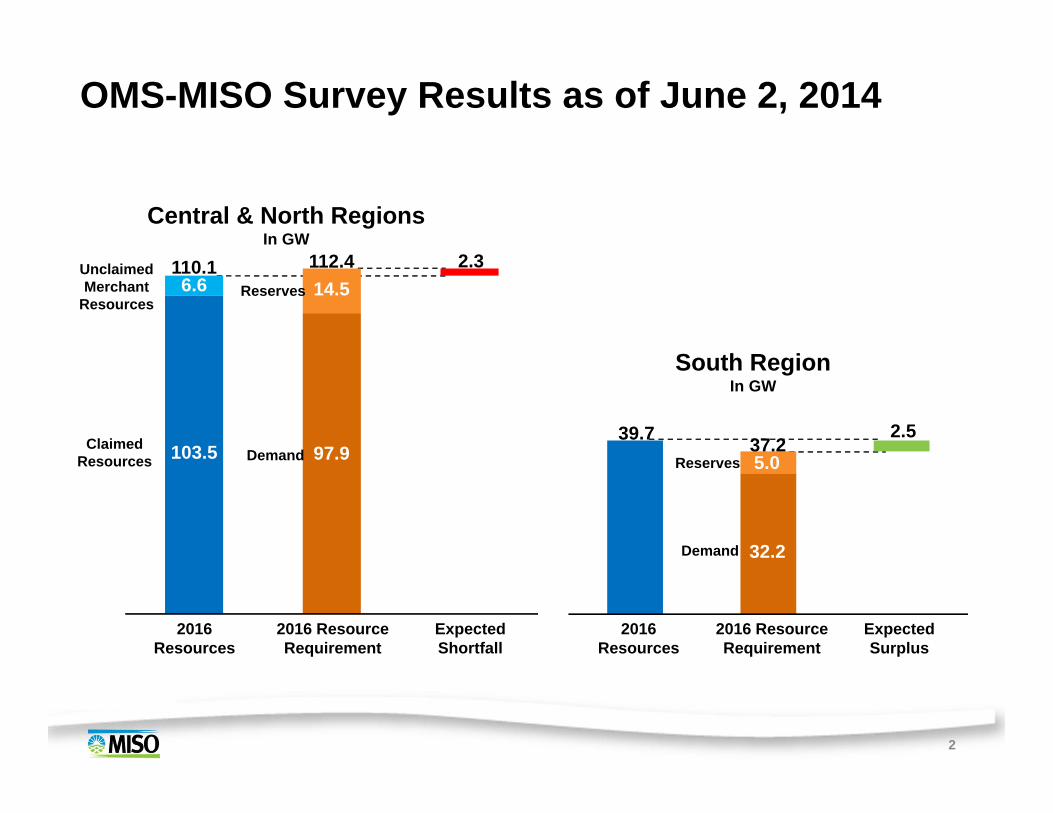
OMS-MISO Survey Results as of June 2, 2014
112.4
2016 ResourceRequirement
ExpectedShortfall
2016Resources
110.1 2.3
37.2
2016 ResourceRequirement
ExpectedSurplus
2016Resources
39.7 2.5
Central & North RegionsIn GW
South RegionIn GW
6.6
103.5ClaimedResources
UnclaimedMerchant
Resources14.5
97.9
Reserves
Demand 5.0
32.2
Reserves
Demand

3
As planning reserves erode, the probability of reliance on Emergency Operating Procedures and loss of load will increase

4
Zonal survey results indicate uncertainty as to whether the system will have adequate resources to meet its desired reserve margin in 2016
Zone 1
Zone 2 Zone 3 Zones 4/5 Zone 6 Zone 7 Zone 8 Zone 9
0.2 (1.9)(1.2)0.4(0.5)0.7 1.41.1
MT, MN, ND, SD,
WI (West)
WI (East),
MI (Upper)
IA IL, MO IN, KY MI (Lower) AR LA, MS, TX

5
• Enhance forward visibility of supply and demand
• Improve utilization of existing resources
• Evaluate / implement market improvements
MISO is pursuing several routes to manage the risks associated with tightening reserve margins

6
APPENDIXZonal Results

7
• The Organization of MISO States (OMS) & MISO conducted a survey to assess resource adequacy
• Survey directed to MISO’s Load Serving Entities– Covered a 10-year time horizon– Addressed existing and future resources– Updated demand forecasts – Load modifying resources (e.g., Demand Side
management and behind the meter generation)
• Received responses from 99% of load
• Results synthesized on a regional basis
Survey Overview
8
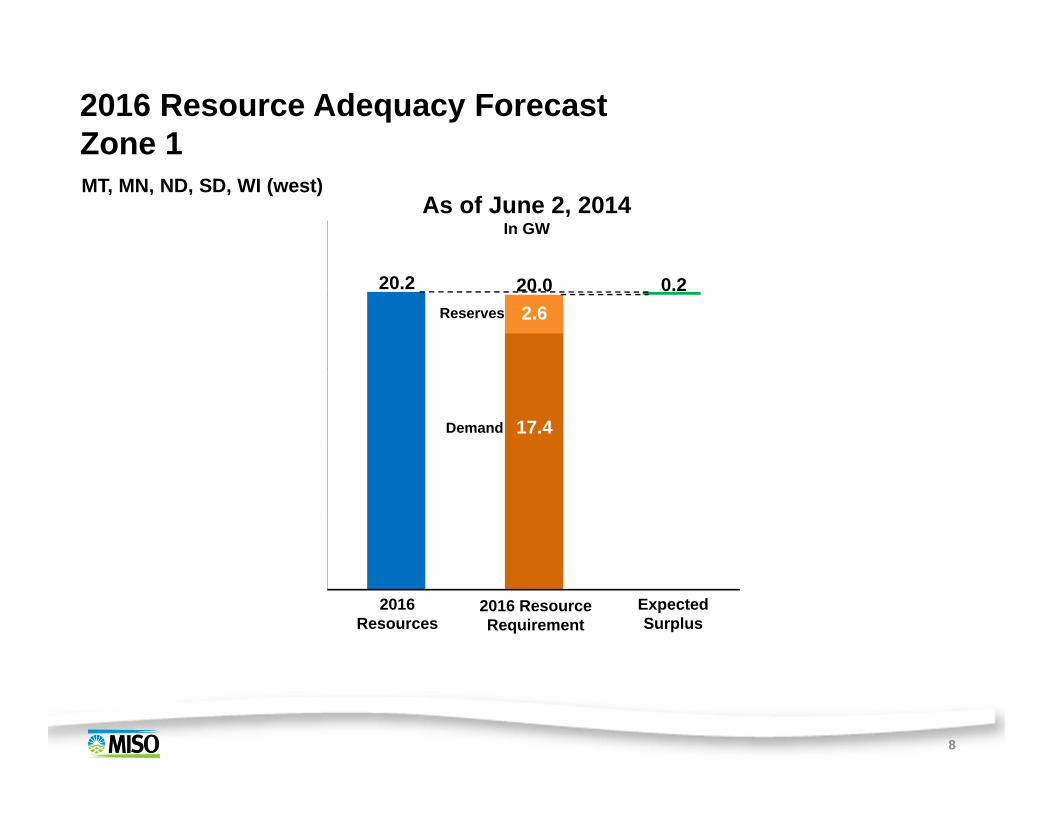
2016 Resource Adequacy ForecastZone 1
As of June 2, 2014In GW
20.0
2016 ResourceRequirement
ExpectedSurplus
2016Resources
20.2 0.2
17.4
Reserves
Demand
2.6
MT, MN, ND, SD, WI (west)

9
2016 Resource Adequacy ForecastZone 2
As of June 2, 2014In GW
14.7
2016 ResourceRequirement
ExpectedSurplus
2016Resources
15.4 0.7
12.8
Reserves
Demand
1.9
WI (east), MI (upper)
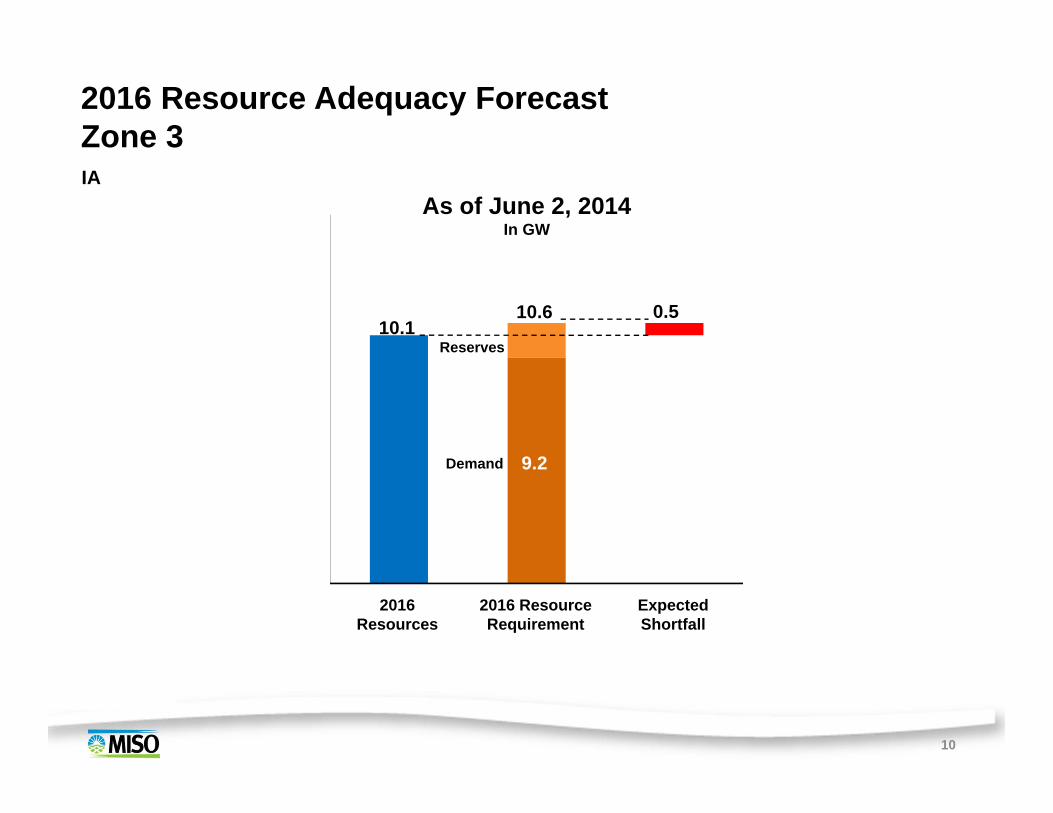
10
10.6
2016 ResourceRequirement
ExpectedShortfall
2016Resources
10.10.5
9.2
Reserves
Demand
As of June 2, 2014In GW
2016 Resource Adequacy ForecastZone 3IA

11
2016 Resource Adequacy ForecastZones 4 and 5
As of June 2, 2014In GW
21.2
2016 ResourceRequirement
ExpectedSurplus
2016Resources
21.6 0.4
18.5
Reserves
Demand
2.7
IL, MO

12
2016 Resource Adequacy ForecastZone 6
As of June 2, 2014In GW
21.1
2016 ResourceRequirement
ExpectedShortfall
2016Resources
19.91.2
18.4
Reserves
Demand
2.7
IN,KY
13
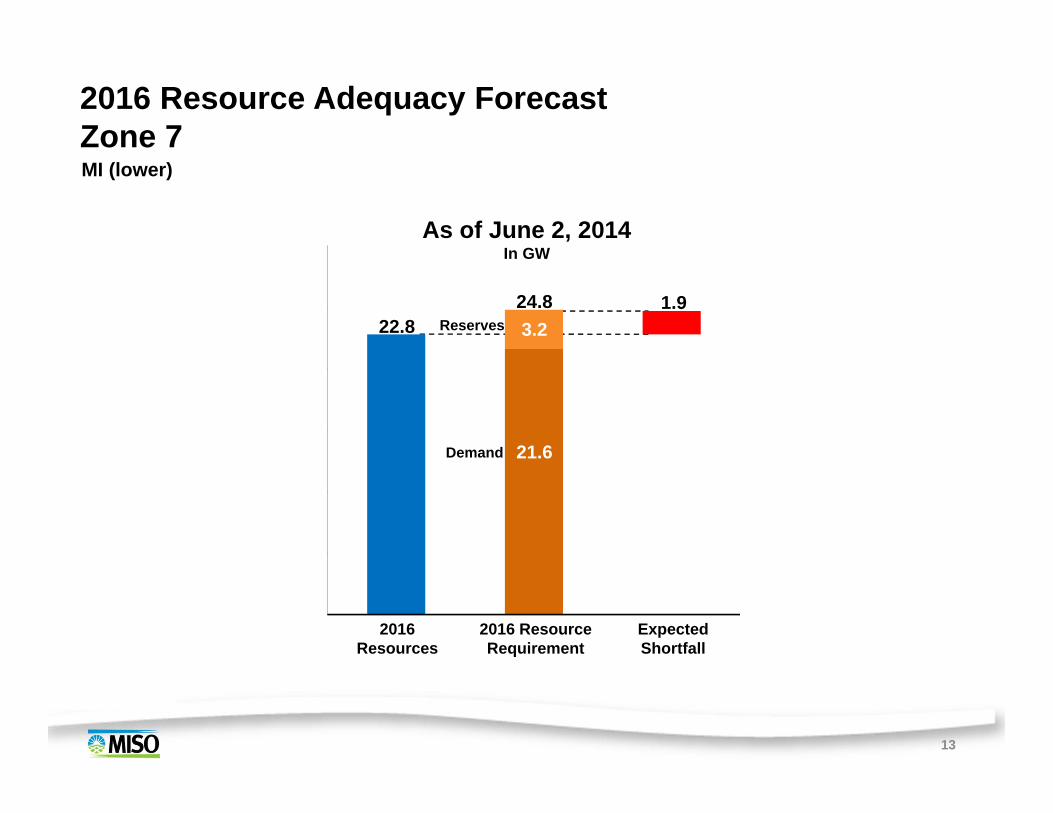
2016 Resource Adequacy ForecastZone 7
As of June 2, 2014In GW
24.8
2016 ResourceRequirement
ExpectedShortfall
2016Resources
22.81.9
21.6
Reserves
Demand
3.2
MI (lower)

14
2016 Resource Adequacy ForecastZone 8
As of June 2, 2014In GW
9.4
2016 ResourceRequirement
ExpectedSurplus
2016Resources
10.5 1.1
8.0
Reserves
Demand
1.4
AR

15
2016 Resource Adequacy ForecastZone 9
As of June 2, 2014In GW
27.9
2016 ResourceRequirement
ExpectedSurplus
2016Resources
29.3 1.4
24.3
Reserves
Demand
3.6
LA, MS, TX
100 Court Avenue, Suite 315 Phone: 515-243-0742 Des Moines, Iowa 50309 Fax: 515-243-0746 www.misostates.org
Update on the MISO 2016 Resource Adequacy Forecast FERC Open Meeting September 18, 2014
Testimony of Eric Callisto
Chairman LaFleur, Commissioners Moeller, Clark, and Bay, it is a pleasure to
appear before you to discuss resource adequacy in MISO from the perspective of a state
utility regulator. I am a commissioner at the Public Service Commission of Wisconsin,
and also the President of the Organization of MISO States (OMS). I’ll be speaking today
in my role as a representative of OMS, the Regional State Committee for MISO.
I want to welcome Commissioner Bay to his new role at FERC, and I cannot miss
the opportunity at his first open meeting to note how the topic of resource adequacy
captures the meaty issues of public policy, regulatory authority, and turf battles that will
make his job – and that of his colleagues – interesting and vitally important in the years
to come.
Reserve margins are tightening across the footprint, the result of aging
infrastructure, environmental regulation, and decisions made by legislatures, utilities,
and regulators to diversify the generation fleet. As an industry, and regardless of our
role in ensuring resource adequacy, the erosion of excess reserves understandably is of
great concern to us all. And consistent with our relative roles in the industry, I believe
there has been an appropriate response in the MISO footprint to this challenge. I want
to spend the remainder of my time discussing how the states are responding to this
challenge, the role played by the OMS-MISO Resource Adequacy Survey (“Survey”) in
helping to focus states on 2016, and some next steps. Chairman Quackenbush will focus
his comments specifically on the Michigan response.
1

The resource adequacy situation is different in each of the 15 states that
comprises a part of MISO. Indeed, a strength of this region is its ability to bring different
resources and regulatory models to bear on the problems it faces. And while not a
problem year after year, resource adequacy has been at the forefront of state
regulators’ minds since the creation of the regulatory compact. It is that compact that
drives the resource adequacy construct in MISO because keeping the lights on is the
most fundamental obligation of vertically integrated utilities. In return for making sure
they maintain a system of adequate generation and distribution, the primarily vertically
integrated utilities in MISO receive the opportunity to earn a reasonable return and a
unique service territory. None of you, of course, needs a history lesson in this
arrangement, but I raise it because there are stakeholders before this body who argue
that state regulators and the utilities they oversee are going to fail the ratepayers in this
most foundational of utility and PUC responsibilities. Their concerns do not take into
account the public interest, nor are they based on any evidence of shortcomings in the
current construct.
State commissions, and those they regulate, have analyzed the situation in 2016
and have taken, and continue to take, steps to address it. Many of the states in the
footprint have an integrated resource plan and require their utilities to bring generation
plans to them years in advance for approval. Others have different processes to ensure
that generation or its proxy will match load. Wisconsin, for example, has a capacity
planning reserve margin requirement of 14.5 percent, but requires annual compliance
by its utilities with MISO’s one day in ten years loss of load expectation figure. Iowa has
advanced ratemaking principles in place to encourage generation as needed.
Regardless of the state specific process, states continue to monitor resource adequacy,
particularly under the challenges being faced by the fleet in the short term, and have
the knowledge and authority to ensure the public’s needs are met.
This model has demonstrable success in MISO and its precursors. Since 1998,
more than 26,000 megawatts of generation has been put in service, with another 6,600
under construction. More than 150 generation projects are in various states of study at
2

MISO. Wisconsin alone, in the face of brownouts more than a decade ago, has seen
investments in the state or on behalf of state utilities of almost $7 billion in new,
upgraded, or purchased generation capacity.
The Commission need not rely on state regulators’ promises that 100 years of
success is proof that the current model works. It need go back no further than this past
winter to see the performance of the MISO construct in action. No firm load was shed
in MISO during the Polar Vortex. When PJM needed help, it came from MISO. And vice
versa. Nobody wants to be in that situation on a regular basis, but when pushed to the
limit this last year, the MISO resource adequacy construct proved up to the task. As
constructed and operated, it will continue to do so into the future.
MISO has been an active and responsive partner in this area. Its existing residual
market, as well as other stakeholder processes, has been invaluable in allowing load
serving entities (LSEs) to benefit from the breadth of resources in the region. As an
example, it is because of the MISO generation and transmission planning process, as
well as its wholesale markets, that the Wisconsin Commission lowered its state-specific
planning reserve margin in 2008 from 18 percent to the 14.5 percent previously noted.
Importantly, MISO has been receptive to input from all stakeholders as it has developed
its resource adequacy construct, and it very clearly responded to the vast majority of
stakeholders in MISO who advocated against a long-term, mandatory forward capacity
market. State regulators believe the common ground reached between us, MISO, and
most of the LSEs in MISO will continue to exist.
Because of this good history with MISO, and for the very reason that state
regulators are concerned about tightening reserve margins, we agreed last year to work
with MISO on the Survey, a 10-year forward look in the region. We are not so beholden
to jurisdictional boundaries to ignore the great value MISO brings to this important
dialogue. It has substantial analytical strengths, and an ability to objectively gather data
on behalf of the footprint as a whole. OMS member state regulators have the ability,
through our direct oversight of the utilities, to ensure that LSEs are fully engaged in the
Survey and to respond when objective data shows resource adequacy deficiencies.
3

There were certainly some challenges presented by the Survey process, and
many questions from the LSEs to both MISO and the state commissions. But with a 99
percent response rate, we believe the Survey provides a needed window – from a
footprint-wide perspective – on the short-term resource adequacy situation. While Clair
Moeller of MISO will address the specific results of the Survey, some facts bear
repeating:
- The most recent June results of the Survey show that the MISO footprint as a
whole does not have a forecasted capacity shortage in 2016 – it forecasts a
modest 0.2 GW surplus.
- Even if the shortfall in MISO North and Central persists through 2016 (a
highly unlikely scenario), the reserve margin would be at 12.5%. That only
suggests a probability of a loss of load event in the range of two days every
decade.
- The June 2014 forecast shows a small forecasted gap in only 3 zones in the
footprint. This is not a footprint wide problem, but the footprint is there to
help solve the challenge, both in planning and emergency situations.
The regulators and LSEs in zones with forecasted shortfalls are working to
address this situation. Zone 3, comprised primarily of Iowa, shows a small 0.5 GW
shortfall. The Iowa Utilities Board (IUB) worked closely with its LSEs throughout the
survey process to understand the responses, and to follow up when the small gap
appeared. Among other things, the IUB has approved the construction of a 650 MW
natural gas combined cycle facility that should help alleviate any shortfall. The Indiana
Utilities Regulatory Commission (IURC) is in the midst of its two-year IRP process with
four utilities required to submit those plans in the next month. Those filings, along with
the IURC’s 3-year out summer planning process, will help to address the projected 1.2
GW shortfall in Zone 6.
It is the combination of established state planning processes and the new
information provided by the Survey on state and regional resources that has helped
provide state regulators the widest array of solutions for 2016 and beyond. We will
4

work with MISO, our transmission owners, LSEs, and other MISO stakeholders on
important efforts internal to MISO and at the RTO’s seams that may help make
additional needed capacity available. We will continue our state-specific actions,
informed by the Survey and the pressing need to respond to the other challenges facing
the industry. I believe the Survey should continue to be an important part of that effort,
and the OMS Board later today will be discussing my recommendation that OMS
continue this important collaboration with MISO for the next planning year. While OMS
remains convinced that the current resource adequacy construct in MISO is best for
customers, we remain open to a dialogue with stakeholders who may have suggestions
for reasonable modifications to the construct. As an example, OMS has been supportive
of MISO’s analysis relating to a potential addition of a seasonal component to the tariff.
OMS appreciates the real concerns FERC has with resource adequacy across the
country. The causes of the challenge are largely known, and 2016 is a time period that
rightly is getting attention. As the Commission has recognized, the responses by RTOs
and their stakeholders can be varied, but the result needs to be the same – resource
adequacy. OMS and its 17 members have this among their highest priorities. We would
be happy to continue to provide information to FERC on our progress on short and long-
term actions that will ensure that we, and those we regulate, are meeting this important
obligation.
5


John D. Quackenbush, Chairman, MPSC
September 18, 2014
Resource Adequacy Michigan Update
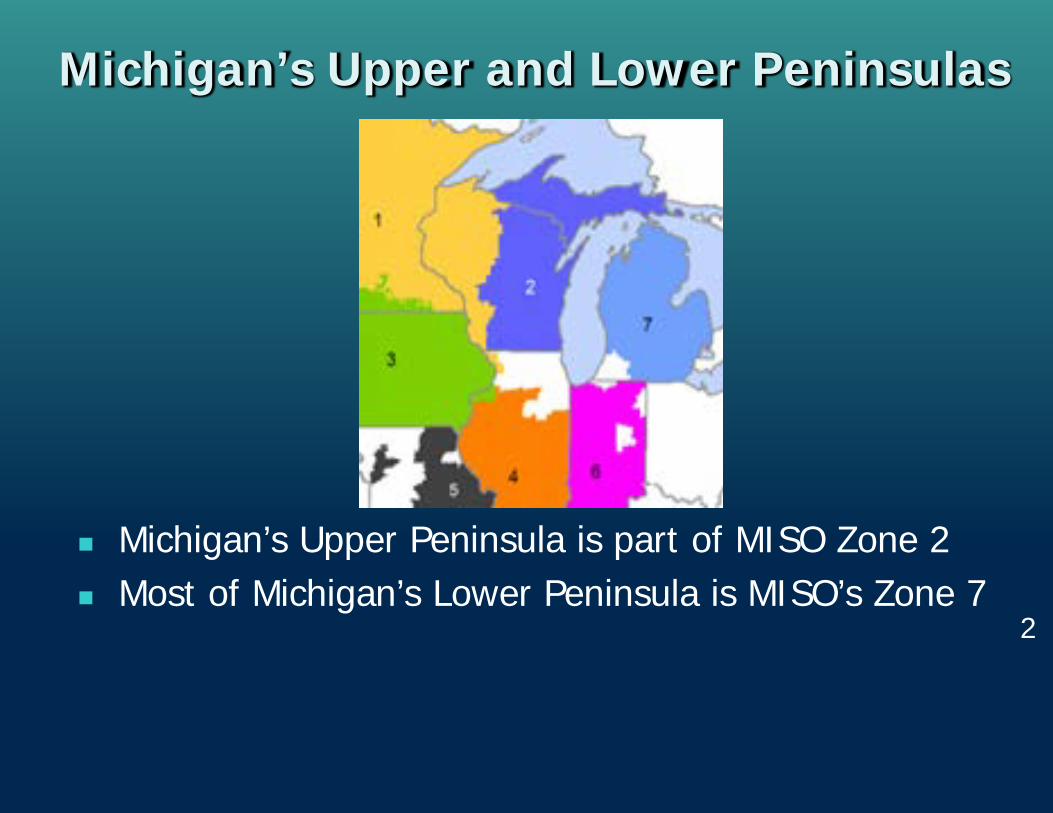
Michigan’s Upper and Lower Peninsulas
Michigan’s Upper Peninsula is part of MISO Zone 2 Most of Michigan’s Lower Peninsula is MISO’s Zone 7
2

Michigan’s Lower Peninsula
MISO Zone 7 (most of the LP) includes: • 576 electric generation units • 9,986 miles of transmission infrastructure • PJM interconnection, seven 345 kV lines • UP interconnection to LRZ 2, double 138 kV • Michigan-Ontario interconnection, single 345 kV
and three 230 kV lines + PARS • Capacity Import Limit 3,884 MW; Capacity Export
Limit 4,517 MW
3
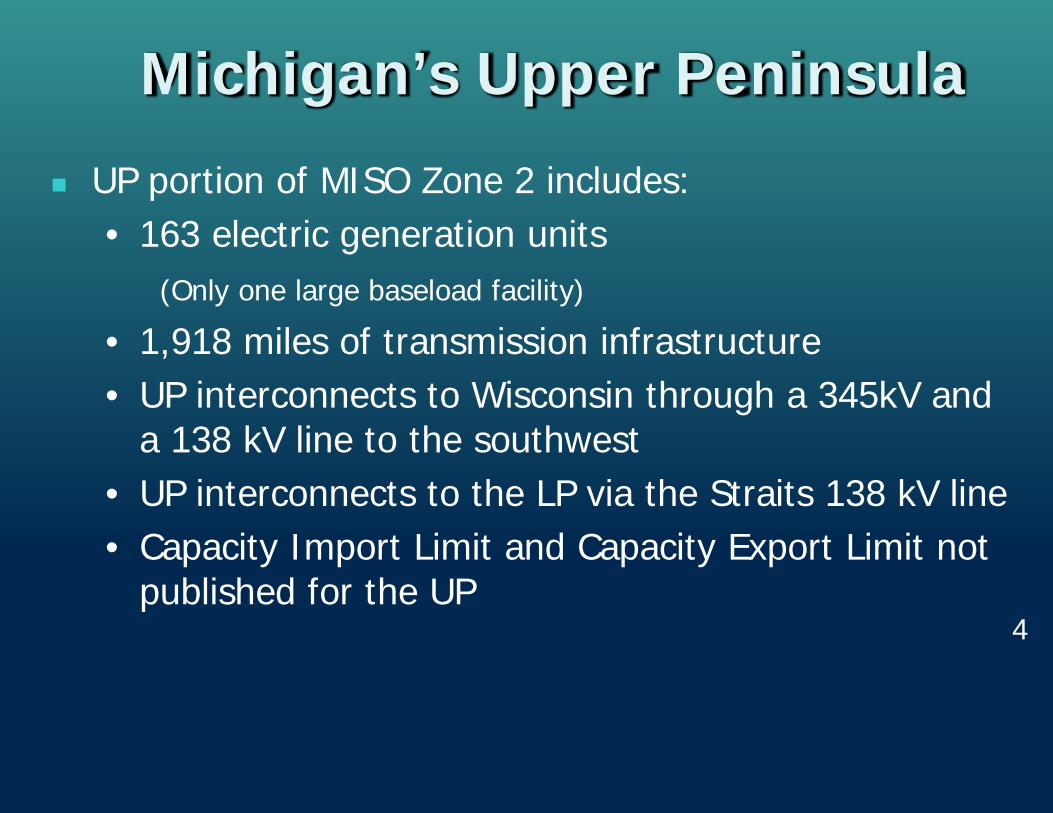
UP portion of MISO Zone 2 includes: • 163 electric generation units (Only one large baseload facility)
• 1,918 miles of transmission infrastructure • UP interconnects to Wisconsin through a 345kV and
a 138 kV line to the southwest • UP interconnects to the LP via the Straits 138 kV line • Capacity Import Limit and Capacity Export Limit not
published for the UP
Michigan’s Upper Peninsula
4

Michigan Resources - 2014
Consumers Energy provides approximately 7,646 MW of capacity • Ludington 1,871 MW currently, 420 MW uprate ISD Q4 2019 • 947 MW of coal generation expected to be suspended
April 2016 • 39 MW of generation operating under an SSR contract • 540 MW Jackson Power Co. purchase ISD Q4 2016
5

Michigan Resources - 2014 DTE Electric provides approximately 10,763 MW of
capacity • 198 MW of coal generation expected to retire
April 2016 • Additional coal retirements are expected in the
2019 – 2023 timeframe that have yet to be announced
6
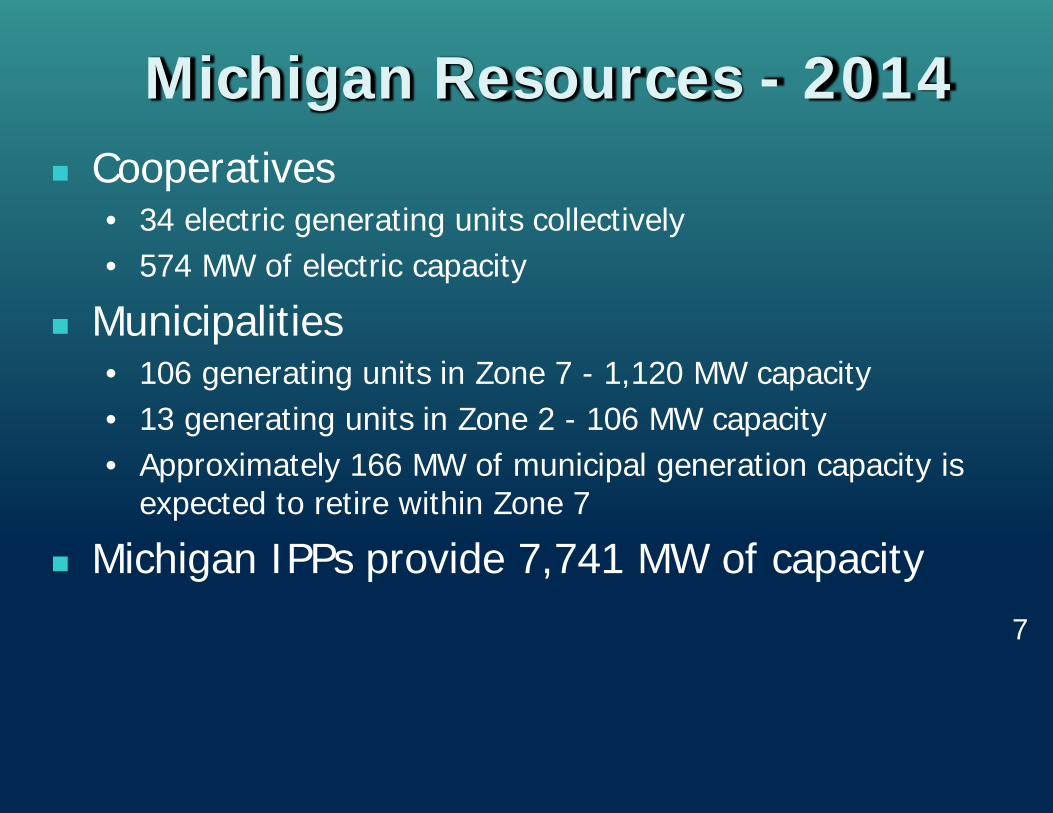
Michigan Resources - 2014 Cooperatives
• 34 electric generating units collectively • 574 MW of electric capacity
Municipalities • 106 generating units in Zone 7 - 1,120 MW capacity • 13 generating units in Zone 2 - 106 MW capacity • Approximately 166 MW of municipal generation capacity is
expected to retire within Zone 7
Michigan IPPs provide 7,741 MW of capacity 7
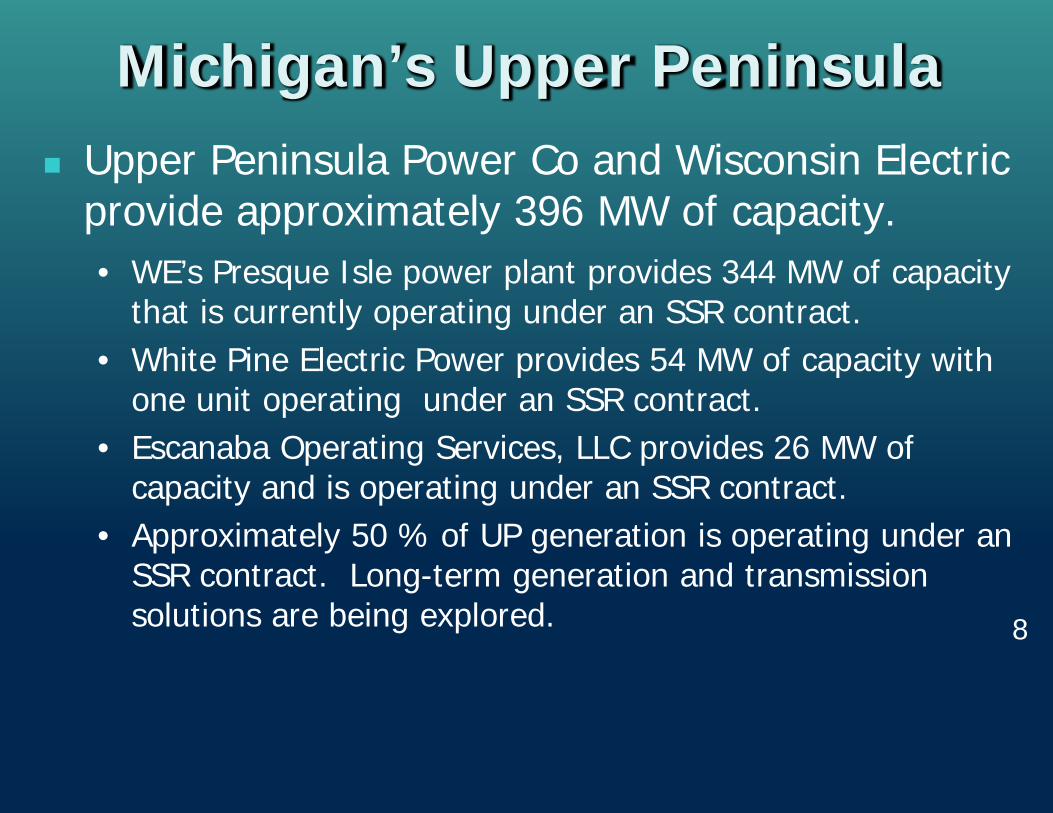
Michigan’s Upper Peninsula Upper Peninsula Power Co and Wisconsin Electric
provide approximately 396 MW of capacity. • WE’s Presque Isle power plant provides 344 MW of capacity
that is currently operating under an SSR contract. • White Pine Electric Power provides 54 MW of capacity with
one unit operating under an SSR contract. • Escanaba Operating Services, LLC provides 26 MW of
capacity and is operating under an SSR contract. • Approximately 50 % of UP generation is operating under an
SSR contract. Long-term generation and transmission solutions are being explored.
8
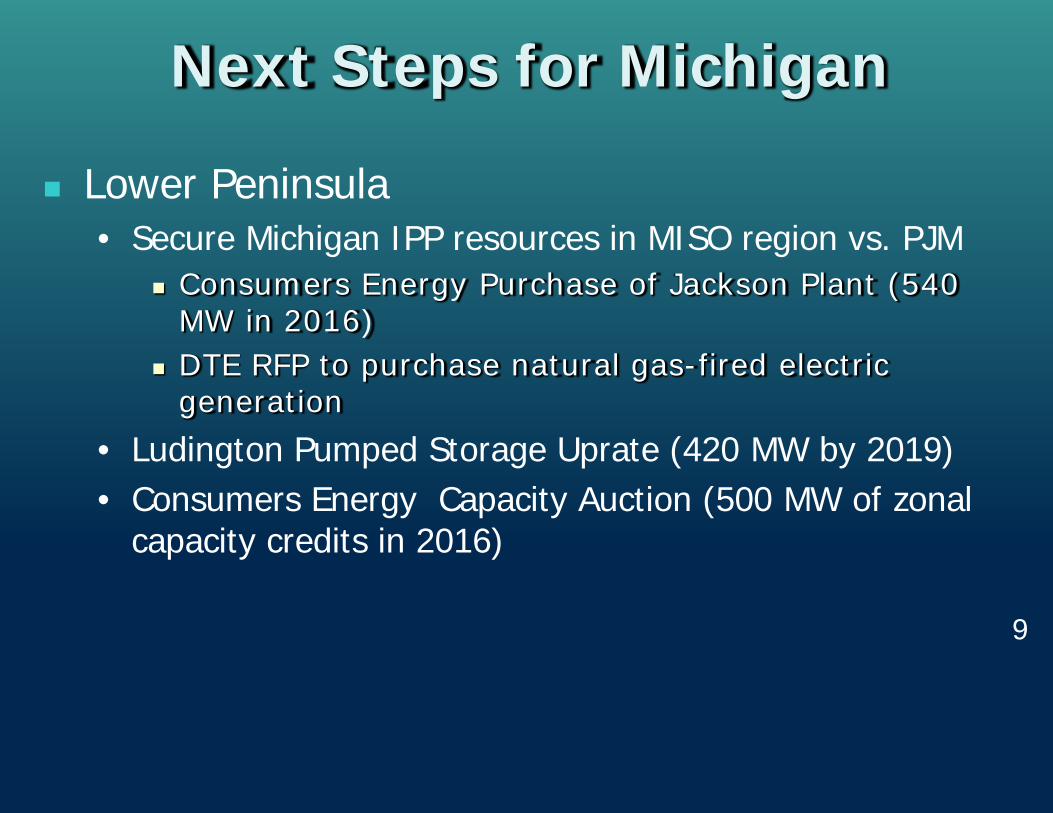
Next Steps for Michigan
Lower Peninsula • Secure Michigan IPP resources in MISO region vs. PJM
Consumers Energy Purchase of Jackson Plant (540 MW in 2016)
DTE RFP to purchase natural gas-fired electric generation
• Ludington Pumped Storage Uprate (420 MW by 2019) • Consumers Energy Capacity Auction (500 MW of zonal
capacity credits in 2016)
9
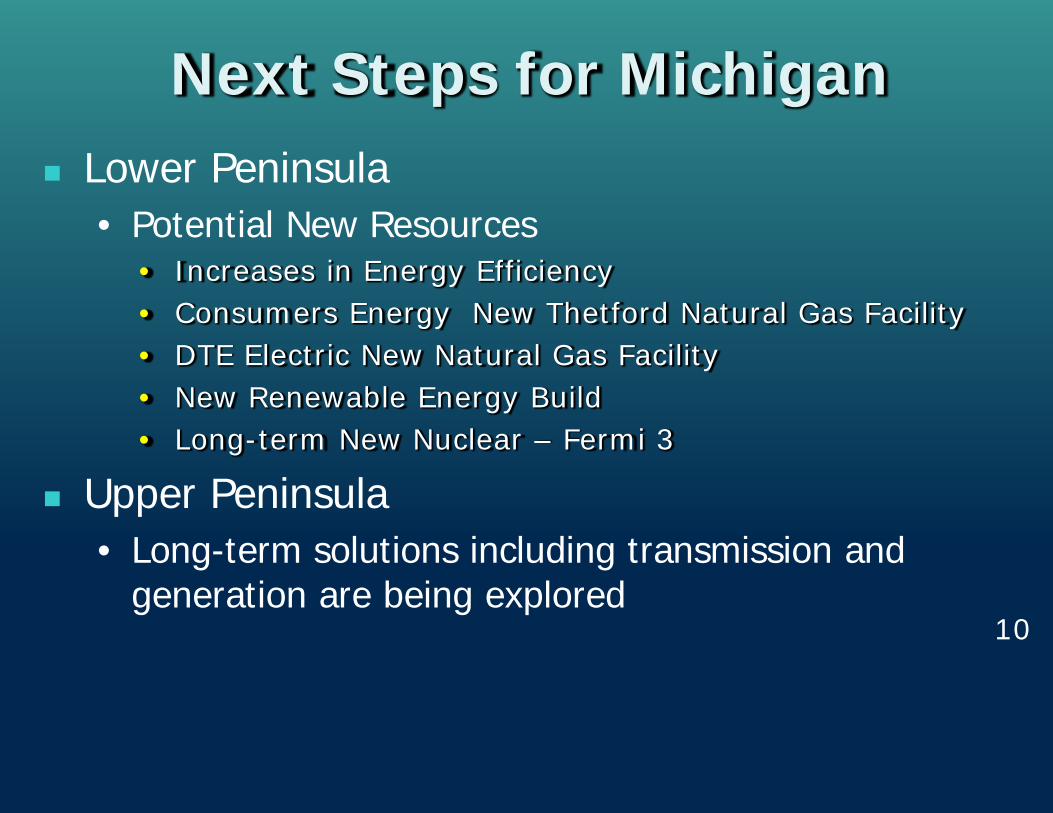
Next Steps for Michigan Lower Peninsula
• Potential New Resources • Increases in Energy Efficiency • Consumers Energy New Thetford Natural Gas Facility • DTE Electric New Natural Gas Facility • New Renewable Energy Build • Long-term New Nuclear – Fermi 3
Upper Peninsula • Long-term solutions including transmission and
generation are being explored 10