a 2011 study of small donors - Campaign Finance Institute · ©2011 The Campaign Finance Institute...
24
Changing the Game by Expanding the Playing Field Public Financing of Elections after Citizens United and Arizona Free Enterprise An Analysis of Six Midwestern States Based on the Elections of 2006-2010 by Michael J. Malbin Peter W. Brusoe Brendan Glavin The Campaign Finance Institute 1425 K St. NW, Suite 350 Washington, DC 20005 202-969-8890 www.CampaignFinanceInstitute.org ©2011 The Campaign Finance Institute
Transcript of a 2011 study of small donors - Campaign Finance Institute · ©2011 The Campaign Finance Institute...
Changing the Game by Expanding the Playing Field
Public Financing of Elections after
Citizens United and Arizona Free Enterprise
An Analysis of Six Midwestern States Based on the Elections of 2006-2010
by
Michael J. Malbin Peter W. Brusoe Brendan Glavin
The Campaign Finance Institute 1425 K St. NW, Suite 350 Washington, DC 20005 202-969-8890 www.CampaignFinanceInstitute.org
©2011 The Campaign Finance Institute
CONTENTS Introduction 1
Summary of Findings 2
What is the Law and Where Does the Money Come From Now? Illinois (4), Indiana (5), Ohio (5), Michigan (6), Wisconsin (7), Minnesota (8)
3
What If …? Illinois (11), Indiana (12), Ohio (13), Michigan (14), Wisconsin (15)
10
Wisconsin Democracy Campaign’s Proposal 17
Partial Flat Grants versus Matching Funds — Minnesota Hypothetical: Public Financing in the Wake of the Arizona Free Enterprise decision
19
Conclusion 21
ABOUT THE AUTHORS Michael J. Malbin is Executive Director of the Campaign Finance Institute and Professor of Political Science, University at Albany, State University of New York. Peter W. Brusoe is a Ph. D. Candidate in Political Science at American University's School of Public Affairs. At the time of the research for this project, he was also a Research Analyst for the Campaign Finance Institute. Brendan Glavin is Data and Systems Manager for the Campaign Finance Institute. The Campaign Finance Institute is grateful to the Joyce Foundation of Chicago, Illinois in support of its Midwest research. It is also grateful to the Smith Richardson Foundation and Rockefeller Brothers Fund for their ongoing support of its work on small donors.
©2011 The Campaign Finance Institute CampaignFinanceInstitute.org PAGE 1
Public Financing of Elections after Citizens United and Arizona Free Enterprise
An Analysis of Six Midwestern States Based on the Elections of 2006-2010
For some time, the Campaign Finance Institute has been arguing the need for a new path in campaign finance policy – one that responds effectively to the some of the key challenges of recent court decisions within a framework that can withstand constitutional challenge. The bulk of the money spent on politics in the United States comes from a small number of people who can afford to give and spend large amounts. This is not surprising. It takes money to give money, but the problem with this fact in a democracy is that it produces unequal political power. Campaign finance reformers have tried to address this in the past by putting limits on contributions and spending. But the Supreme Court has cut off this approach. The Court has upheld contribution limits only for the purpose of preventing corruption, and has rejected any mandatory limits on spending at all, including independent spending by corporations. Restrictions on speech simply will not be accepted in the name of equality, or even in the name of a broad definition of “corruption”. But this does not rule out participation as a legitimate concern of public policy. The requirement is to use policy methods do not restrict or inhibit speech. It is both constitutional and perfectly appropriate to promote participation by building up instead of squeezing down – to dilute the power of the few by increasing the number and importance of low-dollar donors and volunteers. The constitutional theory is straightforward. The empirical question is whether this would actually work? The answer is yes. This report will use recent contribution records from the six Midwestern Great Lakes states to show that a participation-centered policy could make a dramatic difference. The Midwestern information in this report is new. The findings confirm the path taken in Reform in an Age of Networked Campaigns: How to Foster Citizen Participation through Small Donors and Volunteers – a report published jointly in 2010 by The Campaign Finance Institute, Brookings Institution and American Enterprise Institute.1 A few words of caution about what the report does and does not claim. The report is not a stand-alone argument in favor of partial public financing of elections, nor does it see
©2011 The Campaign Finance Institute CampaignFinanceInstitute.org PAGE 2
small-donor matching funds as the magic wand for all governmental problems. It claims that one constitutionally permissible form of public financing, small-donor matching funds, will improve participation – changing the sources of candidate funding by altering the incentives for both candidates and donors. Improving participation in turn will be good for representative government. This argument is developed more fully in the multi-year CFI project of which this report is a part.
Summary of Findings Here is what our analysis of the Midwestern states shows:
• In four of the six states (Illinois, Indiana, Michigan and Ohio), big money dominated. Most of the money raised by candidates for governor and state legislature comes from donors who gave $1,000 or more, or from non-party organizations (including political action committees).* In Wisconsin, these two large-money sources were somewhat less important but still accounted for more than 40 percent of the money. Only in Minnesota did a majority of the money come from donors who gave $250 or less.
• Minnesota’s candidates received 57% of the funds from small donors who gave
$250 or less (44% from those who gave $100 or less). The percentages were about the same in 2006 (when 60% came from donors of $250 or less), as they were in all of the Midwestern states with elections in both years.
o Minnesota has a big lead over the state with the second highest percentage in the nation. While CFI has not completed its 2010 analysis for all 50 states, in 2006 Minnesota was 20 points ahead of second-place Vermont. (Vermont’s candidates raised 40% of their funds from donors who gave $1-$250.)
o Wisconsin was third in 2006 with 36% and was at 34% in 2010.
o The other four states were between 3% and 12% in 2006-2010.
• Campaign finance law seems to be an important part of the explanation for these results – specifically Minnesota’s and Wisconsin’s contribution limits, as well as Minnesota’s partial public financing system.
• But lowering the other states’ contribution limits to the national median would not do much by itself to alter this picture. Lower contribution limits can serve other important purposes, but would have only a modest impact on the proportional role of large versus small donors.
* Note: Our tables treat contributions from the Republican Governors’ Association and Democratic Governors’ Association as non-party contributions. Others may prefer to call these party organizations. This question does not affect the percentage from low-dollar individual donors.
©2011 The Campaign Finance Institute CampaignFinanceInstitute.org PAGE 3
• In contrast, providing a public matching fund incentive for small donors would make a huge difference.
o We ran hypothetical scenarios testing a variety of policy proposals in each of these states. In one scenario, we imagined a low-donor matching fund system in which public funds matched the first $50 from every individual donor on a five-for-one basis. This is patterned after New York City, which offers a six-for-one match for the first $175.
o This low-donor matching fund system would have a substantial effect in
all five of the states, even if no more people gave than do now. (Minnesota was excluded from this part of the analysis because it already has a functioning public financing system.)
o If the system brought more small donors into the system, as we expect, the
effects would be dramatic. Every state’s numbers would look like Minnesota’s.
• For Minnesota, we asked what would happen if the current flat grant system were
replaced by a matching fund system. We put this question forward because we foresee potential problems with sustaining the current system, as explained later. We found that with a small-donor matching fund system, candidates could raise more money to respond to self-financed opponents and independent spending, while the state would continue to rank first place for the role of its small donors.
What Is the Law, and Where Does the Money Come From Now? Before we begin talking about “what if,” let us take a closer look at “what is”. This section presents bar charts showing where the money comes from in each of the six states, together with a brief summary of the provisions of campaign finance law most relevant to the role of small and large donors. We focus on the most recent elections in which gubernatorial and legislative candidates were all running – 2010 for five of the six states and 2008 for Indiana. The states whose candidates received the smallest percentage of their money from small donors will be first, followed in order up to the one with the highest percentage. Thus, Illinois will be first, followed by Indiana, Ohio, Michigan, Wisconsin and Minnesota. A few words about the charts first:
• Because we were interested in the mix of donors to candidates, all charts in this section leave out self-financing and public funds.
• The charts also present only the money raised by major party general election candidates over the course of the a full two-year election cycle.
©2011 The Campaign Finance Institute CampaignFinanceInstitute.org PAGE 4
• The charts present donors not contributions, unlike the typical chart shown on state or federal disclosure websites. This is the only approach that makes sense for our purposes. Candidates care about who gives them how much, not how many different checks it takes them to reach the total. That is why contribution limits restrict the total amount a donor may give to a candidate. A limit per contribution would make no sense if it allowed the donor to write an unlimited number of checks. To arrive at the information for donors, as opposed to contributions, involves the following steps. We begin by looking at contribution records for all fifty states provided by the National Institute of Money in State Politics. Contributions are identified as coming from the same donor by matching the names on contribution records (and indisputable variations of the name) as well as considering their addresses. A donor is classified as giving a certain amount to a candidate if all of his/her combined contributions to that candidate add up to the amount indicated. Of course, this means that a person who gives $100 or less to a particular candidate may not always be a “small donor”. The same donor could contribute to more than one candidate and fall into different ranges for the different candidates.
Three baseline numbers will help put the charts for the six states into perspective.
• Small donors in the Midwest compared to the national median: We mentioned earlier that the most recent elections for which we have analyzed all fifty states were the elections of 2006 and 2008. Of them, 2006 is a better comparison because of the four-year gubernatorial election cycle. In 2006, the median state for low-dollar donors was Tennessee: 8% of the money raised by its candidates for governor or state legislature came from donors who gave $1-$100 and another 9% from those who gave $101-$250.
• Contribution limits in the median state: During the entire period, the median contribution limit for individuals (for states with limits) was $4,000 per election cycle for contributions to gubernatorial candidates and $2,000 per election cycle for contributions to candidates running for the state Assembly or House of Representatives.
• Percentage contributing: Later in this report, we talk about the percentage of people who contribute money to campaigns. In 2006, only about 1.5% of the Voting Age Population in the median state contributed anything at all to a candidate for state legislature or governor. The number exceeded 4% only in Minnesota (4.1%), Vermont (4.7%), New Mexico (4.7%) and Rhode Island (5.4%).

©2011 The Campaign Finance Institute CampaignFinanceInstitute.org PAGE 5
Illinois The Illinois campaign finance law that was in effect through 2010 is simple to describe. Until then, Illinois was one of only a handful of states with no limits on contributions from individual, parties or other organizations (including direct contributions from corporations and labor unions).* It should be no surprise therefore that the bulk of state candidates' money in 2010 came from large, organizational donors. Gubernatorial and legislative candidates raised only 3% of their private contributions from donors who gave them $150 or less, and only another 1% from those who gave $151-$250. (Because Illinois has a $150 disclosure threshold, we cannot separate out contributions of $1-100). In contrast, the candidates received 13% from individuals who gave $1,000 or more, 30% from political parties and 50% from interest groups or non-party organizations (including direct corporate and labor contributions, which were legal in Illinois at the time, as well as the Republican and Democratic Governors’ Associations.) Indiana Indiana also permits unlimited contributions from individuals and PACs (but not directly from corporations or unions). In the election year of 2008, legislative and gubernatorial candidates received 3% of their money from $1-$100 donors and 1% from those who gave $101-$250 – roughly the same percentages as Illinois. Indiana candidates received more of their money than their counterparts in Illinois from individuals who gave $1,000 or more (25% versus 13%), but less from the parties
* A new law election taking effect in Illinois after the 2010 election limits individual contributions to $5,000 per election cycle, PACs to $50,000 and other nonparty organizations to $10,000.

©2011 The Campaign Finance Institute CampaignFinanceInstitute.org PAGE 6
(19% versus 30%). The role of non-party organizations was more or less equivalent (46% in Indiana versus 50% in Illinois). Ohio In Ohio, individuals and PACs in 2009-2010 each were allowed to give up to $11,385.56 for a general election and another $11,385.56 for a contested primary. Since 1995 Ohio has also offered a 100% tax credit of up to $50 per individual for contributions to candidates for state office. While this would seem to be an incentive for low-dollar contributors, the state does a poor job of educating citizens to the credit’s existence and it (remarkably) makes the credit available only to taxpayers who file the long income tax form.2 Most lower-income and many middle-income taxpayers use the short form for their state taxes. According to one study written in 2002, no more than one-half of one percent of the state’s tax filers has used the credit in any given year and there is little evidence that this particular credit, as implemented, has had a significant effect on small contributions.3 That number has increased in recent years. In 2008, according to the Ohio State Department of Taxation, 72,439 tax returns used the credit. That still represents less than one percent of the state’s voting age population who used this opportunity to contribute “free money”. Given the state’s relatively high contribution limits, and the missed opportunity represented by the tax credit, the state’s donor profile was not very different from Illinois’ or Indiana’s. In 2010, legislative and gubernatorial candidates received only 4% of their money from donors who gave $100 or less, and another 4% from those who gave $101-250. In contrast, 36% of their money came from individual donors whose contributions aggregated to $1,000 or more, 29% from political parties and 22% from non-party interest groups.
©2011 The Campaign Finance Institute CampaignFinanceInstitute.org PAGE 7
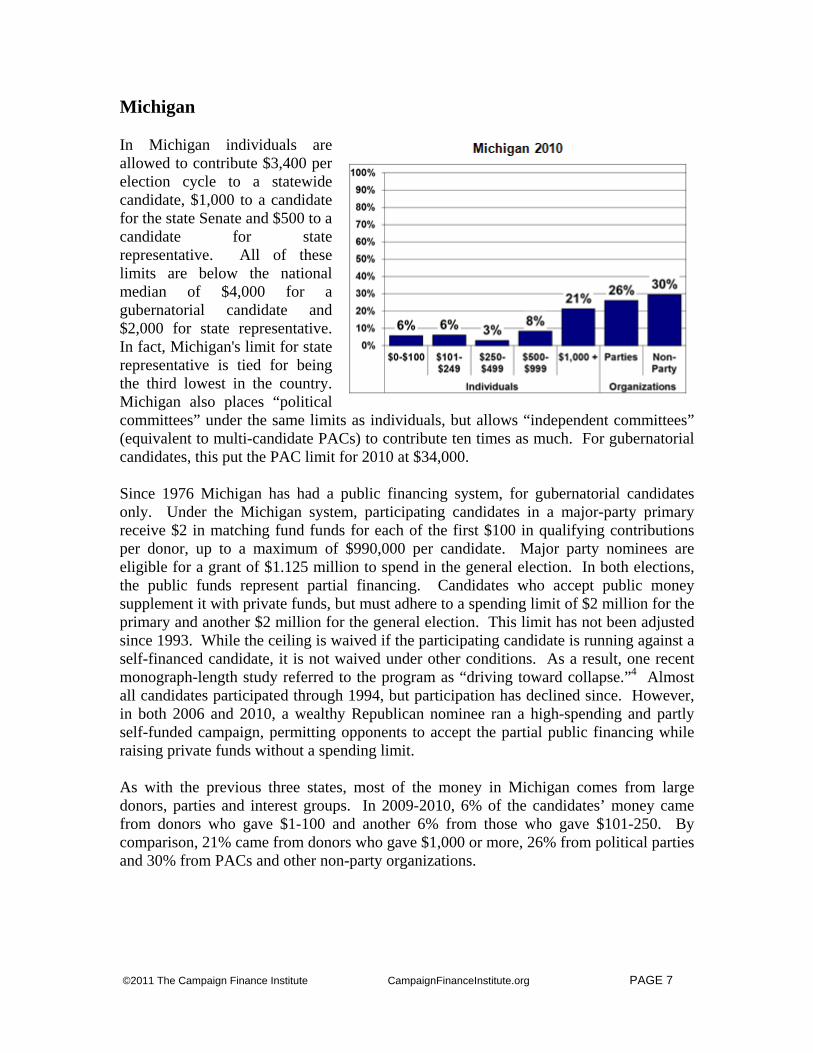
Michigan In Michigan individuals are allowed to contribute $3,400 per election cycle to a statewide candidate, $1,000 to a candidate for the state Senate and $500 to a candidate for state representative. All of these limits are below the national median of $4,000 for a gubernatorial candidate and $2,000 for state representative. In fact, Michigan's limit for state representative is tied for being the third lowest in the country. Michigan also places “political committees” under the same limits as individuals, but allows “independent committees” (equivalent to multi-candidate PACs) to contribute ten times as much. For gubernatorial candidates, this put the PAC limit for 2010 at $34,000. Since 1976 Michigan has had a public financing system, for gubernatorial candidates only. Under the Michigan system, participating candidates in a major-party primary receive $2 in matching fund funds for each of the first $100 in qualifying contributions per donor, up to a maximum of $990,000 per candidate. Major party nominees are eligible for a grant of $1.125 million to spend in the general election. In both elections, the public funds represent partial financing. Candidates who accept public money supplement it with private funds, but must adhere to a spending limit of $2 million for the primary and another $2 million for the general election. This limit has not been adjusted since 1993. While the ceiling is waived if the participating candidate is running against a self-financed candidate, it is not waived under other conditions. As a result, one recent monograph-length study referred to the program as “driving toward collapse.”4 Almost all candidates participated through 1994, but participation has declined since. However, in both 2006 and 2010, a wealthy Republican nominee ran a high-spending and partly self-funded campaign, permitting opponents to accept the partial public financing while raising private funds without a spending limit. As with the previous three states, most of the money in Michigan comes from large donors, parties and interest groups. In 2009-2010, 6% of the candidates’ money came from donors who gave $1-100 and another 6% from those who gave $101-250. By comparison, 21% came from donors who gave $1,000 or more, 26% from political parties and 30% from PACs and other non-party organizations.

©2011 The Campaign Finance Institute CampaignFinanceInstitute.org PAGE 8
Wisconsin Wisconsin lets individuals give $10,000 to a candidate for statewide office over the course of an election cycle, $1,000 to a candidate for Senator and $500 for an Assembly candidate. Individuals also may give only $10,000 per calendar year to all candidates, parties and political committees combined. PACs may give only $1,000 to a state Senate candidate and $500 for state Representative but they can give up to $43,128 to a candidate for governor. Thus, Wisconsin’s contribution limits are roughly the same as Michigan’s, even though the participation by small and large donors is different. Wisconsin had a system of partial financing for statewide and legislative candidates from 1977 through 2011. With Minnesota, it was one of only two states to have an effective program for legislative candidates in the 1970s, long before Maine's and Arizona's full public financing programs took effect in 2000. In 1986, however, Wisconsin's legislature removed the inflation adjustments for the program’s spending limits as well as its public grants. As in Michigan, the value of participating eroded and most candidates opted out. By 1996, a gubernatorial commission found that the system was "simply not working"5. Only 26 candidates received public funding in 2008.6 As a result, the pubic financing system did not have a significant effect on the role of large and small donors in recent elections. The state legislature and Governor effectively ended the program in June 2011. In 2010, Wisconsin’s legislative and gubernatorial candidates received 19% of their privately raised money from donors who gave $1-100 and another 15% from donors who gave $101-250. As noted earlier, Wisconsin was the state with the third highest percentage of candidate money coming from donors who gave $250 or less. Even so, 34% of the candidates’ funds came from donors who gave $1,000 or more. Only 2% came from political parties and 9% from non-party PACs.
©2011 The Campaign Finance Institute CampaignFinanceInstitute.org PAGE 9
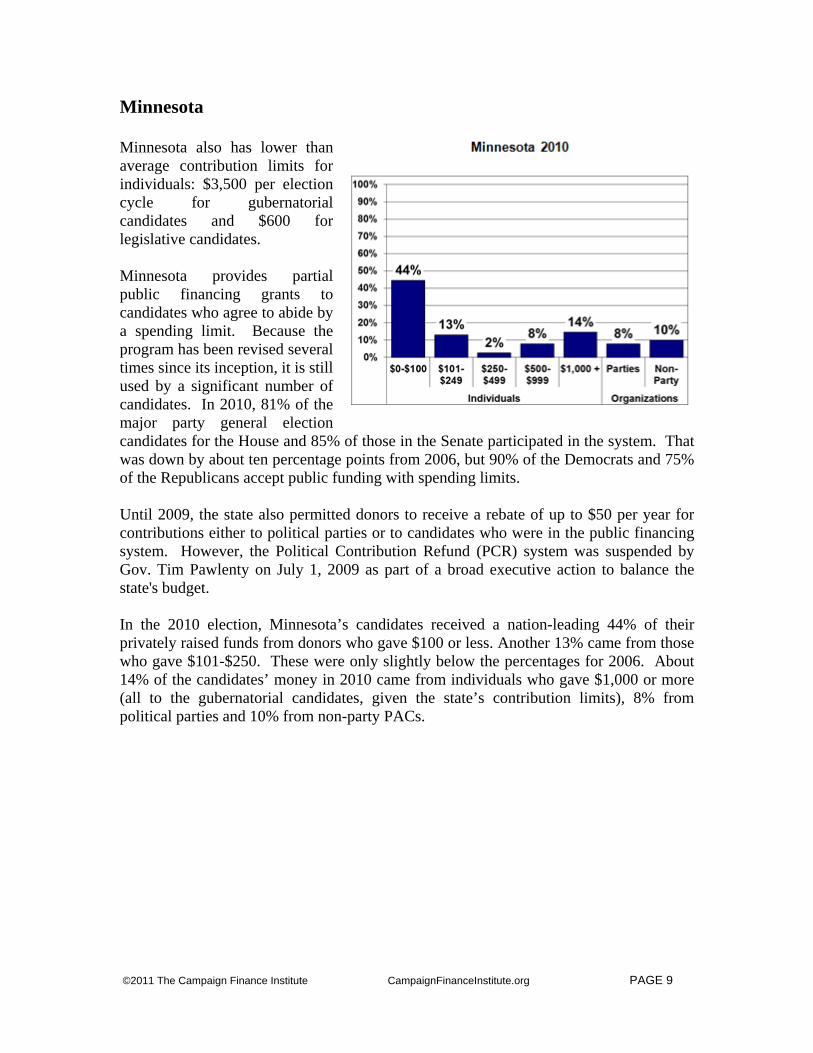
Minnesota Minnesota also has lower than average contribution limits for individuals: $3,500 per election cycle for gubernatorial candidates and $600 for legislative candidates. Minnesota provides partial public financing grants to candidates who agree to abide by a spending limit. Because the program has been revised several times since its inception, it is still used by a significant number of candidates. In 2010, 81% of the major party general election candidates for the House and 85% of those in the Senate participated in the system. That was down by about ten percentage points from 2006, but 90% of the Democrats and 75% of the Republicans accept public funding with spending limits. Until 2009, the state also permitted donors to receive a rebate of up to $50 per year for contributions either to political parties or to candidates who were in the public financing system. However, the Political Contribution Refund (PCR) system was suspended by Gov. Tim Pawlenty on July 1, 2009 as part of a broad executive action to balance the state's budget. In the 2010 election, Minnesota’s candidates received a nation-leading 44% of their privately raised funds from donors who gave $100 or less. Another 13% came from those who gave $101-$250. These were only slightly below the percentages for 2006. About 14% of the candidates’ money in 2010 came from individuals who gave $1,000 or more (all to the gubernatorial candidates, given the state’s contribution limits), 8% from political parties and 10% from non-party PACs.
©2011 The Campaign Finance Institute CampaignFinanceInstitute.org PAGE 10
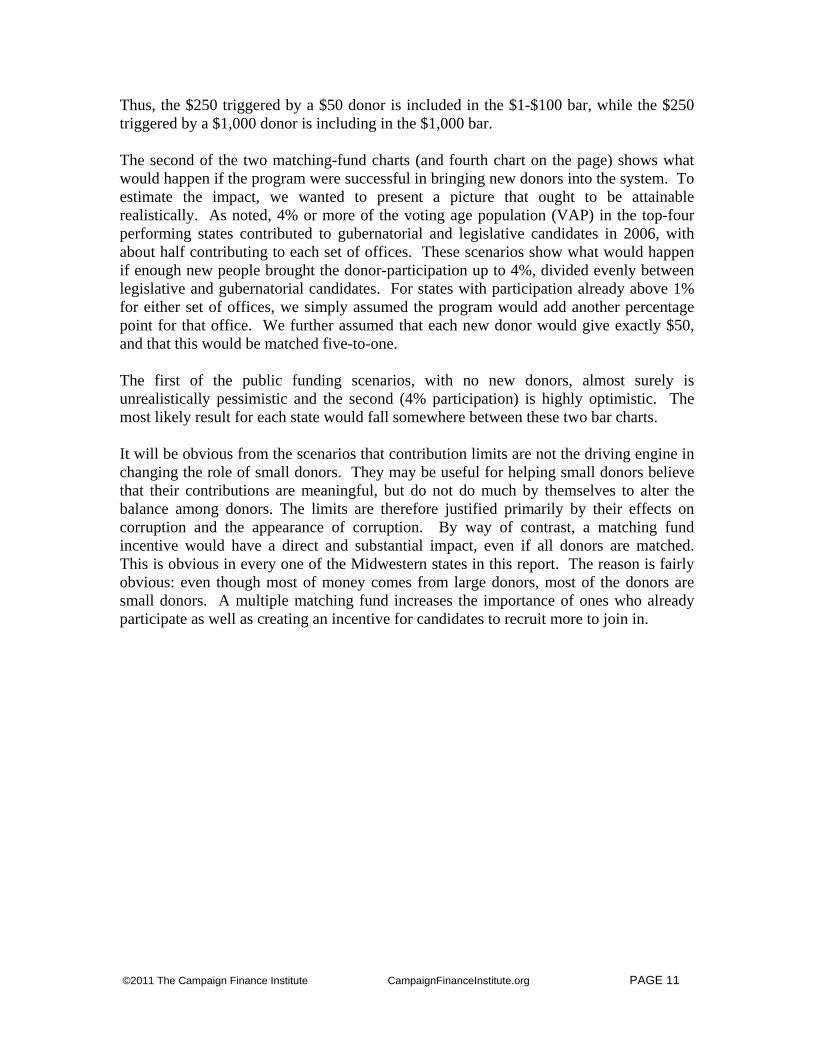
What If …? The next section of this report looks at what would happen to the mixture of donors in a state under a few different policy scenarios. We present a separate set of four bar charts for each state, with an additional set for Wisconsin to reflect an actual proposal on the table. The first chart in each set repeats the state’s current donor profile, as shown in the figures above. The second chart shows what would happen to that state’s donor profile if candidates’ contribution limits were lowered, with no other change in policy or donor participation. The scenario assumes a maximum contribution of $2,000 from individuals, which would be at the national median for legislative candidates and about half the median for gubernatorial candidates. It also assumes a $10,000 limit on contributions from PACs or other non-party organizations. The figures underlying the chart were derived by beginning with the donors who actually gave in 2009-2010 and removing the money that would have exceeded the new limits. In the real world, of course, some large donors might redistribute their funds to new candidates. This chart therefore shows the maximum likely impact of the hypothetical limit. The next two charts show what would happen if the state implemented a public matching fund program that was targeted toward changing the incentives to make it more attractive for candidates to raise money from small donors. The policy scenario assumes a program in which the state offers $5 for each of the first $50 that an individual donates, with no other change in public policy other than the contribution limits shown in the previous chart. The scenario assumes that first $50 from all donors would be matched (even a donor who gives as much as the contribution limit). Some proposals would match only the money from donors whose contributions aggregate to a small dollar figure, even though the state’s contribution limit allows donors to contribute more. This is more difficult to model, because it would require candidates to return funds from donors who exceed the matching-fund limit. We also were concerned substantively that an aggregate limit would have little impact on the proportional role of small donors, while creating a disincentive for participation from donors who want to come back during the heat of a campaign and give more than once. The numbers in the two public funding scenarios also assume that all general election candidates will participate. This is obviously an unrealistic assumption, so these charts should also be seen as showing maximum likely impacts. However, two points strengthen the estimates’ accuracy. (1) Since there are no spending limits assumed in these proposals, candidate participation would likely be high. (2) Even if some candidates opt out, the percentage distributions should be in the ranges shown for those who do choose to participate. The first of the two matching-fund charts (which is the third on each page) shows what would happen in the highly unlikely event that the matching funds brought no new donors into the system over and above the ones who gave in 2010. Each chart places the value of all public matching money in the same bar as the donor who triggered the match.
©2011 The Campaign Finance Institute CampaignFinanceInstitute.org PAGE 11
Thus, the $250 triggered by a $50 donor is included in the $1-$100 bar, while the $250 triggered by a $1,000 donor is including in the $1,000 bar. The second of the two matching-fund charts (and fourth chart on the page) shows what would happen if the program were successful in bringing new donors into the system. To estimate the impact, we wanted to present a picture that ought to be attainable realistically. As noted, 4% or more of the voting age population (VAP) in the top-four performing states contributed to gubernatorial and legislative candidates in 2006, with about half contributing to each set of offices. These scenarios show what would happen if enough new people brought the donor-participation up to 4%, divided evenly between legislative and gubernatorial candidates. For states with participation already above 1% for either set of offices, we simply assumed the program would add another percentage point for that office. We further assumed that each new donor would give exactly $50, and that this would be matched five-to-one. The first of the public funding scenarios, with no new donors, almost surely is unrealistically pessimistic and the second (4% participation) is highly optimistic. The most likely result for each state would fall somewhere between these two bar charts. It will be obvious from the scenarios that contribution limits are not the driving engine in changing the role of small donors. They may be useful for helping small donors believe that their contributions are meaningful, but do not do much by themselves to alter the balance among donors. The limits are therefore justified primarily by their effects on corruption and the appearance of corruption. By way of contrast, a matching fund incentive would have a direct and substantial impact, even if all donors are matched. This is obvious in every one of the Midwestern states in this report. The reason is fairly obvious: even though most of money comes from large donors, most of the donors are small donors. A multiple matching fund increases the importance of ones who already participate as well as creating an incentive for candidates to recruit more to join in.
©2011 The Campaign Finance Institute CampaignFinanceInstitute.org PAGE 12
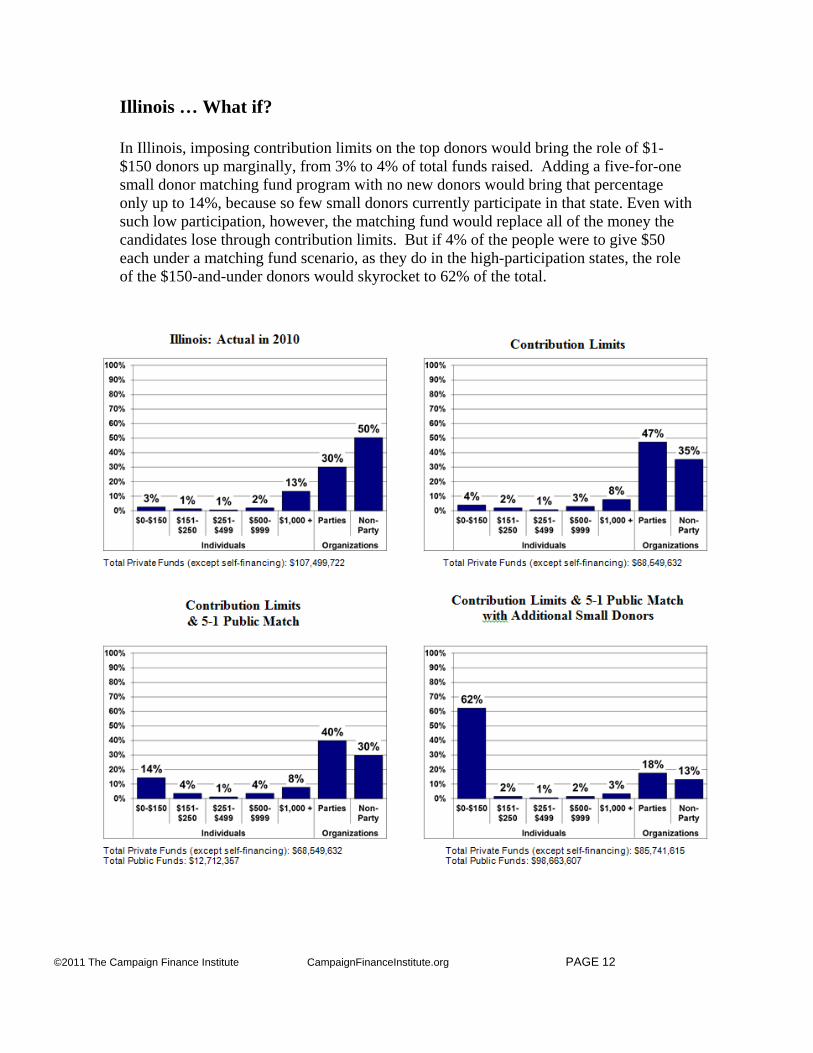
Illinois … What if?
In Illinois, imposing contribution limits on the top donors would bring the role of $1-$150 donors up marginally, from 3% to 4% of total funds raised. Adding a five-for-one small donor matching fund program with no new donors would bring that percentage only up to 14%, because so few small donors currently participate in that state. Even with such low participation, however, the matching fund would replace all of the money the candidates lose through contribution limits. But if 4% of the people were to give $50 each under a matching fund scenario, as they do in the high-participation states, the role of the $150-and-under donors would skyrocket to 62% of the total.
©2011 The Campaign Finance Institute CampaignFinanceInstitute.org PAGE 13
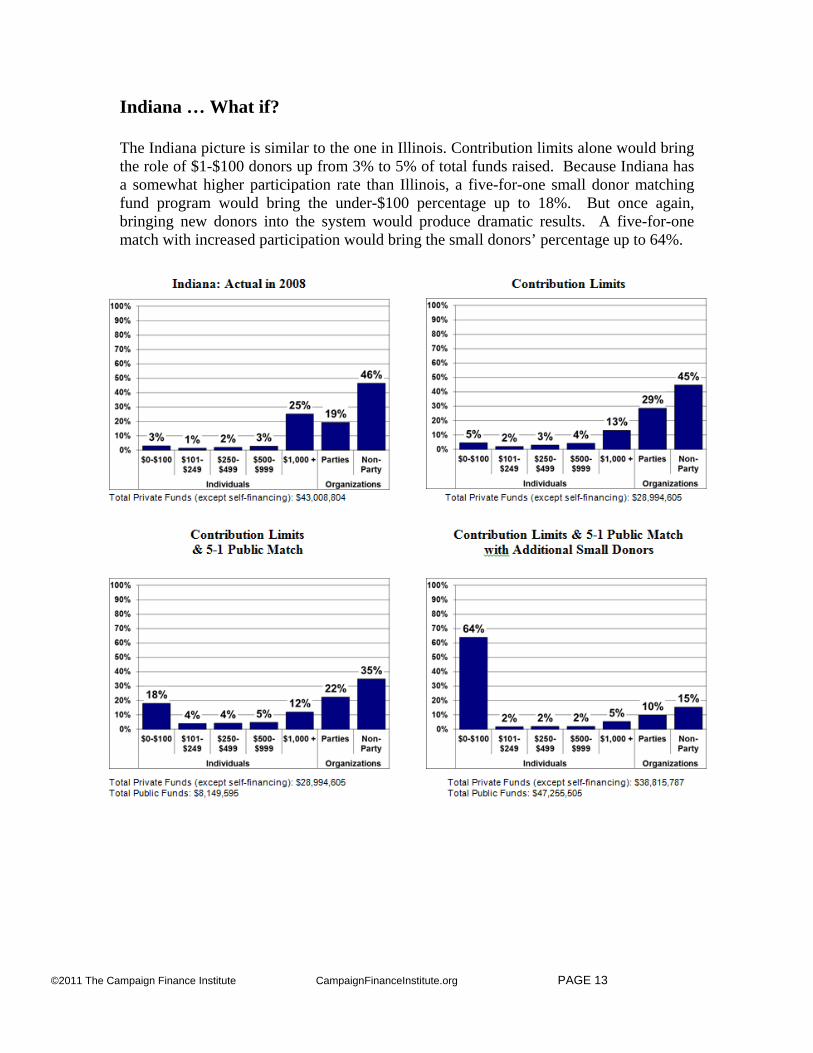
Indiana … What if?
The Indiana picture is similar to the one in Illinois. Contribution limits alone would bring the role of $1-$100 donors up from 3% to 5% of total funds raised. Because Indiana has a somewhat higher participation rate than Illinois, a five-for-one small donor matching fund program would bring the under-$100 percentage up to 18%. But once again, bringing new donors into the system would produce dramatic results. A five-for-one match with increased participation would bring the small donors’ percentage up to 64%.
©2011 The Campaign Finance Institute CampaignFinanceInstitute.org PAGE 14
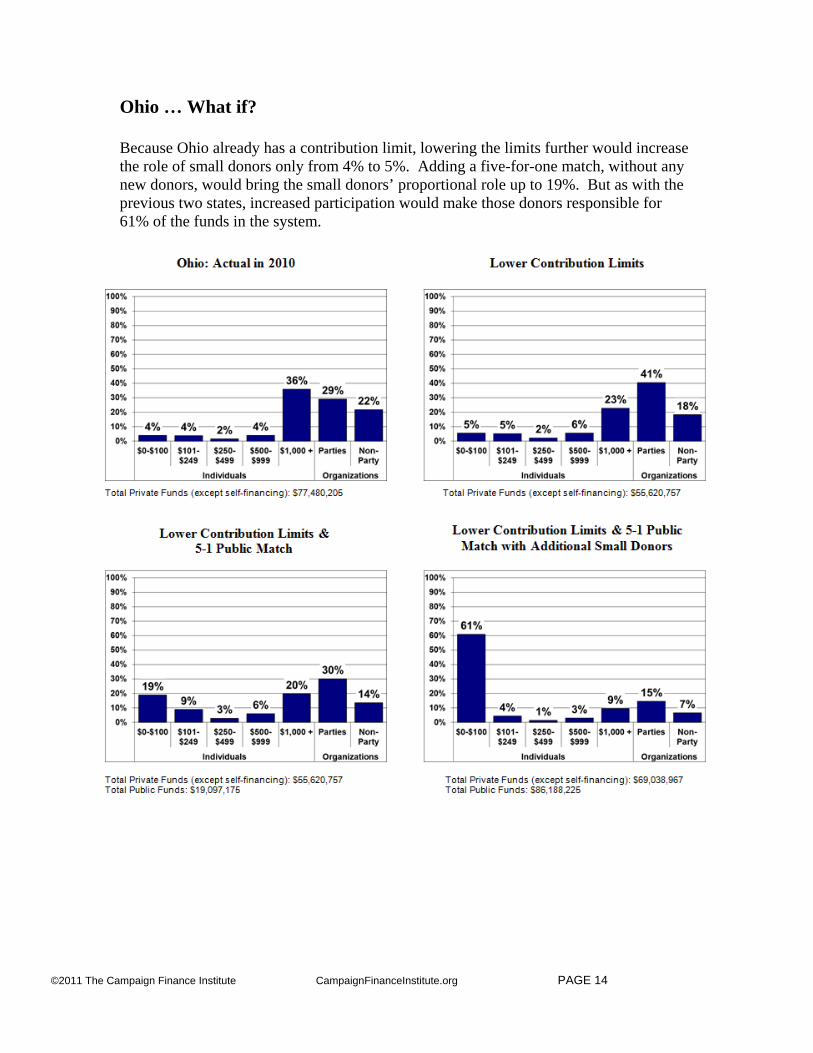
Ohio … What if?
Because Ohio already has a contribution limit, lowering the limits further would increase the role of small donors only from 4% to 5%. Adding a five-for-one match, without any new donors, would bring the small donors’ proportional role up to 19%. But as with the previous two states, increased participation would make those donors responsible for 61% of the funds in the system.
©2011 The Campaign Finance Institute CampaignFinanceInstitute.org PAGE 15
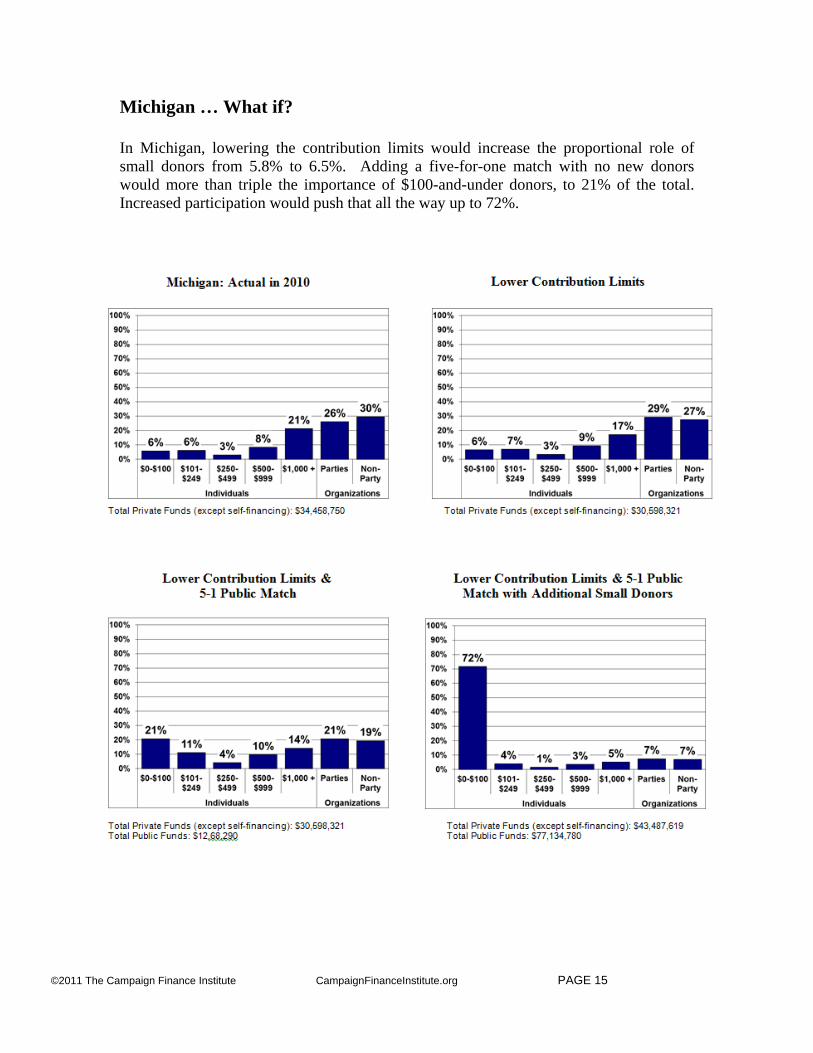
Michigan … What if?
In Michigan, lowering the contribution limits would increase the proportional role of small donors from 5.8% to 6.5%. Adding a five-for-one match with no new donors would more than triple the importance of $100-and-under donors, to 21% of the total. Increased participation would push that all the way up to 72%.
©2011 The Campaign Finance Institute CampaignFinanceInstitute.org PAGE 16
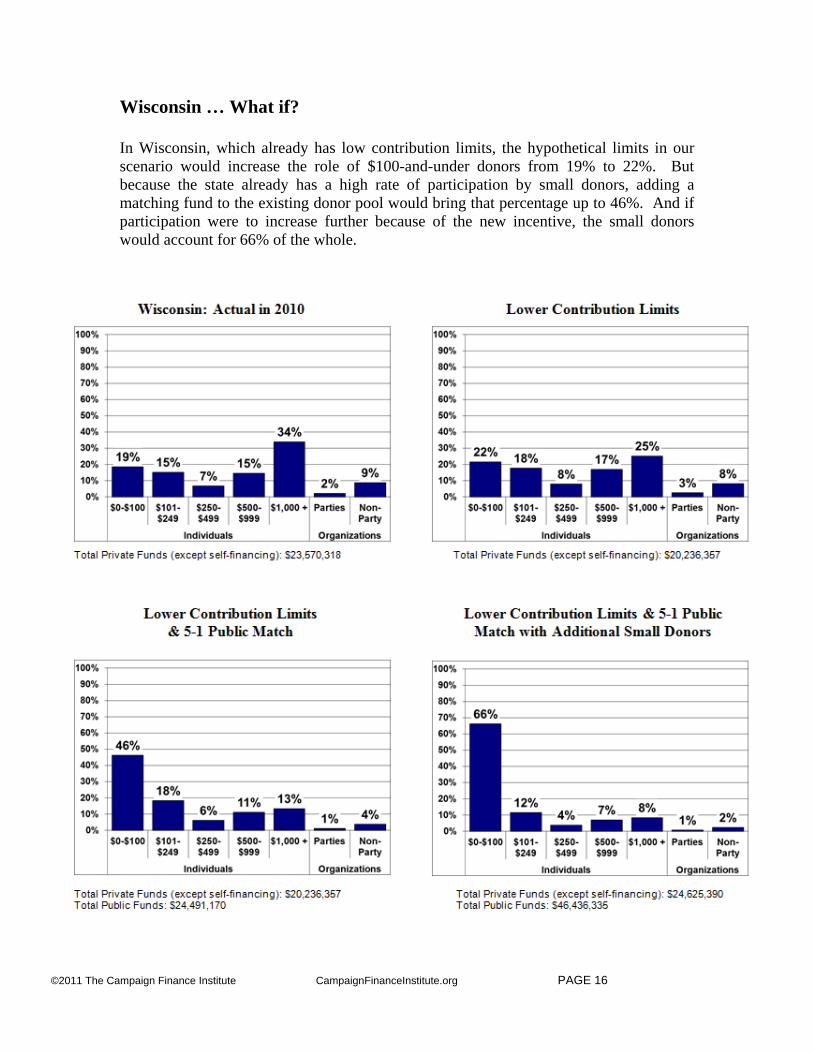
Wisconsin … What if?
In Wisconsin, which already has low contribution limits, the hypothetical limits in our scenario would increase the role of $100-and-under donors from 19% to 22%. But because the state already has a high rate of participation by small donors, adding a matching fund to the existing donor pool would bring that percentage up to 46%. And if participation were to increase further because of the new incentive, the small donors would account for 66% of the whole.
©2011 The Campaign Finance Institute CampaignFinanceInstitute.org PAGE 17
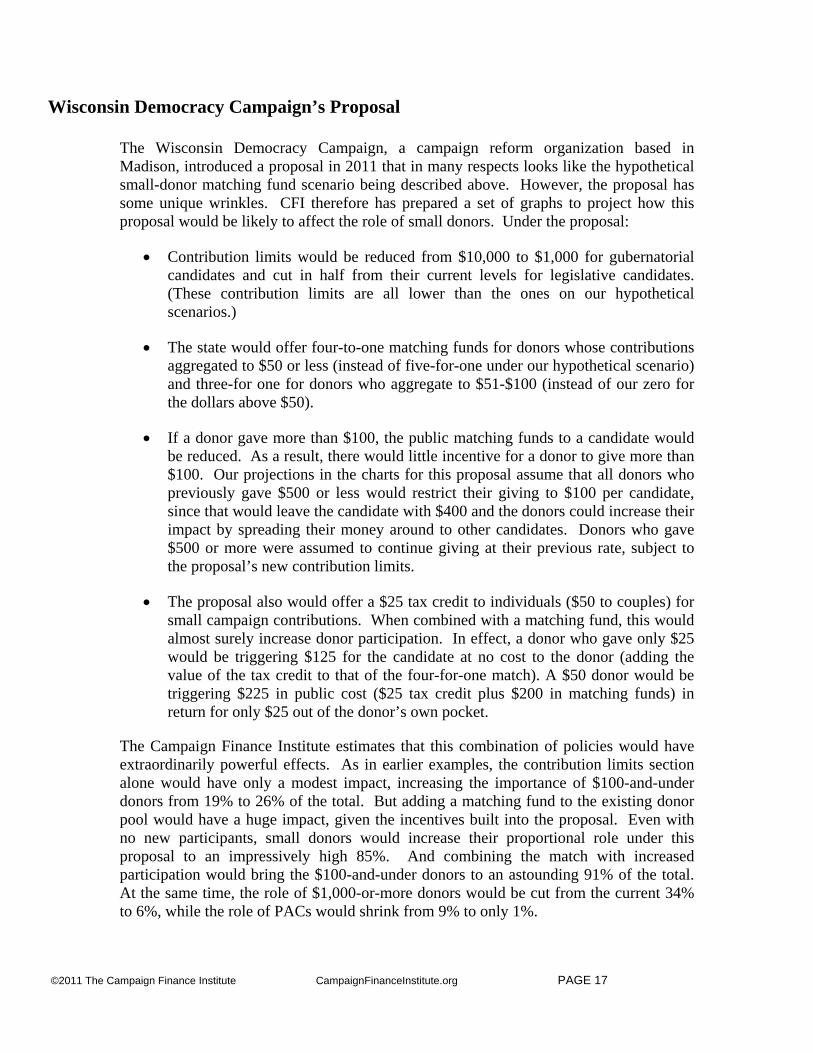
Wisconsin Democracy Campaign’s Proposal
The Wisconsin Democracy Campaign, a campaign reform organization based in Madison, introduced a proposal in 2011 that in many respects looks like the hypothetical small-donor matching fund scenario being described above. However, the proposal has some unique wrinkles. CFI therefore has prepared a set of graphs to project how this proposal would be likely to affect the role of small donors. Under the proposal:
• Contribution limits would be reduced from $10,000 to $1,000 for gubernatorial candidates and cut in half from their current levels for legislative candidates. (These contribution limits are all lower than the ones on our hypothetical scenarios.)
• The state would offer four-to-one matching funds for donors whose contributions aggregated to $50 or less (instead of five-for-one under our hypothetical scenario) and three-for one for donors who aggregate to $51-$100 (instead of our zero for the dollars above $50).
• If a donor gave more than $100, the public matching funds to a candidate would be reduced. As a result, there would little incentive for a donor to give more than $100. Our projections in the charts for this proposal assume that all donors who previously gave $500 or less would restrict their giving to $100 per candidate, since that would leave the candidate with $400 and the donors could increase their impact by spreading their money around to other candidates. Donors who gave $500 or more were assumed to continue giving at their previous rate, subject to the proposal’s new contribution limits.
• The proposal also would offer a $25 tax credit to individuals ($50 to couples) for small campaign contributions. When combined with a matching fund, this would almost surely increase donor participation. In effect, a donor who gave only $25 would be triggering $125 for the candidate at no cost to the donor (adding the value of the tax credit to that of the four-for-one match). A $50 donor would be triggering $225 in public cost ($25 tax credit plus $200 in matching funds) in return for only $25 out of the donor’s own pocket.
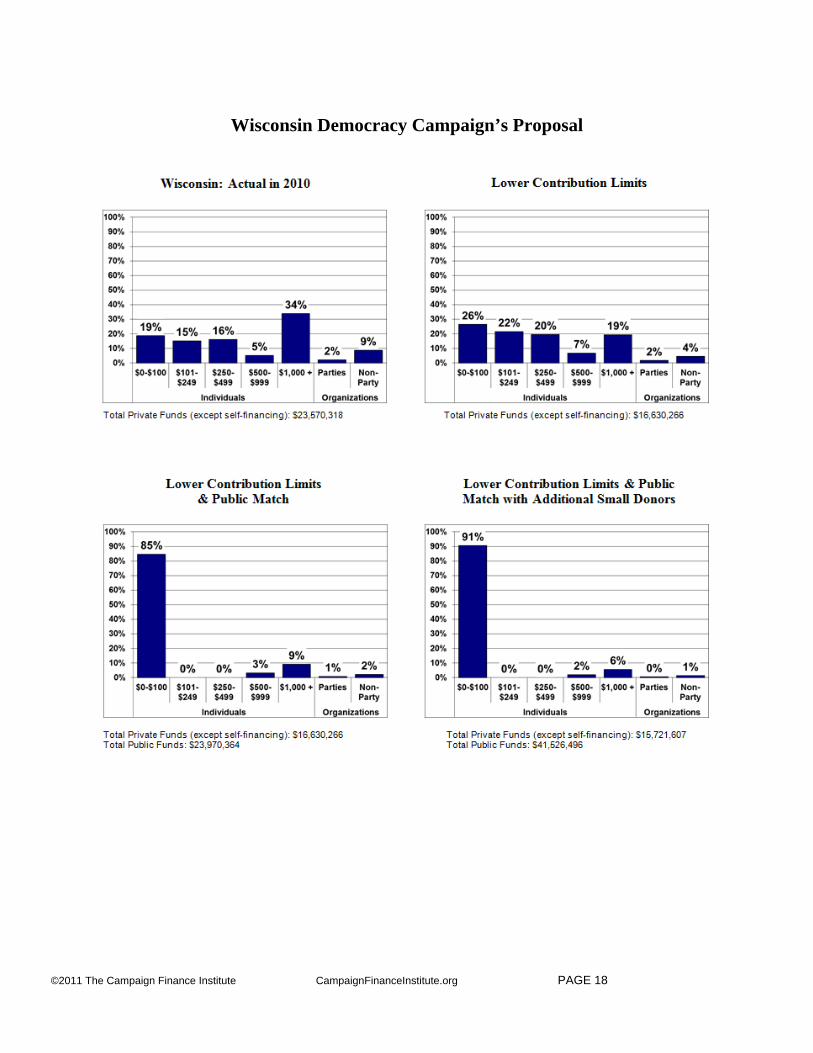
The Campaign Finance Institute estimates that this combination of policies would have extraordinarily powerful effects. As in earlier examples, the contribution limits section alone would have only a modest impact, increasing the importance of $100-and-under donors from 19% to 26% of the total. But adding a matching fund to the existing donor pool would have a huge impact, given the incentives built into the proposal. Even with no new participants, small donors would increase their proportional role under this proposal to an impressively high 85%. And combining the match with increased participation would bring the $100-and-under donors to an astounding 91% of the total. At the same time, the role of $1,000-or-more donors would be cut from the current 34% to 6%, while the role of PACs would shrink from 9% to only 1%.
©2011 The Campaign Finance Institute CampaignFinanceInstitute.org PAGE 18
Wisconsin Democracy Campaign’s Proposal
©2011 The Campaign Finance Institute CampaignFinanceInstitute.org PAGE 19
Partial Flat Grants versus Matching Funds – Minnesota Hypothetical: Public Financing in the Wake of the Arizona Free Enterprise decision
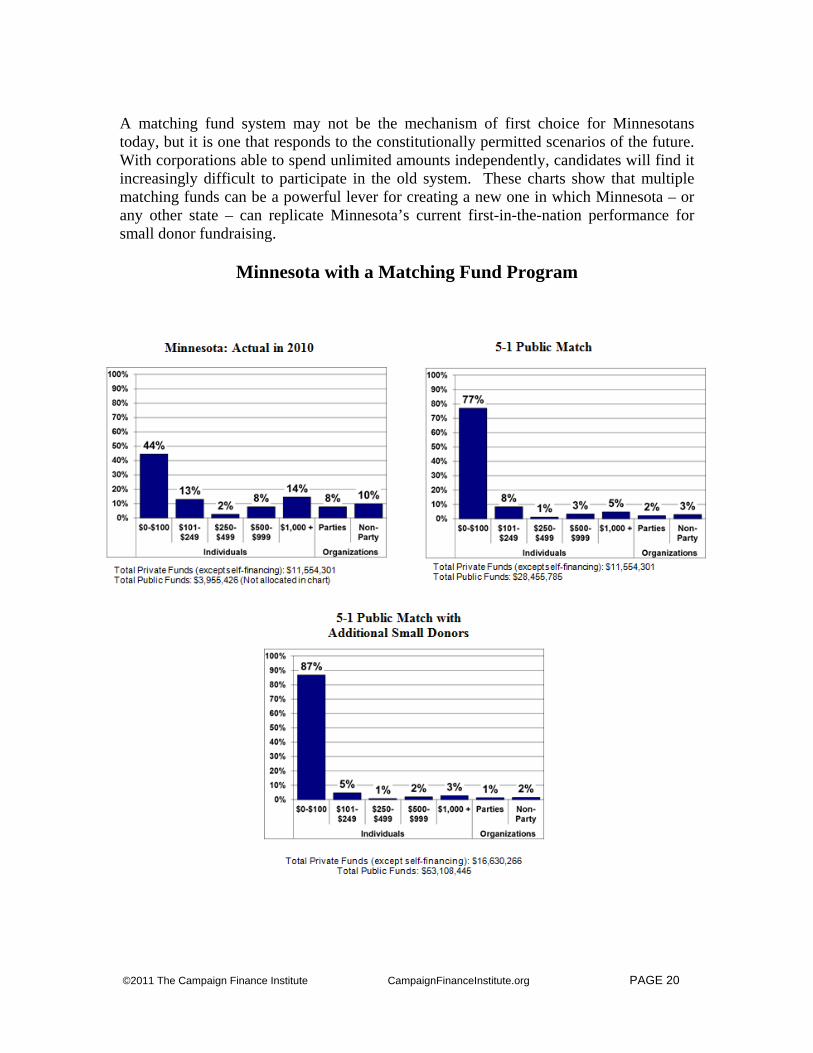
As noted earlier, Minnesota already has a partial public financing system used by a large majority of the general election candidates from both major political parties. Small donors fuel a much higher proportion of Minnesota’s private contributions than any other state in the nation. Nevertheless, there is at least some possibility that the state’s public financing system could become subject to problems within a few years. That could happen if independent spending or self-financing increases, as it has elsewhere, and if candidates consider spending limits too risky in such an environment. In either of these situations, spending ceilings can become a trap for public funding participants. Some states tried to respond by offering extra public funds to candidates who face high spending opponents or independent spending , but the Supreme Court held such a provision to be unconstitutional in Arizona Free Enterprise Club v. Bennett (June 2011). By saying that states may not respond to high spending non-participants or independent spending with trigger funds, the Court’s decision is likely to make candidates feel uncomfortable with spending limits. Public financing will then deteriorate over time as candidates opt out. This is what happened to the federal presidential system as well as to the system in Wisconsin. While Minnesota’s system is still used by most candidates from both major political parties, there was a ten percentage point drop in usage between 2006 and 2010. In this situation, supporters of public financing might prefer to shift to a system that does the following: (1) maintains current contribution limits; (2) replaces the current partial grant system with multiple matching funds; (3) puts a maximum on the amount of public money a candidate may receive in matching funds; and (4) lets candidates continue to raise funds without limit, as long as the funds come from small contributions. Such a system would be similar to one being considered in several states. The following charts show that if a multiple-matching fund system were adopted, Minnesota’s candidates would continue to raise the bulk of their private funds from small donors and the matching funds would more than replace the lost grants. The first chart shows where the funds actually came from in 2009-2010, when candidates raised 44% of their private money from donors who gave them $100 or less. If the flat grant were replaced by a matching fund, the new system would easily replace the lost money and then some. According to the National Institute of Money in State Politics, the public subsidy to candidates amounted to about $4.5 million in 2010 and $4.7 million in 2006. Providing a five-for-one match for each donor’s first $50 would generate more than $28 million in public matching money, even if no new donors came into the system. It would generate $53 million with new donors. At these levels, the under-$100 donors would be responsible for 77%-87% of the candidates’ money. Of course, Minnesotans might balk at expenditures above current levels. In that case, public spending could be controlled by limiting the maximum subsidy per candidate, rather than candidates’ spending.
©2011 The Campaign Finance Institute CampaignFinanceInstitute.org PAGE 20
A matching fund system may not be the mechanism of first choice for Minnesotans today, but it is one that responds to the constitutionally permitted scenarios of the future. With corporations able to spend unlimited amounts independently, candidates will find it increasingly difficult to participate in the old system. These charts show that multiple matching funds can be a powerful lever for creating a new one in which Minnesota – or any other state – can replicate Minnesota’s current first-in-the-nation performance for small donor fundraising.
Minnesota with a Matching Fund Program
©2011 The Campaign Finance Institute CampaignFinanceInstitute.org PAGE 21
Conclusion
For several decades, campaign finance debates have been polarized between the advocates of a laissez-faire market that will naturally be dominated by wealthy donors, versus those who would respond to the power of wealth through restrictions. This report shows there to be another path. The system can be transformed through positive incentives designed to foster participation by small donors. The wealthy and powerful will continue to be heard, but there will be alternatives. Small donors will be asked to give and to volunteer because candidates will have an incentive to do so. Citizens will respond because they will know that their voices will matter. Two objections will be raised to such an approach. The first will be based on a healthy skepticism about whether the hypotheticals will work in practice. In response: the scenarios presented here build on initiatives that in fact exist elsewhere. Matching funds have worked as effective incentives in a host of fundraising venues outside of politics. Within campaign finance, the scenarios in this report closely resemble the six-for-one small-donor matching fund system in place for municipal elections in the City of New York. The Campaign Finance Institute’s previously published research has shown the New York City system to be highly effective.7 The system is simple, and it works. A second objection will come from those who simply oppose any form of public financing. To this objection, we would note that under a matching fund system, no public money would go to a candidate unless it matches money from a donor who puts “skin in the game.” Rather than a so-called program of “welfare for politicians”, the matching format is more accurately described as “empowerment for citizens”. The debate will turn on a question of principle. Is such empowerment an appropriate use of public funds? The argument in favor of matching funds is that citizen engagement is a public good. It is not constitutionally acceptable to promote this good through restrictions on speech, but it is permissible and we believe appropriate to use public resources promote it affirmatively. Of course this will not be easy to sell politically. This report is not meant to address the issue’s politics. But it does show that such an approach, if adopted, would be likely to have a very strong substantive impact.
©2011 The Campaign Finance Institute CampaignFinanceInstitute.org PAGE 22
ENDNOTES
1 Anthony J. Corrado, Michael J. Malbin, Thomas E. Mann and Norman J. Ornstein, Reform in an Age of Networked Campaigns: How to Foster Citizen Participation through Small Donors and Volunteers. Published jointly in 2010 by The Campaign Finance Institute, Brookings Institution and American Enterprise Institute and available at: http://cfinst.org/Press/PReleases/10-01-14/Reform_in_an_Age_of_Networked_Campaigns.aspx. 2 R.G. Boatright and M.J. Malbin, "Political Contribution Tax Credits and Citizen Participation,” American Politics Research, Vol. 33, No. 6 (2005), pp. 787-817 and R.G. Boatright, D.P. Green and M.J. Malbin, "Does Publicizing A Tax Credit for Political Contributions Increase Its Use? Results from a Randomized Field Experiment," American Politics Research Vol. 34, No. 5, pp. 563-582 (2006). 3 David Rosenberg, Broadening the Base: The Case for a New Federal Tax Credit for Political Contributions (Washington DC: American Enterprise Institute, 2002), p.48. 4 Sasha Horwitz, Public Campaign Financing in Michigan: Driving Towards Collapse? (Los Angeles, CA: Center for Governmental Studies, 2008). Available at: http://cgs.org/images/publications/cgs_mi_final_081808.pdf Accessed Feb. 22, 2011. 5 State of Wisconsin, Governor's Blue Ribbon Commission on Campaign Finance Reform, Report of the Commission, Part 1, p. 22 (May 1997). 6 Wisconsin Democracy Campaign, "Money in Wisconsin Politics Index", Nov. 23, 2009. http://www.wisdc.org/moneyinpolitics.php. Accessed February 21, 2011. 7 Michael J. Malbin and Peter W. Brusoe, "Small Donors, Big Democracy: New York City’s Matching Funds as a Model for the City and States." Campaign Finance Institute Working Paper, Dec. 2010. http://www.cfinst.org/pdf/state/NYC-as-a-Model_Malbin-Brusoe_Dec1.pdf