9th dutch flemish meeting presentation serlie mol
14
What will personnel selection look like in 2030? Towards a research agenda Alec Serlie & Stefan Mol
Transcript of 9th dutch flemish meeting presentation serlie mol

What will personnel selection look like in
2030?Towards a research agenda
Alec Serlie & Stefan Mol

Some upcoming personnel selection challenges…
Changing labour supply and demand and anticipated effects on base rate, Selection ratio’s and utility of personnel selection
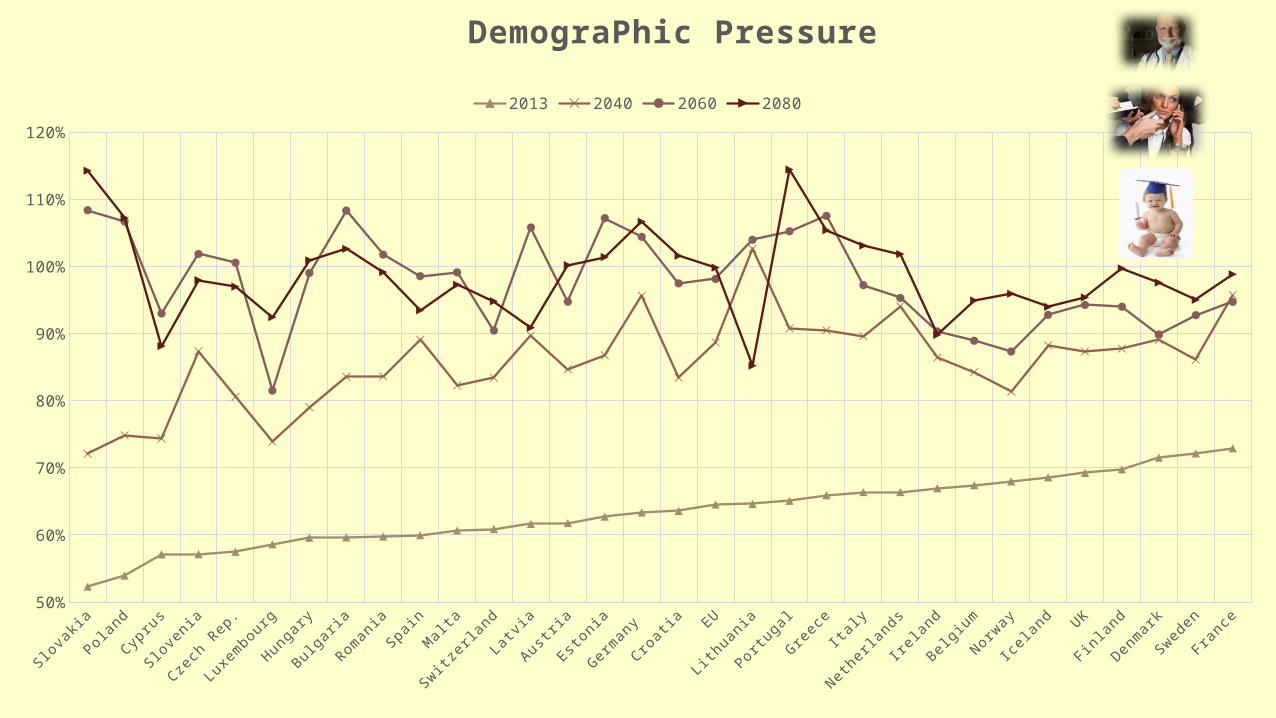
Demographics and Educational level
Aging population
Labour mobility
Robotization
Changing nature of job analysis and potential for disaggregation of jobs
Changing data sources available to personnel psychologists
Slova
kia
Po land
Cyprus
Slove
nia
Czech R
ep.
Luxem
bourg
Hungary
Bulgar i
a
Romania
Spain
Malt
a
Switze
r land
Latvia
Austr i
a
Estonia
Germ
any
Croati
a EU
Lithuania
Portugal
Gre
eceIta ly
Nether l
ands
Ire la
nd
Belgiu
m
Norway
Ice la
nd UK
Finla
nd
Denm
ark
Sweden
France
50%
60%
70%
80%
90%
100%
110%
120%
DemograPhic Pressure
2013 2040 2060 2080

Unemployment rates Europe 2013
GreeceSpain
Croatia
Portugal
Cyprus
Slovakia
Ireland
Bulgaria Italy
Latvia
Lithuania EU
Poland
Hungary
Slovenia
France
Estonia
Belgium
Finland
Sweden UK
Romania
Denmark
Czech
Republic
Netherlands
Malta
Luxe
mbourg
Iceland
Germany
Austria
Switzerla
nd
Norway
0
5
10
15
20
25
30
27.526.2
17.617.0
16.1
14.313.3 13.0
12.4 12.1 12.011.0 10.5 10.3 10.3 9.9
8.9 8.5 8.3 8.2 7.7 7.6 7.2 7.0 6.7 6.55.9 5.5 5.4 5.0 4.5
3.5
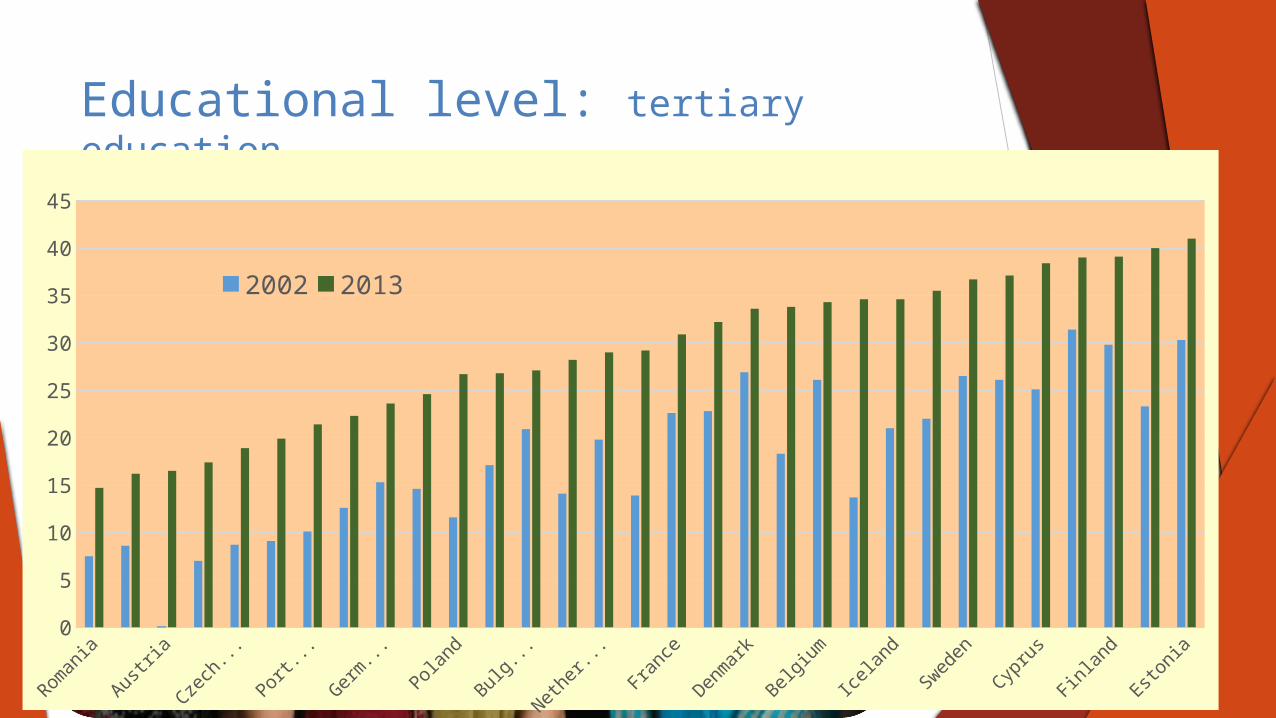
Educational level: tertiary education
RomaniaIta
ly
Austria
Malta
Czech
Rep.
Slovakia
Portugal
Hungary
Germany
Greece
PolandEU-28
Bulgaria
Switzer..
.
Netherl...
Slovenia
FranceSpain
DenmarkLa
tvia
Belgium
Luxe
mb...
Iceland
Lithuania
Sweden UK
Cyprus
Norway
Finland
Ireland
Estonia
0
5
10
15
20
25
30
35
40
45
2002 2013


Robotisation
8
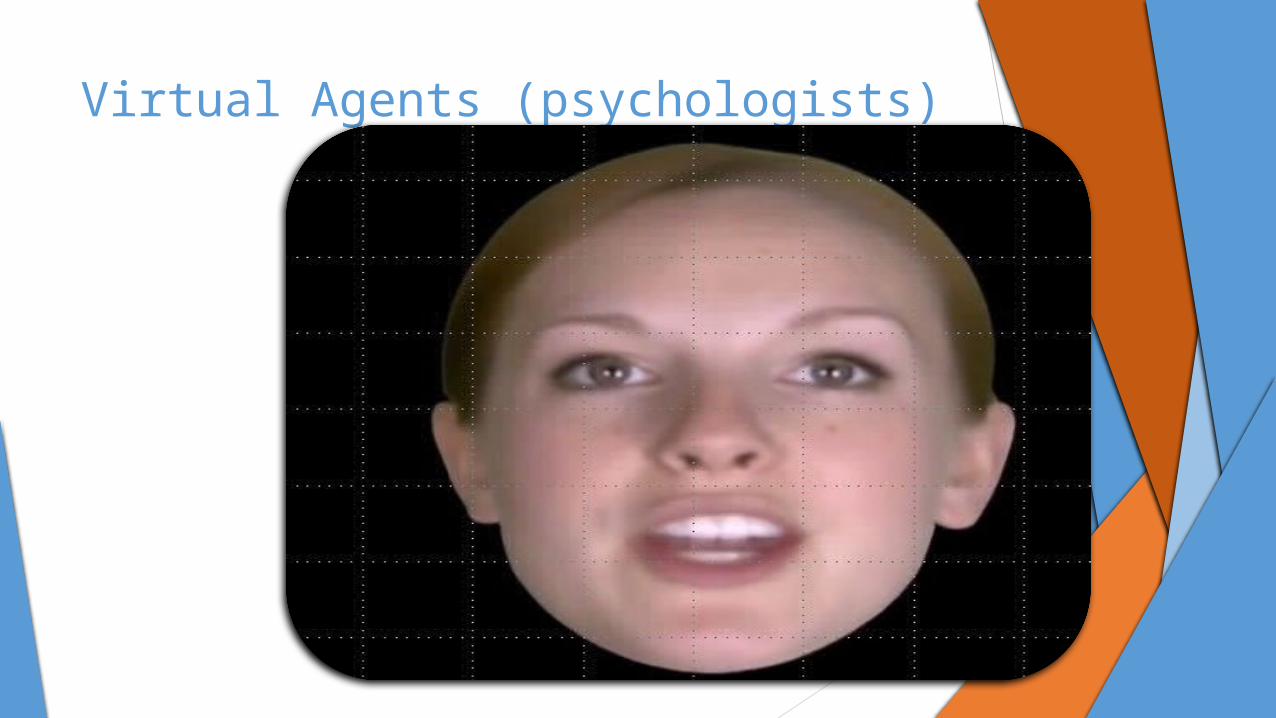
Virtual Agents (psychologists)
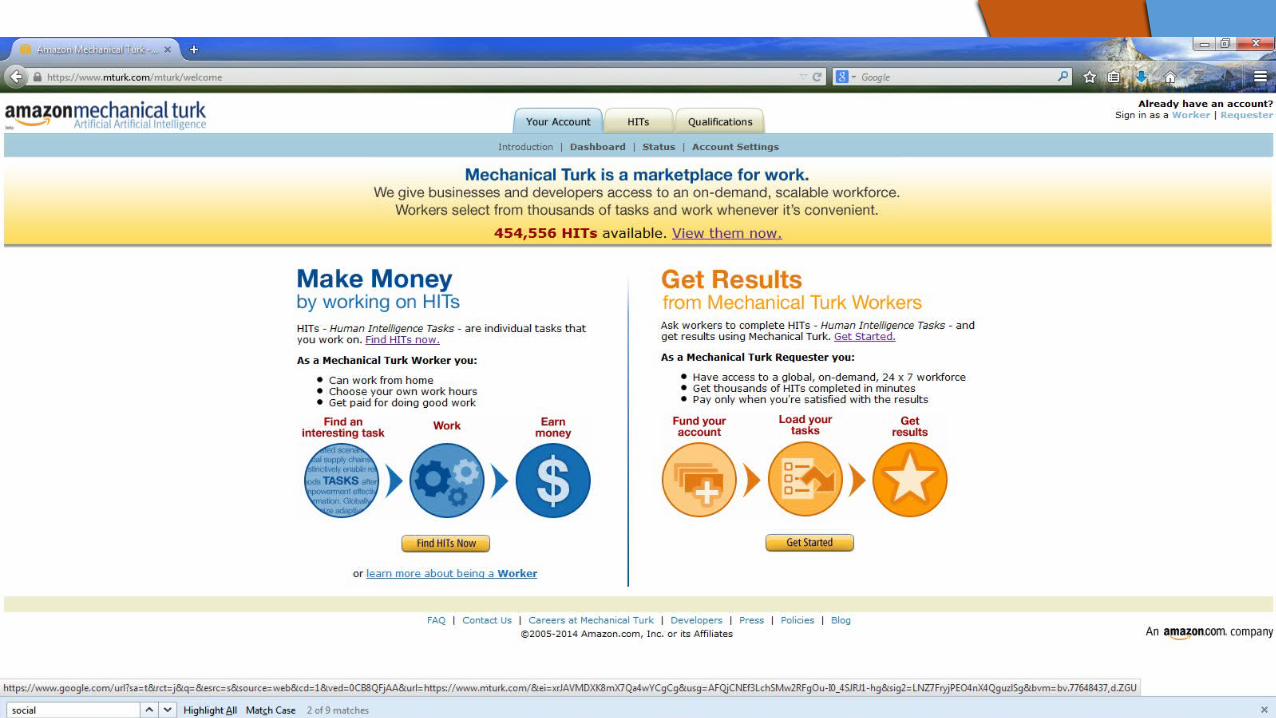

Data Sources:Social Media
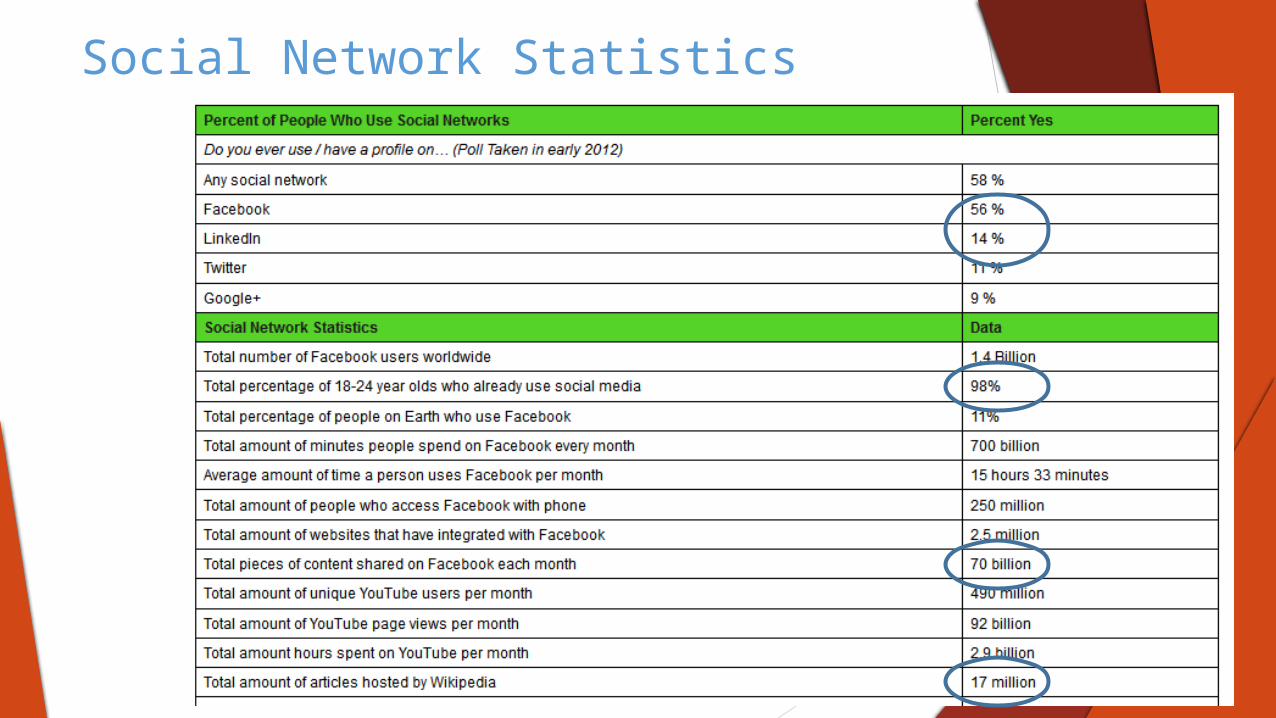
Social Network Statistics

Personnel Selection Consequences in 2030
Employers Employees Researchers
What the same
What different
Selection Ratio
Validity

Labour Market Challenges for the coming Era
Demographics
Aging Population
Educational Level
Social Media
Flex-security
Robotisation
Labour Mobility / Virtual Teams

Flex-security:Self-employed workers / Travailleurs indépendants
Definition:
Self-employed workers are persons who are the sole owners, or joint owners, of the unincorporated enterprises in which they work, excluding those unincorporated enterprises that are classified as quasi-corporations.
EU-2
8
Bulga
ria
Denm
ark
Esto
nia
Greec
e
Fran
ceIta
ly
Latv
ia
Luxe
mbo
urg
Mal
ta
Austri
a
Portu
gal
Slov
enia
Finl
and UK
Norway
0%
5%
10%
15%
20%
2004 2009 2013 average