Industry 4.0 | Manufacturing 4.0 | Industria 4.0 | 4ta Rivoluzione Industriale

9M 2019Analyst Meeting
8 November 2019

2
This presentation and the discussion that follows may contain forward-looking statements that involve known and unknown risks, uncertaintiesand other factors that may cause the actual results, performance orachievements of MindChamps PreSchool Limited (the “Company”) and itssubsidiaries or related entities (the “Group”) to be materially different fromany future results, performance or achievements expressed or implied bythese forward-looking statements. None of the Group, its advisers, or itsrepresentatives, is representing or warranting that the Group’s actual futureresults, performance or achievements will be as discussed in such forward-looking statements. Investors are advised that the actual performance,achievements, investment decisions and operations of the Group mayvary significantly from such statements. This presentation is for informationpurposes only and does not constitute or form any part of an offer of, orinvitation or solicitation to purchase or subscribe for, any shares or securitiesin any jurisdiction in the Company. None of the Group, its advisers, or itsrepresentatives, shall be liable whatsoever for any loss arising, whetherdirectly or indirectly, from any use or distribution of this presentation or thecontents herein.
Disclaimer

Presented by Mr. David Chiem Phu An
Founder Chief Executive Officer and Executive Chairman
Business Updates

Presented by Mr. Teo Wee Jone
Chief Financial Officer
Performance Highlights

5
IPO Proceeds – Fully Deployed as Planned
Use of proceeds
Amount
allocated
(S$’Mil)
Amount
utilised
(S$’Mil)
Amount
unutilised
(S$’Mil)Partial repayment of drawn down and
outstanding amounts under Acquisition Loan (as
defined in the Prospectus)
6.1 (6.1) -
For payment of underwriting commissions and
IPO expenses
3.0 (3.0) -
For funding of our expansion plans, including
potential acquisitions
34.5 (34.5) -
For general corporate and working capital
purposes
4.0 (4.0) (1) -
Total 47.6 (47.6) -
(1) The general corporate and working capital of S$4.0 million was used for the provision of security deposits to
landlords to secure the leases and the payments of monthly operational commitments for newly acquiredpreschool centres in FY2018 and FY2019.

6
MindChamps Early Learning @ Frenchs Forest
No. of centres No. of students
Q3
2018
Q3
2019
9M
2018
9M
2019
Group
comprising
of:
71 82 4,179 5,240
AU 10 20 670 1,324
SG 52 51 3,345 3,552
Others 9 11 164 364
Key Performance Indicators
15% 25%
98%
N.M.
6%
100%
22%
2%

7
Movements:
M&A Loan Interest (1,051)
M&A Due D. Fees (302)
SFRS(I) 16 Effects (700)
Movements:
(347) M&A Loan Interest (1,051)
(250) M&A Due D. Fees (302)
- SFRS(I) 16 Effects (700)
Movements:
M&A Loan Interest (468)
SFRS(I) 16 Effects (365)
Movements:
(167) M&A Loan Interest (468)
(155) M&A Due D. Fees -
- SFRS(I) 16 Effects (365)
Key Financial Indicators
Financial Highlights (S$’000)
Q3 2018 Q3 2019 9M 2018 9M 2019
Operating
Cashflow3,037 2,797 3,141 7,901
Revenue 9,172 15,607 22,829 38,080
Cost of Sales (3,995) (7,787) (9,342) (18,502)
Gross Profit 5,177 7,820 13,487 19,578
Operating
Expenses(4,523) (7,611) (12,238) (18,753)
Operating Profit 1,691 1,207 3,882 3,417
Profit Before Tax 1,302 322 3,155 1,273
Profit After Tax 1,167 339 2,725 1,084
29%
70%
95%
69%
67%
98%
54%
75%
71% 60%
60%
12%
51% 45%
Narratives:
Acquired COCOs have contributed
significant increase in operating cash flows;
Increase in Cost of Sales was mainly due to
increase in teachers in the acquired
COCOs;
Increase in Operating Expenses was
mainly due to increase in rental related
expenses from acquired COCOs;
SFRS(I) 16 effects, M&A Due Diligence Fees
and Interest Expenses lowered Profit Before
Tax and Profit After Tax; and
Business integration of acquired COCOs in
progress to enhance profitability.
8%N.M.

8
Growth of MindChamps Centres and PreSchool Students
2,600 2,661
745 891
25 670
1,299 164
364
4,179
5,240
9M 2018 9M 2019
FOFO Centres (Overseas)COCO Centres (Australia)FOFO Centres (Australia)COCO Centres (Singapore)FOFO Centres (Singapore)
1,061
25%
45 42
7 91
1019
9
1171
82
9M 2018 9M 2019
FOFO Centres (Overseas)COCO Centres (Australia)FOFO Centres (Australia)COCO Centres (Singapore)FOFO Centres (Singapore)
Total Number of MindChamps Centres Total Number of PreSchool Students
11
15%
9
100%
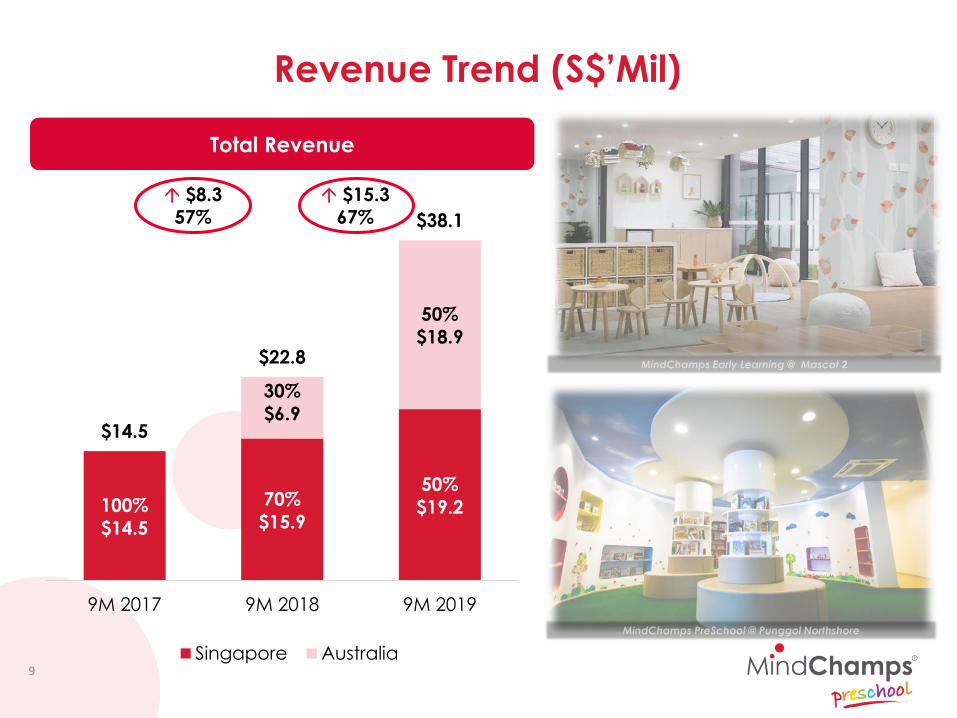
$14.5
70%
$15.9
50%
$19.2
30%
$6.9
50%
$18.9
$14.5
$22.8
$38.1
9M 2017 9M 2018 9M 2019
Singapore Australia
Total Revenue
Revenue Trend (S$’Mil)
$8.3
57%
$15.3
67%

10
AU Education
$18.9
49%
SG Franchise
$5.6
15%
SG Education
$13.6
36%
AU Education
$6.9
30%
SG Franchise
$4.9
22%
SG Education
$11.0
48%
9M 2018 9M 2019
Total: $22.8 Total: $38.1
Revenue Mix – Growth in Australia (S$’Mil)

11
Total Operating Cost Trend – Growth in Australia (S$’Mil)
100%
$12.5
71%
$15.3
48%
$17.7
29%
$6.3
52%
$19.5
$12.5
$21.6
$37.2
9M 2017 9M 2018 9M 2019
Singapore Australia
Total Operating Costs (COS + OPEX)
$9.1
73%
$15.6
72%
(In tandem with 67% revenue growth)
(In tandem with 57% revenue growth)

12
(S$’000) Q3 2019 Q3 2018 Variance Variance (%)
Revenue 15,607 9,172 6,435 70%
Cost of Sales (7,787) (3,995) 3,792 95%
Gross Profit 7,820 5,177 2,643 51%
GP Margin 50% 56% (6%)
Other Income 998 1,037 (39) (4%)
Operating Expenses (7,611) (4,523) 3,088 68%
Operating Profit 1,207 1,691 (484) (29%)
OP Margin 8% 18% (10%)
Foreign Exchange Loss (52) (67) (15) (22%)
Non-Operating Expenses (833) (322) 511 N.M.
Profit Before Taxation 322 1,302 (980) (75%)
PBT Margin 2% 14% (12%)
Income Tax Credit / (Expense) 17 (135) 152 N.M.
Profit After Tax 339 1,167 (828) (71%)
PAT Margin 2% 13% (11%)
Consolidated Income StatementQ3 2019 vs Q3 2018
N.M: Not Meaningful

13
Consolidated Income Statement9M 2019 vs 9M 2018
N.M: Not Meaningful
(S$’000) 9M 2019 9M 2018 Variance Variance (%)
Revenue 38,080 22,829 15,251 67%
Cost of Sales (18,502) (9,342) 9,160 98%
Gross Profit 19,578 13,487 6,091 45%
GP Margin 51% 59% (8%)
Other Income 2,592 2,633 (41) (2%)
Operating Expenses (18,753) (12,238) 6,515 53%
Operating Profit 3,417 3,882 (465) (12%)
OP Margin 9% 17% (8%)
Foreign Exchange Loss (91) (130) (39) (30%)
Non-Operating Expenses (2,053) (597) 1,456 N.M.
Profit Before Taxation 1,273 3,155 (1,882) (60%)
PBT Margin 3% 14% (11%)
Income Tax Expense (189) (430) (241) (56%)
Profit After Tax 1,084 2,725 (1,641) (60%)
PAT Margin 3% 12% (9%)

14
(S$’000) 30.09.19 31.12.18 Variance Variance (%)
Current Assets 24,036 47,584 (23,548) (49%)
Non-Current Assets 120,052 46,144 73,908 N.M.
Total Assets 144,088 93,728 50,360 54%
Current Liabilities 29,945 17,174 12,771 74%
Non-Current Liabilities 56,042 15,868 40,174 N.M.
Total Liabilities 85,987 33,042 52,945 N.M.
Net Assets 58,101 60,686 (2,585) (4%)
Capital and Reserves Attributable to
Equity Holders of the Company
58,302 60,735 (2,433) (4%)
Non-Controlling Interests (201) (49) (152) N.M.
Total Equity 58,101 60,686 (2,585) (4%)
Consolidated Balance Sheet
N.M: Not Meaningful

15
(S$’000) Q3 2019 Q3 2018
Net Cash Provided by Operating Activities 2,797 3,037
Net Cash Used in Investing Activities (3,973) (14,024)
Net Cash (Used in)/Provided by Financing Activities (1,746) 9,603
Net Decrease in Cash and Cash Equivalents (2,922) (1,384)
Cash and Cash Equivalents at Beginning of Financial Period 12,593 33,165
Effects of Currency Translation on Cash and Cash Equivalents (61) (37)
Cash and Cash Equivalents at End of Financial Period 9,610 31,744
Consolidated Statement of Cash Flows Q3 2019 vs Q3 2018
16
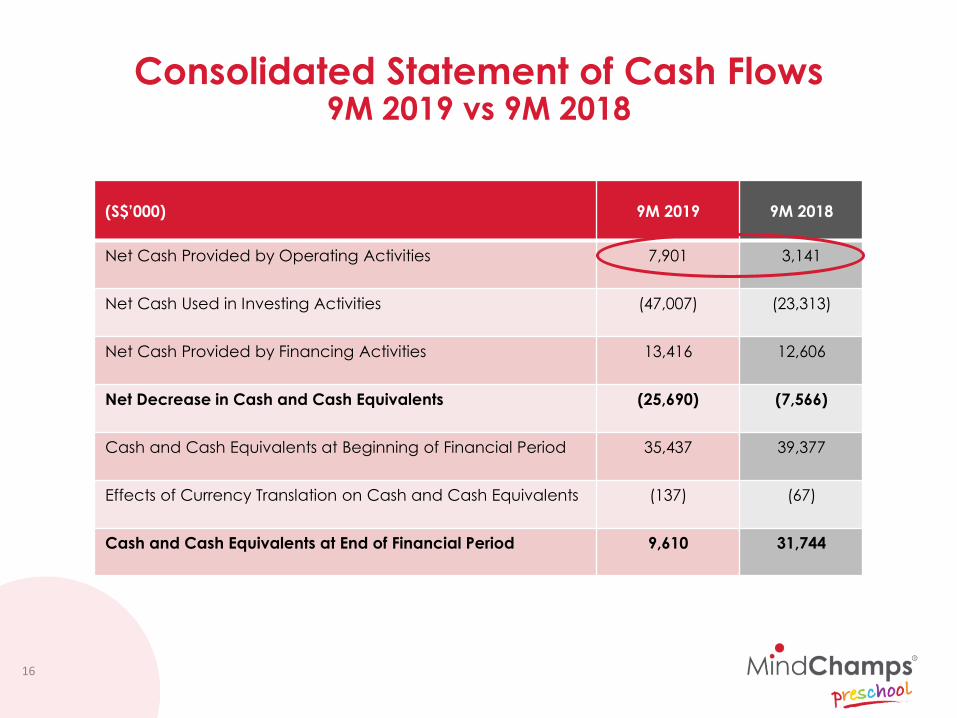
(S$’000) 9M 2019 9M 2018
Net Cash Provided by Operating Activities 7,901 3,141
Net Cash Used in Investing Activities (47,007) (23,313)
Net Cash Provided by Financing Activities 13,416 12,606
Net Decrease in Cash and Cash Equivalents (25,690) (7,566)
Cash and Cash Equivalents at Beginning of Financial Period 35,437 39,377
Effects of Currency Translation on Cash and Cash Equivalents (137) (67)
Cash and Cash Equivalents at End of Financial Period 9,610 31,744
Consolidated Statement of Cash Flows 9M 2019 vs 9M 2018

Q&A Session

18
Capital
• Fully deployed S$47.6million of IPOproceeds
Operational Highlights
• No. of company owned centres up by 65%, from 17 to 28;
• No. of all MindChamps centres up by 15%, from 71 to 82; and
• PreSchool students • up by 25%, from 4,179 to
5,240.
Financial Highlights
• 9M operating cash flow • up by $4.8mil;
• 9M revenue up by 67%, from $22.8mil to $38.1mil; and
• 9M operating profit remains stable at $3.4mil.
• Future Plans
• Focusing on maximisingprofitability of acquired COCOs; and
• Proliferating the Australia Franchise
Segment.

Thank You!


![Influences of the Industry 4.0 Revolution on the Human Capital … · 2020. 5. 14. · Sustainability 2020, 12, 4035 3 of 28 structured intelligent factory [13]. Industry 4.0 aims](https://static.fdocuments.in/doc/165x107/613b222af8f21c0c8268d4ed/influences-of-the-industry-40-revolution-on-the-human-capital-2020-5-14-sustainability.jpg)

