9m 2018 Results - eltechanemos.gr · 9m 2018 Results 3 Financial highlights Revenues Increased by...
14
9m 2018 Results December 2018
-
Upload
nguyennguyet -
Category
Documents
-
view
216 -
download
0
Transcript of 9m 2018 Results - eltechanemos.gr · 9m 2018 Results 3 Financial highlights Revenues Increased by...

9m 2018Results
December 2018

9m 2018 Results
2
Calendar of main events (01 – 09/2018)
Energy yield & performance +22,6% energy yield 26,9% capacity factor 98,7% weighted average availability
New capacity 45,9 MW wind farms (17,1 MW Kalogerovouni , 9,9 MW Pefkias, 18,9 MW Gropes) in commercial operation 6,4 MW wind farm (Tetrapolis Extension) TOCs(1) expected by end-2018
Projects under construction
90 MW (Kassidiaris I & II)− WTG(2) transportation from manufacturing facilities to site, ongoing− BoP(3) construction works, ongoing
76,8 MW (Askio East & Askio West)− WTG(2) supply agreements, in place− BoP(3) construction works, ongoing
28,8 MW (Eptadendros)− WTG(2) supply agreements, in place− BoP(3) construction works, ongoing
Project financing Approval of c. € 80,9 m loan for restructuring older, project finance loans (10 operating plants) Approval of c. € 73,7 m loans to finance new wind farm capacity
(1) Take Over Certificates(2) Wind Turbine Generator(3) Balance of Plant works: Civil and Electrical works

9m 2018 Results
3
Financial highlights
Increased by 21,4%Revenues• Reached € 42,7 m vs € 35,2 ml in 9m 2017, reaping the rewards of both, a windy period with capacity factor rise by
roughly +11% (from 24,3% to 26,9%) and +19% rise in operating capacity (from 243,2 MW to 289,1 MW).
Increased by 30,7%EBITDA• Increased to € 33 m vs € 25,3 m due to increased energy yield & revenues.
• EBITDA margin rose to 77,3% vs. 71,8%.
Increased by 42,4%EBT• Increased to € 14,5 m vs € 10,2 m in 9m 2017, reflecting improvement in all P&L figures.
Increased by 52,8%EAT after minorities• Increased to € 10,4m vs € 6,8 m in 9m 2017.
Increased by 8,1%Net debt• € 186,4 m vs € 172,3 m as of 31.12.2017 due to ongoing heavy investment program in new wind farm capacity.
Off-taker accelerates paymentsReceivables
• Receivables stood constant at roughly € 20 m, but with accelerated Off-taker payments (delays dropped from 5 to 4 months total) and increased operating capacity (243,2 MW to 289,1 MW).
• Positive outlook retained following RES Account restructuring according to law 4414/2016.

9m 2018 Results
4
Evolution of key P&L figures (IFRS in € m)
Revenues EBITDA & EBITDA margin (%)
Profit before Tax Net Income after Minorities
40,145,2
49,7
35,2
42,7
0
10
20
30
40
50
60
2015 2016 2017 9m '17 9m '18
in €
m 28,131,3
33,4
25,3
33,0
70,1% 69,2% 67,2%71,8%
77,3%
0%
20%
40%
60%
80%
100%
0
10
20
30
40
50
2015 2016 2017 9m '17 9m '18
in €
m
12,1
15,0
12,8
10,2
14,5
0
2
4
6
8
10
12
14
16
2015 2016 2017 9m '17 9m '18
in €
m
6,9
9,9 9,6
6,8
10,4
0
2
4
6
8
10
12
2015 2016 2017 9m '17 9m '18
in €
m

9m 2018 Results
5
Evolution of key Balance Sheet figures (IFRS in € m)
Total Assets Total Equity
Net Debt
Wind farms (18): 282,15 MW
Small hydro (1): 4,95 MW
PV (1): 2,00 ΜWp
TOTAL (20): 289,10 MW
Operating power plants (as of 30.09.2018)
328,6352,6
409,3446,5
0
100
200
300
400
500
2015 2016 2017 9m '18
in €
m
122,4132,7
139,7150,2
0
40
80
120
160
2015 2016 2017 9m '18
in €
m123,2 124,0
172,3186,4
0
50
100
150
200
2015 2016 2017 9m '18
in €
m

9m 2018 Results
6
RES Asset Portfolio (11/2018)
RES operating plants & pipeline projects by Geography
(MW)
RES projects by development phase
(1) The 429 MW pipeline includes 21 MW of non-wind projects.
Wind (Operating)
Wind (Under Construction)
(MW)
48.2
6.4
24.3
39.1
90.0
60.5
98.09.0
40.0
114.8
15.0
1.2
Small-hydro (operating)
Solar PV (operating)
5.0
2.0
174.8
6.0
69.6
9.9
RES (Pipeline)
76.8
510
311
118
196
296
Application Productionpermit
Environmentalterms
UnderConstruction
Operating
429MW
Pipeline
(1)
Source: EL.TECH. ANEMOS Management
28.8
6,4 MW Tetrapolis Extension W/F (commissioning, TOCs expected by end-2018).
9m 2018 Results
7
Strategy Going Forward – Maintain Growth Profile
Business Model
Market Segment
Base is and will continue to be Greece− gross energy consumption anticipated to rise from 20% target in 2020 to 30% by 2030(1)
− € 8,5 billion investments in renewables for electricity generation(1)
Focus on WIND
Track & adapt to market developments (incl. storage technologies & offshore wind, expected to gradually become feasible & competitive)
Evaluating investment opportunities (significant consolidation expected during the 2020’s)
Continue to develop pipeline with high quality sites (capacity factors in line with historic values)
Development in-house, outsourcing of O&M directly to the wind turbine manufacturers and close in-house supervision
Leverage on scalable operational model
Funding
Capitalise on available funding sources
Maintain strong banking relationships
Seek to improve existing debt terms and conditions
(1) Hellenic Ministry of Environment & Energy, Draft “National Energy Planning”, Nov. 2018 (in public consultation).

9m 2018 Results
8
2018 – 2020 investment program (202 MW)
(1) Long term average generation based on certified wind measurements
PROJECTS' IDs (11/2018)
Site MW GWh/yr(1) Wind Turbine Generator €/ΜWh Status
Tetrapolis Ext. Kefalonia 6,4 16 Enercon E-48/0,8 MW FiP 98 Commissioning
Kassidiaris I Ioannina 50,4 114 Vestas V 136/3,6 MW FiP 98 Under construction
Kassidiaris II Ioannina 39,6 77 Vestas V 136/3,6 MW FiP 98 Under construction
Askio East Kozani 36,6 75 Vestas V 136/4,2 & 3,6 MW FiP 98 Under construction
Askio West Kozani 40,2 98 Vestas V 136/4,2 & 3,6 MW FiP 98 Under construction
Eptadendros Thrace 28,8 65 Vestas V117/3,6 MW FiP 70 Under construction
SUM 202,0 445
CAPEX SCHEDULE (30.09.18) TIME SCHEDULE
2018 2019 2020
H1 H2 H1 H2 H1 H2
Tetrapolis Ext.
Kassidiaris I
Kassidiaris II
Askio East
Askio West
Eptadendros
Mature for construction
Under construction
COD
65
55
74
13
0
10
20
30
40
50
60
70
80
≤ 30.09.18 '18-Q4 '19-H1 '19-H2
Mill
ion
s
≤ 30.09.1832%
Sum remaining
68%

9m 2018 Results
9
Performance
9m 2017 9m 2018
Capacity factor (%) 24,3% 26,9%
Net Income a.m. (€/MWh) 6,8 10,4
Installed capacity (MW) 243,2 289,1
Capacity factors by project 9m 2018 vs. 9m 2017
Wind, hydro, solar
9m 2017 9m 2018
Capacity factor (%) 24,4% 26,8%
Installed capacity (MW) 236,3 282,2
Wind only
Net Income after minorities (€/MWh)
17,5
21,8
0
5
10
15
20
25
2017-9m 2018-9m
0%
5%
10%
15%
20%
25%
30%
35%
40%
2017-9m 2018-9m
9m 2018 Results
10
Power plant Site Company / SPV StakeInstalled Capacity
(MW)
Licensed Capacity
(MW)
Operation License
Date
Energy yield (GWh) Tariffs(€/MWh)
Mean annual
availability
Long Term Yield
(GWh/yr)2015 2016 2017 2015-17(2)
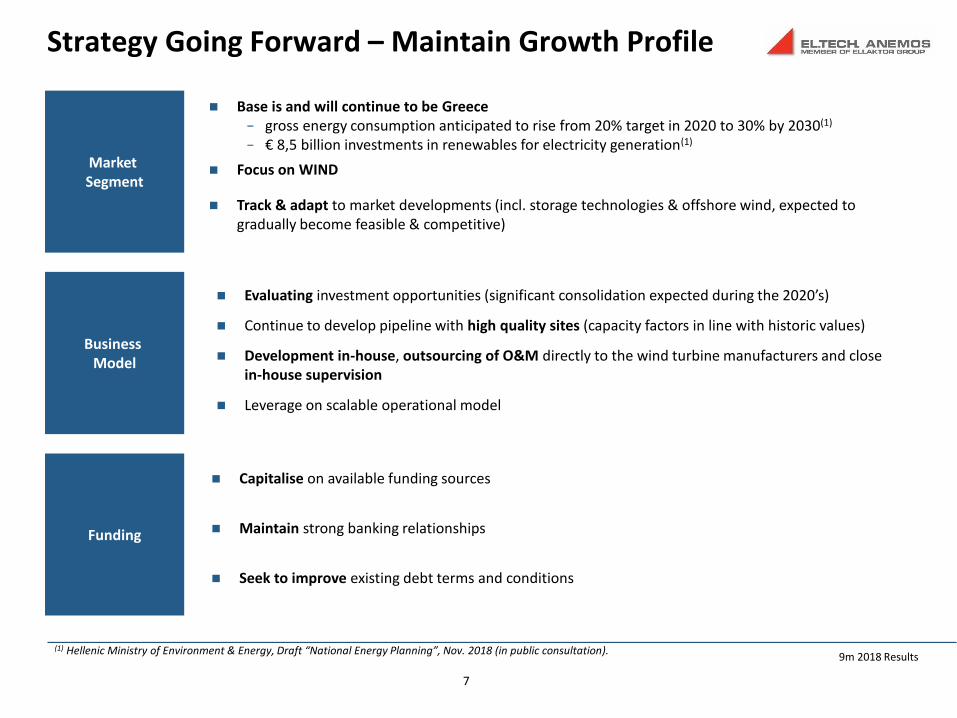
Antissa Lesvos EL.TECH.ANEMOS S.A. 100% 4,20 4,20 Oct-03 10,99 11,65 11,12 93,00 98,72% 12,10
Terpandros Lesvos EL.TECH.ANEMOS S.A. 100% 4,80 4,80 Oct-03 13,88 14,02 13,78 93,00 97,73% 14,94
Tetrapolis Kefalonia EL.TECH.ANEMOS S.A. 100% 13,60 13,60 Jan-06 30,32 33,55 32,49 84,00 97,85% 34,40
Agia Dynati Kefalonia EL.TECH.ANEMOS S.A. 100% 32,2027,20 Apr-09 58,77 64,82 55,52 86,00
98,55%58,10
5,00 Feb-18 --- --- 4,74(1) 98,00 10,68
Ktenias Argolida EL.TECH.ANEMOS S.A. 100% 23,00 20,00 Aug-10 44,51 44,59 44,75 86,00 98,94% 44,30
Lekana (PV) Argolida EL.TECH.ANEMOS S.A. 100% 2,00 2,19 Jul-10 3,19 3,33 3,37 325,00 100,00% 3,26
Magoula Evros EL.TECH.ANEMOS S.A. 100% 23,00 23,00 Aug-11 59,61 60,20 57,24 86,00 98,48% 57,09
Mali Madi Lakonia EL.TECH.ANEMOS S.A. 100% 7,65 7,65 Aug-11 16,81 16,02 16,60 86,00 98,31% 16,24
Vromosykia Troizinia EL.TECH.ANEMOS S.A. 100% 11,05 11,05 Dec-12 34,32 30,48 31,13 89,97 99,27% 31,92
Asprovouni Troizinia EL.TECH.ANEMOS S.A. 100% 20,70 20,00 Nov-12 44,77 45,06 42,84 107,00 98,20% 44,91
Lambousa Troizinia EL.TECH.ANEMOS S.A. 100% 16,10 16,10 Sep-13 47,92 42,84 43,43 89,97 98,99% 43,84
Ortholithi Troizinia EL.TECH.ANEMOS S.A. 100% 20,70 20,00 Jul-15 26,51(1) 48,01 47,49 105,00 99,12% 45,51
Magoula Ext. Evros EL.TECH.ANEMOS S.A. 100% 16,10 16,10 Sep-15 16,41(1) 46,47 46,17 82,00 98,82% 39,72
Lyrkio Arcadia EL.TECH.ANEMOS S.A. 100% 39,60 39,00 Jul-17 --- 2,4(1) 71,74 82,00 98,64% 84,84
Agia Dynati Ext. Kefalonia EL.TECH.ANEMOS S.A. 100% 2,35 2,30 Feb-18 --- --- 2,23(1) 98,00 98,17% 5,02
Kalogerovouni Lakonia ALPHA AIOLIKI MOLAON S.A. 100% 17,10 17,10 May-18 --- --- 5,33(1) 82,00 n/a 44,98
Gropes Lakonia AIOLIKI MOLAON LAKONIAS S.A. 100% 18,90 18,90 Aug-18 --- --- --- 105,00 n/a 43,99
Tetrapolis Ext. Kefalonia EL.TECH. ANEMOS S.A. 100% 6,40 6,40 comm.(3) --- --- --- 98,00 n/a 16,00
Pefkias Viotia THIVAIKOS ANEMOS S.A. 100% 9,90 9,90 Jun-18 --- --- --- 98,00 n/a 28,43
Karpastoni Evia AIOLIKI KARPASTONIOU S.A. 51% 1,20 1,20 Aug-02 4,19 2,78 3,68 87,00 94,25% 3,69
Smixiotiko (Hydro)Grevena SHPP SMIXIOTIKO S.A. 51% 4,95 4,95 Mar-13 12,45 12,11 9,17 89,97 99,56% 12,00
TOTAL 295,50 290,64 381,72 475,93 542,83 695,96
Group Asset Performance Details (11/2018)
(1) Less than 12 months operation(2) Only for full year operation(3) Commissioning

9m 2018 Results
11
Consolidated P&L
Revenues rose by 21,4% reaping the rewards of a windy period & increased capacity.
EBITDA rose by 30,7% as a result of enhanced revenues.
Profit before tax increased by 42,4%.
Net Income after minorities grew by 52,8%, rising from € 6,8 ml € to 10,4 ml €.
30/9/2018 30/9/2017 % change
(€ thousands) IFRS IFRS
Revenue 42.737 35.217 21,4%
Cost of goods sold (21.001) (17.359)
Gross Margin 21.736 17.859
EBITDA 33.044 25.292 30,7%
% Margin 77,3% 71,8%
Administrative expenses (1.674) (1.499)
Other operating income/(expenses) 2.911 561
EBIT 22.973 16.921 35,8%
% Margin 53,8% 48,0%
Financial income/(expenses) (8.491) (6.749)
Profit before Tax 14.482 10.173 42,4%
% Margin 33,9% 28,9%
Income tax (3.870) (3.244)
Net Income 10.612 6.929 53,2%
% Margin 24,8% 19,7%
Parent company equity holders 10.366 6.786 52,8%
Minorities 246 144

9m 2018 Results
12
Consolidated Balance Sheet
Non-current assets increased by 8,8% reflecting increased investments in new capacity (fixed assets) and acquisitions (intangible assets).
Current assets rose by 11,1% primarily due to increased cash.
Total liabilities & shareholders’ equity increased by 9,1%, reflecting enhanced profits & increased bank liabilities to finance the 202 MW ongoing heavy investment program.
30/9/2018 31/12/2017 % change
(€ thousands) IFRS IFRS
Fixed assets 364.551 343.124 6,2%
Intangible assets 23.522 14.437 62,9%
Other non-current assets 3.142 2.062 52,4%
Non-current assets 391.216 359.623 8,8%
Cash & cash equivalents 3.614 2.033 77,8%
Restricted cash 18.070 13.469 34,2%
Available-for-sale financial assets - 1.543 -100,0%
Trade & other receivables 33.567 32.674 2,7%
Current assets 55.252 49.719 11,1%
TOTAL ASSETS 446.468 409.342 9,1%
Total shareholders' equity 150.221 139.687 7,5%
Non-current bank liabilities 179.528 169.100 6,2%
Grants 53.786 50.366 6,8%
Other non-current liabilities 23.642 16.090 46,9%
Non-current liabilities 256.957 235.555 9,1%
Current bank liabilities 28.510 20.261 40,7%
Payables and other current liabilities 10.780 13.840 -22,1%
Current liabilities 39.290 34.101 15,2%
TOTAL LIABILITIES & SHAREHOLDERS' EQUITY 446.468 409.342 9,1%
9m 2018 Results
13
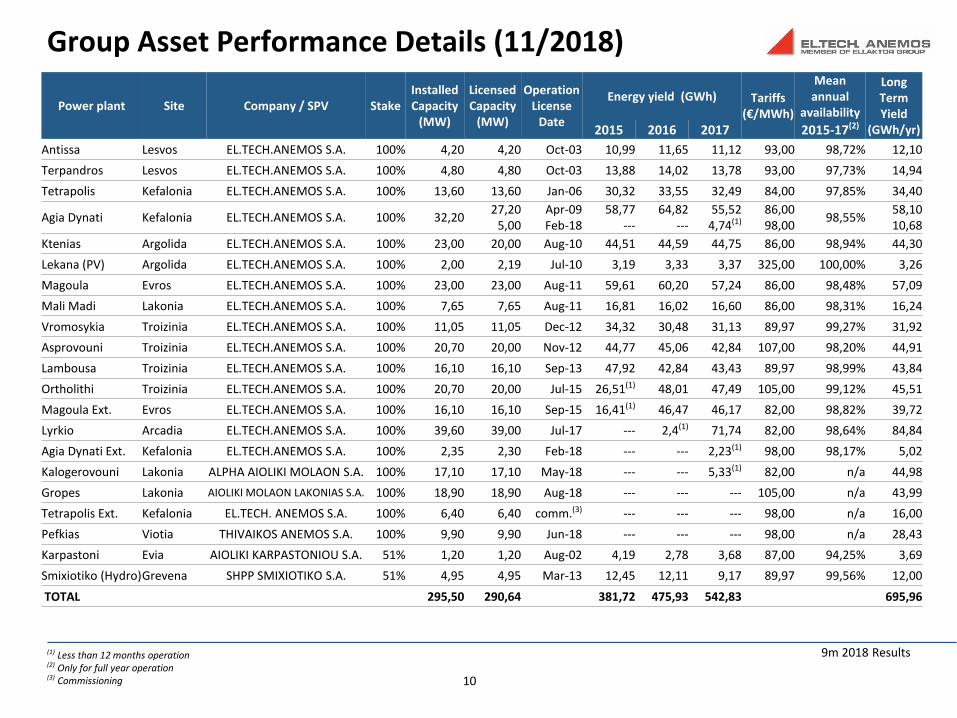
Consolidated Cash Flows
Operating cash flows dropped by -17% reflecting a significant decrease in payables and increased interest paid to finance new capacity.
Total cash outflows from investment activities reached € 35 ml reflecting ongoing investments.
Cash flow from Financing reached €13 ml mainly effected by loan drawdowns to finance new capacity.
30/9/2018 30/9/2017 % change(€ thousands) IFRS IFRSCash Flow from Operations
Profit Before Tax 14.482 10.173 42%Adjustments for:
Depreciation 10.071 8.371Provisions 75 68Profit / Loss from investments (55) 952Interest Expenses 8.512 7.049 21%
Changes in Working Capital:Decrease / (Increase) of receivables 3.535 8.742(Decrease) / Increase of payables (non-debt) (5.197) (2.728)
Less:Interest Paid (7.862) (4.377) 80%Taxes Paid (48) (37)
Total Cash Flow from Operations (a) 23.514 28.212 -17%Cash Flow from Investments
(Acquisition) / Disposal of subsidiaries (3.789) 1.711(Acquisition) / Disposal of Tangible and intangible fixed assets (32.938) (65.781) -50%Interest income received 70 97(Acquisition) / Disposal of Available-for-sale financial assets 1.541 1.903
Total Cash Flow from Investments (b) (35.116) (62.070) -43%Cash Flow from Financing
New Loan drawdown 24.785 92.027Loan Repayment (6.704) (46.610)Finance Lease payments (226) (327)Dividend paid (60) (42)Dividend Tax paid (11) (7)Restricted Cash (4.601) (9.005)
Total Cash Flow from Financing (c) 13.183 36.036 -63%Net Increase / (decrease) in cash and cash equivalents (a)+(b)+(c) 1.581 2.177Starting Cash Balance 2.033 3.981 -49%Period End Cash Balance 3.615 6.159 -41%

9m 2018 Results
14
DisclaimerThis presentation has been prepared by EL.TECH. ANEMOS S.A. (the “Company”).
The information contained in this presentation has not been independently verified and no representation or warranty, express or implied, ismade as to, and no reliance should be placed on, the fairness, accuracy, completeness or correctness of the information or opinions containedherein. None of the Company, shareholders or any of their respective affiliates, advisers or representatives shall have any liability whatsoever (innegligence or otherwise) for any loss howsoever arising from any use of this document or its contents or otherwise arising in connection with thisdocument.
Unless otherwise stated, all financials contained herein are stated in accordance with International Financial Reporting Standards (“IFRS”).
This presentation does not constitute an offer or invitation to purchase or subscribe for any shares and neither it or any part of its half or on thebasis of, or be relied upon or in connection with, any contract or commitment whatsoever.
The information included in this presentation maybe subject to updating, completion, revision and amendment and such information may changematerially. No person is under any obligation to update or keep current the information contained in the presentation and any opinions expressedin relation thereof are subject to change without notices. This presentation is subject to any future announcement so material information madeby the Company in accordance with law.
This presentation does not constitute a recommendation regarding the securities of the Company.
This presentation also contains forward-looking statements, which include comments with respect to our objectives and strategies, and theresults of our operations and our business, considering environment and risk conditions.
However, by their nature, these forward-looking statements involve numerous assumptions, uncertainties and opportunities, both general andspecific. The risk exists that these statements may not be fulfilled. We caution readers of this presentation not to place undue reliance on theseforward-looking statements as a number of factors could cause future Group results to differ materially from these targets.
Forward looking statements may be influenced in particular by factors as the effects of competition in the areas in which we operate, and changesin economic, political, regulatory and technological conditions. We caution that the foregoing list is not exhaustive.
When relying on forward-looking statements to make decisions, investors should carefully consider the aforementioned factors as well as otheruncertainties and events.


![[FINAL] CNPF 9M18 Investor Presentation · Branded, 75% OEM Exports, 25% 9M 2017 Revenues Branded Growth OEM Growth 9M 2018 Revenues 9M Revenues Branded OEM Exports 9M 2018 Revenues](https://static.fdocuments.in/doc/165x107/5fbd371fb2712f4df801798d/final-cnpf-9m18-investor-presentation-branded-75-oem-exports-25-9m-2017-revenues.jpg)