964 Seafood
121
NOAA Technical Memorandum NOS OR&R 9 Guidance on Sensory Testing and Monitoring of Seafood for Presence of Petroleum Taint Following an Oil Spill Seattle, Washington August 2001 NOAA NATIONAL OCEANIC AND ATMOSPHERIC ADMINISTRATION National Ocean Service
-
Upload
vedpalyadav7793 -
Category
Documents
-
view
57 -
download
2
Transcript of 964 Seafood

NOAA Technical Memorandum NOS OR&R 9
Guidance on Sensory Testing and Monitoring of Seafood for Presence of Petroleum Taint Following an Oil Spill Seattle, Washington August 2001 NOAA NATIONAL OCEANIC AND ATMOSPHERIC ADMINISTRATION
National Ocean Service


NOAA Technical Memorandum NOS OR&R 9 Guidance on Sensory Testing and Monitoring of Seafood for Presence of Petroleum Taint Following an Oil Spill
Terriann I. Reilly National Oceanic and Atmospheric Administration/National Marine Fisheries Service Seafood Inspection Program Roberta K. York Canadian Food Inspection Agency Laboratories Directorate
Seattle, Washington Donald L. Evans, Secretary U.S. Department of Commerce
Scott B. Gudes Acting Under Secretary for Oceans and Atmosphere and NOAA Administrator/ Deputy Under Secretary for Oceans and Atmosphere
Margaret A. Davidson Acting Assistant Administrator for Ocean Services and Coastal Zone Management NOAA National Ocean Service

Office of Response and Restoration National Ocean Service National Oceanic and Atmospheric Administration U.S. Department of Commerce Silver Spring, Maryland NOTICE This report has been reviewed by the National Ocean Service of the National Oceanic and Atmospheric Administration (NOAA) and approved for publication. Such approval does not signify that the contents of this report necessarily represent the official position of NOAA or of the Government of the United States, nor does mention of trade names or commercial products constitute endorsement or recommendation for their use.

Foreword
After an oil spill occurs, government regulatory authorities and other concerned
parties may choose to conduct sensory testing of seafood that may have been exposed.
If sensory testing is conducted, it must be carried out in a scientific and legally defensible
manner. To date, there are few standard procedures published for this type of sensory
testing (Bett et al. 1997). This document was written to provide guidance for conducting
sensory testing on seafood suspected of petroleum taint.
Development of these guidelines was supported and partially funded by
NOAA/NOS Office of Response and Restoration. The document was written by sensory
scientists from the National Oceanic and Atmospheric Administration /National Marine
Fisheries Service (NOAA/NMFS) Seafood Inspection Program and from the Canadian
Food Inspection Agency (CFIA). In addition to the two principal authors, many other
individuals have made significant contributions to this document by communicating
practical suggestions gained from their actual work experiences as seafood inspectors
and laboratory professionals. The extensive bibliography (Section 9.0) provides
supplemental resources for more in-depth information on sensory testing in general and
for sensory testing specifically for taint.
These guidelines are the result of collaborative efforts to address the need for
standard sensory testing procedures for petroleum taint. By issuing these guidelines,
NOAA does not intend to imply that sensory testing should be conducted after every oil
spill that potentially involves seafood, or that a closure should be the end-point if taint is
detected. The need for sensory testing should be assessed on a case-by-case basis
after each oil spill because each spill is unique.


Acknowledgments
Special thanks for the editorial contributions of Ruth Yender and Nancy Peacock,
National Ocean Service, NOAA, and for the invaluable information and practical advice
from the seafood inspectors of the USDC/NOAA Seafood Inspection Program, and the
U.S. Food and Drug Administration.
We acknowledge also the contribution of the technical review committee
consisting of: Larry Hufnagle and Dr. Margaret Krahn from the NOAA/NMFS NW
Fisheries Science Center, Dr. Alvin Rainosek of the University of Alabama, Mr. James
Barnett and Dr. Aladar Bencsath of the U.S. Food and Drug Administration, Dr. Lyle
Lockhart from the Canadian Department of Fisheries and Oceans, and Ruth Yender,
with the NOAA National Ocean Service.


Contents
1.0 Scope and Use of Guideline ..............................................................................1 1.1 Introduction...............................................................................................1 1.2 Scope and use .........................................................................................2 1.3 A few words about terminology.................................................................3 2.0 Collection and Preservation of Seafood Samples for Sensory Evaluation .5
2.1 Introduction ...............................................................................................5 2.2 Types of samples to be collected .............................................................5 2.3 Timing of sampling during the oil spill and cleanup ..................................6 2.4 Handling samples during and after collection ..........................................7 2.5 Ready-to-use sampling kit ........................................................................9 2.6 Chain of custody and ensuring validity and integrity of sensory
samples................................................................................................9 2.6.1 Collecting seafood samples .....................................................9
2.6.2 Ensuring chain of custody (continuity of evidence) ................10
2.6.3 Secure shipping of frozen samples ........................................11
2.7 Statistical sampling requirements ...........................................................12 2.7.1 Basic types of statistical sampling plans..................................12
2.7.2 Required sample sizes and presentation for sensory
testing ...................................................................................13 2.8 Species-specific collection procedures...................................................14 2.8.1 Finfish ......................................................................................14 2.8.2 Crustaceans and molluscan shellfish.......................................15
3.0 Selecting Appropriate Sensory Test Methods and Assessors ...................17 3.1 Introduction.............................................................................................17
3.2 Subjective vs. objective sensory testing ................................................17
3.2.1 Subjective testing ..................................................................17
3.2.2 Objective testing ....................................................................18
3.3 Selecting a sensory approach – general considerations ........................18
3.3.1 What answers are required? .................................................18
3.3.2 Assessor type.........................................................................18

3.3.3 Numbers of assessors needed ..............................................19
3.3.4 Assessor availability...............................................................19
3.4 Test selection .........................................................................................20 3.4.1 Discriminative testing .............................................................20
3.4.1.1 Difference testing using the triangle test ....................20
3.4.1.2 Difference-from-control (DFC) testing ........................21
3.4.2 Descriptive Analysis testing ...................................................22
3.4.3 Testing with product experts and official inspections .............22
3.5 Selecting an assessor type.....................................................................23 3.5.1 Two types of assessor panels appropriate for seafood taint
assessment ............................................................................23
3.5.2 Recommended assessor types..............................................25
3.5.2.1 Expert assessors........................................................25
3.5.2.2 Trained and monitored assessors ..............................26
3.6 Criteria for selecting expert and/or trained assessors...........................26 3.6.1 Time required to assemble a panel of assessors...................26
4.0 Selecting, training, and validating sensory assessors.................................28
4.1 Expert assessors ...............................................................................28 4.1.1 On-site validation ....................................................................28
4.1.1.1 Sequential testing......................................................28 4.1.1.2 Triangle test ..............................................................29
4.1.2 Training expert assessors........................................................30 4.1.3 Monitoring expert assessors ....................................................31
4.2 Trained assessors..............................................................................31 4.2.1 Selecting assessor trainees .....................................................31 4.2.2 Training assessors ..................................................................32 4.2.3 Monitoring trained assessors ...................................................32
4.3 Experimental design and data analysis for testing assessors
(both expert and trained assessors) ..................................................32
4.4 Test systems for assessor selection (both expert and trained assessors)..........................................................................................34 4.4.1 Model system solution of water-soluble fraction of
petroleum ...............................................................................34

4.4.2 Tainted and non-tainted known samples .................................35 4.4.3 Solutions of 1-butanol ..............................................................35
4.5 Data analysis for evaluating assessor candidates..................................36 4.5.1 Data analysis for difference-from-control test ..........................36 4.5.2 Data analysis using SAS..........................................................36
4.5.3 Data analysis using Microsoft Excel™ ....................................38
5.0 Facility Requirements for Sensory Evaluation of Seafood .........................39 5.1 Maintaining a neutral environment..........................................................39 5.2 Sensory testing at the spill site ...............................................................40
5.3 Sensory testing in the laboratory ............................................................40 5.3.1 Sample-preparation area in the laboratory ..............................41 5.3.2 Sensory-evaluation (testing) area in the laboratory .................42
5.3.3 Workshop facility......................................................................43 5.3.4 Booth facility.............................................................................44
6.0 Sample Handling, Preparation, and Presentation in the Laboratory...........45 6.1 Personnel involved in sample handling, preparation, and presentation .45 6.2 Secure handling of samples ..................................................................45
6.2.1 Sample receiving....................................................................45 6.2.2 General principles of sample preparation ..............................46 6.2.2.1 Intact organism samples ...........................................48 6.2.2.2 Pooled, blended samples..........................................48 6.2.3 Storing samples .....................................................................49 6.3 Sample preparation for sensory testing ..................................................49 6.3.1 Intact single/multiple organism samples ..................................50 6.3.2 Blended, pooled samples.........................................................51
6.4 Sample presentation in the evaluation area ...........................................51 6.4.1 Preliminary preparations ........................................................51
6.4.2 Sample placement and timing................................................51
6.4.3 Presentation of intact organism samples ...............................52
6.4.4 Presentation of pooled, blended samples ..............................52
6.5 Assigning random-sample presentation sequences...............................53

7.0 Sensory Evaluation Protocols ........................................................................55 7.1 General sensory testing procedures.......................................................55
7.2 General instructions for expert assessors .............................................56
7.2.1 Before testing...........................................................................56
7.2.2 During testing...........................................................................57
7.2.3 Evaluation criteria ....................................................................58
7.2.4 Evaluation ballots ....................................................................58
7.3 General instructions for trained assessors .............................................59
7.3.1 Before testing...........................................................................60
7.3.2 During testing...........................................................................60
7.3.3 Evaluation criteria ....................................................................61
7.3.4 Evaluation ballots.....................................................................61 8.0 Collection and Analysis of Test Data and Decision Criteria ........................63
8.1 Introduction.............................................................................................63
8.1.1 Expert assessors....................................................................64
8.1.2 Trained assessors....................................................................64
8.2 Test data types and numbers of assessors needed...............................65
8.2.1 Data types................................................................................65
8.2.2 Number of expert assessors needed .......................................65
8.2.3 Number of trained assessors needed ......................................65
8.3 Design and content of evaluation ballots ................................................66
8.3.1 Ballots for expert assessors.....................................................66
8.3.2 Ballots for trained assessors....................................................67
8.4 Test data analysis ..................................................................................67
8.4.1 Expert assessors .....................................................................67
8.4.2 Trained assessors....................................................................68 8.5 Decision criteria ......................................................................................69
8.5.1 Expert assessors .....................................................................69 8.5.2 Trained assessors....................................................................69
9.0 Bibliography .....................................................................................................71

Appendices Appendix 1 Normative References - Existing guidelines, standard practices, and
sampling plans for sensory testing. Appendix 2 Definitions, terminology, and references used in sensory testing for
petroleum taint. Appendix 3 Expert assessor ballot for recording sensory evaluations of seafood: 3-
alternative forced-choice (AFC) triangle test. Appendix 4 Expert assessor ballot for recording quantitative/qualitative sensory
evaluations of seafood. Appendix 5 Trained assessor ballot for recording sensory difference-from-control
evaluations of seafood. Appendix 6 Control graph for plotting and analyzing responses to triangle test for
selection of sensory assessors. Appendix 7 Method for exposing live seafood to petroleum products for purposes of
selecting and training sensory assessors. Appendix 8 Using random code numbers and random-sample presentation methods Appendix 9 Example of expert assessor training data. Appendix 10 Example of a Chain of Custody form and instructions. Appendix 11 Evaluating Expert Assessors Training Results using Fishers Exact
Test.
Figures Figure 1 Summary of sample collection, handling, and shipping for sensory evaluation.............................................................................8 Figure 2 Sampling kit for collection of samples.....................................................9 Figure 3 Decision tree for sensory testing methodology.....................................27 Figure 4 Model system solution of water-soluble fraction of petroleum for testing sensory assessors ...............................................................34 Figure 5 Sensory decision tree for use by expert assessors in evaluating petroleum taint.....................................................................59 Figure 6 Sensory decision tree for use by trained assessors in evaluating petroleum taint.....................................................................62 Tables Table 1 Characteristics of various types of sensory assessors in general ........24 Table 2 Summary flowchart of sample preparation and presentation............... 47

1.0 Scope and Use of this Guideline
1.1 Introduction
When an oil spill occurs, local seafood resources may be exposed to
petrochemicals that affect their sensory qualities (taste, smell, and appearance). Even
when seafood samples from the spill area pass the standard chemical-analytical tests
(the levels of polycyclic aromatic hydrocarbons are below the limits permitted as
determined by human health risk assessment), flavor or odor still may be affected. Taint
in seafood renders it adulterated and unfit for human consumption according to U.S. law
(Federal Food, Drug, and Cosmetics Act, US Code 21, Chapter IV, Sec. 402 [342], a.3). The specific compounds in oil responsible for causing off-flavors and off-odors in
seafood have not been determined with certainty. Experience at recent oil spills
indicates that, when well-trained sensory panelists conduct sensory testing, there is
generally a high degree of correlation between the results of chemical analysis and
sensory testing. Because this correlation is not absolute, there is a role for both sensory
and chemical analysis in assessing adulteration and safety of seafood. Analytical
instrumentation, particularly hand-held electronic noses, continue to advance and may
eventually play a significant role at oil spills as tools for rapid assessment. However, at
their present state of sophistication, these instruments are chemical detectors only,
incapable of making any sensory judgment on odor or flavor. The final judgment about
the presence and absence of taint in seafood (or in any food) remains the jurisdiction of
human assessors.
Fisheries and water researchers have conducted much valuable research on
seafood tainting. However, the pertinent information from the many existing research
and guideline documents needed to be pulled together and adapted specifically for
testing seafood exposed to petrochemicals. Some of the most extensive research has
been conducted in Aberdeen, Scotland at the former Torry Research Station.
Individuals from this former institution have provided valuable information included in this
guideline. In the literature, some of the most technically useful and inclusive guideline
work has been done by Environment Canada, as found in their 1997 Technical
Guidance Document for Pulp and Paper Environment Effects Monitoring (EEM)
1

(Environment Canada 1997). Portions of the sensory section of the EEM document
served as a framework for writing this guideline.
1.2 Scope and Use
The specific scope of this document is to provide guidance for conducting
appropriate sensory tests to objectively assess seafood resources for petrochemical
taint following an oil spill. The instruction and background contained here is intended not
only for the sensory professionals and assessors, but also for other personnel
responsible for managing seafood. This guidance applies to finfish, shellfish/mollusks,
and crustaceans.
This document does not provide guidance on how to make the decision to
conduct or not conduct sensory testing; it provides guidance on how to conduct the test
once the decision has been made to do so.
Seafood issues are unique to each incident. This means that sensory evaluation
of seafood resources for petroleum taint must be area- and incident-specific, rather than
taking a generic approach to every spill. In addition, the design and implementation of
sensory tests for this purpose must generate results that are both scientifically sound
and legally defensible. This guideline is meant to help ensure that sensory testing is
appropriate to the oil spill context and is conducted with adequate and appropriate
quality control. Once the decision to conduct sensory testing is made, it is important that
industry and regulatory agencies immediately engage the assistance of an experienced
sensory professional (see Section 1.3 for definition) in both designing and
implementing the sensory-testing procedure.
This guideline provides systematic instructions for sensory testing involving either
of two types of assessors:
1) Trained assessors, or
2) Seafood product expert assessors.
There is a detailed definition of the two assessor types below in Section 1.3.
Each section of the document is organized according to these two assessor types, as
procedures in the section may be different depending on the type of assessor.
This guideline might involve hazardous materials and does not claim to address
all of the safety concerns associated with its use. It is the responsibility of the user to
2

adhere to appropriate safety and health practices. The processing and maintenance of
sensory samples should follow good manufacturing practices.
1.3 A few words about terminology
1) The term seafood generally applies to finfish, shellfish/mollusks, and crustaceans. When sections of this guideline refer only to one of these classes, it will be specified.
2) Tainted seafood is herein defined as “seafood that contains abnormal odor
or flavor” based on the sensory analysis vocabulary of ISO 5492 (see
Appendix 1). The contextual meaning of taint is an odor or flavor introduced into
the seafood from external sources.
This excludes any natural byproducts of deterioration due to
aging during storage, i.e., decomposition of fats, proteins, or other components;
or
•
•
•
•
•
microbial contamination normally found in fish.
3) In the field of Sensory Science, many terms are interchangeably used to refer to
certain personnel involved in a sensory test. For purposes of this document, the
terms will be defined as follows:
Sensory professional will be defined as an individual who has received a
combination of University-based sensory science instruction and practical
experience that provides them with the ability to design and execute various
types of sensory studies.
Assessor is defined as any person taking part in a sensory test, usually an
individual who evaluates a sample for odor, taste, appearance, etc.
Panel is defined as any group of assessors chosen to participate in a sensory
test. Following, different types of assessors are defined in order of experience
and level of training:
a) A consumer is defined as an untrained, naive assessor.
b) A trained assessor or trained panel is defined as a group of
assessors selected and trained to perform a specific task (this may be
for a particular product or for a particular attribute). For purposes of
3

this guideline, they will hereafter be referred to as “trained assessors”.
c) An expert assessor is defined as an assessor with a high degree of
sensory ability and experience with sensory methodology and who is
able to make consistent and repeatable sensory assessments of
various products.
d) A specialized expert assessor is defined as an individual who has
additional experience as a specialist in a certain product and/or
process and who and is able to evaluate the effects of variations
related to raw materials, recipes, processing, storage, aging, etc. In
many countries, such as the US and Canada, seafood inspectors
(employed by either NOAA/NMFS or USFDA or the Canadian Food
Inspection Agency (CFIA)), perform sensory testing of a wide variety
of seafood species and processes on a daily basis as part of their job.
In addition, most inspectors have received some education in sensory
science methodology, and have been selected, trained and validated
as being highly accurate and repeatable sensory assessors. These
individuals meet the requirements of specialized expert assessors of
seafood products. For purposes of this guideline, they will hereafter
be referred to as “expert assessors”.
This document provides guidance on sensory testing using either a panel of “trained assessors” (b) or “expert assessors” (d). Further details of the differences
in selection, training, testing methodology and numbers of assessors needed are
addressed in each section of this guideline.
Additionally, see Appendix 2 for a detailed list of definitions of sensory attributes
used in this document.
4
2.0 Collection and Preservation of Seafood Samples
for Sensory Evaluation
2.1 Introduction
This section provides technical guidance on the collection and handling of
seafood samples for testing the sensory effects of petrochemicals on the resident finfish
and shellfish populations. Sensory professionals should collaborate with other involved
individuals such as fisheries biologists, statisticians, spill site managers and
coordinators, and appropriate regulatory authorities, on planning the number and size of
sampling sites, the number of organisms from each site to be tested, sample collection
responsibility, and chain of custody procedures.
See Section 2.7 for more details or Appendix 1 of this document for examples
of sampling plans.
2.2 Types of samples to be collected
Several types of samples are referred to in this guideline:
Samples generally refer to indigenous species collected from the spill area to be
tested for the presence of taint, i.e., the “unknowns” for which the qualities of
odor and flavor will be established. These could also include living seafood
samples that are held in captivity in the spill area (generally in cages) to monitor
changes in taint as the spill is cleaned up and the oil begins to weather, or in
commercial aquaculture facilities.
•
• Control samples include any seafood samples taken from unaffected areas
adjacent to the spill area to provide the "background fish flavor/odor against
which taint in the “unknown” samples is assessed. Control samples are collected
before or at the same time as "affected" samples from the spill area and should
be handled in exactly the same manner. They provide an internal control in the
test design, and the data from these samples can be used to measure the
degree to which samples from the spill area differ from background samples.
Control samples of each species to be tested should be included in the test
design when using expert assessors, but must be included when using trained
assessors. When control samples are not available under any circumstances,
5

sensory assessments should be conducted only by expert assessors trained in
evaluating the species in question who, therefore, have an "internal control" from
their training and on-the-job experience.
Concurrent samples for chemical analysis. In addition to sensory testing, it is
sometimes decided to conduct chemical testing of seafood samples from the
affected site. If the decision is made to conduct chemistry, the final sample size
should include enough samples from the affected and control areas to allow one-
half of each organism to be retained for chemical analyses, and for possible
correlation with sensory analyses. The same rapid collection and preservation
methods should be used in handling these samples, along with the same
thorough documentation and chain of custody, as for sensory samples. In
addition, because organisms are usually not tainted uniformly in any
environment, it is important to code samples so that chemistry and sensory data
can be compared for the same organism. Chemical analyses can sometimes
be delayed until results of sensory testing are available.
•
• Reference samples are used in sensory training and testing as an illustration for
the definition of a sensory attribute or condition (such as intensity). These
include any product that illustrates a sensory attribute or intensity and, in this
work, may include seafood, petroleum products, other food or non-food items,
etc. (see Appendix 2). Reference samples are chosen so that they demonstrate
a chosen attribute and can be generated as often as needed and in the same
“repeatable” condition. Data are not collected from reference samples, nor are
they included in the test design for statistical analysis.
2.3 Timing of sampling during oil spill and cleanup
The time between exposure of an organism to spilled oil and the onset of tainting
varies, as does the intensity and persistence of the taint (Motohiro 1983; Law and Hellou
1999; Whittle et al. 1999). The degree of taint depends on several factors: type of
petroleum product, habitat, water temperature, weather conditions, etc. (see Motohiro
1983, for a review). Reported times required for onset of taint range from less than 1
hour to 48 hours; thus samples for sensory testing should not be taken before a
minimum 48 hour exposure period.
6
Control samples from areas adjacent to the spill should be taken as quickly as
possible (no waiting period) and must be taken before the spill spreads. For obvious
reasons, control samples and affected samples must be taken from an area as close as
possible to the affected area to reduce background variability in natural sample odors
and flavors. Figure 1 schematizes the necessary steps in collecting, handling, and
shipping seafood samples from the spill site to the evaluation laboratory.
2.4 Handling samples during and after collection
It is of primary importance that all samples be collected to prevent any post-
sampling exposure to contaminants or other conditions that could affect the results or
credibility of the sensory assessments. For example:
Exposure to fuel or other petroleum products aboard the sampling boat •
•
•
Contact with packaging materials made with petroleum products
Exposure to inappropriate holding temperatures or conditions that could induce
the production of off-flavors or off-odors within the product
It is essential, from the start, to ensure that all necessary steps are followed to
demonstrate "chain of custody” (see Section 2.6.2). To be legally valid, it must be
evident that the data were generated from samples taken from the specified areas and
could not have been contaminated at any other point in time after sampling.
7

Oil Spill Occurs Determination made by State health agencies or other spill
responders to conduct sensory testing
Institute Chain-of-Custody procedures
Establish experimental design of sensory tests Establish number of samples to be collected - double the
number of control and suspect samples if chemistry is to be performed
Collect control samples (if able)
Control samples
(all species)
Finfish
Crustaceans
(shrimp, lobsters, crayfish, etc.)
Mollusks
(oysters, clams, mussels, etc.)
In Field
Collect samples, process appropriately, immediately wrap in foil, code, chill, and transport to laboratory.
At Laboratory
Prepare samples appropriately by species (see Section 2.6) If concurrent chemical testing, divide and code
Re-wrap in foil, vacuum seal, code
Chill at 0-4° C
for immediate testing (within 24 hours)
Freeze at < -20° C
and test within 1 month or freeze < - 60° for longer
Figure 1. Summary of sample collection, handling, and shipping for sensory evaluation.
8

2.5 Ready-to-use sampling kit
As part of emergency preparedness, a sampling kit can be pre-assembled and
ready for field use when an oil spill occurs. We suggest the contents of such a sampling
kit as shown below. Quantity for sample size n=21
organisms Items
1 roll
Heavy-duty aluminum foil - institutional rolls.
25
Vacuum-packaging bags of a size appropriate to the species being sampled. Pre-code if possible.
1
Vacuum sealer (consumer model, if institutional model is not available).
50
Zip-lock bags of suitable size, with straws for evacuating air. Pre-code if possible.
6
Cutting boards (use separate boards for control and exposed samples; label clearly).
6
Knives (use separately for control and exposed samples; label clearly).
4
Scissors (use separately for control and exposed samples; label clearly).
4 Permanent marking pens 25 Adhesive labels 2 Coolers (1 each for control and exposed samples; label clearly).
6 sheets Styrofoam or packing material 1 roll Newsprint (unprinted) for packing material
2 Shipping cartons (1 each for control and exposed samples). weight of samples Dry ice or ice packs
2 rolls Packing tape and/or masking tape
Figure 2. Sampling kit for collection of sensory samples.
2.6 Chain of custody and ensuring validity and integrity of sensory samples
2.6.1 Collecting seafood samples
The EEM document (Environment Canada 1997) cites seven requirements for
sample collection of indigenous species for exposed and control samples that can be
adapted to sampling during oil spills.
1) Both exposed and control samples must be collected from the same water
body and similar habitat type. Though the EEM document applies to
collecting from smaller freshwater areas, the same principle holds true in
marine sampling. This reduces any variability in flavor caused by seafood
samples originating from dissimilar habitats.
9

2) The same collection methods must be used in obtaining both exposed and
control samples, and organisms must be removed from the water as quickly
as possible after capture. 3) Organisms collected in the control area must be physically isolated from the
exposed population to prevent any mixing of the two groups. 4) Exposure times for organisms collected in the exposed area should be at
least 48 hours; to ensure that uptake of oil has reached its maximum.
5) Standard measurements, such as weight, length, sex, and age, must be
recorded for each organism collected for sensory testing. If possible, steps
may be taken to preserve the otolith for age determination. 6) Organisms taken from each exposed and control area should approximate the
same size, age, and sex ratio. If trained assessors are used, the weight
range among organisms should not exceed a factor of 1.2 to minimize
potential differences in texture, color, and flavor. This is not an issue for
expert assessors, providing sample sizes are large enough to allow multiple
assessors to evaluate them.
7) Only organisms that are alive at the time of collection should be used for
testing to ensure that they have been exposed to taint conditions. This also
ensures that there are no flavor effects from decomposition present, as fish
can deteriorate while still in the water if they die in the net (EEM and ASTM
documents, see Appendix 1). Any quality (freshness) evaluations must be
performed only by trained inspectors or expert assessors.
2.6.2 Ensuring chain of custody (continuity of evidence)
During sample collection and preparation for transport, the handlers must be able
to account for all aspects of handling in case they are called to testify in legal
proceedings (see part 2 of Appendix 10 for a definition and detailed list of procedures).
Complete documentation must be demonstrated through detailed note-keeping,
including the time of all significant events, where event occurred, what happened, who is
present, etc. This also includes being able to swear under oath as to the location of the
samples from the moment they are collected until the samples are delivered to a specific
individual at the sensory testing laboratory. From that point on, chain of custody
becomes the responsibility of the sensory testing laboratory (although, in some cases,
10

the individual who supervised the sample collection may be the same person
responsible for sample storage and preparation at the laboratory).
Ensure security of the sample at all times. If the samples are left untended for
any period of time, (e.g., while being held in chilled or frozen storage), they
should be locked in an appropriate container and a seal placed around the
opening with a signature to show that the container was not disturbed (opened).
An example of this would be holding the samples in a cooler, with the lid taped
around to completely seal it into place and with signatures of the responsible
person on the tape or seal.
•
•
•
•
•
•
•
•
•
Record the identity of every person who has custody of the samples at any point
in the sequence, and include an NRDA-style chain-of-custody form. This number
should be kept to a minimum with the ideal number being one individual (or, at
the most, two), as each individual may possibly be required to testify as to the
sample security.
Each party involved should record the time and other pertinent details, such as
when samples are transferred from individuals and locations.
Record the location and environmental conditions under which samples are held
throughout the entire history, e.g., temperatures for chilled or frozen samples.
An example of a chain of custody form and related instructions are included in
Appendix 10.
2.6.3 Secure shipping of frozen samples.
If sensory testing cannot be performed within a 24-hour period, samples should
be frozen according to procedures specified in Section 2.8. Instructions are given here
for the secure transport of frozen samples to the sensory laboratory. It is imperative that
chain of custody be maintained during this process.
Samples should not, at any point, reach a temperature above -20° C during
shipping or storage.
Initially, all seafood samples should be wrapped in aluminum foil to ensure no
contact with petroleum-based packaging materials.
The foil-wrapped samples should then be vacuum-sealed and then over-wrap
again with heavy-duty aluminum foil. Make sure each sample is clearly labeled.
Place clear, odor-free shipping carton lined with thick Styrofoam and packing
material in the freezer to chill before adding the samples.
11

Dry ice or ice packs will be added to the shipping carton with no less than a 2:1
ratio with samples. Alternate layers of sample with layers of ice packs or dry ice.
The box should be as tightly packed as possible to exclude as much air as
possible. Pack with unprinted newspaper (i.e. clean, never exposed to ink) or
with Styrofoam chips to fill the air voids. As many air voids as possible should be
excluded to maximize the frozen stability of the samples.
•
•
•
•
•
Seal package tightly, keeping in mind the requirements for chain of custody (i.e.,
securing and signing the closures so that evidence of any tampering will be
clearly apparent). If possible, photograph the sample containers prepared for
shipping. Ship immediately via secure transport. Package should not be en
route more than 24 hours.
Upon receipt of the sample container, examine it for security of contents, i.e., any
evidence of tampering, and document condition of container. If possible,
photograph the sample containers on arrival. Then, open the container, remove
samples from extra packing material, but retain vacuum packaging and
immediately place in secure freezer at -20° C or lower. Examine samples for any
signs of thawing and document accordingly.
2.7 Statistical sampling requirements
The numbers of each species that should be collected from any given area for
purposes of sensory testing depends on: 1) the population size of the species and the
size of the affected area (calculated according to the best-available information) or, 2)
on the minimum number required that will give a sufficient quantity of sample for testing.
The assumption is always made that there will be some variability in uptake of taint
within a species when exposed to the same tainting conditions.
There are two considerations in establishing the number of samples required for
testing:
2.7.1 Basic types of statistical sampling plans
Attribute Each sample unit is classified according to conformity.
Variable Characteristics are evaluated on a numerical scale.
12

For an oil spill situation, attribute-sampling plans are recommended. Thus, if a
sample is tainted, it is non-conforming.
For attribute sampling guidelines, refer to the 1994 U.S. Code of Federal
Regulations, Title 50; the 1993 ANSI/ASQC attribute sampling procedures; the UN/WHO
Codex Alimentarius Commission sampling procedures; and the ISO attribute sampling
procedures. See Appendix 1 for complete citations.
2.7.2 Required sample sizes and presentation for sensory testing
•
•
•
–
–
At least 6 samples per species from each area are recommended for testing with
either type of assessor. As a general rule, the sample size collected should
comply with the minimum requirements in the statistical sampling tables of ISO,
Codex Alimentarius, CFIA, and NOAA (see Appendix 1). If samples are to be
collected concurrently for both sensory and chemical analyses, the sample size
should be doubled to ensure sufficient samples.
For testing by expert assessors: A sample will consist of an individual organism
when testing finfish and lobsters, or multiple organisms when testing shellfish.
Depending on the size of the shellfish, 3 to 6 organisms are recommended for a
sample.
When using trained assessors: Samples can be presented in one of two ways.
20-g blended, individual fish samples (BIFs) from multiple pooled
organisms, or
20-g dorsal-muscle single-organism samples (see Environment
Canada 1997). Given the expected recovery of fish or shellfish flesh
(see table below), you will need to compute the total weight of the final
sample and the estimated number of samples needed.
Type of seafood
Expected % recovery of edible flesh
Finfish 38–40 Flatfish 30–33 Lobsters 14–18 Shrimp 28–30 Clams 16–20 Oysters 25–30 Scallops 20–25 Mussels 15–20
13

2.8 Species-specific collection procedures
Samples must be obtained for each commercial species normally harvested from
the area that is suspect. Generally applicable instructions for all samples should be: 1)
handle in a manner that ensures that no interfering odors/flavors of decomposition are
allowed to develop that could interfere with the evaluation of flavors from contaminants,
2) do not expose to products of petrochemical origin that might interfere with the
integrity of the sample under chain of custody. The goal of these methods is to
immediately stabilize the harvested seafood samples. The important factors are
cleaning, protecting from exposure to air, and chilling. Following are the general
requirements for each type of seafood.
2.8.1 Finfish
Samples should be taken from the water source using clean gear, not previously
exposed to petroleum from any source.
Seafood samples are rinsed in clear, potable, odor/flavor-free water to remove
any residual surface oil (if necessary, suitable bottled water can be brought to the
sampling site).
•
•
•
•
Samples are to be prepared in the same manner as for commercial sale. Clean
to remove viscera, gills, and kidney if this is done in commercial practice. Under
no circumstances should the viscera come into contact with the flesh that will be
used for sensory evaluations. The head should be left on but the gills removed
carefully to preserve the otolith if it will be examined for age determination.
Carcasses must be rinsed in clean water, such as distilled water or other clean
potable water source, and immediately placed on non-chlorinated ice with the
body cavity facing downward to allow for drainage. Use enough ice so that the
sample does not come in contact with drainage or melt water.
After draining, samples should be tightly wrapped in double layers of heavy-duty
aluminum foil and then individually placed in double zip-lock bags, evacuating as
much of the air as possible by pushing it out or by sucking it out through a straw.
Ensure that no plastic touches the sample. Ideally, the samples should be
vacuum-sealed if they are to be frozen (several home models are available).
14
Samples must be clearly labeled with all pertinent information regarding sampling
sites, dates, etc. (see Section 2.6.2). All labeling should be firmly and securely
affixed to the plastic outer-wrap of the samples.
•
•
•
•
•
Either chill samples to 4º C and test within 24 hours, or freeze samples
immediately and store at a temperature of at least -20º F (preferably -30º F).
Frozen samples must remain frozen at all times during shipment from the field to
the sensory-evaluation laboratory, or well iced if the testing will be done within 24
hours.
Samples should be tested as soon as possible and not kept frozen for more than
1 month before testing. (However, with proper handling and < - 60º F storage, samples
can be saved for longer periods and used successfully to demonstrate the presence of
taint.). To maximize ease of data presentation, we recommend shorter rather than
longer storage times. If samples are to be in frozen storage and are not vacuum-sealed
in the field, they should be vacuum-sealed upon arrival at the sensory-evaluation
laboratory as described above in this section.
2.8.2 Crustaceans and molluscan shellfish
Ideally, a suitable sensory laboratory would be available near the spill site so that
crustaceans and mollusks can be evaluated alive, as they would be just before cooking
by the consumer. If this is not the case, samples are to be shipped alive or frozen to the
evaluation laboratory as described below. The goal of these methods is to immediately stabilize harvested shellfish to
prevent any changes due to deterioration that could interfere with the evaluation of
petroleum-related flavors and odors. The important factors are cleaning, protecting from
exposure to air, and chilling with ice (if samples are to be tested alive) or by rapid
freezing if live testing is not possible.
Samples must be rinsed in clean, potable, odor- and flavor-free water (e.g.,
distilled or filtered) to remove any residual surface oil and immediately placed on
non-chlorinated ice. Sufficient ice should be used to keep samples from coming
in contact with melt water.
Samples should be coded in the field with unique 3-digit random numbers (see
Appendix 8) and labeled with all the pertinent information.
15

Samples that can be evaluated alive should be tightly wrapped in double layers
of heavy-duty aluminum foil and placed on ice in clean, odor-free shipping
containers.
•
•
•
•
Samples that must be shipped frozen for evaluation should be wrapped
individually in double layers of heavy-duty aluminum foil, and frozen at -20º C, or
lower for about 30 minutes to immobilize the sample (i.e., lobsters, crab). They
are then placed in double zip-lock bags with as much of the air evacuated as
possible by pushing or sucking it out through a straw, ensuring that no plastic
touches the sample. Ideally, samples should be vacuum-sealed before freezing.
Samples must be clearly labeled with all pertinent information required coding
each sample for later analysis at the sensory-evaluation laboratory. All labeling
should be firmly and securely affixed to the plastic outer-wrap of the samples.
Again, all appropriate measures must be taken to ensure chain of custody
throughout the handling and transportation steps.
16

3.0 Selecting Appropriate Sensory Test Methods and Assessors
3.1 Introduction
Because of the legal and regulatory implications of oil spills, it is strongly
suggested that the sensory evaluation of seafood be designed and conducted under the
direct supervision of a trained professional, in this case a sensory scientist. Most
importantly, consideration must be give to the amount of information that interested
parties will require and the types of assessors that are available. The level of necessary
assessor training and the extent of information that can be collected will vary according
to the selected test method.
3.2 Subjective vs. objective sensory testing
Sensory evaluation in general can be either subjective (consumer) or objective
(analytical). Some key differences in subjective vs. objective sensory test methods
include: the type of assessor used (untrained vs. trained), types of information collected
(personal feelings vs. product attributes and intensity), and numbers of assessors
needed (many vs. few). When evaluating any food for the presence of taint, in this case
seafood, the evaluations must be objective.
3.2.1 Subjective testing
Subjective testing measures responses as feelings and preferences about
samples. Untrained assessors on this type of consumer panel provide purely
subjective responses—based on personal bias—which are not appropriate for taint
analysis. Subjective sensory evaluation measures an assessor’s feelings toward a
sample; it does not measure the sensory attributes of the sample. Thus, subjective
testing is clearly NOT appropriate for assessments of taint upon which decisions to
close/reopen fisheries may be based. These kinds of decisions call for objective,
analytical sensory evaluation to confirm and quantify the presence of taint (York 1995).
17

3.2.2 Objective testing
Objective sensory testing measures the intrinsic sensory attributes of
a sample through the analytic sensory perceptions of trained human assessors (Jellinek
1985; Meilgaard et al. 1999). Several objective test methods would be suitable for
assessing the presence of seafood taint.
3.3 Selecting a sensory testing approach – general considerations
3.3.1 What answers are required?
From the start, interested parties, working with a sensory professional, must
decide what they want to know – what questions do they want answered so that the
appropriate test method can be selected. Each test method requires different:
numbers of assessors •
•
•
•
•
assessor training periods
data collection methods
repetitions of the test
sample numbers
Difference testing will result in basic information that would answer the question
“is there a difference between the suspect and control samples?” but does not provide
information on the nature or the degree of the difference. More sophisticated testing,
such as descriptive analysis may answer many questions such as; “Is there a difference
What is the difference? How big is the difference? Is the difference due to petroleum
taint? How intense is the taint? What is the description of the sensory characteristics of
the taint?” In general, the tests that give you more information about the samples require
greater assessor training periods, but less numbers of assessors, test repetitions, and
sample quantity. These methods will be further explained in this section.
3.3.2 Assessor type
Objective sensory measurements are obtained from the following three types of
trained assessors:
1) Assessors screened and selected for sensory tasks (usually 25),
18
2) Assessors selected and highly trained to participate on a panel for specific sensory tasks (usually 10 to 15),
3) Expert assessors, e.g., product specialists, seafood inspectors (usually 1 to
5) (York & Sereda 1995).
As the list of assessor types progresses above, the level of training and
experience increases which then increases the amount of information that that may be
obtained from the test. To conduct any objective sensory analyses of seafood (or any
product), assessors must be
selected according to their abilities to perform the sensory tasks at hand, •
•
•
trained in the application of the required test methods, and
monitored (validated) for their ongoing abilities to effectively perform the
sensory tasks.
Assessors are chosen to work within specific test protocols and must be trained
to perform within those criteria (see Table 1). Assessors must be considered the
analytical tool for the assessment for the presence of taint.
3.3.3 Numbers of assessors required
In general, the higher the level of training, the less statistical variability in the
sensory data and the fewer the number of assessors required. (Note: This is why very
large panels, of 100 or more assessors, are required for subjective (consumer) testing.
Because their responses are personally biased, there is wide variability within and
among the resulting data sets.)
In many cases, the type and number of assessors available (professionals,
expert/trained, new trainees) limit the feasibility of testing approach that can be
implemented.
3.3.4 Assessor availability
In reality, the limiting factor in choosing a particular sensory test method following
an oil spill is often the type of assessors available, given the urgency and often remote
locations of spill scenarios. With this in mind, two types of assessors that are
recommended are:
19

Expert assessors can specify the presence and intensity of petroleum
contamination, as well as the presence of flavor changes that are not due to taint (i.e.
quality changes due to autolytic and/or microbial decomposition).
Trained assessors can measure the degree to which samples differ from
standard, uncontaminated samples for the presence of taint. Because this group is not
trained in assessing general seafood quality, we cannot assume that they will
differentiate petroleum taint from other quality changes, caused perhaps by
deterioration, that might be present in seafood with low or borderline levels of taint. For
this reason, it is even more essential when using trained assessors that control samples
and taint samples be handled and processed quickly to prevent extraneous flavor
changes.
3.4 Test selection
3.4.1 Discriminative testing
Discriminative testing is also referred to as difference testing. Several different
sensory test methods will allow one to determine differences. The 2 types of test below
are appropriate for taint assessment.
3.4.1.1 Difference testing using the Triangle Test
In early studies to measure the effects of petrochemical exposure on fish flavor,
one of the sensory-evaluation methods used is difference testing using the triangle test.
Here, an assessor is presented with three coded samples—two of which are the same—
and is asked to identify the "odd" sample. This is known as the 3-alternative forced-choice triangle test.
There are problems, however, in using the triangle test to establish the presence
of petrochemical taint.
The procedure is used to determine any perceptible sensory difference between
samples of two products; thus, all differences—not just the presence of
petrochemical taint—will be used by the assessor in evaluating the samples
(e.g., color, texture and other flavor differences which may not be taint).
•
• Actual differences among samples may be detected in a single sensory attribute
or in several attributes.
20

Although applicable when the nature of the difference is unknown, this test does
not determine the magnitude or direction of difference; also, assessors must be
trained to identify the attribute responsible for the difference.
•
•
•
•
•
•
•
•
•
•
The test is applicable only if the products are homogeneous, and does not
account for natural variations in the product, such as those found when working
with seafood.
Because the test identifies only a difference, and not the magnitude of the
difference, the data cannot be compared over time, such as when the effects of
the petrochemical exposure begin to abate.
Triangle tests require a relatively larger quantity of sample than the
recommended test.
3.4.1.2 Difference-from-control (DFC) testing
The DFC test is recommended for use with trained assessors, and sometimes
expert assessors in assessing petroleum taint in seafood flesh (ASTM E 1810-96;
Appendix 1). This test is often used in quality-control situations to measure a difference
and estimate the size of any difference found, taking into account the natural variability
of the product. The advantages of this method include:
provides an estimate of the presence and degree of difference compared to a
clear control;
defines more easily the nature of the difference;
assessor is less influenced by other factors in the sample, e.g., natural flavor of
the seafood and intra-species flavor differences among samples from different
areas;
data collected can be analyzed through standard statistical tests;
test recognizes that seafood, being natural foods, have some variation in flavor
and this natural variability is considered in the experimental design and the
statistical analysis;
comparisons between the triangle and DFC tests show a high frequency of false
statistically significant results (Type I error) in the triangle test (Aust et al. 1985).
21

3.4.2 Descriptive Analysis Testing
Descriptive analysis is a sensory method by which the attributes of a food or
product are identified and quantified, using human subjects who have been specifically
trained for this purpose (Manual on Descriptive Analysis Testing for Sensory Evaluation,
ASTM Manual Series: MNL 13, 1992). Most of these methods require the use of highly
trained assessors and evaluate many sensory attributes within each sample (York and
Sereda, 1995). For taint assessment, panelists can be trained to provide both qualitative
and quantitative information on the presence of petroleum taint only. In petroleum spill
or environmental effects monitoring situations intensity (quantitative) data may provide
valuable information to the interested parties if the problem persists for long periods of
time (Whittle et al. 1997).
3.4.3 Testing with Product Experts and official inspections
The International Organization for Standardization (ISO), Technical Committee
34 on sensory analysis, sub committee 12 has accepted the role of the expert assessor
in product evaluations (see ISO/DP 8586 Sensory Analysis - Assessors, Part 2 - General
Guidance for the Selection, Training, and Monitoring of Experts). Experts contrast with
other types of assessors in the level of training that they must have in both product
specialization and sensory analysis methods, and also in their responsibility for samples,
testing conditions, data analysis, and reporting of results (York and Sereda, 1995). This
awareness of the need for expert assessors’ seafood evaluation for international trade
has been demonstrated by Codex Alimentarius in a Code of Practice for the Sensory
Evaluation of Fish and Fish Products (see Appendix 1).
Government agencies routinely use seafood product experts to inspect seafood.
These inspectors undergo years of training and direct product experience and may
easily be further trained to detect the presence of taint, such as from an oil spill. These
assessors use either a pass/fail or a grading system, but, in either case, seafood that is
tainted or unwholesome is considered not fit for consumption or trade and will not pass
an inspection.
22

3.5 Selecting an assessor type
3.5.1 Two types of assessor panels appropriate for seafood taint assessment
Panel of 3 to 5 expert assessors (fish inspectors, usually employed by a
regulatory agency) whose job it is to assess fish for its suitability for sale for
human consumption. These assessors must be selected for and have additional
training to detect petroleum taint in seafood.
•
• Panel of 10 to 15 selected and trained assessors convened specifically for the
task of assessing taint from a particular oil spill.
The capabilities of different types of assessors and the advantages and
disadvantages for taint assessment in particular are compared in the following table [see
also ISO 8586-2:1994(E); see Appendix 1].
23

Table 1. Characteristics of various types of sensory assessors in general.
Type of Test
Type and definition of
assessor
Characteristics of assessors and numbers needed
Possible advantages of using such assessors
Consumer Tests
Untrained, naive assessors chosen to represent market segment.
Untrained - Respondents relate feelings, wants and needs of products. Need at least 100 respondents.
Not appropriate for taint assessment.
Discriminative Tests
Selected and trained assessors who have been screened and selected for. Chosen for his/her short-term ability to perform a sensory test.
Assessors work under supervision of a sensory professional and perform short-term tasks such as difference testing and scaling. Need approximately 25 respondents.
More readily available, esp. in remote areas. Only spill-specific training is required.
Descriptive Tests
Assessors who have been screened and selected for and extensively trained for long term tasks.
Experienced assessors who also work under the supervision of a sensory professional. Consistency of judgment, both within and among testing sessions. Can provide detailed quantitative and qualitative information Need 10-15 respondents.
Fewer assessors required to maintain a given degree of reliability in the results. Long-term sensory memory and accumulated experiences allow recognition of particular attributes, such as taints.
Tests using Product Experts as assessors
Assessors with high degree of sensory sensitivity and well experienced with sensory methodology. Specialized experience with the product and/or the process and/or marketing and can make consistent and repeatable sensory assessments. One who can evaluate or predict effects of variations relating to raw material, recipes, processing, storage, aging, etc., of various products.
Long-term sensory memory. Can operate independently. Extensive experience in the relevant specialist field. Highly developed ability to recognize and evaluate sensory properties. Mental retention of reference standard. Recognition of key attributes. Can apply deductive skills to problem solving and can describe and communicate conclusions or take appropriate action. For taint assessment, 3 to 5 respondents are recommended.
Evidence from an expert panel is more persuasive, for example, in a court of law. A product expert assessor takes full responsibility for all judgements, comments and estimates, including tasks undertaken by a panel leader. Gives advice on sensory aspects of contractual or legal matters.
24

3.5.2 Recommended assessor types
3.5.2.1 Expert assessors
Expert assessors are most preferable because they are trained, experienced,
and validated (sometimes certified) in assessing seafood products. Trained assessors
will require years of more training to achieve the same goals. Expert assessors must be
further selected and trained specifically for petroleum tainted seafood (see Section 1.3).
If sensory results indicate that commercial seafood resources are tainted, it may
have economic implications to individuals and industries for extended periods.
Considering both the potentials for damage claims by affected parties and the
speed with which the spill response must be handled, we recommend that, when
possible, expert assessors be chosen. These inspectors are already familiar,
through their training and experience, with the sensory attributes of taint.
Seafood inspectors are employed by government agencies and assigned to
specific offices and laboratories in different areas of the country. By prior
agreement with their employing agencies, arrangements can be made for
temporary assignments of these seafood inspectors to oil spill-related sensory
analysis in an emergency situation. This means they can travel to the spill area
or sensory laboratory on short notice and immediately begin assessing spill-
related taint of seafood stocks. The presence of a defect can be quantified by
these inspectors, as in seafood inspections carried out under U.S. federal law
where defect levels are established.
•
•
•
Although seafood inspectors are experienced in assessing all aspects of quality
deterioration in seafood, we recommend that the sensory testing methodology be
designed to generate additional data other than in routine inspections (see
Section 8.3). The first step in this testing should be to re-familiarize (recalibrate)
the inspectors with the sensory attributes and intensity of petroleum
contamination.
Canada's approach to sensory testing differs in that descriptions of defects
under the categories tainted, decomposed and unwholesome are given by law.
Also, a defect is defined as perceptible at the level of “distinct and persistent,” in
other words, a flavor or odor that may be present at a very low level, but that
does not disappear when left to stand for 1 minute.
25

3.5.2.2 Trained and monitored assessors
Trained and monitored assessors are the other choice for objective sensory
evaluation. Ten to 15 individuals are selected according to their consistent ability to
perceive taint at normal levels, and then trained for these assessments. Using trained
assessors requires the constant application of a sensory test with samples relative to a
known, clear, control standard, for presence of a defined difference, e.g., the difference-
from-control (DFC) test. In addition, when using trained assessors, every aspect of the
training and testing must be conducted in the light of potential regulatory and legal
impacts and the reliability of the evaluation results. Time and resources must be
allocated to monitor and validate the performance of trained assessors to ensure that the
data produced will be allowable in court, if required.
3.6 Criteria for selecting expert and/or trained assessors
To be selected either as an expert assessor or for a trained assessor panel,
candidates must meet the following qualifications:
1) Basic sensory acuity and the ability to describe perceptions analytically (i.e.,
not influenced by personal bias). Allergies to seafood or to some food additives should
eliminate a candidate assessor.
2) Potential to develop analytic capability through familiarization with test
procedures, to increase ability to recognize and identify sensory attributes in complex
food systems, and to refine sensitivity and memory so that the assessor can provide
precise, consistent, and standardized sensory measurements that are reproducible.
3) Capable of being monitored (validated) through frequent, periodic evaluations
of the performance and consistency of his/her sensory-analysis decisions.
3.6.1 Time required to assemble a panel of assessors
If expert assessors have been previously trained for petroleum taint, they will
require 4 to 6 hours on the day prior to sensory testing to re-calibrate. For trained
assessors, the best scenario would be to have a previously trained and recently
validated panel available. Assuming that a specific petroleum taint panel of trained
assessors does not already exist, approximately 3 weeks will be needed prior to sensory
testing to recruit, select, train, and validate a panel of assessors. See Figure 3 for a
decision tree for selecting sensory testing methodology.
26

Oil spill occurs in area of fish populations (commercial or sport fisheries)
YES • Sensory testing required to confirm
presence of taint for fish to be released for use as food.
• Species concerned: applies to all finfish, shellfish, mollusks and crustaceans
• Samples taken: see Section 3.0 • Panel type available:
NO
Sensory testing not required
Expert Assessors Selected Trained Panel
Assembling the Assessment Group
Identifying Appropriate Group at Testing Site OR Selecting Testing Site Based on proximity and on
availability of appropriate group
Preliminary validation using known samples, reference standards, laboratory-exposed
samples
Selection Tests using Sequential Testing to Validate ability of assessor for participation
(see Section 4.0)
Evaluation of suspect samples for presence and intensity of taint using sequence:
Raw odor – Cooked Odor – Cooked Flavor
Training using known samples, tainted samples, reference standards, laboratory-tainted samples
Raw odor Data Collection using Difference from Control Test to
measure the presence and degree/intensity of taint present (cooked odor and flavor)
Yes
Stop testing-Taint present
No Continue testing
Data analysis to demonstrate the relationship of
exposed samples to control samples
Cooked odor
Yes
Stop testing Taint present
No Continue Testing
Criteria established for test:
Cooked Flavor
Yes
Stop testing Taint present
No Stop Testing
No taint present – samples pass
Samples demonstrate taint in sensory testing
Samples do not
demonstrate presence of taint
Figure 3. Decision Tree for Sensory Testing Methodology.
27

4.0 Selecting, Training, and Validating Sensory Assessors
In order to conduct objective sensory analyses of seafood, assessors must be: 1)
selected for their ability to perform the sensory task required, 2) trained in the application
of the required test method, and 3) monitored (or validated) for their ongoing ability to
effectively perform. Assessors are chosen to work within specific test protocols and
must be trained to perform within those criteria. The level of training needs vary with the
test method, the assessor type, and the form of data analysis that will be used.
In general, the higher the level of training which has been given (as in expert
assessors), the less statistical variability in the sensory data and the fewer number of
assessors required. Also note – in addition to performance, availability should be a
factor in selecting assessors, as they may be required to travel to a laboratory or spill
site for several weeks.
4.1 Expert assessors
4.1.1 On-site validation
Generally, expert assessors are already employed as seafood sensory analysts
and routinely perform overall quality evaluation of seafood products, including taint
(Reilly and York 1994), so are already trained. In addition, many government sensory
analysts in the US and Canada have received training specifically for petroleum taint in
seafood. These individuals should be chosen when possible.
Expert assessors should be re-validated on-site for their ability to perform the test
in case the test results are used in litigation. This validation can consist of a series of
sequential tests (as would be used for screening panelists for sensory training), and
demonstrates that the individuals have the sensory abilities to perceive the sensory
attributes for which the samples are being examined, and it serves to re-familiarize or,
re-calibrate the assessor.
4.1.1.1 Sequential testing
The groups of tests that fall under the heading of sequential testing are actually
difference tests that are used with pre-set statistical criteria. They allow the decisions
28

“accept for panel," “reject for panel,” or “continue testing” to be made via a pre-set
graphic representation of the statistical criteria (see Appendix 6). The benefits of
sequential tests, as described in the sensory literature (Amerine et al. 1965, Munoz et al.
1992; Meilgaard et al. 1999), are that they “economize” on the number of tests needed
to "accept" or "reject" a candidate, yet they also provide a statistical basis for
accept/reject decisions. Sequential testing is based on pre-selecting the statistical levels
of α and β probabilities for the performance level of the assessors using difference tests
such as triangle, duo-trio, and paired comparison-difference. The test is conducted
using a minimum of 6 sample sets to begin and continuing until the results from the
assessor being tested moves into the accept or reject range of the control chart (see
Appendix 6).
4.1.1.2 Triangle test
In this type of situation, the triangle test can be used effectively, as there is
adequate control over the nature of the treated and control samples. Control charts for
these tests and probability levels can be calculated using the methods described in
Meilgaard et al. (1999). As mentioned above, sequential testing using the triangle test or
other difference tests requires the calculation of control graphs to evaluate the
performance of each assessor candidate. The criteria used in calculating the control
graphs (see Appendix 6) are based on the type of test used and the levels of statistical
significance chosen. The recommended levels of statistical significance are α=0.05 and
β=0.05.
Samples that can be used for selection of expert assessors include:
tainted seafood from prior field sampling or laboratory exposures; •
•
•
an appropriate model system using either seafood flesh or water as the carrier
and appropriate dilutions of critical compounds identified in the petroleum water-
soluble fraction;
concentrations chosen should represent a level of difficulty appropriate for the
taint tested.
The recommended procedure is the 3-alternative forced-choice (AFC) triangle test. The three samples always include two controls and one treated sample. This
29

minimizes carry-over effects and increases the chance of being able to detect the
different sample (thus increasing the sensitivity of the test).
The sample sets are presented in the triangle test format, and the resulting
correct/incorrect responses plotted on the control chart shown in Appendix 6. The
samples to be used should be standardized according to the concentration range of
stimulus that might be expected in the final testing. When the triangle test is being used,
the samples used in selection must be homogeneous in nature and demonstrate no
other differences except for the tainting mixture.
4.1.2 Training expert assessors
Specific details on training expert assessors in general can be found in the ISO-
8586-2 document referenced in Appendix 1. For evaluation of seafood for presence
petroleum taint, expert assessors are trained with known (tainted and non-tainted)
seafood samples. The ballot used in the US is illustrated in Appendix 4. The same
ballot used for final testing is used for training. All expert assessors must demonstrate
that they are evaluating the known samples appropriately. Data are collected and
analyzed statistically either by a. the analysis of variance of the taint intensity data or, b.
by Fisher’s exact test applied to the pass/fail decisions (see Appendix 11). Analysis of
variance is the preferred method of data analysis. If analysis of variance is used for data
analysis, there must be no assessor by sample interaction. For expert assessors, there is a 3-tiered approach to evaluating each sample as
summarized below and explained in further detail in Section 7.0.
The test for RAW ODOR is sequenced as follows:
1) Coded samples of fish are presented for analysis of the raw odor.
2) Assessors decide whether samples “pass” or “fail”, based on presence of
taint (any presence causes a sample to fail).
3) Intensity of taint is rated on the scale provided, from none (0) to strong
(3). Any comments regarding the nature of the taint (descriptors) are also
recorded.
4) If taint is detected in the raw-odor test, then testing stops there, if no taint
is detected in the raw state, then the sample is cooked.
30
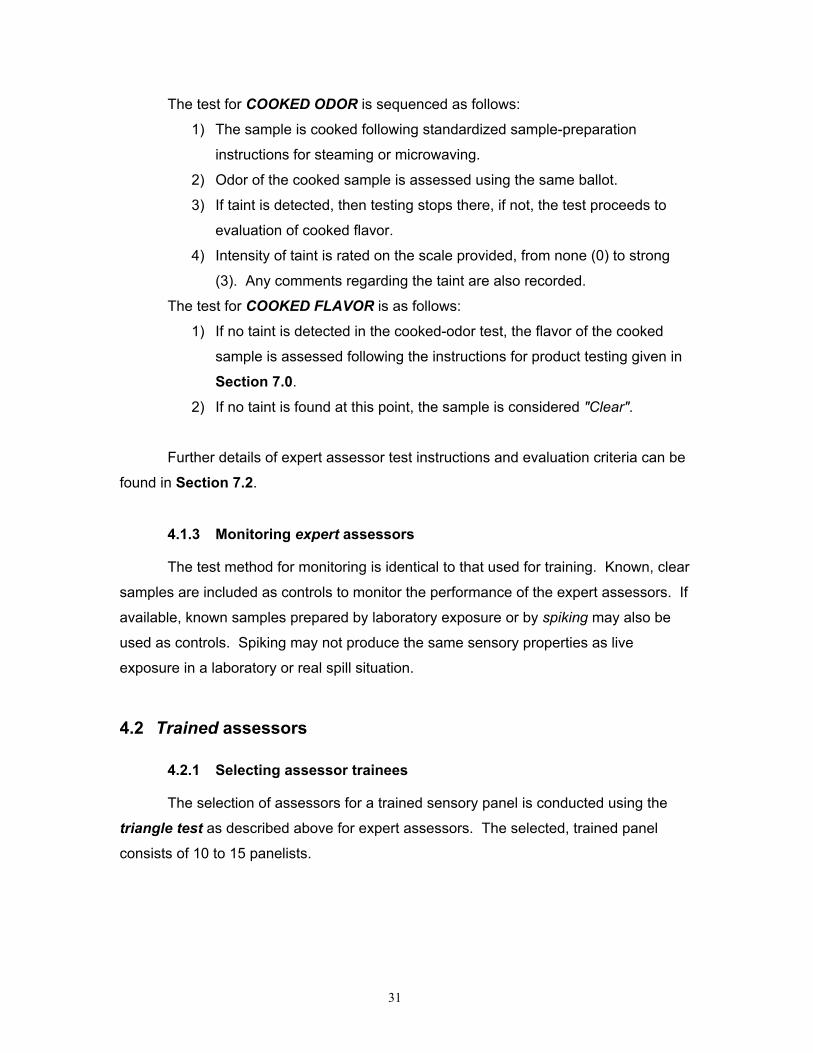
The test for COOKED ODOR is sequenced as follows:
1) The sample is cooked following standardized sample-preparation
instructions for steaming or microwaving.
2) Odor of the cooked sample is assessed using the same ballot.
3) If taint is detected, then testing stops there, if not, the test proceeds to
evaluation of cooked flavor.
4) Intensity of taint is rated on the scale provided, from none (0) to strong
(3). Any comments regarding the taint are also recorded.
The test for COOKED FLAVOR is as follows:
1) If no taint is detected in the cooked-odor test, the flavor of the cooked
sample is assessed following the instructions for product testing given in
Section 7.0.
2) If no taint is found at this point, the sample is considered "Clear".
Further details of expert assessor test instructions and evaluation criteria can be
found in Section 7.2.
4.1.3 Monitoring expert assessors
The test method for monitoring is identical to that used for training. Known, clear
samples are included as controls to monitor the performance of the expert assessors. If
available, known samples prepared by laboratory exposure or by spiking may also be
used as controls. Spiking may not produce the same sensory properties as live
exposure in a laboratory or real spill situation.
4.2 Trained assessors
4.2.1 Selecting assessor trainees
The selection of assessors for a trained sensory panel is conducted using the
triangle test as described above for expert assessors. The selected, trained panel
consists of 10 to 15 panelists.
31
4.2.2 Training assessors
Specific details on training expert assessors in general can be found in the ISO-
8586-1 document referenced in Appendix 1. For an oil spill situation, assessors can be
trained using the difference-from-control procedure, as shown on the ballot in
Appendix 5. The control is always a clear sample of the same species, identified by
marking it “C” or “Control.” All other samples are presented with three-digit codes to
mask their identity.
Known samples are used for training (see ballot shown in Appendix 5).
Panelists are instructed to follow the instructions on the ballot and to use tasting
procedures outlined in Section 7.3. In training, data from the known samples are
collected as blind-coded samples in the test included in the data analysis (using analysis
of variance). Assessor performance is measured by the main effects and the assessor by sample interaction. There should be no statistical significance for either of these.
Any panelist found to be assessing samples differently from the other selected
assessors must be dropped from the panel and replaced by another trained panelist. If
a statistician is not available, refer to Post, Mackie, Butler and Larmond, 1991 for a
simple description and example of calculation of 1-way or 2-way analysis of variance
(i.e. one main effect or 2 main effects).
4.2.3 Monitoring trained assessors
Trained assessors are monitored by including known, clear reference samples
presented with the tainted or suspect samples. If available, known samples prepared by
laboratory exposure or by spiking may also be used as coded samples for monitoring
purposes. Again, spiking may not produce the same sensory properties as live
exposure in a laboratory or real spill situation.
4.3 Experimental design and data analysis for testing assessors (both expert and trained assessors)
Data collection for taint analysis must allow appropriate statistical methods to be
used to interpret the results. Data should include:
descriptive statistics of the number of samples and the numbers that
demonstrate taint.
•
32
statistical analysis of the data, including variables such as species, location,
panelists, etc.
•
•
•
•
•
•
mechanism for monitoring the performance and consistency of the experts
and/or trained assessors, for the purpose of demonstrating the effectiveness of
the measurement tool.
comparisons of samples of affected area against control samples.
When possible, the experimental design should be done with the advice of a
statistician. Studies should be conducted, as much as possible, as a randomized,
complete block design to allow for simple analyses though analysis of variance and for
clear presentation of the data, especially when the data will be used as part of litigation.
The main effects include factors such as species, area, time of sampling, and assessors.
Use of the randomized, complete block design allows for 1) interactions to be calculated
and 2) assessors to be monitored through both the main effects and sample interactions.
Data will be collected as numbers decoded from the ballots.
Ballot for sequential testing using 3-alternative forced-choice triangle test (see
Appendix 3)
Ballot for use by expert assessors (see Appendix 4)
Ballot for the difference-from-control test (see Appendix 5)
In the case of expert assessors, a pass/fail decision is recorded as Pass = 0 or
Fail = 1 for raw odor, cooked odor, and/or cooked flavor (see Appendix 4). The
intensity is also recorded as a value (0, 1, 2, or 3). Because the intensity scale is used
as a continuous scale in training, the numbers may be used in data analysis as well as
through descriptive statistics.
In the difference-from-control test (see Appendix 5), data are recorded on a
sensory scale which represents the perceived difference from the control sample. The
difference is measured using either a 6-inch ruler with increments of 0.1 inches, or with a
15-cm ruler with 1-mm increments. For inches, the scale is recorded from 0 (no
difference) to 60 in. (extreme difference). For centimeters, the scale is recorded from 0
(no difference) to 150 cm (extreme difference). In both cases, results are reported to the
nearest whole number; no decimal fractions are recorded.
33

4.4 Test systems for assessor selection (both expert and trained assessors)
4.4.1 Model system solution of water-soluble fraction of petroleum
The formulation of chemicals present in the water-soluble fraction of crude oil is
presented in Figure 4. This formulation, developed by Derek Murray, Canada
Department of Fisheries & Oceans (Freshwater Institute, Winnipeg), was first used in
1985. This model system has been used in selecting assessors when data are used in
litigation.
Hydrocarbon component
Amount used (mg/L = ppm)
Actual amount used
(µL/L) Benzene 5 5.8 Toluene 5 5.8 ethyl benzene 5 5.8 m-xylene 5 5.8 p-xylene 5 5.8 o-xylene 5 5.8 n-propyl benzene 2 2.33 1,3,5-trimethyl benzene 2 2.33 cumene (isopropyl benzene) 2 2.33 cymene (isopropyl methylbenzene) 2 2.33 Total 38 ppm
Figure 4. Model system solution of water-soluble fraction of petroleum for testing sensory
assessors.
Serial dilutions are prepared at approximately 38, 19, 9.5, 4.75, and 2.375 ppm.
Suggested sets for the triangle test are:
Control: 2 samples, 9.5 ppm: 1 sample,
Control: 2 samples, 2.375 ppm: 1 sample,
Control: 2 samples, 4.75 ppm: 1 sample.
These samples are presented in the 3-alternative forced-choice (AFC) formats
of the triangle test. In this case, the sample sets always contain two control samples
(clear) and one tainted sample. This allows the taint to be assessed against a clear
reference at all times, and makes the test more sensitive in allowing assessors to
distinguish the presence of the petroleum tain
34

4.4.2 Tainted and non-tainted known samples
Laboratory-controlled known tainted ("live") and non-tainted control samples is
the most realistic method for selecting assessors. Although this method is very costly
and labor intensive, it will provide the most realistic conditions (Poels et al. 1988;
Ackman et al. 1991; Davis et al. 1992) and the taint is presented in the actual seafood
system. A detailed laboratory exposure procedure (Hufnagle 2000) is included in
Appendix 7.
4.4.3 Solutions of 1-butanol
An alternative test is based on the use of solutions of 1-butanol (as described in
ASTM E544; Appendix 1). In this case, the triangle test uses two sets of samples: one
in which the control sample is a clear reference, and a second in which the control
contains the test compound, to make the test more difficult. This test has been
developed for use by York and Zhang (1998) for testing assessors of airborne malodors
and may be used for other taint assessments as well.
The test sets are comprised of:
Series 1 [2 clear reference (water) plus one 80-ppm 1-butanol in water] 3 sets each, min [2 clear reference (water) plus one 40-ppm 1-butanol in water] Series 2 [2 20-ppm 1-butanol in water plus one 80-ppm 1-butanol in water] 3 sets each, min [2 10-ppm 1-butanol in water plus one 40-ppm 1-butanol in water]
Each of these series is presented as separate, sequential testing procedures in
which the assessor must pass the first test to proceed to the second. The assessor
must pass both procedures to be accepted.
(NOTE: In some cases, it is possible for a candidate to perform poorly in the
butanol test, but to perform very well with actual petroleum-based samples). If at all possible, model systems outlined in 4.4.1 and 4.4.2 should be chosen.
35

4.5 Data analysis for evaluating assessor candidates
Data from the testing can be recorded as below, and transposed into a suitable
format for analysis of variance through programs such as Microsoft Excel™. For
analysis through SAS, a format such as shown in Appendix 8 is used.
Species Location Date Sample # Analyst Results 1 2 3
4.5.1 Data analysis for difference-from-control test
1) For each sample/code/panelist, measure the response using a 15-cm ruler.
Record the response as a measurement in millimeters (to the nearest mm.).
The scale is therefore 0 to 150.
2) Record the response in an electronic data table, such as in Excel, or coded
appropriately for analysis by SAS or SPSS programming through analysis of
variance for difference from the control sample. The control sample will show
some readings that will give an indication of the sensory “noise” in the test
method.
3) Use the appropriate available program to analyze the data.
4.5.2 Data analysis using SAS
The following is an example of the format for data coding for a randomized
complete block design for the difference from control test. Each sample, which is
assigned a unique three-digit code, has the following information associated with it:
36
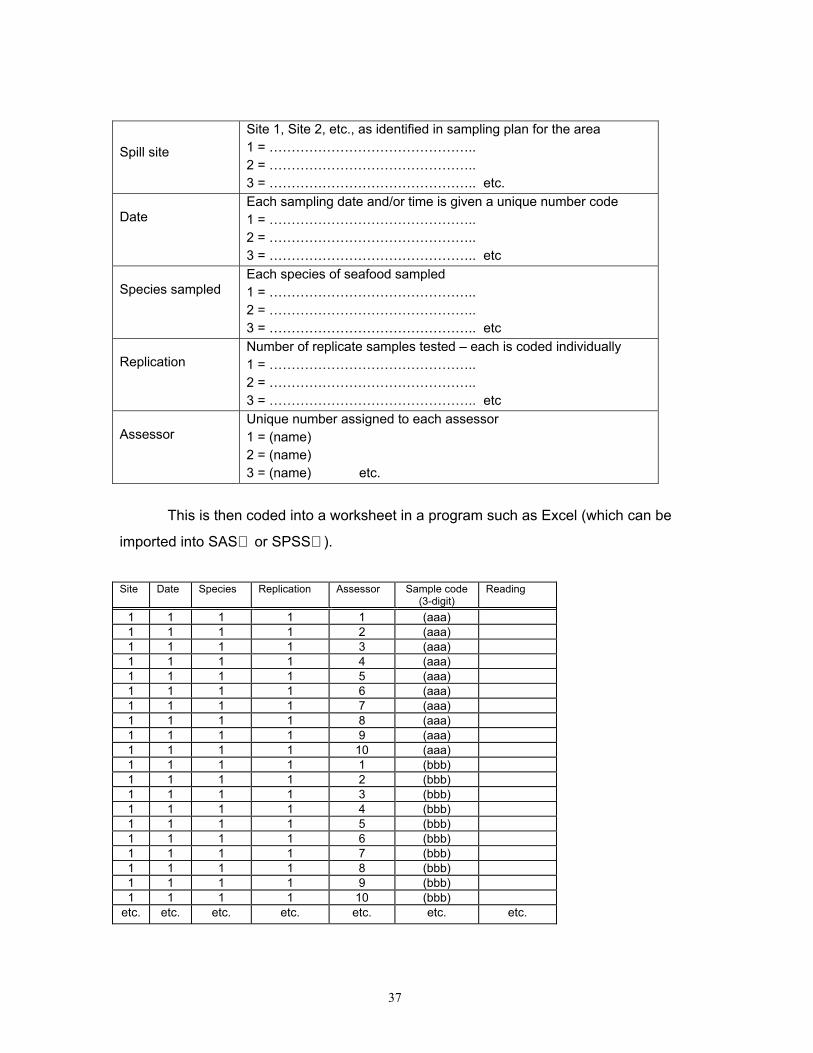
Spill site
Site 1, Site 2, etc., as identified in sampling plan for the area 1 = ……………………………………….. 2 = ……………………………………….. 3 = ……………………………………….. etc.
Date
Each sampling date and/or time is given a unique number code 1 = ……………………………………….. 2 = ……………………………………….. 3 = ……………………………………….. etc
Species sampled
Each species of seafood sampled 1 = ……………………………………….. 2 = ……………………………………….. 3 = ……………………………………….. etc
Replication
Number of replicate samples tested – each is coded individually 1 = ……………………………………….. 2 = ……………………………………….. 3 = ……………………………………….. etc
Assessor
Unique number assigned to each assessor 1 = (name) 2 = (name) 3 = (name) etc.
This is then coded into a worksheet in a program such as Excel (which can be
imported into SAS or SPSS ). Site Date Species Replication Assessor Sample code
(3-digit) Reading
1 1 1 1 1 (aaa) 1 1 1 1 2 (aaa) 1 1 1 1 3 (aaa) 1 1 1 1 4 (aaa) 1 1 1 1 5 (aaa) 1 1 1 1 6 (aaa) 1 1 1 1 7 (aaa) 1 1 1 1 8 (aaa) 1 1 1 1 9 (aaa) 1 1 1 1 10 (aaa) 1 1 1 1 1 (bbb) 1 1 1 1 2 (bbb) 1 1 1 1 3 (bbb) 1 1 1 1 4 (bbb) 1 1 1 1 5 (bbb) 1 1 1 1 6 (bbb) 1 1 1 1 7 (bbb) 1 1 1 1 8 (bbb) 1 1 1 1 9 (bbb) 1 1 1 1 10 (bbb)
etc. etc. etc. etc. etc. etc. etc.
37

4.5.3 Data Analysis using Microsoft Excel
Examples of data recording for analysis using the Data Analysis subroutine
under Tools:
One-way ANOVA Two-way ANOVA with Replication
Two-way ANOVA without Replication
Only simple ANOVAs are possible with Excel. If more than two main effects are
tested, SAS or SPSS or their equivalent must be used.
38
5.0 Facility Requirements for Sensory Evaluation of Seafood
5.1 Maintaining a neutral environment
The facility in which objective sensory evaluation is conducted is an essential
component of sensory test protocols. Sensory testing generally requires a controlled
neutral environment in which samples can be evaluated for their intrinsic attributes, here,
the possible presence and intensity of taint from exposure to petrochemicals. The
testing environment must not interfere with or influence the sensory test. Both ASTM
and ISO provide excellent guidelines for facility design (see Appendix 1).
Principle of facility-design requirements: A special test room or area in which to conduct sensory evaluations under constant controlled conditions with a minimum of distractions. To control the effects from introductions of physiological or psychological errors into human assessments, e.g., background odors causing adaptation and reduced sensitivity.
Components of the neutral environment include:
lighting of appropriate quality and intensity for the assessments, •
•
•
ventilation that is appropriate and adequate to remove odors given off by the
samples during testing, and
freedom from distractions.
Another important consideration is ease of sanitation and the use of products that
do not add odors of their own into the test area (odor-free soaps, etc.) Various
publications describe the construction of sensory facilities, including ASTM STP913
Physical Requirement Guidelines for Sensory Evaluation Laboratories (see Appendix 1).
In evaluating seafood following an oil spill, consideration must be given to the
choice of testing locations, as well as to field vs. laboratory testing. It is important to also
consider chain of custody during the handling, preparation and evaluation of samples
(see Section 6.1).
39

5.2 Sensory testing at the spill site
Field-testing involves actually bringing the assessors to the site where samples
are harvested for sensory evaluation. This approach has several disadvantages
following an oil spill:
Lack of control over ambient conditions (e.g., air temperature and humidity,
provision of appropriate shelter).
•
•
•
Interference from and adaptation to, environmental odors (e.g., spilled oil, fuel on
the boat or ship; rigging, nets, etc.).
Exposure to distractions (e.g., cleanup personnel, equipment noise, media
presence, etc.).
When expert sensory assessors were tested in England on their ability to
conduct quality evaluations of products in a field (market) setting, as well as in a
laboratory, their evaluations were shown to be accurate in both settings (Aust et al.
1985). However, because of ambient conditions at the oil-spill site that could
compromise the objectivity of the testing—and the likelihood that the sensory data on
seafood taint would be a component of possible legal actions—we recommend that all
sensory assessments relative to oil spills be conducted in an appropriate laboratory
setting where the testing environment cannot be challenged.
5.3 Sensory testing in the laboratory
An appropriately designed laboratory, preferably one specifically designed for
sensory testing or one that can be converted as such, is the best choice. The key is
providing adequate equipment and space for sample storage, preparation, sample
evaluation, and data analysis.
Another concern during sensory testing of seafood following an oil spill is the
presence of other interested parties (such as media, industry representatives, fishers,
etc.), all with a vested interest in the results of the sensory tests. It is essential that they
not be allowed to interfere in the assessors concentration on their tasks on the sensory
tests; i.e., they should be kept out of the sensory testing room when assessors are
evaluating seafood samples.
40

5.3.1 Sample-preparation area in the laboratory
It is critical that the sample preparation area be physically separate from the
sample evaluation area. The preparation area is used for the storage and handling of
seafood samples and for the preparation of samples for sensory evaluation (in the test
area). The facility should be constructed so as to comply with the requirements of good
manufacturing practices for the design and construction of fishery facilities, and all
equipment used in the area must also comply with the requirements for equipment used
in fish-processing. The facility design must also be appropriate for a sensory evaluation
laboratory, e.g., the rooms must be designed so that odors from sample preparation and
cooking do not transfer into the sensory evaluation area.
The sample-preparation area should provide:
•
•
•
•
•
•
•
•
–
–
–
–
refrigerators and freezers adequate for the temporary storage of chilled and
frozen seafood, and for the freezing of samples. Freezers must have < -20º C
temperature capability.
storage facility for glassware used for sample presentation for evaluation
tables and benches (one or more) for the preliminary handling and inspection of
batches of material,
table (at least one) suitable for the wet-processing operation of filleting of fish,
handling of crustaceans and molluscs, preparation of blended samples (BIFs),
etc.
counter-space suitable for the preparation and coding of final samples for
serving in the evaluation area,
large sink (at least one) for thawing samples and for washing containers,
utensils and equipment used in the preparation and evaluation areas.
cooking facilities (microwave ovens, steamers, etc.) for the cooking of samples
as needed during evaluation. Stoves should be electric (gas or propane is
another source of potential off-odors in the background air).
equipment including:
stainless-steel trays, medium (~50x40 cm) and large (~70x60 cm)
filleting boards, filleting knives, sharpening stone and steel
plastic or metal containers for fish offal
containers for other rubbish
41

utensils and materials for cleaning and disinfecting premises,
equipment, and utensils
–
–
–
–
–
•
•
•
glass or ceramic baking dishes with lids (not plastic), suitable capacity
for holding samples of finfish, molluscs, and crustaceans
digital thermometer, range -50 to 300º F (-45 to 149º C)
electronic balance
assorted stainless steel kitchen utensils, knives, serving spoons, etc.
If possible, all cooking equipment and utensils should be kept separate for the
control and suspect samples. If functionally, it is not possible to keep the two groups of
equipment separate, everything must be fully cleaned in between sample sets using
unscented soap and several rinses in odor free water. Cooking equipment such as
microwave ovens and steam tables must be kept separate, as it is not possible to
completely clean these in between sample sets.
5.3.2 Sensory-evaluation (testing) area in the laboratory
This area is to be used only for sensory evaluation (testing) of raw and cooked
seafood samples delivered from the sample-preparation area. There must be no
preparation of products in this area. The surroundings should be sensory-neutral (e.g.
color, odor) and free from distraction, so that the personnel involved in the sensory test
can concentrate on evaluating the products.
This area should be constructed and furnished so that it can be maintained in a
clean and hygienic state. However, because there should be no seafood preparation in
the area, it need not comply with requirements for seafood-processing facilities. It
should, however, comply with the guidelines for food preparation areas in catering
establishments and with ASTM STP 913 (see Appendix 1).
Floors should be finished with a seamless, waterproof coating.
Wall surfaces should be smooth and painted white or very light, neutral grey or
beige, using washable paint; or finished in tile or odor free plastic sheet material
in white or neutral grey or beige.
Workbenches should be constructed of, or finished in, impervious material that
can be sanitized and disinfected. Any joint between benches and walls should
be sealed with waterproof mastic. Benches may incorporate cupboards and
42

drawers, and cupboards may be fitted to the walls above the benches. Bench
tops should be white or pale neutral grey or beige.
•
•
•
•
•
•
–
–
–
Lighting should be from fluorescent tubes providing about 1000 lux/m2 (92.9 or
approximately 100 foot-candles), of color-matching quality (5000º K or 6000-
6500º K), and with a color-rendering index of greater than 90%.
Air handling equipment to create positive pressure to facilitate removal of odors.
Supplementary electronic air purifiers with activated carbon filters may also be
used.
Room temperature should be controlled to between 68 to 75º F (20 to 24º C),
and relative humidity is 45%, so should be within that range.
Washbasin or sink supplied with hot and cold water and odor-free hand soap.
Odor-free drinking water should be available for rinsing during evaluation
sessions, either filtered water from the laboratory water supply, or bottled water
Small equipment including
warming plates to keep cooked samples at serving temperature
cutlery (forks, spoons, table knives)
glass jugs and/or beakers for water or other rinsing materials
The sensory-evaluation area is arranged in one of two different ways, depending
on the type of sensory evaluation being conducted and the type of assessors being used
(expert or trained).
5.3.3 Workshop facility
Expert assessors usually work in a workshop-type facility, where samples are
laid out in individual stations and the assessors move from one sample to another to
perform the evaluations. This area must meet the requirements for lighting and
ventilation (odor control), minimize distractions, and ease sanitation.
A workshop facility consists of large areas of benches (e.g., counters or
stainless-steel tables on casters for easy mobility) on which are movable dividers: three-
sided units either hinged to the wall or free-sanding. Dividers are constructed of non-
porous, easily cleaned materials, as are the countertops. Individual samples are placed
in each of the divided spaces, with assessors moving from one sample to another. If
dividers are not available, assessors may work on samples in the same area if they are
43

positioned far apart and are not facing one another. This type of facility is designed to
accommodate larger sample sizes and to facilitate movement of assessors so that all
assessors can examine every sample (see Section 6.4.2).
5.3.4 Booth facility
Trained assessors usually work in a traditional booth facility in which the
assessors are stationary in booths and the laboratory technicians bring the samples to
them. In this facility, individual booths are provided to control the test conditions and
provide a comfortable evaluation environment. Smaller, individual samples or sample
sets are presented to each assessor for evaluation, and data are collected from the test
ballots (see Appendix 5 for ballot sample). In this type of facility, each person receives
his or her own individual sample or set of samples. The individual samples are made
homogenous in nature by preparing small aliquots from multiple blended organisms (see
Section 6.1.2.2). Criteria for construction of panel booths are given in ASTM STP913
(see Appendix 1) and generally include:
Enough booths for the size of the sensory panel (panel sessions are scheduled
to accommodate individual assessors).
•
•
•
•
•
•
•
•
Countertop and walls are constructed of non-porous material and are neutral in
color and durable.
Booths are generally 27 to 32 inches wide (~69 to 82 cm) to allow adequate
workspace (for tray, ballot, judge), and are fitted with a hatchway door for sample
presentation and removal.
Booths may be computer-equipped for data acquisition during sensory testing
Dividers extend beyond the countertop to minimize distraction during panel
sessions.
Lighting should be even and of the quality and quantity specified above
Booths are equipped with adjustable chairs of appropriate height and having
casters for ease of mobility.
Booths may be equipped with rinse sinks (although not generally recommended
because of specialized cleaning needs and potential problems with odor control).
44
6.0 Sample Handling, Preparation, and Presentation
in the Laboratory
6.1 Personnel involved in sample handling, preparation, and presentation
Assessors who will evaluate the samples for presence of taint should not handle
or help prepare the samples at any stage before the test.
•
•
•
•
The individuals who will be responsible for preparing samples must be trained
and are usually referred to as facilitators or technicians. Individuals who
prepare the samples can not participate as assessors. These individuals should
follow the guidelines for odor assessment panels and refrain from using any
scented personal care products in any form (especially perfumes, after-shaves,
etc.). These individuals must not smoke, must have clean, odor-free hands, and
must wear clean clothing that is odor-free. Lab coats or aprons should be worn
only in the laboratory setting.
6.2 Secure handling of samples
To ensure chain of custody, samples are to be handled in a secure manner at
all times, and their inherent sensory characteristics are to be preserved (see also
Section 3.0).
6.2.1 Sample receiving
Keep detailed records of the date and amount of sample received, sample
condition, labeling and codes present, storage procedures, and names of
personnel handling the samples (see Appendix 10 for an example of a chain of
custody form and detailed instructions). Notes should be taken in a hardbound
notebook specifically designated for this project. If control samples were
collected, make sure that they are clearly labeled.
Upon receipt, unpack samples immediately and check for any physical damage.
Have a trained sensory assessor check to see if any quality changes have
occurred. Samples should not be decomposed.
45
If sensory testing is to be done immediately and can meet the 24-hour time
window, re-ice and refrigerate immediately (see storage procedures in Section 6.2.3 below).
•
•
•
•
•
•
•
•
•
If samples are shipped frozen, check to see that an adequate frozen state was
maintained. If any samples have thawed, separate these from the others and
label. Have a trained inspector or expert assessor check for decomposition).
After unpacking, record sample information and place immediately on ice or in
frozen storage as described in Section 6.2.3 below.
6.2.2 General principles of sample preparation
The goal is to prepare samples for presentation to the assessors without causing
any quality changes or imparting any off odors/flavors due to handling or cooking.
Personnel who will be preparing the samples should perform preliminary
sample-preparation trials to determine and standardize thawing and cooking
times.
If samples can be tested within 24 hours of capture, freezing is not necessary as
long as samples are kept adequately cold (4° C or below).
Only clean glassware, aluminum foil or stainless steel should be allowed to come
in contact with the samples at any time. Any other materials, particularly plastic
packaging material, could impart, or be suspected of imparting off odors and/or
flavors. Make sure that all thaw water is clean and odor-free.
If control samples are incorporated into the test design, these samples must be
handled, stored, prepared, and presented in exactly the same manner as the
suspect samples.
If chemistry is to be performed, work with the chemists to determine the numbers
and volume of sample that they will need. Chemistry samples are to be handled
in exactly the same manner as sensory samples. If correlations will be
performed on the chemistry and sensory data, measurements should be taken
from the same sample, as fish do not taint uniformly.
An experimental design must be determined before sample preparation begins
(see Section 9.0). Prepare enough samples to ensure enough for each
treatment and replication. An expected flesh recovery table is included in
Section 2.7.2.
46

In addition to the muscle tissue, it is common in certain societies to consume
other parts of finfish and crustaceans such as the roe, tamale, or certain organs.
In this case, all parts normally consumed should be evaluated for tainting. For
pooled, blended samples, enzyme-containing organs should be separated from
the muscle tissue and evaluated separately.
•
•
•
•
Nothing may be added to change the odor or flavor of the edible tissue. This
includes condiments, such as salt.
For expert assessors, either intact tissue portions or whole organisms will be
prepared for testing.
For trained assessors, individual foil packet samples (BIFs) will be prepared
from the normally consumed portions of pooled multiple organisms.
From this point forward this section is organized according to the 2 sample
preparation styles (“intact organisms” and “pooled, blended organisms”) as necessitated
by assessor and test type and described above. A full description of each sample style
can be found later in this section.
Table 2. Summary flowchart of sample preparation and presentation.
Intact single organism samples for
expert assessors Pooled, blended multi-organism
samples for trained assessors
Single organisms, or parts thereof, presented in covered glassware
Multiple organisms, blended, portioned, and presented in individual foil packets. (BIFs)
One blind-coded organism presented at each station; assessors move from station to station.
Stationary panelists are presented with multiple blind-coded samples at each station.
All assessors evaluate each sample. One assessor evaluates own set of foil-packet samples.
Vacuum-sealed samples thawed under refrigeration or in cool, running water.
Frozen foil packets thawed under refrigeration or cooked from frozen state.
Raw samples presented first for odor evaluation in covered glassware at ambient temperature.
Samples evaluated in cooked state only. For odor, then flavor.
Samples microwaved in covered glassware to internal temperature of 160° F and placed on warming trays back at stations in evaluation lab.
Samples steam-cooked 7 mins. if thawed, or 10 mins. if frozen. Transfer one set for each panelist to warming trays in evaluation booths.
In pre-determined order, assessors evaluate odor of all samples found negative for taint in the raw odor evaluation. Assessors then taste all samples found negative for taint in the raw and cooked odor evaluation steps (see Section 7.2).
In predetermined order, assessors evaluate odor of all samples first, re-folding the packets as they go. Assessors then taste all samples found negative for taint by odor evaluation (see Section 7.3).
47

6.2.2.1 Intact organism samples
Intact organism samples are usually presented to expert assessors, and are
presented raw first, then cooked as outlined below in Section 6.3.1.
Finfish Remove edible muscle tissue by filleting. If the species is commonly
sold and consumed skinless in the marketplace, remove the skin. If the species
is usually sold skin-on, leave the skin on the fillets but remove scales first from
the entire fish. Keep cool if testing is to be done immediately, or wrap each fillet
in heavy-duty aluminum foil, vacuum-seal and freeze at < -20º C.
•
•
•
•
•
•
•
•
Bivalves or Mollusks Rinse live organisms in shell, organize into sample units
of 3 to 6 (see Section 2.0), and keep cool if testing is to be done immediately. If
samples are to be tested later, wrap 3 to 6 live, in shell organisms together in
heavy-duty aluminum foil, vacuum-seal and freeze at < -20º C.
Crustaceans Keep cool and moist if testing is to be done immediately. If
testing is to be done later, place live organisms in freezer until all movement
stops, then remove, wrap with heavy-duty aluminum foil, vacuum-seal and freeze
at < -20º C.
6.2.2.2 Pooled, blended samples
Pooled, blended samples are usually presented to trained assessors. To
prepare pooled samples, the edible parts of multiple organisms are blended, divided into
20-gram aliquots and sealed in individual foil packets as outlined below. These samples
are evaluated in the cooked state only.
At least 6 organisms are recommended for pooling per sample to minimize the
effects of natural flavor differences among organisms; however, a minimum of
three organisms can be acceptable if samples numbers are limited or the
individual organisms are large.
Standard measurements, such as size, weight, length and sex (if possible),
must be recorded before pooling.
Detailed-harvesting records must be kept. Pooled samples must be from the
same harvest location.
Sample preparation should result in uniform samples.
Keep seafood tissue cool at all times.
48

If preparing samples from frozen seafood, thaw samples under refrigeration only
enough to handle.
•
•
•
•
•
•
•
Finfish Blend edible tissue from 6 fish just long enough to homogenize.
Bivalves Remove the meats from six organisms and blend.
Crustaceans If any organs or other body tissues are commonly eaten other
than muscle tissue, these must also be evaluated for taint, but kept distinct and
evaluated separately. First, separate commonly consumed sections from six
organisms, then pool, blend, and freeze. (For example, for lobsters, pool, blend
and prepare individual samples with the muscle tissue from six organisms,
separately blend the tamale from six, etc.).
6.2.3 Storing samples
All frozen samples must be protected from dehydration and oxidation either by
vacuum sealing or through a combination of glazing and airtight wrapping. The sample
must be wrapped in heavy-duty aluminum foil before placement into any plastic vacuum
bag or plastic wrapping.
Freeze samples quickly and store in a freezer at -20° F or below, keeping
samples from different sources separate and clearly labeled. The freezer must
be clean and odor-free.
For security purposes, the freezer should have a lock, or samples must be
stored in a locked container or compartment in the freezer. The number of
personnel with access to the samples must be limited and recorded.
The freezer should be equipped with a temperature alarm system and the
freezer temperature should be periodically monitored.
6.3 Sample preparation for sensory testing
Prior to each day of sensory testing, identify and gather the samples that will be
tested on the following day and organize by sessions.
All sample preparation will be done in the preparation area before being brought
to the evaluation area of the laboratory.
49

6.3.1 Intact single/multiple organism samples
As stated above, this type of sample consists of whole or edible parts from single
or multiple animals and is usually presented to expert assessors. These samples will be
evaluated for raw odor, then cooked and evaluated for odor and flavor. Samples should
be presented as they are normally purchased and consumed in the marketplace. This
will vary with species and region (i.e., in the United States, finfish is usually purchased
and prepared in the filleted state, either skinless or skin-on, depending on the species,
while in many other countries, it is usually purchased and prepared whole or dressed).
Raw samples should be presented at ambient temperature. These samples should be
presented to assessors as soon as possible and not allowed to remain at ambient
temperature, as this will cause quality changes.
Frozen samples must be thawed in their vacuum-sealed packaging, either under
refrigeration overnight, or in cool running water before the session. Allow them to
reach room temperature before presenting to the assessors.
•
•
•
•
Chilled (never been frozen) samples are to reach room temperature before
testing.
Raw samples must remain, after thawing, at refrigeration temperature and in
their vacuum sealed packages until approximately 1 hour before the test, at
which time they are brought up to ambient temperature in covered glassware.
After initial raw odor evaluation by the assessors, the same samples will be
cooked by the facilitators and placed back in the evaluation laboratory.
Cooked samples are to be heated to an internal temperature of 160° F.
Appropriate cooking methods include steaming or microwaving in glassware.
Samples must be cooked uniformly, and equipment must be calibrated. Perform
cooking trials for each species, each type of cooking vessel, and each piece of
cooking and warming equipment. Note on each piece of equipment the specific
cooking and/or warming instructions required bringing samples to an internal
temperature of 160° F for each species. Samples are to be kept warm and
maintained at a temperature of 140–150° F with electric warming trays at the
booths or stations in the sensory evaluation laboratory.
50

6.3.2 Blended, pooled samples
Blended, individual foil packets (BIFs) can be cooked either from a frozen
state, or from a thawed state. Samples should be uniform in appearance,
amount, and temperature. To minimize browning of the samples, steaming is
preferred.
•
•
•
•
•
•
•
To cook, arrange foil packets on a rack in a steamer, allowing enough room for
steam to circulate. Cook for about 7 minutes if thawed, or 10 to 12 minutes if
frozen (a trial run should be conducted ahead to determine exact times).
Transfer cooked samples via stainless-steel tongs to electric warming trays at the
booths in the evaluation laboratory to maintain a temperature of 140 to 150° F.
Do not hold samples on warming trays longer than 15 minutes.
6.4 Sample presentation in the evaluation area
6.4.1 Preliminary preparations
A set of 3-digit random numbers for blind-coding the samples and a template for
randomized presentation order should be generated ahead of time.
6.4.2 Sample placement and timing
The sample design must include randomized order of presentation of samples
within a session (see Section 6.5 below).
All coded samples should be placed at booths or stations in the evaluation
laboratory by the facilitators before the assessors enter the area.
Samples should be presented in sessions (or sets) with a 15 to 20 minute break
in-between.
Assessors should generally evaluate a maximum of eight samples per session to
minimize sensory fatigue and carry-over effects.
For trained assessors, multiple samples (~ 8) are placed at each booth or station
where the panelist remains stationary. With expert assessors, each intact
organism sample is presented at a booth or station and the assessors rotate
among them. All assessors evaluate all the samples.
51

For trained assessors, the order of sample presentation within a session must
be randomized. With expert assessors, order is randomized as they rotate
among the stations.
•
•
•
•
Intact organism samples should be presented in glassware large enough to
allow volatiles to equilibrate in the headspace for sniffing. The ratio should be
about 1/3 sample to 2/3 headspace. Samples must be covered at all times to
allow volatiles to accumulate in the headspace, except for when an assessor is
actually engaged in smelling or tasting.
6.4.3 Presentation of intact organism samples
All samples are random coded in microwave-safe covered glassware (such as
Pyrex) and placed in pre-determined positions in the evaluation area in the raw state
first before any cooked evaluation occurs. After the assessors evaluate all the raw
samples, the samples are removed from the evaluation area, cooked, and placed back
at their original stations in the evaluation area on warming trays. The assessors should
leave the evaluation area for a break during this time.
Raw evaluation Raw samples are presented in coded, covered glassware.
Assessors will follow the raw odor evaluation protocol as stated in Section 7.2.3.
Cooked evaluation Facilitators will remove samples from their booths or
stations and cook according to Section 6.3.1. Facilitators then place cooked
samples back in their original positions in the sensory lab. Samples should
remain in their covered glass container at all times. Samples must be placed on
warming trays that have been set to maintain an internal sample temperature of
145–150° F. Assessors will follow the cooked odor and flavor evaluation protocol
for expert assessors, as stated in Section 7.2.3.
6.4.4 Presentation of pooled, blended samples
Facilitators place multiple, cooked and coded foil packets, in order, on a warming
tray at each booth or station. Order of presentation is usually left to right, front to back.
Assessors will evaluate the samples following the protocol for trained assessors, as
stated in Section 7.3.
52

6.5 Assigning random sample-presentation sequences
Randomizing sequences for sample presentation should include:
1) Random order of sample presentation among assessors at each session. Within the set of samples presented at one session, randomize the
order of presentation such that no two assessors get samples in the same
order. This is easily done with a random-number table described in
Appendix 8. This can be done for both expert and trained sensory
assessors.
2) Random order of sets of samples presented to each assessor at each session. In selecting panels, such as when using the triangle test, the sets
of samples are randomized for each assessor, and the sequence of samples
within each set of three is also randomized. This requires careful attention to
the randomization process and careful record keeping for sample
presentation.
3) Random presentation of sets of samples over all sessions. In a larger
study and when using trained assessors, by order of presentation over all
sessions (when this is possible). This occurs when all of the samples have
been prepared ahead of time (as for the BIFs), and individual sets can be
drawn for each panelist. This is not usually possible for expert assessors, as
all must examine the same sample within the same short time period.
4) Exceptions There are certain exceptions to the random order of samples,
the most important one being threshold studies which require ascending or
descending series of concentrations. In this case, blank samples are inserted
at the beginning and within each series, with the number of blanks varying to
minimize predictability.
Detailed instructions on the use of random codes and generating random
numbers, and randomizing samples are included in Appendix 8.
53


7.0 Sensory Evaluation Protocols
7.1 General sensory testing procedures
The following points are common to all of the sensory test methods described in
this document. 1) Do not allow participants to taste any seafood that has died or is suspect of
dying as a result of the oil spill.
2) Before entering the evaluation room, the assessors should wash their hands
with odorless soap and dry them with low odor (white) paper towels to
remove any trace of residue. Assessors must wear clean, odor-free clothing
and refrain from using any scented personal care products. Assessors may
not smoke before or during testing. Assessors may not wear clothing that
has been exposed to cigarette smoke, including lab coats, etc.
3) Assessors must not smoke during the test.
4) During testing sessions, assessors should avoid or minimize touching
samples. They should clean hands of any sample residue between each sample using unscented soap or, if sinks are not available, low-odor paper
towels dipped in odor-free water. This is to prevent cross-contamination of
samples and physical carry-over of any stimuli.
5) If flavor is evaluated, participants must adhere to strict rinsing procedures
and must expectorate all samples.
6) Rinsing between samples using neutral materials is standard practice during
sensory evaluation sessions. The purpose of rinsing is to prevent the carry-
over of stimuli from one sample to the next. Odor-free water (e.g., distilled
or filtered) is recommended along with unsalted soda crackers. When
crackers are used, they must be followed by a water rinse to remove any
residue from the mouth. It has been found that using odor-free water heated
to 50º C is useful in removing flavors between samples. In ASTM D3696-95
(which has been superceded by E-18 1096), the recommendation is still
given to use a dilute lemon juice rinse during panel sessions. Do not use lemon juice rinse! Lemon juice can interfere with low levels of sourness in
the samples.
55

7) Human assessors are susceptible to fatigue and adaptation to petroleum
odors/flavors that may diminish their ability to detect taint. Samples should
be arranged in sets with maximum number in each session, and assessors
must be given a break between sets (see Section 6.4.2). Assessors must
also take sufficient time between samples within a session.
8) Time-out between samples is required to avoid carry-over of odor/flavors
from the previous sample. A minimum of 1 minute should be taken between
samples within a session, although a longer time may be needed in specific
testing conditions. Assessor fatigue is minimized by rinsing and by limiting
the number of samples that are analyzed at each session. The number that
can be tested will be established during training. Generally speaking, if
there is a strong carry-over effect, 1 to 3 treatments with appropriate rinsing
may be the limit for number of samples per session. If carry-over effects are
minimal, a larger number of samples can be evaluated, with appropriate
rinsing. We have found that expert assessors generally feel that eight to 10
per session is the maximum.
9) Panel methodology for the analysis of taint includes the use of warm-up
samples at the beginning of each test session. This allows the sensory
systems to re-experience the sensory attributes that will be evaluated before
the actual testing begins. Although data may be collected on these warm-up
samples, they are not used in the final analysis.
10) Assessors should be familiar with all instructions before the test.
The following sections are divided according to protocols for expert assessors
(as defined in Section 3.5.2.1) and for trained assessors (as defined in Section 3.5.2.2).
7.2 General instructions for expert assessors
7.2.1 Before testing
Assessors must wear clean, odor-free clothing. •
•
•
No extraneous scents are allowed, e.g., perfume, after-shave, or breath mints.
Assessors should not eat or drink 1/2 hour before sensory testing.
56

Assessors should avoid highly spiced foods the day before and the day of the
test.
•
•
•
•
•
•
•
•
•
•
•
•
•
•
•
Assessors may not smoke before or during the test, or wear clothing smelling of
cigarette smoke.
Assessors must wash their hands with unscented cleanser and odor-free water
when they enter lab.
Assessors must cleanse their mouth by rinsing either with odor-free water or by
chewing an unsalted cracker, then rinsing several times with odor-free water.
The facilitator must review the ballot and test procedure with the assessors.
Assessors should evaluate a few warm-up samples at the start of each day of
testing.
7.2.2 During testing
Assessors must avoid hand contact with samples by using a knife, fork, or tongs
to manipulate the sample.
Assessors should wash hands with unscented soap between samples.
To sniff or taste the sample, assessors should slide the glass covers off just a
slight distance, then quickly slide the cover back. This retains as many volatiles
as possible within the glassware for other assessors.
Assessors should wait at least 1 minute between each sample within a set,
taking longer if necessary.
Assessors should wait at least 15 minutes between sample sets.
Assessors should evaluate a maximum of 8 to 10 samples within a set.
For odor evaluation, assessors should take two or three short shallow sniffs
(sometimes called “bunny” sniffs) and standardize the distance from their nose to
the samples.
Assessors should cleanse their nose between samples by sniffing the back of the
hand or arm, or the headspace over a glass of odor-free water.
For flavor evaluation, assessors must cleanse their mouth between each sample
by chewing an unsalted cracker and rinsing with odor-free water. Assessors
should standardize the amount of sample placed in the mouth. All samples must be expectorated!
57

7.2.3 Evaluation criteria
The following 3-tiered procedure is recommended to minimize sensory fatigue
and carry-over effects (see Figure 5).
1) Evaluate the odor of the RAW sample for the presence of taint. If taint is
detected: STOP—Sample fails. If taint is not detected, proceed to Step 2.
2) Evaluate the odor of the COOKED sample for the presence of taint. If taint is
detected: STOP—Sample fails. If taint is not detected, proceed to Step 3.
3) Taste the COOKED sample for the presence of taint. If taint is detected:
STOP—Sample fails. If taint is not detected: Sample passes.
Using this the 3-tier evaluation procedure described above, assessors must
evaluate the raw odor of all the samples presented in the set first, then proceed to
evaluate the cooked odor of all the samples found negative for taint by raw odor, then
proceed to evaluate the flavor of all the cooked samples that were found negative for
taint by raw and cooked odor. The principle behind this procedure is: if taint is detected
in the raw odor of a sample, concentrations are usually well above threshold. If the
same sample were cooked and evaluated, the perceived intensity would only be more
intense and the assessor would be exposed to relatively high concentrations (of taint)
that would add to fatigue and carry-over. The same is true for cooked odor vs. cooked
flavor; if the assessor perceives taint in the cooked odor, it would only become more
pronounced in the flavor. Rinsing taint from the mouth is more difficult.
7.2.4 Evaluation ballots
Expert assessors who have had some descriptive training should use ballots that
allow for recording both quantitative and qualitative information. Ballots of this
nature usually incorporate a type of category scale with an area to record
descriptors. An example is illustrated in Appendix 4.
•
• Because expert assessors are intimately familiar with the seafood products they
are assessing (see Section 8.1.1), they can disregard “normal” sensory
attributes and focus on contamination. Expert assessors should use the ballot to
record only the presence and intensity of petroleum contamination and to
provide descriptors of that contamination.
58

Oil Spill Event
Collect suspect and control samples (if possible) Prepare samples, ship to laboratory
Freeze samples if longer than 24 hours to testing
Assemble the Expert Assessment Group at proper facility
Preliminary validation using known samples, reference
standards, laboratory-exposed samples
Evaluation of suspect samples for presence and intensity of taint using sequence:
Raw odor – Cooked Odor – Cooked Flavor
Raw odor
Yes
Stop testing-Taint present No
Continue testing
Cooked odor
Yes
Stop testing - Taint present No
Continue Testing
Cooked Flavor
Yes
Stop testing - Taint present No
Stop Testing No taint present – samples
pass
Figure 5. Sensory decision tree for use by expert assessors in evaluating petroleum taint.
7.3 General instructions for trained assessors
** Assessors should be familiar with these instructions before the test.
A panel of trained assessors will evaluate 20-g packets of pooled and blended
seafood samples. The panelists’ instructions for handling blended sample packets
during evaluation sessions include:
Open packets by tearing off one folded end and down one side of the foil. •
59

Evaluate the odor of the samples first, then close the packet temporarily. •
•
•
•
•
•
•
•
•
•
•
•
•
•
•
•
•
•
•
•
If no petroleum contamination is detected, or if it is of such a slight intensity as to
be questionable, samples must be tasted.
To taste, divide the sample in half and do the assessment. Use second half as
needed for re-tasting.
Cleanse mouth after each sample set.
7.3.1 Before testing
Panelists must wear clean, odor-free clothing.
No extraneous odors or scents should interfere, such as perfume, after-shave, or
breath mints.
No eating or drinking 1/2 hour before sensory testing.
Panelists should avoid highly spiced foods the day before and the day of the test.
No smoking is allowed or during the test.
Panelists must wash hands with unscented cleanser and odor-free water when
entering the lab.
Facilitator must review the ballot and the test procedure with the panelists.
Panelists should evaluate a few warm-up samples.
7.3.2 During testing
All samples will be evaluated for odor before tasting any samples.
Packets are re-folded after odor evaluation to retain volatiles.
Hand contact with samples must be avoided or kept to a minimum.
If contact with sample is made, hands should be washed with unscented soap
and/or rinsed with odor-free water before the next sample.
Panelists should wait at least 1 minute between samples within a set, or longer if
felt necessary.
Panelists should wait at least 15 minutes between sample sets.
Panelists should evaluate a maximum of eight samples within a set to minimize
fatigue and carry-over effects.
For odor evaluation, panelists should take two or three short shallow sniffs
(sometimes called “bunny” sniffs) and should standardize the distance from their
60

nose to the sample and standardize the number and duration of sniffs. Each foil
packet must be folded back up to retain aromatics for the tasting phase.
Assessors should cleanse their noses between samples by sniffing the back of
the hand or the headspace over a cup of odor-free water.
•
• For flavor evaluation, assessors must begin by cleansing their mouth by chewing
an unsalted cracker and rinsing with odor-free water, repeating this procedure
between each sample. The amount of sample placed in the mouth should be
standardized. All samples must be expectorated!
7.3.3 Evaluation criteria
Trained assessors do not make decisions on samples (see Figure 6). Rather,
they evaluate samples for the degree of difference from the control sample as outlined in
Section 8.4.2. The data are then statistically analyzed to determine whether there is a
significant difference (see Section 8.5.2).
7.3.4 Evaluation Ballots
Several types of discrimination, or difference, tests may be conducted with a
panel of trained assessors (see Section 3.3.4), although the “difference-from-control”
test has been shown to be effective in seafood tainting situations (EEM 1996). Ballots
will vary according to the type of discrimination test chosen. Ballots for a difference-
from-control test are illustrated in Appendix 5.
61

Oil spill occurs
Trained Panel chosen for assessors (already trained)
Collect suspect and reference samples – You MUST have reference samples!
Prepare samples and ship to laboratory. At laboratory, prepare blended, pooled packets according to protocol. Freeze samples if longer than 24 hours
to testing.
Validation Tests using Sequential Testing to confirm ability of assessor for
participation
Perform testing in an appropriate facility
Cook pooled, blended sample packets and
present according to protocol
Results of cooked odor Positive
May taste samples
Results of cooked odor
Negative Taste samples
Results of cooked flavor - Positive
Results of cooked flavor - Negative
Results of cooked flavor - Positive
Results of cooked flavor - Negative
Data Collection using Difference from Control Test to measure the presence and degree/intensity of taint present (cooked odor and flavor) and to determine the relationship of exposed samples to control samples.
Facilitators analyze data to determine if samples pass or fail statistically.
Figure 6. Sensory decision tree for use by trained assessors in evaluating petroleum taint in
seafood.
62

8.0 Collection and Analysis of Test Data and Decision Criteria
8.1 Introduction
•
•
–
–
–
–
–
–
–
•
•
Because seafood sensory testing for the presence of taint requires an analytically
based objective response, sensory assessment must be based on this type of
evaluation. As explained in Ssection 3.2, it is important to evaluate samples
suspected of petroleum contamination objectively and not subjectively
(according to likes or dislikes). If done correctly, objective sensory testing will
measure the presence and intensity of a tainting substance with no allowance for
like/dislike responses.
If the decision is made to perform sensory testing after an oil spill, an overall
experimental plan should be developed (see Sections 2.0 and 3.0), including the
experimental design for collection and analysis of data. In planning the design,
careful consideration must be given to the
type of assessors
type and number of samples
size of the experiment
number of replications
availability of reference samples
data collection method
subsequent statistical analysis
The presence or absence of control samples is pivotal to the design and data-
collection method chosen. Whenever possible, blind control samples should
be included in the experiment to monitor the performance of expert assessors
and must be included with trained panelists (see explanation below). Control
samples must be collected immediately after the spill and handled according to
procedures in Section 2.2. Control samples should be harvested from an
unaffected area adjacent to the spill site.
Each spill situation is unique! Although the examples given below have
proven effective in petroleum-tainting situations, this document is not meant to
imply that other types of data would be ineffective. We strongly recommend that
63

a statistician be consulted. See Section 9.0 for sources of more in-depth
information.
8.1.1 Expert assessors
Expert assessors, as described in Sections 3.5 and 3.6, are intimately familiar
with “normal” sensory characteristics of seafood and any byproduct of deterioration in
quality due to aging in storage, decomposition of fats, proteins, or other microbial
contamination normally found in fish. Because of this familiarity, the expert assessor is
able to examine samples for taint only and disregard other sensory characteristics.
Whenever possible, control samples should be incorporated into the
experimental design, but if they are not available, expert assessors can still
perform the sensory testing. If control samples are not available, the expert
assessor is able to detect taint comparing the samples to their internal “control”
based on his past experiences and training sessions with that species (i.e., they
know what “normal” is) (ISO 8586 –2).
•
•
•
Generally with expert assessors, both qualitative (presence) and quantitative
(intensity) information can be obtained because they have had some descriptive
training. To obtain valid qualitative information (the identification of particular
odor/flavor attributes), the assessor must have had some descriptive analysis
training (ASTM MNL 13; ISO 8586; Rainey 1986). A suggested list of descriptors
and training references relating to petroleum tainting can be found in Appendix 2. Seafood inspectors trained and selected for their ability to detect taint—but
with no additional descriptive training—can also be used. In this case, assessors
would use a pass/fail system by passing a sample if no taint is detected, or failing
a sample it taint is detected.
8.1.2 Trained assessors
Trained assessors (see Sections 3.5 and 3.6) are used to conduct objective
quantitative sensory testing (i.e., to test statistically for a difference between exposed
and non-exposed (control) seafood). With trained panels, it is always necessary to have
control samples.
Because this type of assessor is usually not familiar with every normal
characteristic of seafood samples, including deterioration, the difference-from-
64

control test will be less problematic than the other tests (see EEM document for
details) which have been reported (e.g. triangle (3-AFC), paired comparison,
duo-trio).
Trained assessors are asked to rate the degree of difference from the control,
and are provided a scale for this purpose.
•
8.2 Test data types and numbers of assessors needed
8.2.1 Data types
Data are collected to measure a sensory response, in this case, the presence of
petroleum taint. Sensory data are generally considered to fall under one of the four
following categories. The categories marked with an asterisk (*) are most appropriate
for measuring taint.
Nominal* Qualitative;; in name only (i.e., yes/no, pass/fail, accept/reject).
Assigning descriptors (without absolute relative intensity) also falls into this
category.
Ordinal Relative value by ranking, but with unknown relative intervals
between categories.
Interval* Quantitative values that increase with constant intervals.
Ratio Quantitative values that increase by orders of magnitude above the
previous value.
8.2.2 Number of expert assessors needed
Because selected expert assessors are the most highly trained (see Section 3.5), fewer numbers of judgments on each sample are needed to draw confident
conclusions on sample tainting. Because of the high rate of reliability, as few as 3 to 5 assessors can be utilized.
8.2.3 Number of trained assessors needed
It is recommended that 10 to 15 panelists participate in the testing to ensure
that conclusions can be drawn with confidence (Meilgaard et al. 1999).
65

8.3 Design and content of evaluation ballots
Ballots are used to record the presence or absence of taint in a sample. Ballot
design is fundamental to effective and accurate sensory analysis. Ballots incorporating
sensory scales and terms that solicit accurate descriptions of the samples and possible
degrees of taint are essential.
An effective ballot must: 1) Provide a standardized format and terminology.
2) Provide a meaningful permanent record.
3) Generate data so that a difference in the score reflects a reproducible variation in the factors being scored (intensity of the tainting substance).
4) Reflect general agreement on intensity of the tainting substance among
assessors, thus minimising the scoring range used and variability among
assessors.
An effective ballot should: 1) Lend itself to wide use by trained assessors.
2) Lend itself to statistical analysis
3) Generate improved assessment procedures and habits
Examples of ballots, and assessor instructions for each type, can be found in
Appendices 3-5.
8.3.1 Ballots for expert assessors
With expert assessors, ballots can incorporate from two categories (pass/fail) to
more categories (e.g., none, slight, moderate, and strong) that generate information that
is more detailed. In addition, if the assessors have been trained in descriptive analysis,
the ballots can include a space for recording descriptors (see example in Appendix 4).
Additional information, such as intensity and characteristics of the taint, may help
decision-makers in monitoring levels and characteristics of seafood contamination and
demonstrate trends in the progress of the development and cleanup of the oil spill.
66

8.3.2 Ballots for trained assessors
Panelists are asked to rate the degree of difference between a test and a control
sample on a given scale (see example in Appendix 5). This produces data on the
intensity of tainting, which is analyzed statistically for the presence of taint.
8.4 Test data analysis
This section describes the analysis of data from spill site samples and control
samples included for monitoring panel performance.
8.4.1 Expert assessors
Expert assessors employed as seafood inspectors are accustomed to performing
pass/fail tests using a product standard for comparison. The presence of any taint, no
matter how slight, usually causes a sample to fail. As with any sensory test, blind control
samples, if available, should be included to monitor the effectiveness of the experiment
and the performance of the assessors.
Two types of statistical analyses may be applied to expert assessors:
1) Pass/Fail decisions may be analyzed using:
a. Sampling tables for fish inspection, including the number of defective
units required for the lot to fail. In this case, the tables associated with re-
inspection would be used.
b. Statistical test such as the Fishers Exact Test (see Appendix 11).
Generally, data from each assessor for each sample are examined for the
number of hits (number of samples failed because of positive response to taint).
Because multiple assessors evaluate each sample (see Section 6.0), a
threshold must be established by the stakeholders as to what percentage of
assessors must get a hit for that individual sample to fail (i.e., 3/5 or 60%, 4/5 or
80%, 5/5 or 100%). A realistic situation might be that 4 to 5 positive responses
for taint cause the sample to fail, 2 to 3 positive responses initiate further testing
of samples from that particular area, 0 to 1 positive response causes the sample
to pass. If the assessors are truly experts, there usually is much agreement and
little variation among the data.
•
67

To illustrate this, a table of data from a NOAA/FDA training workshop for
selecting expert assessors can be found in Appendix 9. Assessors’
performance can also be monitored through control samples. Data can be
quickly entered into a database programmed to automatically place samples into
pass, fail, or continue testing categories.
•
2) Statistical analysis of the difference from control test using analysis of
variance. This allows the evaluation of the presence of differences and the
calculation of the probability levels associated with these differences.
Decisions can be made according to predetermined probability levels (usually
α = 0.05).
8.4.2 Trained assessors
The difference-from-control test is often used in quality-control situations to
measure a difference. The nature of the difference is easier to define (i.e., taint) than in
triangle tests, and the panelists are less influenced by other factors in the sample. The
data gathered can be analyzed through standard statistical tests to give measurements
of taint relative to the control samples. The test is described in detail in Meilgaard et al.
(1999) and Munoz et al. (1992).
For an internal blind control, some of the test samples should be the same as the
control. The resulting mean difference-from-control of the test samples should be
evaluated against the difference-from-control obtained with the blind controls. This
measures the placebo effect (Meilgaard et al. 1999).
Review and summary of the sequence of data analysis that is used for each of
the steps in the test is:
1) Expert Assessors
a) Assessor selection – using sequential testing (see Appendix 6) or
Fisher’s Exact Test (see Appendix 11).
b) Sample evaluation as pass/fail decisions as well as measurements of
intensity and identity of off-flavors and odors. Blind coded controls
included to monitor assessor performance.
68

c) If data is collected on off-flavor intensity, it may be analyzed using the
same procedures as for the difference-from-control test.
2) Trained Assessors
a) Assessor selection using sequential testing as described in Section 4.0.
b) Sample evaluation using the difference-from-control method and
including blind coded samples to monitor panel performance.
8.5 Decision criteria
8.5.1 Expert assessors
After pass/fail decisions are made on each sample, the pass/fails from each
harvest location are tallied. If very few samples (1 or 2) from a particular area test as
tainted, some tainted seafood may end up in the marketplace if harvested from that area
and sold. It is the responsibility of public health officials and/or seafood processors to
decide what level of risk, if any, is acceptable.
8.5.2 Trained assessors
Generally, 25 to 50 presentations of each of the samples and the control are
needed to determine the degree of difference (Meilgaard et al. 1999), i.e. 10 to 15
assessors and 3 replications of the test.
After the mean difference-from-control for each sample (and for blind controls)
are calculated, results are evaluated by analysis of variance (or by paired t-test if only
one sample is compared with the control). See Bibliography for more information on
possible analytical methods.
69

9.0 Bibliography
Ackman, R.G, and H. Heras. 1992. Tainting by short-term exposure of Atlantic salmon to water soluble petroleum hydrocarbons. In Proceedings of the Fifteenth Arctic and Marine Oil Spill Program (AMOP) Technical Seminar, p.757–761. Ottawa, Ontario: Minister of Supply and Services.
Ackman, R.G., E.J. Macpherson, and A.M. Timmins. 1991. The individual and combined effects of an oil dispersant and crude oil on tainting in the sea scallop. Environment Canada Technical Report. Dartmouth, Nova Scotia: Environment Canada, Conservation and Protection.
Amerine, M.A., R.M. Pangborn, and E.B. Roesler. 1965. Principles of Sensory Evaluation of Food. New York: Academic Press.
ASTM (American Society for Testing and Materials). 1995. Standard test method for odor in water. Rep. D 1292–86 (re-approved 1995). Philadelphia: American Society for Testing and Materials.
Aust, L.B., M.C. Gacula Jr., S.A. Beard, and R.W. Washam II. 1985. Degree or difference test method in sensory evaluation of heterogeneous product types. Journal of Food Science 50:511–513.
Basker, D. 1988. Assessor selection: Procedures and results. In Moskowitz H.R. (ed.), Applied Sensory Analysis of Foods, vol. 1, pp. 125–143. Boca Raton, Florida: CRC Press, Inc.
Bencsath, F.A., T.I. Reilly, M. DiLiberti, L.C. Hufnagle, and J.D. Barnett. 2000. Hydrocarbon analysis in petroleum tainted salmon by the use of electronic nose and dynamic headspace gas chromatography/mass spectrometry. 48th ASMS Conference on Mass Spectrometry and Allied Topics, Long Beach, California, p.477–478.
Bett, K.L. & Dionigi, C.P. 1997. Detecting seafood off-flavors: limitations of sensory evaluation. Food Technology 51(8):70–77.
Blenkinsopp, S., P. Boileau, D. Kyle, G. Sergy, and M. Fingas. 1997. How to prepare water accommodated fractions from petroleum hydrocarbons for use in aquatic toxicity testing – the basics. In Proceedings of the Twentieth Arctic and Marine Oil spill Program (AMOP) Technical Seminar, pp. 515–529. Ottawa, Ontario: Minister of Supply and Services.
Blenkinsopp, S. and G. Sergy. 1997. A method of exposing fish to water-accommodated fraction of oil. In Proceedings of the Twentieth Arctic and Marine Oil spill Program (AMOP) Technical Seminar. Ottawa, Ontario: Minister of Supply and Services. pp. 515–529.
Cain, W.S. 1970. Odor intensity after self-adaptation and cross-adaptation. Perception & Psychophysics 7(5):271–275.
Chambers, E. IV and E.A. Smith. 1993. Effects of testing experience on performance of trained sensory panelists. Journal of Sensory Studies 8(2):155–166.
Chambers, E. IV and M.B. Wolf. 1996. Sensory Testing Methods. ASTM MNL 26, 2d ed. Philadelphia: American Society for Testing and Materials.
71
Davis, H.K., E.N. Geelhoad, A.W. MacRae, and P. Howgate. 1992. Sensory analysis of trout tainted by diesel fuel in ambient water. Water Science and Technology 25(2):11–18.
B. de March and R.K. York, Canadian Department of Fisheries and Oceans, Canadian Food Inspection Agency, personal communication, 2000.
Doty, R.L. 1995. The Smell Identification Test Manual, 3rd ed. Haddon Heights, New Jersey: Sensonics, Inc.
Doty, R.L. P. Shaman, and M. Dann. 1984. Development of the University of Pennsylvania Smell Identification Test: A standardized microencapsulated test of olfactory function. Physiology and Behavior 32:489–502.
Dravnieks, A. 1985. Atlas of odor character profiles. ASTM-Data Series DS 61. Philadelphia: American Society for Testing and Materials.
Dunn-Rankin, P. 1983. Scaling Methods. London: Lawrence Erlbaum Assoc.
Engen, T. 1982. The Perception of Odors. New York: Academic Press.
Environment Canada. 1997. Technical guidance document for pulp and paper environmental effects monitoring. Rep. EEM/1997/7. Ottawa, Ontario: Minister of Supply and Services.
Girardot, N.F., D.R. Peryam, and R. Shapiro. 1952. Selection of sensory testing panels. Food Technology 6(4):140–143.
Heil, T.P., N.A. Lane, and R.C. Lindsay. 1989. Sensory properties of thio- and alkyl-phenols causing flavor tainting in fish from the Upper Wisconsin River. Journal of Environmental Science and Health B24(4):361–388.
Howgate, P., P.R. Mackie, K.J. Whittle, J. Farmer, A.D. McIntyre, and A. Eleftheriou. 1977. Petroleum tainting in fish. Rapports et proces-verbaux des reunions. Conseil permanent international pour l’exploration de la Mer 171:143–146.
Hufnagle, L., NOAA National Marine Fisheries Service, Seattle, personal communication.
Institute of Food Technologists Sensory Evaluation Division. 1981. Guidelines for the preparation and review of papers reporting sensory evaluation data. Food Technology 35(4):16-17.
Institute of Food Technologists Sensory Evaluation Division. 1981. Sensory evaluation guide for testing food and beverage products. Food Technology 35(11):50–59.
Jellinek, G. 1985. Sensory Evaluation of Food: Theory and Practice. Chichester, United Kingdom: Ellis Horwood, Ltd.
Johnsen, P.B. and C.A. Kelly. 1990. A technique for the quantitative sensory evaluation of farm-raised catfish. Journal of Sensory Studies 4(3):189–200.
Law, R.J. and J. Hellou. 1999. Contamination of fish and shellfish following oil spill incidents. Environmental Geosciences 6(2):90–98.
Lawless, H.T. and G.V. Civille. 1986. The importance of language in describing perceptions. Journal of Sensory Studies 1(3/4):203–216.
72

Lawless, H.T. and G.J. Malone. 1986. The discriminative efficiency of common scaling methods. Journal of Sensory Studies 1(1):85–98.
Lockhart, W.L. and R.W. Danell, 1992. Field and experimental tainting of arctic freshwater fish by crude and refined petroleum products. In Proceedings of the Fifteenth Arctic and Marine Oil Spill Program (AMOP) Technical Seminar. Ottawa, Ontario: Minister of Supply and Services. pp. 763–771.
MacHovec, F.J. 1987. The Expert Witness Survival Manual. Springfield, Illinois: Charles C. Thomas.
Mearns, A.J. 1996. Exxon Valdez shoreline treatment and operations: Implications for response, assessment, monitoring, and research. American Fisheries Society Symposium 18:309–328.
Mearns, A.J. and R. Yender. 1997. Workshop on managing seafood problems during the response phase of an oil spill. In Proceedings of the Twentieth Arctic and Marine Oil Spill Program (AMOP) Technical Seminar. Ottawa, Ontario: Minister of Supply and Services.
Meilgaard, M.C. 1991. Current progress in sensory analysis. A review. American Society of Brewing Chemists 49(3):101–109.
Meilgaard, M.C., G.V. Civille, and B.T. Carr. 1999. Sensory Evaluation Techniques, 3rd ed. Boca Raton, Florida: CRC Press, Inc.
Moller, T.H., B. Dicks, and C.N. Goodman. 1989. Fisheries and mariculture affected by oil spills. In Proceedings of the International Oil Spill Conference Proceedings, February 13–16, San Antonio, Texas.
Motohiro, T. 1983. Tainted fish caused by petroleum compounds - A review. Water Science Technology 15:75–83.
Moy, L. and M. Collins. 1996. Electronic noses and artificial neural networks. American Laboratory, February:22–31.
Munoz, A.M., G.V. Civille, and B.T. Carr. 1992. Sensory Evaluation in Quality Control. New York: Van Nostrand Reinhold.
Munoz, A.M. and G.V. Civille. 1998. Universal, product and attribute specific scaling and the development of common lexicons in descriptive analysis. Journal of Sensory Studies 13(1):57-75.
Murray, Derek. 1992. Canada Department of Fisheries and Oceans, Freshwater Institute, Winnipeg, personal communication.
NCASI (National Council of the Paper Industry for Air and Steam Improvement). 1987. Guidelines to methods for the analysis of the effects of effluent on the flavour of fish. Technical Bulletin 513. New York: NCASI.
Neilson, A.J., V.B. Ferguson, and D.A. Kendall. 1988. Profile methods: Flavor profile and profile attribute analysis. In Moskowitz, H.R. (ed.), Applied Sensory Analysis of Foods, Vol. 1. Boca Raton, Florida: CRC Press, Inc. pp. 21-41.
73

Nevissi, A.E., C. Martinsen, and R.E. Nakatani. 1991. Salmon tainting by untreated and chemically dispersed Prudhoe Bay crude oil. Anchorage: Cook Inlet Spill Prevention and Response and Alaska Clean Seas.
O'Mahony, M. 1986. Sensory Adaptation. Journal of Sensory Studies 1(3/4): 237–258.
O'Mahony, M. and N. Odbert. 1985. A comparison of sensory difference testing procedures: Sequential sensitivity analysis and aspects of taste adaptation. Journal of Food Science 50:1055–1058.
Persson, P.E. 1984. Uptake and release of environmentally occurring odorous compounds by fish. Water Resources 18(10):1263–1271.
Persson, P.E., F.B. Whitfield, and T. Motohiro. 1987. Off-flavors in the aquatic environment. In Persson et al. (eds.), Proceedings of the 2nd IAWPRC International Symposium, Kagoshima, Japan, 12-16 October. London: Pergamon Press.
Poels, C.L. M., R. Fischer, K. Fukawa, P. Howgate, B.G. Maddock, G. Persoone, R.R. Stephenson, and W.J. Bontinick. 1988. Establishment of a test guideline for the evaluation of fish tainting. Chemosphere 17(4):751–756.
Prichett Mangan, P.A. 1992. Performance assessment of sensory panelists. Journal of Sensory Studies 7(3):229–252.
Rainey, B.A. 1986. Importance of reference standards in training panelists. Journal of Sensory Studies 1(2):149-154.
Rainey, B.A. 1979. Selection and training of panelists for sensory testing. IFT Short Course. Chicago: Institute of Food Technologists.
Rainosek, A.P. 1996. Inherent risks in acceptance sampling. In Martin, R.E. et al. (eds), Fish inspection, quality control and HACCP - Conference Proceedings, May 19–24, 1996, Arlington, Virginia. Lancaster, Pennsylvania: Technomic Publishing Co., Inc.
Reilly, T.I., and R. K. York. 1994. Sensory analysis application to harmonize expert assessors of fish products. In Sylva, G., A.L. Shriver, and M.T. Morrissey (eds.), Quality Control and Quality Assurance for Seafood. Corvallis: Oregon State University. pp. 120–124.
Roubal, W.T., S.I. Stranahan, and D.C. Malins. 1978. The accumulation of low molecular weight aromatic hydrocarbons of Crude Oil by Coho Salmon and Starry Flounder. Archives of Environmental Contamination and Toxicology 7:237–244.
Rousseau, B., A. Meyer, and M. O'Mahony. 1998. Power and sensitivity of the same-different test: Comparison with triangle and duo-trio methods. Journal of Sensory Studies 13(2):149–173.
Rutledge, K.P. 1992. Accelerated training of sensory descriptive flavor analysis panelists. Food Technology 46(11):114–118.
U.S.C.F.R. (Code of Federal Regulations). 1994. Title 50, Sect. 260.57 "Sampling." Washington, D.C.: U.S. Government Printing Office.
Vie, A. and M. O'Mahony. 1989. Triangular difference testing: Refinements to sequential sensitivity analysis for predictions for individual triads. Journal of Sensory Studies 4(2): 87–103.
74

Whitford, J. 1992. Characteristics of tainting in farmed Atlantic salmon and cultured blue mussels exposed to water-soluble fractions of Brent crude oil and Scotian Shelf condensate. Dartmouth, Nova Scotia: Environmental Protection.
Whittle, K.J., D.A. Mackie, P.R. Anderson, C.F. Moffat, N.J. Shepherd, and A.H. McVicar. 1995. The impact of the Braer oil on caged salmon. In J.M. Davies and G. Topping (eds.), The Impact of an oil spill in turbulent waters: The Braer. Proceedings of a symposium held at the Royal Society of Edinburgh, 7-8 September, p.121-143 and 144-160. Edinburgh: The Stationery Office, Limited. ISBN 0 11495798 3.
Whittle, K.J., J. Murray, P.R. Mackie, R. Hardy, and J. Farmer. 1977. Fate of hydrocarbons in fish. Rapports et proces-verbaux des reunions. Conseil permanent international pour l’exploration de la Mer, 171:139–142.
Williams, U.P., J.W. Kiceniuk, J.E. Ryder, and J.R. Botta. 1988. Effects of an oil spill on American lobster (Homarus americanus) from Placentia Bay, Newfoundland. Canadian Technical Report of Fisheries and Aquatic Sciences 1650.
York, R.K., and L.M. Sereda. 1995. Sensory assessment of quality in fish and seafood (Chap. 13). In Shahidi, F. and J.R. Botta (eds.), Seafoods: Chemistry, Processing Technology and Quality. London: Blackie Academic and Professional. pp. 233–262.
York, R.K. 1989. Canadian fish products-fish inspection and sensory evaluation. Canadian Institute of Food Science Technology Journal 22(5): 441–444.
York, R.K. 1995. Quality assessment in a regulatory environment. Food Quality and Preference 6:137–141.
Zelek E.F. Jr. 1990. Legal aspects of sensory analysis. Food Technology 44(11):168-174.
Zook, K.L., and J.H. Pearce. 1988. Quantitative descriptive analysis. In Moskowitz, H.R. (ed.), Applied Sensory Analysis of Foods, vol. 1. Boca Raton, Florida: CRC Press, Inc. pp. 43–71.
Zook, K., and C. Wessman. 1977. The selection and use of judges for descriptive panels. Food Technology 31(11): 56–61.
75


APPENDIX 1
Normative References - Existing Guidelines, Standard Practices, And Sampling Plans for Sensory Testing
American Society of Testing & Materials (ASTM) Standards Standard practice for evaluating an effluent for flavor impairment to fish flesh. ASTM D3696-89. Standard practices for evaluating effects of contaminants on odor and taste of exposed fish. Committee E-18 on Sensory Evaluation of Materials and Products. ASTM E1810-96. [Supersedes the sensory evaluation procedures in D3696-95, Standard practices for evaluating an effluent for flavor impairment of fish flesh, in Standardization News, Jan. 1997, p. 4.] Terminology relating to sensory evaluation of materials and products. ASTM E253-98a. Standard practices for referencing supra-threshold odor intensity [re-approved 1993]. ASTM E544-75. Standard test method for sensory analysis – triangle test. ASTM E1885-97. Manual on descriptive analysis testing for sensory evaluation. ASTM MNL 13. 1992. Manual on sensory testing methods. ASTM STP 434. 1999. Establishing conditions for sensory evaluation of foods and beverages. ASTM STP 480-84. Guidelines for the selection and training of sensory panel members. ASTM STP 758. 1981. Physical requirement guidelines for sensory evaluation laboratories. ASTM STP 913. Canadian Government Standards Technical guidance document for pulp and paper environment effects monitoring. Environment Canada EEM/1997/7 October 1997. International Organization for Standardization (ISO) Sensory analysis – General guidance for the selection, training and monitoring of assessors – Part I: Selected assessors. ISO 8586-1. 1993. Sensory analysis – General guidance for the selection, training and monitoring of assessors – Part 2: Experts. ISO 8586-2. 1993. Sensory analysis – Vocabulary. ISO 5492. 1992. Sensory analysis – Methodology – General guidance. ISO 6658. 1985. Sensory analysis – General guidance for the design of test rooms. ISO 8589. 1998.
77
Sensory analysis – Methodology – Triangular test. ISO 4120. 1983
United Nations/World Health Organization (UN/WHO) UN/WHO Codex Alimentarius Commission. Draft guideline for the sensory evaluation of fish and shellfish in laboratories. ALINORM 99/18.
UN/WHO Codex Alimentarius Commission. Procedural Manual F/3026.
Sampling Plans for Sensory Testing of Seafood American National Standards Institute (ANSI)/American Society for Quality Control (ASQC). Sampling procedures and tables for inspection by attributes. ANSI/ASQC Z1.4. 1993. International Organization for Standardization (ISO). Sampling procedures for inspection by attributes. ISO 2859.
Part 1: Sampling plans indexed by acceptance quality level (AQL) for lot-by-lot inspection.
Part 2: Sampling plans indexed by limiting quality (LQ) for isolated lot inspection.
UN/WHO Codex Alimentarius Commission. Procedural Manual F/3026.
U.S. Code of Federal Regulations. Title 50, Sect. 260.57, "Sampling." 1994 (example of an
AQL sampling plan).
78

APPENDIX 2
Definitions, Terminology, and References used in Sensory Training for Petroleum Taint
Specific Seafood Terminology Associated with fresh seafood, not subject to deterioration Odor: Ocean air, clean seaweed, briny, slightly sweet, metallic, cucumber, melon, grassy, neutral.
Flavor: Slightly sweet, oceany, meaty/brothy, briny, fresh oil, buttery, neutral.
Associated with seafood deterioration (spoilage) Odor: Fishy, oxidized, rancid, sour, fermented, yeasty, fruity, sulfury vegetable, pungent, putrid,
fecal, cheesy, ammonia, painty.
Flavor: Fishy, oxidized, rancid, painty, sour, bitter, yeasty, fermented, sulfury vegetable, putrid,
fecal.
Associated with petrochemical tainting of seafood Odor: Petroleum, diesel, kerosene, hydraulic fluid, lube oil, dirty sour (old oil), solventy,
chemical, pungent, acrid, burnt, creosote, tar, piney/resinous, rubbery, phenolic, nose-
sting.
Flavor: Pungent, kerosene, petroleum fuel, chemical, dirty sour, warming mouth-feel, oily/waxy
mouth-coating.
General Sensory Definitions acrid/burnt Burning, irritating, pungent, aromatic; often associated with burnt wood
or smoke.
adaptation Decreased in sensitivity to a given stimulus resulting from exposure to
that stimulus. ammonia Aromatic characteristic of unscented ammonia.
anosmic Lack of sensitivity to odor stimuli.
appearance All the visible characteristics of a substance/sample.
assessor Any person taking part in a sensory test.
79

astringent The chemical "feeling" factor on the tongue or other skin surfaces of the
oral cavity, described as puckering/dry and associated with tannins or
alum.
bakelite Burnt, phenolic, aromatic; reminiscent of a burnt circuit board or burnt
plastic.
bitter One of the four basic tastes (w/sour, sweet, salty) primarily perceived at
the back of the tongue; common to caffeine and quinine.
briny Aromatic associated with the smell of clean seaweed and ocean air.
brothy Aromatic associated with boiled meat.
burnt Aromatic associated with heated, scorched, or blackened substances.
burnt plastic Aromatic associated with burnt plastic, such as Bakelite.
burnt rubber Aromatic associated with higher sulfur mercaptans.
cardboardy Aromatic associated with slightly oxidized fats, reminiscent of wet
cardboard packaging.
carry-over A decrease in sensitivity to a given stimulus resulting from exposure to
previous samples containing the same stimulus. cheesy Sour aromatic associated with aged cheese and butyric acid.
chemical A general term associated with many types of aromatic compounds such
as solvents, cleaning compounds, and hydrocarbons.
creosote Heavy, tar-like, acrid aromatic associated with creosote, smoke, and
some solvents.
cucumber Aromatic associated with fresh cucumber; similar aromas can be
associated with certain species of very fresh, raw fish.
decompose Break down into component parts; fish having an offensive or
objectionable odor, flavor, color, texture, or substance associated with
spoilage.
diesel Chemical-like aromatic associated with diesel fuel.
dirty Soiled, sour aromatic.
distinct Capable of being readily perceived.
earthy Aromatic characteristic of wet foliage, damp soil, or slightly undercooked
boiled potato.
error Difference between the observed value and the true value. error/psychological Errors that can introduce bias into sensory assessment. error/physiological Systemic errors that may be positive or negative. These differ from the
statistical phenomena of random error, which are unpredictable errors
that are random deviations of observed values from true values and that
average to 0.
80
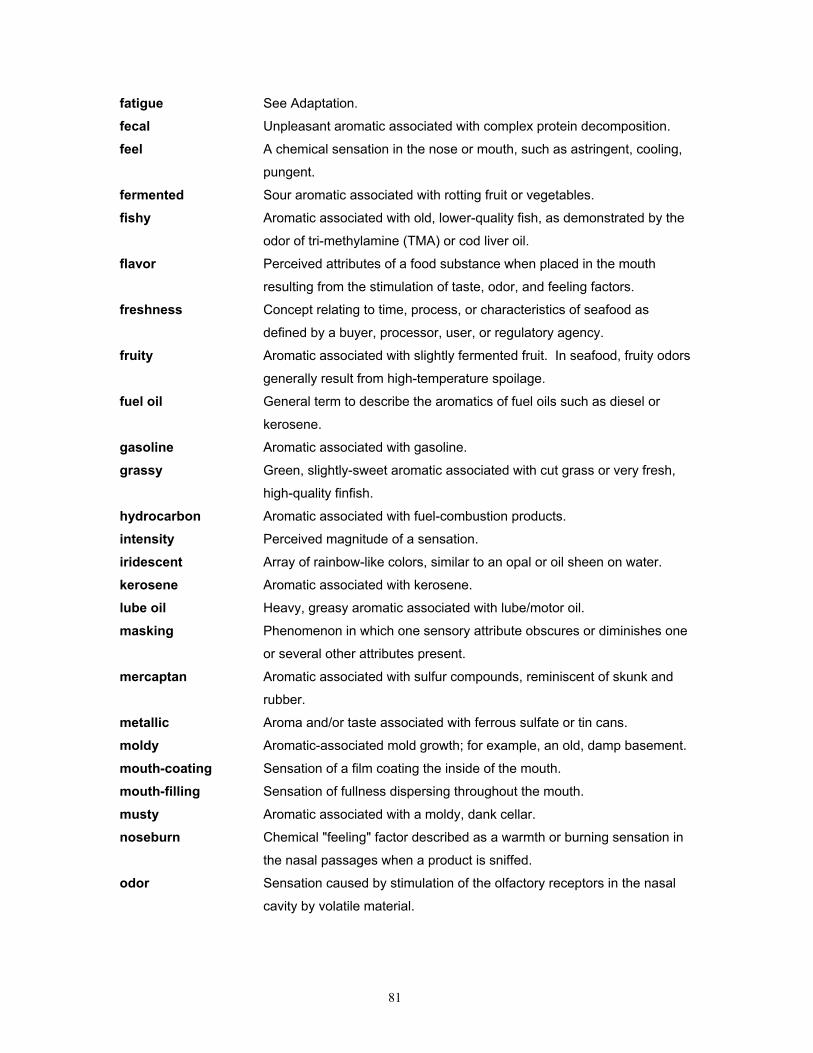
fatigue See Adaptation. fecal Unpleasant aromatic associated with complex protein decomposition.
feel A chemical sensation in the nose or mouth, such as astringent, cooling,
pungent. fermented Sour aromatic associated with rotting fruit or vegetables.
fishy Aromatic associated with old, lower-quality fish, as demonstrated by the
odor of tri-methylamine (TMA) or cod liver oil.
flavor Perceived attributes of a food substance when placed in the mouth
resulting from the stimulation of taste, odor, and feeling factors.
freshness Concept relating to time, process, or characteristics of seafood as
defined by a buyer, processor, user, or regulatory agency.
fruity Aromatic associated with slightly fermented fruit. In seafood, fruity odors
generally result from high-temperature spoilage.
fuel oil General term to describe the aromatics of fuel oils such as diesel or
kerosene.
gasoline Aromatic associated with gasoline.
grassy Green, slightly-sweet aromatic associated with cut grass or very fresh,
high-quality finfish.
hydrocarbon Aromatic associated with fuel-combustion products.
intensity Perceived magnitude of a sensation.
iridescent Array of rainbow-like colors, similar to an opal or oil sheen on water.
kerosene Aromatic associated with kerosene.
lube oil Heavy, greasy aromatic associated with lube/motor oil.
masking Phenomenon in which one sensory attribute obscures or diminishes one
or several other attributes present.
mercaptan Aromatic associated with sulfur compounds, reminiscent of skunk and
rubber.
metallic Aroma and/or taste associated with ferrous sulfate or tin cans.
moldy Aromatic-associated mold growth; for example, an old, damp basement.
mouth-coating Sensation of a film coating the inside of the mouth.
mouth-filling Sensation of fullness dispersing throughout the mouth.
musty Aromatic associated with a moldy, dank cellar.
noseburn Chemical "feeling" factor described as a warmth or burning sensation in
the nasal passages when a product is sniffed.
odor Sensation caused by stimulation of the olfactory receptors in the nasal
cavity by volatile material.
81
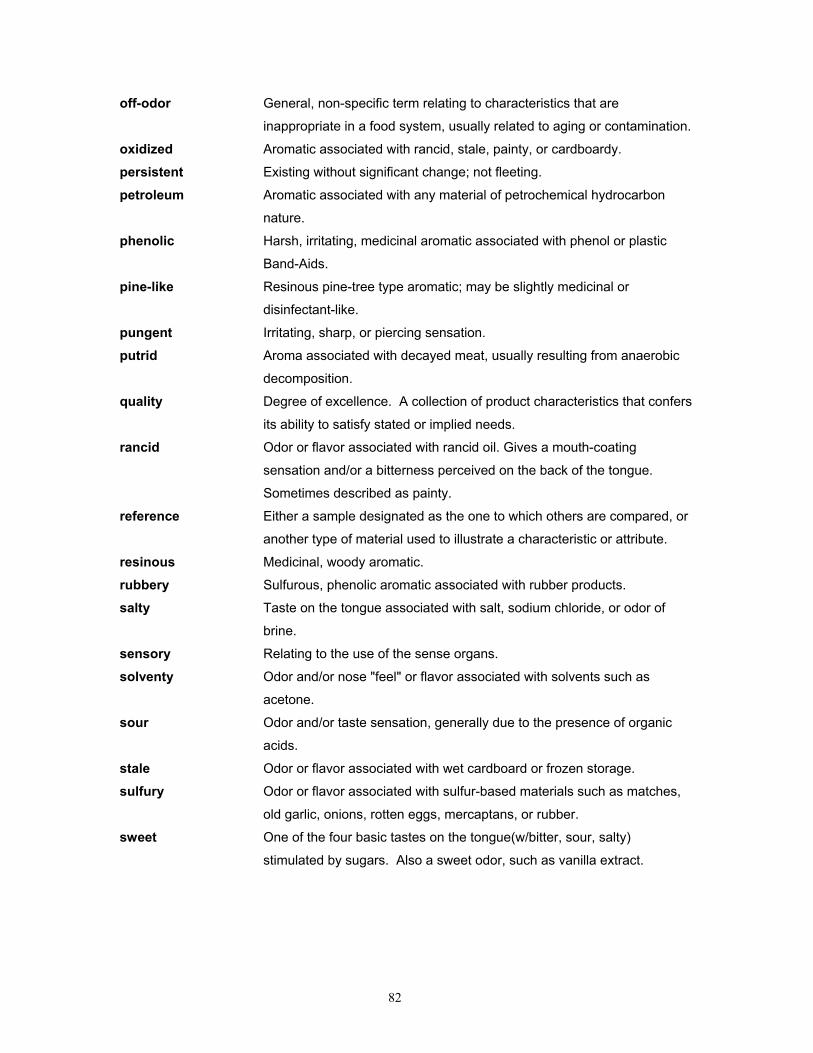
off-odor General, non-specific term relating to characteristics that are
inappropriate in a food system, usually related to aging or contamination.
oxidized Aromatic associated with rancid, stale, painty, or cardboardy.
persistent Existing without significant change; not fleeting.
petroleum Aromatic associated with any material of petrochemical hydrocarbon
nature.
phenolic Harsh, irritating, medicinal aromatic associated with phenol or plastic
Band-Aids.
pine-like Resinous pine-tree type aromatic; may be slightly medicinal or
disinfectant-like.
pungent Irritating, sharp, or piercing sensation.
putrid Aroma associated with decayed meat, usually resulting from anaerobic
decomposition.
quality Degree of excellence. A collection of product characteristics that confers
its ability to satisfy stated or implied needs.
rancid Odor or flavor associated with rancid oil. Gives a mouth-coating
sensation and/or a bitterness perceived on the back of the tongue.
Sometimes described as painty.
reference Either a sample designated as the one to which others are compared, or
another type of material used to illustrate a characteristic or attribute.
resinous Medicinal, woody aromatic.
rubbery Sulfurous, phenolic aromatic associated with rubber products.
salty Taste on the tongue associated with salt, sodium chloride, or odor of
brine.
sensory Relating to the use of the sense organs.
solventy Odor and/or nose "feel" or flavor associated with solvents such as
acetone.
sour Odor and/or taste sensation, generally due to the presence of organic
acids.
stale Odor or flavor associated with wet cardboard or frozen storage.
sulfury Odor or flavor associated with sulfur-based materials such as matches,
old garlic, onions, rotten eggs, mercaptans, or rubber.
sweet One of the four basic tastes on the tongue(w/bitter, sour, salty)
stimulated by sugars. Also a sweet odor, such as vanilla extract.
82

tar-like Aromatic associated with the heavier, tar-like substances of petroleum
chemicals, as demonstrated by hot asphalt. taste One of the basic senses, the receptors for which are located in the
mouth and activated by compounds in solution.
terminology Terms used to describe the sensory attributes of a product.
umami Taste produced by substances such as monosodium glutamate (MSG) in
solution. A meaty, savory, or mouth-filling sensation.
vegetable Odor associated with sulfur-containing vegetables such as cooked
broccoli, cabbage, or cauliflower.
watermelon Aroma characteristic of fresh-cut watermelon rind. Similar odors
sometimes found in certain species of very fresh, raw fish.
yeasty Aroma associated with yeast and fermented products such as bread or beer.
83

Petroleum Taint References for Assessor Training As explained in more detail in Section 4.0, it is very important to include actual
petroleum-contaminated seafood samples when selecting, testing, and training sensory
assessors, whether expert or novice. Actual samples can serve as both controls and
references (see Section 4.0). In addition, the substances listed below can serve as
referents for developing and refining sensory terminology during the assessor training
process.
Term Referent
astringent (oral) alum solution
burnt/acrid burnt toast, scorched oil
burnt plastic burnt plastic
cooling (nasal) menthol, etc.
creosote creosote
diesel diesel fuel
earthy beets, potatoes, potting soil
gasoline/kerosene gasoline/kerosene
hydraulic fluid hydraulic fluid
lube oil WD-40
petroleum petroleum jelly
phenolic phenol, Band-Aids
piney pine needles, Pine Sol
pungent (nasal) vinegar, burnt substances
rubber rubber bands
soapy lauric acid
solventy acetone
sour old oil, vinegar, yogurt, etc.
sulfur rubber, matches, old garlic/onions, mercaptans
tar-like tar
84

APPENDIX 3
Expert Assessor Ballot for Recording Sensory Evaluations of Seafood: 3-Alternative Forced-Choice (AFC) Triangle Test
Name Date Product
Sensory panel screening
Six sets of three samples each are laid out in the room. Two of the three samples smell the same. Using this ballot, evaluate each sample set and identify the one sample that differs from the other two. Open and evaluate the samples as shown, taking two or three shallow sniffs. Evaluate the odor in each sample for the presence of taint. Within each set, evaluate the samples in the order given below. You may evaluate a sample more than once, if needed. Partially close the sample, as shown, when not testing it.
Open each sample only briefly to prevent any release of odor into the test room. If you cannot detect any difference among the samples, you must guess.
Sample sets
Sample # Sample # Sample # The one sample that is different. 435 394 391
2 433 450 717
3 183 462 245
4 843 700 906
5 591 845 056
6 130 801 295
Comments:
1
85

APPENDIX 4 Expert Assessor Ballot for Recording Quantitative/Qualitative Sensory
Evaluation of Seafood.
Name:___________________________________
Date:____________________________________
Species: _________________________________
Open and evaluate the samples as shown. Evaluate each sample for presence of "off" odor or flavor.
Make a Pass/Fail decision, rate the intensity (using the numerical scale), and characterize (using descriptors). RO = Raw odor CO = Cooked odor CF = Cooked flavor
Decision
Intensity
Comments/Descriptors
scale
Pass
Fail
None
Strong
051 RO 0 1 2 3 051 CO 0 1 2 3 051 CF 0 1 2 3
Pass
Fail
None
Strong
333 RO 0 1 2 3 333 CO 0 1 2 3 333 CF 0 1 2 3
Pass
Fail
None
Strong
758 RO 0 1 2 3 758 CO 0 1 2 3 758 CF 0 1 2 3
Pass
Fail
None
Strong
420 RO 0 1 2 3
420 CO 0 1 2 3 420 CF 0 1 2 3
86

APPENDIX 5 Trained Assessor Ballot for Recording Sensory Difference-from-Control Evaluations of Seafood.
Name: Date: Species:
Test or Set #:
Attribute assessed = Presence of Taint in Cooked Odor or Cooked Flavor
Do not swallow samples: EXPECTORATE any sample that is tasted.
Follow strict rinsing procedures. Instructions:
1. Smell and taste the sample marked “Control” first. 2. Smell the sample marked with the 3-digit code; if no taint is detected, or if it so slight as to be
questionable, taste the sample. 3. Assess the overall sensory difference between the two samples, using the scale below. 4. Mark the scale to indicate the degree of overall difference by placing a vertical mark across the
horizontal line at the point corresponding to the degree to which the sample deviates from the reference (indicated by R).
Code No. Sensory Scale
same as R
extremelydifferent
from R
same as R
extremelydifferent
from R
same as R
extremelydifferent
from R
same as R
extremelydifferent
from R
same as R
extremelydifferent
from R
same as R
extremelydifferent
from R
87


APP
END
IX 6
C
ontr
ol g
raph
for s
eque
ntia
l ana
lysi
s us
ing
the
tria
ngle
test
met
hod
for a
sses
sor s
elec
tion.
Gra
ph fo
r S
eque
ntia
l Ana
lysi
s fo
r S
elec
tion
Pan
el T
rain
ees
Usi
ng T
rian
gle
Test
s
-4-20246810121416
01
23
45
67
89
1011
1213
1415
1617
1819
20
n, n
umbe
r of
tria
ngle
test
s, (c
umul
ativ
e)
n, number of correct tests (cumulative)
Acc
ept
Con
tinue
Tes
ting Rej
ect
alph
a =
0.05
beta
= 0
.05
po =
0.4
5p1
= 0
.70

90

APPENDIX 7
Method for Exposing Live Seafood to Petroleum Products for Selecting and Training Sensory Assessors.
Memorandum Report (February 2000)
Larry Hufnagle Environmental Conservation Division Northwest Fisheries Science Center
National Marine Fisheries Service, NOAA Seattle, Washington 98112
Three commercially important seafood species were exposed to 25-ppm diesel
or Monterey Crude oil to produce sensory-analysis training materials for the National
Marine Fisheries Service's (NMFS) Sensory Branch Inspection Services and the U.S.
Food and Drug Administration. The exposure was conducted at the Mukilteo Field
Station of the Northwest Fisheries Science Center in Mukilteo, Washington. Three
classes of experimental organisms were chosen for the experiment—a bivalve (oyster),
crustacean (lobster), and finfish (Atlantic salmon)—representing commercially important
seafood types. Oysters (Crassostrea gigas) size #1 were obtained from Westcott Bay
Sea Farms, Friday Harbor, Washington. Two sizes of Atlantic salmon (Salmo salar)—2
lb. fish for the diesel exposure and 1 lb. fish for the Monterey Crude oil exposure—were
obtained from Northwest Seafarms, Bainbridge Island, Washington. The lobsters
(Homarus americanus), weighing 1 to 1.25 lbs. each, were shipped from Gloucester,
Massachusetts.
• The diesel exposure tank contained 46 salmon, 40 lobsters, and 240 oysters
(assuming 6 oysters/sample) to obtain the required 25 to 30 samples per species. The
control tank contained 25 salmon, 20 lobsters and 120 oysters.
• The Monterey Crude exposure tank contained 40 salmon, 40 lobsters, and 240
oysters. The control tank contained of 35 salmon, 20 lobsters and 120 oysters.
The surplus specimens were to allow for incidental mortality during transportation and
exposure, and for monitoring of baseline contamination and uptake during the exposure.
91

The control tanks were used to rule out any flavors or odors that might be artifacts of our
facility (e.g., from the water or the tanks) and to serve as controls for chemical analysis.
The control organisms (3 species) were held in an 8-ft circular tank (4981.6 L), and the
exposed organisms (3 species) were held in a 12-ft circular tank (10129.2 L). A PVC
liner was used to prevent oil contamination of the aquaculture facilities' tanks. All three
species were allowed to acclimate for at least 24 hours in their respective tanks (under
flow-through conditions) before exposure. Exposure consisted of 48-hour static-water
exposure with aeration and a single addition of the petroleum product to yield a nominal
concentration of 25-ppm (w/v). Approximately 250 g of the diesel or Monterey Crude oil
were weighed out in a beaker. At the beginning of the exposure, water flow and aeration
were turned off and the petroleum product was poured onto the water surface. For
diesel oil, the beaker was rinsed several times in the tank water to complete the transfer,
and the aeration was then resumed. For the crude-oil exposure, the oil had to be
scraped out of the beaker to complete the transfer. The aeration system was used to: 1)
circulate the petroleum product in the tank,
2) simulate water conditions characteristic of near shore exposure, where wave action
and mixing are an important part of the exposure conditions, as well as
3) maintain the system-dissolved oxygen during the static exposure.
At the end of the 48-hour exposure, the animals were sacrificed. Salmon were filleted,
skinned, wrapped in aluminum foil, and vacuum-packed before storing at -20° C. Whole
lobsters and oysters in the shell were wrapped in aluminum foil and vacuum-packed
before storing at -20° C.
92
APPENDIX 8
Using Random Code Numbers and Random Sample-Presentation Methods
Random code numbers are those code numbers that cannot be predicted, based on the
numbers already seen in the sample series, and that bear no relationship to any variable within the samples.
An example is shown in a series that can be predicted and one that cannot, where a coin is
tossed and, assuming that 0 = heads and 1 = tails, these series become:
predictable series. . . coin 0 1 0 1 0 1 0 1 0 1 0 1. . . . . . . . .
unpredictable series. . . coin 1 1 0 0 0 1 0 1 0 1 1 1 0 1 1 0 0 1 0 0 0 0 1. . . . . . . .
Random numbers are used in sample presentations to 1) prevent assessors from
predicting information about the samples, and 2) control the occurrence of errors of expectation.
Information about samples can be inadvertently given from factors such as
• the order in which samples are presented,
• the code numbers assigned to the samples, or
• extraneous information about the samples that have been given before the evaluation
sessions.
Also, seemingly predictable codes can provide false information that creates confusion in a
test. These errors are generally not an issue when the evaluators are professional sensory
analysts who have been calibrated and tested. However, these errors are significant when
selecting assessor trainees and testing trained sensory panels.
These presentations are appropriate for both expert and trained assessors to demonstrate
the validity of the test method.
The randomization process
1. Assigning code numbers to the sample. In this case, 3-digit random number
codes are used. This is common practice in sensory testing, as 3-digit codes generally have no
meaning to the assessors. (However, there may be occasions where 3-digit codes do have
meaning to the assessors in the context of the samples. In this case, using 4-digit codes will
93

generally remove the difficulty.)
2. Assigning random presentation sequences for the samples. This reduces any
effect of sample order or carryover effect from one sample to another. Each assessor examines
the samples in a different sequence from the others. This is done when testing both expert and
trained assessors.
Generating 3-digit code numbers • Examples of predictable coding that should not be used. Using a meaningful code within
the sample number, e.g., the middle number:
113 219 817 blank (water) 321 726 429 low-concentration salt 138 432 635 high-concentration salt • Examples of unpredictable coding as it should be used. An appropriately coded series
would be given by no meaningful numbers:
726 255 979 blank (water) 368 417 182 low-concentration salt 631 118 229 high-concentration salt • Random 3-digit number codes are easily generated in different ways:
1. Using the random number table, found in the tables section of most sensory analysis
texts and statistics texts. A starting point within the table is arbitrarily selected, and random
codes are written from that point. Resulting codes should be checked so that no accidental
patterning occurs and so that no repeat codes are generated.
2. Using a random code set, i.e., a prepared set of all the 3-digit codes from 001 to 999 on
separate cardboard disks (or other convenient medium). The codes are drawn from this set
without replacement, to ensure that no repeat codes are generated. The resulting number
set should be checked for any accidental patterning.
1. By computerized random number generation within a software package, e.g., Excel. This is
the easiest way to generate a large set of random numbers; the sort function can be used to
check for any repeat codes.
94

Generating random 3-digit numbers using Excel .
This method will generate a set of 3-digit random codes with no repeats for use in coding
samples for sensory studies. The codes act to remove identity from the sample for presentation
to sensory panelists, but still provide a method for tracking samples within a study.
A. Generating the random number set: 1. Using “TOOLS” > “DATA ANALYSIS” > “RANDOM NUMBER GENERATION”, generate
the set of three digit codes needed.
Settings:
No. of variables = 1.
No. of random variables = (as needed).
Distribution = uniform.
Between 1 and 999 (or 100 and 999 if numbers below 100 are not needed).
Random seed = choose one as needed.
Output range = as needed (Column A, here).
2. Format the code numbers using “FORMAT” “CELL” “NUMBER” “CUSTOM” to 000 (so
that 1 to 99 will appear as 3 digits).
3. Adjust the values of the numbers generated in the worksheet using “TOOLS” >
“OPTIONS” > “CALCULATION” and check “precision as displayed”, and “OK” to loosing
the accuracy with the numbers. (This gets rid of hidden decimal places that interfere
with the sorting process).
B. Now begin the process of checking for duplicates by: 4. Enter “1” in the first cell of Column B. Number the codes from 1 to X (here = 100) in
column B (so that they can be put beck in random sequence after checking duplicates).
Do this with “EDIT” > “FILL” > “SERIES” > “COLUMNS” (step value = 1, stop value = N,
(hers, 100)).
5. Use “DATA” > “SORT” by Column A to put the random numbers in order.
6. Place the cursor in the first cell of Column C. Using the “Function Wizard” icon, call up
the IF statement, and enter the formula to test for repeat numbers into Column C, with
“a1 = a2, if true = 1, if false = 0”. Copy this statement down the full length of Column C.
95

7. Check Column C for any 1’s. Correct and duplications (i.e. change them appropriately).
(By entering a “Σ” command at the base of Column C, the number of duplicates which
must be corrected will be shown. As they are corrected, this number will reduce to “0”).
8. Use “DATA” > “SORT” by Column B to put the codes back in random order. Assign
them to samples as needed.
96

APP
END
IX 9
Ex
ampl
e of
exp
ert a
sses
sor t
rain
ing
data
(fr
om N
OA
A S
eafo
od S
afet
y W
orks
hop,
May
199
9, S
eattl
e, W
A).
Sum
mar
y sc
ores
follo
win
g br
ief
(8-h
r) tr
aini
ng p
erio
d.
Sam
ple
Key
Sa
lmon
#O
yste
rs#
Lobs
ter
#O
vera
ll %
Ass
esso
rC
= C
ontro
l (no
exp
osur
e)
C
D
CM
Cor
rect
CM
D
CC
orre
ctD
CM
D
Cor
rect
Cor
rect
#
D =
Die
sel f
uel e
xpos
ure
0 2
0 3
4 0
3 3
0 4
2 0
2 3
4 10
0.00
5
M =
Mon
tere
y C
rude
oil
expo
sure
0
1 0
34
0 2
2 0
4 3
0 3
2 4
100.
00
7
0
20
24
01
20
42
01
24
100.
008
02
01
40
13
04
30
13
410
0.00
11Sc
ore
Inte
nsity
Key
0
1
01
40
12
04
20
23
410
0.00
120
= no
con
tam
inat
ion
0 2
0 3
4 0
3 2
0 4
3 0
2 3
4 10
0.00
13
1
= ve
ry s
light
0
1 0
24
0 1
2 0
4 2
0 2
2 4
100.
00
15
2 =
slig
ht c
onta
min
atio
n 0
2 0
24
0 1
2 0
4 2
0 2
2 4
100.
00
16
3 =
mod
erat
e co
ntam
inat
ion
0 2
0 3
4 1
1 1
0 3
2 0
2 3
4 91
.67
1 4
= st
rong
con
tam
inat
ion
0 2
0 2
4 0
2 3
0 4
3 0
0 3
3 91
.67
3
0
10
24
02
20
42
00
33
91.6
76
02
01
40
13
04
30
01
391
.67
100
10
34
01
10
43
00
33
91.6
714
10
02
20
22
04
30
12
483
.33
41
10
23
01
20
41
00
13
83.3
317
03
02
41
02
02
20
01
375
.00
21
00
22
03
30
43
01
03
75.0
09
Aver
age
petro
leum
inte
nsity
0
1 0
23.
79
0 2
2 0
3.85
2
0 1
2 3.
584
92.6
5
Gro
up A
vg.
Tota
l hits
in 1
7 ev
alua
tions
3
150
17
2 17
17
0
17
0 11
16
Thes
e da
ta a
re fr
om a
trai
ning
wor
ksho
p us
ing
know
n sa
mpl
es.
Parti
cipa
nts
wer
e se
afoo
d in
spec
tors
or s
eafo
od re
sear
cher
s. F
or a
n ac
tual
oil-
spill
situ
atio
n, y
ou w
ould
sel
ect t
hose
ass
esso
rs s
corin
g 10
0%, i
f pos
sibl
e, o
r at l
east
90%
. W
hen
usin
g as
sess
ors
for s
eafo
od
test
ing
who
sco
re le
ss th
an 1
00%
, you
may
wan
t to
incr
ease
the
num
ber o
f ass
esso
rs.

98

APPENDIX 10
NOAA/NMFS NATIONAL SENSORY SECTION
CHAIN OF CUSTODY FORM
7600 Sand Point Way NE, Seattle, WA For more information contact Michael DiLiberti 978-281-9123 or FAX 978-281-9125
Project___________________ Sampler________________________ Sample I.D. #
Date Collected
Location Sample Type (Tissue, oil, water. Include species ame nand tissue type)
Comments
� � � � �
� � � � �
� � � � �
� � � � �
� � � � �
� � � � �
� � � � �
� � � � �
� � � � �
� � � � �
� � �
� � � � �
Collected by: (signature)� Received by:(signature)� Condition:� Date/Time�
Relinquished by: (signature)� Received by:(signature)� Condition:� Date/Time�
Relinquished by: (signature) Received by:(signature) Condition: Date/Time
* If shipped, include carrier name and copy of shipping invoice
99

Chain of Custody Procedures BACKGROUND The NOAA Damage Assessment Center (DAC) has established chain of custody procedures for those personnel collecting field data. This document is a record of the methods used to handle samples collected for the damage assessment process, which may become evidence in a court of law. The procedures outlined in this document represent one acceptable method. The failure in any particular instance to follow one or more of the steps listed here does not necessarily render evidence either inadmissible or unusable, however, field personnel should inform either the Damage Assessment Center or its attorneys about any deviation from procedures specified in this document. All that the Courts require is that the sample itself (or results of its analysis) be adequately authenticated to assure that what occurs in court replicates circumstances existing at the sample-taking location. No defendant or respondent may claim as a defense or an objection any deviation from procedures described in this memo. DEFINITION OF CUSTODY "Chain-of-custody" procedures are followed to "authenticate" a sample from the time it is taken until the results are introduced as evidence into court. A sample is in your "custody" when:
1. It is in your actual physical control and presence. 2. It is in your view. 3. It is not in your physical presence but is secure in a place of storage to which only you have access. 4. It is not in your view or physical presence but is secured in a place of storage to which only you and identified others have access.
SAMPLE COLLECTION 1. As few people as possible should handle the sample from its taking through laboratory analysis. 2. Preprinted DAC samples tags should be used to identify each sample. These are filled out in waterproof ink and attached to the sample container at the time the complete sample is collected. The preprinted tags contain the following information: sample #, contents, preservative, time/date of collection, location, and collector. A witness who has observed the samples being taken should also include his/her name on the sample. The sample tags are records made in the usual course of regularly conducted official activity and may constitute past recollection recorded. When tags are completed, the collector should not leave any blanks thereon unfilled.
100

3. Blank samples using water prepared specifically for the sample collector should be used on a sampling project, and should be analyzed later to establish the lack of contamination by the sampling device, the container, or any preservatives used. 4. Field Data Record logbooks with numbered pages should be used to record field measurements and other pertinent information. These notes will be used to refresh the sample collector's memory in the event he/she later testifies regarding his/her actions. The original or first impression copy of these field data sheets, chain-of-custody sheets, and analysis requested sheets should be sent along with the samples. Data entered in the logbooks or forms are recorded with ballpoint pen or waterproof ink. Each page is signed by the sample collector and any available witness. The preparation and custody of the logbooks during the survey are the responsibility of the survey coordinator. Once the survey is complete, field data logbooks and data forms are to be retained by the survey coordinator or a designated representative. Any errata in entries should be lined out with a single line and initialed and dated so a later reader can read what was written before the correction. 5. The sample collector is responsible for the care and custody of the samples until they are properly dispatched to the receiving laboratory or turned over to an assigned custodian or courier. The sample collector must assure that each sample is in his/her "custody" so no one can tamper with it. 6. If colored slides, photographs, or other related evidence are obtained to show the impact of the pollutant or substantiate any other conclusions of the investigations, the following documentation should be on the back of the photo or in the field data logbook: time, date, site location, and the signature of the photographer and any witness. Film or other materials of this nature which may be used as evidence, may also (but need not) be handled using chain-of-custody procedures. TRANSFER OF CUSTODY AND SHIPMENT 1. Collected samples are to be accompanied by a chain-of-custody record that includes the name of the survey, sample collector's initials, laboratory sample number, and number of containers. When turning over the possession of a part or all of the samples to a field analysis station or to a laboratory, the transferor and transferee should sign and record the time and date on the sheet. 2. All packages are to be accompanied by the chain-of-custody record identifying the contents. The original accompanies the shipment, and a copy is retained by the survey coordinator. The chain-of-custody record is signed by the collector along with recording the date and time. It is then placed inside the shipping container along with the Field Data Sheet and Analysis Requested Sheet. 3. Samples are to be packed and sealed for shipment in suitable containers to avoid damage. A sample seal should be attached across the lid of each shipping container in such a manner that the container cannot be opened without breaking the seal. This lock and/or seal is not to be removed until the shipping container is opened by the laboratory custodian or a designee.
101

4. If sent by mail, the package is sent via Registered Mail with Return Receipt Requested. If sent by common carrier, all shipping receipts should be retained as part of he permanent chain-of-custody documentation. 5. Couriers picking up samples at the airport, post office, etc. should sign the shipping documents to acknowledge receipt of the samples. LABORATORY CUSTODY PROCEDURES The following procedures should be followed regarding the handling and custody of samples in the laboratory. In any given instance, an assistant may perform any item indicated below, but a record should be made of the assistant's participation.
1. A designated custodian should:
a. Accept and receive custody of the shipped samples. b. Observe the physical condition of the shipping container noting any broken seals or indications of any tampering. c. Open the shipping container (and at his/her option saving or not saving any seals or stickers on that container). d. Crosscheck and verify the information on the chain-of-custody receipt with the tags or other markings on the sample containers. e. Make appropriate entries in the chain-of-custody receipt making sure the identity of the courier is reflected. f. Enter or have an assistant enter the information contained on the sample tags and/or markings on the field data sheet and on the analysis-requested sheet, into a bound logbook. g. Place all of the received samples in an appropriate storage area that is capable of being secured against access whether or not the access to the building is secured.
2. A designated person should routinely be in charge of distributing samples to the appropriate analysts, or each analyst should be in charge of collecting his/her samples from the storage area. In any event, the person performing that activity should be identified in the analysis records for each sample. 3. When not needed or being used in the laboratory for analysis, the unused portion of the sample should be returned to its storage area. 4. All identifying tags, seals, or stickers from the sample container should be retained with the analysts notes and other analysts documents. 5. Each analyst is responsible for the care and custody of each sample received by him/her for analysis form the time of receipt until the sample is exhausted or returned to its storage area. Samples should be returned to a storage area by
102
the analyst who analyzed the sample, and the analysts' records for the sample should record any deviation from that practice. 6. The laboratory director should obtain authorization from the project coordinator and case attorney for sample disposal for civil cases. No criminal cases samples are to be disposed of until the case is closed and all appeals have been heard. The prosecuting attorney must be consulted prior to disposal of any evidence for criminal cases. LABORATORY DOCUMENTATION The procedures generally recognized by professional chemists and laboratories for documenting their work are acceptable for documentation in laboratories contracted by DAC for damage assessment work. All sample data, laboratory observations, and calculations will be recorded in logbooks or in bench sheets. Each lab document should, on its first page, reflect the project number, date of composing, names of analysts and assistants participating, and any other information concerning the identity of the sample analyzed. Any document reflecting results of analysis should have similar identifying data on the first page. Charts or printouts from instrumentation, graphs, and similar "display" type documents should have similar identifying information affixed to them. Both draft and smooth copies of any such documents should be retained as part of the lab documentation.
Correspondence, report notes, methods, references, sample inventories, checkout logs, etc. should be part of the permanent lab records. Any logbook or bench sheet needs to contain (1) clear identification of who made what entries on the same, and (2) information sufficient to enable the entry-maker to recall and describe each step of the analysis performed. The analyst and his/her assistants may be called upon to testify in subsequent legal proceedings about the analysis performed and results obtained. In addition, procedures followed if it became necessary for that to be done. Irregularities (if any) observed during the analytical process should be noted. If, in the professional judgement of the analyst, a deviation from a particular analytical method is advisable or used, the deviation should be described and the reasons for that deviation should be recorded. Logbooks or comparable permanent records must be kept which reflect each instance in which lab instruments or instrumentation is calibrated. Such records are the very foundation of the later analytical work performed, and are critical in any later legal proceeding. Any continuous monitoring records (e.g. charts showing temperatures of storage cabinets where some samples are stored) should be kept for some years. Before a final lab report is sent out, the lab personnel will assemble and cross-check information on sample tags, custody records, bench sheets, analysts' logbooks and/or notes, and in any relevant permanent records to ensure that
103

data pertaining to each particular sample is consistent throughout all lab documents.
104

APPENDIX 11
Evaluating Expert Assessor Training Using Fisher’s Exact Test Following training, it may be necessary to validate the performance of the expert assessors before beginning evaluations of the samples taken from the spill and control sites. The following procedure can be applied after training or re-familiarisation of expert assessors with defects caused by petroleum contamination. It can be used with known samples, so there is an actual right or wrong answer associated with each sample. It allows the calculation of the exact probability of the results a test set of samples and shows the minimum number of samples needed for the selected level of p = 0.999 for testing of significance. The method used is Fisher’s Exact Test as described by Hays (1994)1. The null hypothesis for the test is that the data is random in nature and the alternate hypothesis is that it is not. The probability calculated is then the indication of the chance that the results given by that assessor were only random in nature. The data is recorded in a table as shown below.
Assessor’s Responses Known Condition of Samples Taint present Clear (no taint present) Total Tainted samples a b a + b Clear samples c d c + d Total a + c b + d N This is essentially finding the probability that the particular result or any result less likely is due to chance. This is calculated using the following formula and may be done using a hand-held calculator or by programming the calculation into an Excel spreadsheet.
p (obtained table) = (a+b)! (c+d)! (a+c)! (b+d)!* (N! a! b! c! d!)
For example, if the expert assessors are presented with 40 samples (20 clear controls and 20 exposed to taint) and the following data are obtained
Assessor’s Responses Known Condition of Samples Taint present Clear (no taint present) Total Tainted samples 17 3 20 Clear samples 1 19 20 Total 18 22 40 p (obtained table) = (20)! (20)! (18)! (22)! = 2.011 x 10⁻⁷ (or 0.0000002011) (40! 17! 3! 1! 19!) 1 Hayes, William L. 1994. Statistics. Harcourt Brace College Publishers, New York. pp. 863-865.
105

In order to evaluate the results, a “cut-off” of an acceptable probability of chance must be selected. In this case, p = .001 (or 1.0 x 10⁻³) is being used. This means there is less than 1 chance in 1000 that the results are due to chance and the ability of the expert assessor to evaluate the samples is validated. The results in the example show 2 chances in 10 million that the results are due to chance (or 1 chance in 5 million). The following gives examples of data collected and the calculations based on each. These examples show that if a minimum number of 20 samples are used (10 clear and 10 tainted), the pattern of results (calculated as shown in the above tables) gives assurance at P<0.001 that the expert assessor can correctly identify taint when it is present in the samples. If more samples are used, the formula given above can be used to calculate the results for any data set. Example 1.
Assessor’s Responses Known Condition of Samples Taint present Clear (no taint present) Total Tainted samples 9 1 10 Clear samples 1 9 10 Total 10 10 20 p (obtained table) = (10)! (10)! (10)! (10)! = 0.00054 (10! 9! 1! 1! 9!) Example 2.
Assessor’s Responses Known Condition of Samples Taint present Clear (no taint present) Total Tainted samples 8 2 10 Clear samples 0 10 10 Total 8 12 20 p (obtained table) = (10)! (10)! (8)! (12)! = 0.00036 (10! 8! 2! 0! 10!) Example 3.
Assessor’s Responses Known Condition of Samples Taint present Clear (no taint present) Total Tainted samples 10 0 10 Clear samples 2 8 10 Total 12 8 20 p (obtained table) = (12)! (8)! (10)! (10)! = 0.00036 (10! 0! 10! 2! 8!) Explanatory Note on the use of Factorial Notation: The notation “!” means the
factorial of the number, e.g. 4! = 4 x 3 x 2 x 1 = 24. When using a hand-held calculator,
the usual algebraic “cancelling” of numbers in the numerator can be done and then the
106

value for p calculated. It must be remembered that, e.g. 20! divided by 17! would leave
20 x 19 x18 in the numerator and 20! / 19! would leave 20 in the numerator, etc. This
does not have to be done if the calculation is programmed into Excel.
107