9.6 Earth Science Forum
101
-
Upload
nguyenduong -
Category
Documents
-
view
330 -
download
14
Transcript of 9.6 Earth Science Forum

National Centre for Earth Science Studiesjk"Vªh; i`Foh foKku v/;;u dsanz
(ESSO, Ministry of Earth Sciences, Govt. of India)
(bZ ,l ,l vks] i`Foh foKku ea=ky;)Committed to our Earth our Future
gekjs Hkfo”; gekjh i`Foh ds fy, izfrc)
ESSO -National Centre for Earth Science StudiesbZ ,l ,l vks] jk”Vªh; iqFoh foKku v/;;u dsanz
i`Foh foKku ea=ky;] Hkkjr ljdkjAkkulam, Thiruvananthapuram-695011, IndiavkDdqye] fr#ouariqje&695011 HkkjrnÚ®¦ÉɹÉ/Phone : +91 - 471 - 2442213, 2511720, 2511721 ¡èòCºÉ /Fax : +91 - 471 - 2442280; <Ç-¨Éä±É/E-mail : [email protected] osclkbV/Website : www.cess.res.in / ncess.gov.in
Ministry of Earth Sciences, Govt. of India
NC
ESS
Ann
ual R
epor
t 201
4 -
‘15
ANNUAL REPORT 2014 - ‘15

ANNUAL REPORT
(bZ ,l ,l vks
National Centre for Earth Science Studies®É¹]ÅÒªÉ {ÉÞl´ÉÒ Î´ÉYÉÉxÉ +vªÉªÉxÉ Eäòxpù®É¹]ÅÒªÉ {ÉÞl´ÉÒ Î´ÉYÉÉxÉ +vªÉªÉxÉ Eäòxpù®É¹]ÅÒªÉ {ÉÞl´ÉÒ Î´ÉYÉÉxÉ +vªÉªÉxÉ Eäòxpù®É¹]ÅÒªÉ {ÉÞl´ÉÒ Î´ÉYÉÉxÉ +vªÉªÉxÉ Eäòxpù®É¹]ÅÒªÉ {ÉÞl´ÉÒ Î´ÉYÉÉxÉ +vªÉªÉxÉ Eäòxpù
(ESSO, Ministry of Earth Sciences, Govt. of India)
Akkulam, Thiruvananthapuram-695011, India ] ] ] ] ]i`Foh foKku ea=kky;] Hkkjr ljdkj½
vkDdqye] fr#ouariqje&695011] Hkkjr
�
okf”kZd izfrosnuokf”kZd izfrosnuokf”kZd izfrosnuokf”kZd izfrosnuokf”kZd izfrosnu
2014 - 2015

i zdk f’ kr fun s’ kd]jk”Vªh; i`Foh foKku v/;;u ds anz ¼,ulhbZ,l,l½
laikndh; lfefr MkW- Mh- in~eykyMkW- ,y- ‘khyk uk;jMkW- Mh- ,l- lqjs’k ckcw
lfpoh; lgk;rk Jh- Mh- Jhdkar ikbZJherh ,l- vkj- jhtk jktJherh vkj- fi jstkuh
okf”k Zd izfrosnu 2014&15

i
NC
ES
S A
nn
ual R
epo
rt 20
14
-’15
Co
nten
ts
Contents
From the Director’s Desk .................................................................................................................................................... v
1. Crustal Processes
1.1 Mafic volcanic flows/sills in the Gwalior, Bijawar sedimentary basins ................................................................... 1
1.2 Proterozoic mafic dykes ......................................................................................................................................... 2
1.3 Late Neoproterozoic anorthosites in South India ................................................................................................... 2
1.4 Paleo fluids in the petroliferous basins of Western Offshore, India ......................................................................... 3
1.5 Graphitization process in Kollam district, Kerala, India ........................................................................................ 5
1.6 Late Quaternary geology of the coastal lands of Southern Kerala, India with special reference to palaeoclimate and
coastal evolution .................................................................................................................................................... 5
1.7 Palaeoclimate and sea level records in the Late Quaternary sediments of the coastal wetlamds of Pallikkal and
Achankovil river basins, Kerala ........................................................................................................................... 7
1.8 Quaternary geology, paleoclimate and geomorphic evolution of Central Kerala, SW India ................................... 8
1.9 Monitoring Indian shield seismicity with 10 BBS to understand seismotectonics of the region using Vsat
connectivity ........................................................................................................................................................... 8
1.10 Land subsidence in the highlands of Kerala ......................................................................................................... 10
1.11 Surficial earth processes studies in the Sahyadris .................................................................................................. 15
1.12 Impact of human activities in the generation of land disturbances in humid tropical highland areas - a study in
Idukki district, Kerala ........................................................................................................................................ 18
1.13 Analysis of natural hazards along a tropical highland basin with special emphasis on flood and landslides :
Panamaram watershed, Wayanad district, Kerala ............................................................................................... 18
2. Coastal Processes
2.1 Integrated study on estuary, beach and innershelf dynamics of west coast of India ................................................ 19
2.2 Shoreline mapping and monitoring along west coast of India ................................................................................. 21
2.3 Establishment and maintenance of wave gauge stations in the coastal waters of the SW coast of India ................. 22
2.4 Study of impact of sea level rise along Kerala coast .............................................................................................. 22
2.5 Coastal Zone Management plan for Kerala ......................................................................................................... 23
3. Atmospheric Processes
3.1 Intensity, duration and frequency analysis of precipitation microphysical parameters of South-West monsoon rain,
2014 at a high altitude station in Western Ghats ................................................................................................. 25
3.2 Modelling Atmospheric Pollution and Networking (MAPAN) ........................................................................... 26
4. Natural Resources and Environmental Management
4.1 Water Resources
4.1.1 Appraisal of drinking water potential of springs in Pathanamthitta, Kottayam and Idukki districts
of Kerala .............................................................................................................................................. 29
4.1.2 Hydrological modelling of Greater Cochin urban agglomerate in the context of sustainable urban
water resource development ..................................................................................................................... 29
4.2 Environmetal Monitoring & assessment
4.2.1 Sand audit of the rivers of Idukki district ............................................................................................ 31
4.2.2 Study on the environmental effects of mining and quarrying in the Periyar river basin, Central Kerala ... 31
4.23 Environmetal monitoring of water and sediment quality paraments in the backwaters of Cochin Port
Trust .................................................................................................................................................... 32
4.2.4 In-situ bioremediation of landfill pollutants: maximizing the remediation potential of selected indegenous
and exogenous microorgranisms ............................................................................................................. 33
4.2.5 Sea water quality monitoring ................................................................................................................. 34

ii
NC
ES
S A
nn
ual
Rep
ort
20
14
-’1
5C
on
ten
ts4.2.6 Environmental studies of the Kollam - Neendakara wetland system and associated inlands .................... 36
4.2.7 Environmental studies on the Netravathi-Gurupur river basins of Karnataka and Periyar-Chalakudy
river basins of Kerala ............................................................................................................................ 37
4.2.8 Monitoring global change impacts in Sahyadri (Western Ghats) ............................................................. 37
4.2.9 Preparation of management action plan for ecorestoration of Vembanad lake ecosystem ........................ 39
4.2.10 EIA of muncipal solid waste management project of Thruvananthapuram muncipal corporation .......... 39
4.2.11 Mining and quarrying in the river catchments of Central Kerala around Kochi city, SW India :- Conse-
quences and sustainable development strategies ........................................................................................ 39
4.2.12 Integrated geoenvironmental studies of the lacustrine wetlands of Kerala in climate change paradigms for
conservation and management ................................................................................................................ 41
4.2.13 Adsorptive potential of surface modified clays and chitosan for the recovery of certain inorganic toxic
metal ions from aqueous media using batch and column studies: kinetics and thermodynamics profile ...... 42
4.2.14 Studies on hydrogeochemical and biological aspects of various streams of Karamana river near Sree
Parasurama Swami Temple, Thiruvananathapuram dist., Southern Kerala ........................................... 44
4.2.15 Assessment of nutrient flux in urban drainage systems: identification of sources, pathways and remedial
measures ............................................................................................................................................... 44
4.2.16 Appraisal of marine ecosystem of Kavaratti island in Kochi in Southwest coast of India with special
reference to lagoon system ...................................................................................................................... 46
4.3 Coastal Zone Management
4.3.1 Integrated Island Management Plan (IIMP) for Lakshadweep islands .................................................. 48
4.4 GIS and Remote sensing applications in natural resources management
4.4.1 Setting up of the modular data centre .................................................................................................... 48
4.4.2 Spatial urban information system using open source software .................................................................. 49
4.4.3 A customized OSSGIS application for Vegetable and Fruit Promotion Council Keralam (VFPCK)
for management of soil nutrients ........................................................................................................... 49
4.4.4 Geographic information system of particularly vulnerable tribal groups of Kerala ................................. 50
5. External and Consultancy Projects
5.1 External grant-in-aid Projects ............................................................................................................................. 53
5.2 Consultancy Projects: Demarcation of HTL and LTL for Coastal Regulation Zone .......................................... 57
6. Honours, Awards & Academic Activities
6.1 Honours & Awards ........................................................................................................................................... 59
6.2 Membership in Committees outside NCESS....................................................................................................... 59
6.3 Visits Abroad .................................................................................................................................................... 61
6.4 Internship / Summer Training ........................................................................................................................... 62
6.5 M. Sc. / B. Tech / M. Tech Dissertation Programmes ...................................................................................... 63
6.6 Ph. D Students .................................................................................................................................................. 64
7. Library and Publications
7.1 Library .............................................................................................................................................................. 67
7.2 Research Papers
7.1.1 In Journals .......................................................................................................................................... 68
7.1.2 In Conference Proceedings .................................................................................................................... 69
7.3 Project Reports ................................................................................................................................................... 70
7.4 Books / Edited Volumes / Monographs ........................................................................................................... 72
8. Conference, Seminar & Workshop
8.1 Continental crust and cover sequences in the evolution of the Indian subcontinent ................ ............................... 73
8.2 Invited Lectures / Chairing of technical sessions ................................................................................................ 74
8.3 Papers presented in Conference/ Workshop / Symposium / Seminar ................................................................. 75

iii
NC
ES
S A
nn
ual R
epo
rt 20
14
-’15
Co
nten
ts
9. Extension
9.1 Observance of Rashtriya Ekta Diwas ................................................................................................................. 77
9.2 Observance of Vigilance Awareness Week .......................................................................................................... 77
9.3 Swachch Bharat Mission ...................................................................................................................................... 77
9.4 Observance of Communal Harmony Campaign Week ........................................................................................ 77
9.5 Visit to NCESS Seismic Observatory at Peechi ................................................................................................. 78
9.6 Earth Science Forum ........................................................................................................................................... 78
9.7 Campus Development & Green Committee ......................................................................................................... 78
9.8 Recreation Club: Onam Celebration .................................................................................................................... 78
10. Committees
10.1 Statutory Committees
10.1.1 Governing Body (GB) ............................................................................................ ............................. 79
10.1.2 Governing Council (GC) ........................................................................................... ......................... 79
10.1.3 Finance Committee (FC) .......................................................................................... .......................... 80
10.1.4 Research Advisory Committee (RAC) ................................................................. .............................. 81
10.2 Internal Committees
10.2.1 Group Heads ...................................................................................................................................... 82
10.2.2 Material Purchase ............................................................................................................................... 82
10.2.3 Library Management .......................................................................................................................... 82
10.2.4 Canteen .............................................................................................................................................. 82
10.2.5 Campus Development and Green Committee ...................................................................................... 82
10.2.6 Complaints Committee to Combat Sexual Harassment at Work Place .............................................. 82
10.2.7 Website Management ......................................................................................................................... 82
11. Staff Details
11.1 Diretor’s Office ................................................................................................................................................. 83
11.2 Crustal Processes (CrP).................................................................................................................................... 83
11.3 Coastal Processes (CoP) ................................................................................................................................... 83
11.4 Atmospheric Processes (AtP) ........................................................................................................................... 83
11.5 Natural Resources & Environmetal Management (NREM) .......................................................................... 83
11.6 Projects, Training & Documentation (PT&D) ............................................................................................... 83
11.7 Administration ................................................................................................................................................ 83
11.8 Retirements ...................................................................................................................................................... 84
11.9 Obituary .......................................................................................................................................................... 85
.
12. Balance Sheet ...................................................................................................................... 87

v
NC
ES
S A
nn
ual R
epo
rt 20
14
-’15
Fro
m th
e Directo
r’s Desk
From the Director’s Desk
The MoES takeover of CESS
gave great vigour and
enthusiasm among the research
community of the centre in
pursuing an integrated approach
to the earth system science
studies. NCESS recognises the
vast potential and promise of
research opportunities in
implementing major research
programmes in the frontier areas of basic and applied
aspects of Earth Sciences. Goal for the coming decade
will be to achieve and maintain research efforts at
internationally competitive level.
The reporting period is another creditable year for NCESS
in its efforts to grow as a leading R & D centre of the
country in the field of Earth System Sciences. NCESS
continued to undertake R&D activities for the improved
knowledge of earth’s processes and for sustainable
development of our natural resources, conservation of
environment and mitigation of natural hazards in
accordance with its stated objectives.The R&D activities
of NCESS is centered on four major spheres of research
viz., Crustal Processes, Coastal Processes, Cloud
Microphysics & Lightning and Natural Resources &
Environmental Management. In addition to the
implementation of core project “Earth system dynamics”,
notable are the implementation of 32 external grant-in-aid
projects and 25 consultancy projects for several public/
private sector undertakings and agencies in different parts
of our country.
The activities of the Crustal Processes group were focussed
mainly on the petrological studies of southern granulite
belt, geochemistry and palaeo-magnetism of mafic dykes,
formation of palaeo-fluids in petroliferous basins,
Quaternary geology and geo-hazards. A collaborative
project between NCESS and the Bundelkhand University
was undertaken to study the mafic dykes in the Dharwar
and Bundelkhand cratons and to identify linkages between
the igneous units occurring within the basins. Detailed
studies on palaeo-magnetic, major and trace element
geochemistry of the Palaeoproterozoic mafic dykes in the
Indian shield was also carried out so as to understand the
petrogenesis of continental magmatism. Demagnetization
experiments, petrological and geochemical studies have
been initiated during this period.
A non-destructive methodology was developed to
determine the API gravity of oil in hydrocarbon fluid
inclusions based on photoluminescence emission to
determine the quality of oil. Patent has been filed for the
methodology. From the studies on land subsidence in the
highlands of Kerala taken up since 2012, a database of the
affected sites is created and laboratory-scale mitigation trials
are experimented using chemical amelioration techniques.
Studies on Quaternary geology, land disturbances, micro-
seismicity, neo and active tectonics, electrical resistivity
surveys, and geochemical and mineralogical studies were
continued in selected localities in SW India. A National
Workshop on continental crust and cover sequences in the
evolution of the Indian sub-continent was conducted during
January 20-21, 2015.
The Coastal Processes Group is continuing its
multidisciplinary studies on the coastal land, estuaries, surf
zone, nearshore and inner-shelfregions of the west coast.
With better instrumentation and numerical modelling
capabilities, the group is examining nearshore dynamics,
beach-surf zone morphology, coastal hydrogeology,
mudbank and estuarine dynamics on a micro scale in order
to decipher the complex processes at work in the land-sea
interface. Study of near bed sediment dynamics in the surf
zone, mapping of sediment thickness and its distribution
in the innershelf, measuring submarine ground water
discharge, estimation of sediment flux in tidal inlet system
and coastal zone management are the major thrust areas
of the Coastal Processes Group.
As part of developing methodology to use video imaging
for monitoring beach-surf zone morphodynamics and
measurement of near shore waves, a long term program
has been initiated by the Group. The project in
collaboration with ESSO-INCOIS for collection of site-
specific, real-time wave data for validation of the daily
Ocean State Forecast (OSF) is being continued in the
reporting period as well. Site specific OSF information is
being disseminated through e-mails and news bulletin of
the All India Radio. As instructed by the Hon’ble Supreme
Court of India, Integrated Island Management Plans for
all the inhabited islands and 3 uninhabited islands of
Lakshadweep has been accomplished in record time.
Preparation of Coastal Zone Management Plans (CZMPs)
of coastal districts of Kerala in 1:25000 and 1:4000 scales
are in the final stages of completion.

vi
NC
ES
S A
nn
ual
Rep
ort
20
14
-’1
5fr
om
th
e D
irec
tor’
s D
esk
Dr. M. Samsuddin
Director, NCESS
Studies on intensity, duration, frequency analysis of
precipitation micro-physical parameters of south-west
monsoon rain has been the thrust areas of the Atmospheric
Processes Group. As part of this studies, measurement of
cloud and atmospheric parameters from the three stations
established at Thiruvananthapuram,Braemore and
Agumbeare is being continued. Additionaly, real-time
collection of data from AWS as well as data collection from
Atmospheric electric field mill and Ceilometer were carried
out. The pollutants and weather parameters are also being
monitored, as part of MAPAN project of IITM.
In an experimental study to reduce the toxicity of Municipal
Solid Waste (MSW) landfill pollutants like dissolved
organics, inorganics and heavy metals in leachate and
methane, an in-situ bioremediation technique has been
initiated using a consortium of micro-organisms. The
results are highly encouraging. This technique does not
require costly installations for recovery and purification of
LFG or for leachate treatment units.
Small rivers being one of the most sensitive ecosystems
and perhaps the first to be hit by negative impacts of
developmental pressures, as part of the Natural Resources
and Environmental Management Group’s activities, it is
planned to conduct an integrated river basin analysis of
the two twin- river basins in the western flanks of the
Western Ghats, the Periyar- Chalakudi river systems (Kerala
state) draining the granulite belt and Netravathi-Gurupur
river systems (Karnataka state) draining the Dharwar
Craton.
As part of the Sea water Quality Monitoring Programme
of MoES, hydrochemical, biological and microbiological
parametes are being monitored off Kochi and off
Mangalore offshore and Lakshadweep on a regular basis.
In order to ensure the drinking water potential of springs,
physic-chemical and biological parameters in 200 highland
springs in the central Kerala were monitored. The study
on water quality parameters and sediment characteristics
has been continued in the Cochin backwaters. Analysis of
water and sediment quality of the Ashtamudi Wetland
System revealed that the Wetland is contaminated
moderately with chromium, iron, nickel, and copper. By
integrating the thematic layers and attribute data of societal
importance, web based user-friendly customized
information systems has been designed and developed in
open source platform.
With the takeover of Ministry of Earth Sciences, the centre
has continued its effort to enhance its infrastructural
facilities in a full swing. This year saw setting up of a
National Facility for Micro Laser Raman Spectrometer,
revitalizing the chemical lab to modern analytical facility,
initiating the SEM facility, modular data centre, upgradation
of LAN facility with WiFi campus, purchase of various
oceanographic equipment etc. By initiating action to set
up the paperless office and introduce e-tendering and e-
attendance system, we have made major strides in the e-
governance also. In pursuit of adopting e-library services,
Web of Science and Scopus LAN based online public access
catalogue (OPAC) facilities are made available. NCESS
continued to extend consultancy services to government
departments and public and private sector undertakings
on earth science related issues. The Coastal Regulation Zone
(CRZ) maps prepared by the Centre for different parts of
the Indian coast have enabled decision makers at various
levels to arrive at appropriate management action plans
and decisions on development projects.
Submission of 30 project reports stands to the testimony
of earnest effort of the scientific community of NCESS
in achieving the target of completing the sponsored
projects. NCESS publication record was moderate with 25
papers in peer reviewed national and international journals,
6 papers/chapters in proceedings/books. In the academic
activities also NCESS continued its vibrant activities with
29 Ph. D. students and 1 Ph. D. award during the year.
Besides, 25 students completed their B.Tech./M. Tech./
M. Sc. dissertations.
I would like to place on record our appreciation and
gratitude to all the members of the NCESS family for their
hard work and co-operation. Special thanks are also due to
the senior scientists, who superannuated this year, for their
invaluable contribution and support in achieving the goals
set forth by this institute. I greatly appreciate the unstinted
co-operation and support received from the President and
members of the NCESS Society, the Chairman and
members of the Governing Council, Research Advisory
Committee, Finance Committee of NCESS and the
Ministry of Earth Sciences.
On behalf of NCESS, I acknowledge with appreciation
the relentless service and the commitment of Dr. N. P.
Kurian, who superannuated this year. His earnest effort in
accomplishing the takeover of CESS by MoES and his
contribution in the scientific endeavours of this centre once
deeply acknowledged.

1
1
NC
ES
S A
nn
ual R
epo
rt 20
14
-’15
Cru
stal Pro
cesses
Crustal Processes
1.1 Mafic Volcanic Flows / Sills in the Gwalior,
Bijawar Sedimentary Basins
Gwalior, Bijawar and Cuddapah Basins constitute the large
Palaeoproterozoic sedimentary basins in India with
occurrences of volcanic flows and/or sills in the lower
stratigraphic horizons. The igneous activity is generally
linked to the dyke magmatism in the adjoining cratons and
to the geodynamic development of these marginal basins.
A collaborative project between the NCESS and the
Bundelkhand University has been initiated with funding
from the Department of Science and Technology,
Government of India to study petrology, geochemistry and
palaeomagnetism coupled with isotope dating of the
igneous units occurring within these basins. The project is
aimed at integrating and comparing the data with the results
produced on mafic dykes in the adjoining Dharwar and
Bundelkhand cratons to identify linkages, if any, between
them. The results along with own and other published data
will summarize and constrain the Palaeoproterozoic igneous
activity in India in terms of large igneous provinces across
the Archaean cratons of the world and will test different
Palaeoproterozoic supercontinental reconstruction models
tracing the position of Indian landmass within the
reconstruction model.
A fieldwork was carried out during the previous year in the
Gwalior and Bijawar Basins. Oriented cores of 2-3 inch
long and 1 inch dia were drilled from igneous units at six
sites in Bijawar Basin and at eight sites in the Gwalior Basin
for palaeomagnetic study and fifteen block samples were
collected for major and trace element analysis. During this
year thin sections were made and petrography of these
Fig.1.1.1 Photomicrographs of Gwalior and Bijawar igneous units
Fig. 1.1.2 Examples of Equal area and orthogonal projections of alter-nate field demagnetization results from Gwalior traps. In the equal areaplot the open and closed symbols indicate projections in the lower and upperhemisphere; in the orthogonal projections, closed symbols are in horizontalplane and open symbols are in the vertical plane.
Fig. 1.1.3 Tholeiitic basalt composition of the Gwalior and Bijawar igneousunits depicted in total alkali-silica (TAS) diagram by Le maître (2002)
samples was documented. The samples are found to be
relatively fresh and are only sparsely altered without any
trace of deformation (Fig. 1.1.1). The samples were crushed
and pulverised for major and trace element geochemistry.
Major oxides were determined by XRF methods. The LOI
of all samples were <1 % attesting no major hydrothermal
alterations except in one sample for which the LOI was
~3%. Trace elements, including rare earth elements were
determined by the ICP-MS.
All the oriented core samples were made into 1 inch dia
and long specimens for detailed palaeomagnetic study. Step-
wise incremental alternating field demagnetization
experiments have been initiated. Natural Remanent
Magnetisation (NRM) was determined for 50 samples and
demagnetisations attempted at 2.5 mT increments initially
up to 40 mT, then 10 mT steps up to 60 mT. Selected
Na 2O
=K
2O
SiO2

2
NC
ES
S A
nn
ual
Rep
ort
20
14
-’1
5C
rust
al P
roce
sses
1
samples where sizable magnetization still retain, were
demagnetized at 20 mT steps up to 100 mT. The data were
analysed following the standard methods of stereographic
projections, orthogonal projections and principal
component analysis. A typical demagnetization behavior
during alternating field demagnetization experiments is
presented in Fig. 1.1.2.
Preliminary analyses of both geochemical and
palaeomagnetic data (Fig. 1.1.3) have been carried out by
taking into account the field and petrographic details to
submit progress report to DST for a mid-term review and
also presented in a Group Monitoring Workshop of the
PAC-DST at the IIT, Kharagpur.
T. Radhakrishna, Tomson J. Kallukalam
& Ram Chandra
Funding: DST, GoI
1.2 Proterozoic Mafic Dykes
Palaeoproterozoic mafic dykes have become the focus of
recent research because of their potential in unraveling
global continental reconstructions in the early history of
the Earth and also in understanding petrogenesis of
continental magmatism. The Indian shield comprises one
of the five oldest cratons of the world with profuse dyke
intrusions of Palaeoproterozoic era. During the previous
years, our focus was on the analysis of palaeomagnetic
results for testing various continental reconstructions.
During this year, thrust has been given detailed analysis of
the major and trace element geochemistry of mafic dykes
in the Bundelkhand craton. Major and trace element data
of 60 dolerite samples have been critically analysed. The
samples are all tholeiitic basalts in composition and are the
products of variable degrees of fractionation. The Mg
numbers typically vary between 0.62 and 0.36. Some of
the less fractionated samples appear to have witnessed only
limited fractionation of olivine. However, majority of
samples show evidences of gabbro fractionation in the
latter stages of magmatic evolution. More detailed work
on identifying mantle source characteristics is in progress.
The main palaeomagnetic investigations on mafic dykes
during this year has focused on reassessing the palaeopole
data reported on 1460 Ma dykes on the Eastern Ghat
mobile front in the eastern Bastar craton. The palaeopole
data were carefully examined in the light of our recent
results on Palaeoproterozoic dykes in the Indian shield.
Eliminating the pole data comparable to the
Palaeoproterozoic poles, a robust pole of Mesoproterozoic
has been estimated. Interpretations of the results are in
T. Radhakrishna & Ram Chandra
Funding: DST, GoI
1.3 Late Neoproterozoic Anorthosites in South India
Petrogenesis and emplacement of Proterozoic anorthosites
are highly controversial and considered to have important
bearing on supercontinent assembly and dispersal. South
India is marked by numerous anorthosite-gabbro plutons
whose age of emplacement and petrogenesis are relatively
unknown. In this background detailed field, petrology,
geochemistry and palaeomagnetic investigations on
Oddanchatram and Kadavur anorthosites (Fig. 1.3.1 & Fig.
1.3.2) in Dindigal district, Tamilnadu have been initiated.
Fig. 1.3.1 Anorthosite-gabbro layering within Oddanchatram anorthosite.;
variation in the thickness ranging to subcentimeter scale is seen.
Fig. 1.3.2 Outcrop of Kadavur anorthosite near Kadavur town
A field work has been carried out to record their physical
characteristics and also the geological relationships with
the adjoining lithological units. Seventy oriented core
progress.

3
1
NC
ES
S A
nn
ual R
epo
rt 20
14
-’15
Cru
stal Pro
cessessamples for palaeomagnetic investigations and twenty block
samples for detailed petrological work were collected. Field
observations indicate significant differences in disposition
and physical characters of these plutons. The
Oddanchatram anorthosite (Fig. 1.3.3) is better exposed
as an elongated north east-south west oval shaped body
comprising sensuo stricto anorthosite in the central region.
Towards the southern and northern margins, it becomes
more layered with gabbroic assemblages ranging from sub-
centimeter to meter scale in width. In contrast to
Oddanchatram anorthosite, the Kadavur anorthosite (Fig.
1.3.4) is rarely exposed. Most of the available exposures
are deeply weathered and restricted to drainage channels.
It is devoid of mafic layering and surrounded by massive
gabbro on the margins. The anorthosite and gabbro units
are confined to circular ridges of quartzite.
Fig. 1.3.3 Large garnet (Gt) crystals within Oddanchatram anorthosite;
clinopyroxene(Cpx) is seen along the margin of the garnet
Preliminary petrographic studies reveal that both
Oddanchatram and Kadavur anorthosites are comprised
Fig. 1.3.4 Anorthosite from Kadavur comprising plagioclase and fine grained
minor mafic minerals
of >90% plagioclase and common accessory phases are
pyroxene, hornblende, biotite and iron oxides. Primary
hornblende in Oddanchatram anorthosite implies presence
of water content in the magma. Occasionally the plagioclase
is granulated in Kadavur anorthosite.
Electron probe microanalysis (EPMA) has been done for
two thin sections of Oddanchatram anorthosites. All the
collected oriented core samples have been made into 1 inch
dia and long specimens for NRM and demagnetization
experiments. Detailed petrological, geochemical and
palaeomagnetic studies are in progress.
G. Soumya, Tomson J. Kallukalam & T.
Radhakrishna
1.4 Paleao Fluids in the Petroliferous Basins of Western
Offshore, India
The potential of Laser Raman Micro Spectroscopy (LRMS)
in photoluminescence emission studies on oil inclusions
was explored in detail. A non-contact, non-destructive
methodology was developed to determine the API gravity
of oil in hydrocarbon fluid inclusions (HCFIs) based on
photoluminescence emission studies. Using the emission
profile of oil in inclusions, the quality of oil such as high
or low API gravity could be assessed and further studies
on the emission ratio could tell the actual API gravity. It
has been observed that the API gravity values obtained
for oil in the RV-1 well samples (Fig. 1.4.1) are between 35
and 55 and are commercially viable oils. The developed
methodology could be used in real time drilling site to
determine the quality of oil and is a quick and convenient
technique in petroleum quality assay. Patent application filed
for the methodology developed with filing No. 1559/CHE/
2015 dated March 26, 2015.
Fig. 1.4.1 Raman spectrum in the middle frequency region of naturalHCFIs in the RV-1 well (3495-3500m)

4
NC
ES
S A
nn
ual
Rep
ort
20
14
-’1
5C
rust
al P
roce
sses
1
The utility of Raman spectroscopy as a tool for finger-
printing hydrocarbons and also for identifying the major
functional groups within oil inclusions/ hydrocarbon bear-
ing fluid inclusions (HCFIs) were also explored. A laser
wavelength of 785nm was used for Raman studies since
longer wavelength excites less fluorescence. Peaks corre-
spond to cyclohexane (863, 2660, 2938 cm-1), benzene and
its derivatives (309, 464, 703, 999, 1310, 1018, 1168 , 1485,
1580cm-1), methane/methylene (2905, 2924, 2848, 2945 cm-
1), carbonyl group (1064, 1650 cm-1), paraffin (1232, 2560
cm-1), perchlorate ion (645 cm-1), propane (940, 2740
cm-1), acetylene (1662 cm-1), i-butane (800 cm-1) were iden-
tified in HCFIs along with the presence of CO2 peaks at
1410, 2350 cm-1 . Fig. 1.4.1 shows the Raman spectra ob-
tained for oil inclusions in the mid frequency region for
RV-1 well. This could be a significant step in the petro-
leum exploration industry where characterization of HCFIs
could be decisive in the development of a well.
Fig. 1.4.2 Bright field (a) and fluorescent (b) images from the oil inclusionin KK-4C-A-1 well (depth 3950-3955m)
Table 1.4.1 Micro thermometric data from KK-4C-A-1 well.
In KK-4C- A-1 well, micro thermometric studies were
performed for 80 samples and mostly aqueous phase
inclusions that were seen in secondary fractures and
cements mostly from quartz and feldspars. Systems such
as CO2-H
2O, CO
2 (l)- CO
2 (g) – NaCl, NaCl-H
2O and H
2O-
CO2-CH
4–N
2 were identified based on the first melting
and last melting temperature using heating-freezing stage.
Table 1.4.2 Oil inclusions in KK-4C-A-1 well with horizon depth andlithology
Table 1.4.1 shows the micro thermometer data obtained
from the well.
Presence of hydrocarbons were observed at the horizon
depths 3890-3895, 4020-4025, 3950-3955 m while doing
petrography (Fig. 1.4.2 & Fig. 1.4.3). The first two horizons
are of sandstone- claystone lithologies and the latter one
is of claystone- limestone lithology (Table 1.4.2). Inclusion
sample at a depth of 4020-4025m and a coevial inclusion
showed a temperature of homogenization at 155oC, which
is indicative of overheating for oil with
medium to high API gravities.
The API gravity of oil from the HCFIs
of the KK-4C-A-1 well were determined
using the recently developed
technique.The values arrived at are
between 20 and 30 that indicating the
entrapment of heavy grade oil which are of low commercial
viability.
Fig. 1.4.3 Bright field (c) and fluorescent (d) images from the oil inclusionin KK-4C-A-1 well (depth 3890-3895m)
Raman Spectroscopic studies were performed on non-
HCFIs too and the species present were identified (Fig.
1.4.4). Peaks corresponds to species such as CO32-(1064
cm-1), calcite (1081 cm-1), SiO2
(1160 cm-1), CO2(l) and
CO2(g) (1281, 1385 cm-1), N
2 (2330 cm-1 ) and CH
4 (2926
cm-1) were present in the fluid inclusions of samples of
KK-4C- A-1 well. Presence of water in liquid form shows
Sample No.
Depth /horizon (m)
Lithology TFM (°C)
T LM (°C)
TH (°C)
Salinity (eq. wt% NaCl)
System
1 3215-3220 Claystone, Sandstone, Limestone
-181 -4.5 -80 7.17 CH4-CO2-H2O-NaCl (N2)
2 3235-3240 Claystone, Sandstone
-64.3 -31.2 15 1.40 CO2-H2O-NaCl (CH4,N2 )
3
3885-3890 Claystone, Sandstone, Limestone
-58.3 -2.2 21 3.71 CO2-H2O-NaCl
�A total of 619 samples from KK-4C- A-1 well (offshore
to Kerala) were obtained from the Regional Geological
Laboratory, Panvel. Samples from horizons with claystone
and shale were excluded from the study. Representative
samples from other lithologies of interest from different
depths were selected for the study. A preliminary scanning
on the specially prepared 285 wafer samples from 3025-
6190 m depth were subjected to petrographic (93 Nos.),
micro thermometric (80 Nos.) and Raman Spectroscopic
(42 Nos.) studies. Micro thermometry data were used to
study the P-V-T-X properties of the entrapped fluids along
with the determination of oil window using heating-
freezing stage and Bakker program at the Geo-Fluids
Research Laboratory (GFRL) of NCESS. Laser Raman
Micro Spectrometer (LRMS) at the National Facility for
Fluid Inclusion Research (NFFIR) at NCESS was used for
the photoluminescence (PL) and Raman spectroscopic
studies.
Sl. No. Depth /horizon (m) Lithology Oil inclusion 1 3890-3895 Sandstone, claystone
Oil inclusion 2 3950-3955 Claystone, limestone
Oil inclusion 3 4020-4025 Claystone, sandstone
�

5
1
NC
ES
S A
nn
ual R
epo
rt 20
14
-’15
Cru
stal Pro
cesses
a broad peak around 3000 - 3500 cm-1. More specialized
fluid inclusion wafers are to be prepared to ascertain the
availability, API gravity and extent of hydrocarbons in
different horizons in the KK-4C- A-1 well from the already
available samples. Raman Spectroscopic studies are in
progress for both RV-1 and KK-4C- A-1 well samples.
Fig. 1.4.4 Raman peaks for non-HCFI from KK-4C-A-1 well (3940-39455 m)
V. Nandakumar
Funding: MoES, GoI
1.5 Graphitization Process in Kollam district, Kerala,
India
Graphite and graphite bearing rocks having different
mineral assemblages occur in khondalite suite of rocks,
like quartzo feldspathic gneiss, garnet-biobite gneiss, and
granetiferrous biotite gneiss. In some sampling locations
graphite occurs as coarse grains/flakes, hosted in laterite
or weathered khondalite. Associated minerals could not
be identified as the rock is in weathered condition. Graphite
samples from almost all the localities are flaky in nature.
The flaky nature is indicative of the good quality nature of
graphite. 10 representative samples were collected from 3
taluks of Kollam district.
The compiled X-Ray Diffraction (XRD) data reveals highly
crystalline and highly ordered nature of the graphite as
evidenced by the sharp and well defined peaks at 2Ø values
26.61º, 26.35º and 54.45º having inter-planar spacing d(002)
values (3.35Aº to 3.38Aº and (1.68Aº) respectively.The
Scanning Electron Microscopic (SEM) data of the graphite
samples from all the study area was compiled. The
photomicrographs of the samples from Nilamel,
Azhanthakuzhy and Cherukara display triangular markings
on the base. Arrangement of well-formed, platy individual
layers of flakes is exhibited by SEM photos of Ottumala
and Karalikonam. The SEM photos representing graphite
from Chithara, Eyyappacha and Boundaa rymukku, show
hexagonal outline with prominent basal plane having
perfect micaceous cleavage. The graphite samples from
Manjappara, Ottumala and Arayil are arranged in a book
type stacking sequence.
�
�
Fig. 1.5.1 SEM photograph of the graphite
Ansom Sebastian
The unique morphology and textural pattern displayed by
SEM photomicrographs (Fig. 1.5.1) correlate well with the
high degree of crystallinity and slow cooling rate as proved
by the well-defined and sharp peaks in the X-Ray
Diffractograms. Through these studies important clues are
obtained in the mineralization history as well as the formation
environment (high pressure, temperature metamorphic) of the
flaky graphite.
The graphite occurrence in Kollam district is found to be of
high grade with more than 85% carbon. The stable isotopic values
of carbon (δ13C) vary significantly indicating difference in the
origin of graphite from different sources. Manjappara and
Ottumala graphite show sedimentary origin and/or showing
tendency towards sedimentary origin with (δ13C) value of 18.7
‰ and 22.4 ‰ respectively. Arayil and Eyyappacha graphite
indicate remobilization origin and have (δ13C) values of -6.4 ‰
and -7.9 ‰ respectively.
1.6 Late Quaternary Geology of the Coastal lands of
Southern Kerala, India with special reference to
Palaeoclimate and coastal evolution
Earth has been subjected to dramatic changes in
environment throughout its geologic history. The changes
were most striking in the Quaternary period - the time span
representing the last two million years of earth’s history.
The Quaternary period comprises two epochs- the
Pleistocene epoch (2 million yrs BP to 10 kilo yrs BP) and
the Holocene epoch (<10 kilo yrs BP). The Pleistocene
epoch comprises four principal glacial episodes separated
by warmer interglacial periods. During glacial period, sea
level began to lower and the rivers could no longer shift
their courses, instead cut its own valley to deeper level rather
than widening its valley. The Last Glacial Maximum (LGM),
occurred around 18 kilo yrs BP, witnessed lowering of sea
level to about 120 m with respect to the present Mean Sea
6
NC
ES
S A
nn
ual
Rep
ort
20
14
-’1
5C
rust
al P
roce
sses
1
Level. This was followed by a sea level rise in the interglacial
period. During the rising spells of the sea, rivers began to
meander within their incised valleys, depositing its load in
the form of point bar and / or over bank deposits. Like
many other tropical coasts, the south western coast of
India, especially the coastal lands of Kerala also responded
remarkably to Late Quaternary climate and sea level
changes. A better understanding of the same receives
special significance as a major proportion of the State’s
population and economic activity are centered on the
coastal lands. In addition to this, many of the economically
viable mineral resources like heavy mineral sands, lime shells,
glass sands, tile/ brick earths etc., are also associated with the
Quaternary sedimentary deposits in the coastal lands. Further,
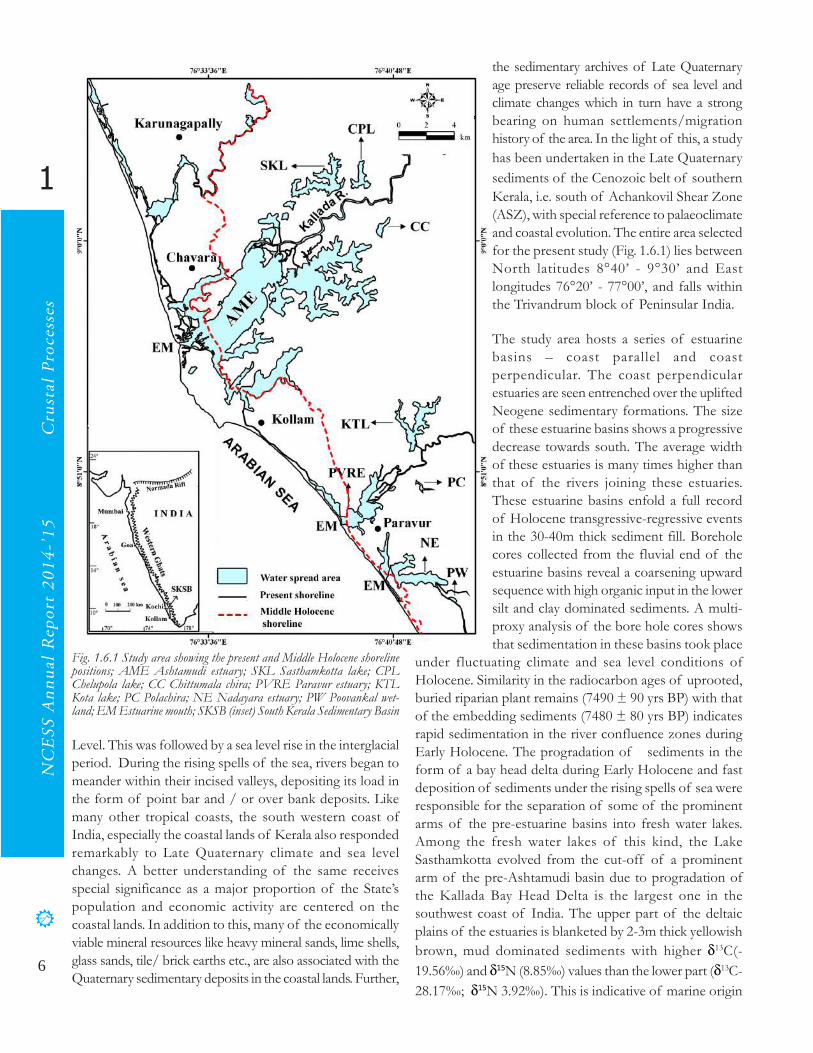
Fig. 1.6.1 Study area showing the present and Middle Holocene shorelinepositions; AME Ashtamudi estuary; SKL Sasthamkotta lake; CPLChelupola lake; CC Chittumala chira; PVRE Paravur estuary; KTLKota lake; PC Polachira; NE Nadayara estuary; PW Poovankal wet-land; EM Estuarine mouth; SKSB (inset) South Kerala Sedimentary Basin
The study area hosts a series of estuarine
basins – coast parallel and coast
perpendicular. The coast perpendicular
estuaries are seen entrenched over the uplifted
Neogene sedimentary formations. The size
of these estuarine basins shows a progressive
decrease towards south. The average width
of these estuaries is many times higher than
that of the rivers joining these estuaries.
These estuarine basins enfold a full record
of Holocene transgressive-regressive events
in the 30-40m thick sediment fill. Borehole
cores collected from the fluvial end of the
estuarine basins reveal a coarsening upward
sequence with high organic input in the lower
silt and clay dominated sediments. A multi-
proxy analysis of the bore hole cores shows
that sedimentation in these basins took place
under fluctuating climate and sea level conditions of
Holocene. Similarity in the radiocarbon ages of uprooted,
buried riparian plant remains (7490 ± 90 yrs BP) with that
of the embedding sediments (7480 ± 80 yrs BP) indicates
rapid sedimentation in the river confluence zones during
Early Holocene. The progradation of sediments in the
form of a bay head delta during Early Holocene and fast
deposition of sediments under the rising spells of sea were
responsible for the separation of some of the prominent
arms of the pre-estuarine basins into fresh water lakes.
Among the fresh water lakes of this kind, the Lake
Sasthamkotta evolved from the cut-off of a prominent
arm of the pre-Ashtamudi basin due to progradation of
the Kallada Bay Head Delta is the largest one in the
southwest coast of India. The upper part of the deltaic
plains of the estuaries is blanketed by 2-3m thick yellowish
brown, mud dominated sediments with higher δ13C(-
19.56‰) and δ15N (8.85‰) values than the lower part (δ13C-
28.17‰; δ15N 3.92‰). This is indicative of marine origin
the sedimentary archives of Late Quaternary
age preserve reliable records of sea level and
climate changes which in turn have a strong
bearing on human settlements/migration
history of the area. In the light of this, a study
has been undertaken in the Late Quaternary
sediments of the Cenozoic belt of southern
Kerala, i.e. south of Achankovil Shear Zone
(ASZ), with special reference to palaeoclimate
and coastal evolution. The entire area selected
for the present study (Fig. 1.6.1) lies between
North latitudes 8°40’ - 9°30’ and East
longitudes 76°20’ - 77°00’, and falls within
the Trivandrum block of Peninsular India.

7
1
NC
ES
S A
nn
ual R
epo
rt 20
14
-’15
Cru
stal Pro
cessesof the sediment blanket which is later subjected to sub-
aerial weathering and degradation of organic matter and
iron containing minerals imparting yellow or yellowish
brown coloration to the sediments. The colouration of the
exposed sediments, occurrence of calcareous nodules in
the sediment cores retrieved from the marginal areas of
the estuarine basins etc., are indicative of dry phase at
around 5-4 kyrs BP. This was followed again by a high
rainfall period before stabilizing the climate to the present.
The coastal lands north of the Ashtamudi estuary have
been subjected to severe coastal erosion from Late
Pleistocene onwards. As a result, the entire area has been
leveled down leaving a chain of wetlands on its east as a
mark of the once existed coastal plain rivers. At the same
time coastal erosion and cliff retreat is now aggressive in
areas south of the Ashtamudi estuary.
S. Vishnu Mohan, D. Padmalal & K. Sajan
Funding: CSIR
1.7 Palaeoclimate and Sea Level Records in the Late Qua-
ternary Sediments of the Coastal Wetlands of Pallikkal
and Achankovil River Basins, Kerala
It is reported that the Muthukulam borehole core retrieved
from the younger coastal plains in the west showed C14
dates 3662 ± 114 yrs BP (depth 1.27-1.35 m bgl), 6276 ±
112 yrs BP (2.07-2.12 m bgl) and 7176 ± 82 yrs BP (3.0-
3.10 m bgl). The sediment sample at a depth of 20.4 mbgl
of the Ayiramthengu borehole was 14C dated 40000yrs BP.
However, a shell sample at a depth of 4.75 mbgl in the
same borehole core gave Late Holocene date (2580±110
yrs BP). Two carbonaceous clay samples of Pathiyur
borehole from 5.0 m (40,000 yrs BP) and 9.0 m (28830 ±
2330 yrs BP) levels gave Late Pleistocene age. Almost similar
date has been obtained for a peat sample at 1.0 m level
(20600 ± 1030 yrs BP) and organic matter rich sediment at
10.0 m level (43738 ± 574 yrs BP) of the Komallur borehole
core. The geological section of the study area (Fig. 1.7.1)
reveals records of two transgressive events - one
corresponds to the NNE-SSW trending beach ridge and
the other to NNWE-SSE trending beach ridge. The heavy
rainfall during periods of lowered sea level around 40-30
kyrs BP might have resulted in carving wide and deep
channels and wetlands in the eastern side.
Fig. 1.7.1 A transect along Vayyankara chira (1) – Komallur (2) – Pathiyur (3) – Ramapuram (4) –Muthukulam borehole locations. KL Kayamkulam Lagoon; B Beach; YCP Young Coastal Plain; OCPOld Coastal Plain.
The discrete array of wetlands that are seen incised over
the lateritic terrains in the lowlands of the Pallikkal and
Achankovil river basins enfold a fairly thick blanket of Late
Quaternary sediments whose radiocarbon dates vary
between 46570±3480 and 2460± 120yrs BP. The oldest
date is recorded for the sediment sample at a depth of 5m
below ground level (bgl) of the Valummel Punja borehole
core and the youngest for the vegetative material at a depth
of 3m bgl of the Ramapuram borehole core. Most of the
Late Pleistocene sediments are confined mainly to the
eastern side of the study area and also seen underlying the
Holocene sands and clays in the western side. Sediments
in the younger coastal plains in the west and also some of
the wood samples in the eastern wetlands exhibit Holocene
age. Among the Holocene dates, the oldest date was
recorded for a wood sample collected from Vatta kayal,
one of the important wetlands in the eastern periphery.
This indicates that the eastern wetlands that existed during
late Pleistocene and supported marine brackish water fauna
and flora were later transformed to fresh water swamps
during Holocene.
However, the events in 10-
7kyrs BP have affected only
half of the coastal area as
evidenced from the coast
parallel beach ridges. In short,
the observed geochronology
and landform features of the
study area unveil the effects of
Late Pleistocene - Early
Holocene geological events in
giving rise to the observed
features in the coastal
lowlands of Pallikkal and
Achankovil river basins.
D. Padmalal, K. Maya &
S.Vishnu Mohan

8
NC
ES
S A
nn
ual
Rep
ort
20
14
-’1
5C
rust
al P
roce
sses
1
1.8 Quaternary Geology, Paleoclimate and Geomorphic
Evolution of Central Kerala, SW India (MoES Plan)
The study of Quaternary sediments has attained great
importance in recent years as it is now generally accepted
that the present day landscape and environment are
essentially the products of various processes that operated
during the Quaternary period. Further, the Quaternary
sediments are expected to contain records of past sea level
and climate changes, information of which is very essential
for developing high resolution predictive models of future
climate and sea level changes. The coastal areas of Indian
subcontinent contain Late Quaternary sediments in its
estuaries, lagoons and nearby coastal lowlands. Therefore,
a systematic study has been undertaken in the SW coast of
India, especially the coastal lowlands between Periyar and
Kadaludi rivers of Central Kerala, to unfold the
palaeoclimate and sea level records in its coastal sedimentary
archives, using multiproxy analysis of a series of borehole
cores retrived from the area. In connection with this
investigation, reconnaissance field surveys were conducted
in the area to collect representative samples from different
landforms. Also, identified 10 sites for borehole drilling
from the coastal segment between Periyar and Karuvannur
rivers. A survey of published studies reveals that the region
is blanketed by a maximum of 30-50m thick Late
Quaternary sediments whose age ranges from 1828±520
yrs BP to 40000 yrs BP. Out of the total 42 14C dates
available from the secondary records, about 83% of the
dates are of Holocene and the remaining (17%) are of
Late Pleistocene. The Late Pleistocene
sediments, occur as pockets within the
Holocene dominated sediment blanket. This
reiterates that greater land modifications had
occurred during Holocene rather than Late
Pleistocene. The floodplains of the Periyar,
Chalakudy and the Karuvannur rivers contain
a fairly complete record of Holocene
sediments - carbonaceous clays, peat and
yellowish brown silty clays. The peat is 14C
dated 6630±120 yrs BP. Sedimentological,
palaeontological and stable isotope (δ15N and
δ13C) analysis of the sediments are in
progress. D. Padmalal & K. Maya
1.9 Monitoring Indian Shield Seismicity with 10 BBS to
understand Seismotectonics of the region using Vsat con-
nectivity
Broadband seismic observatory at Peechi, being operated
by CESS (present NCESS) in the campus of the Kerala
Forest Research Institute (KFRI) was established in 1999,
as a part of strengthening earthquake monitoring in the
peninsular India and for improving the detection and
identification of location capabilities of earthquakes in the
shield region. Major objectives of the project are to maintain
and operate the Seismic Observatory at Peechi to produce
high resolution seismic data.
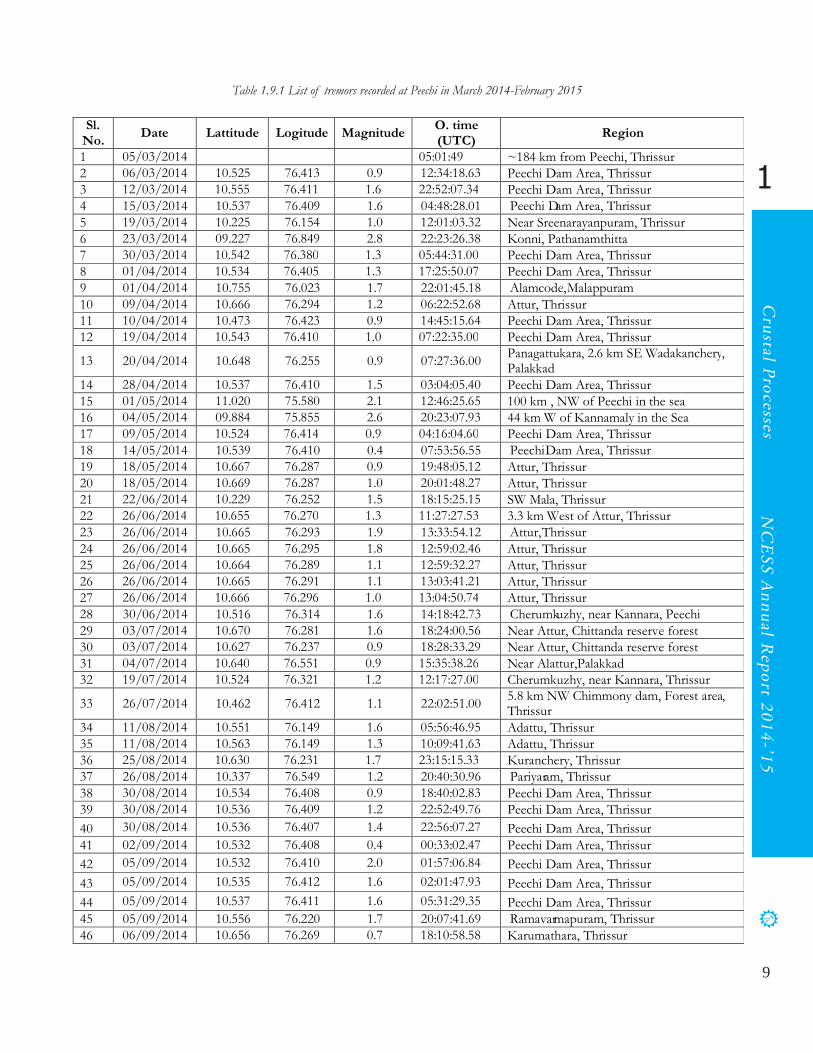
A total of 2018 local events were recorded during the period
March 2014 - February 2015. In addition, there were records
of 1856 global events, 15 events from other parts of India
and 55 from the Andaman-Nicobar region. Among the
regional events, 7 events are from the neighboring areas
of Karnataka and Andhra. Andhra tremors were mainly
from Guntur and Prakasam Districts whereas the
Karnataka tremor was from Sakaleshpur-Mudigere border.
Seismic activity in India was relatively low this year. Indian
events are mainly from Koyna, Assam, Manipur, Mizoram,
and Arunachalpradesh-Myanmar border. The 8.2
magnitude Chile, 7.6 magnitude earthquake of Solomon
Islands, 7.9 near Alaska and 7.1 near Fiji were some of the
major teleseismic earthquakes recorded in the observatory
during the period.
�
�
Fig. 1.9.1 Location of tremors recorded from Kerala During March 2014-February 2015.
9
1
NC
ES
S A
nn
ual R
epo
rt 20
14
-’15
Cru
stal Pro
cesses
Table 1.9.1 List of tremors recorded at Peechi in March 2014-February 2015
Sl. No.
Date Lattitude Logitude Magnitude O. time (UTC)
Region
1 05/03/2014
05:01:49 ~184 km from Peechi, Thrissur
2 06/03/2014 10.525 76.413 0.9 12:34:18.63 Peechi Dam Area, Thrissur
3 12/03/2014 10.555 76.411 1.6 22:52:07.34 Peechi Dam Area, Thrissur
4 15/03/2014 10.537 76.409 1.6 04:48:28.01 Peechi Dam Area, Thrissur
5 19/03/2014 10.225 76.154 1.0 12:01:03.32 Near Sreenarayanpuram, Thrissur
6 23/03/2014 09.227 76.849 2.8 22:23:26.38 Konni, Pathanamthitta
7 30/03/2014 10.542 76.380 1.3 05:44:31.00 Peechi Dam Area, Thrissur
8 01/04/2014 10.534 76.405 1.3 17:25:50.07 Peechi Dam Area, Thrissur
9 01/04/2014 10.755 76.023 1.7 22:01:45.18 Alamcode, Malappuram
10 09/04/2014 10.666 76.294 1.2 06:22:52.68 Attur, Thrissur
11 10/04/2014 10.473 76.423 0.9 14:45:15.64 Peechi Dam Area, Thrissur
12 19/04/2014 10.543 76.410 1.0 07:22:35.00 Peechi Dam Area, Thrissur
13 20/04/2014 10.648 76.255 0.9 07:27:36.00 Panagattukara, 2.6 km SE Wadakanchery, Palakkad
14 28/04/2014 10.537 76.410 1.5 03:04:05.40 Peechi Dam Area, Thrissur
15 01/05/2014 11.020 75.580 2.1 12:46:25.65 100 km , NW of Peechi in the sea
16 04/05/2014 09.884 75.855 2.6 20:23:07.93 44 km W of Kannamaly in the Sea
17 09/05/2014 10.524 76.414 0.9 04:16:04.60 Peechi Dam Area, Thrissur
18 14/05/2014 10.539 76.410 0.4 07:53:56.55 Peechi Dam Area, Thrissur
19 18/05/2014 10.667 76.287 0.9 19:48:05.12 Attur, Thrissur
20 18/05/2014 10.669 76.287 1.0 20:01:48.27 Attur, Thrissur
21 22/06/2014 10.229 76.252 1.5 18:15:25.15 SW Mala, Thrissur
22 26/06/2014 10.655 76.270 1.3 11:27:27.53 3.3 km West of Attur, Thrissur
23 26/06/2014 10.665 76.293 1.9 13:33:54.12 Attur, Thrissur
24 26/06/2014 10.665 76.295 1.8 12:59:02.46 Attur, Thrissur
25 26/06/2014 10.664 76.289 1.1 12:59:32.27 Attur, Thrissur
26 26/06/2014 10.665 76.291 1.1 13:03:41.21 Attur, Thrissur
27 26/06/2014 10.666 76.296 1.0 13:04:50.74 Attur, Thrissur
28 30/06/2014 10.516 76.314 1.6 14:18:42.73 Cherumkuzhy, near Kannara, Peechi
29 03/07/2014 10.670 76.281 1.6 18:24:00.56 Near Attur, Chittanda reserve forest
30 03/07/2014 10.627 76.237 0.9 18:28:33.29 Near Attur, Chittanda reserve forest
31 04/07/2014 10.640 76.551 0.9 15:35:38.26 Near Alattur,Palakkad
32 19/07/2014 10.524 76.321 1.2 12:17:27.00 Cherumkuzhy, near Kannara, Thrissur
33 26/07/2014 10.462 76.412 1.1 22:02:51.00 5.8 km NW Chimmony dam, Forest area, Thrissur
34 11/08/2014 10.551 76.149 1.6 05:56:46.95 Adattu, Thrissur
35 11/08/2014 10.563 76.149 1.3 10:09:41.63 Adattu, Thrissur
36 25/08/2014 10.630 76.231 1.7 23:15:15.33 Kuranchery, Thrissur
37 26/08/2014 10.337 76.549 1.2 20:40:30.96 Pariyaram, Thrissur
38 30/08/2014 10.534 76.408 0.9 18:40:02.83 Peechi Dam Area, Thrissur
39 30/08/2014 10.536 76.409 1.2 22:52:49.76 Peechi Dam Area, Thrissur
40 30/08/2014 10.536 76.407 1.4 22:56:07.27 Peechi Dam Area, Thrissur
41 02/09/2014 10.532 76.408 0.4 00:33:02.47 Peechi Dam Area, Thrissur
42 05/09/2014 10.532 76.410 2.0 01:57:06.84 Peechi Dam Area, Thrissur
43 05/09/2014 10.535 76.412 1.6 02:01:47.93 Peechi Dam Area, Thrissur
44 05/09/2014 10.537 76.411 1.6 05:31:29.35 Peechi Dam Area, Thrissur
45 05/09/2014 10.556 76.220 1.7 20:07:41.69 Ramavarmapuram, Thrissur
46 06/09/2014 10.656 76.269 0.7 18:10:58.58 Karumathara, Thrissur

10
NC
ES
S A
nn
ual
Rep
ort
20
14
-’1
5C
rust
al P
roce
sses
1
Sreekumari Kesavan
Funding: MoES, GoI
1.10 Land Subsidence in the Highlands of Kerala
During high rains, especially during monsoons, land
subsidence and landslides occur in many parts of Western
Ghats. Eventhough landslides are very common in
highlands, the incidences of land subsidence were noticed
only recently. The first major occurrence was reported in
2005 from Chattivayal in the Thirumeni village of Kannur
district, Kerala. Since then from many parts of the state
land subsidences were reported. Other than Trivandrum,
Kollam and Alappuazha almost all the districts in the state
have reported incidence of land subsidence.
The studies carried out indicated that the land subsidences
are caused by the internal soil erosion called tunnel erosion
or soil piping. The cavities and pipes developed below the
ground grow with respect to time. The development of
subsurface tunnels will result in weakening the overburden.
Subsidence of the overburden occurs over a period of time.
The soil piping affected soils are not suitable for cultivation
or any development purposes. Infact the soil piping affected
land converts a fertile land to a totally a waste land.
Systematic investigations were taken up since 2012 to create
a data base of the affected sites, to study the processes
47 07/09/2014 10.530 76.407 0.7 08:15:32.06 Peechi Dam Area, Thrissur
48 07/09/2014 10.537 76.413 2.7 17:02:19.64 Peechi Dam Area, Thrissur
49 07/09/2014 10.537 76.411 1.2 17:10:48.47 Peechi Dam Area, Thrissur
50 07/09/2014 10.538 76.412 2.3 18:21:14.41 Peechi Dam Area, Thrissur
51 07/09/2014 10.535 76.411 1.7 19:50:20.13 Peechi Dam Area, Thrissur
52 07/09/2014 10.530 76.409 0.8 20:07:06.82 Peechi Dam Area, Thrissur
53 08/09/2014 10.539 76.411 1.1 00:29:57.04 Peechi Dam Area, Thrissur
54 11/09/2014 10.534 76.406 1.1 01:24:06.63 Peechi Dam Area, Thrissur
55 11/09/2014 10.539 76.409 1.3 11:07:31.18 Peechi Dam Area, Thrissur
56 11/09/2014 10.535 76.410 1.7 11:08:41.55 Peechi Dam Area, Thrissur
57 11/09/2014 10.532 76.410 2.2 11:12:18.50 Peechi Dam Area, Thrissur
58 11/09/2014 10.532 76.411 2.7 11:12:04.12 Peechi Dam Area, Thrissur
59 15/09/2014 10.504 76.378 1.3 02:13:42.10 Anakuzhy, 5 km SE Peechi station
60 25/09/2014 10.570 76.206 1.3 01:02:16.68 Kolazhy, Thrissur
61 17/10/2014 10.560 76.407 2.1 02:55:29.19 Near Kuthiran, Thrissur
62 19/10/2014 10.539 76.410 2.4 04:04:02.54 Peechi Dam Area, Thrissur
63 23/10/2014 10.551 76.414 2.1 05:03:07.99 Near Kuthiran, Thrissur
64 23/10/2014 10.550 76.410 0.9 13:42:33.95 Near Kuthiran, Thrissur
65 26/10/2014 10.345 76.708 1.8 01:26:16.66 Near Sholayar, Thrissur
66 27/10/2014 10.530 76.411 1.2 10:50:05.07 Peechi Dam Area, Thrissur
67 03/11/2014 10.663 76.283 1.3 11:14:02 Near Attur, Thrissur 68 03/11/2014 10.541 76.420 2.2 13:50:52.62 Peechi Dam Area, Thrissur 69 06/11/2014 10.668 76.308 0.8 23:16:52.34 Attur, Thrissur 70 06/11/2014 10.669 76.299 0.7 23:18:52.3 Attur, Thrissur 71 14/11/2014 10.537 76.413 1.5 01:54:50 Peechi Dam Area, Thrissur 72 25/11/2014 10.534 76.408 0.9 18:58:55.92 Peechi Dam Area, Thrissur 73 25/11/2014 10.543 76.412 1.1 21:40:15.92 Peechi Dam Area, Thrissur 74 27/11/2014 10.543 76.408 1.6 14:38:41.17 Peechi Dam Area, Thrissur 75 30/11/2014 10.552 76.414 1.3 01:42:29.42 Peechi Dam Area, Thrissur 76 28/12/2014 10.557 76.416 1.4 09:24:30.10 Peechi Dam Area, Thrissur 77 12/01/2015 10.572 76.632 1.8 23:52:50.43 Near Poothundy dam, Palakkad 78 17/01/2015 10.658 76.245 0.5 23:06:29 Wadakkanchery, Palakkad 79 18/01/2015 10.759 76.275 1.3 02:03:09 Shoranur, Palakkad 80 27/01/2015 10.518 76.410 1.8 03:00:42.93 Peechi Dam Area, Thrissur 81 04/02/2015 10.550 76.415 2.0 03:13:18.89 Peechi Dam Area, Thrissur 82 04/02/2015 10.539 76.413 1.5 03:13:5032 Peechi Dam Area, Thrissur 83 06/02/2015 10.556 76.409 1.3 06:47:47.30 Peechi Dam Area, Thrissur 84 15/02/2015 10.601 76.275 1.5 04:03:29.79 Kundukad, Thrissur 85 15/02/2015 10.582 76.257 1.0 04:25:54.78 Thannikudam, Thrissur

11
1
NC
ES
S A
nn
ual R
epo
rt 20
14
-’15
Cru
stal Pro
cesses
Fig. 1.10.2 Failed roof of tunnel inside the well, Niranganpara, Irittytaluk, Kannur district
Fig. 1.10.1 Inside the tunnel, Niranganpara, Iritty taluk, Kannur district
responsible for those destructive events and to contain the
adversities of soil piping.
Data base on soil piping : A data base was created on
the soil piping affected regions in the southern Western
Ghats. The data base is being updated by incorporating
Fig. 1.10.3 Electrical resistivity survey at Kottathalachimala, Kannur
new incidences. A new incident which occurred in July 2014
in the Niranganpara locality (Fig. 1.10.1 and Fig. 1.10.2) in
Ayyankunnu panchayath, Thalasseri taluk in the Kannur
district evoked lot of public attention. A subsidence has
occurred inside a well (N12°02’09.4", E75°45’07.2"). The
affected locality is in the foot hills and surrounded by hilly
area. Piping has affected the saprolite clay below the laterite.
The piping outlet is located at 120m north of this area.
The soil is 1.5m thick and overlying the well-developed
laterite. The slope of the terrain as well as the orientation
of the tunnel were Northwest direction. The underground
tunnels formed are found to be affected by the ground
water storage of the wells in this area.
Fig. 1.10.4 The layout of Electrical Resistivity survey line (figure not toscale)
Field Surveys : Field surveys were conducted in
Niranganpara locality in Ayyankunnu panchayath,, Kannur
district, Kuttikol in Kasargod and Peringassery and

12
NC
ES
S A
nn
ual
Rep
ort
20
14
-’1
5C
rust
al P
roce
sses
1
����������
Fig. 1.10.5 Electrical Resistivity Tomographic section in differentelectrode spacing
�
Fig. 1.10.6 Electrical Resistivity Tomographic section of Schlumberger array at 1m electrode spacing
The five survey profiles were laid in the West-East direc-
tion (Fig. 1.10.3). Profiles are laid above an established soil
pipe. The terrain gently slopes towards north hence the
Profiles 2 and 3 are laid almost parallel (Fig. 1.10.4) to profile
1 at a distance of about 27m north of it. The central
electrode for profile 2 is about 8m east of central electrode
for profile 3. Profile 2a and 2b correspond to electrode
spacing of 0.50m and 1.00m respectively. Profiles 3a and
3b correspond to electrode spacing of 1.50m and 2.00m
respectively. Profile 4 is laid further towards north at a
distance of about 18m from profiles 2 and 3. The electrode
spacing used for profiles 4a and 4b are 1.00m and 1.50m
respectively. Profile 5 is laid in the NW-SE direction with
the first electrode towards north-west. Electrode spacing
of 1.00m and 1.50 m has been used for profiles 5a and 5b
respectively.
Another experiment was conducted with profile with
different electrode separation were laid parallel to the pipe
in north south direction (Fig. 1.10.6 - Fig. 1.10.8) mid-
point of survey is 30m north of the pipe entrance on the
down slope side oriented in the North to South direction.
at Kottathalachimala in Kannur district.
The dipole-dipole configuration has the highest
investigation depth and a highly resistive region can be
observed for this array just below the surface. This high
resistive region can be attributed to the roof of the tunnel.
From the earlier analyzed data we are concluded that the
dipole-dipole configuration has the highest investigation
depth; this array configuration clearly brings out the entire
Tattekanni, in the Udumbanoor and Kanjikuzhi village in
the Thodupuzha taluk of the Idukki district.
Electrical Resistivity Surveys (Geophysical surveys): The
2D Electrical Resistivity imaging experiments using
Electrical Resistivity survey techniques were used at
Kottathalachimala near Cherupuzha, Kannur district across
the alignment of a known soil pipe by using the WGMD-
4 Multi-function instrument. Electrical resistivity
tomography has been carried out over five mutually parallel
profiles using a 60 electrode-setup (Fig. 1.10.3). A minimum
of 0.25m to a maximum of 2.0m spacing has been used as
electrode configuration. Use of larger electrode spacing
has been constrained due to the nature of the terrain.
�
Fig. 1.10.7 Electrical Resistivity Tomographic section of Wenner array at 1m electrode spacing
elevation gradually decreases from profile 1 to profile 5.
ERT at profile 1 is carried out using five different elec-
trode spacing. Profile 1a,1b,1c,1d and 1e correspond to
ERT at profile 1 with electrode spacing equal to 0.25m,
0.50m, 1.00m, 1.50m and 2.00m respectively.

13
1
NC
ES
S A
nn
ual R
epo
rt 20
14
-’15
Cru
stal Pro
cesses
Investigations with Push camera:
�
Fig. 1.10.8 Electrical Resistivity Tomographic section of Dipole-Dipole array at 1m electrode spacing
tunnel cross-section. Wenner and Schlumberger array fails
to map the vertical extent of the soil pipe but it can be
used for differentiating piping from the rock boulders.
Across all the qualitative interpretation of the resistivity
section indicates that the technique could delineate the
conductive zones where the soil pipes are present. For
detailed investigation need more electrical resistivity surveys
data information from the other piping location.
Fig. 1.10.9 Experimenting with Push Camera inside the Tunnel in Chattivayal, Kannur
The underground tunnels formed by the soil piping process
have many branching small tunnels. Often they are either
small or water filled making it impossible for further
investigations. Push Cameras are highly useful in under
water operations and small tunnel investigations. One such
Camera was used (Fig. 1.10.9) for visual investigation of
tunnel branches at Chattivayal in Kannur district for
studying sediment deposition and branching. The camera
has a cable length of 100meters enabling to cover deeper
levels. The information from camera was recorded in both
video and picture modes (Fig. 1.10.10).
Geochemical studies: Nine samples (Table 1.10.1) were
collected for analysis from Idukki district. The six soil
samples were collected from the premises of the non-piping
area, by using hand auger at different depths and thickness
from the surface. The three samples (I-23, I-24 and I-25)
were taken from the piping affected area in Peringassery
and Venniyanimala of the Idukki district.
Analysis of samples (Table 1.10.2) indicate that the sample
I-21 shows an organic carbon percentage of 3.40 %. The
soil sample was collected from a depth of 50 cm at a loca-
tion with an elevation of 877m. The sample I-25 shows
relatively low organic carbon content (0.48%). This sample
was collected from a piping affected locality with an eleva-
tion of 492m. In general, vertical distribution of organic
carbon in soil is decreasing with depth. By comparing
samples of the piping and non piping areas, organic car-
bon is rich in non-piping area and low in piping area.
Table 1.10.3 shows pH, EC and TDS of nine samples
collected from both piping and non piping areas. In non-
piping areas (I-17, I-18, I-19, I-20, I-21, I-22) the samples
show variation in pH, EC and TDS. The pH of the sample
ranges from 5.63 to 6.02, EC from3.84µs/m to 13.22 µs/
m and TDS from 2.72ppm to 9.38 ppm in non-piping area.
In piping affected area (I-23, I-24, I-25) pH value ranges
from 5 to 5.91, EC from 5.49µs/m to 21.52µs/m and TDS
from 3.95 to 15.29 ppm.
Sedimentalogical and geochemical analyses were carried out
on the samples collected from the affected sites. 12 soil
samples were collected from Kottathalachi mala during 04-

14
NC
ES
S A
nn
ual
Rep
ort
20
14
-’1
5C
rust
al P
roce
sses
1
Fig. 1.10.10 The images taken by Push Camera from inside the pipes (filled with water)
Sl. No.
Sample number
Location Latitude Longitude Type of Sample
1 I 17 Nalaam Mile
N 9º39'34.0" E 765º59'29.4"
Soil (Non piping area)
2 I 18 NalaamMile Soil (Non piping area)
3 I 19 Nalaam Mile Soil (Non piping area) 4 I 20 Nalaam Mile
N 9º39'37.4" E 765º59'28.5"
Soil (Non piping area)
5 I 21 Nalaam Mile Soil (Non piping area)
6 I 22 Nalaam Mile Soil (Non piping area)
7 I 23 Peringassery N 9�52'2.9'' E 76�51'28.4'' Soil Piping area
8 I 24 Peringassery N 9�52'2.9'' E 76�51'28.4'' Soil Piping area
9 I 25 Venniyanimala N9�51'39.3'' E 76�51'16.8'' Soil Piping area
Table 1.10.1 Location and other relevant details of samplesTable 1.10.3 Analytical results of soil samples
collected from Idukki
Sl. No.
Sample code
Organic carbon (%)
Organic matter (%)
1 I-17 2.49 4.30
2 I-18 2.04 3.52
3 I-19 0.97 1.67
4 I-20 2.98 5.14
5 I-21 3.40 5.87
6 I-22 2.49 4.30
7 I-23 0.75 1.29
8 I-24 0.69 1.18
9 I-25 0.48 0.82
Table 1.10.2 Organic carbon and organic matter percentage of samples
Sl. No.
Sample code
pH E C (µs/m)
TDS (ppm)
1 I-17 5.63 10.85 7.70
2 I-18 5.74 13.22 9.38
3 I-19 5.96 5.22 3.70
4 I-20 6.02 10.16 7.21
5 I-21 5.71 6.66 4.72
6 I-22 6.00 3.84 2.72
7 I-23 5.85 7.33 5.22
8 I-24 5.00 21.52 15.29
9 I-25 5.91 5.49 3.95
The textural analysis of the samples from the affected area
shows (Table 1.10.4) a high percentage of sand. The
maximum percentage was shown by 6-WAY-(68.96%) and
minimum by K-42 (23.75%). The maximum percentage
of silt (46.82) was shown by K-40 and minimum (4.58%)
by 6-WAY. Higher values of clay 54.86% was indicated by
K42 and a lower value of clay (12.25%) was shown by K45.
XRD analysis was carried out on 5 samples collected from
Kasaragod (KSD), Kannur (KTM) and Wayanad (WAY)
soil samples. The XRD studies reveled that, gibbsite, zeolite
and kaolinite are more dominant followed by quartz.
Presence of gibbsite and other clay minerals enhance the
absorption capacity of soil. This indicates prominent
leaching material which confirms the erosional activity in
that region.
Mitigation: Management of surface and subsurface
hydrology is the one of the methods adopted to arrest the
soil piping process. Diverting water to the nearest naturally
occuring drains for rapid discharge will considerably reduce
the erosive power of the subsurface flow. However chemical
amelioration techniques are found to be one of the
effective methods to contain the erosion.
Labaratoray scale mitigation trials were experimented
using chemical amelioration techniques: Chemical
amelioration by adding gypsum (CaSO42H
2O) to improves
physical properties of sodic soils such as infiltration rate
and hydraulic conductivity in addition to decreasing excess
Na+ levels was studied. For this five soil sample of 20g
each collect from different piping location were tested by
adding gypsum at different amount (0.5g, 1g, 1.5g, 2g and
one free of gypsum); treated for 15hr. These trials showed
positive indications of slowing down of the dispersion
tendency. More tests are needed to calculate the rate of
change with addition of gypsum. Hydrated lime (calcium
hydroxide) has also been widely used to prevent piping.
Rates of application have varied depending on soils and
degree of compaction used in construction. Laboratory
testing usually indicates that only around 0.5 –1.0%
hydrated lime is required to prevent dispersion.
03-2014 and 05-03-2014 and 1 rock sample from
Kottathalachi mala on 19-03-2014 for further laboratory
examinations.

15
1
NC
ES
S A
nn
ual R
epo
rt 20
14
-’15
Cru
stal Pro
cesses
�
Table 1.10.4 Ternary diagram for classification of soil texture (USDA)
G. SankarFunding: NDMA, GoI
1.11 Surficial Earth Processes-Studies in the Sahyadris
Evaluation of landforms having close relation to regions
of active tectonics provide basic data for long-term
prediction of natural hazards especially landslides and
earthquakes. This is mainly due to the fact that tectonic
rates are reflected in rates and patterns of geomorphic
Fig. 1.11.1 A distant view of slope failure intiated in the lithomargic clayat the base of a deep laterite profile at Kadwad near Karwar.
Fig. 1.11.2 Road section near Medikeri shows the presence of a crack insteep road cutting that can develop as a potential surface of failure
Reconnaissance surveys: Traverses in
the Coorg region indicates the presence
of slope instability along the road
sections especially in Medikeri-Sullya
sector (Fig. 1.11.1), Subramania-
Kudrasthe sector and in the Shiradi
Ghat sector. Cutting and levelling of
steep hill facets in the northern part of
Medikeri town can trigger instability in
critical segments. The presence of fresh
down dip slickenslides on the foliation
planes in finely laminated gneisses near
Subrah mania, sheared metadolerites
filled with assymmetrically folded quartz
veins near Enjira on Bangalore-
Mangalore Highway and the presence of deep valley fill
deposits with terraces at different levels near Bhagmandla
processes and forms. In this context
reconnaissance surveys were carried out
in the Sahyadris and adjacent regions
falling in Karnataka and Maharashtra to
select few areas prone to landslides and
to elucidate geomorphology and
structural geology imprints along
suspected faults and lineaments.

16
NC
ES
S A
nn
ual
Rep
ort
20
14
-’1
5C
rust
al P
roce
sses
1
Landslide at Malin: Investigation of the landslide affected
Malin site shows that the failed surface is a rectilinear slope
of over 150 m height and >320 slope with an ill defined
hollow in the centre. The slope is moderately vegetated
and terraced cultivation is practised at least at two levels
on the slope. The overburden of 2-3 m thick is underlain
by blocky basaltic rock with N-S, E-W and subhorizontal
joints. Deep weathering along E-W planes is evident from
the profile. The crown region where the slip has been
initiated merges with the floor of an ephemeral drainage
channel that conducts water from a wide flat topped crestal
portion to the valley. Diversion of the overland flow from
the flat upper crestal portion into the drainage channel has
resulted in the channel exceeding its normal capacity leading
to oversaturation of the adjacent hollow portion and its
failure. The location of the dwelling units directly in the
path of the debris flow has resulted in the large number
of casualties. Another minor debris flow is seen on the
eastern side.
Landslide occurrence in Mahabaleswar region:
Detailed studies were carried out in the Mahabaleswar
region -mainly along the road sections- to document the
recent occurrence of landslides (Fig. 1.11.3) and to elucidate
the broad causative terrain factors to the region. Over sixty
landslide affected locations have been identified in the study
area. Most of the failed surfaces are the steep slopes of
road cuttings with little vegetation cover (Fig. 1.11.4). The
traverse from Mahabaleswar to Poladpur, Satara, Tapola
and Wai reveals the presence of many failures. Some of
the villages have also suffered by landslides.
Fig. 1.11.3 Landslides occure in Mahabaleswar region
are indicative of continuing tectonic activity
in this region. Critical segments of
instability were noted in the Agumbe Ghats
and on the way from Jog falls to Honnavar
and Bhatkal in Karnataka, Ambe Ghat near
Kolhapur, Patan Ghats and Mahabaleswar
in Satara district, Ingaloon, Ambegaon and
Khandala ghat areas in Pune district of
Maharashtra. The pattern of weathering
and erosion in the Deccan basalt region
leading to the formation of flat bottom
valleys flanked by long and steep side slopes
with terraces at different levels and the
presence of active lineaments are significant
in defining locales of possible landslides.
Fig. 1.11.4 Failed surfaces are the steep slopes of road cuttings with littlevegetation cover.
The annual average rainfall in this region is 600 cm making
it one of the wettest regions in the country. Bulk of this
rain is received in the month of July and August (430 cm),
when large number of landslide events are reported.
Though intense rainfall is a causative factor, the common
association of the affected sites to certain lithology,
landform and a higher level of human intervention was
noticed. Deccan basalt with multiple f lows of
Mahabaleswar, Ambenali and Poladpur formations form

17
1
NC
ES
S A
nn
ual R
epo
rt 20
14
-’15
Cru
stal Pro
cesses
Fig.1.11.5 Sub-horizontal flows in nature
Fig. 1.11.6 Distinct flow with red coloured weathered zoneFig. 1.11.7 Circular cracks have developed with creep damage in buildingsand cemented road, Bhekavali Village, Mahabaleswar, Satara, Maharashtra
John Mathai & G. Sankar
The dominant landform of the region is nearly flat topped
hills flanked by very steep slopes interrupted with terraces
of limited width at lower elevations (Fig. 1.11.5). The
terraces are the locations of the upper weathered part of a
flow that support vegetation while the steep slopes depict
massive basalts of the lower part of the flow that is either
barren or with sparse vegetation. The flat topped crestal
portions in Mahabaleswar region is characterised by
luxuriant vegetation that holds the soil and adds stability
to the upper surface. Landslide occurrences are more
common in areas where the red clay rich weathered zone is
exposed in a steeply sloping man made cutting with little
vegetation cover. In periods of intense rain, the water that
percolates through the joints are arrested by the weathered
red coloured clay rich zone that act as an impervious layer.
Some of the localities with settlement have been inferred
to be affected by landslides. In Bhekavali Village (170 54'
58" N, 730 41' 31" E) circular cracks have developed with
creep damaging four buildings and a cemented road (Fig.
1.11.7). The event initiated on 13th July, 2014 and continued
for eight days. The area with terraces at different levels,
mainly for cultivation, is being converted for settlement
and would require intervention for the stabilisation of the
region. Similalry past occurrence of landslides were noted
in Navli, Machutar, Tekavli, Erandal, Dhardev, Adhal,
Dhanavli, Rajni, Umbari, Par, Chikhali, Ghavri and
Yermukh Village all these areas need a detailed
investigations to delineate critical land failures.
the dominant lithology of the region. The flows are mostly
sub-horizontal in nature (Fig. 1.11.5). The upper most part
of a flow is distinct with a red coloured weathered zone
(Fig.1.11.6), underlain by an extremely vescicular layer. The
lower most part of the flow is often massive but with
subvertical arcuate joints mostly oriented NNW-SSE and
NNE-SSW.
When the cohesive strength of this clay rich layer exceeds
the pore water pressure, failure takes place. The presence
of vegetation cover adds to the strength resisting pore
pressure.

18
NC
ES
S A
nn
ual
Rep
ort
20
14
-’1
5C
rust
al P
roce
sses
1
As part of this study extensive fieldwork was carried out
the Idukki district and also collected secondary level data
from various village/panchayat/ taluk offices. Based on
the field observations and the inferences from the
secondary data, five panchayats having habitual occurrence
of landslide phenomena are identified for comprehensive
study. Analysis of spatial distribution and growth pattern
of population and analysis scope based Young’s formulae
are progressing.C. Ganapathy & K. Raju
Funding: Post -metric scholarship of the Scheduled
Caste Development Dept., Govt. of Kerala
1.13 Analysis of Natural Hazards along a Tropical
Highland basin with special emphasis on Flood and
Landslides: Panamaram Watershed, Wayanad district,
Kerala
Broad objectives of the study are to identify and assess the
physical factors that causes natural hazards, to analyse the
impact of landslides and flood on the environment, to
arrive at vulnerability of people living at hazard prone areas
and to evolve recommendations for the mitigation hazard
induced problems in the study area.
A reconnaissance survey was conducted in the study area
and visited various taluk/ panchayat offices, research
institutions and agriculture offices for collection of
secondary level data on the subject.
N. P. Ragi & K. Raju
Funding: UGC / JRF
1.12 Impact of Human activities in the generation of land
disturbances in Humid tropical highland areas - a study in
Idukki district, Kerala
This study aims to investigate the role of human activities
in the generation of land disturbances mainly in the form
of landslides in Idukki district, Kerala. The district is
characterized by dynamic land use changes due to
population pressure mostly in the form of migration. This
is one of the areas in Kerala where maximum deforestation
of tropical rainforests, with the consequent replacement
by plantation and settlement has taken place. Settlements
and cultivation have been extended even in the hazardous
slopes which in turn increased the risk factor of landslides.

19
2
NC
ES
S A
nn
ual R
epo
rt 20
14
-’15
Co
astal Pro
cesses
Coastal Processes
2.1 Integrated study on estuary, beach and innershelf
dynamics of west coast of India (Core program-I of CoP)
The integrated study on Estuary-Beach-Innershelf
Dynamics pertaining to the southwest coast of India
between Koyilandy and Puthiyapa in northern Kerala was
initiated in July 2014. The coast has a complex morphology
consisting of tidal inlets at Kadalundi, Beypore, Kallayi
and Elathur; coastal plains along the Beypore – Kozhikode
sector; promontories at Elathur and Kollam; seawalls along
Beypore-Kozhikode and Elathur-Koyilandi sectors; groins
at Kallayi and
Kappad and harbor
breakwaters at
Beypore, Vellayil,
Puthiyapa and
K o y i l a n d i .
Occurrence of
mudbanks was also
observed along the
Koyilandi-Kappad sector (Fig. 2.1.1).
�
Fig. 2.1.1 Location Map
During the
reconnoiter surveys,
16 beach
monitoring stations
were identified for
regular beach profile
measurements and
LEO observations.
Two major
m o r p h o l o g i c a l
sediment cells and
three sub-cells have
been identified in
the study area (Fig.
2.1.1). Mapping of
shoreline and other
geomorphological
features, sediment
and water sampling
and their analysis
for suspendedsediment load, texture, clay minerals, etc.,were carried out.
Sediment and water samples were collected from 8 locations
along two transects from the innershelf with depth ranging
from 4 to 13 m to understand the sediment characteristics
Table 2.1.1 Characteristics of surficial sediments and suspended sediment contents in thewater samples off Kozhikode during July 2014
· Developing a reliable methodology to use video
imaging for monitoring of beach-surf zone
morphodynamics and nearshore waves including
breaker wave-surf zone processes. Formulation of
methodologies to collect reliable real time data on
nearshore waves, wave breaking, surf zone waves,
rip currents, longshore currents, longshore bar,
rhythmic morphology and sediment characteristics
for beach-surf zone system.
· Developing prediction capabilities for nearshore
processes, nearshore sea state, wind-wave set up, etc.
· Study of near bed sediment dynamics in the surf
zone and enhancing the prediction capabilities of
nearshore sediment transport due to surf zone
currents.
· Mapping of sediment thickness and distribution in
the innershelf to obtain stratigraphic structure and
nature of bottom sediments.
· Measuring submarine ground water discharge
through field mapping to understand the fresh and
saline water interaction and mud suspension and its
role in the formation, cessation and dissipation of
mudbank.
The major objectives of the project are:
Tran-sect
Sample No.
Water Depth (m)
Sediment Type
Sediment Size (microns)
Heavy mineral (%)
Water Samples SSC (g/lt.)
Clay Minerals
I
1 4 Medium silt 13.12 7 0.01469 Kaolinite is dominant mineral with illite, gibbsite and chlorite as minor minerals
2 6.5 Coarse silt 16.90 1.02 0.02963
3 10 Medium silt 14.35 - 0.035319
4 12 Coarse silt 17.56 0.12 0.01469
II
5 13 Medium silt 13.10 4.54 0.018089
6 9.5 Very coarse silt 33.65 4.50 0.02297
7 7 Medium silt 12.06 7.33 0.035539
8 8 Fine sand 83.84 1.34 0.0408842
and distribution in the study area. Two sediment cores were
also collected. All the collected samples were analyzed for
suspended sediment concentration (SSC), texture and clay
minerals. (Table 2.1.1). Collected samples were also
prepared for chemical analysis. The process of
procurement of the same has been initiated. Based on the
reconnoiter study and suggestions of NCESS, in the last
RAC some of the envisaged objectives were fine tuned
within the core theme of the coastal processes group.

20
NC
ES
S A
nn
ual
Rep
ort
20
14
-’1
5C
oas
tal
Pro
cess
es
2
· Estimation of sediment flux in tidal inlet system
to develop hydrodynamic model for the system.The significance of understanding SGD in the Indian
context involves estimation of maximum pumping
possibilities and defining the limit of seawater intrusion in
the fresh-seawater interference zone. In short, such studies
help in assessing the optimum exploitation levels of coastal
fresh groundwater, locating feasible waste disposal sites in
coastal zone and estimating seaward pollution transport
levels. The objectives of study are (a) mapping the
horizontal and vertical extent of coastal aquifer in the area
between Koyilandi and Kadalundi, (b) demarcation of
hydrochemical facies and (c) determining temporal changes
in the dynamism of freshwater-salt water wedge.
Methodology adopted for the study includes direct
measurements using seepage meters and piezometers,
modeling, natural tracers using 222Rn, 226Ra, salinity, and
temperature, isotopes, and conventional hydrochemical
methods. In addition, water-balance approaches,
hydrograph separation techniques, and numerical
simulations have been widely applied for basin-scale
estimates of groundwater flow into the ocean. The methods
adopted for the present study are (i) digital analysis of
satellite data, (ii) EC measurements in coastal wells, (iii)
Resistivity sounding, SP and resistivity cross section profile
surveys in the interface zone, (iv) hydrochemical analyses,
(v) water table elevation surveys with respect to msl, and
(vi) groundwater modeling.
During the reporting period, we have
downloaded thermal band satellite images
for image processing, procured GMS
groundwater modelling software and
received training and conducted resistivity
surveys in the study area to understand the
hydrological layers and the nature of the
shallow aquifer. It was observed that the
sediment thickness in the area is more than
35m and the depth to water table is around
2m. Inspection of open wells in the coastal
zone under consideration indicated that the
area releases fresh groundwater to sea
during a considerable period of the year.
Two cross section profiles showing the
nature of aquifer along the beach as well as
at about 500m inland are provided in the
following figure (Fig. 2.1.2 & Fig. 2.1.3).
Measurement of Submarine Groundwater Discharge
(SGD) was carried out through field mapping and resistivity
surveys to understand the fresh and saline water interaction
and mud suspension in the nearshore waters. Normally
the ground water either fresh, saline or both that escapes
or recirculates from coastal margins into the marine
environment; it commonly occurs as seepage, submarine
springs, and tidally controlled groundwater discharge from
unconfined as well as artesian aquifers. The flow may be
driven by terrestrial hydraulic gradient, water level
differences across a permeable barrier, along with different
marine processes such as wave set up, tidally driven
oscillations, density-driven convections and thermal
convection. It acts as a pathway for material transport to
marine environment. Different processes that cause
significant impact on the hydrochemistry of surface and
subsurface discharges to marine environment can be human
use of surface water and groundwater for agricultural,
industrial and domestic purposes and subsequent waste
water treatment, reuse and disposal practices. The study
on SGD focuses particularly on discharge rate and also on
an amount of pollution loads into ocean.
Fig. 2.1.2 Map Showing the study area
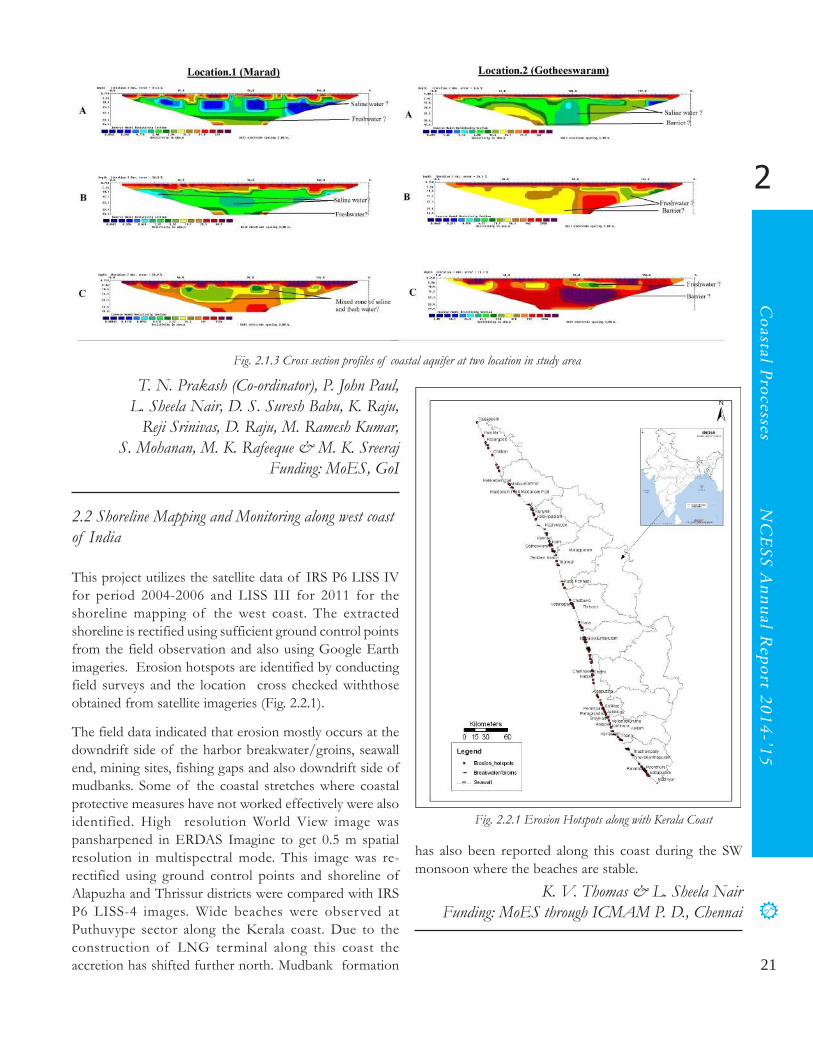
21
2
NC
ES
S A
nn
ual R
epo
rt 20
14
-’15
Co
astal Pro
cesses
T. N. Prakash (Co-ordinator), P. John Paul,
L. Sheela Nair, D. S. Suresh Babu, K. Raju,
Reji Srinivas, D. Raju, M. Ramesh Kumar,
S. Mohanan, M. K. Rafeeque & M. K. Sreeraj
Funding: MoES, GoI
Fig. 2.1.3 Cross section profiles of coastal aquifer at two location in study area
2.2 Shoreline Mapping and Monitoring along west coast
of India
This project utilizes the satellite data of IRS P6 LISS IV
for period 2004-2006 and LISS III for 2011 for the
shoreline mapping of the west coast. The extracted
shoreline is rectified using sufficient ground control points
from the field observation and also using Google Earth
imageries. Erosion hotspots are identified by conducting
field surveys and the location cross checked withthose
obtained from satellite imageries (Fig. 2.2.1).
�
Fig. 2.2.1 Erosion Hotspots along with Kerala Coast
The field data indicated that erosion mostly occurs at the
downdrift side of the harbor breakwater/groins, seawall
end, mining sites, fishing gaps and also downdrift side of
mudbanks. Some of the coastal stretches where coastal
protective measures have not worked effectively were also
identified. High resolution World View image was
pansharpened in ERDAS Imagine to get 0.5 m spatial
resolution in multispectral mode. This image was re-
rectified using ground control points and shoreline of
Alapuzha and Thrissur districts were compared with IRS
P6 LISS-4 images. Wide beaches were observed at
Puthuvype sector along the Kerala coast. Due to the
construction of LNG terminal along this coast the
accretion has shifted further north. Mudbank formation
K. V. Thomas & L. Sheela Nair
Funding: MoES through ICMAM P. D., Chennai
has also been reported along this coast during the SW
monsoon where the beaches are stable.

22
NC
ES
S A
nn
ual
Rep
ort
20
14
-’1
5C
oas
tal
Pro
cess
es
2
2.3 Establishment and Maintenance of Wave Gauge
Stations in the Coastal Waters of the SW coast of
India
The project was taken up in collaboration with the ESSO-
INCOIS, Hyderabad. The main objective of this project is
to establish and maintain wave gauges at selected locations
along the Kerala coast for the collection of site specific
real time wave data for validation of the daily Ocean State
Forecast (OSF). As part of this programme, the first Wave
Rider Buoy (WRB) was deployed off Valiathura coast in
Trivandrum during May 2011 and this was later shifted to
Kollam in May 2012. The second station was established
off Kozhikode coast in northern Kerala on 26th April, 2013.
At both the locations, shore stations have been set up for
the reception of HF data from the WRB.
The methods currently being adopted for the dissemination
to the coastal community includes providing site specific
OSF through e-mails to the user and also through news
bulletin of the All India Radio (AIR). At present the AIR
broadcasts site specific OSF for five important coastal
locations of Kerala viz. Trivandrum, Kollam, Aleppey,
Cochin and Kozhikode is being continued twice a day both
in the morning and evening. The mobile phone based OSF-
SMS facility (text as well as voice message in Malayalam)
for the coastal community of Kozhikode is also continuing.
�
(a) Kollam-Fair Season
(b) Kollam-Rough Season
(c) Kozhikode-Fair Season
(d) Kozhikode-Rough Season
Fig. 2.3.1 Average spectral energy density for (a & b) Kollam and (c & d)Kozhikode for the fair and rough seasons during 2014
On comparison of the wave climate off Kollam and
Kozhikode it can be seen that during the rough season the
sea condition at both the locations is dominated by the
westerly swell waves. But the influence of locally generated
wind waves was more pronounced for the Kozhikode coast
compared to that of Kollam (Fig. 2.3.1). The total energy
level at both the locations was found to be more or less of
the same magnitude. This study also provides the
observational evidence of Shamal waves along the Kerala
coast (Fig. 2.3.2). The effect was found to be more
pronounced for the north Kerala coast compared to south
Kerala. During the Shamal event mixed sea condition was
observed indicating the co-existence of locally generated
wind waves from the northwest direction and southerly
swells. Even though a reduction in the peak wave period
was observed during the event, the total energy more or
less remained the same as the spectrum became broader
due to the effect of local wind waves.
L. Sheela Nair
Funding: MoES, GoIThe real time wave data from the WRB’s off Kollam and
Kozhikode are also being used for validation of the site
specific daily forecast. The statistical error estimates are
computed at regular intervals by comparing the forecast
data with the measured values. The data set will also be
used for the core programme of Integrated study on
Estuary Beach and Innershelf Dynamics of the west coast
of India carried out by the Coastal Processes Group of
NCESS.
(a)
(b)
Fig. 2.3.2 Spectral energy density showing the effect of Shamal wind off(a) Kollam and (b) Kozhikode during 2014
2.4 Study of Impact of Sea Level Rise along Kerala
coast
The study on ‘Impact of sea level rise along Kerala coast’
sponsored by the Department of Environment and Climate
Change (DECC), Govt. of Kerala addresses the following
major objectives.
1. Assessment of areas of probable inundation due
to projected SLR along the coast and including
overbank areas and backwaters

23
2
NC
ES
S A
nn
ual R
epo
rt 20
14
-’15
Co
astal Pro
cesses2. Identification of impact zones in the form of
salinity ingress, vulnerable ecosystems and
infrastructure including possible damages to
coastal protection measures
3. Assessment of damages to flora, fauna and
habitats and impacts on livelihood requirements
and activities due to changes in physical parameters
like salinity
4. Assessment of economic implications of impacts
such as loss of land and infrastructure, livelihood
activities, modifications to wetland systems,
groundwater contamination due to salinity, etc.
5. Assessment of financial implications to adaptation
strategies and mitigation measures
Realistic assessment of possible inundation of the coastal
areas due to the projected SLR is dependent on the accuracy
of the contour maps of the coastal zone. The MoEF &
CC is in the process of generating Digital Elevation Maps
(DEM) of 0.5 m accuracy through Survey of India. The
accuracy of 0.5 m is proposed for hazard line mapping by
MoEF. This will be cross-checked with available elevation
data including SRTM elevation data and updated with
primary DGPS surveys. Maximum inundation limits will
be arrived with the help of GIS computation. Shoreline
data, land use, landform/morphology and assets/
infrastructure will be derived from high resolution satellite
imageries and toposheets which will be fine-tuned with
GPS-based field observations. Some of the archival data
available with different organizations including NCESS,
PWD, Town Planning Dept., etc., will also be utilized.
Coastal land has multiple and competing uses. All the
economic activities in the affected zone will be listed and
extent of damage in each case including tourism will be
worked out. Socio-economic activities in the coastal zone
are performed by people living in-situ and also ex-situ. The
coastal zone acts as main thorough fare by housing NH
and Railways to link the Kerala State with outside. The
study will capture all aspects like fisheries, agriculture,
aquaculture, tourism, ports, etc., to create respective impact
scenario and compute socio-economic impacts. These data
will be projected on a GIS platform which will make it
easy to transfer the data to inundation maps. Once these
are projected on inundation maps, the strategies for action
plans for adaptation and mitigation could be evolved.
Financial implications for loss, mitigation and adaptation
would form the final deliverables.
Regarding the progress of the work during the reporting
period, the study area was subjected to microlevel
geomorphological mapping in terms of (a) coastal plains,
barrier beaches and spits ; (b) sandy beaches ; (c) tidal inlets,
estuaries and backwaters ; (d) sea walls ; (e) headlands and
pocket beaches ; (f) vegetated coasts and (g) backwater
islands. Subsequently, morphological hotspots of SLR and
coastal landuse distribution patterns were identified.
Detailed DGPS surveys are being conducted to generate
contour lines of elevation along the coastline as well as
along the backwater banks. The mapping of already affected
zones of salt water ingress are also planned during these
GPS campaigns.
The work plan is as follows: Digital Elevation Model
(DEM) of the land area will be generated using elevation
values of contours and spot heights and primarily surveyed
Ground Control Points (GCPs) using DGPS. Tide contours
will be generated with high water level values to map the
maximum area of inundation, pertaining to the current
spring tide position and will be represented on map.
Georeferenced topographic maps and high resolution
satellite images will be used as spatial references to plot
the present land-sea interface at high spring tide as well as
the probable inundation areas with respect to sea level rise
(high tide) of 0.5m, 1m and 1.5m. The predicted inundation
area in km2 at different SLR will be calculated using GIS.
P. John Paul & D. S. Suresh Babu
Funding: Department of Environment and
Climate Change, GoK
2.5 Coastal Zone Management Plan for Kerala
The coastal policy of the Government of India and the
coastal states is to develop the coastal regions of the country
within the framework of Integrated Coastal Management
Plans (ICMP). This will ensure the utilisation of coastal
resources to its optimum potential and to sustain the
functional integrity of coastal ecosystems. This approach
will also help to contain, to a certain extent, the impact of
coastal hazards to coastal communities and properties. The
CRZ notifications intend to achieve the above objective
through providing a framework for ICZMP. Regulating high
impact activities in the coastal zone through CRZ is one
of the effective tools in this endeavour. It was with this
objective the Coastal Regulation Zone (CRZ) Notification
(MoEF, 2011; 1991) was introduced in the country. The
Coastal Regulation Zone (CRZ) notification of 2011 has
made it mandatory for the State to prepare Coastal Zone
Management Plan (CZMP) as per the guidelines in the
notification and get it approved by the Govt of India.
Accordingly the preparation of the CZMP has been
entrusted with the National Centre for Earth Science

24
NC
ES
S A
nn
ual
Rep
ort
20
14
-’1
5C
oas
tal
Pro
cess
es
2
T. N. Prakash (Co-ordinator), P. John Paul,
L. Sheela Nair, D. S. Suresh Babu, K. Raju,
Reji Srinivas, D. Raju, M. Ramesh Kumar,
S. Mohanan, M. K. Rafeeque & M. K. Sreeraj
Funding: KSCSTE, GoK
Table 2.5.1 Coastal Zone Management Plan for Kerala in differnt stages of progress
District World View Image
Rectification
HTL Delineation
Morphology Delineation
HTL buffering and CRZ
categorization
Proposed Work
Kottayam Completed Completed Completed Completed
Field Verification of
HTLcompleted.
Ernakulam Completed Completed In Progress In Progress
Trissur Completed Completed Completed Completed
Malappuram Completed Completed Completed Completed
Kozhikkode Completed Completed Completed Completed
Kannur Completed Completed Completed Completed
Kasaragod Completed Completed Completed Completed
Alappuzha Draft CZMP in 1:25000 scale submitted KSCSTE Kollam Draft CZMP in 1:25000 scale submitted KSCSTE Thiruvananthapuram Draft CZMP in 1:25000 scale submitted KSCSTE
During the reporting period CZMP of three districts viz.,
Thiruvanathapuram, Kollam and Alleppey in 1:25000 scale
were finalized and submitted to KSCSTE, Government
of Kerala. The CZMP maps for the other six districts viz.,
Kasargod, Kannur, Kozhikode, Malappuram, Thrissur and
Kottayam are in different stages of progress (Table 2.5.1).
The first draft of CZMP map of 6 districts will be submit-
ted to KSCSTE in July/August, 2015. The cadastral data
base of all the districts are also being generated simulta-
neously along with the 25,000 scale map.
Studies (vide reference STED S.O (M.S) No. 02/2014/
STED dt. 10.03.14 and Council (P) Order No. 356/2014/
KSCSTE dt.30.04.2014).

25
3
NC
ES
S A
nn
ual R
epo
rt 20
14
-’15
Atm
osp
heric P
rocesses
Atmospheric Processes
3.1 Intensity, Duration, Frequency Analysis of Precipi-
tation Microphysical Parameters of South-west Monsoon
Rain, 2014 at a High Altitude Station on the Western
Ghats
Intensity, duration and frequency analysis of rain in 2014
South West monsoon season was conducted. A laser optical
disdrometer (PARSIVEL) along with a manual rain gauge
is used for the present study. Rain intensity was classified
as per the norms of World Meteorological Organisation
(WMO) and further analysis was carried out in these
classified intensity ranges (Table 3.1.1). One minute average
data from a high altitude station (Braemore, Lat. 8.76
Long.77.07 600 ASL) on western slopes of the Western
Ghats is used for the present work. For validation and cross
comparison daily rain water intensity is compared with a
manual rain gauge observation.
Rain Type Range Intensity class
Drizzle
RI < 0.1 mm/h Light
0.1 ≤ RI < 0.5 mm/h Moderate
RI ≥ 0.5mm/h Heavy
Rain
RI < 2.5 mm/h Light Light
2.5 ≤ RI < 10.0 mm/h Moderate
10.0 ≤ RI < 50.0 mm/h Heavy
RI ≥ 50.0 mm/h Violent
�
�
�
Table 3.1.1 World Meterological Organisation’s (WMO) classification ofrain intensity.
Being a tropical region in a heavy rain prone area we
introduced two more intensity ranges 50 d” RI < 100 mm/
h and RI e” 100 mm/h for the present study and each
intensity bins are designated as R1, R2, R3, R4, R5, R6 &
R7. Mean drop diameter, Dm is also divided into equaly
spaced 20 bins of width range 0.25-Dm20. Regarding rain
drop number, Nt is classified as follows. Ranges 10 d” Nt
< 100 and 100 d” Nt < 500 are designated as
N1 & N2 respectively. Then from 500 upto
5000 Nt is equally divided into 9 bins of bin
width 500. So there are 11 Nt bins in total.
Daily rain fall data from optical laser
disdrometer is cross checked with manual rain
gauge observation and found to be reliable
(Fig. 3.1.1). The frequency of occurance of
rain is decreasing more or less linearly from
lower range bins to higher range (Fig. 3.1.4).�
�
Fig. 3.1.2 Mean RI, Dm and Nt in each intensity bins
Average values of rain intensity, drop diameter and drop
number in each of the intensity bins are calculated and
ploted in Fig. 3.1.2. Average values increase linearly from
low range bins to higher bins. So for higher rain intensity
durations number and size of rain drops are also.
Contribution of accumulated water from RI, Dm and Nt
bins are calculated and ploted in Fig. 3.1.3. About 45%
(300mm out of 693 mm) of total rain water is contributed
by the intensity range R5 (5-10 mm/h, heavy rain as per
WMO norms). Another 40% is jointly contributed by
ranges R4 & R6 mm/h. Eventhough the frequency of
occurance is higher in the low intensity ranges, contribution
of accumulated water is high from middle order ranges
and not from high and low range intensity ranges. Even
R4 and R5 are contributing equally, contribution fron R5
�
Fig. 3.1.1 Cross comparison of Disdrometer reading with Manual RainGauge
So maximum number of occurances of Rain Intensity (RI),
Drop mean Diameter (Dm) and Number of drops (Nt)
are in lower bins during the study period (Southwest
Monsoon, 2014). A notable difference from the other two
graphs, histogram of Dm shows maximum frequency is in
the second bin of range 0.5-0.75 mm.

26
NC
ES
S A
nn
ual
Rep
ort
20
14
-’1
5A
tmo
sph
eric
Pro
cess
es
3
�
Fig. 3.1.3 Accumulated rain water from Dm, RI and Nt bins
R. Ajayakumar Varma
Funding: MoES,GoI
is from a shorter time period since it is a higher intensity
range.
Total water contribution from mean diameter bins revealed
that about 65% of total rain water is from Dm bins Dm5,
Dm6, Dm7 and Dm8 covering 1.25 mm to 2.25 mm drop
diameter. Last bin Dm > 5 also contributed 20 mm rain to
the total. Here also the major contribution to total rain
from Dm bins is from middle order bins and not from low
and higher ranges.
Regarding number of drops (Nt), about 55% of rain water
is from ranges Nt3, Nt4 and Nt5 covering 500-2000 drops.
i. e. during 55% of total rain number of rain drops is varying
between 500 and 2000. Last Nt bin Nt11 (Nt > 5000) also
contributed 47 mm (7%) to the total rain water. With these
collective information of rain intensity, raindrop number
and drop diameter, we can conclude nature of rain in a
rainy seaon. Present work is confined to 2014 Southwest
monsoon season and can be extended to other seaons also.
3.2 Modelling Atmospheric Pollution and Networking
(MAPAN)
The Indian Institute of Tropical Meteorology (IITM),Pune
has initiated an air quality monitoring and atmospheric
pollution modelling project with the objectives of setting
�
0
10
20
30
40
50
60
0:00
1:00
2:00
3:00
4:00
5:00
6:00
7:00
8:00
9:00
10:00
11:00
12:00
13:00
14:00
15:00
16:00
17:00
18:00
19:00
20:00
21:00
22:00
23:00
������������ ��
����
Annual
Summer�(MAM)
monsoon�(JJAS)
Postmonsoon(ON)
Winter�(DJF)
Fig. 3.2.1 Diurnal and seasonal variation of surface ozone during March2014 – February2015
�
Fig. 3.1.4 Frequency of rain occurance in RI, Nt and Dm bins
up air pollution monitoring stations
at selected strategic locations in
India to continuously monitor
pollutants and weather parameters
to address question related short
term climate change and its impact.
As a part of this, a station has been
established in NCESS campus at
Thiruvananthapuram in 2013 with
NCESS as a collaborator. The entire
instrumental set up has been provided by
IITM. Monitoring of the parameters has
commenced from March 2014. The station
monitors 18 air pollution and weather
parameters and the data is shared online with
IITM. The station is equipped with all the
necessary analysers such as Beta Attenuation
Monitor for Suspended Particulate Matter
(PM10
& PM2.5
), Serinus-10 Ozone Analyzer,
Serinus-30 CO Analyzer, Serinus-40
NOxAnalyzer, Alpha 115 Hydro Carbon Analyzer, Black
Carbon Analyzer required for Ambient Air Quality
monitoring; calibration equipment - Hydrogen Generator
and Zero Air Generator, Gas Calibration System; data
acquisition hardware and software with complete power
backup; Met Sensor for monitoring Ambient Temperature,
Relative Humidity, Barometric Pressure, Solar Radiation,
Rain Gauge, Wind Speed, Wind Direction.
The station continuouly records Particulate Matters
(PM10
&PM2.5
), Carbon Monoxide(CO), Carbon Dioxide
(CO2), Surface Ozone (O3),Oxides of Nitrogen
(NO,NO2,NO
x),Methane (CH
4),Non methane Hydro
Carbon (NMHC), Black carbon (BC) Ambient
Temperature, Relative Humidity, Barometric Pressure, Solar
Radiation, Rain Gauge, Wind Speed and Wind Direction.
Diurnal, seasonal and annual variability in surface ozone
(O3) concentrations over NCESS have been studied from
March 2014-February 2015 in the light of changes in

27
3
NC
ES
S A
nn
ual R
epo
rt 20
14
-’15
Atm
osp
heric P
rocesses
�
0
0.1
0.2
0.3
0.4
0.5
0.6
0
1
2
3
4
5
6
7
8
9
10
0:00
1:00
2:00
3:00
4:00
5:00
6:00
7:00
8:00
9:00
10:00
11:00
12:00
13:00
14:00
15:00
16:00
17:00
18:00
19:00
20:00
21:00
22:00
23:00
��������
�������
� ��
Nox CO
Fig. 3.2.2 Diurnal variation of CO and NOx during March 2014 –
February 2015
The ozone precursors, NOx and CO, show (Fig. 3.2.2) an
almost opposite diurnal variation to Ozone characterized
by high concentrations during night and morning and low
concentrations during day time, especially noon and
afternoon. Each pollutant has two main peak concentration
levels; the first peak appears in the morning rush hours
(6:00 - 9:00); the second one appears around late night
(22:00 - 2:00), but for CO, the second one, appears around
midnight (21:00 - 1:00).
�
0
10
20
30
40
50
60
0:00
1:00
2:00
3:00
4:00
5:00
6:00
7:00
8:00
9:00
10:00
11:00
12:00
13:00
14:00
15:00
16:00
17:00
18:00
19:00
20:00
21:00
22:00
23:00
�������������� ��
��
�����
PM2.5
PM10�
Fig. 3.2.3 .Diurnal variation of PM10
and PM2.5
during March 2014–February 2015
Diurnal variation of PM10
and PM2.5
shows similar pattern
of variation (Fig. 3.2.3). Both the particulate matter
concentration gradually increase just an hour after sun rise
in the morning.The build-up of local anthropogenic
activities associated with higher traffic density is responsible
for this peak. The morning high concentration, low
concentration at mid-afternoon hours and nocturnal peak
value also attributed with atmospheric boundary layer
(ABL) dynamics. In the evening, the concentration of both
particulates matter increased gradually due to local
anthropogenic activities and increased traffic density. The
diurnal variation of PM10
and PM2.5
with wind speed shows
an inverse relationship. The monthly variations of PM10
and PM2.5
show that high value occurs in summer and low
values during the monsoon months. This is due to the wet
removal of aerosols by extensive monsoon rains and
stronger monsoon winds.
Fig. 3.2.4 Monthly variation of temperature, relative humidity and
wind speed
Fig. 3.2.5 Monthly variation of rainfall
Concentration of particulate matter shows an inverse
relationship with wind speed. During night the mean wind
speed has been generally slow (1-2.5 m/s) and nocturnal
boundary layer has been shallow resulting low ventilation
coefficient (defined as product of boundary layer height
and horizontal wind speed).This had caused confinement
of particle and increase in concentration during early night
period. As day progresses ,the wind speed increases and
also release of solar heating of land. This results in
increased convective activity leading to an increase in
meteorological parameters like solar radiation, temperature,
and relative humidity (RH). The annual average diurnal
profile of O3 showed (Fig. 3.2.1) a peak (35.92 ppb) at
13.00 hrs afternoon and minimum of (9.31ppb) in the early
morning. Surface ozone exhibits a distinct seasonal variation
over this site. Among the maximum concentration, the
highest value of O3 was found in summer (56.09 ppb) and
lowest during monsoon (8 ppb). The correlation coefficient
of O3 concentration with relative humidity, wind speed and
temperature were 0.98, 0.96 and 0.97respectively during
the period of observation. It is evident that O3 variation is
directly correlated to temperature and solar radiation and
is inversely related to relative humidity.
�
0
50
100
150
200
250
���������������� �
��
Fig. 3.2.6 Monthly variation of solar radiation

28
NC
ES
S A
nn
ual
Rep
ort
20
14
-’1
5A
tmo
sph
eric
Pro
cess
es
3 R. Ajayakumar Varma
Funding: MoES, GoI
boundary height and faster dispersion of particulate
matters.
The average weather parameters like relative temperature,
humidity, wind speed, rainfall and solar radiation during
observation period are depicted in (Fig. 3.2.4 - Fig. 3.2.6).

29
4
NC
ES
S A
nn
ual R
epo
rt 20
14
-’15
Natu
ral Reso
urces an
d E
nv
iron
men
talM
anag
emen
t
Natural Resources and EnvironmentalManagement
4.1 Water Resources
4.1.1 Appraisal of drinking water potential of springs in
Pathanamthitta, Kottayam and Idukki districts of Kerala
19�
Fig. 4.1.12.1 Trend showing the total nitrogen concentration Presence of pathogenic coliforms noticed in certain spring waters in three clusters which prevailing the unhealthy human interaction. In Idukki the spring water near the spices cultivation noticed with coliforms populations. At Kottayam the pollution indication concentrated towards urban areas. The pilgrim activities prevails the unhealthy conditions of spring and ground water especially in the areas of Erumeli, and Pampa. The unscientific land use resulted the deterioration of the spring water in all the study areas. In the present study, 20% of the observed spring resources are on verge of destruction. The average microbial health Indicator population is given in Fig. 4.1.13.2)
Fig. 4.1.12.2 Average Microbial health indicator population Much of the enormous water resources remain unutilized and most of them are natural springs and spring fed wetlands. These are getting dried up due to the absence of proper traditional water resource management. The present study revealed that the quality of spring waters in the three districts and importance of rejuvenation of traditional ground water resources for the sustainability of the ecosystem. The implementation of community water management schemes with maximum people’s participation is the suitable option to mitigate all the ill effects of water resource management.
Dr.Anoop Krishnan
Fig. 4.1.1.1 Trend showing the total nitrogen concentration
19�
Fig. 4.1.12.1 Trend showing the total nitrogen concentration Presence of pathogenic coliforms noticed in certain spring waters in three clusters which prevailing the unhealthy human interaction. In Idukki the spring water near the spices cultivation noticed with coliforms populations. At Kottayam the pollution indication concentrated towards urban areas. The pilgrim activities prevails the unhealthy conditions of spring and ground water especially in the areas of Erumeli, and Pampa. The unscientific land use resulted the deterioration of the spring water in all the study areas. In the present study, 20% of the observed spring resources are on verge of destruction. The average microbial health Indicator population is given in Fig. 4.1.13.2)
Fig. 4.1.12.2 Average Microbial health indicator population Much of the enormous water resources remain unutilized and most of them are natural springs and spring fed wetlands. These are getting dried up due to the absence of proper traditional water resource management. The present study revealed that the quality of spring waters in the three districts and importance of rejuvenation of traditional ground water resources for the sustainability of the ecosystem. The implementation of community water management schemes with maximum people’s participation is the suitable option to mitigate all the ill effects of water resource management.
Dr.Anoop Krishnan
Fig. 4.1.1.2 Average Microbial health indicator population
K. Anoop Krishnan
Funding: KSCSTE, GoK
4.1.2 Hydrological modelling of Greater Cochin urban
agglomerate in the context of Sustainable Urban Water
Resource Development
The study area comprises of Cochin (Kochi) as well as all
the major towns towards north of Cochin within
Ernakulam district along the national highway (NH47). This
study envisages providing insights in to the amount of
alteration due to urbanization in the hydrologic system.
The programme involves seasonal monitoring of water
quality parameters (physico-chemical and biological) of
highland springs in the central Kerala (Pathanamthitta,
Kottayam and Idukki districts). A total of 64 springs was
identified and studied. The study area lies between 90°3’ &
10°23’ North Latitudes and 76°37’ & 77°30’ East Longi-
tudes and covers nearly 9995 km2in Central Kerala. The
area falls within the western flanks of Southern Western
Ghats Region covering Pathanamthitta, Kottayam and
Idukki districts.
Conventional water resources are at the verge of
destruction due to various anthropogenic activities.
Agricultural activities have an important role in the
deterioration of ground water quality. The areas of Idukki
nourished with plenty of perennial spring water resources
which are remained relatively untapped to its full potential.
Majority of the springs falls under perennial category.
Springs of both flow type and pond type are identified in
the area. Selected spring water samples from Kottayam,
Idukki and Pathanamthitta were studied for microbiological
and hydrogeochemical characteristics. The chemical quality
of water satisfies BIS/WHO drinking water specifications
except pH, which showed acidic characteristics in certain
springs of Idukki region. In general the springs have
conductivity values less than 100µS/cm indicating low range
of dissolved salts in water. The major ion concentrations
are in the order of Ca (03-3.97mg/l), Mg (0.5-1.84mg/l),
Na (1.3-1.79mg/l), Fe (60.0-67.88 µg/l)Cl (22.22-31.70mg/
l), and NO3 (1752.10-1879.52 µg/l (Fig. 4.1.1.1). All the
values are well below the permissible limits.
Presence of pathogenic coliforms noticed in certain spring
waters in three clusters where unhealthy human interac-
tion exists. In Idukki the spring water near the spices culti-
vation areas shows coliforms populations. The spring and
ground water especially in the areas of Erumeli, and Pampa
are polluted due to pilgrim activities. In the present study,
20% of the observed spring resources are on verge of
deterioration. The average microbial health Indicator popu-
lation is given in Fig. 4.1.1.2.
Most of the spring water resources remain unutilized/
under-utilized. A scientific water resource management is
highly needed for effectively using these precious spring
resources. The present study revealed that the quality of
spring waters in the three districts and importance of
rejuvenation of traditional ground water resources for the
sustainability of the ecosystem. Throughout the study area,
it has been observed that people’s participation is inevitable
in preserving the spring resources. So far, the end users
are not aware about the quality as well as the ways of
protection of these resources.

30
NC
ES
S A
nn
ual
Rep
ort
20
14
-’1
5N
atu
ral
Res
ou
rces
an
d E
nv
iro
nm
enta
lM
anag
emen
t
4
Fig. 4.1.2.1 Water depth contour fluctuation of post monsoon season in
1981 and 2014 (CGWB data)
Monthly monitoring of ground water table in selected wells
is carried out for determine changes with respect to time
and rainfall rate. The effect of fast growing urban life in
the ground water recharge will clearly understood through
this method.
Water samples were collected from 60 selected locations
including dug wells and surface water bodies. The insitu
physical parameters like pH, mV, TDs, resistivity,
conductivity, DO and temperature were measured during
sampling. The chemical analysis for carbonate, sulphate,
phosphate, chlorite, nitrate, calcium, magnesium and
hardness are carried out. Hydrogen- ion concentration (pH)
of the collected water samples of coastal area ranges from
5.68 to 7.14. In most of the areas the pH level goes beneath
the standard quality especially in midland areas where it
varies from 3 to 5.87 showing the water is more acidic. The
pH of Surface water samples are between 3.96 and 8.4.
Even though the district receives very good rainfall of about
3400 mm annually it is paradoxical that acute water scarcity
is felt in certain areas. Another important problem is salt
water intrusion.
Fig. 4.1.2.2 Concentration of nitrate and chloride in wells and ponds of the study area.
Chloride occurs to only a limited extent under normal
conditions. The important sources of chloride, however,
are from sewage, connate water, and intruded sea water. In
the study area chloride is showing a highest value of 128mg/
l in the Thattapalli river sample. In the coastal ponds
because of the sea water influence, chloride shows a higher
value with respect to other surface water bodies.
Hardness results from the presence of divalent metallic
cations, of which calcium and magnesium are the most
abundant in ground water. Low pH condition leads to the
solution of insoluble carbonates in the soil soluble
bicarbonates. Contents of limestone, such as sulfates,
chlorides, and silicates are dissolved and the hard water is
originated in areas where thick topsoil overlie limestone
formations. In the present study the dug well and surface
water samples are soft to moderately hard, though river
sample hardness is falls near to very hard water class.
Phosphate is a minor constituent as a dissolved solid in
potable water. Phosphate is commonly seen as 0.0001 –
0.1 mg/l and is within the desirable limit.
Reji Srinivas
Monthly monitoring of ground water table in selected wells is carried out for determine the changes with respect to time and rainfall rate. The effect of fast growing urban life in the ground water recharge fluctuationwill clearly understood through this method. The present ground water table level data (2014-15) is used to prepare water depth contours (Fig. 4.1.7.2.1) and it is compaired with previous datas from CGWB of 1981, 2005 and 2010 of both pre and post monsoon seasons. Water samples were collected from 60 selected locations including dug wells and surface water bodies. The insitu physical parameters like pH, mV, TDs, resistivity, conductivity, DO and temperature were measured during sampling. The chemical analysis for carbonates, sulphate, phosphate, chlorite, nitrate, calcium, magnesium and hardness are carried out. Hydrogen- ion concentration (pH) of the collected water samples of coastal area ranges from 5.68 to 7.14. In most of the areas the pH level goes beneath the standard quality especially in mid land areas where it varies from 3 to 5.87 showing the water is more acidic. Majority of surface water samples are within the drinking quality limit of 3.96 to 8.4. TDS values are high in coastal areas varies from 2 – 847 mg/l, but in midland areas its values changing from 45 to 301 mg/l, and in NH side it is 69 to 644 mg/l. It is noticed that the highest values are nearby back water and coastal areas. The major sources for nitrate in the ground water are atmosphere, legumes, plant debris, and animal excrement. A maximum concentration for nitrate in the coastal area is 39.54mg/l (Fig: 4.1.7.2.2). Some locations in the NH side and midland areas showing values above the standard limit, but in surface water bodies the nitrate concentration is below specified standard values.
4.1.7.2.2 Average Concentration changes of Nitrate and Chloride in wells and ponds.
Chloride occurs to only a limited extent under normal conditions; important sources of chloride, however are from sewage, connate water, and intruded sea water. In the study area chloride is showing a highest value of 128mg/l in the Thattapalli river sample. In the coastal ponds because of the sea water influence, chloride shows a higher value with respect to other surface water bodies.
0
10
20
30
40
Coastal�
Wells
Urban�
Wells
Rural�
Wells
Coastal�
ponds
Rural�
ponds
Urban�
Ponds
���������
Nitrate,�mg/l
Chloride.�mg/l
TDS values are high in coastal areas are varing from 2 to
847 mg/l. But in midland areas the values chang from 45
to 301 mg/l, and in NH side it varies from 69 to644 mg/l.
The major sources for nitrate in the ground water are
atmosphere, legumes, plant debris, and animal excrement.
Maximum concentration for nitrate in the coastal area is
39.54mg/l (Fig: 4.1.2.2). Some locations in the NH side
and midland areas show values above the standard limit,
but in surface water bodies the nitrate concentration is
below specified standard values.
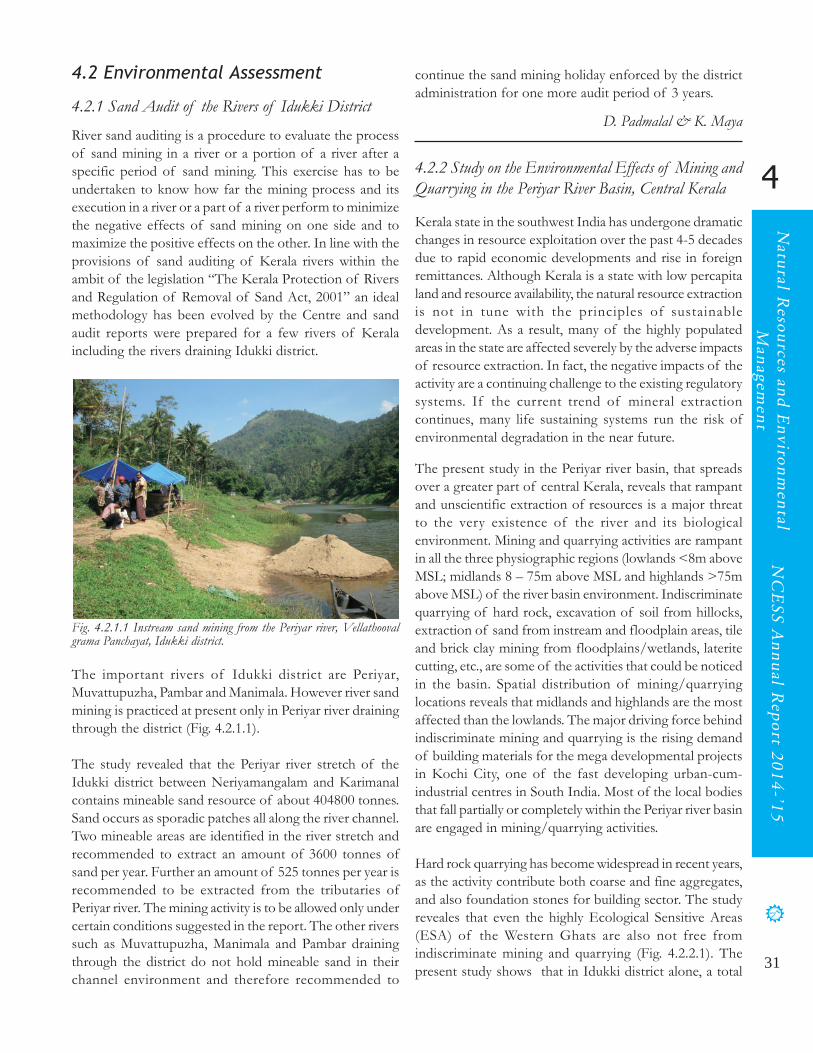
31
4
NC
ES
S A
nn
ual R
epo
rt 20
14
-’15
Natu
ral Reso
urces an
d E
nv
iron
men
talM
anag
emen
t
4.2 Environmental Assessment
4.2.1 Sand Audit of the Rivers of Idukki District
River sand auditing is a procedure to evaluate the process
of sand mining in a river or a portion of a river after a
specific period of sand mining. This exercise has to be
undertaken to know how far the mining process and its
execution in a river or a part of a river perform to minimize
the negative effects of sand mining on one side and to
maximize the positive effects on the other. In line with the
provisions of sand auditing of Kerala rivers within the
ambit of the legislation “The Kerala Protection of Rivers
and Regulation of Removal of Sand Act, 2001” an ideal
methodology has been evolved by the Centre and sand
audit reports were prepared for a few rivers of Kerala
including the rivers draining Idukki district.
Fig. 4.2.1.1 Instream sand mining from the Periyar river, Vellathoovalgrama Panchayat, Idukki district.
The important rivers of Idukki district are Periyar,
Muvattupuzha, Pambar and Manimala. However river sand
mining is practiced at present only in Periyar river draining
through the district (Fig. 4.2.1.1).
The study revealed that the Periyar river stretch of the
Idukki district between Neriyamangalam and Karimanal
contains mineable sand resource of about 404800 tonnes.
Sand occurs as sporadic patches all along the river channel.
Two mineable areas are identified in the river stretch and
recommended to extract an amount of 3600 tonnes of
sand per year. Further an amount of 525 tonnes per year is
recommended to be extracted from the tributaries of
Periyar river. The mining activity is to be allowed only under
certain conditions suggested in the report. The other rivers
such as Muvattupuzha, Manimala and Pambar draining
through the district do not hold mineable sand in their
channel environment and therefore recommended to
D. Padmalal & K. Maya
4.2.2 Study on the Environmental Effects of Mining and
Quarrying in the Periyar River Basin, Central Kerala
Kerala state in the southwest India has undergone dramatic
changes in resource exploitation over the past 4-5 decades
due to rapid economic developments and rise in foreign
remittances. Although Kerala is a state with low percapita
land and resource availability, the natural resource extraction
is not in tune with the principles of sustainable
development. As a result, many of the highly populated
areas in the state are affected severely by the adverse impacts
of resource extraction. In fact, the negative impacts of the
activity are a continuing challenge to the existing regulatory
systems. If the current trend of mineral extraction
continues, many life sustaining systems run the risk of
environmental degradation in the near future.
The present study in the Periyar river basin, that spreads
over a greater part of central Kerala, reveals that rampant
and unscientific extraction of resources is a major threat
to the very existence of the river and its biological
environment. Mining and quarrying activities are rampant
in all the three physiographic regions (lowlands <8m above
MSL; midlands 8 – 75m above MSL and highlands >75m
above MSL) of the river basin environment. Indiscriminate
quarrying of hard rock, excavation of soil from hillocks,
extraction of sand from instream and floodplain areas, tile
and brick clay mining from floodplains/wetlands, laterite
cutting, etc., are some of the activities that could be noticed
in the basin. Spatial distribution of mining/quarrying
locations reveals that midlands and highlands are the most
affected than the lowlands. The major driving force behind
indiscriminate mining and quarrying is the rising demand
of building materials for the mega developmental projects
in Kochi City, one of the fast developing urban-cum-
industrial centres in South India. Most of the local bodies
that fall partially or completely within the Periyar river basin
are engaged in mining/quarrying activities.
Hard rock quarrying has become widespread in recent years,
as the activity contribute both coarse and fine aggregates,
and also foundation stones for building sector. The study
reveales that even the highly Ecological Sensitive Areas
(ESA) of the Western Ghats are also not free from
indiscriminate mining and quarrying (Fig. 4.2.2.1). The
present study shows that in Idukki district alone, a total
continue the sand mining holiday enforced by the district
administration for one more audit period of 3 years.
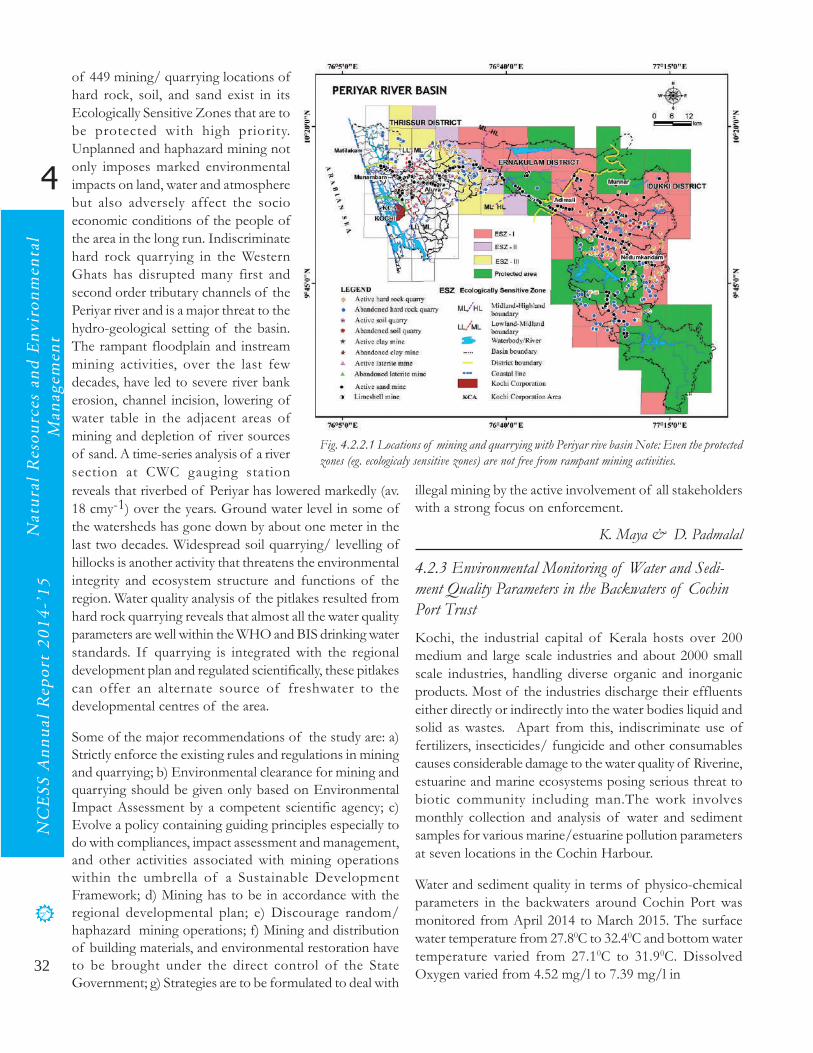
32
NC
ES
S A
nn
ual
Rep
ort
20
14
-’1
5N
atu
ral
Res
ou
rces
an
d E
nv
iro
nm
enta
lM
anag
emen
t
4
reveals that riverbed of Periyar has lowered markedly (av.
18 cmy-1) over the years. Ground water level in some of
the watersheds has gone down by about one meter in the
last two decades. Widespread soil quarrying/ levelling of
hillocks is another activity that threatens the environmental
integrity and ecosystem structure and functions of the
region. Water quality analysis of the pitlakes resulted from
hard rock quarrying reveals that almost all the water quality
parameters are well within the WHO and BIS drinking water
standards. If quarrying is integrated with the regional
development plan and regulated scientifically, these pitlakes
can offer an alternate source of freshwater to the
developmental centres of the area.
Some of the major recommendations of the study are: a)
Strictly enforce the existing rules and regulations in mining
and quarrying; b) Environmental clearance for mining and
quarrying should be given only based on Environmental
Impact Assessment by a competent scientific agency; c)
Evolve a policy containing guiding principles especially to
do with compliances, impact assessment and management,
and other activities associated with mining operations
within the umbrella of a Sustainable Development
Framework; d) Mining has to be in accordance with the
regional developmental plan; e) Discourage random/
haphazard mining operations; f) Mining and distribution
of building materials, and environmental restoration have
to be brought under the direct control of the State
Government; g) Strategies are to be formulated to deal with
Fig. 4.2.2.1 Locations of mining and quarrying with Periyar rive basin Note: Even the protected
zones (eg. ecologicaly sensitive zones) are not free from rampant mining activities.
illegal mining by the active involvement of all stakeholders
with a strong focus on enforcement.
K. Maya & D. Padmalal
4.2.3 Environmental Monitoring of Water and Sedi-
ment Quality Parameters in the Backwaters of Cochin
Port Trust
Kochi, the industrial capital of Kerala hosts over 200
medium and large scale industries and about 2000 small
scale industries, handling diverse organic and inorganic
products. Most of the industries discharge their effluents
either directly or indirectly into the water bodies liquid and
solid as wastes. Apart from this, indiscriminate use of
fertilizers, insecticides/ fungicide and other consumables
causes considerable damage to the water quality of Riverine,
estuarine and marine ecosystems posing serious threat to
biotic community including man.The work involves
monthly collection and analysis of water and sediment
samples for various marine/estuarine pollution parameters
at seven locations in the Cochin Harbour.
Water and sediment quality in terms of physico-chemical
parameters in the backwaters around Cochin Port was
monitored from April 2014 to March 2015. The surface
water temperature from 27.80C to 32.40C and bottom water
temperature varied from 27.10C to 31.90C. Dissolved
Oxygen varied from 4.52 mg/l to 7.39 mg/l in
of 449 mining/ quarrying locations of
hard rock, soil, and sand exist in its
Ecologically Sensitive Zones that are to
be protected with high priority.
Unplanned and haphazard mining not
only imposes marked environmental
impacts on land, water and atmosphere
but also adversely affect the socio
economic conditions of the people of
the area in the long run. Indiscriminate
hard rock quarrying in the Western
Ghats has disrupted many first and
second order tributary channels of the
Periyar river and is a major threat to the
hydro-geological setting of the basin.
The rampant floodplain and instream
mining activities, over the last few
decades, have led to severe river bank
erosion, channel incision, lowering of
water table in the adjacent areas of
mining and depletion of river sources
of sand. A time-series analysis of a river
section at CWC gauging station

33
4
NC
ES
S A
nn
ual R
epo
rt 20
14
-’15
Natu
ral Reso
urces an
d E
nv
iron
men
talM
anag
emen
t
�
Fig.4.2.3.1 Concentration of mercury in sediments of the study area
Petroleum hydrocarbon (PHC) in bottom water varied from
0.2 mg/l to 10.94 mg/l. Surface water always showed higher
values for petroleum hydrocarbon. Station 4 reported the
high values of PHC (32.4 mg/l) both in surface and bottom
waters which may be due to oil shipment activities carried
out in this area. Turbidity was low in surface water
compared to the bottom water. In surface water, Gross
Production showed higher value upto 104.6 mgC/m3/hr
and bottom water showed upto 20.54 mgC/m3/hr.
As regards sediment quality parameters, pH showed marked
variation from 7.68 to 9.04 during the study period. The
concentration range of cadmium (Cd), lead (Pb) and
mercury (Hg; Fig. 4.2.3.1) in the sediment any environs
around Cochin Port Trust were 0.31 to 1.54 ppm; 18.24 to
48.35 ppm; and 0.09 to 0.87 ppm respectively during the
study period. The river Periyar brings heavy metals in the
form of fine grade suspended particulates matter from
effluent discharge points of various industries. The
sediment quality parameters are indicative of industrial
K. Anoop Krishnan
Funding: Cochin Port Trust (CPT)
4.2.4 In-situ Bioremediation of Landfill Pollutants: Maxi-
mizing the Remediation Potential of Select Indigenous and
Exogenous Microorganisms
The safe disposal of Municipal Solid Waste (MSW) is a
critical issue worldwide. Although different waste
management strategies have been in use like recycling,
composting, incineration etc, this sector still remains is
one of the most poorly managed sectors in India. Sanitary
landfilling is the predominant waste disposal alternative,
but raises environmental concerns in the form of
generation of landfill gas (LFG) with methane as a major
component and leachate as an obnoxious effluent with its
toxic compound overloading. Moreover, the issue of
fugitive and residual methane emissions has still not been
resolved fully.
surface water and 4.08 mg/l to 7.05 mg/l in bottom water.
The salinity of surface water was minimum during
November and January and maximum during August.
Bottom water recorded prominent values in salinity, which
may be due to the saline water intrusion. The pH of water
showed fluctuations in surface and bottom waters due to
the icobined effects of saline water ingression and rainwater
inflow. Inorganic phosphate showed the highest values
during the month of August and November. Surface water
recorded high values than bottom water. Nitrate Nitrogen
ranges from low values in January (0.86 µmol/l to 2.86
µmol/l) to high values in August (1.59 µmol/l to 7.65 µmol/
l). The concentration of nitrite was maximum of during
August and ammonia nitrogen during September and
October, total nitrogen and total phosphorous do not
exhibit marked change when compared with the results of
the previous year. In surface water, Petroleum Hydrocarbon
(oil and grease) varied from 0.2 mg/l to 25.63 mg/l during
the study period.
pollution in the study area.
The present study consists of using the technique of in-
situ bioremediation to reduce the toxicity of Municipal Solid
Waste (MSW) landfill pollutants like dissolved organics,
inorganics and heavy metals in leachate and methane in
landfill gas. Landfill is proposed to be considered as a
bioreactor in the study in which the stabilisation of waste
is accelerated by incorporating various interventions.
Combined methane oxidation and in-situ treatment of
leachate is proposed to be conducted using a consortium
of microorganisms. The methane from the landfill soils is
to be oxidised using methanotrophic bacteria. The organics,
inorganics and heavy metals in leachate are proposed to be
reduced using select chemoautotrophic bacteria as well as
fungal species. The technique does not require costly
Fig. 4.2.4.1 Experimental Setup

34
NC
ES
S A
nn
ual
Rep
ort
20
14
-’1
5N
atu
ral
Res
ou
rces
an
d E
nv
iro
nm
enta
lM
anag
emen
t
4
The study will estimate the quantity and quality of landfill
gas and leachate produced from each of the landfill models;
the oxygen/air requirement for optimal remediation of
landfill pollutants; the growth rate of select indigenous and
exogenous microorganisms in the system; the correlation
of bacterial growth rate with the treatment efficiency; the
bacterial kinetics of select species and the group
performance of the exogenous bacteria with the indigenous
bacteria. The physical models to suite the purpose of landfill
simulation and fitted with the installations for aeration,
inoculation of microorganisms, recirculation of leachate,
collection of landfill gas from various locations and
collection of leachate. Indigenous microorganisms in the
models have been identified. The exogenous
microorganisms were selected based on their source,
prospective remediation capability and growth conditions
and were procured from Microbial Type Culture Centre,
Chandigarh. These microorganisms have been cultured in
the lab and inoculated into the two of the landfill models
for enhanced bioremediation and accelerated waste
stabilization.
Fig. 4.2.4.2 Percentage reduction in Methane
The study aims to develop a comprehensive procedure to
reduce the toxicity of landfill pollutants and design of a
landfill system to cater to municipal solid wastes based on
the remediation efficiency of the interventions. LFG is
being monitored once in every two weeks from October
2013 and leachate every month from January 2014. The
parameters estimated from LFG include CH4 and CO
2.
Aeration started in 4 among the 6 landfill models. The
results (Fig. 4.2.4.2) show a decreased production of
methane as well as enhanced bioxidation of generated
methane in the aerated models. The model with
methanotrophic microorganism inoculation without
�
75
80
85
90
95
100
0 50 100 150 200 250 300 350 400
�������������
�� ���
����������������� ������������������������
Control
Leachate�recirculation
Aeration
Aeration+�leachate�recirculation
Aeration+exogenous�mo
Aeration+exogenous+lechate�reciculation
K. Deepa Nair
Funding: DST, GoI
4.2.5 Sea Water Quality Monitoring
The littoral ecosystem and nearby areas of our country,
particularly the south west coast of India, are facing
unprecedented threats from rampant population growth,
growing urbanization, declining fisheries and multiple
impacts from climate change. In order to assess the seasonal
variations of chemical, biological and microbiological
aspects of coastal milieu, the Ministry of Earth Sciences,
Govt. of India initiated a project “Sea Water Quality
Monitoring (SWQM)”, the prime objective of which is to
assess the sources, levels, pathways and effects of various
pollutants in identified hot spots along the coastal areas of
Kerala, Mangalore and Lakshadweep islands.
installations for recovery and purification of LFG or for
leachate treatment units.
leachate recirculation shows much lower methane
generation and a higher bioxidation than the other aerated
models.
Kochi
�
Fig. 4.2.5.1 Spatial variation of Silicate in Kochi
Silicate shows relatively higher values (31.93 ± 8.66 µ mol/
L; Fig. 4.2.5.1) among the nutrients in coastal waters of
Kochi during post monsoon season. In Coastal sediments
Lead (Pb) is reported in higher concentration (22.47 µg/
g). In a positive correlation with silicate values diatom
population dominates in the Kochi coastal waters.
Among the phytoplanktons populations,
Chaetoceroslorenzianus, Cosinodiscusgigas and Skeletonemacostatum
dominate in Kochi estuary during monsoon and post
monsoon seasons. Dinoflagellates like Ceratiumfurca
dominate throughout the pre-monsoon period (24200
Cells/L). Crustaceans like Evadnaetergestina and copepods
namely Acrocalanus gibber and Lucifer hanseinii contribute a

35
4
NC
ES
S A
nn
ual R
epo
rt 20
14
-’15
Natu
ral Reso
urces an
d E
nv
iron
men
talM
anag
emen
tmajor share among the zooplankton population during pre-
monsoon (21.4%) and post monsoon seasons (23.7%).
During monsoon season, more than fifty percent of
zooplankton density was composed of fish eggs as the
season is breeding time for fishes. Zoobenthos of Kochi
consist mainly of foraminifera like Ammoniatepida and
Ammonia beccari. Capitellacapitata is one of the common
benthic species which indicates bioaccumulation in deep
waters. Though, not in large numbers, these species are
encountered round the year irrespective of seasons.
Annual mean chlorophyll values of Kochi estuary ranged
from 1.6 to 3.1 mg/m3.Nutrient entrainment along with
presence of plant matters like Eichornia sp. contributed
higher values in the estuary as compared to open sea. No
Harmful Algal Blooms (HABs) were reported from the
station.The highest mean value for Total Viable Bacterial
load (TVC) in Estuary is reported in post-monsoon
season(20615.38 CFU/mL), While highest mean
population of E.coli and Faecal coliforms are reported in
pre-monsoon season (359.2 CFU/mL and 2693.8 CFU/
mL). In Kochi coastal waters post monsoon studies show
highest mean viable bacterial load (TVC) is 24807.69 CFU/
mL but the mean population of E.coli reported as 630.8
CFU/mL and Feacal coliforms reported as 5033.08
bursting the contamination limits.
Mangalore
In post monsoon season, the nitrate (NO3; Fig. 4.2.5.2)
and silicate (SiO4) reported higher values (25.48±3.16 µ
mol/L and 26.12±2.95 µ mol/L ,Fig. 4.2.5.2). In sediment
the heavy metal Pb shows high value of 22.47 µg/g during
the post monsoon seasons. Mangalore recorded
comparatively lower values of chlorophyll ranging from
0.15 to 2.7 mg/m3. Cells of Chaetocerosdydymus ,
Coscinodiscusgigas, Pleurosigma sp., and Leptocylindrusminimus are
found in large numbers at Mangalore during monsoon and
postmonsoon seasons. In premonsoon season,
�
Fig. 4.2.5.2 Spatial variation of Nitrate in Mangalore
During monsoon, Fish eggs considerable the major
zooplankton populations. Zooplankton abundance in
Mangalore is governed by vertical migration due to
upwelling of the sea. Gastropods and bivalves are the major
macro benthos which constitutes 80 percent of biomass.
The major meiobenthos recorded include Ammonia beccari
and Oxystomina species. The benthic diversity was found to
be low in all the seasons. The highest mean value for Total
Viable Bacterial load (TVC) in the coastal waters reported
in premonsoon(18269 CFU/mL). The mean population
of E.coli and Faecal coliforms is reported as 165.4 CFU/
mL and 2752.3 CFU/mL.
dinoflagellates like Prorocentrummicans, Peridinium sp. were
become dominant. Among zooplanktons, calanoid
copepods, fish eggs and larvaes like mysis and nauplius are
found in large numbers at Mangalore during premonsoon
and postmonsoon. However no HABs were reported.
Kavaratti
In Kavaratti coastal waters the summer values of SiO4from 5.24 µmol/L to 10.33 µmol/L, Total nitrate ranges
from 5.21 µmol/L to 9.65 µmol/L and Total phosphate
from 1.25 µmol/L to 2.40 µmol/L (Fig. 4.2.5.3).
Chlorophyll value of Kavaratti lagoon ranges from 0.078
to 0.71 mg/m3, which indicates the oligotrophic nature of
lagoon. Major phytoplanktons include coralloid algaes like
Bellerochea malleus. Zooplankton composition was primarily
governed by the abundance of larvaes like mysis, polychate
larvae, fish eggs and nauplius. Zoobenthos commonly
constitutes gastropods and bivalves like Meritrixmeritrix,
Desmodora sp., Pernaviridisetc. E. coli has not detected in the
summer samples but hourly studies shows that Mean viable
count of Faecal streptococci in the lagoon water is 75 CFU/
mL. However Vibrio sps. show their presence in the coastal
and lagoon waters (Mean viable count – 311 CFU/mL).
�
Fig. 4.2.5.3 Microbiology in Kavaratti coastal waters
R. Ajayakumar Varma & K. Anoop Krishnan
Funding: MoES, GoI

36
NC
ES
S A
nn
ual
Rep
ort
20
14
-’1
5N
atu
ral
Res
ou
rces
an
d E
nv
iro
nm
enta
lM
anag
emen
t
4
4.2.6 Environmental Studies of the Kollam - Neendakara
Wetland System and Associated Inlands
The Ashtamudi wetland system (AWS), a Ramsar Site
designated as “Wetland of International Importance”, is a
major estuarine wetland in SW India. The present study
evaluates the extent of water pollution and accumulation
�
�
Fig. 4.2.6.1 Spatial distribution of Dissolved oxygen in surface waters ofAshtamudi Wetland Systems
of heavy/trace metals in the recent sediments of AWS.
The analysis of water and sediment quality of AWS revealed
the degree of impacts of human activities in this estuarine
wetland. The contamination factor worked out for beach
sediments indicates that AWS is moderately contaminated
with chromium, iron, nickel, and copper.
The hydrochemical quality of the AWS has been controlled
by the freshwater input from Kallada River and marine
water inflow from the nearly coastal waters. Comparatively
lesser inputs from riverine source is noticed in non-
monsoon season while high inputs from sources like
coconut husk retting yards, fish-processing centres, urban
sewages and industries located near the system (Table
4.2.6.1). Comparing with the monsoon period, a different
situation is noted during nonmonsoon period in AWS due
to reduced fresh water inflow to the sytem together with
the addition of contaminants in large quantities and thereby
depleting the level of DO and subsequent non-oxidation
of organic matter. The spatial distribution of DO during
the different seasons are depicted in Fig. 4.2.6.1
Table 4.2.6.1 Ranges of water Quality Parameters of Ashtamudi Wet-land System (AWS) during Monsoon and Non-Monsoon seasons
The study emphasizes the need of sustainable management
measures of this Ramsar wetland. Continuous monitoring
of sediment and water quality of different sub-
environments of the AWS is suggested for deriving location
specific management options for the conservation of the
health of the important backwater system.
A. Krishnakumar
Funding: Department of port & Fisheries, GoK
Parameter Units Monsoon Non-monsoon
pH 5.86 - 8.38 4 - 8.04 TDS mg/l 83 - 838 464 - 2720 TSS mg/l 11.7 - 135.6 53.2 - 125.6 EC mS/cm 3.07 - 32.45 30.9 - 47.4
Total Hardness mg/l 96 - 1620 4000 - 7400
Calcium mg/l 60.12 - 400.80 320.64 - 721.44 Magnesium mg/l 2.44 - 299.02 729 - 1552.2 Total Alkalinity mg/l 100 - 300 500 - 900 Salinity 0/00 18.68 - 21.25 20.96 - 72.72 Sodium mg/l 123.10 - 558.6 624 - 839.7 Potassium mg/l 26.20 - 1094 114.2 - 145 DO mg/l 5.12 - 9.07 1.69 - 6.78
BOD mg/l 0.11 - 5.85 0.089 - 6.79
Total Phosphorus mg/l 0.05 - 0.58 0.07 - 1.60 PO4 mg/l 0.001 - 0.08 0.05 - 0.20
Total Nitrogen mg/l 0.07 - 1.75 1.11 - 2.77
Nitrate, NO3- mg/l 0.64 - 5.20 0.01 - 1.14
Nitrite, NO2- mg/l 0.002 - 1.30 0.003 - 0.05
Ammonia mg/l 3.03 - 3.67 0.87 - 1.72

37
4
NC
ES
S A
nn
ual R
epo
rt 20
14
-’15
Natu
ral Reso
urces an
d E
nv
iron
men
talM
anag
emen
t4.2.7 Environmental studies on the Netravathi-Gurupur
river basins of Karnataka and Periyar-Chalakudy river
basins of Kerala
Reconnaissance field work was conducted in the Periyar -
Chalakkudi River basin for primary and secondary data
collection. A few sediment and water samples were also
were analysed for various physico-chemical and
microbiological parameters using standard procedures.
Analysis of nitrates and heavy metal contents in the water
and sediment samples are progressing. The spatial
distribution of nitrite, phosphate and silicate is shown in
Fig. 4.2.7.1
�
10,�153
24,�821
4,�148
-100
0
100
200
300
400
500
600
700
800
900
0 1 2 3 4 5 6 7 8 9 10 11 12 13 14 15 16 17 18 19 20 21 22 23 24 25 26 27 28 29 30 31 32 33
Concentration (µg/L)
Concentration (µg/L)
Concentration (µg/L)
Concentration (µg/L)
����������
Nutrients patternNutrients patternNutrients patternNutrients pattern
Series1 Series2 Series3Phosphate SilicateNitrite
Fig. 4.2.7.1 Spatial distribution of nitrite, phosphate and silicate
contents in the water samples of the Periyar-Chalakudy river
Water level fluctuations with respect to the ground level
has been worked out. The hydro-chemical quality of the
observations wells of Periyar River basin for the period
2003 - 2012 has been compiled. The salient features of the
drainage characteristics and neo-tectonic activities of the
Periyar and Chalakudy river basins has been compiled from
published work and detailed analysis of drainage features
are in progress. Rainfall data from 1916 to 2005 has been
analysed and its trend has been worked out (Fig. 4.2.7.2).
�
Fig. 4.2.7.2 Annual average rainfall in the Munnar area for the period1916-2005
Existing data sets are being transformed with reference to
OSM in UTM Zone-43 coordinate system and WGS-84
datum. Vectorization of drainage network of Chalakkudi
River basin has been completed based on Strahler’s method
using ArcGIS 10.3 in Window’s platform.
4.2.8 Monitoring Global Change Impacts in Sahyadri
(Western Ghats)
The drainage network in Chalakkudi river basin is given
Fig. 4.2.7.3. A rapid morphometric analysis has been carried
out for the basin. The study is in progres.
�Fig. 4.2.7.3 Drainage network of the Chalakkudi River Basin
As part of monitoring climate change and its impacts on
Sahyadri (Western Ghats), 4 major themes in a cross-section
of area south of Palghat gap and the Achenkovil shear
zone is monitored. In connection with this program,
installed two Automatic Weather Stations (AWS) one in
Periyar river Basin and the other in Netravathi River Basin
for collecting weather data. The daily weather data on air
temperature, wind speed, wind direction, relative humidity,
rainfall, pressure, solar radiation, sun rise and sunset are
being collected from March 2015 onwards.
The major objectives are (i) Setting up a high altitude Green
house gas Observatory at Rajamalai near Munnar around
2000m elevation and Automatic Weather stations at
Rajamalai, Chinnar and Mankulam; (ii) Ecological studies
along altitudinal gradients and in associated headwater
basins, (iii) Monitoring and analysis of indicators of
systemic and cumulative environmental changes in
mountain regions and (iv) Integrated model based studies
of environmental changes in mountains through scenario
building and modeling. The transect study selected the
Eravikulam National Park (ENP), the highest plateau in
Western Ghats with mountain cloud forests as the
undisturbed core area and moist forests of Idamala-
Puyankutty valleys in the western slope and the dry
deciduous Muthirpuzha –Chinnar valleys in the eastern
slopes.
R. Ajayakumar Varma, D. Padmalal,
B. K. Jayaprasad, Ansom Sebastian, K. Maya,
K. Anoop Krishnan & A. Krishnakumar

38
NC
ES
S A
nn
ual
Rep
ort
20
14
-’1
5N
atu
ral
Res
ou
rces
an
d E
nv
iro
nm
enta
lM
anag
emen
t
4
�
Fig. 4.2.8.1 The Automatic Weather Station in Munnar
�
Eravikulam National Park
A suitable site at 2000m elevation at Rajamalai in
Eravikulam National Park has been identified for setting
up the Green house gas observatory.
The programme mainly covers two watersheds (Periyar and
Chinnar) for modeling purposes. Data on water quality and
quantity of the streams originating from Eravikulam
Table 4.2.8.1 Water quality data of the upstream regions of the study area in Periyar river
National Park
area and its
downs t r e am,
were used to
study the
aquatic and
t e r r e s t r i a l
community, the
population of
rare and
e n d a n g e r e d
species and
pollution in
i n d i c a t o r
species like
lichens and
m o s s e s .
Acco rd ing l y,
water samples(premonsoon) were collected from upstream reaches of
Periyar river and analysed for physico-chemical and
microbiological parameters. The result is presented in Table
4.2.8.1
Condu
ctivityTSS
Turbi
dity
Alkal
inity
Total
Hard
ness
Ca
Hardn
ess
Mg
hardnes
s
Chlorid
e
Sulph
ateIron Silicate
Nitr
ite
Nitra
te
Amm
oniaT.N
Phos
phateT.P
Esche
richia
coli
Other
Colifo
rms
ms/cm mg/L (NTU) (mg/l) (mg/l) (mg/l) (mg/l) (mg/l) (µ g/l) (µ g/l) (µ g/l) (µ g/l)(µ g/l) (µ g/l)(µ g/l)(µ g/l) (µ g/l)
1 Nallathanni 6.38 35.39 0.0036 5.2 12 11 3.607 0.49 26.67 0.03 1.94 40.09 0.05 1.78 17.94 2.73 0.33 13.16 NIL 300
2Nallathanni
Bridge6.66 137 0.0072 0.42 24 63 24.850 0.24 45.72 0.17 11.40 54.59 0.38 3.36 7.80 1.44 0.39 15.71 NIL 620
3 Vellathooval 6.06 41.51 0.0058 0.55 8 8 2.004 0.73 45.72 0.01 0.78 28.40 0.02 3.44 8.76 2.38 0.15 5.91 NIL 80
4 Anayirankal Dam 6.12 31.84 0.0042 < 0.19 8 14 2.004 2.19 38.10 0.02 1.27 45.96 0.01 1.96 8.68 0.38 0.19 7.52 NIL 70
5 Pooppara 4.75 71.3 0.0044 0.9 8 24 4.810 2.92 68.57 0.03 2.31 48.44 0.12 5.56 10.08 4.21 0.45 18.26 240 610
6 panniyar 4.8 30.82 0.0006 0.16 8 15 1.603 2.67 38.10 0.01 0.83 43.84 BDL 3.03 8.53 1.21 0.18 7.12 NIL 380
7 Ponmudi Dam 4.72 39.56 0.0028 0.09 8 15 3.206 1.70 49.52 0.01 0.98 27.09 BDL 3.75 8.73 1.86 0.26 10.34 NIL 20
8 Vimala City 4.75 40.96 0.003 0.55 4 15 2.004 2.43 38.10 0.01 1.00 30.97 0.01 4.02 10.23 0.97 0.11 4.56 NIL 1830
9Senkulam
Reservoir5.06 43 0.0022 0.19 8 15 3.607 1.46 41.91 0.01 0.50 40.70 0.03 3.74 7.28 1.64 0.30 12.08 NIL 50
10 Kallarkutty Bridge 5.13 30.69 0.0048 0.33 8 15 2.806 1.94 38.10 0.00 0.00 72.84 0.00 0.66 8.24 0.67 0.33 13.43 NIL 90
11 Neryamangalam 5.62 38.65 0.0038 0.18 12 17 4.409 1.46 41.91 0.02 1.57 47.08 0.02 2.84 7.98 0.51 0.50 20.27 10 90
12 Neendapara East 5.15 26.9 0.0066 0.88 12 13 2.806 1.46 34.29 0.00 0.00 55.33 BDL 0.98 9.12 0.38 0.29 11.81 NIL 540
13 Pambla Dam 5.4 32.27 0.0034 0.18 8 20 4.409 2.19 34.29 0.04 2.56 67.24 0.02 3.39 6.99 0.47 0.53 21.35 NIL 60
14 Kallarkutty 5.3 24.8 0.0126 0.88 8 7 3.206 -0.24 38.10 0.00 0.33 47.34 BDL 4.08 9.16 1.12 0.23 9.13 NIL 440
15 Panamkutty 6.45 223.8 0.0022 0.18 60 118 28.056 11.67 53.33 0.53 35.65 119.33 0.13 1.31 8.16 0.63 0.47 18.80 NIL 190
16 Kallarkutty Dam 5.91 62.57 0.037 0.63 16 28 10.822 0.24 34.29 0.12 7.95 40.47 0.06 3.77 8.27 1.14 0.56 22.69 NIL 60
CFU/mL
Sampling
StationpH
Sl.
No
.
����������������� ��������������������� ������������������� ���� ��� ���
A. Krishnakumar
39
4
NC
ES
S A
nn
ual R
epo
rt 20
14
-’15
Natu
ral Reso
urces an
d E
nv
iron
men
talM
anag
emen
t4.2.9 Preparation of Management Action Plan for Eco-restoration of Vembanad Lake Ecosystem
R. Ajayakumar Varma
Funding: 13th Finance Commission Award, Govt. of
Kerala
Vembanad lake is one of the three Ramsar sites in Kerala
and greatly influences the social, economic and
environmental aspects of the state. However, the wetland
is increasingly under stress due to various anthropogenic
and environmental pressures. Though there are various
studies and reports highlighting the internal and external
factors impinging upon the very existence of Vembanad
Lake and its inflowing rivers, there is no holistic
management action plan exists that could be implemented
for eco-restoration of the lake and its catchments.
Therefore, a project has been conceived for preparing an
implementable action plan for restoring the Vembanad lake
and its river catchments drained by Achankoil, Pamba,
Manimala, Meenachil and Muvattupuzha rivers in line with
the guidelines of National Lake and River Conservation
Plan (NLRCP).
Detailed inventory has been carried out on various studies
pertaining to the environmental aspects of Vembanad Lake
and rivers, field level information gathered for assessing
the state of environment of the ecosystems and
environmental evaluation carried out for delineating the
environmental issues, causative factors, resultant pressure,
present state, impact and stakeholder responses. Based
on this, position papers on the five rivers and lake have
been prepared. Detailed watershed analysis has been carried
out for the five river catchments and catchment area
conservation plans have been prepared. Comprehensive
plan for waste management has been prepared taking into
consideration the urban and rural local bodies in each of
the river basin and also considering the requirement for
solid and liquid waste management including septage and
fecal sludge. An overflow management system has been
adopted for both solid and liquid waste management. The
conservation and development plans will be integrated to
prepare a Management Action Plan for Vembanad Lake
Ecosystem.
4.2.10 EIA of Municipal Solid Waste Management
Project of Thiruvananthapuram Municipal Corporation
An environmental impact assessment study has been carried
out on the project ‘Municipal Solid Waste Management
(MSW) of Thiruvananthapuram Municipal Corporation
(TMC)’ which has been designed to expand and upgrade
R. Ajayakumar Varma
Funding: Corporation of Thiruvananthapuram
4.2.11 Mining and quarrying in the river catchments of
Central Kerala around Kochi city, SW India-Consequences
and sustainable development strategies
Expanding human requirements and economic
developments impose immense pressure on our natural
resource base. Economic growth will continue to depend
on the extractive industry as it supplies most of the raw
materials for developments. Kerala state with an area of
38,863 sq km is one of the densely populated regions of
the world having limited land and natural resources
availability. The scenario of resource utilization in the state
has changed drastically over the past 4-5 decades due to
the MSW management system of the TMC. The proposed
project includes modernization of process and procedures
in the collection, transportation and treatment of MSW
and disposal of the final rejects. As a first step, detailed
baseline environmental study has been carried out in the
impact zone comprising the entire TMC domain and the
neighborhood of the composting yard at Vilappilsala. Based
on this, the existing environmental scenario has been
elucidated and the environmental hotspots delineated. The
major environmental issues identified have been the leachate
generation, breeding of flies, emission of green-house gases
(GHGs) and possibility of health hazards. As required,
additional studies have been carried out to ascertain the
composting capacity of the plant at Vilappilsala, its
performance efficiency, environmental issues and
environmental cost due to the operational deficiencies of
the plant, environmental, health and social safeguards for
MSW collectors, alternative management options etc.
Based on the impacts predicted, mitigation plans derived
and the additional studies carried out, a detailed
environmental management plan has been evolved. In the
background of these, an alternative management option
has been examined in conformity with reduce-reuse-recycle
principle for MSW management. Based on this, 10
recommendations are put forward for implementation by
the TMC to improve the MSW management system. The
prime recommendation is to adopt Overflow Management
Option for MSW management. This is a concept based on
reduction and management of biodegradable waste at
source using the most appropriate technology and social
engineering and centralization of non-biodegradable waste
for appropriate reuse and recycle considering the
commercial viability.

40
NC
ES
S A
nn
ual
Rep
ort
20
14
-’1
5N
atu
ral
Res
ou
rces
an
d E
nv
iro
nm
enta
lM
anag
emen
t
4
the exponential rise in foreign remittance and subsequent
economic developments. Most of the highly populated
areas even in the midlands and highlands are affected
severely by the mining and quarrying activities.
Construction of infrastructure is of prime importance in
sustaining the pace of developments that are under taken
with an intention to enhance the quality of life of the people
in the state. As the demand for minerals increase, the extent
and magnitude of mining also grows. Resource extraction
in its wake causes serious environmental problems which
need to be tackled judiciously by striking a balance between
the degree and need for development, and the extent of
environmental hazards based on scientific studies.
In view of the severity of environmental degradation
caused by indiscriminate mining and quarrying, and also
considering its potential impacts on the developmental
initiatives of the state, a study has been made in the river
catchments of Muvattupuzha, Periyar and Chalakudy rivers
in Central Kerala as an example.
Fig. 4.2.11.1 Resource extraction and associated labour force in mining/
quarrying sectors of the study area. HR Hard rock; RS river sand; VBSS
Vembanad Beach Strandline System; MRB Muvattupuzha River Basin;
ERB Edappally River Basin; PRB Periyar River Basin; CRB Chalakudy
River Basin
The study area falls within Alappuzha, Kottayam,
Ernakulam, Idukki, Palakkad and Thrissur districts of
Kerala. Spatial analysis of mining and quarrying activities
in the area reveals that the activities are rampant in the
midlands compared to highlands and lowlands (Fig.
4.2.11.1). The mining and quarrying activities in the study
area include hard rock quarrying, alluvial sand mining, soil
and laterite quarrying, clay mining, lime shell mining and
silica sand mining. A total of 209 local bodies fall partially
or completely within the study area; comprising Vembanad
Beach Strandline System (42), Muvattupuzha basin (63),
Edappally river basin (11), Periyar river basin (80) and
Chalakudy river basin (13). Hard rock quarrying is the most
widespread extractive activity in the midland and highland
regions. It is surprising that the Ecologically Sensitive Areas
of the Western Ghats are also not free from this destructive
activity. It is estimated that an amount of 16.657 x 10⁶ ty-1
of hard rock is being extracted from the study area for
various purposes. An overall analysis shows that among
the three physiographic zones, the midlands contribute the
bulk of hard rock (85%) to the construction sector. Hard
rock quarrying is widespread in the midlands of Periyar
river basin (6.872 x 10⁶ ty-1). Although small in river length
and catchment area compared to the river Periyar (244 km
/ 5398 km2), the river Muvattupuzha (121 km / 1554 km2)
is also subjected to indiscriminate rock quarrying (4.635 x
106 ty-1). A total of 5995 labourers (5190 in midlands and
805 in lowlands) are employed in hard rock quarrying sector
of the study area. The midland areas falling in Ernakulam
district is likely to become a potential hotspot in terms of
resource extraction, as the demand for building materials
is expected to rise exponentially on account of the rapid
developmental activities in the region. Soil quarries noticed
in about 60 local bodies of the study area. About 800
labourers are engaged in the activity. The maximum quantity
of soil is extracted from the midlands (85%) followed by
lowlands (14%) and highlands (<1%). About 3.012 x 10⁶
ty-1 of soil is extracted from the 77 soil quarries in the
study area; out of which maximum quantity of extraction
is from Muvattupuzha river basin (2.105 x 10⁶ ty-1). Apart
from soil quarrying, mining for brick clays was also
widespread in the lowlands and midlands. At present, there
are only a few active tile and brick clay mines in the basin.
A major part of the highland in the Idukki district is
categorized under Ecologically Sensitive Zones (MoEF
2011). Mining and quarrying activities are widespread even
in these local bodies as well. The consequences of
haphazard mining will have severe long term impacts that
in turn can threaten the ecological integrity of the region.
Shiekha E. John, K. Maya & D. Padmalal
University of Kerala

41
4
NC
ES
S A
nn
ual R
epo
rt 20
14
-’15
Natu
ral Reso
urces an
d E
nv
iron
men
talM
anag
emen
t4.2.12 Integrated geoenvironmenal studies of the Lacus-
trine wetlands of Kerala in climate change paradigms for
conservation and management
Freshwater resources act as pioneers for nation’s wealth
and they play a pivotal role in the socio-environmental
frame of its holding expanse.The studies on the quality of
fresh water resources have received considerable attention
worldwide in order to protect them for present and future
generations. In this context, the three fresh water lakes of
Kerala viz: Sasthamkotta, Vellayani and Pookot lakes (Fig.
4.2.12.1) have been taken for the present study.
Fig. 4.2.12.1 Location Map
Sasthamkotta lake which lies between North latitudes
9000’40" -904’05’’ and East longitudes76036.2’ 30’’ -
76039.2’55.3" is located in the outskirts of Kollam
town.Vellayani lake (second largest lake) situated at the
outskirts of Thiruvananthapuram city, is located between
North latitudes 8024’90’’-8026’30’’ and East longitudes
76059’08"-76059’ 47’’. Pookot lake, located in the high ranges
of the Wayanad district, lies between North latitudes 11030’
20’’ -11045’30’’ and East longitudes 7604’10’’ -76010’00’. The
hydro geochemistry of these three lakes during monsoon
�
�
�
Fig.4.2.12.2 Piper Diagram for the relative concentration of anions and
cations in Vellayani,Sasthamkotta and Pookot Lake waters
Fig. 4.2.12.3 Phytoplankton Diversity in Sasthamkotta, Vellayani, and
Pookot Lake waters
season was studied, and their drinking water potential was
evaluated against WHO (2011) drinking standards. The
piper trilinear diagram worked out showed that Na-HCO3
with subordinates of sulphates in Vellayani, Na-HCO3 type
in Pookot and Na-Cl with subordinates of Ca & Mg in
Sasthamkotta Lake (Fig. 4.2.12.2).
The Water Quality Index (WQI) calculated for evaluating
the infuence of natural and anthropogenic activities based
on several key parameters (pH, EC, TDS, HCO3, Cl, SO
4,
NO3, Ca2+, Mg2+, Na+, K+) of surface water chemistry and
based on the WQI, majority of the samples in the three
lakes falls under excellent to good category indicating its
suitability for drinking water. Increased concentration of
nitrates and phospates were observed in the water samples

42
NC
ES
S A
nn
ual
Rep
ort
20
14
-’1
5N
atu
ral
Res
ou
rces
an
d E
nv
iro
nm
enta
lM
anag
emen
t
4
Fig .4.2.12.4 Average concentrations of Faecal Coliforms in Sasthamkotta,
Vellayani, and Pookot lake waters
�
Fig. 4.2.12.5 Dominant phytoplankton species (Arthospirasps, Aulacioseira.
sp, Gomphonemasps, Ceratium sps) observed in Vellayani, Sasthamkotta
and Pookot lake waters.
Revathy Das & A. Krishnakumar
UGC/ JRF
4.2.13 Adsorptive potential of surface modified clays and
chitosan for the Recovery of certain inorganic toxic Metal
ions from Aqueous media using Batch and Column stud-
ies: Kinetics and Thermodynamic profile
Adsorption is a most promising technology for effluent
treatment in terms of cost, operation, application at very
low concentrations and possibility of regeneration and
reuse. Present study makes use of adsorption technique
for the removal of cationic as well as anionic pollutants
from aqueous phase. Heavy metals have been indicated as
a prominent component of industrial effluents, causing
of environmental pollution problems because of their
bioaccumulation tendencies and toxicity to life. A quality
adsorbent at the solid/solution interface can lead to
adsorption process more easily and effectively.
Chitosan, a linear polysaccharide is one among the suitable
adsorbents used for recovery of toxic metals. It can have
exceptional ways of modification as they are composed of
randomly distributed β-(1-4)-linked D-glucosamine
(deacetylated unit) and N-acetyl-D-glucosamine (acetylated
unit). It is prepared by treating exoskeliton of shrimps and
other crustaceans with alkali sodium hydroxide. The
chemical modification of chitosan is of interest because
the modification would not change the fundamental
skeleton of chitosan, similarly these derivatives conforms
new or improved adsorption properties.
Methodology includes a novel organic synthesis
propagating through a free radical chain reaction
mechanism leads to the formation of a highly active graft
co-polymer possessing improved adsorption properties.
The effects of pH, contact time, initial concentration,
adsorbent dose, and adsorption isotherm on removal
Detailed microscopic investigation revealed that 4 families
consisting of 40 genera of phytoplankton in the order
Baciilariophyceae>Cyanophyceaae>Chlorophyceae>
Euglenophyceae in Vellayani Lake. Sasthamkotta Lake,
showed the presence of 3 families consisting of 27genera
in the order Chlorophyceae>Bacillariophyceae>
of the three lakes compared to the previous data (2006)
reported from the region.This may be due to the intensive
agricultural activities around the lake ecosystems. The
textural facies were also worked out for the substratum
sediments. Sasthamkotta Lake sediments show
predominance of silt and clay with very subtle quantities
of sand. The surface sediments of the Vellayani Lake
blanketed mainly by silty sediments. But in Pookot Lake,
sediments show dominance of silt and clay. The high
percentage of C-org and TN recorded in the surface
sediments of Pookot Lake, which surrounded by thick
forest plantations. The research also includes understanding
of greenhouse gas dynamics and effective ways to reduce
greenhouse gas emissions in the area inorder to improve
its ecological health.
Dynophyceae. But in Pookot Lake, a diversity of 22 genera
observed consisting of Chlorophyceae>Cyanophyceae>
Bacillariophyceae (Fig. 4.2.12.3). Faecal Coliforms showed
an average concentration of 159CFU/ml in Sasthamkotta
Lake, 136 CFU/ml in Vellayani Lake and 98 CFU/ml in
Pookot Lake (Fig. 4.2.12.4). Although all physico-chemical
parameters are falling under the prescribed limits of
drinking waterquality standards, microbial population of
faecal origin was noticed in all lakes due to the unhealthy
waste management practices in the catchments.

43
4
NC
ES
S A
nn
ual R
epo
rt 20
14
-’15
Natu
ral Reso
urces an
d E
nv
iron
men
talM
anag
emen
tprocess were evaluated using batch adsorption technique
for chitosan and the chitosan derivatives. The proposed
reaction mechanism for the organic synthesis of chitosan
based co-polymer is shown in Fig. 4.2.13.1.
�
�
�
�
Fig. 4.2.13.1 The Mechanism involved in the preparation of
CFCCP-COOH
The carboxylate functionalized chitosan co-polymer
(CFCCP-COOH) was prepared by reacting chitosan free
radical (CFRM) and a monomer methacrylic acid (MA) in
the presence of a cross linker N, N’-
methylenebisacrylamide ( MBA), Mn IV/citric acid as
initiator. Studies on adsorption behavior of newly
synthesized chitosan based graft co polymer CFCCP-
COOH are pursuing and the properties of Chitosan as an
adsorbent for the removal of lead (Pb) are well studied
and the results were summarized (Fig. 4.2.13.2).
The performance of chitosan on the adsorption of Pb is
maximum at the pH range 4.5– 5, 99.1% and 91.2%. Pb is
removed from the solution of initial concentrations 10 mg/
L and 25mg/L of lead respectively at pH 5. The percentage
of adsorption decreases with increase in pH may be due
to the formation of Pb(OH)2 species having less tendency
for complexation with chitosan. The equilibrium contact
time for adsorption is 30 minutes, beyond that it is almost
saturated and the amount adsorbed are 0.97, 3.17, 7.7 and
14.84 mg/L, respectively for 5, 10, 25, 50 mg/L of initial
concentrations of Pb(II). This is due to the availability of
large number of adsorption sites initially for adsorption.
The influence of initial concentration was studied by
varying the concentration of adsorbate from 5 mg/l to
125 mg/l. The adsorption efficiency was consistent up to
25 mg/l suggests unavailability of adsorption sites beyond
the mono layer capacity.
�
�
�
0
30
60
90
120
3 4 5 6 7
Adso
rption��
�
��
Effect of solution pH
10mg/L
25mg/L
Temp. =30 ̊C
Adsorbent�
dose=0.1g
Contact�Time=2hr
-2
2
6
10
14
18
0 20 40 60 80 100 120 140
qe(m
g/g�
time(min�
��������������������
5mg/L
10mg/L
25mg/L
50mg/L
y�=�0.048x�+�0.119
R²�=�0.993
0
1
2
3
4
5
0 50 100
Ce/q
e
������
pHpHpHpH
0
30
60
90
120
150
0 50 100 150
t/qt
time�(min�
Pseudo 2nd order kinetics
5mg/L
10mg/L
25mg/L
50mg/L
pH�:�5
Temp:�30 C
dose:�0.1g
Fig. 4.2.13.2 The adsorption behavior of newly synthesized chitosan
For determining the adsorption capacity Langmuir and
Freundlich isotherms were introduced for the process and
the isotherm constants were calculated. Langmuir isotherm
gives the best fit for the entire range of concentration with
R2 value 0.993. There for the adsorption of Pb(II) on
chitosan is mono molecular layer.
The adsorption potential of chitosan was investigated in
batch technique. The parameters like pH, contact time,
initial concentration and temperature were optimized and
the isotherm models are introduced in the results. The
maximum adsorption of Pb(II) was observed at pH 5 and
the removal of Pb(II) is highly efficient up to 30 minutes
of contact time. Kinetics of adsorption indicates that the
process follows a pseudo second order rate equation.
Adsorption process is well described by Langmuir isotherm
model and suggests entire process attains equilibrium after
the formation of a mono molecular layer. The adsorption
capacity of chitosan for the adsorption of Pb(II) was found
to be 25 mg/l at 300C. For higher adsorbate concentrations
beyond 25 mg/l chitosan skeleton need modification. The
newly synthesized CFCCP-COOH can be a better option
and the adsorption studies are pursuing to introduce better
results. Vinu V. Dev & K. Anoop Krishnan
University of Kerala

44
NC
ES
S A
nn
ual
Rep
ort
20
14
-’1
5N
atu
ral
Res
ou
rces
an
d E
nv
iro
nm
enta
lM
anag
emen
t
4
4.2.14 Studies on Hydrogeochemical and Biological as-
pects of various streams of Karamana river near Sree
Parasurama Swami Temple, Thiruvananthapuram district,
Southern India
The present study entitled “Studies on hydrogeochemical
and biological aspects of various streams of Karamana
River near Sree Parasurama Swami Temple,
Thiruvananthapuram District, Southern India” focuses on
the pollution aspect of the selected localies. The
downstream of Karamana river near the Parasurama Swamy
Temple is widely utilized by people in various walks of life
- pilgrims, students, fishermen, merchants, swimming
youths, etc. The region has high socio-economic, cultural
and spiritual importance. The main objective of this work
7�
�
Stn Alkalinity (mg/l)
DO (mg/l)
BOD (mg/l)
Ammonia
(µµµµmol/l)
Nitrite
(µµµµmol/l)
Nitrate
(µµµµmol/l)
Phosphate
(µµµµmol/l)
Chloride (mg/l)
Silicate
(µµµµmol/l)
TP
(µµµµmol/l)
TN
µµµµmol/l
Sulphate
µµµµmol/l)
Iron
(µµµµmol/l) 1 224 0.64 0.64 0.70 2.83 94.16 2.64 15.49 105.93 9.93 96.82 0.05 1.23
2 116 4.80 0.64 0.46 3.61 96.91 4.06 13.10 115.29 12.02 102.43 0.14 1.08
3 180 4.84 9.92 1.85 2.04 91.78 11.31 12.33 114.52 8.12 96.69 0.22 0.72
4 172 2.56 1.92 0.82 2.29 65.99 11.52 14.21 107.54 2.50 90.64 0.17 3.87
5 196 7.56 8.00 7.66 2.11 62.89 7.06 13.78 112.29 0.91 92.12 0.05 4.59
6 160 1.60 1.28 6.41 6.02 54.36 8.64 0.51 84.65 0.73 89.64 0.15 1.87
7 180 1.92 5.12 9.91 4.65 76.71 1.96 0.26 119.83 0. 96 91.89 0.08 5.78
Table 4.2.14.1 The physico-chemical data for the field programme
�
0
2
4
6
8
10
12
1 2 3 4 5 6 7
BO
D (
mg
/L
)
Station
A
0.00
20.00
40.00
60.00
80.00
100.00
120.00
1 2 3 4 5 6 7
Am
mo
nia
(µ
mo
l/L
)
Station
B
Fig. 4.2.14.1 (A)Variation of BOD and (B) ammonia at different sta-
tions
V. Viswadas & K. Anoop Krishnan
University of Kerala
4.2.15 Assessment of Nutrient flux in Urban Drainage
Systems: Identification of Sources, Pathways and Reme-
dial Measures
The objective of this research is to assess the nutrient flux
in urban drainage systems, with an emphasis on phosphates
in Karamana River Basin, Thiruvananthapuram, Kerala.
Phosphorous is an essential nutrient for micro and macro
organisms. Its presence beyond 1.0 ppm leads to
eutrophication and therefore its removal from water and
wastewaters is highly warranted. Among the various
methods adopted for phosphate removal, adsorption is
found to be one of the excellent technique for their removal
from aqueous solution. Here a preliminary study has been
initiated to focus on the removal of phosphate by
adsorption technique. Prior to that one field programme
has been conducted to collect water/sediment samples
from selected points in Karamana River, Killiyar,
Aamayizhanjanthodu and Parvathy Puthanar. Collected
is to develop a spatial and temporal model for representing
the area under study and the nearby areas to understand
the factors contributing to pollution of water bodies. This
study also aims to propose reliable remedial measures to
improve socio-economic, cultural and spiritual aspects of
the study area inorder to improve its overall environmental
quality. Moreover, the study focuses on the pollutant
distribution pattern in terms of solution chemistry and
also the speciation of chemical constituts as well as bilogical
components with in the water/sediment interfaces.
Awareness creation on environmental degradation
including pollution of water resources form another aim
of the study.
Methodology of research programme is streamlined well
in advance. Initially, water and sediment samples are
collected for analysis from seven stations in Karamana River
and nearby canals/streams which are located near Sree
Parasurama Swami Temple, Thiruvallam,
Thiruvananthapuram District. Chemical analysis includes
tests for alkalinity, dissolved oxygen, BOD, ammonia,
nitrites, nitrates, phosphates, chlorides, sulphates , Iron,
etc. based on APHA. Sediment analysis is done for texture
analysis, heavy metals, nutrients and major ions. The
estimated physico-chemical data is summerised in Table
4.2.14.1.
Among the nutrients, phosphate concentration ranges from
1.96 to 11.52 µmol/l, while the range of nitrite, nitrate,
ammonia and silicate were found to be 2.04-6.02, 54.36-
96.91, 0.46-9.91 and 84.65-119.83 µmol/l, respectively. The
higher values of nutrient concentration is indication of
uncontrolled sewage disposal into the riverine system. A
holistic approach is to be implemented to prevent the water
pollution in and around the Temple premises. The
evaluation of sediment characteristics along with heavy
metal analysis is progressing.
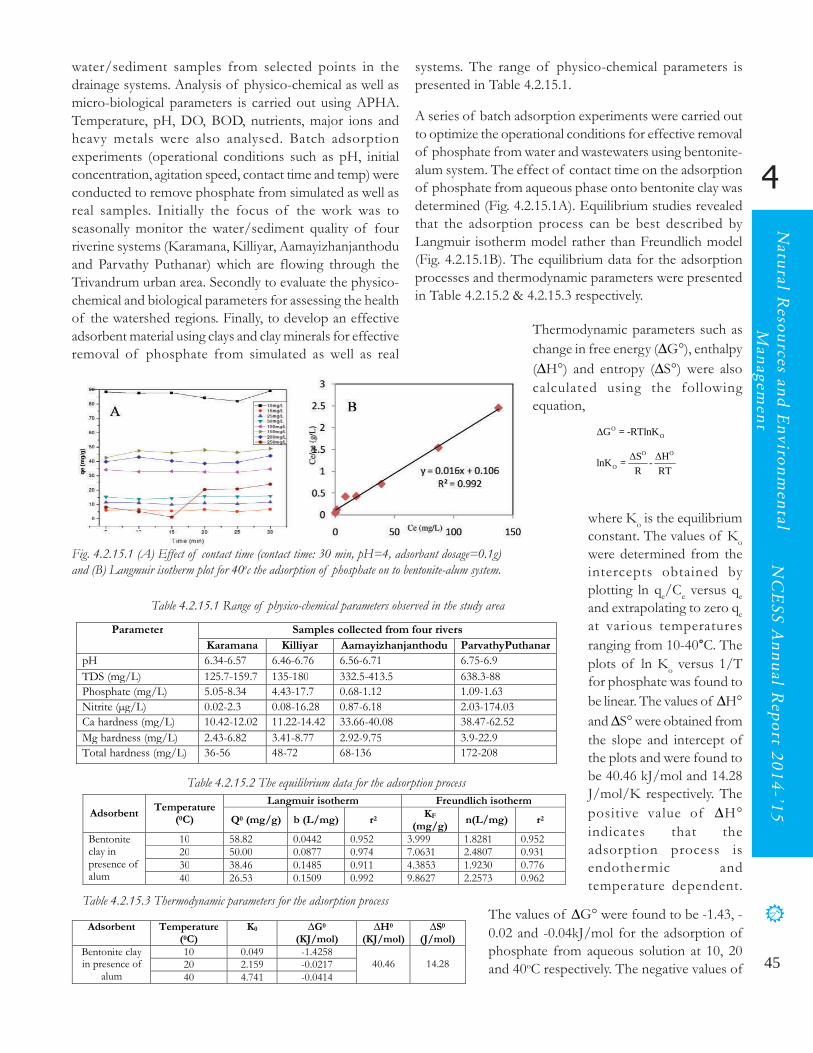
45
4
NC
ES
S A
nn
ual R
epo
rt 20
14
-’15
Natu
ral Reso
urces an
d E
nv
iron
men
talM
anag
emen
twater/sediment samples from selected points in the
drainage systems. Analysis of physico-chemical as well as
micro-biological parameters is carried out using APHA.
Temperature, pH, DO, BOD, nutrients, major ions and
heavy metals were also analysed. Batch adsorption
experiments (operational conditions such as pH, initial
concentration, agitation speed, contact time and temp) were
conducted to remove phosphate from simulated as well as
real samples. Initially the focus of the work was to
seasonally monitor the water/sediment quality of four
riverine systems (Karamana, Killiyar, Aamayizhanjanthodu
and Parvathy Puthanar) which are flowing through the
Trivandrum urban area. Secondly to evaluate the physico-
chemical and biological parameters for assessing the health
of the watershed regions. Finally, to develop an effective
adsorbent material using clays and clay minerals for effective
removal of phosphate from simulated as well as real
Table 4.2.15.1 Range of physico-chemical parameters observed in the study area
systems. The range of physico-chemical parameters is
presented in Table 4.2.15.1.
A series of batch adsorption experiments were carried out
to optimize the operational conditions for effective removal
of phosphate from water and wastewaters using bentonite-
alum system. The effect of contact time on the adsorption
of phosphate from aqueous phase onto bentonite clay was
determined (Fig. 4.2.15.1A). Equilibrium studies revealed
that the adsorption process can be best described by
Langmuir isotherm model rather than Freundlich model
(Fig. 4.2.15.1B). The equilibrium data for the adsorption
processes and thermodynamic parameters were presented
in Table 4.2.15.2 & 4.2.15.3 respectively.
Fig. 4.2.15.1 (A) Effect of contact time (contact time: 30 min, pH=4, adsorbant dosage=0.1g)
and (B) Langmuir isotherm plot for 40oc the adsorption of phosphate on to bentonite-alum system.
Table 4.2.15.2 The equilibrium data for the adsorption process
Table 4.2.15.3 Thermodynamic parameters for the adsorption process
Thermodynamic parameters such as
change in free energy (∆G°), enthalpy
(∆H°) and entropy (∆S°) were also
calculated using the following
equation,
where Ko is the equilibrium
constant. The values of Ko
were determined from the
intercepts obtained by
plotting ln qe/C
e versus q
e
and extrapolating to zero qe
at various temperatures
ranging from 10-40°C. The
plots of ln Ko versus 1/T
for phosphate was found to
be linear. The values of ∆H°
and ∆S° were obtained from
the slope and intercept of
the plots and were found to
be 40.46 kJ/mol and 14.28
J/mol/K respectively. The
positive value of ∆H°
indicates that the
adsorption process is
endothermic and
temperature dependent.
The values of ∆G° were found to be -1.43, -
0.02 and -0.04kJ/mol for the adsorption of
phosphate from aqueous solution at 10, 20
and 40oC respectively. The negative values of
7�
�
y�=�0.016x�+�0.106
R²�=�0.992
0
0.5
1
1.5
2
2.5
3
0 50 100 150
)
Parameter Samples collected from four rivers
Karamana Killiyar Aamayizhanjanthodu ParvathyPuthanar
pH 6.34-6.57 6.46-6.76 6.56-6.71 6.75-6.9
TDS (mg/L) 125.7-159.7 135-180 332.5-413.5 638.3-88
Phosphate (mg/L) 5.05-8.34 4.43-17.7 0.68-1.12 1.09-1.63
Nitrite (µg/L) 0.02-2.3 0.08-16.28 0.87-6.18 2.03-174.03
Ca hardness (mg/L) 10.42-12.02 11.22-14.42 33.66-40.08 38.47-62.52
Mg hardness (mg/L) 2.43-6.82 3.41-8.77 2.92-9.75 3.9-22.9
Total hardness (mg/L) 36-56 48-72 68-136 172-208
Adsorbent Temperature
(0C)
Langmuir isotherm Freundlich isotherm
Q0 (mg/g) b (L/mg) r2 KF
(mg/g) n(L/mg) r2
Bentonite clay in presence of alum
10 58.82 0.0442 0.952 3.999 1.8281 0.952 20 50.00 0.0877 0.974 7.0631 2.4807 0.931 30 38.46 0.1485 0.911 4.3853 1.9230 0.776 40 26.53 0.1509 0.992 9.8627 2.2573 0.962
8�
�
∆ ∆
∆
∆
∆ ∆
∆ ∆
∆
∆
∆
∆
Adsorbent Temperature (0C)
K0 ∆G0 (KJ/mol)
∆H0 (KJ/mol)
∆S0 (J/mol)
Bentonite clay in presence of
alum
10 0.049 -1.4258 40.46
14.28 20 2.159 -0.0217
40 4.741 -0.0414
8�
�
∆ ∆
∆
OO∆G = -RTlnK
O O
O
∆S ∆HlnK = -
R RT
where K is the equilibrium
∆ ∆
∆
∆
∆
∆
Adsorbent Temperature (0C)
K0 ∆G0 (KJ/mol)
∆H0 (KJ/mol)
∆S0 (J/mol)
Bentonite clay in presence of
alum
10 0.049 -1.4258 40.46
14.28 20 2.159 -0.0217
40 4.741 -0.0414

46
NC
ES
S A
nn
ual
Rep
ort
20
14
-’1
5N
atu
ral
Res
ou
rces
an
d E
nv
iro
nm
enta
lM
anag
emen
t
4
Pre-monsoon sampling was successfully conducted in
selected locations at Karamana River, Killiyar,
Aamayizhanjanthodu and Parvathy Puthanar in Trivandrum
urban area. Physico-chemical and biological parameters
were analysed and evaluated. Batch adsorption studies were
conducted and found that bentonite in presence of alum
is an effective adsorbent for the removal of phosphate from
water and wastewaters. The maximum adsorption was
found to be at pH 4.0 and equilibrium attained at 30 min.
Equilibrium studies revealed that adsorption follows the
Langmuir isotherm model. Application of bentonite clay
into riverine water samples is shown in Table 4.2.15.4.
Table 4.2.15.4 Adsorption of phosphate from riverine water samples
Water samples containing phosphate were analysed by usual
procedure and found that about 17mg/L and 10mg/L of
phosphate was present in Parvathy Puthanar and
Aamayizhanjanthodu respectively. In our experiments,
∆G° show the spontaneous adsorption of phosphate on
the adsorbent. The positive value of ∆S° suggested some
structural changes in adsorbent and adsorbate and also
reflects the affinity of the adsorbent material under
consideration towards phosphate ions.
The probable mechanism of phosphate adsorption onto
bentonite clay in presence of alum can be summarised as
follows:
maximum phosphate adsorption was found to be for 25
mg/L and therefore we made the real water sample
concentration into 25mg/L through spiking and by applying
suitable operational conditions (contact time 30 min & pH
4.0). The water samples from Parvathy Puthanar and
Aamayizhanjanthodu showed a qe value of 11mg/g (90.0%)
and 9.81mg/g (78.5%) respectively. This finding explains
the suitability of the adsorbent in real system for phosphate
removal.
Harsha Mahadevan & K. Anoop Krishnan
University of Kerala
4.2.16 Appraisal of Marine Ecosystem of Kavarathi Is-
land in Kochi in South West coast of India with special
reference to Lagoon system
The present study deals with the hydrochemical, marine
biological and geochemical characteristics of the lagoon
environment of the Lakshadweep Archipelago. As a
consequence of indiscriminative exploitation of water
resources and population explosion, the quality of well
water and nearby lagoon waters is constantly deteriorating
especially around the Kavaratti Island. Detailed
hydrogeological, geophysical and hydrochemical studies
have been carried out to characterise the ground waterresources and identify the
vulnerable areas of
Kavaratti. Biological
processes also impart
considerable influence in
the composition of coastal
waters and lagoon systems.
At the same time chemical
characteristics have an
important role in the productivity between oligotrophic
and eutrophic waters and life sustaining processes between
aerobic and anoxic waters. In the lagoon system of
Kavaratti, the composition of sea water is closely related
to the temporal and spacial variation of marine biological
resources. Pollution of Kavaratti is mainly due to microbial
means, as the industrial development was almost nil in the
region and the island has little or no suitable sewage
treatment in the coral reef area. The small oceanic islands
differ from the mainland and the major islands in their
aquifer geometry and hydrochemistry. In these small
oceanic islands, fresh groundwater occurs as a lens floating
over the saline water,and the freshwater lens is in hydraulic
continuity with seawater. The variation in quality ismore
pronounced in themargins of the freshwater lens than at
its centre .The coral islands are composed of calcareous
sand and the materials derived from coral atoll, which are
9�
�
Al �alum� OH � H Al � OH H ��Hydrolysis of alum��
� � � �
�
�
�
Waste water system Concentration (mg/L) q e (mg/g)
Simulated system 25mg/l 11.25 (90.0%)
Water sample collected from Parvathy Puthanar
17mg/L (phosphate present in real system) + 8mg/L (spiking)
11.00 (88.0%)
Water sample collected from Aamayizhanjanthodu
10mg/L (phosphate present in real system) + 15mg/L (spiking)
9.81 (78.5%)
�
H+ (Si, Al)-OH (Si, Al)-OH2+
-H2O Bentonite
�
H2PO4-�
(Si, Al)-O-P=O
OH
OH
�
Al (OH) 2+
Bentonite surface
pH = 4 (alum)
2 H2PO4- H+
H2PO4
H2PO4
�
�
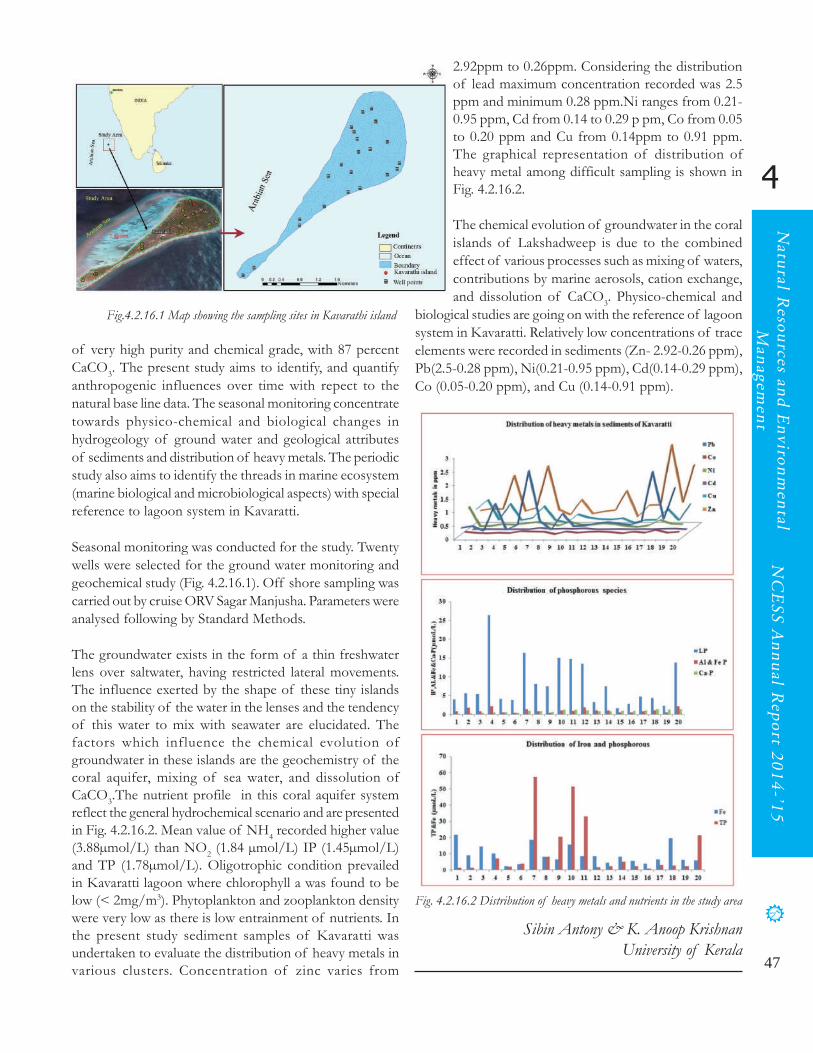
47
4
NC
ES
S A
nn
ual R
epo
rt 20
14
-’15
Natu
ral Reso
urces an
d E
nv
iron
men
talM
anag
emen
t
of very high purity and chemical grade, with 87 percent
CaCO3. The present study aims to identify, and quantify
anthropogenic influences over time with repect to the
natural base line data. The seasonal monitoring concentrate
towards physico-chemical and biological changes in
hydrogeology of ground water and geological attributes
of sediments and distribution of heavy metals. The periodic
study also aims to identify the threads in marine ecosystem
(marine biological and microbiological aspects) with special
reference to lagoon system in Kavaratti.
Seasonal monitoring was conducted for the study. Twenty
wells were selected for the ground water monitoring and
geochemical study (Fig. 4.2.16.1). Off shore sampling was
carried out by cruise ORV Sagar Manjusha. Parameters were
analysed following by Standard Methods.
The groundwater exists in the form of a thin freshwater
lens over saltwater, having restricted lateral movements.
The influence exerted by the shape of these tiny islands
on the stability of the water in the lenses and the tendency
of this water to mix with seawater are elucidated. The
factors which influence the chemical evolution of
groundwater in these islands are the geochemistry of the
coral aquifer, mixing of sea water, and dissolution of
CaCO3.The nutrient profile in this coral aquifer system
reflect the general hydrochemical scenario and are presented
in Fig. 4.2.16.2. Mean value of NH4 recorded higher value
(3.88µmol/L) than NO2 (1.84 µmol/L) IP (1.45µmol/L)
and TP (1.78µmol/L). Oligotrophic condition prevailed
in Kavaratti lagoon where chlorophyll a was found to be
low (< 2mg/m3). Phytoplankton and zooplankton density
were very low as there is low entrainment of nutrients. In
the present study sediment samples of Kavaratti was
undertaken to evaluate the distribution of heavy metals in
various clusters. Concentration of zinc varies from
Fig.4.2.16.1 Map showing the sampling sites in Kavarathi island
2.92ppm to 0.26ppm. Considering the distribution
of lead maximum concentration recorded was 2.5
ppm and minimum 0.28 ppm.Ni ranges from 0.21-
0.95 ppm, Cd from 0.14 to 0.29 p pm, Co from 0.05
to 0.20 ppm and Cu from 0.14ppm to 0.91 ppm.
The graphical representation of distribution of
heavy metal among difficult sampling is shown in
Fig. 4.2.16.2.
The chemical evolution of groundwater in the coral
islands of Lakshadweep is due to the combined
effect of various processes such as mixing of waters,
contributions by marine aerosols, cation exchange,
and dissolution of CaCO3. Physico-chemical and
biological studies are going on with the reference of lagoon
system in Kavaratti. Relatively low concentrations of trace
elements were recorded in sediments (Zn- 2.92-0.26 ppm),
Pb(2.5-0.28 ppm), Ni(0.21-0.95 ppm), Cd(0.14-0.29 ppm),
Co (0.05-0.20 ppm), and Cu (0.14-0.91 ppm).
Fig. 4.2.16.2 Distribution of heavy metals and nutrients in the study area
Sibin Antony & K. Anoop Krishnan
University of Kerala

48
NC
ES
S A
nn
ual
Rep
ort
20
14
-’1
5N
atu
ral
Res
ou
rces
an
d E
nv
iro
nm
enta
lM
anag
emen
t
4
4.3 Coastal Zone Management (CZM)
4.3.1 Integrated Island Management Plan (IIMP) for
Lakshawdeep islands
The preparation of Integrated Island Management Plan
(IIMP) for all the inhabited islands of Lakshadweep has
been accomplished in accordance with the guidelines
provided in the Island Protection Zone Notification of
MoEF, 2011. The plan preparation was supervised by a
Technical Committee constituted by the Supreme Court
of India in 2012 under Chairmanship of Justice R.V.
Raveendran, Supreme Court Judge(Rtd). The entire island
zone including the aquatic area were considered for the
preparation of IIMP plan. The digital data base on 1:4000
scale was utilized for mapping different physical
characteristics of the island. Areas indicating the dwelling
units including the infrastructure projects such as schools,
markets, hospitals, public facilities, road net work were
brought into the digital map with all their characteristics.
The conservation and preservation schemes were mapped
separately. The data on the coral ecosystems which were
mapped utilizing the satellite imageries of 2007 were also
incorporated. Vulnerability map showing the elevation of
the island with respect to the MSL has been worked out.
This map will be utilized to assess the vulnerability to
human life and property. This will also help to indicate
suitable areas that are safe for locating dwelling units,
infrastructure and appropriate safeguard measures to
protect the life and property of the local communities.
Mapping of HTL and No Development Zone in the island
has also been completed. An approach for identification
of Buffer zone/Setback line for Conservation/
Preservation in the islands has been worked out keeping
the natural threats such as high waves storm surges,
horizontal shoreline displacement and sea level changes in
the islands.
The final report and IIMP plan in respect of 10 inhabited
islands viz., Agatti, Amini, Androth, Bitra, Chetlet,
Kavaratti, Kadamat, Kalpeni, Kiltan and Minicoy were
completed and submitted to the UT Lakshadweep
Administration. The public interaction and field visits to
the related representative islands were also completed. The
draft IIMP for 3 uninhabited islands were also completed
and submitted to UTL.
T. N. PrakashFunding: DST, UT of Lakshawdeep
4.4 GIS and Remote Sensing Applica-tions in Natural Resources Manage-ment
4.4.1 Setting up of modular data centre
Main purpose of this infrastructure is to organize and share
the available geospatial data in inter-operable and open
standard format. Based on the comprehensive request for
proposal tender was released to supply, instal and
commissioning of server and storage in a virtual
environment. As depicted in the Fig. 4.4.1.1, the proposed
infrastructure comprises of modular rack, physical servers,
SAN switches, SAN storage and tape library. The three
physical servers will act as three VMware hosts. The
vSphere hypervisor shall be installed on these 3 physical
servers in order to virtualize them.
14�
Fig. 4.1.7.3.1 Logical schematic of the proposed solution of hardware architecture The cluster shall be configured in such a way that the cluster is capable of High availability and Distributed Resource Scheduling (DRS). SAN Storage comprises of dual controllers and an enclosure module and disks will be grouped using appropriate RAID, thus ensuring high availability for controllers and disks respectively. The servers and data storage will be hosted at the Central Geomatics Lab of NCESS.
M.Samsuddin, B.K. Jayaprasad 4.1.8Preparation of Management Action Plan for Eco-restoration of Vembanad Lake Ecosystem Vembanad lake is one of the three Ramsar sites in Kerala and greatly influences the social, economic and environmental aspects of the state. However, the wetland is increasingly under severe stress due to various anthropogenic and environmental pressures. Though there are various studies and reports highlighting the internal and external factors impinging upon the very existence of Vembanad Lake and its inflowing rivers, there is no holistic management action plan that could be implemented for eco-restoration of the lake and its catchments. Therefore, a project has been conceived for preparing an implementable action plan for restoring the Vembanad lake and its river catch meets drained by Achankoil, Pamba, Manimala, Meenachil and Muvattupuzha rivers in line with the guidelines of National Lake and River Conservation Plan (NLRCP). Detailed inventory has been carried out on various studies pertaining to the environmental aspects of Vembanad Lake and rivers, field level information gathered for assessing the state of environment of the ecosystems and environmental evaluation carried out for delineating the environmental issues, causative factors, resultant pressure, present state, impact and stakeholder responses. Based on this, position papers on the five rivers and lake have been prepared. Detailed watershed analysis has been carried out for the five river catchments and catchment area conservation plans have been prepared.
Fig. 4.4.1.1 Logical schematic diagram of the proposed of hardware
architecture of modular data centre.
The cluster shall be configured in such a way it is capable
of High availability and Distributed Resource Scheduling
(DRS). SAN Storage comprises of dual controllers and an
enclosure module and disks will be grouped using appro-
priate RAID, thus ensuring high availability for controllers
and disks respectively. The servers and data storage will be
hosted at the Central Geomatics Lab of NCESS.
M. Samsuddin & B. K. Jayaprasad

49
4
NC
ES
S A
nn
ual R
epo
rt 20
14
-’15
Natu
ral Reso
urces an
d E
nv
iron
men
talM
anag
emen
t4.4.2 Spatial Urban Information System using open
source software
Main focus of the programme is to generate and
disseminate spatial/non spatial digital database including
socio economic data in the Malappuram municipal area
through a customized information system with thrust on
planning, management and decentralized governance.World
view 2 satellite data (with spatial resolution of 0.50m Mx
and 2 m PAN) was used in conjunction with Global
Positioning System (GPS) and field survey data for
preparing the database. WV02 satellite data was precisely
geo-corrected using Differential Global Positioning System
values. Various thematic layers such as land use/land cover,
road network, water bodies, settlements, building foot
prints, assets, utilities, services, religious institutions and
amenities etc, were derived in 1:4000 scale.The thematic
layers were integrated with socio-economic database and
were reproduced in WGS-84 Datum and UTM Projection.
�
Fig. 4.4.2.1 Customized Urban Information System
Individual village level cadastral sheets were Geo-
Referenced with respect to the DGPS coordinate values.
Cadastre was vectorized and linked to the survey parcels.
Attribute data with respect to the location, resource
database including socio-economic data collected from the
field has also been linked in a GIS platform.
By integrating the thematic layers and attribute data of
societal importance, a web based user-friendly customized
information system (Fig. 4.4.2.1) has been designed and
developed in open source platform. The decision support
modules provide flexible environment for data handling,
resource query, update analysis and provide inputs into the
master/zonal planning and utilities management.
The user can explore, update and extract reliable cadastre
level spatial database according to their requirement.The
application has been modified to incorporate all the .jpg
images of buildings/properties along with building details
collected through the socio-economic survey. After
modification of application with spatial search module and
application tools the customized application has been
hosted.B. K. Jayaprasad
Funding: Information Kerala Mission, LSG
Department, Govt. of Kerala
4.4.3 A Customized OSSGIS Application for Veg-
etable and Fruit Promotion Council Keralam (VFPCK)
for Management of Soil Nutrients
Vegetables and Fruit Promotion Council Keralam
(VFPCK), the successor of Kerala Horticulture
Development Programme(KHDP) is a Kerala Government
Public Sector Undertaking. VFPCK has awarded a project
to this centre for developing a Open Source GIS
customized application software for the management of
soil nutrients in 162 Grama Panchayats covering fourteen
districts of Kerala using Open source Mapserver and
PostgreSQL. The objective of the project is to build
application software using the existing thematic digital
database of land use/land cover, geomorphology, soil etc.
and updating with the data pertaining to the soil (macro &
micro) nutrients of the panchayat to help farmers engaged
in the horticulture development program for the application
of proper manures on need basis in their farms.
Thus customized GIS application software has been
developed using open source software to show the GPS
coordinates of soil sample locations collected and provided
by VFPCK for selected 162 panchayats of Kerala. Open
source software used for the development of Customized
GIS application are Map Server 4 Windows 2.2.3, Web
server (Apache-HTTP), PHP 5.2, JavaScript, PostGIS
enabled Postgre SQL8.4 and Quantum GIS 0.11.0 . The
software shall be hosted in intra-net/internet and there is
no license required for any deployment.
The application has a menu comprising pan, zoom-in,
zoom-out, recenter, measure, display current extent and
map legend. It has the facility to identify the attributes of
a thematic layer by using a mouse click. The application
has the provision to add the coordinates of latitude/
longitude values in Degrees, Minutes and Seconds (DMS)
for inserting a point shape in the appropriate location based
on the graticule (latitude & longitude) values. Apart from
that, functions such as “Query”, “View data”, “View
legend”, “Export attributes in .xls format”, “add point”,
“import excel”, “delete excel”, “remove point” are also

50
NC
ES
S A
nn
ual
Rep
ort
20
14
-’1
5N
atu
ral
Res
ou
rces
an
d E
nv
iro
nm
enta
lM
anag
emen
t
4
Fig 4.4.3.1 Soil sample sites in land use of Chelakkara Panchayat
B. K. Jayaprasad
Funding: Vegetable and Fruit Promotion Council,
Govt. of Kerala
available. The variation of micro and macro nutrients
distribution of the soil parameters are also displayed in
graphs and charts. The customized application has been
hosted in the site address http://14.139.171.147/VFPCK
4.4.4 Geographic Information System of the Particularly
Vulnerable Tribal Groups of Kerala
The tribal communities of the state are at varying degrees
of socio-economic educational and political advancements.
A few of them are very much adapted to the mainstream
life and are living as part of it. However, there are certain
communities who are still leading more or less an isolated
life either within the rural society or away from it in the
forest terrain. Eight among the 36 Scheduled Tribe
communities of the state are categorized as Particularly
Vulnerable Tribal Groups (PTG) since they are the most
The point data such as spatial location of the PTGs, as
provided by KIRTADS in standard geographic reference
datum and projection viz., WGS 84 datum & UTM Zone
43 projection. The spatial location of amenities like
hospitals/Primary Health Centers, Government Officers,
etc., were integrated to the existing digital database such as
drainage, road network (Fig. 4.4.4.1), landuse/land cover
and soil pattern in 1:250,000 scale generated by NCESS. A
vulnerable sections amidst the ST’s of the State. The present
work is an outcome of the study undertaken jointly by
NCESS and KIRTADS for generation of a digital database
pertaining to the hamlets of the Particularly Vulnerable
Tribal Groups (PTG’s) spread across six districts of the
state in order to accelerate the development process among
the tribal communities. Main objective of the project is to
develop a customized information system for the PTGs
by integrating the existing digital resource database and
updating the information with the data pertaining to the
spatial location of the house hold of these tribal groups.
Both primary and secondary data were used in the study.

51
4
NC
ES
S A
nn
ual R
epo
rt 20
14
-’15
Natu
ral Reso
urces an
d E
nv
iron
men
talM
anag
emen
t
17�
Fig. 4.1.11.1 Spatial Distribution Tribal population in Malappuram District The point data such as spatial location of the PTGs, as provided by KIRTADS in standard geographic reference datum and projection viz., WGS 84 datum & UTM Zone 43 projection. The spatial location of amenities like hospitals/Primary Health Centers, Government Officers, etc., were integrated to the existing digital database such as drainage, road network (Fig. 4.1.11.1), landuse/land cover and soil pattern in 1:250,000 scale generated by CESS.An user friendly Tribal Settlement Information System (TSIS) has been developed with all basic functionalities customized for viewing, analyzing, editing, updating and retrieving and analyzing the information pertaining to the selected particularly vulnerable tribal groups of Kerala (Fig. 4.1.12.2) Attribute data with respect to the location of PTG household and resource database including socio-economic data has been linked in a GIS platform, so that desired information can be retrieved based on user query.
Fig. 4.4.4.1 Spatial distribution tribal population in Malappuram District
Fig. 4.4.4.2 The tribal information system
Archana M. Nair & B. K. Jayaprasad
Funding: KIRTADS, Govt. of Kerala
user - friendly Tribal Settlement Information System (TSIS)
has been developed with all basic functionalities customized
for viewing, analyzing, editing, updating and retrieving and
analyzing the information pertaining to the selected
particularly vulnerable tribal groups of Kerala (Fig. 4.4.4.2)
Attribute data with respect to the location of PTG
household and resource database including socio-economic
data has been linked in a GIS platform, so that desired
information can be retrieved based on user query.
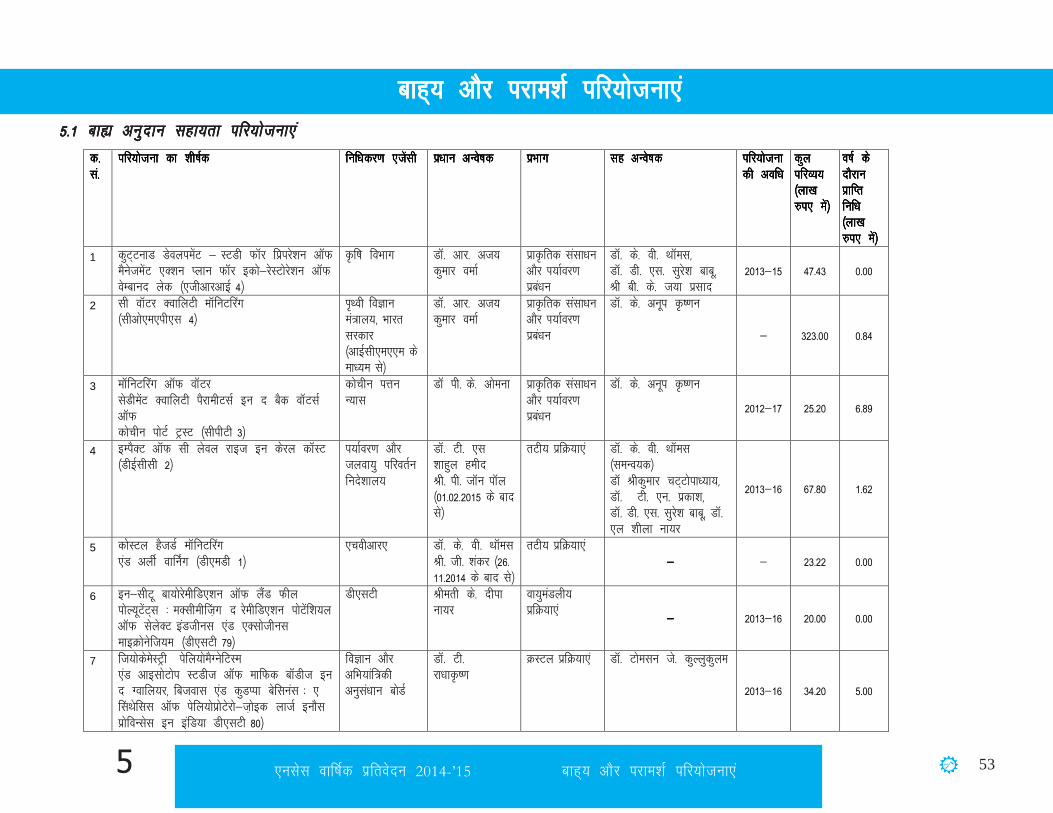
5 53,ulsl okf”kZd izfrosnu 2014-’15 Ckkg~; vkSj ijke'kZ ifj;kstuk,a
5-1 cká vuqnku lgk;rk ifj;kstuk,a5-1 cká vuqnku lgk;rk ifj;kstuk,a5-1 cká vuqnku lgk;rk ifj;kstuk,a5-1 cká vuqnku lgk;rk ifj;kstuk,a5-1 cká vuqnku lgk;rk ifj;kstuk,a
Ckkg~; vkSj ijke'kZ ifj;kstuk,aCkkg~; vkSj ijke'kZ ifj;kstuk,aCkkg~; vkSj ijke'kZ ifj;kstuk,aCkkg~; vkSj ijke'kZ ifj;kstuk,aCkkg~; vkSj ijke'kZ ifj;kstuk,a
�
�
dddd---- lalalala----
ifj;kstukifj;kstukifj;kstukifj;kstuk dkdkdkdk 'kh"kZd'kh"kZd'kh"kZd'kh"kZd fuf/kdj.kfuf/kdj.kfuf/kdj.kfuf/kdj.k ,tsalh,tsalh,tsalh,tsalh iz/kkuiz/kkuiz/kkuiz/kku vUos"kdvUos"kdvUos"kdvUos"kd izHkkxizHkkxizHkkxizHkkx lglglglg vUos"kdvUos"kdvUos"kdvUos"kd ifj;kstukifj;kstukifj;kstukifj;kstuk dhdhdhdh vof/kvof/kvof/kvof/k
dqydqydqydqy ifjO;;ifjO;;ifjO;;ifjO;; ¼¼¼¼yk[k yk[k yk[k yk[k #i,#i,#i,#i, esa½esa½esa½esa½
o"kZo"kZo"kZo"kZ dsdsdsds nkSjkunkSjkunkSjkunkSjku izkfIrizkfIrizkfIrizkfIr fuf/kfuf/kfuf/kfuf/k ¼¼¼¼yk[k yk[k yk[k yk[k #i,#i,#i,#i, esa½esa½esa½esa½
1 dqV~VukM MsoyiesaV & LVMh QkWj fizijs'ku vkWQ eSustesaV ,D'ku Iyku QkWj bdks&jsLVksjs'ku vkWQ osEckun ysd ¼,thvkjvkbZ 4½
—f"k foHkkx MkW- vkj- vt; dqekj oekZ
izkÑfrd lalk/ku vkSj Ik;kZoj.k izca/ku
MkW- ds- oh- FkkWel] MkW- Mh- ,l- lqjs'k ckcw] Jh ch- ds- t;k izlkn
2013&15 47-43 0-00
2 lh okWVj DokfyVh ekWfuVÇjx ¼lhvks,e,ih,l 4½
Ik̀Foh foKku ea=ky;] Hkkjr ljdkj ¼vkbZlh,e,,e ds ek/;e ls½
MkW- vkj- vt; dqekj oekZ
izkÑfrd lalk/ku vkSj Ik;kZoj.k izca/ku
MkW- ds- vuwi —".ku
& 323-00 0-84
3 ekWfuVÇjx vkWQ okWVj lsMhesaV DokfyVh iSjkehVlZ bu n cSd okWVlZ vkWQ dksphu iksVZ VªLV ¼lhihVh 3½
dksphu iŸku U;kl
MkW ih- ds- vkseuk izkÑfrd lalk/ku vkSj Ik;kZoj.k izca/ku
MkW- ds- vuwi —".ku
2012&17 25-20 6-89
4 bEiSDV vkWQ lh ysoy jkbt bu dsjy dkWLV ¼MhbZlhlh 2½
i;kZoj.k vkSj tyok;q ifjorZu funs'kky;
MkW- Vh- ,l 'kkgqy gehn Jh- ih- tkWu ikWy ¼01-02-2015 ds ckn ls½
rVh; izfØ;k,a MkW- ds- oh- FkkWel ¼leUo;d½ MkW Jhdqekj pV~Vksik/;k;] MkW- Vh- ,u- izdk'k] MkW- Mh- ,l- lqjs’k ckcw] MkW- ,y 'khyk uk;j
2013&16 67-80 1-62
5 dksLVy gStMZ ekWfuVÇjx ,aM vyhZ okÉux ¼Mh,eMh 1½
,pohvkj,
MkW- ds- oh- FkkWel Jh- th- ‘kadj ¼26-11-2014 ds ckn ls½
rVh; izfØ;k,a &&&& & 23-22 0-00
6 bu&lhVw ck;ksjsehfM,'ku vkWQ ySaM Qhy iksY;wVsaV~l % eDlhehÇt+x n jsehfM,'ku iksVsaf'k;y vkWQ lsysDV baMthul ,aM ,Dlksthul ekbØksusft;e ¼Mh,lVh 79½
Mh,lVh Jherh ds- nhik uk;j
ok;qeaMyh; izfØ;k,a
&&&& 2013&16 20-00 0-00
7 ft;ksdsesLVªh isfy;kseSXusfVLe ,aM vkblksVksi LVMht vkWQ ekfQd ckWMht bu n Xokfy;j] fctokl ,aM dqMIik csflual % , ÇlFksfll vkWQ isfy;ksizksVsjks&t+ksbd yktZ bukSl izksfoUlsl bu bafM;k Mh,lVh 80½
foKku vkSj vfHk;kaf=dh vuqla/kku cksMZ
MkW- Vh- jk/kk—".k
ØLVy izfØ;k,a MkW- Vkselu ts- dqYyqdqye
2013&16 34-20 5-00

,ulsl okf”kZd izfrosnu 2014-’15Ckkg~; vkSj ijke'kZ ifj;kstuk,a554
�
�
8 ,uok;uZesaVy LVMht vkWQ n osVySaM flLVe vkWQ dksYye&uhandkjk ,UM ,lksflVsM baySaM~l ¼,QihMh 1½
eRL; ikyu vkSj iŸku foHkkx
MkW- ,- Ñ".kdqekj
izkÑfrd lalk/ku vkSj Ik;kZoj.k izca/ku
MkW- jsth Jhfuokl MkW- ds- vuwi —".ku] MkW- Vkselu ts- dqYyqdqye
2013&15 8-18 0-00
9 gStMZ oYusjsfcfyVh ,aM fjLd vlslesaV vkWQ n LVsV ,t+ ikVZ vkWQ izsisÇjx fMtkLVj eSustesaV Iyku QkWj n LVsV ¼,pohvkj,½
jktLo foHkkx Jh- th- 'kadj ØLVy izfØ;k,a &&&& 2011&15 4-56 0-00
10 dsMsLVjy Ldsy lhvkjt+sM eSIl QkWj vcZu ,fj;kt bu dsjy( Qst 1 & dkst+ghdksMs] dksYye ,aM f=osaæe dkWiksZjs'kal ,aM ojdyk E;qfuflisfyVh ¼ds,llh,l 6½
ds,llh,lVhbZ MkW- ds- oh- FkkWel ØLVy izfØ;k,a Jh Mh jktw] Jh ,l eksguu] Jh ,e jes'k dqekj 2006&15 6-99 0-00
11 dsMsLVjy Ldsy lhvkjt+sM eSIl QkWj vcZu ,fj;kt bu dsjy % Qst 2&dksPph dkWjiksZjs'ku] ejnq ,aM dkUgkuxM+ E;qfufliSfyVh ¼ds,llh,l 17½
ds,llh,lVhbZ MkW- jsth Jhfuokl ØLVy izfØ;k,a Jh Mh jktw] Jh ,l eksguu] Jh ,e jes'k dqekj Jh Jh ,e- ds- Jhjkt Jh ,e- ds- jQhd
2011&15 25-00 0-00
12 lh ysoy psat ,aM bV~l bEiSDV~l ¼ds,llh,l 18½
ds,llh,lVhbZ MkW- ds- oh- FkkWel ØLVy izfØ;k,a MkW- Vh- ,l- 'kkgqy gehn 2011&16 81-54 0-00
13 ekWfuVÇjx Xykscy psat bEiSDV~l bu lákfæ ¼osLVuZ ?kkV~l½ ¼ds,llh,l 21½
ds,llh,lVhbZ MkW- , Ñ”.k dqekj izkÑfrd lalk/ku vkSj Ik;kZoj.k izca/ku
Jh ch- ds- t;kizlkn 2011&15 63-46 0-00
14 isfy;ksDykbesV ,aM lh ysoy fjdkM~lZ bu n ysV DokVuZjh lsMhesaV~l vkWQ dkWLVy osVySaM~l vkWQ ifYydky ,aM vpkudksfoy fjoj csflual] dsjy&bV~l bfEIyds'kUl vkWu dkWLVy boksyw'ku ¼ds,llh,l 24½
ds,llh,lVhbZ MkW- Mh ineyky izkÑfrd lalk/ku vkSj Ik;kZoj.k izca/ku
MkW- ds- ek;k
2011&15 10-54 0-00
15 ,uok;uZesaV eSustesaV Vªsfuax ¼ds,llh,l 28½ ds,llh,lVhbZ MkW- ds- oh FkkWel MkW- Mh- lqjs’k ckcw ¼26-11-2014 ds ckn ls½
ØLVy izfØ;k,a MkW- Mh- ,l- lqjs’k ckcw
2014&15 4-00 4-00
16 dksLVy tksu eSustesaV Iyku vkWQ dsjy fon~ fjLisDV Vq dksLVy jsxqys’ku tksu ¼ds,llh,l 29½
ds,llh,lVhbZ MkW- ds- oh FkkWel MkW- Vh- ,u- izdk’k ¼26-11-2014 ds ckn ls½
ØLVy izfØ;k,a MkW- Mh- ,l- lqjs’k ckcw] MkW- ds- jktw] Jh ch- ds- t;kizlkn] MkW- jsth Jhfuokl 2014&15 299-75 45-00
17 buosLVhxs’ku vaMjxzkmaM LVªDplZ ,V vksoj & fczt Vq ,l,y fFk,Vj LVªsp vkWQ jksM ;wftax besftax jsftfLVfoVh okWVj ¼ds,l;wMhih 2½
dsjy LFkk;h ‘kgjh fodkl ifj;kstuk]
MkW- vkj- vt;dqekj oekZ
izkÑfrd lalk/ku vkSj Ik;kZoj.k izca/ku
& 2014&15 1-15 0-69

5 55,ulsl okf”kZd izfrosnu 2014-’15 Ckkg~; vkSj ijke'kZ ifj;kstuk,a
�
�
LFkkuh; Lo’kklu foHkkx] dsjy ljdkj
18 ekWMÇyx ,VeksLQsfjd ikWY;w'ku ,aM usVofdZax ¼,e,ih,u½
Hkkjrh; m".kdfVca/kh; ekSle foKku laLFkku
MkW- vkj- vt; dqekj oekZ
ok;qeaMyh; izfØ;k,a
&&&& 2013&17 20-32 2-77
19 ekWfuVÇjx bafM;u 'khYM lslehflVh foFk 10 chch,l Vw vaMjLVSaM flLeksVsDVkWfuDl vkWQ n jhtu ;wÇlx oh&lsV dusfDVfoVh ¼,evksbZ,l5½
i`Foh foKku ea=ky;] Hkkjr ljdkj
Jhdqekjh ds'kou ØLVy izfØ;k,a
&&&& 2010&15 13-93 0-00
20 isfy;ks ¶yqbM~l bu n isVªksfyQsjksl csflual vkWQ osLVuZ vkWQ'kksj bafM;k ¼,evksbZ,l 7½
i`Foh foKku ea=ky;] Hkkjr ljdkj
MkW- oh- uandqekj
ØLVy izfØ;k,a MkW- ds- ujsUæ ckcw
2011&15 265-67 0-00
21 gSoh feujy dsfeLVªh bu fMQjsaV lkslZ jkWDl ,aM dkWLVy lsMhesaV~l vkWQ ,lMCY;w dkWLV vkWQ bafM;k % vaMjLVSaÇMx izksosuUl ,aM izkslslst bu Iyslj fMikWftV QkesZ'ku ¼,evksbZ,l 8½
i`Foh foKku ea=ky;] Hkkjr ljdkj
MkW- th- vkj- johaæ dqekj
ØLVy izfØ;k,a MkW- Vh- ,u- izdk'k
2012&15 18-36 0-00
22 ,LVSfCy'kesaV ,aM esaVsusal vkWQ oso xst LVs'kUl vykWUx n lkmFkosLV dkWLV vkWQ bafM;k ¼,evksbZ,l 9½
vkbZ,ulhvksvkbZ,l] ,evksbZ,l,] Hkkjr ljdkj
MkW- ,y- 'khyk uk;j
ØLVy izfØ;k,a MkW- jsth Jhfuokl MkW- Vh- ,l- 'kkgqy gehn 2013&17 98-49 15-84
23 'kksjykbu eSÇix QkWj osLV dkWLV vkWQ bafM;k ¼,evksbZ,l 10½
vkbZlh,e,,e] ,evksbZ,l] Hkkjr ljdkj
MkW- ds- oh- FkkWel MkW- Vh- ,l- ‘kkgqy gehn ¼26-11-2014 ds ckn ls½ MkW- ,y- ‘khyk uk;j ¼01-02-2015 ds ckn ls½
ØLVy izfØ;k,a
& 2013&17 190-00 0-00
24 Iksfy;kseSXusfVd buosLVhxs’ku ,ØkWl n ou fd-eh- ykWUx dks;uk fMªy dksj ¼,evksbZ,l 11½
Ik̀Foh foKku ea=ky;] Hkkjr ljdkj
MkW- Vh- jk/kkÑ”.k ØLVy izfØ;k,a & 2014&17 9-25 4-63
25 ekWfuVfjax bafM;u ‘khYM lsbfeflVh fon~ 10 chch,l Vw vaMjLVSaM lkbLeksVsDVksfuDl vkWQ n fjtu ;wftax oh,l,Vh dusfDVfoVh & dafVU;wM
Ik̀Foh foKku ea=ky;] Hkkjr ljdkj
Jhdqekjh ds'kou ØLVy izfØ;k,a MkW- lh- ds- lkseu ¼ds,QvkjvkbZ½ 2014&17 13-04 4-15
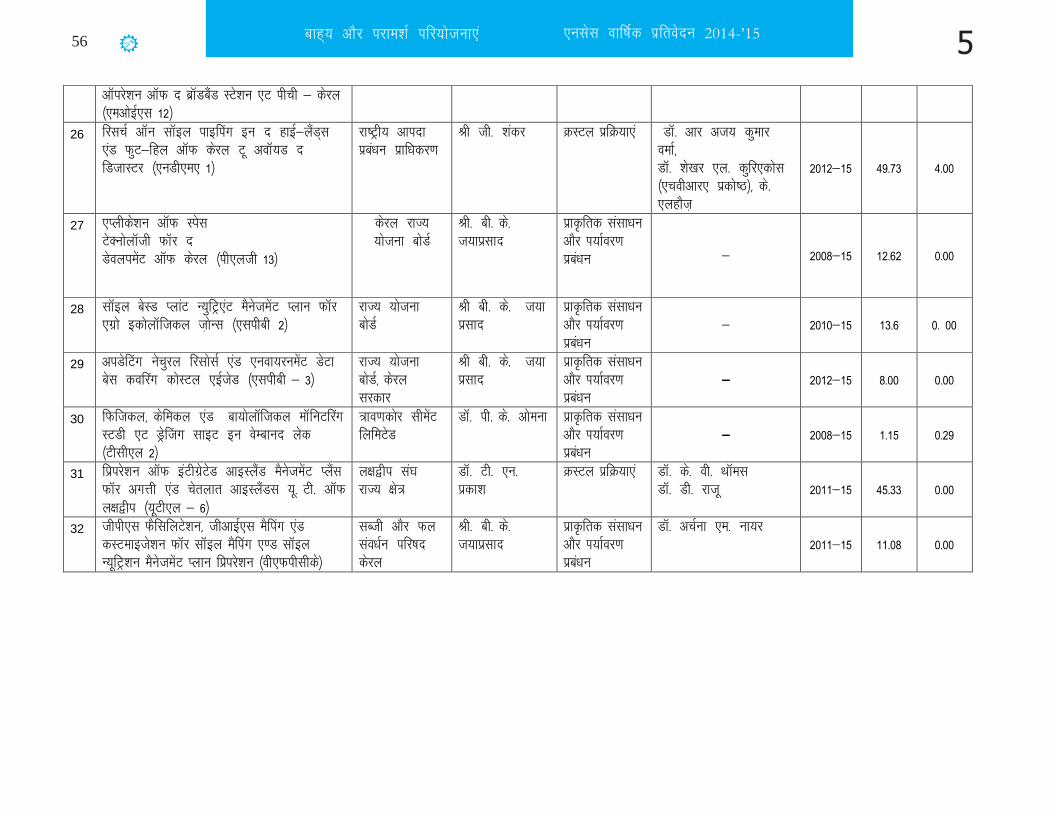
,ulsl okf”kZd izfrosnu 2014-’15Ckkg~; vkSj ijke'kZ ifj;kstuk,a556
�
�
�
�
�
�
�
vkWijs’ku vkWQ n czkWMcSaM LVs’ku ,V ihph & dsjy ¼,evksbZ,l 12½
26 fjlpZ vkWu lkWby ikbÇix bu n gkbZ&ySaM~l ,aM QqV&fgy vkWQ dsjy Vw vokW;M n fMtkLVj ¼,uMh,e, 1½
jk"Vªh; vkink izca/ku izkf/kdj.k
Jh th- 'kadj ØLVy izfØ;k,a MkW- vkj vt; dqekj oekZ] MkW- 'ks[kj ,y- dqfj,dksl ¼,pohvkj, izdks"B½] ds- ,ygkSt+
2012&15 49-73 4-00
27 ,Iyhds'ku vkWQ Lisl VsDuksykWth QkWj n MsoyiesaV vkWQ dsjy ¼ih,yth 13½
dsjy jkT; ;kstuk cksMZ
Jh- ch- ds- t;kizlkn
izkÑfrd lalk/ku vkSj Ik;kZoj.k izca/ku & 2008&15 12-62 0-00
28 lkWby csLM IykaV U;qfVª,aV eSustesaV Iyku QkWj ,xzks bdksykWftdy t+ksUl ¼,lihch 2½
jkT; ;kstuk cksMZ
Jh ch- ds- t;k izlkn
izkÑfrd lalk/ku vkSj Ik;kZoj.k izca/ku
& 2010&15 13-6 0- 00
29 viMsÇVx uspqjy fjlkslZ ,aM ,uok;juesaV MsVk csl doÇjx dksLVy ,bZtsM ¼,lihch & 3½
jkT; ;kstuk cksMZ] dsjy ljdkj
Jh ch- ds- t;k izlkn
izkÑfrd lalk/ku vkSj Ik;kZoj.k izca/ku
&&&& 2012&15 8-00 0-00
30 fQftdy] dsfedy ,aM ck;ksykWftdy ekWfuVÇjx LVMh ,V MªsÇtx lkbV bu osEckun ysd ¼Vhlh,y 2½
=ko.kdksj lhesaV fyfeVsM
MkW- ih- ds- vkseuk izkÑfrd lalk/ku vkSj Ik;kZoj.k izca/ku
&&&& 2008&15 1-15 0-29
31 fizijs'ku vkWQ baVhxzsVsM vkbLySaM eSustesaV IySal QkWj vxŸkh ,aM psrykr vkbLySaMl ;w- Vh- vkWQ y{k}hi ¼;wVh,y & 6½
y{k}hi la?k jkT; {ks=
MkW- Vh- ,u- izdk'k
ØLVy izfØ;k,a MkW- ds- oh- FkkWel MkW- Mh- jktw 2011&15 45-33 0-00
32 thih,l QSflfyVs'ku] thvkbZ,l eSfiax ,aM dLVekbts'ku QkWj lkWby eSfiax ,.M lkWby U;wfVª'ku eSustesaV Iyku fizijs'ku ¼oh,Qihlhds½
lCth vkSj Qy lao/kZu ifj"kn dsjy
Jh- ch- ds- t;kizlkn
izkÑfrd lalk/ku vkSj Ik;kZoj.k izca/ku
MkW- vpZuk ,e- uk;j 2011&15 11-08 0-00

5 57,ulsl okf”kZd izfrosnu 2014-’15 Ckkg~; vkSj ijke'kZ ifj;kstuk,a
5-2 ijke'kZ ifj;kstuk,a % rVh; fofu;eu {ks= ds fy, ,pVh,y vkSj ,yVh,y dk lhekadu5-2 ijke'kZ ifj;kstuk,a % rVh; fofu;eu {ks= ds fy, ,pVh,y vkSj ,yVh,y dk lhekadu5-2 ijke'kZ ifj;kstuk,a % rVh; fofu;eu {ks= ds fy, ,pVh,y vkSj ,yVh,y dk lhekadu5-2 ijke'kZ ifj;kstuk,a % rVh; fofu;eu {ks= ds fy, ,pVh,y vkSj ,yVh,y dk lhekadu5-2 ijke'kZ ifj;kstuk,a % rVh; fofu;eu {ks= ds fy, ,pVh,y vkSj ,yVh,y dk lhekadu
,pVh,y] ,yVh,y vkSj lhvkjtsM fofu;eu ykbuksa dk lhekadu fd;k x;k gS vkSj 2014&15 ds nkSjku fuEufyf[kr ifj;kstukvksa ds fy, rS;kj lhvkjtsM ekufp=AlhvkjtsM fLFkfr fjiksVZ vyx vyx DykbaVksa ds fy, rS;kj vkSj tek Hkh dh xbZA 2014&15 ds nkSjku iwjh dh xbZ lhvkjtsM fjiksVksZa dh lwph rkfydk 5-2-1 esa nh xbZgSA
rkfydk 5-2-1 % 2014&15 dh vof/k ds nkSjku rS;kj lhvkjtsM fjiksVks Z a dh lwph�
�
ØØØØ---- lalalala---- laLFkku @ ,tsalhlaLFkku @ ,tsalhlaLFkku @ ,tsalhlaLFkku @ ,tsalh Ikfj;kstukIkfj;kstukIkfj;kstukIkfj;kstuk LFkkuLFkkuLFkkuLFkku
1 Eks- tud oklokuh eqacbZ ¼vyhckx] jk;x<+ esa uosnj & uoxkao½ izLrkfor LFky uosnj & uoxkao] jk;x<+] egkjk”Vª
2 es- tud oklokuh eqacbZ ¼vyhckx] jk;x<+ esa feydV[kkj½ izLrkfor LFky vyhx<+] jk;x<+] egkjk”Vª feydV[kkj
3 Eks- ;wds,u izkWIVhZt] Qsjksds] dksf>dksM+s vikVZesaV dk fuekZ.k Qsjksds] dksf>dksM+s] dsjy
4 vykikM] dksYyke] dsjy esa bafM;u js;j vFkZl fyfeVsM ¼vkbZvkjbZ,y½ ekbfuax CykWDl] ^,uds 4* ,aM ^,uds 4 bZbZ*
[kuu CykWd vykikM] dksYyke] dsjy
5 dksphu iksVZ VªLV] fofyaxVu }hi] dksph fodkl LFky fofyaxVu }hi] dksph] dsjy
6 gkcZj bathfu;fjax dsjy foHkkx ¼fpydwj] ojdyk esa feuh fQ’kjh gkcZj½
feuh fQ’kjh gkcZj dk fuekZ.k ojdyk] fr#ouariqje] dsjy
7 Eks- Jhookyk bLVsV MsoyilZ izk- fy-] egkjk”Vª fodkl LFky fuyts xkao] dY;k.k rkyqdk
8 Eks- vkbZ & jkbt fcYMlZ & MsoyilZ fy-] FkkykLlsjh] dUuwj jsthMsaf’k;y vikVZesaV ifj;kstuk FkkykLlsjh] dUuwj] dsjy
9 fpFkjkefydk] FkkWel Mksfefud] ,ukZdqyke Hkou dk fuekZ.k Fksojk] dksph] dsjy
10 es- valy fcYMosy fy-] ospwj fjt+kWVZ MsoyiesaV ospwj] dksV~Vk;e] dsjy
11 fotu ojdyk baÝkLVªDpj MsoyiesaV dkWiksZjs’ku dyk izn’kZu ds fy, dsanz dh LFkkiuk odZyk] fr#ouariqje] dsjy
12 es- vyekl vk;qosZfnd fjt+kWVZ] iqjFkqj] eyIiqje fjt+kWVZ MsoyiesaV iqjFkqj] eyIiqje] dsjy
13 Jh Jhin~ mik/;k] oksnsgkscyh xkao] mnqih ftyk] dukZVd IykWV fl- la- 194 ds ,pVh,y vkSj ,yVh,y
lhekadu ds lkFk lhvkjtsM ekufp= oksnsgkscyh xkao] dqaMiqj] dukZVd
14 Eks- pkWbl lhlkbM gksVy] dUuwj gksVy vikVZesaV dk fuekZ.k dUuwj] dsjy
15 dksphu iksVZ VªLV] dksph ¼,e;w,yVh½ eYVh ;wtj fDyfoM VfeZuy dk fodkl iqFkqoihu] dksph] dsjy
16 Eks- ,ftl ykWftfLVDl] eqacbZ ¼gfYn;k esa ,yihth VfeZuy½ ,yihth VfeZuy gfYn;k] if’pe caxky
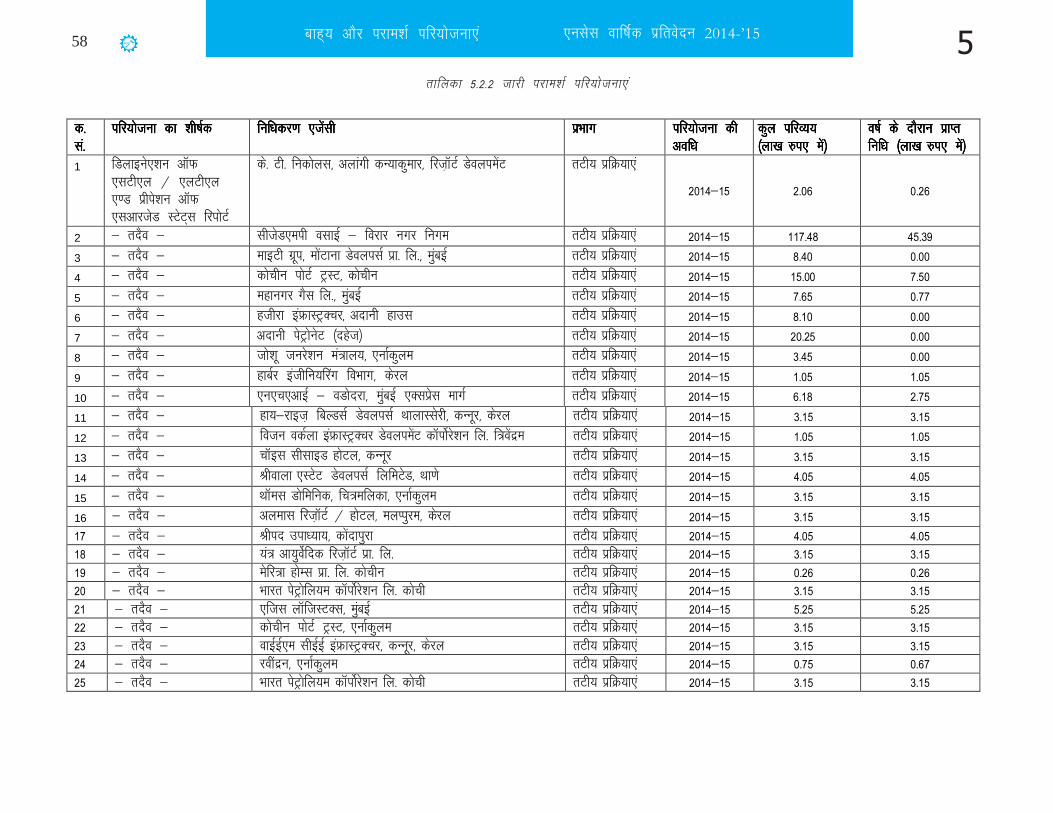
,ulsl okf”kZd izfrosnu 2014-’15Ckkg~; vkSj ijke'kZ ifj;kstuk,a558
rkfydk 5-2-2 tkjh ijke'k Z ifj;kstuk,a
�
�
5555----2222----2222 tkjhtkjhtkjhtkjh iiiijjjjkkkkeeee''''kkkkZZ ZZ iiiiffffjjjj;;;;kkkkss ssttttuuuukkkk,,,,aa aa
dddd---- llllaa aa----
ifj;kstukifj;kstukifj;kstukifj;kstuk dkdkdkdk 'kh"kZd'kh"kZd'kh"kZd'kh"kZd fuf/kdj.kfuf/kdj.kfuf/kdj.kfuf/kdj.k ,tsalh,tsalh,tsalh,tsalh izHkkxizHkkxizHkkxizHkkx ifj;kstukifj;kstukifj;kstukifj;kstuk dhdhdhdh vof/kvof/kvof/kvof/k
dqydqydqydqy ifjO;;ifjO;;ifjO;;ifjO;; ¼¼¼¼yk[k yk[k yk[k yk[k #i,#i,#i,#i, esa½esa½esa½esa½
o"kZo"kZo"kZo"kZ dsdsdsds nkSjkunkSjkunkSjkunkSjku izkIrizkIrizkIrizkIr fuf/kfuf/kfuf/kfuf/k ¼¼¼¼yk[k yk[k yk[k yk[k #i,#i,#i,#i, esa½esa½esa½esa½
1 fMykbus,'ku vkWQ ,lVh,y @ ,yVh,y ,.M izhis'ku vkWQ ,lvkjtsM LVsV~l fjiksVZ
ds- Vh- fudksyl] vykaxh dU;kdqekj] fjt+kWVZ MsoyiesaV rVh; izfØ;k,a
2014&15 2-06 0-26
2 & rnSo & lhtsM,eih olkbZ & fojkj uxj fuxe rVh; izfØ;k,a 2014&15 117-48 45-39 3 & rnSo & ekbVh xzwi] eksaVkuk MsoyilZ izk- fy-] eqacbZ rVh; izfØ;k,a 2014&15 8-40 0-00 4 & rnSo & dksphu iksVZ VªLV] dksphu rVh; izfØ;k,a 2014&15 15-00 7-50 5 & rnSo & egkuxj xSl fy-] eqacbZ rVh; izfØ;k,a 2014&15 7-65 0-77 6 & rnSo & gthjk baÝkLVªDpj] vnkuh gkml rVh; izfØ;k,a 2014&15 8-10 0-00 7 & rnSo & vnkuh isVªksusV ¼ngst½ rVh; izfØ;k,a 2014&15 20-25 0-00 8 & rnSo & tks'kw tujs'ku ea=ky;] ,ukZdqye rVh; izfØ;k,a 2014&15 3-45 0-00 9 & rnSo & gkcZj bathfu;Çjx foHkkx] dsjy rVh; izfØ;k,a 2014&15 1-05 1-05 10 & rnSo & ,u,p,vkbZ & oMksnjk] eqacbZ ,Dlizsl ekxZ rVh; izfØ;k,a 2014&15 6-18 2-75 11 & rnSo & gk;&jkbt+ fcYMlZ MsoyilZ FkkykLlsjh] dUUkwj] dsjy rVh; izfØ;k,a 2014&15 3-15 3-15 12 & rnSo & fotu odZyk baÝkLVªDpj MsoyiesaV dkWiksZjs’ku fy- f=osanze rVh; izfØ;k,a 2014&15 1-05 1-05 13 & rnSo & pkWbl lhlkbM gksVy] dUuwj rVh; izfØ;k,a 2014&15 3-15 3-15 14 & rnSo & Jhokyk ,LVsV MsoyilZ fyfeVsM] Fkk.ks rVh; izfØ;k,a 2014&15 4-05 4-05 15 & rnSo & FkkWel Mksfefud] fp=efydk] ,ukZdqye rVh; izfØ;k,a 2014&15 3-15 3-15 16 & rnSo & vyekl fjt+kWVZ @ gksVy] eyIiqje] dsjy rVh; izfØ;k,a 2014&15 3-15 3-15 17 & rnSo & Jhin mik/;k;] dksankiqjk rVh; izfØ;k,a 2014&15 4-05 4-05 18 & rnSo & ;a= vk;qosZfnd fjt+kWVZ izk- fy- rVh; izfØ;k,a 2014&15 3-15 3-15 19 & rnSo & esfj=k gksEl izk- fy- dksphu rVh; izfØ;k,a 2014&15 0-26 0-26 20 & rnSo & Hkkjr isVªksfy;e dkWiksZjs’ku fy- dksph rVh; izfØ;k,a 2014&15 3-15 3-15 21 & rnSo & ,ftl ykWftLVDl] eqacbZ rVh; izfØ;k,a 2014&15 5-25 5-25 22 & rnSo & dksphu iksVZ VªLV] ,ukZdqye rVh; izfØ;k,a 2014&15 3-15 3-15 23 & rnSo & okbZbZ,e lhbZbZ baÝkLVªDpj] dUuwj] dsjy rVh; izfØ;k,a 2014&15 3-15 3-15 24 & rnSo & johanzu] ,ukZdqye rVh; izfØ;k,a 2014&15 0-75 0-67 25 & rnSo & Hkkjr isVªksfy;e dkWiksZjs’ku fy- dksph rVh; izfØ;k,a 2014&15 3-15 3-15 �
�

59
6
NC
ES
S A
nn
ual R
epo
rt 20
14
-’15
Ho
no
urs, A
ward
s & A
cadem
ic Activ
ities
Honours, Awards & Academic Activities
6.1 Honours & Awards
Mrs. L. Sheela Nair, Scientist-E, Coastal
Processes (CoP) has been awarded Ph. D.
Degree under the faculty of Coastal Engi-
neering from IIT, Madras for her thesis
“Sediment dynamics along the coast of
Kerala, India” in July 2014.
Dr. D. Padmalal, Scientist-F, Natural Re-
sources and Environmental Management
(NREM) has been awarded ‘Cetificate of
Merit Award-2014’ by the Ministry of
Earth Science Studies, Govt. of India.
Smt. K. Viswabharathy, Deputy Manager,
Administrative Section has been awarded
‘Cetificate of Merit Award-2014’ by the
Ministry of Earth Science Studies, Govt.
of India.
Shri. K. Eldhose, Technician Grade-B,
Crustal Processes Group (CrP) has been
awarded ‘Cetificate of Merit Award-2014’
by the Ministry of Earth Science Studies,
Govt. of India.
Ms. T. R. Rajimol, Research Scientist,
Natural Resources and Environmetal
Mangement (NREM) has been awarded
best paper award on ‘Coastal Plain Rivers
of Thiruvananthapuram district, Kerala-
River Characteristics, Human Interven-
tions and Management Strategies’ in the
Environmetal Science session of the 23rd Swadeshi Sci-
ence Congress organized by Swadeshi Science Movement,
Kerala and Mahatma Gandhi University, Kottayam during
6-8, November 2013 at Mahatma Gandhi University.
Shri. P. Saseendran Nair, MTS, Adminis-
trative section has been awarded Cetificate
of Merit Award-2014’ by the Ministry of
Earth Science Studies, Govt. of India.
6.2 Membership in Committees outside
NCESS
Dr. N. P. Kurian
Member, Project Review Board, Coastal Engineering
Division, National Institute of Ocean Technology, Ministry
of Earth Sciences, Govt. of India.
Member, Board of Studies in Physical Oceanography and
Member, Faculty of Marine Sciences, Cochin University
of Science and Technology, Kochi.
Member, Kerala Dam Safety Authority, Water Resources
(Inter State Water Cell) Department, Govt. of Kerala.
Member of the State High Level Committee, Kerala
Protection of River Banks of Regulation of Removal of
Sand Rules 2002- for River Management Fund by Revenue
(P) Department, Govt. of Kerala.
Member, Kerala Coastal Zone Management Authority
constituted by the Ministry of Environment & Forests,
Govt. of India.
Member, Project Appraisal and Monitoring Committee on
Ocean Sciences and Resources of the Ministry of Earth
Sciences, Govt. of India.
Vice-Chairperson (Research), Hazard Vulnerability and Risk
Assessment Cell, ILDM, Thiruvananthapuram.
Chairman, Independent Expert Committee to evaluate the
progress of work carried out during the 11th Plan period
for the “Studies on Cobalt Crust’, constituted by the Min-
istry of Earth Sciences, Govt. of India.
Member, Task force on Coastal Erosion, Narmada Water
Resources, Water Supply and Kalpsar Department, Govt.
of Gujarat.
Dr. K. V. Thomas
Member, Project Advisory Committee of INCOIS,
Hyderabad.
Invited Member of the Expert Committee, constituted by
the Hon’ble Supreme Court of India under the chairman-
ship of Justice R. V. Raveendran, Former Judge, Supreme

60
NC
ES
S A
nn
ual
Rep
ort
20
14
-’1
5H
on
ou
rs,
Aw
ard
s &
Aca
dem
ic A
ctiv
itie
s
6
Invited Member, Expert Committee, constituted by the
Hon’ble Supreme Court of India under the chairmanship
of Justice R. V. Raveendran, Former Judge, Supreme Court
for the preparation of Integrated Island Management Plan
(IIMPs) for Lakshadweep.
Convenor of the Research Committee of CUSAT, Mem-
ber of the Permanent Doctoral Committee of Geogra-
phy, constituted by the University of Kerala.
Expert Member, Technical Review Committee on Mineral
Mapping of Indian Coasts, National Centre for Sustain-
able Coastal Management (NCSCM), MoEF, Chennai.
Dr. T. N. Prakash
Dr. R. Ajayakumar Varma
Chairman, Committee for assessing the damages to the
properties of local people due to the blasting operations
in a 7 km long tunnel of Sengulam Augmentation Scheme.
Member, Committee for preparing Project Report for
modernization of the Department of Mining and Geology,
Govt. of Kerala.
Chairman, Expert Committee to assess the impact of
blasting operations in the tunnel of Thottiyar Hydro
Electric Project, Kerala State Electricity Board.
Member, Expert Committee for Drafting guidelines for
the preparation of District Development Plan, Kerala State
Planning Board.
Member, Task Force on Greening Rural Development con-
stituted by the Ministry of Rural Development, Govt. of
India.
Member, Management Committee of Centre State Tech-
nology Transfer Institute.
Member, Technical Support Group of Solid Waste Man-
agement by Govt. of Tamilnadu.
Court for the preparation of Integrated Island Manage-
ment Plan (IIMPs) for Lakshadweep.
Member, Kerala Coastal Zone Management Authority
(KCZMA) Sub-committees to look into various CRZ issues
implementation, policies, violations and reports.
Member, Lakshadweep Coastal Zone Management
Authority.
Member, Project Advisory Committee of the ICZMP
project of Odisha.
Dr. T. Radhakrishna
Member, Evaluation of the UGC-Kothari PDF applica-
tions.
Member, MoES representative for a JRF interview at PSG
Institute Coimbatore.
Member, Selection Committee for the post of Associate
Professor of the Indian Institute of Geomagnetism,
Mumbai.
Member, UNESCO-IGCP 597 National Working Group.
Shri. John Mathai
Member, State Expert Appraisal Committee, Government
of Kerala, under the State Level Environment Impact As-
sessment Authority (SEIAA), Kerala.
Member, Expert committee for the formulation of Scien-
tific Mining Policy of Kerala State.
Member, Technical Committee, Disaster Management-
Mullaperiyar Dam, Govt. of Kerala.
Shri. G. Sankar
Member, Technical Committee for validation of security
schemes at Sree Padmanabha Swami Temple constituted
by the Govt. of Kerala.
Member, Ecologically Fragile Land (EFL-CDRC),
Chalakudy division, Govt. of Kerala.
Member, Expert Committe for making recommendations
in the modernisation of Kerala Forest Department, Govt.
of Kerala.
Member, Research and Management Committee of HVRA
Cell, Department of Revenue, Govt. of Kerala.
Member, Expert Committee constituted by the State gov-
ernment as well as the Ministry of Earth Sciences to sug-
gest immediate mitigation measures to Varkala Cliff Vul-
nerability.
Member, Assessment Committee of Scientific and Tech-
nical personnel of Indian Institute of Geomagnetism,
Mumbai.
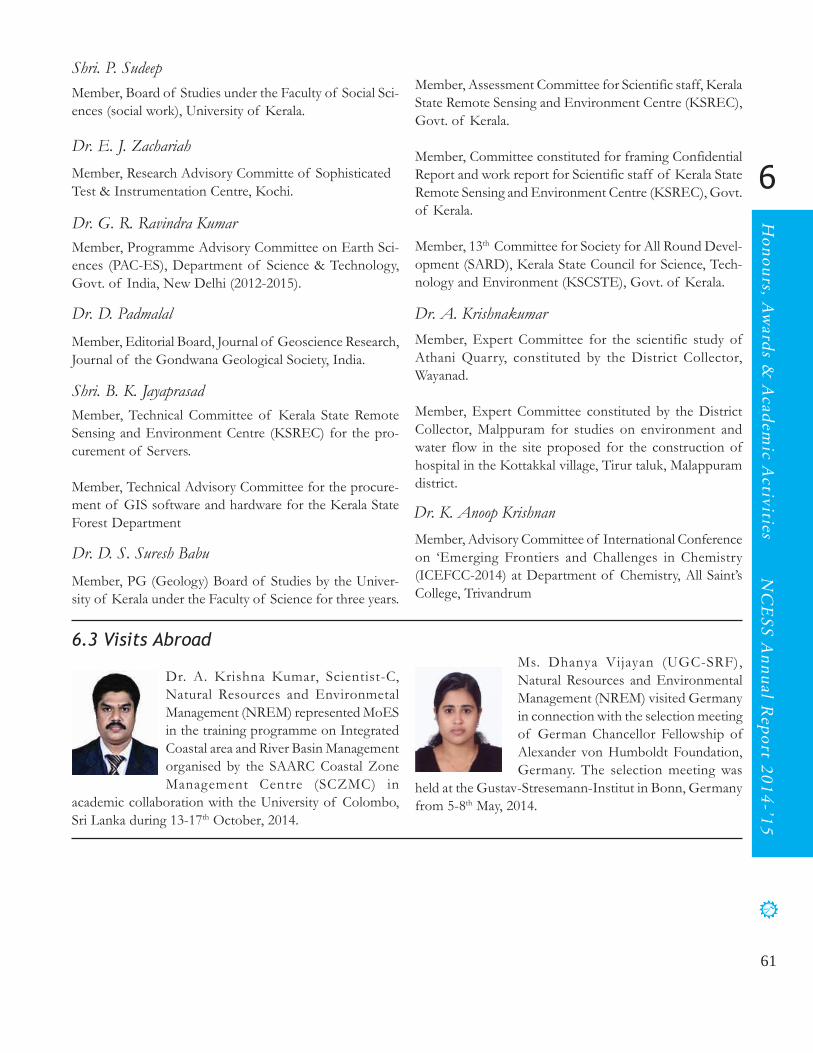
61
6
NC
ES
S A
nn
ual R
epo
rt 20
14
-’15
Ho
no
urs, A
ward
s & A
cadem
ic Activ
ities
6.3 Visits Abroad
Dr. A. Krishna Kumar, Scientist-C,
Natural Resources and Environmetal
Management (NREM) represented MoES
in the training programme on Integrated
Coastal area and River Basin Management
organised by the SAARC Coastal Zone
Management Centre (SCZMC) in
academic collaboration with the University of Colombo,
Sri Lanka during 13-17th October, 2014.
Ms. Dhanya Vijayan (UGC-SRF),
Natural Resources and Environmental
Management (NREM) visited Germany
in connection with the selection meeting
of German Chancellor Fellowship of
Alexander von Humboldt Foundation,
Germany. The selection meeting was
held at the Gustav-Stresemann-Institut in Bonn, Germany
from 5-8th May, 2014.
Dr. A. Krishnakumar
Member, Expert Committee for the scientific study of
Athani Quarry, constituted by the District Collector,
Wayanad.
Member, Expert Committee constituted by the District
Collector, Malppuram for studies on environment and
water flow in the site proposed for the construction of
hospital in the Kottakkal village, Tirur taluk, Malappuram
district.
Dr. D. Padmalal
Member, Editorial Board, Journal of Geoscience Research,
Journal of the Gondwana Geological Society, India.
Dr. D. S. Suresh Babu
Member, PG (Geology) Board of Studies by the Univer-
sity of Kerala under the Faculty of Science for three years.
Dr. G. R. Ravindra Kumar
Member, Programme Advisory Committee on Earth Sci-
ences (PAC-ES), Department of Science & Technology,
Govt. of India, New Delhi (2012-2015).
Dr. K. Anoop Krishnan
Member, Advisory Committee of International Conference
on ‘Emerging Frontiers and Challenges in Chemistry
(ICEFCC-2014) at Department of Chemistry, All Saint’s
College, Trivandrum
Shri. B. K. Jayaprasad
Member, Technical Committee of Kerala State Remote
Sensing and Environment Centre (KSREC) for the pro-
curement of Servers.
Member, Technical Advisory Committee for the procure-
ment of GIS software and hardware for the Kerala State
Forest Department
Member, Assessment Committee for Scientific staff, Kerala
State Remote Sensing and Environment Centre (KSREC),
Govt. of Kerala.
Member, Committee constituted for framing Confidential
Report and work report for Scientific staff of Kerala State
Remote Sensing and Environment Centre (KSREC), Govt.
of Kerala.
Member, 13th Committee for Society for All Round Devel-
opment (SARD), Kerala State Council for Science, Tech-
nology and Environment (KSCSTE), Govt. of Kerala.
Shri. P. Sudeep
Member, Board of Studies under the Faculty of Social Sci-
ences (social work), University of Kerala.
Dr. E. J. Zachariah
Member, Research Advisory Committe of Sophisticated
Test & Instrumentation Centre, Kochi.
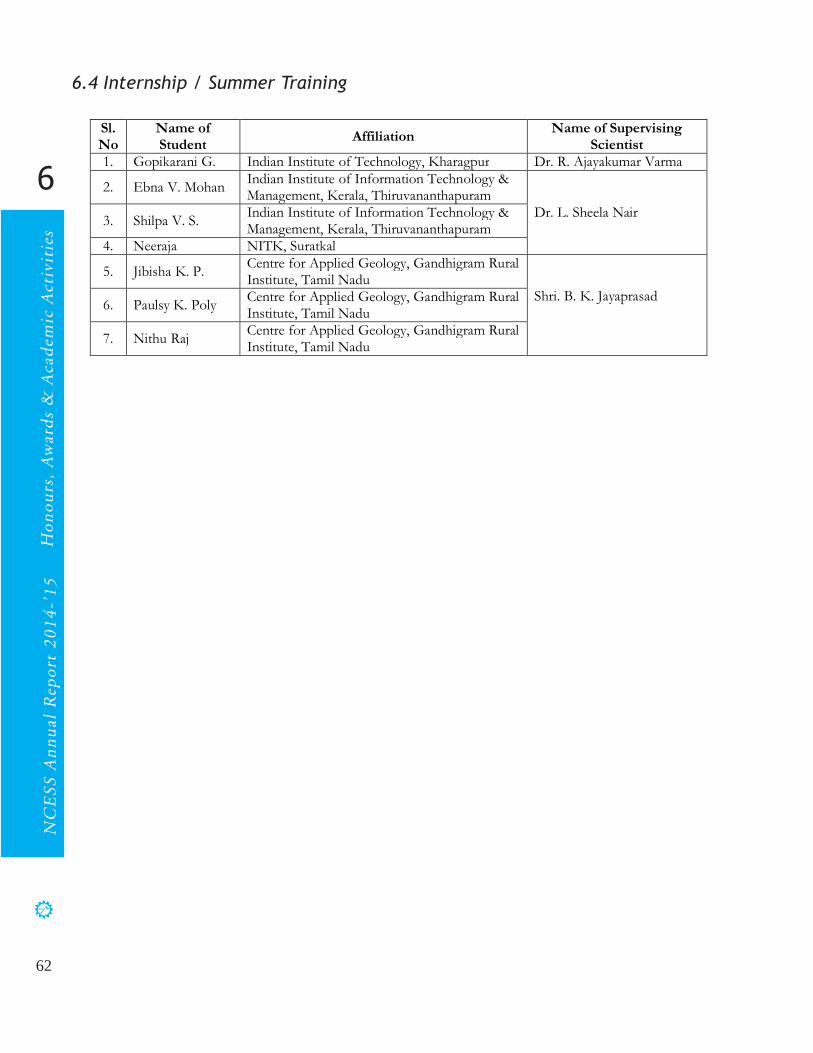
62
NC
ES
S A
nn
ual
Rep
ort
20
14
-’1
5H
on
ou
rs,
Aw
ard
s &
Aca
dem
ic A
ctiv
itie
s
6
6.4 Internship / Summer Training
Sl.
No Name of
Student Affiliation
Name of Supervising Scientist
1. Gopikarani G. Indian Institute of Technology, Kharagpur Dr. R. Ajayakumar Varma
2. Ebna V. Mohan Indian Institute of Information Technology & Management, Kerala, Thiruvananthapuram
Dr. L. Sheela Nair 3. Shilpa V. S.
Indian Institute of Information Technology & Management, Kerala, Thiruvananthapuram
4. Neeraja NITK, Suratkal
5. Jibisha K. P. Centre for Applied Geology, Gandhigram Rural Institute, Tamil Nadu
Shri. B. K. Jayaprasad
6. Paulsy K. Poly Centre for Applied Geology, Gandhigram Rural Institute, Tamil Nadu
7. Nithu Raj Centre for Applied Geology, Gandhigram Rural Institute, Tamil Nadu

63
6
NC
ES
S A
nn
ual R
epo
rt 20
14
-’15
Ho
no
urs, A
ward
s & A
cadem
ic Activ
ities
6.5 M.Sc. / B. Tech / M. Tech Dissertaion Programmes
Sl.
No. Name of Student College / Affiliation Topic of Dissertation Supervising Guide
1. Austin T. Sabu
St. Josephs College of Engineering & Technology, Palai
Sustainable Coastal Protection Methods. Dr. K. V. Thomas 2. Elza Mathew
3. Justin Jayan
4. Thrishna N.
5. Deepak Babu Government College, Kasaragod
Texture and heavy mineralogy of the coastal sediments of Thruvananthapuram district.
Dr. D. Padmalal
6. Sudharma Mohan CUSAT Estimation of Longshore sediment transport along the Beypore-Puthuvypene coastal sector Dr. L. Sheela Nair
7. Suresh Thatikonda IITM, Pune Wave climate studies along the SW cost of India
8. Akhil Shaji
Kerala University SEAM-GIS
Shri. B. K. Jayaprasad
9. Jasmin
10. Akhila C. K.
11. Monica Praisy
Regional Centre, Anna University
Impacts of digital elevation model in land degradation assessment-A case study in Munnar
12. Sujitha
Slope stability analysis for identifying landslide prone areas using remote sensing and GIS techniques in Munnar
13. Suresh D. Morphometric analysis for the identification of artificial recharge sites in Neyyar river basin
14. Shalini
Identification of groundwater potential zone using remote sensing and GIS in Kabani river basin
15. Ancy Abraham
Mar Ivanios College, Trivandrum
Adsorption of phosphate from water and waste waters using Bentonite clay
Dr. K. Anoop Krishnan
16. Elizabeth T. Vargheese
Hydrogeochemical modeling to assess the nature of highland springs in the PRB and analysis
17. Nithya T. M. Chemical hydrology of cochin estuary around Willington island, South India
18. Sruthy S. L.
SN College, Varkala
Hydrochemical and biological profiling of well water resources at Kadakkavur grama Panchayath, Thiruvananthapuram, India
19. Praveena Prasad Adsorptive removal of Pb (II) from aqeous
phase using surface modified chitosan 20.
Ayishath Nabeela
CUSAT
Study of ground water recharge ability in the context of urbanization, using remote sensing and GIS
Dr. Reji Srinivas 21. Likhil
Surface texture of quartz grain from a high energy coast, Thiruvananthapuram, SW coast of India
22. Neethu Heavy mineral assemblage of a high energy coast Thiruvananthapuram, SW coast of India.
23. Mithun P. M. Mangalore University, Mangalagangotri
Beach morphological and sedimetological study along Calicut coast, Kerala
Dr. T. N. Prakash 24. Sooraj P.
25. Meenu V. Sree Sankara University Dr. Archana M. Nair
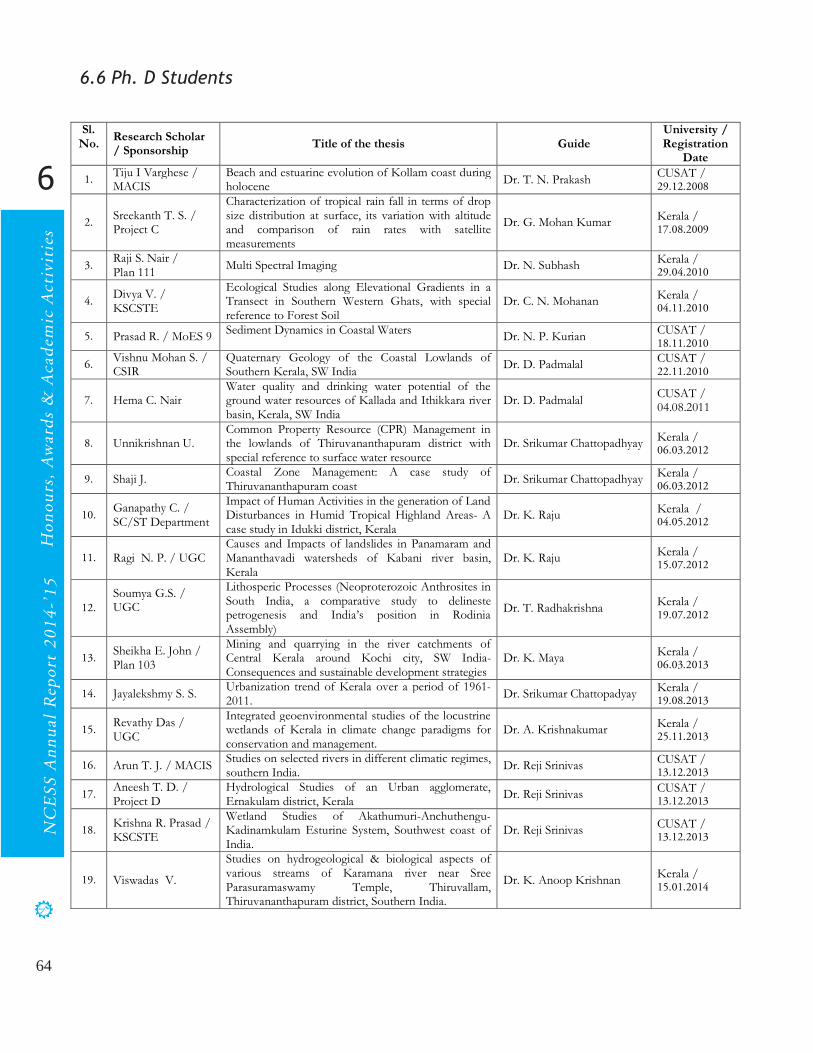
64
NC
ES
S A
nn
ual
Rep
ort
20
14
-’1
5H
on
ou
rs,
Aw
ard
s &
Aca
dem
ic A
ctiv
itie
s
6
6.6 Ph. D Students
Sl. No.
Research Scholar / Sponsorship
Title of the thesis Guide University / Registration
Date
1. Tiju I Varghese / MACIS
Beach and estuarine evolution of Kollam coast during holocene
Dr. T. N. Prakash CUSAT /
29.12.2008
2. Sreekanth T. S. / Project C
Characterization of tropical rain fall in terms of drop size distribution at surface, its variation with altitude and comparison of rain rates with satellite measurements
Dr. G. Mohan Kumar Kerala /
17.08.2009
3. Raji S. Nair / Plan 111
Multi Spectral Imaging Dr. N. Subhash Kerala /
29.04.2010
4. Divya V. / KSCSTE
Ecological Studies along Elevational Gradients in a Transect in Southern Western Ghats, with special reference to Forest Soil
Dr. C. N. Mohanan Kerala / 04.11.2010
5. Prasad R. / MoES 9 Sediment Dynamics in Coastal Waters
Dr. N. P. Kurian CUSAT / 18.11.2010
6. Vishnu Mohan S. / CSIR
Quaternary Geology of the Coastal Lowlands of Southern Kerala, SW India
Dr. D. Padmalal CUSAT /
22.11.2010
7. Hema C. Nair Water quality and drinking water potential of the ground water resources of Kallada and Ithikkara river basin, Kerala, SW India
Dr. D. Padmalal CUSAT / 04.08.2011
8. Unnikrishnan U. Common Property Resource (CPR) Management in the lowlands of Thiruvananthapuram district with special reference to surface water resource
Dr. Srikumar Chattopadhyay Kerala /
06.03.2012
9. Shaji J. Coastal Zone Management: A case study of Thiruvananthapuram coast
Dr. Srikumar Chattopadhyay Kerala /
06.03.2012
10. Ganapathy C. / SC/ST Department
Impact of Human Activities in the generation of Land Disturbances in Humid Tropical Highland Areas- A case study in Idukki district, Kerala
Dr. K. Raju Kerala / 04.05.2012
11. Ragi N. P. / UGC Causes and Impacts of landslides in Panamaram and Mananthavadi watersheds of Kabani river basin, Kerala
Dr. K. Raju Kerala /
15.07.2012
12.
Soumya G.S. / UGC
Lithosperic Processes (Neoproterozoic Anthrosites in South India, a comparative study to delineste petrogenesis and India’s position in Rodinia Assembly)
Dr. T. Radhakrishna Kerala /
19.07.2012
13. Sheikha E. John / Plan 103
Mining and quarrying in the river catchments of Central Kerala around Kochi city, SW India- Consequences and sustainable development strategies
Dr. K. Maya Kerala /
06.03.2013
14. Jayalekshmy S. S. Urbanization trend of Kerala over a period of 1961-2011.
Dr. Srikumar Chattopadyay Kerala / 19.08.2013
15. Revathy Das / UGC
Integrated geoenvironmental studies of the locustrine wetlands of Kerala in climate change paradigms for conservation and management.
Dr. A. Krishnakumar Kerala /
25.11.2013
16. Arun T. J. / MACIS Studies on selected rivers in different climatic regimes, southern India.
Dr. Reji Srinivas CUSAT / 13.12.2013
17. Aneesh T. D. / Project D
Hydrological Studies of an Urban agglomerate, Ernakulam district, Kerala
Dr. Reji Srinivas CUSAT /
13.12.2013
18. Krishna R. Prasad / KSCSTE
Wetland Studies of Akathumuri-Anchuthengu-Kadinamkulam Esturine System, Southwest coast of India.
Dr. Reji Srinivas CUSAT / 13.12.2013
19. Viswadas V.
Studies on hydrogeological & biological aspects of various streams of Karamana river near Sree Parasuramaswamy Temple, Thiruvallam, Thiruvananthapuram district, Southern India.
Dr. K. Anoop Krishnan Kerala /
15.01.2014

65
6
NC
ES
S A
nn
ual R
epo
rt 20
14
-’15
Ho
no
urs, A
ward
s & A
cadem
ic Activ
ities
20. Mereena C. S / DST
Inland waterways of Kerala: A geographical and economical analysis of west coast canal
Dr. Srikumar Chattopadhyay/ Dr. K. Raju (Co-Guide)
Kerala /
17.03.2014
21. Jobish E. A. / SC/ST Department
Coastal Zone Management: A case study of Eranakulam coast
Dr. K. Raju Kerala / 28.03.2014
22. Parvathy K. Nair / KSCSTE
Development of Vembanad Management action plan through a geological perspective
Dr. D. S. Suresh Babu Kerala /
30.04.2014
23. Sibin Antony / COMAPS 4
Appraisal of marine ecosystem of Kavarathi island in southwest coast of Kerala in the special reference to lagoon system
Dr. K. AnoopKrishnan Kerala /
23.05.2014
24. Vinu V. Dev / CPT-3
Adsoptive potential of surface modified ceramics, clays and chitosan for the removal of toxic heavy metals from aqeous media using batch and column studies: kinetic and thermodynamic profile
Dr. K. AnoopKrishnan Kerala /
09.06.2014
25. Praseetha B. S. / KSCSTE
Geochemistry estuarine and innershelf sediment Dr. T. N. Prakash CUSAT /
18.12.2014
26. Praveen M. N. / (part time)
Geological aspects of the eastern part of betal belt, Central Indian Tectonic Zone
Dr. G. R. Ravindra Kumar CUSAT
27. Kunhambu V. / CGWB (part time)
Characterisation and evaluation of the aquifer system of Kuttanad area, Kerala for Sustainable Groundwater Development
Dr. D. S. Suresh Babu Kerala / 05.01.2015
28. Shiny R. / KSCSTE Geo-environmetal appraisal and water quality assessment of low land and coastal plain rivers of southern Kerala, India-A GIS based study.
Dr. K. Maya Kerala /
02.03.2015
29. Harsha Mahadevan Assessment of Nutrient Flux in Urban Drainage Systems: Identification of Sources, Pathways and Remedial Measures
Dr. K. Anoop Krishnan Kerala / 01.05.2015
29.12.2008 17.08.2009 04.11.2010 29.04.2010 18.11.2010 22.11.2010 04.08.2011 04.05.2012 06.03.2012 06.03.2012 15.07.2012 19.07.2012 06.03.2013 19.08.2013 25.11.2013 13.12.2013 13.12.2013 13.12.2013 15.01.2014 17.03.2014 28.03.2014 30.04.2014 23.05.2014 09.06.2014 18.12.2014 01.05.2015

67
7
NC
ES
S A
nn
ual R
epo
rt 20
14
-’15
Lib
rary an
d P
ub
lication
s
Library and Publications
7.1 Library
The Library of ESSO-NCESS is one of the key reference and information centre for researchers in the field of Earth
Sciences in terms of its collection and services. It has a unique and rare collection of books, journals, back volumes,
maps, atlas, theses, project reports, reference books, CDs, VCDs, CD ROM Databases etc. The Library subscribes a
good number of foreign as well as Indian periodicals and journals. Apart from this 129 full text E-journal of Science
Direct, SCOPUS and Web of Science are available through the MoES E-Journal Consortium .
�
The Library offers Reference Service, Document Delivery Service, Selective Dissemination of Information, Current
Awareness Service, Internet access to electronic full-text
journals etc. An e-mail alert is sent to the scientists who
request new arrival of books and publications related to
their fields. Library provides Inter Library Resource Sharing
facilities with a number of major R&D and Academic
institutional Libraries. In addition, a list of new additions
of NCESS publications, useful article, fellowship
information, forthcoming conferences, seminars are
displayed in the library. A separate computer lab provided
to students and staff for surfing internet. Books are
arranged according to the Dewey Decimal Classification
(DDC) system.
�
Online Public Access Catalogue(OPAC) software customised by NCESS Library Team.
All functions of the library have been automated with KOHA Library management software and library documents are
bar-coded. The library catalogue OPAC (On-line Public Access Catalogue) can be accessed through the on campus
wide Intranet.
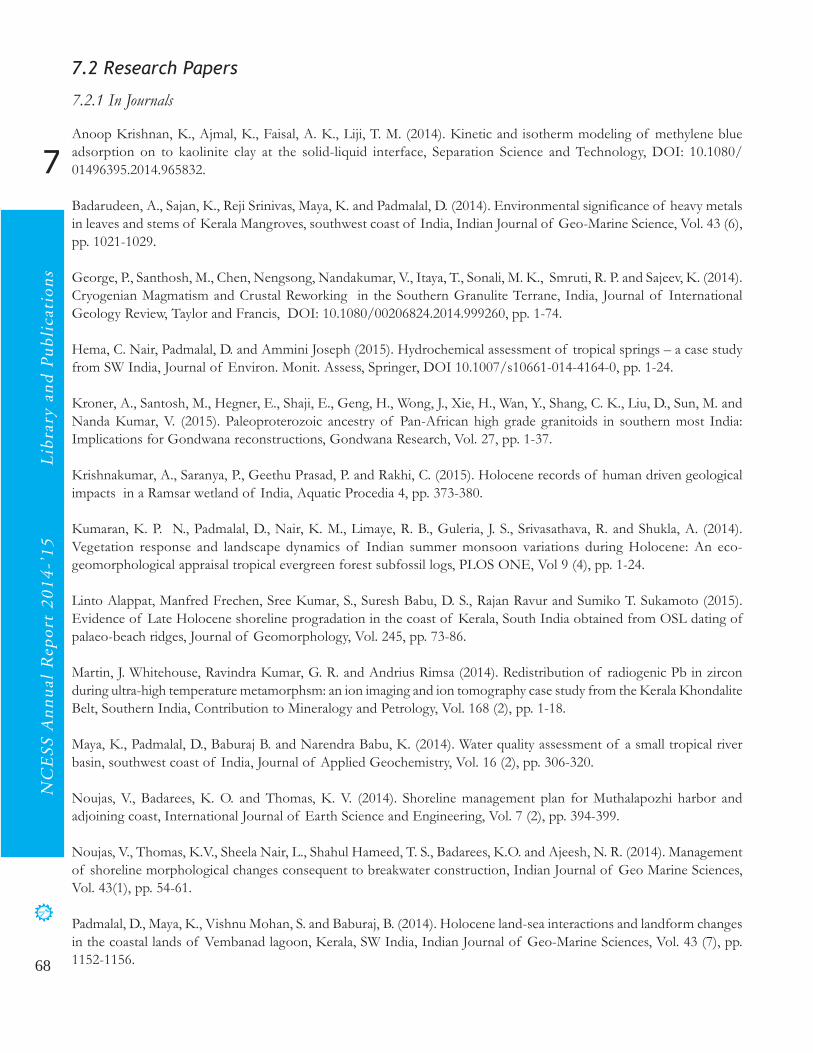
68
NC
ES
S A
nn
ual
Rep
ort
20
14
-’1
5L
ibra
ry a
nd
Pu
bli
cati
on
s
7
7.2 Research Papers
7.2.1 In Journals
Anoop Krishnan, K., Ajmal, K., Faisal, A. K., Liji, T. M. (2014). Kinetic and isotherm modeling of methylene blue
adsorption on to kaolinite clay at the solid-liquid interface, Separation Science and Technology, DOI: 10.1080/
01496395.2014.965832.
Badarudeen, A., Sajan, K., Reji Srinivas, Maya, K. and Padmalal, D. (2014). Environmental significance of heavy metals
in leaves and stems of Kerala Mangroves, southwest coast of India, Indian Journal of Geo-Marine Science, Vol. 43 (6),
pp. 1021-1029.
George, P., Santhosh, M., Chen, Nengsong, Nandakumar, V., Itaya, T., Sonali, M. K., Smruti, R. P. and Sajeev, K. (2014).
Cryogenian Magmatism and Crustal Reworking in the Southern Granulite Terrane, India, Journal of International
Geology Review, Taylor and Francis, DOI: 10.1080/00206824.2014.999260, pp. 1-74.
Hema, C. Nair, Padmalal, D. and Ammini Joseph (2015). Hydrochemical assessment of tropical springs – a case study
from SW India, Journal of Environ. Monit. Assess, Springer, DOI 10.1007/s10661-014-4164-0, pp. 1-24.
Kroner, A., Santosh, M., Hegner, E., Shaji, E., Geng, H., Wong, J., Xie, H., Wan, Y., Shang, C. K., Liu, D., Sun, M. and
Nanda Kumar, V. (2015). Paleoproterozoic ancestry of Pan-African high grade granitoids in southern most India:
Implications for Gondwana reconstructions, Gondwana Research, Vol. 27, pp. 1-37.
Krishnakumar, A., Saranya, P., Geethu Prasad, P. and Rakhi, C. (2015). Holocene records of human driven geological
impacts in a Ramsar wetland of India, Aquatic Procedia 4, pp. 373-380.
Kumaran, K. P. N., Padmalal, D., Nair, K. M., Limaye, R. B., Guleria, J. S., Srivasathava, R. and Shukla, A. (2014).
Vegetation response and landscape dynamics of Indian summer monsoon variations during Holocene: An eco-
geomorphological appraisal tropical evergreen forest subfossil logs, PLOS ONE, Vol 9 (4), pp. 1-24.
Linto Alappat, Manfred Frechen, Sree Kumar, S., Suresh Babu, D. S., Rajan Ravur and Sumiko T. Sukamoto (2015).
Evidence of Late Holocene shoreline progradation in the coast of Kerala, South India obtained from OSL dating of
palaeo-beach ridges, Journal of Geomorphology, Vol. 245, pp. 73-86.
Martin, J. Whitehouse, Ravindra Kumar, G. R. and Andrius Rimsa (2014). Redistribution of radiogenic Pb in zircon
during ultra-high temperature metamorphsm: an ion imaging and ion tomography case study from the Kerala Khondalite
Belt, Southern India, Contribution to Mineralogy and Petrology, Vol. 168 (2), pp. 1-18.
Maya, K., Padmalal, D., Baburaj B. and Narendra Babu, K. (2014). Water quality assessment of a small tropical river
basin, southwest coast of India, Journal of Applied Geochemistry, Vol. 16 (2), pp. 306-320.
Noujas, V., Badarees, K. O. and Thomas, K. V. (2014). Shoreline management plan for Muthalapozhi harbor and
adjoining coast, International Journal of Earth Science and Engineering, Vol. 7 (2), pp. 394-399.
Noujas, V., Thomas, K.V., Sheela Nair, L., Shahul Hameed, T. S., Badarees, K.O. and Ajeesh, N. R. (2014). Management
of shoreline morphological changes consequent to breakwater construction, Indian Journal of Geo Marine Sciences,
Vol. 43(1), pp. 54-61.
Padmalal, D., Maya, K., Vishnu Mohan, S. and Baburaj, B. (2014). Holocene land-sea interactions and landform changes
in the coastal lands of Vembanad lagoon, Kerala, SW India, Indian Journal of Geo-Marine Sciences, Vol. 43 (7), pp.
1152-1156.

69
7
NC
ES
S A
nn
ual R
epo
rt 20
14
-’15
Lib
rary an
d P
ub
lication
sPrakash, T. N., Sheela Nair, L. and Tiju I. Varghese (2014) Shoreline changes and reef strengthening at Kavaratti island
in Lakshadweep Archipelago-A case study, Indian Journal of Geo-Marine Science, Vol. 43 (7), pp. 1135-1139.
Ratheesh Kumar, M., Vishnu, S. Raj, Sudhanandh, V. S., Faisal, A. K., Shibu, R., Vimexen, V., Ajmal, K., Aneesh, K. S.,
Sibin Antony and Anoop Krishnan, K. (2014). Proliferation of dinoflagellates during pre monsoon season in Kochi bar
mouth, Kerala, Journal of Environmental Biology, Vol. 35, pp. 877-882.
Ria Mukherjee, Sisir, K. Mondal, Hong Zhong, Zhong-Jie Bai, Vysetti Balaram and Ravindra Kumar, G. R. (2014).
Platinum group element geochemistry of komatiite-derived 3.1 ga ultramafic-mafic rocks and chromitites from the
Nuggihalli greenstone belt, Western Dharwar craton (India), Chemical Geology, Vol. 386, pp. 190-208.
Sajin Kumar, K. S., Sankar, G., Rani, V. R. and Sunderrajan, P. (2014). Effect of quarrying on the slope stability in
Banasuramala: an offshoot valley of Western Ghats, Kerala, India, Environment Earth Science, Springer, DOI 10.1007/
s12665-014-3143-7.
Sheela Nair, L., Sundar, V. and Kurian , N. P. (2014). Comparative evaluation of erosion accretion criteria for a tropical
beach, Indian Journal of Geo-Marine Sceinces, Vol. 43 (7), pp. 1130-1134.
Shiekha, E. John, Vishnu Sagar, M. K., Maya, K. and Padmalal, D. (2014). Dissolved nutrients (NO3-N and PO
4-P) and
Fe in the interstitial and overlying waters of two tropical fresh water lakes in southern Kerala, Indian Journal of Applied
Geochemistry, Vol. 16 (4), pp. 381-392.
Simon, L. Harley and Nandakumar, V. (2014). Accessory mineral behavior in Granulite migmatites: a case study from
the Kerala Khondalite Belt, India, Journal of Petrology, Vol. 55 (10), pp. 1965-2002, doi:10.1093/petrology/egu047.
Udaya Kumar, P., Chandran, A., Jose, J. J., Shibu, R. and Anoop Krishnan, K. (2014). Nutrient-charecteristics, stoichimetry
and response stimulus of phytoplankton biomass along the southwest coastal waters of India, Journal of Marine
Biology and Oceanography, DOI: 10.4172/2324-8661.1000129.
Vimexen, V., Baiju, R. S., Faisal, A. K., Ajmal, K., Aneessh, K. S., Anoop Krishnan, K. and Ajayakumar Varma, R.
(2014). Evaluation of water chemistry along the coastal and lagoon segments of Kavaratti tropical island, India, In
Environmental Sustainability: Concepts, Principles, Evidences and Innovations, Krishi Sanskriti (Ed. G. C. Mishra),
pp. 420-426.
Vimexen, V., Aneesh, K. S., Sheena, A. S., Faisal, A. K., Ajmal, K., Anoop Krishnan, K. and Ajayakumar Varma, R.
(2014). Geochemical aspects and uptale mechanism of Pb(II) onto nano sized clay fractions of lithoral sediments in
Kochi, South-west of India, Journal of Research in Science, ISSN: 2278-9.73, pp. 115-119.
Vishnu Mohan, S., Padmalal, D., Maya, K. and Baburaj, B. (2014). Sea level oscillations, climate change and landform
evolution in the western coastal lowlands of Trivandrum block in peninsular India, Indian Journal of Geo-Marine
Sciences, Vol. 43 (7), pp. 1145-1151.
7.2.2 In Conference proceedings
Anoop Krishnan, K. (2015). Ocean Acidification: Chemistry and impacts, Proc. of National workshop on Ocean
Acidification Research, NWOAR, Department of Marine and Coastal Studies, School of Energy, Environmental and
Natural Resources, Madurai Kamraj University, pp. 17-22.
Anoop Krishnan, K. (2015). Ocean chemistry: Impacts of ocean acidification on Phosphorus and silicon speciation,
Proc. of National workshop on Ocean Acidification Research, NWOAR, department of Marine and Coastal Studies,
School of Energy, Environmental and Natural Resources, Madurai Kamraj University, pp. 23-27.

70
NC
ES
S A
nn
ual
Rep
ort
20
14
-’1
5L
ibra
ry a
nd
Pu
bli
cati
on
s
7
7.3 Project Reports
Ajayakumar Varma, R., Jayaprasad, B. K., Shiny, R., Ragi, M. S., Kalaraj, Krishnapriya, S., Gopikrishna, V. G., Kiran, S.
J. and Anila, M. T. (2015). An integrated management action plan for ecological restoration of Vembanad lake and its
inflowing river systems- Achankovil river basin, Project report submitted to Department of Agriculture, Govt. of
Kerala, 49 p.
Ajayakumar Varma, R., Jayaprasad, B. K., Suresh Babu, D. S., Shiny, R. Ragi, M. S., Kalaraj, Krishnapriya, S. and Anila,
M. T. (2015). An integrated management action plan for ecological restoration of Vembanad lake and its inflowing river
systems- Meenachil river basin, Project report submitted to Department of Agriculture, Govt. of Kerala, 56 p.
Ajayakumar Varma, R., Padmalal, D., Maya, K., Suresh Babu, D. S., Jayaprasad, B. K., Shiny, R., Ragi, M. S., Kalaraj,
Krishnapriya, S., Kiran, S. J. and Anila, M. T. (2015). An integrated management action plan for ecological restoration of
Vembanad lake and its inflowing river systems- Muvattupuzha river basin, Project report submitted to Department of
Agriculture, Govt. of Kerala, 57 p.
Ajayakumar Varma, R., Shiny, R. and Ragi, M. S. (2014). EIA study of Municipal solid waste Management project of
Thiruvananthapuram Municipal Corporation.
Ajayakumar Varma, R. and Anoop Krishnan, K. (2014). Coastal Ocean Monitoring and Prediction System, Project
report submitted to ICMAM, PD., Ministry of Earth Science, Govt. of India, 54 p.
Anoop Krishnan, K., Krishnakumar, A., Liji, T. M., Baiju, R. S., Arya, S., Sibin Antony, Noufal, K. N. and Arunima, R.
(2015). Appraisal of drinking water potential in Pathanamthitta, Kottayam and Idukki districts of Kerala, Project report
submitted to the Kerala State Science, Technology and Environment, Thiruvananthapuram, 118 p.
Anoop Krishnan, K., Liji, T. M., Vinu, V. Dev, Faisal, A. K., Mohind, M. and Suraj Krishna, R. (2015). Environmental
monitoring of water and sediment quality parameters in the backwaters around Cochin Port Trust (Half yearly), Project
report submitted to the Chief Engineer, Cochin Port Trust, 77 p.
Archana, M. Nair and Jayaprasad, B. K. (2014). Generation of Geographic Information system of five particularly
vulnerable tribal groups (PTG’s), Project report submitted to KIRTADS, 95 p.
Archana, M. Nair and Jayaprasad, B. K. (2014). Generation of tribal information sytem for Mannan and Urali
communication for KIRTADS, 60 p.
Krishnankumar, A. (2015). Evaluation of seasonal fluctuation of water quality in Ashtamudi Wetland System, India,
Proc. of National Seminar on Recent and Emerging Advances in Chemical Science (REACS-2015), Department of
Chemistry, All Saints’ College, Trivandrum, pp. 50-55.
Krishnankumar, A. (2015). Recent hydrochemical characterisation of two tropical Lacustrine Ecosystems of Kerala,
Proc. of National Seminar on Recent and Emerging Advances in Chemical Science (REACS-2015), Department of
Chemistry, All Saints’ College, Trivandrum, pp. 55-59.
Krishnankumar, A. (2015). Groundwater chemistry of Neyyar and Karamana Basins, Kerala with special refernce to
salinity intrusion problems in the coastal urban environment, Proc. of National Seminar on Recent and Emerging
Advances in Chemical Science (REACS-2015), Department of Chemistry, All Saints’ College, Trivandrum, pp. 12-16.
Vinu, V. Dev, Sachin, S. R., Faisal, A. K., Arya, S., Liji, T. M. and Anoop Krishnan, K. (2015). Aqueous nutrient flux and
sediment heavy metal contaminaton in Cochin Backwaters: A systematic spatial pattern study on monthly basis, Proc.
of National Seminar on Recent and Emerging Advances in Chemical Science (REACS-2015), Department of Chemistry,
All Saints’ College, Trivandrum, p. 69.

71
7
NC
ES
S A
nn
ual R
epo
rt 20
14
-’15
Lib
rary an
d P
ub
lication
s
Jayaprasad, B. K. (2014). Creation of a model GIS database for Malappuram Municipality under Saptial Urban Information
Sytem, Project report submitted to Information Kerala Mission, Department of Local Self Governmet, Govt. of
Kerala, 146 p.
John Paul, P. (2014). Quaternary evolution of the Coastal Plains of Southern Kerala, Project report, National Centre
for Earth Science Studies, Thiruvananthapuram, 66p.
Mahamaya Chattopadhyay (2014). Land system analysis of Kabani river basin Wayanad district, Kerala, Project report,
National Centre for Earth Science Studies, 96 p.
Mahamaya Chattopadhyay (2014). Study of landuse/ landcover as linked to climate change in Kerala, Project report,
National Centre for Earth Science Studies, 52 p.
Mahamaya Chattopadhyay and Raju, K. (2014). Geomorphic evolution and terrain characteristics: A case study of the
Achankovil river, Project report, National Centre for Earth Science Studies, 87 p.
Mahamaya Chattopadhyay and Sakunthala, C. (2014). Valley formation and geomorphic processes under tropical wet
and dry climate: examples from Kerala, Project report submitted to the Kerala State Council for Science, Technology
and Environment, Thiruvananthapuram, 101p.
Maya, K., Baburaj, B., Sheikha, E. John, Aswathy, K. A. and Rajimol, T. R. (2014). Rockfall incidence of Vengamala,
Pullampara grama panchayat, Thiruvananthapuram district, project report submitted to Sri. Koliyakkode N. Krishnan
Nair, MLA, Govt. of Kerala.
Maya, K., Padmalal, D., Baburaj, B., Sheika, E. John and Rajimol, T. R. (2015). Study on the environmental effects of
minning and quarrying in the Periyar river basin, Central Kerala, Project report, National Centre for Earth Science
Studies, 115 p.
Mohan Kumar, G. and Zachariya, E. J (2014). Solar UV-B radiation and atmospheric trace constituents measurements,
Project report submitted to Kerala State Council for Science, Technology and Environment, Thiruvananthapuram,
12 p.
Omana, P. K. (2014). Physical, Chemical and Biological monitoring study at dredging site in Vembanad lake, Project
report, Travancore Cements Ltd., Kottayam, 12 p.
Omana, P. K. (2014). Water, Sediment quality monitoring and assessment of estuaries of Kerala; a case study from
Kochi estuary and Periyar river, Project report, National Centre for Earth Science Studies, Thiruvananthapuram, 105 p.
Padmalal, D., Maya, K., Baburaj, B., Aswathy, K. A., Sheika, E. John and Rajimol, T. R. (2014). Environmental degradation
of Paravur kayal, Kollam district, Kerala, project report submitted to the Additional Chief Secretary, Water Resources
Department, Govt. of Kerala.
Padmalal, D. and Maya, K. (2014). Sand auditing of rivers (Manimala, Periyar and Muvattupuzha) in the Idukki district,
Project report submitted to the Department of Revenue, Govt. of Kerala, 37 p.
Padmalal, D., Maya, K., Baburaj, B. and Shiekha, E. John (2015). Feasibility of sand mining in Muvattupuzha , Manimala
and Pambar rivers flowing through Idukki district (Kerala) using the methodology of Sand Auditing, Project report
submitted to the district Collector, Idukki, 22 p.
Prakash, T. N., Thomas, K. V., Raju, D., Sreeraj, M. K., Rafeeque, M. K., Anish, S. Anand, Sreejith, S., Nadee Bin
Haneef, Kiran, S. J. and Muhammad Asif, M. (2014). Preparation of Integrated Island Management plan for Lakshadweep

72
NC
ES
S A
nn
ual
Rep
ort
20
14
-’1
5L
ibra
ry a
nd
Pu
bli
cati
on
s
7
Islands, Project report submitted to Department of Science and Technology, UT of Lakshadweep, Govt. of India,
100 p.
Srikumar Chattopadhyay, Mahamaya Chattopadhyay and Sankar, G. (2014). Land system analysis of Kabani river basin,
Project report submitted to the Kerala State Council for Science, Technology and Environment, Thiruvananthapuram,
96 p.
Thomas, K. V. (2014). Conservation and nourishment of beaches of selected tourism locations of Kerala, Project
report submitted to the Department of Tourism, Govt. of Kerala, 23 p.
Thomas, K. V., Ajayakumar Varma, R. and Anoop Krishnan, K. (2014).Coastal Ocean Monitoring and Prediction
System along the coast of Kerala, Karnataka and Lakshdweep Islands, 64 p.
Zachariah, E. J., Ouseph, P. P., Narendrababu, K., George Thomas and Iyer, C. S. P. (2014). Nitrous Oxide and Methane
in coastal ocean and estuaries, Project report submitted to Ministry of Earth Sciences, 54 p.
Zachariya, E. J. and Sasidharan, C. K., Deepa Nair, K., Sherin, A.P. and Pravinkumar, C. S. (2014). Greenhouse gases
monitoring, Project report submitted to the Kerala State Council for Science, Technology and Environment,
Thiruvananthapuram, 26 p.
Zachariya, E. J. and Vinayak, P. V. S. S. K., George Thomas, Shareekul Ansar and Sherin, A. P. (2014). Effect of
urbanization on the buildup of urban heat island in Kochi, Project report, National Centre for Earth Science Studies,
Thiruvananthapuram, 22 p.
7.4 Books / Edited Volumes /Monographs
Padmalal, D. and Maya, K. (2014). Sand Mining- Environmental Problems and Selected Case Studies, Springer, London,
162 p.
Prakash, T. N., Sheela Nair, L. and Shahul Hameed, T. S. (2015). Geomorphology and Physical Oceanography of the
Lakshadweep Coral Islands in the Indian Ocean, Springer Briefs in Earth Sciences, Springer Cham Heidelberg, New
York, Dordrecht London, 111 p. (DOI 10.1007/978-3-319-12367-7).

73
8
NC
ES
S A
nn
ual R
epo
rt 20
14
-’15
Co
nferen
ce, Sem
inar &
Wo
rksh
op
Conference, Seminar, Workshop
8.1 Continental Crust and Cover Sequences in the Evolution of the Indian Sub-Continent
�
Dr. Shailesh Nayak, Honorable Secretary, MoES delivered the keynote lecture on the workshop on “ Continental Crust and Cover Sequences in theEvolution of the Indian Sub-Continent” was organized in NCESS on January 20-21, 2015 to commemorate the one year completion of takeover ofCESS by MoES. Dr. N.P. Kurian, Director, NCESS , Shri. T.M. Mahadevan, Former Director, AMD, Dr. T. Radhakrishna, Chairman,Organising Committee and Group Head, Crustal Processes are also seen on the dias.
A National Workshop on “Continental Crust and Cover Sequences in the Evolution of the Indian Sub-Continent” was
conducted in NCESS during January 20-21, 2015 to commemorate the one year completion of takeover of CESS by
MoES. The workshop was inaugurated by Dr. Shailesh Nayak, Honorable Secretary, MoES and presided by Sri. T.M.
Mahadevan, Former Director, AMD. Dr. N.P. Kurian, Director, NCESS welcomed the participants and Dr. T.
Radhakrishna, Chairman, Organising Committee offered vote of thanks. The workshop included twenty special invited
lectures on various themes by eminent geoscientists from different organisations and Universities in India who have
made significant contributions in the field of geology and geophysics. The talks covered a wide spectrum of topics
related to the crustal processes in the development of Solid Earth involving studies on basement complexes as well as
sedimentary cover sequences ranging in age from Archaean to Quaternary. The lectures also focused on inferences on
early crustal growth, paleoclimate changes, neotectonics, present day seismicity and land disturbances in the Indian
shield. In addition to the special lectures, a poster session was also included in the workshop on topics related to the
theme of the workshop. Thirty-four posters were presented and the workshop was attended by nearly hundred young
researchers and students both within and outside Kerala.

74
NC
ES
S A
nn
ual
Rep
ort
20
14
-’1
5C
on
fere
nce
, S
emin
ar &
Wo
rksh
op
8
8.2 Invited Lectures / Chairing of Tech-
nical Sessions
Dr. D. Padmalal
Delivered a keynote address on “Impact of mining and
quarrying on the Western Ghat environment” at the Na-
tional seminar conducted by Government college Kottayam
on March 2015.
Dr. K. V. Thomas
As a resource person gave a lecture on “Coastal Erosion
and Prevention Measures in Kerala Coast” for the training
programme for Engineers, Irrigation Department, Govt.
of Kerala, August 2014.
Dr. L. Sheela Nair
Delivered an invited talk on “Sediment deposit in pattern
at selected inlets along the SW coast of India” at the
INDO_ JAPAN workshop on River mouths, Tidal Flats
and Lagoons, IIT Madras during 15-16th September 2014.
Delivered an invited talk on “Oil spill trajectory modeling
off the coast of Kiltan in the Lakshadweep group of
Islands” at the Oil Spill India International Conference,
Goa during 18-20th September 2014.
Dr. Mahamaya Chattopadhay
Delivered a lecture on “Terrain analysis of Kerala: Concepts
and methodology” during the training programme at Kerala
State Landuse Board, Thrissur as part of a pilot project on
Eco restoration plan through land cover information
management system at agro ecological unit level on 22nd
April 2014.
Dr. N. P. Kurian
Attended and delivered an invited talk entitled “propogation
and inundation of the 2004 tsunami along the Lakshadweep
and SW coast of India” at the International conference on
a decade after the Indian Ocean Tsunami: Statement
Experiences, Pondicherry during 10-13th December 2014.
Inaugurated and delivered a talk entitled “Coastal Hazards
and Management” at the National Workshop on Disaster
Mitigation Measures, Kothamangalam during 16-18th
December 2014.
Delivered a talk entitled “Technologies for coastal disaster
risk reduction-Indian context”at the 102nd Indian Science
Congress, Mumbai during 4-8th January 2014.
Dr. R. Ajayakumar Varma
Delivered a lecture on “Technology options for sustain-
able municipal solid waste management” in summer school
for Architects organized by the Laurie Baker Centre for
habitat studies, Nopoliyode on 26th May 2014.
Attended and delivered a lecture the workshop on
“Drinking water” organized by the State Planning Board,
Thiruvananthapuram on 23rd July 2014.
Delivered a lecture on “Sanitation in Kerala – Yesterday,
Today and Tomorrow” at the training on sanitation for
senior officials from Rajasthan, Bihar, Jharkhand and
Assam organized by the World Bank at Kozhikode on 2nd
August 2014.
Delivered a talk on “Overflow management technique for
waste management” during the training on development
perspective for participants from the Third World Countries
organized by Kanthari, an NGO at Vellayani,
Thiruvananthapuram on 25th August 2014.
Delivered an invited talk on “Urban environmental issues
during the training programme on urban design:
oppourtunities and challenges-India” organized by the
Shri. B. K. Jayaprasad
Delivered a lecture on “GIS and Remote sensing Applica-
tions for Irrigation Management” at IMG,
Thiruvananthapuram in connection with the training
programme for the Engineers and Officers of the Irriga-
tion Department, Govt. of Kerala on 15th November 2014.
Shri. John Mathai
Attended the pre-workshop meeting on “Water resources”
convened by the State Planning Board and made a
presentation of “Different techniques of rain water
harvesting and ground water recharge implememted in
Chadayamangalam block as part of Hariyali project and in
other parts of the state” on July 2014.
Delivered a lecture on the “Ocean Chemistry: Impacts of
Ocean Acidificatin on Phosphorus and Silicon Speciation”
at the UGC sponsored National Workshop on Ocean
Acidificatin Research (NWOAR-2015), Department of
Marine & Coastal studies, Madurai Kamaraj University,
Dr. K. Anoop Krishnan
Department of Architecture, College of Engineering,
Thiruvananthapuram during 17-19th November 2014.

75
8
NC
ES
S A
nn
ual R
epo
rt 20
14
-’15
Co
nferen
ce, Sem
inar &
Wo
rksh
op
8.3 Papers presented in Conference / Workshop / Symposium / Seminar
Madurai during 25-27th February 2015
Delivered a lecture on “Seawater quality monitoring: Ocean
acidification as a case study of impact of climate change
on marine ecosystem” at the World Environment Day Cel-
ebrations on ‘Impact of Climate Change on Environment’,
Department of Environmental Science, St. John’s College,
Anchal, Kollam during 17-18th June 2014.
Name
Conference / Symposium / Seminar Title of the Paper
Krishnakumar A.
National Conference on ‘Sedimentation and Stratigraphy’ and XXXI Convention of Indian Association of Sedimentologists, University of Pune during 12-14 November,2014.
Geochemical signatures of Anthropocene in the sediments of the tropical Ashtamudi wetland system, Kerala, SW Coast of India.
Padmalal D.
5th Indian National Conference on Harbour and Ocean Engineering (INCHOE-2014), CSIR-NIO, Goa, during 5-7th February 2014.
Holocene land-sea interactions and landform changes in the coastal lands of Vembanad lagoon, Kerala, SW India
Padmalal D. Regional workshop on ‘Water conservation in Kerala-Impacts and challenges’, Central ground water board, Trivandrum on 27th March 2014.
Chemical quality of fresh water sources in Kerala, SW India-an overview
Raju K.
36th Indian Geography Congress on urban systems rural livelihoods, security and resource management organized by Jaipur University, Rajasthan, 2014.
Morphometric and TRP Analysis of a highland Tropical river basin: A case study of Panamaram River, Wayanad, Kerala
Suresh Babu D. S.
Regional workshop on ‘Water conservation in Kerala-Impacts and challenges’, Central ground water board, Trivandrum on 27th March 2014.
Can we conserve part of portable ground water that regularly discharges to sea across the Kerala coast.
Thomas K. V. Seminar on ‘Climate Change’ organized by Malayala Manorama in July 2014.
Sea level rise and its impact on Kerala coast.
Thomas K. V. Workshop on ‘Coastal Zone Management in South Asia’ organized by the Centre for Science and Environment (CSE) on January 2014.
Climate Change and coastal vulnerability.

77
9
NC
ES
S A
nn
ual R
epo
rt 20
14
-’15
Ex
tensio
n
Extension
9.1 Observance of Rashtriya Ekta Diwas
31st October 2014, the birth anniversary of Late Sardar Vallabhai Patel was be observed as “RASHTRIYA EKTA
DIWAS” (National Unity day). As part of the observance, all the employees of NCESS assembled at the Foyer of the
Administrative block at 10.55 am to take the pledge which was read out by the Director.
9.2 Observance of Vigilance Awareness Week:
Vigilance awareness week was observed at NCESS from 27th October 2014 to 1st November 2014 with the
theme’Combating Corruption- Technology as an anabler”.
9.3 Swachch Bharat Mission
The 150th Birth Anniversary of Mahatma Gandhi on 2nd October 2014, every Government servant take part of swachch
Bharat Mission programme. As part of this programme, the employees of NCESS has assembled at the Foyer of the
Administrative block at 09.45 am and take the pledge which was read out by the Director. Further all officers and
officials take part in the cleaning of the office and its premises, which was coordinated by the Campus Green Committee.
9.4 Observance of Communal Harmony Campaign Week
Communal Harmony Campaign Week during 19-25
November, 2014 and the Flag Day on 25th November,
2014 of the National Foundation for Communal
Harmony were observed at NCESS. NCESS Employees
contributed to augment the resources of the National
Foundation for Communal Harmony (NFCH) to carry
on its activities on various schemes and projects. The
donation was sent to NFCH. During the campaign week
flags and stickers were distributed and posters displayed.
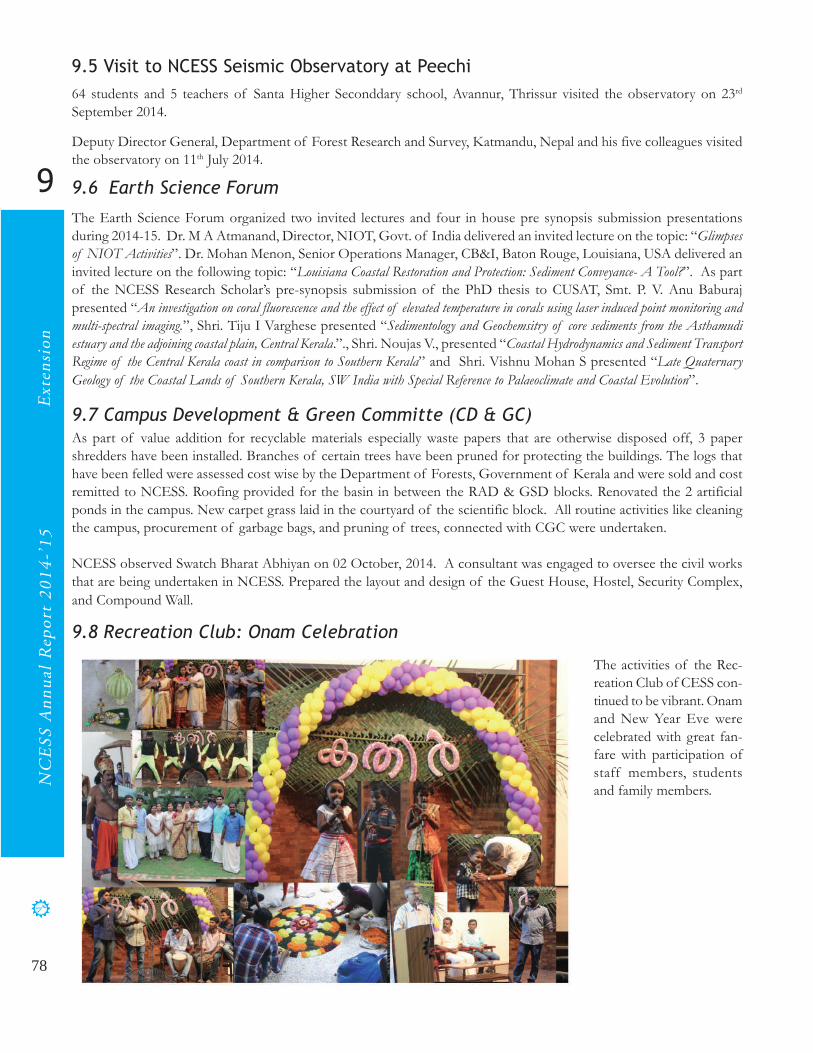
78
NC
ES
S A
nn
ual
Rep
ort
20
14
-’1
5E
xte
nsi
on
9 9.6 Earth Science Forum
9.7 Campus Development & Green Committe (CD & GC)
9.5 Visit to NCESS Seismic Observatory at Peechi
64 students and 5 teachers of Santa Higher Seconddary school, Avannur, Thrissur visited the observatory on 23rd
September 2014.
Deputy Director General, Department of Forest Research and Survey, Katmandu, Nepal and his five colleagues visited
the observatory on 11th July 2014.
As part of value addition for recyclable materials especially waste papers that are otherwise disposed off, 3 paper
shredders have been installed. Branches of certain trees have been pruned for protecting the buildings. The logs that
have been felled were assessed cost wise by the Department of Forests, Government of Kerala and were sold and cost
remitted to NCESS. Roofing provided for the basin in between the RAD & GSD blocks. Renovated the 2 artificial
ponds in the campus. New carpet grass laid in the courtyard of the scientific block. All routine activities like cleaning
the campus, procurement of garbage bags, and pruning of trees, connected with CGC were undertaken.
NCESS observed Swatch Bharat Abhiyan on 02 October, 2014. A consultant was engaged to oversee the civil works
that are being undertaken in NCESS. Prepared the layout and design of the Guest House, Hostel, Security Complex,
and Compound Wall.
The Earth Science Forum organized two invited lectures and four in house pre synopsis submission presentations
during 2014-15. Dr. M A Atmanand, Director, NIOT, Govt. of India delivered an invited lecture on the topic: “Glimpses
of NIOT Activities”. Dr. Mohan Menon, Senior Operations Manager, CB&I, Baton Rouge, Louisiana, USA delivered an
invited lecture on the following topic: “Louisiana Coastal Restoration and Protection: Sediment Conveyance- A Tool?”. As part
of the NCESS Research Scholar’s pre-synopsis submission of the PhD thesis to CUSAT, Smt. P. V. Anu Baburaj
presented “An investigation on coral fluorescence and the effect of elevated temperature in corals using laser induced point monitoring and
multi-spectral imaging.”, Shri. Tiju I Varghese presented “Sedimentology and Geochemsitry of core sediments from the Asthamudi
estuary and the adjoining coastal plain, Central Kerala.”., Shri. Noujas V., presented “Coastal Hydrodynamics and Sediment Transport
Regime of the Central Kerala coast in comparison to Southern Kerala” and Shri. Vishnu Mohan S presented “Late Quaternary
Geology of the Coastal Lands of Southern Kerala, SW India with Special Reference to Palaeoclimate and Coastal Evolution”.
9.8 Recreation Club: Onam Celebration
The activities of the Rec-
reation Club of CESS con-
tinued to be vibrant. Onam
and New Year Eve were
celebrated with great fan-
fare with participation of
staff members, students
and family members.

79
10
NC
ES
S A
nn
ual R
epo
rt 20
14
-’15
Co
mm
ittees
Committees
10.1 Statutory Committees
10.1.1 Governing Body (GB)
Dr. Shailesh R. Nayak
Secretary, Ministry of Earth Sciences, Government of India
Prithvi Bhavan, Lodhi Road, New Delhi
Dr. (Mrs.) Swati Basu
Scientific Secretary & Advisor
Ministry of Earth Sciences, Government of India
Prithvi Bhavan, Lodhi Road, New Delhi
Mrs. Anuradha Mitra
JS&FA, Ministry of Earth Sciences, Government of India
Prithvi Bhavan, Lodhi Road, New Delhi
Shri. Anand S. Khati
JS, Ministry of Earth Sciences, Government of India
Prithvi Bhavan, Lodhi Road, New Delhi
Dr. B. K. Bansal
Scientist-G & Advisor
Ministry of Earth Sciences, Government of India
Prithvi Bhavan, Lodhi Road, New Delhi
Director,
National Centre for Antartic & Ocean Research (NCAOR)
Ministry of Earth Sciences, Government of India
Headland Sada, Vasco-da-Gama, Goa
Director,
National Institute of Ocean Technology (NIOT)
Velacherry-Tambaram Main Road, Narayanapuram
Pallikaranai, Chennai
Dr. M. Samsuddin
Director, National Centre for Earth Science Studies
Akkulam, Thiruvanathapuram
President
Member
Member
Member
Member
Member
Member
Member Secretary
Dr. Shailesh R. Nayak
Secretary, Ministry of Earth Sciences, Government of India
Prithvi Bhavan, Lodhi Road, New Delhi
Chairman
10.1.2 Governing Council (GC)

80
NC
ES
S A
nn
ual
Rep
ort
20
14
-’1
5C
om
mit
tees
10
10.1.3 Finance Committee (FC)
Mrs. Anuradha Mitra
JS&FA, Ministry of Earth Sciences, Government of India
Prithvi Bhavan, Lodhi Road, New Delhi
Shri. Anand S. Khati
JS, Ministry of Earth Sciences, Government of India
Prithvi Bhavan, Lodhi Road, New Delhi
Dr. B. K. Bansal
Scientist G & Advisor
Programme Officer, ESSO-NCESS
Ministry of Earth Sciences, Government of India
Prithvi Bhavan, Lodhi Road, New Delhi
Chairman
Member
Member
Dr. Somnath Dasgupta
Vice Chancellor, Assam University, Silchar, Assam
Professor,
Indian Institute of Science Education and Research (IISER)
Kolkatta
Mrs. Anuradha Mitra
JS&FA, Ministry of Earth Sciences, Government of India
Prithvi Bhavan, Lodhi Road, New Delhi
Shri. B. N. Satpathy
Sr. Adviser (E & F & S & T)
Planning Commission, New Delhi
Shri. Anand S. Khati
JS, Ministry of Earth Sciences, Government of India
Prithvi Bhavan, Lodhi Road, New Delhi
Dr. (Mrs.) Swati Basu
Scientific Secretary & Advisor,
Ministry of Earth Sciences, Government of India
Prithvi Bhavan, Lodhi Road, New Delhi
Dr. Suresh Das
Executive Vice President
Kerala State Council for Science, Technology & Environment
Sasthra Bhavan, Pattom
Thiruvananthapuram
Director,
National Centre for Antartic & Ocean Research (NCAOR)
Ministry of Earth Sciences, Government of India
Headland Sada, Vasco-da-Gama, Goa
Dr. M. Samsuddin
Director, National Centre for Earth Science Studies
Akkulam, Thiruvanathapuram
Member
Member
Member
Member
Member
Member
Member
Member Secretary

81
10
NC
ES
S A
nn
ual R
epo
rt 20
14
-’15
Co
mm
ittees
10.1.4 Research Advisory Committee (RAC)
Dr. Somnath Dasgupta
Vice Chancellor, Assam University, Silchar, Assam
Professor,
Indian Institute of Science Education and Research (IISER)
Kolkotta
Director, NIOT/ Nominee
National Institute of Ocean Technology
Velacherry-Tambaran Main Road, Narayanapuram
Pallikaranai, Chennai
Director, NGRI/ Nominee
National Geophysical Research Institute
Uppal Road, Habsiguda, Uppal
Hyderabad, Andra Pradesh
Prof. A. D. Rao
Centre for Atmospheric Sciences,
Indian Institute of Technology
New Delhi
Dr. M. V. Ramanamurthy
ICMAM Project Directorate
NIOT Campus
Velacherry-Tambaram Main Road
Pallikkaranai, Chennai
Dr. V. Nandakumar
Scientist-F, Crustal Processes (CrP)
National Centre for Earth Science Studies
Akkulam, Thiruvananthapuram
Chairman
Member
Member
Member
Member
Member Secretary
Dr. M. Samsuddin
Director, National Centre for Earth Sceince Studies
Akkulam, Thiruvananthapuram
Shri. P. Sudeep
Chief Manager
National Centre for Earth Science Studies
Akkulam, Thiruvananthapuram
Shri. M. A. K. H. Rasheed
Manager (Finance)
National Centre for Earth Science Studies
Akkulam, Thiruvananthapuram
Dr. D. S. Suresh Babu
Head, Projects, Training & Documentation
National Centre for Earth Science Studies
Akkulam, Thiruvananthapuram
Member
Member
Member
Member Secretary

82
NC
ES
S A
nn
ual
Rep
ort
20
14
-’1
5C
om
mit
tees
10
10.2.4 Canteen
Dr. T. S. Shahul Hameed Chairman
(till January 2015)
Dr. D. S. Suresh Babu Member
Shri. M. Mohammed Ismail Member
Shri. G. Lavanya Member
10.2.5 Campus Development and Green Committee
Dr. V. Nandakumar Chairman
Shri. G. Sankar Member
Shri. John Paul Member
Shri. S. Krishnakumar Member
Dr. K. Raju Member
10.2.6 Complaints Committee to combat Sexual
harassment at work place
Dr. L. Sheela Nair Chairperson
Smt. G. Lavanya Member
Dr. J. K. Tomson Member
Dr. Susha Janardhanan External Member
10.2.7 Website Maintenance
Dr. D. S. Suresh Babu Chairman
Shri. N. Nishanth Member
Shri. S. S. Salaj Member
10.2 Internal Committees
10.2.1 Group Heads
Director, NCESS Chairman
Dr. T. Radhakrishna Member
Crustal Processes
Dr. T. N. Prakash Member
Coastal Processes
Dr. R. Ajayakumar Varma Member
Atmospheric Processes
Dr. M. Samsuddin Member
Natural Resources & Environmental Management
Shri. P. Sudeep Member
Chief Manager
Dr. D. S. Suresh Babu Convenor
Head, Project, Training & Documentation
10.2.2 Material Purchase
Dr. E. J. Zachariah Chairman
(till April 2014)
Shri. John Mathai Chairman
(since May 2014)
Dr. T. N. Prakash Member
Shri. M. A. K. H. Rasheed Member
(till October 2014)
Dr. L. Sheela Nair Member
(till January 2015)
Shri. P. Sudeep Member
(since January 2015)
10.2.3 Library Management
Director Chairman
All Group Heads Members
Manager, Accounts Member
Head, PT&D Member
Librarian (i/c) Convenor
Dr. L. Sheela Nair Member
Dr. Tomson J. Kallukalam Member
Shri. S. Mohanan Member
Shri. M. Ramesh Kumar Member
Smt. K. V. Padmaja Kumari Convenor
Shri. D. Raju Convenor
Shri. N. Nishanth Member
Smt. Indu Janardanan Member
Smt. P. C. Rasi Member

83
11
NC
ES
S A
nn
ual R
epo
rt 20
14
-’15
Staff D
etails
Staff Details
11.1 Directors office
Dr. M. Samsuddin Director
(Since February 2015)
Dr. N. P. Kurian Director (Since August 2014)
(till January 2015)
Dr. K. Somasunder Director-in-Charge
(till July 2014)
Dr. D. S. Suresh Babu Scientist-E & Head PT&D
Smt. T. Remani Helper (Gr. 1)
11.4 Atmospheric Processes (AtP)
Dr. E. J. Zachariah Scientist-F & Head
(till April 2014)
Dr. R. Ajayakumar Varma Scientist-G & Head
(since May 2014)
11.3 Coastal Processes (CoP)
11.2 Crustal Processes (CrP)
Dr. T. Radhakrishna Scientist-G & Head
Shri. John Mathai Scientist-G
Dr. C. P. Rajendran Scientist-G (on long leave)
Shri. G. Sankar Scientist-G
Dr. V. Nandakumar Scientist-F
Smt. Sreekumari Kesavan Scientist-D
Dr. Tomson J. Kallukalam Scientist-C
Shri. N. Nishanth Scientific Asst. (Gr. B)
Shri. K. Eldhose Technician (Gr. B)
11.5 Natural Resources andEnvironmental Management (NREM)
11.6 Projects, Training &Documentation (PT&D)
Dr. D. S. Suresh Babu Scientist-E & Head
Dr. K. Raju Scientist-E
Shri. S. S. Salaj Scientific Asst. (Gr. B)
Smt. K. Reshma Scientific Asst. (Gr. A)
Shri. P. M. Gopakumar Junior Executive
11.7 Administration
Shri. P. Sudeep Chief Manager
(since January 2015)
Dr. L. Sheela Nair Chief Manager (i/c)
(till January 2015)
Shri. M. A. K. H. Rasheed Chief Manager (i/c)
(till October 2014)
Shri. M. A. K. H. Rasheed Manger (finance)
(since November 2014)
Dr. K. V. Thomas Scientist-G & Head
(till November 2014)
Dr. T. N. Prakash Scientist-G & Head
(Since December 2014)
Dr. T. S. Shahul Hameed Scientist-G
(till January 2015)
Dr. L. Sheela Nair Scientist-E
Shri. P. John Paul Scientist-E &
Librarian (i/c)
Dr. D. S. Suresh Babu Scientist-E
Dr. K. Raju Scientist-E
Dr. Reji Srinivas Scientist-C
Shri. D. Raju Scientific Officer (Gr. 3)
Shri. S. Mohanan Scientific Officer (Gr. 2)
Shri. A. Vijayakumaran Nair Scientific Officer (Gr. 2)
(till November 2014)
Shri. M. Ajith Kumar Scientific Officer (Gr. 2)
Shri. M. Ramesh Kumar Scientific Officer (Gr. 2)
Shri. S. S. Salaj Scientific Asst. (Gr. B)
Shri. M. K. Rafeeque Scientific Asst. (Gr. A)
Shri. M. K. Sreeraj Scientific Asst. (Gr. A)
Shri. Louis William MTS
Dr. M. Samsuddin Scientist-G & Head
(on deputation) (till January 2015)
Dr. R. Ajayakumar Varma Scientist-G & Head
(till December 2014)
Dr. K. K. Ramachandran Scientist-F (on deputation)
Dr. P. K. Omana Scientist-F
(till July 2014)
Dr. D. Padmalal Scientist-F
Dr. Mahamaya Chattopadhyay Scientist-E
(till June 2014)
Dr. K. Maya Scientist-E
Dr. Ansom Sebastian Scientist-E
Shri. B. K. Jayaprasad Scientist-E
Dr. K. Anoop Krishnan Scientist-C
Dr. A. Krishnakumar Scientist-C
Dr. Archana M . Nair Scientist-C (on leave)
Smt. C. Sakunthala Technical Officer ( Gr. 5)
Shri. K. Surendran Co-Ordinator (Gr. 4)
Smt. S. Najumunniza Technician (Gr. E)
(till December 2014)
Smt. T. M. Liji Scientific Asst. (Gr. B)
Shri. P. B. Vibin Scientific Asst. (Gr. A)
Shri. M. Philip Internal Auditor
(on deputation)
Smt. K. V. Padmaja Kumari Joint Manager
Shri. Mohammed Ismail Technical Officer (Gr. 4)
Smt. Nita Sukumar Technical Officer (Gr. 1)

84
NC
ES
S A
nn
ual
Rep
ort
20
14
-’1
5S
taff
Det
ails
11
11.8 Retirements
Dr. E. J. Zachariah
Scientist-F
Atmospheric Processes
Superannuated on
30th April 2014
Dr. Mahamaya Chattopadhyay
Scientist-E
Natural Resources & Environ-
mental Management
Superannuated on
30th June 2014
Dr. K. V. Thomas
Scientist-G
Coastal Processes
Superannuated on
31st November 2014
Dr. N. P. Kurian
Director
Superannuated on
31st January 2015
Dr. P. K. Omana
Scientist-F
Natural Resources &
Environmental Management
Superannuated on
31st July 2014
Dr. T. S. Shahul Hameed
Scientist-G
Coastal Processes
Superannuated on
31st January 2015
Shri. T. D. Bashardeen Co-rdinator (Gr. 4)
Shri. R. Haridas Deputy Manager
Smt. K. Viswabharathy Deputy Manager
(on long leave)
Shri. C. M. Youseph Deputy Manager
(on deputation)
Shri. M. Madhu Madhavan Deputy Manager
Smt. R. Jaya Deputy Manager
Smt. G. Lavanya Deputy Manager
Shri. S. Krishnakumar Senior Executive
Smt. Femi R. Sreenivasan Executive
Shri. P. Rajesh Executive
Smt. P. C. Rasi Executive
Shri. N. Jayapal Executive
Smt. Smitha Vijayan Junior Executive
Smt. K. S. Anju Junior Executive
Shri. P. H. Shinaj Junior Executive
Smt. D. Shimla Junior Executive
Smt. V. Sajitha Kumari Junior Executive
Smt. Seeja Vijayan Junior Executive
Shri. K. R. Satheesan Junior Executive
(till April 2014)
Smt. Indu Janardanan Scientif Asst. (Gr. A)
Smt. P. Prabhavathy Co-Ordinator (Gr.4)
Smt. N. J. Saramma Senior Executive
Smt. K. Prasanna Senior Executive
Smt. M. K. Radha Senior Executive
(till November 2014)
Shri. M. Parameswaran Nair Technician (Gr. E)
Shri. N. Unni MTS
Smt. S. Vimala Kumari MTS
(till October 2014)
Shri. P. S. Anoop MTS
Smt. P. S. Divya MTS
Shri. B. Rajendran Nair MTS
Shri. P. Saseendran Nair MTS
Shri P. Rajendra Babu MTS
Shri. K. Sudeerkumar MTS (Driver)
Shri V. Chandran Nair MTS
(till May 2014)

85
11
NC
ES
S A
nn
ual R
epo
rt 20
14
-’15
Staff D
etails
Shri. K. R. Satheesan
Junior Executive
Administration
Superannauated on
30th April 2014
Shri. V. Chandran Nair
MTS
Administration
Superannuated on
31st May 2014
Smt. S. Vimalakumari
MTS
Administration
Superannuated on
31st October 2014
Shri. A. Vijayakumaran Nair
Scientific Officer Gr.2
Coastal Processes
Superannuated on
30th November 2014
Smt. M. K. Radha
Senior Executive
Administration
Superannauated on
30th November 2014
Smt. S. Nujumunniza
Technician Gr. E
Natural Resources &
Environmental Management
Superannuated on
31st December 2014
11.9 Obituary
Dr. K. M. Nair, former
Director of CESS
(04.11.1992 – 16.04.1998),
expired on the 7th July 2014
at Amrutha Hospital,
Ernakulam. He joined CESS
after an illustrious career in
ONGC (India), University
of Illorin (Nigeria) and
United Nations Programme
at Belize (Central America).
At ONGC, he has made extensive studies on the Western
Offshore Sedimentary Basins of India. His tenure in CESS
was instrumental in initiating/strengthening many new
areas of research like Sand Mining Studies, Landslide
Hazard Zonation, Water harvesting, Carrying Capacity
Studies, Palaeo Seismicity and Natural Resources Evaluation
at local level. After his retirement from CESS he undertook
many projects on Quaternary studies of Kerala funded by
State and Central Government Agencies. He has published
�
many bench mark papers on the Cenozoic Sedimentary
Formations of India. On superannuation from CESS, he
was also associated with many NGO’s in awareness creation
on various environmental issues of the State. He is survived
by wife Saraswathi Amma and their sons Ayyappan and
Ashok, who always stood by Dr. Nair in the Geological
pursuits. In his passing, the geoscientific community lost a
very brilliant and dedicated earth scientist of our country.

87
12
NC
ES
S A
nn
ual R
epo
rt 20
14
-’15
Balan
ce Sh
eet
Balance Sheet

88
NC
ES
S A
nn
ual
Rep
ort
20
14
-’1
5B
alan
ce S
hee
t
12
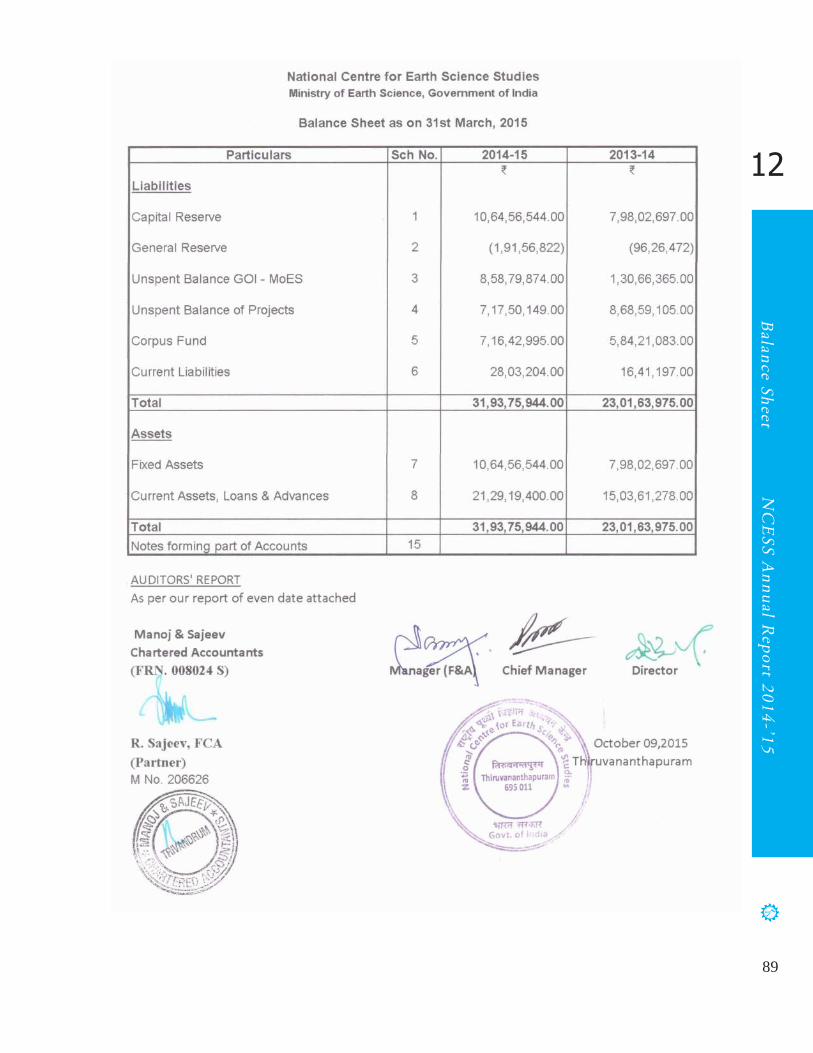
89
12
NC
ES
S A
nn
ual R
epo
rt 20
14
-’15
Balan
ce Sh
eet

90
NC
ES
S A
nn
ual
Rep
ort
20
14
-’1
5B
alan
ce S
hee
t
12
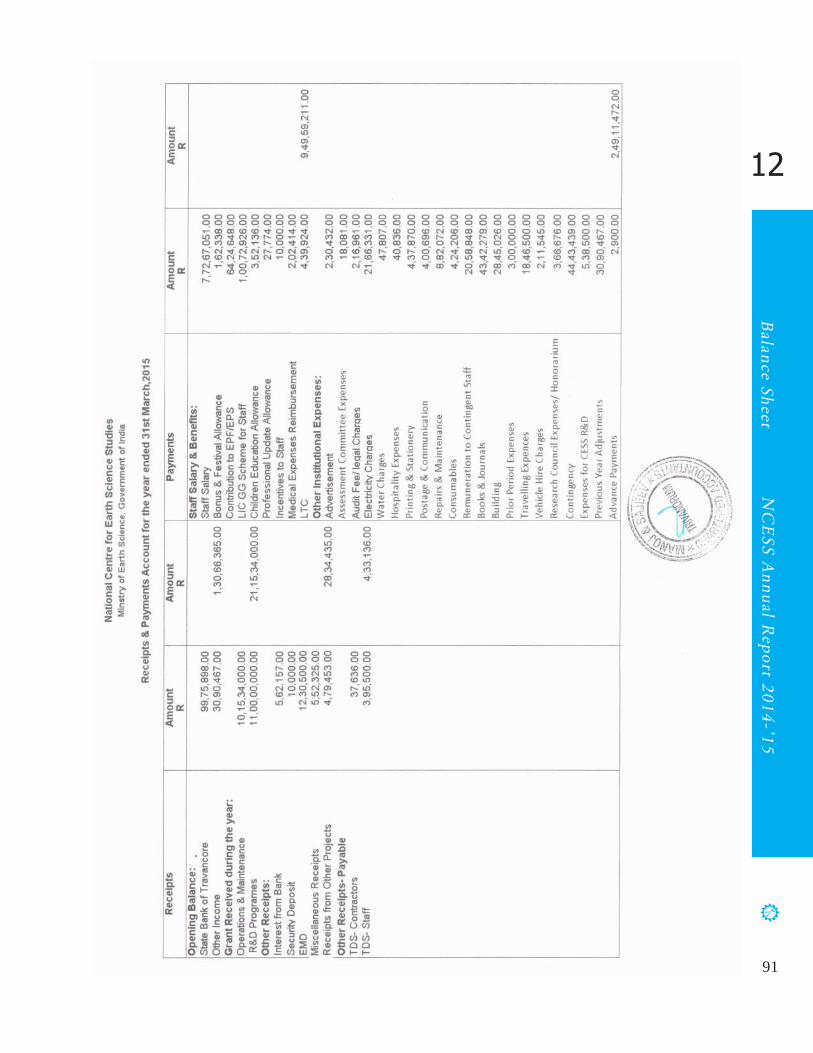
91
12
NC
ES
S A
nn
ual R
epo
rt 20
14
-’15
Balan
ce Sh
eet
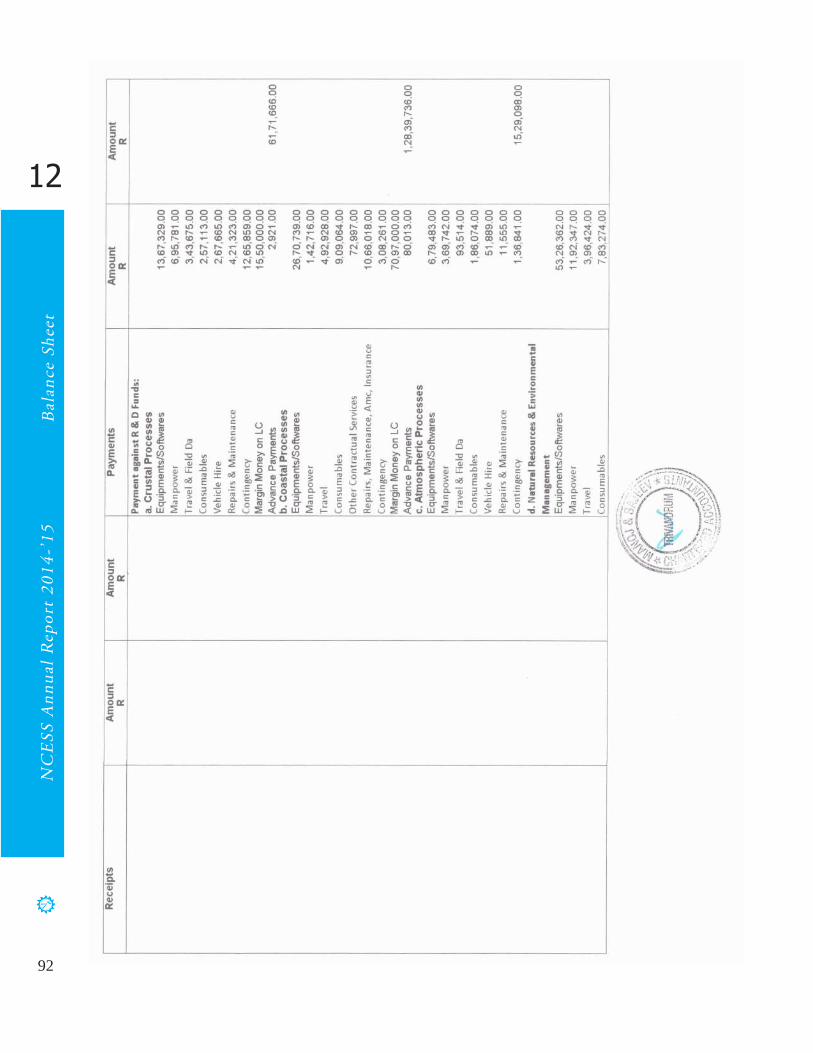
92
NC
ES
S A
nn
ual
Rep
ort
20
14
-’1
5B
alan
ce S
hee
t
12

93
12
NC
ES
S A
nn
ual R
epo
rt 20
14
-’15
Balan
ce Sh
eet

94
NC
ES
S A
nn
ual
Rep
ort
20
14
-’1
5B
alan
ce S
hee
t
12

95
12
NC
ES
S A
nn
ual R
epo
rt 20
14
-’15
Balan
ce Sh
eet

96
NC
ES
S A
nn
ual
Rep
ort
20
14
-’1
5B
alan
ce S
hee
t
12

97
12
NC
ES
S A
nn
ual R
epo
rt 20
14
-’15
Balan
ce Sh
eet