9.2 Lesson · 398 Chapter 9 Statistical Measures 9.2 Lesson Key Vocabulary mean, p. 398 outlier, p....
4
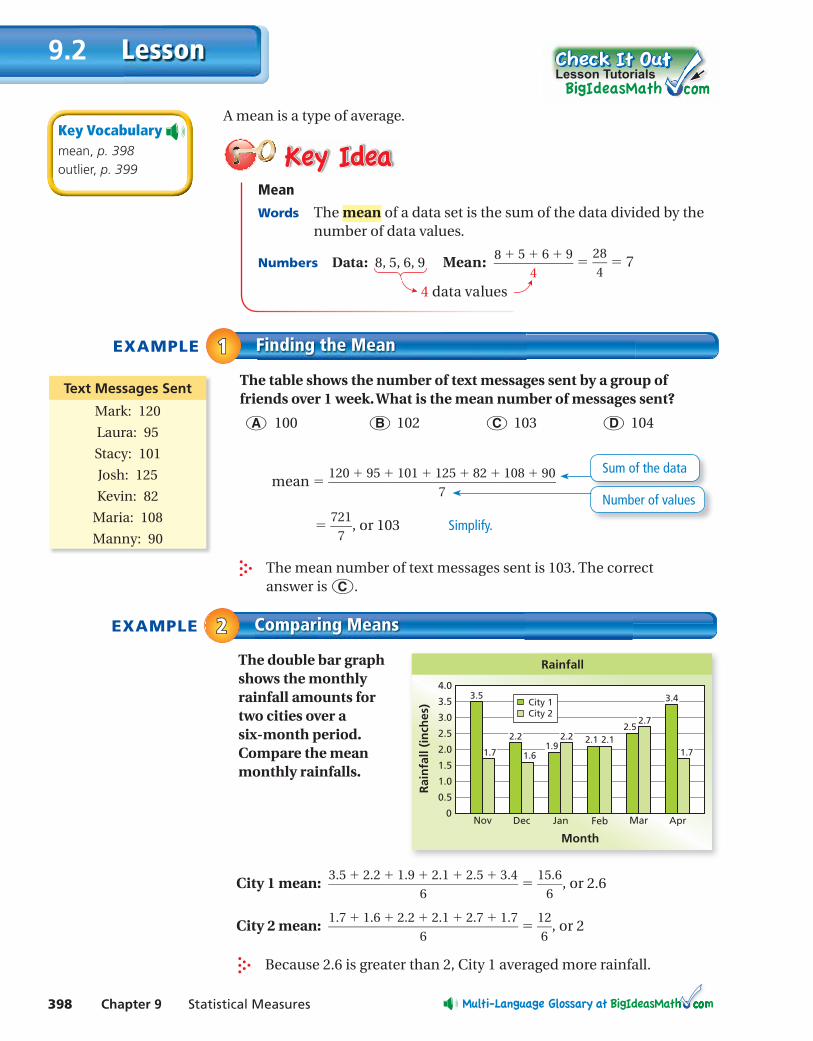
398 Chapter 9 Statistical Measures Lesson 9.2 Key Vocabulary mean, p. 398 outlier, p. 399 Mean Words The mean of a data set is the sum of the data divided by the number of data values. Numbers Data: 8, 5, 6, 9 Mean: 8 + 5 + 6 + 9 —— 4 = 28 — 4 = 7 4 data values EXAMPLE Finding the Mean 1 1 The table shows the number of text messages sent by a group of friends over 1 week. What is the mean number of messages sent? ○ A 100 ○ B 102 ○ C 103 ○ D 104 mean = 120 + 95 + 101 + 125 + 82 + 108 + 90 ———— 7 = 721 — 7 , or 103 Simplify. The mean number of text messages sent is 103. The correct answer is ○ C . Sum of the data Number of values Text Messages Sent Mark: 120 Laura: 95 Stacy: 101 Josh: 125 Kevin: 82 Maria: 108 Manny: 90 EXAMPLE Comparing Means 2 2 The double bar graph shows the monthly rainfall amounts for two cities over a six-month period. Compare the mean monthly rainfalls. Because 2.6 is greater than 2, City 1 averaged more rainfall. City 1 mean: 3.5 + 2.2 + 1.9 + 2.1 + 2.5 + 3.4 ——— 6 = 15.6 — 6 , or 2.6 City 2 mean: 1.7 + 1.6 + 2.2 + 2.1 + 2.7 + 1.7 ——— 6 = 12 — 6 , or 2 Lesson Tutorials 0.5 1.0 1.5 2.0 2.5 3.0 4.0 3.5 0 Nov Dec Jan Feb Mar Apr Month Rainfall (inches) Rainfall City 1 City 2 3.5 1.6 2.1 2.1 2.5 1.7 2.2 1.9 2.2 2.7 3.4 1.7 A mean is a type of average.
Transcript of 9.2 Lesson · 398 Chapter 9 Statistical Measures 9.2 Lesson Key Vocabulary mean, p. 398 outlier, p....
398 Chapter 9 Statistical Measures
Lesson9.2
Key Vocabularymean, p. 398outlier, p. 399
MeanWords The mean of a data set is the sum of the data divided by the
number of data values.
Numbers Data: 8, 5, 6, 9 Mean: 8 + 5 + 6 + 9 ——
4 =
28 —
4 = 7
4 data values
EXAMPLE Finding the Mean11The table shows the number of text messages sent by a group of friends over 1 week. What is the mean number of messages sent?
○A 100 ○B 102 ○C 103 ○D 104
mean = 120 + 95 + 101 + 125 + 82 + 108 + 90 ————
7
= 721 —
7 , or 103 Simplify.
The mean number of text messages sent is 103. The correct answer is ○C .
Sum of the data
Number of values
Text Messages Sent
Mark: 120
Laura: 95
Stacy: 101
Josh: 125
Kevin: 82
Maria: 108
Manny: 90
EXAMPLE Comparing Means22The double bar graph shows the monthly rainfall amounts for two cities over a six-month period. Compare the mean monthly rainfalls.
Because 2.6 is greater than 2, City 1 averaged more rainfall.
City 1 mean: 3.5 + 2.2 + 1.9 + 2.1 + 2.5 + 3.4 ———
6 = 15.6
— 6
, or 2.6
City 2 mean: 1.7 + 1.6 + 2.2 + 2.1 + 2.7 + 1.7 ———
6 = 12
— 6
, or 2
Lesson Tutorials
0.5
1.0
1.5
2.0
2.5
3.0
4.0
3.5
0Nov Dec Jan Feb Mar Apr
Month
Rain
fall
(inch
es)
Rainfall
City 1City 2
3.5
1.6
2.1 2.12.5
1.7
2.21.9
2.2
2.7
3.4
1.7
A mean is a type of average.
ms_green pe_0902.indd 398ms_green pe_0902.indd 398 1/28/15 3:50:41 PM1/28/15 3:50:41 PM
Section 9.2 Mean 399
An outlier is a data value that is much greater or much less than the other values. When included in a data set, it can affect the mean.
Find the mean of the data.
1. 49, 62, 52, 54, 61, 70, 55, 53 2. 7.2, 8.5, 7.0, 8.1, 6.7Exercises 6 –9
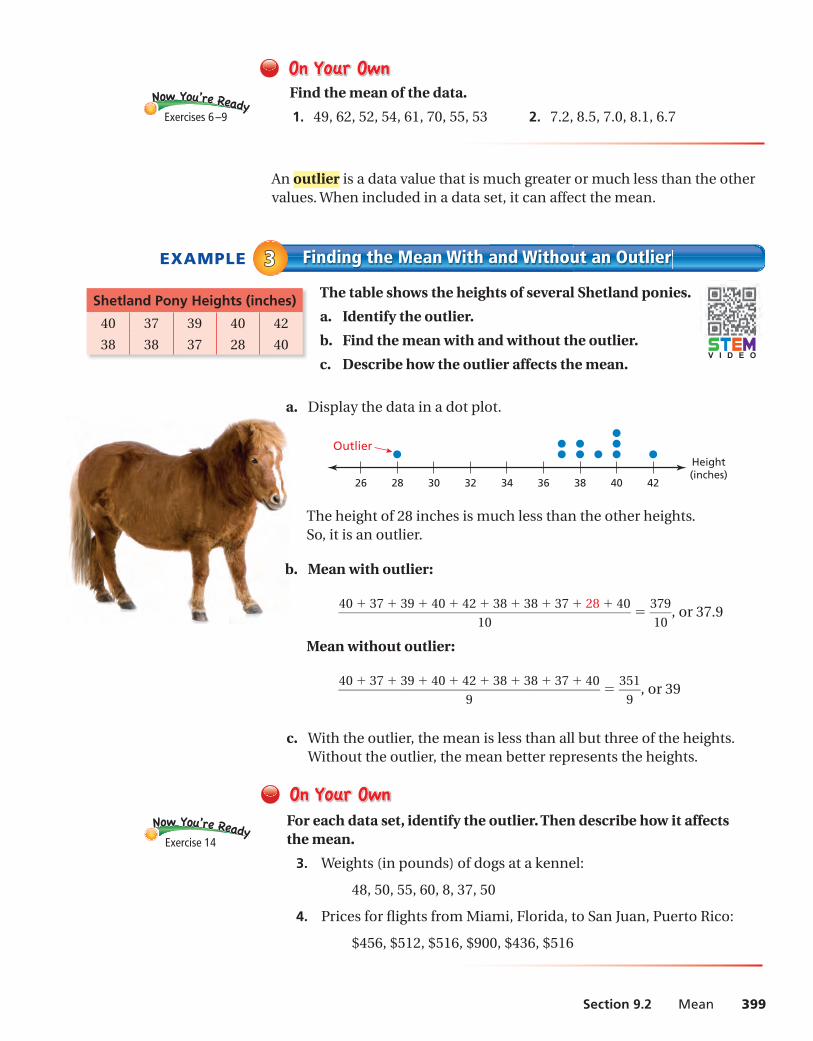
EXAMPLE Finding the Mean With and Without an Outlier33The table shows the heights of several Shetland ponies.
a. Identify the outlier.
b. Find the mean with and without the outlier.
c. Describe how the outlier affects the mean.
a. Display the data in a dot plot.
26 28 30 34 3832 36 40 42
OutlierHeight(inches)
The height of 28 inches is much less than the other heights. So, it is an outlier.
b. Mean with outlier:
40 + 37 + 39 + 40 + 42 + 38 + 38 + 37 + 28 + 40 ————
10 = 379
— 10
, or 37.9
Mean without outlier:
40 + 37 + 39 + 40 + 42 + 38 + 38 + 37 + 40 ————
9 = 351
— 9
, or 39
c. With the outlier, the mean is less than all but three of the heights. Without the outlier, the mean better represents the heights.
For each data set, identify the outlier. Then describe how it affects the mean.
3. Weights (in pounds) of dogs at a kennel:
48, 50, 55, 60, 8, 37, 50
4. Prices for fl ights from Miami, Florida, to San Juan, Puerto Rico:
$456, $512, $516, $900, $436, $516
Shetland Pony Heights (inches)
40 37 39 40 42
38 38 37 28 40
Exercise 14
V I D E O
ms_2017_green_pe_0902.indd 399ms_2017_green_pe_0902.indd 399 7/20/16 9:43:22 AM7/20/16 9:43:22 AM
Exercises9.2
400 Chapter 9 Statistical Measures
1. VOCABULARY Arrange the words to explain how to fi nd a mean.
the data values
divide by
the number of data values
add
then
2. NUMBER SENSE Is the mean always equal to a value in the data set? Explain.
3. REASONING Can you use the mean to answer a statistical question? Explain.
9+(-6)=3
3+(-3)=
4+(-9)=
9+(-1)=
Describe an average value of the data.
4. Ages in a class: 11, 12, 12, 12, 12, 12, 13 5. Movies seen this week: 0, 0, 0, 1, 1, 2, 3
Find the mean of the data.
6. Pets Owned
Brandon ∣̇̇
Jill ∣̇̇̇∣̇̇∣̇
Mark ∣̇̇̇∣̇
Nicole ∣̇̇̇∣̇̇∣̇̇∣̇
Steve 0
7. Brothers and Sisters
Amanda
Eve
Joseph
Michael
8. Sit-ups
108 85 94
103 112 115
98 119 126
105 82 89
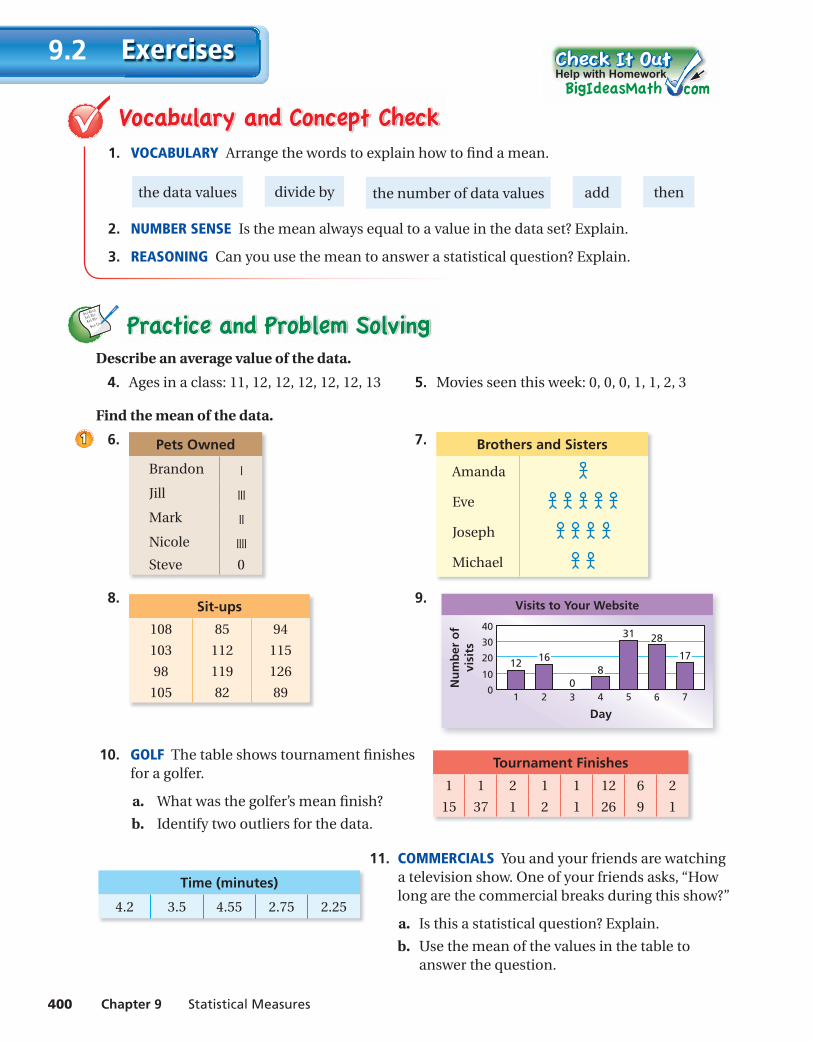
9.
Num
ber
ofvi
sits
Visits to Your Website
10
20
30
40
01 2 3 4 5 6 7
Day
0
31
128
28
1716
10. GOLF The table shows tournament fi nishes for a golfer.
a. What was the golfer’s mean fi nish?
b. Identify two outliers for the data.
11. COMMERCIALS You and your friends are watching a television show. One of your friends asks, “How long are the commercial breaks during this show?”
a. Is this a statistical question? Explain.
b. Use the mean of the values in the table to answer the question.
11
Tournament Finishes
1 1 2 1 1 12 6 2
15 37 1 2 1 26 9 1
Help with Homework
Time (minutes)
4.2 3.5 4.55 2.75 2.25
ms_green pe_0902.indd 400ms_green pe_0902.indd 400 1/28/15 3:50:47 PM1/28/15 3:50:47 PM
Section 9.2 Mean 401
Evaluate the expression. (Section 1.3)
19. 8 + 10 —
2 20. 26 + 34
— 2
21. 18 + 19 —
2 22. 14 + 17
— 2
23. MULTIPLE CHOICE 60% of what number is 105? (Section 5.6)
○A 63 ○B 175 ○C 630 ○D 1750
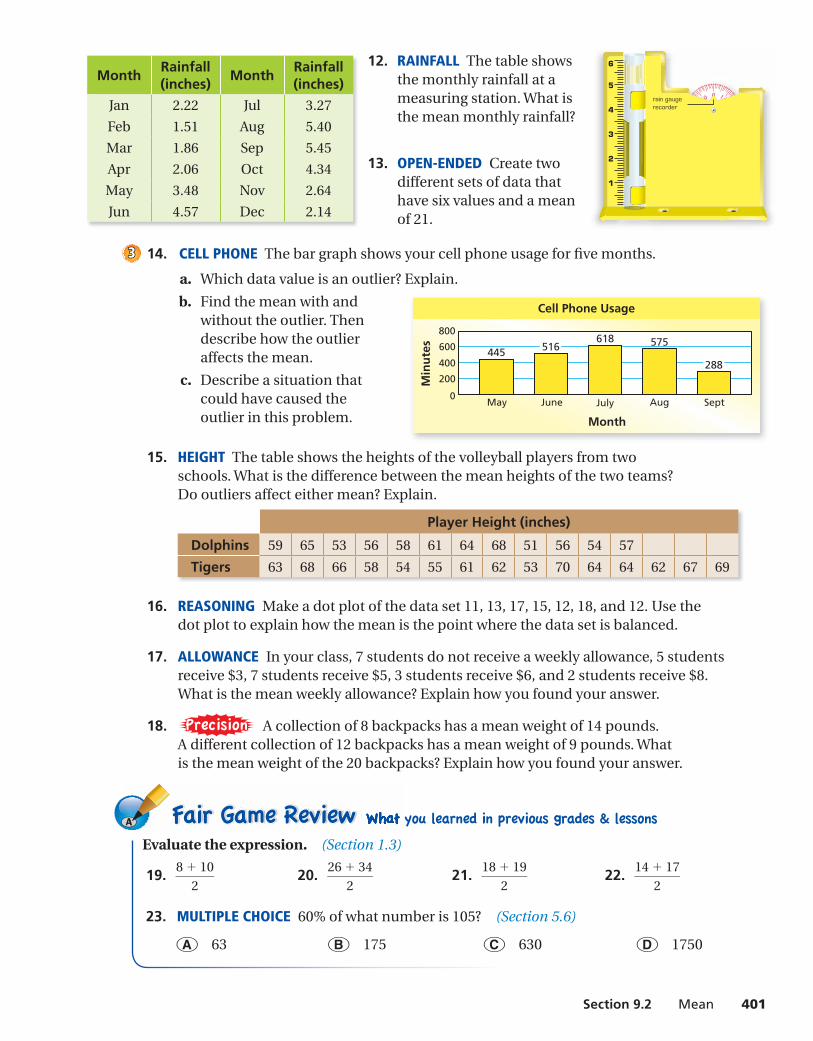
12. RAINFALL The table shows the monthly rainfall at a measuring station. What is the mean monthly rainfall?
13. OPEN-ENDED Create two different sets of data that have six values and a mean of 21.
14. CELL PHONE The bar graph shows your cell phone usage for fi ve months.
a. Which data value is an outlier? Explain.
b. Find the mean with and without the outlier. Then describe how the outlier affects the mean.
c. Describe a situation that could have caused the outlier in this problem.
15. HEIGHT The table shows the heights of the volleyball players from two schools. What is the difference between the mean heights of the two teams? Do outliers affect either mean? Explain.
Player Height (inches)
Dolphins 59 65 53 56 58 61 64 68 51 56 54 57
Tigers 63 68 66 58 54 55 61 62 53 70 64 64 62 67 69
16. REASONING Make a dot plot of the data set 11, 13, 17, 15, 12, 18, and 12. Use the dot plot to explain how the mean is the point where the data set is balanced.
17. ALLOWANCE In your class, 7 students do not receive a weekly allowance, 5 students receive $3, 7 students receive $5, 3 students receive $6, and 2 students receive $8. What is the mean weekly allowance? Explain how you found your answer.
18. PrecisionPrecision A collection of 8 backpacks has a mean weight of 14 pounds. A different collection of 12 backpacks has a mean weight of 9 pounds. What is the mean weight of the 20 backpacks? Explain how you found your answer.
200
400
600
May June July Aug Sept
800
0
MonthM
inut
es
Cell Phone Usage
445618 575516
288
12
13
Month Rainfall (inches) Month Rainfall
(inches)Jan 2.22 Jul 3.27
Feb 1.51 Aug 5.40
Mar 1.86 Sep 5.45
Apr 2.06 Oct 4.34
May 3.48 Nov 2.64
Jun 4.57 Dec 2.14
0 1.06.0
6
5
4
3
2
1
rain gaugerecorder
33
ms_green pe_0902.indd 401ms_green pe_0902.indd 401 1/28/15 3:50:51 PM1/28/15 3:50:51 PM