9.11.2009 1 Transmissions, Gearboxes and Axles RotasPro Noise Analysis.
41
9.11.2009 1 Transmissions, Gearboxes and Axles RotasPro Noise Analysis
-
Upload
vivien-brooks -
Category
Documents
-
view
218 -
download
1
Transcript of 9.11.2009 1 Transmissions, Gearboxes and Axles RotasPro Noise Analysis.

9.11.2009 1
Transmissions, Gearboxes and Axles
RotasPro Noise Analysis

9.11.2009 2
The company was founded in 1985. It is situated in Göttingen in the heart of Germany. Since 1989 the main product are measurement system for the acoustical quality analysis. There are 20 employees and more than 500 test systems deployed.
Base system are ROTAS and MESAM-4 (a joint development with DaimlerChrysler). Build on top of them are APAS for the cabin noise analysis, ROTAS-GP for the analysis of gearboxes and transmissions, ROTAS-ZP for the gear test, ROTAS-TMO for the test of tapered roller bearings.
MESAM 4
APAS-II
Base System Gearboxes and ComponentsCabin noise
ROTAS-Mobil
Discom Industrial Measurement Inc.

9.11.2009 3
ZF DGear Testers 4 Systems
Volkswagen D, ES, SA,AR, China,B,SK,BR
Gearboxes, Transmissions, Gear Testers, Cabin Noise Production Database, 178 Systems
Tongil, Korea
Axles, Durability test Stand, 1 System
SFT, Magna Stey Powertrain
Axles and gearboxes 28 Systems
Skoda, Cz
Gearboxes, 7 Systems
SAIC Shanghai Automobile Internatiol Corp.
Gearboxes test systems, 5 Systems
SKF D, USA, India, Ukraine
Tapered Roller Bearings, 35 Systems
Robert Bosch Starters, injection pumps, production database 6 Systems
Renault, PeugeotTransmissions, Gear Testers 11 Systems
GM, USA, Opel D and AGearboxes and Axle Testers, Gear Testers 44 Systems
Jatco, Japan
CVT Transmissions
Discom: Customers and Applications
Fiat, Iveco, Tata, It, Brazil, India
Manual Transmissions 20 Systems
Getrag, USA Sc, Single Flank Gear Tester for Cummins Engine Gears with Tors. Acceleration
Graziano, Italy Gearboxes and Axles for Audi, Aston Martin, Ferrari, Lamborghini, Maserrati
Eaton, Br Manual transmissions,
mobil system
Ford, D
Gear Testers 4 Systems
First Automobile Works, China
Gearboxes 2 Systems
DaimlerChrysler D, US Cooperation MESAM4, gearboxes, transmissions and engines. 48 Systems
Borg-Warner, USA,UK Transmissions und Axles 11 Systems
Bentley, UK
Cabin Noise Analysis APAS, 2 Systems
American Axle, USA
Front and Rear Axles, 5 Systems
Hyundai, Korea
Gear tester 2 Systems
Cummins
9.11.2009 4
Rotas NVH Testing
End of line test with vehicle correlation and the ability to find production errors
Separation of noise components from inner wheels of transmissions
Calibrated evaluation for comparison of the production process with car experiences
Simultaneous measurement and evaluation of all transmission order components
Recognition of nicks on gears and bearings
Trainable system in combination with fixed limits
Test results stored in central data base
Intranet evaluation of test results for groups of test benches

9.11.2009 5
Parameter- und Limit Database
Parameter- und Limit Database
RotasAnalysisProgram
RotasAnalysisProgram
Result DatabaseArchives, SQL-DBResult Database
Archives, SQL-DB
Web StatisticsWeb StatisticsPresentationPresentation
Test StandControl
Test StandControl
Sensors
ROTAS Test Stand Configuration

9.11.2009 6
Rotas Analyzers
19”-Industrial PC.TAS Frontend RAID systemDual Core and I7 CPUs
Panel with IPC and TASFrontend. AC and UPS buildinto panel
TAS USB Measurement frontend.10 analog channels, 4 speed inputs, D/A monitor outputs.Mobile system with USB power for 5 ICP sensors
9.11.2009 7
BKS03 Accelerometer
1.0 2.0 3.0 4.0 5.0 6.0 7.0 8.0 9.0 k Hz
-20.0
-15.0
-10.0
-5.0
0.0
dBg
TrnsFnc
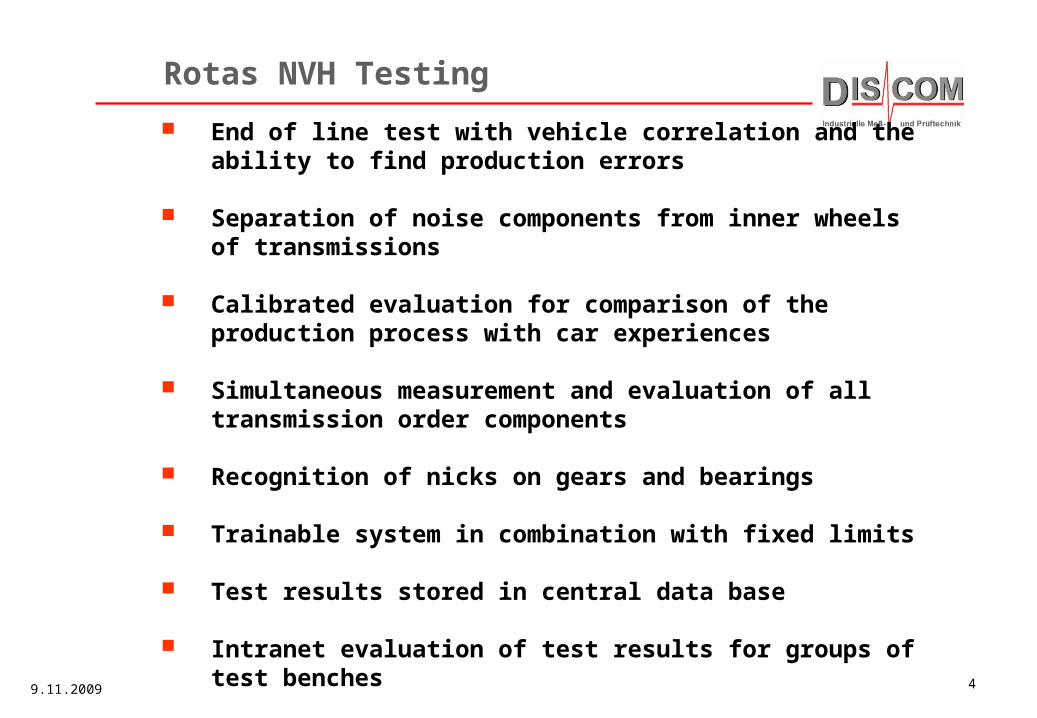
The BKS03 has a linear frequency range of up to 10 kHz and can be used to pick up the NVH signal also from unfinished surfaces

9.11.2009 8
RotasPro separates the noise into the different sources inside the transmission like input, intermediate and output shaft. I addition, the the total noise is evaluated.
A prominent method is the calculation of the spectral components of the noise. The spectrum shows the characteristic of the noise in form of a curve.
For transmissions, spectral components exist for tooth mesh and its harmonics.
The spectra are compared with limit curves. If the limit curve is exceeded, a defect can be assumed.
In addition, temporal measurement give Crest, Peak and RMS values, which are used for the identification of nicks on the transmission parts.
Noise sources
A main noise source is the tooth mesh of the gears.
Analysis of transmission noise
9.11.2009 9
Input
One rev
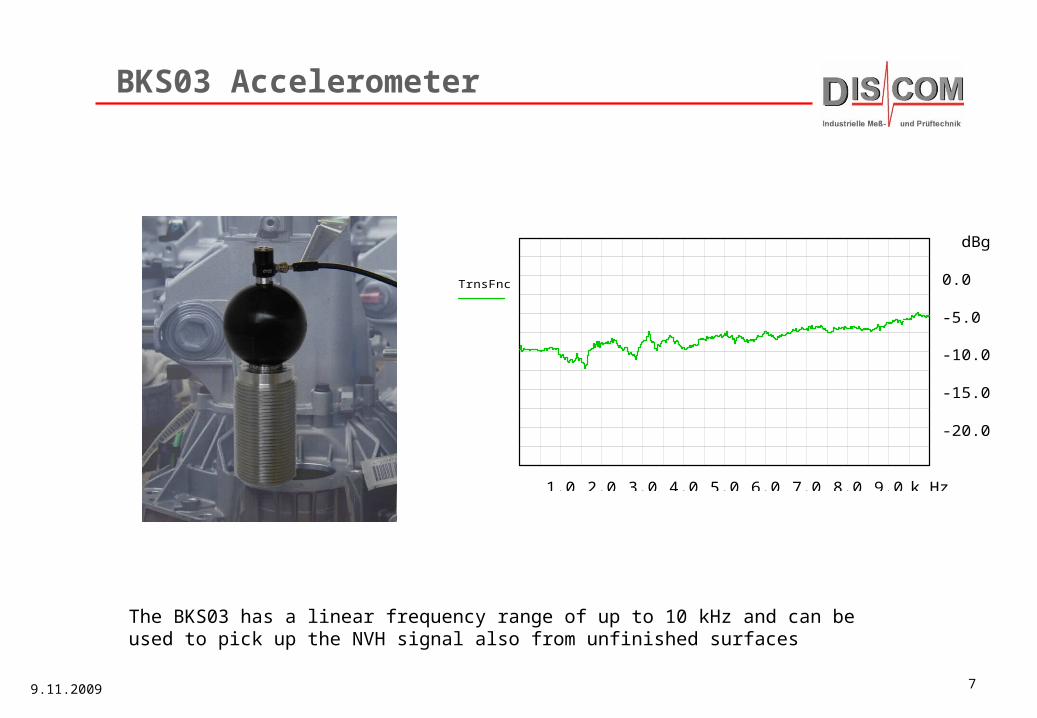
Exact order analysis is accomplished by generating of the same amount of samples per revolution of a part, independent of its revolutionary speed.
Digital resampling allows for the processing of 3 to 5 shafts of a transmission.
From this resampled time domain signal, spectra evaluation produces order components. These are the amplitudes of sine components, which are cyclic with the revolution of the part
Order Analysis
Input
One rev
Input
One rev
Constant numberof samples perrevolution

9.11.2009 10
Revolution Synchronous Transmission Analysis
Input Shaft Interm. Shaft Output Shaft
The transmission noise is the sum of the noise originating from the individual mechanical components.
For the gear noise components, the individual sources can be isolated by the transmission ratio.
Synchronousorder analysis:The signals are acquired synchronousto the inner shafts.AcousticalStroboscope
Input Shaft
Interm. Shaft
Output Shaft

9.11.2009 11
Signal
Background
Average:Signal enhanced
For every shaft, averaging is performed synchronous to its revolution.
Signal components of the synchronous shaft are enhanced, other noise components are attenuated.
One shaft is shown. Rotas can do the processing for 3 to 5 shafts simultaneously.
Usually, only one sensor is needed.
The synchronization can be done for inner shafts, for which only the transmission ration is known.
Synchronous Averaging I
Signal
Background
Signal
Background
+
+
+
+
+
Summe * 1/n =
9.11.2009 12
400 800 1200160020002400280032003600m Rev
-16.0
-8.0
0.0
8.0
16.0
g
ZwAn
-16.0
-8.0
0.0
8.0
16.0
g
ZwAb
-16.0
-8.0
0.0
8.0
16.0
g
TsAb
400 800 1200160020002400280032003600m Rev
-16.0
-8.0
0.0
8.0
16.0
g
ZwAn
-16.0
-8.0
0.0
8.0
16.0
g
ZwAb
-16.0
-8.0
0.0
8.0
16.0
g
TsAb
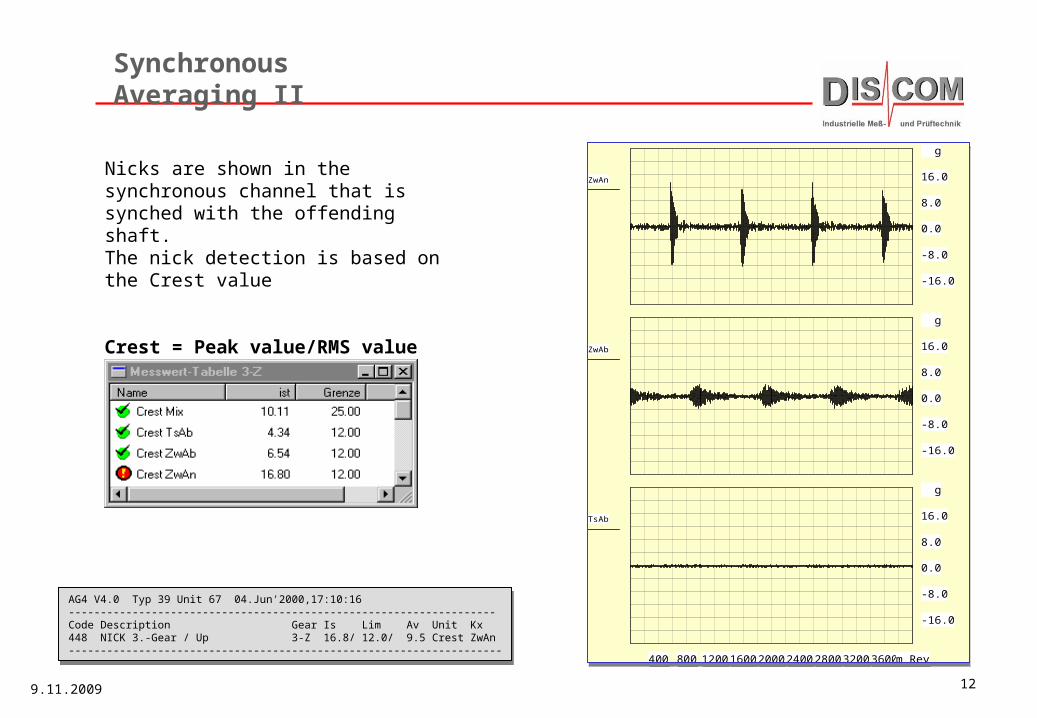
Synchronous Averaging II
Nicks are shown in the synchronous channel that is synched with the offending shaft.The nick detection is based on the Crest value
Crest = Peak value/RMS value
AG4 V4.0 Typ 39 Unit 67 04.Jun'2000,17:10:16-------------------------------------------------------------------Code Description Gear Is Lim Av Unit Kx 448 NICK 3.-Gear / Up 3-Z 16.8/ 12.0/ 9.5 Crest ZwAn--------------------------------------------------------------------
AG4 V4.0 Typ 39 Unit 67 04.Jun'2000,17:10:16-------------------------------------------------------------------Code Description Gear Is Lim Av Unit Kx 448 NICK 3.-Gear / Up 3-Z 16.8/ 12.0/ 9.5 Crest ZwAn--------------------------------------------------------------------

9.11.2009 13
400 800 1200160020002400280032003600m Rev
-16.0
-8.0
0.0
8.0
16.0
g
ZwAn
-16.0
-8.0
0.0
8.0
16.0
g
ZwAb
-16.0
-8.0
0.0
8.0
16.0
g
TsAb
400 800 1200160020002400280032003600m Rev
-16.0
-8.0
0.0
8.0
16.0
g
ZwAn
-16.0
-8.0
0.0
8.0
16.0
g
ZwAb
-16.0
-8.0
0.0
8.0
16.0
g
TsAb
Time Domain Measurements
Peak: The maximum amplitude in a time domain signal. In the example to the right the Peak value is about 15 g
RMS: The average energy in a time domain signal. In the example to the right the RMS value is about 0.9 g. The exact formula is Sqrt(Sum((xi)2) for all measurement values xi
Crest: The ratio of the peak value divided by the RMS value:
Crest = Peak value/RMS value
In the example to the right the Crest value is about 16.8. It has no unit
The Crest value is a good indication of the ‘Peakiness’ in a signal. Good gears have a Crest value of 3-8, bad gears have a Crest value from 10 to 30.
Tickeval: The Tickeval value indicates the maximum difference of short-time spectra taken over the revolution from the average short-time spectrum for the revolution. Good gears have values of 6, bad gears have values above 12.
AG4 V4.0 Typ 39 Unit 67 04.Jun'2000,17:10:16-------------------------------------------------------------------Code Description Gear Is Lim Av Unit Kx 448 NICK 3.-Gear / Up 3-Z 16.8/ 12.0/ 9.5 Crest ZwAn--------------------------------------------------------------------
AG4 V4.0 Typ 39 Unit 67 04.Jun'2000,17:10:16-------------------------------------------------------------------Code Description Gear Is Lim Av Unit Kx 448 NICK 3.-Gear / Up 3-Z 16.8/ 12.0/ 9.5 Crest ZwAn--------------------------------------------------------------------
Peak
RMS

9.11.2009 14
Separation of Gear Errors
The acoustical signal holds the components of both gears.
Knowing the transmission ratio, the periodicity of each gear can be found. Gear mesh components only depend on the pairing of the gears.
Eccentricities and surface errors can be separated because they have a cycle that corresponds to the originating gear. The following errors can contributed individually:
� Eccentricities, � Deviation from circular shape� Tooth spacing� Surface waves (Ghost Orders)� Nicks
Z1
16
Z2
20
Z 1
1 6
Z 2
2 0
The gear mesh componentdepends on the pairing
Eccentricities and surfaceerrors can be contributedindividually.
16
20
16
20

9.11.2009 15
Fourier transform: Order spectrum
Time Domain Versus Order Domain I
5.0 10.0 15.0 20.0 25.0 30.0 35.0 40.0 45.0 Ord
60
70
80
90
100
dBV
Oran.SK1
5.0 10.0 15.0 20.0 25.0 30.0 35.0 40.0 45.0 Ord
60
70
80
90
100
dBV
Oran.SK1
400 800 1200160020002400280032003600m Rev
-2.0
-1.0
0.0
1.0
2.0
V
Oran.SK1
400 800 1200160020002400280032003600m Rev
-2.0
-1.0
0.0
1.0
2.0
V
Oran.SK1
Sinesmooth gear contact
Order at number of teeht: 5Base order H1
400 800 1200160020002400280032003600m Rev
-2.0
-1.0
0.0
1.0
2.0
V
Oran.SK1
400 800 1200160020002400280032003600m Rev
-2.0
-1.0
0.0
1.0
2.0
V
Oran.SK1
5.0 10.0 15.0 20.0 25.0 30.0 35.0 40.0 45.0 Ord
60
70
80
90
100
dBV
Oran.SK1
5.0 10.0 15.0 20.0 25.0 30.0 35.0 40.0 45.0 Ord
60
70
80
90
100
dBV
Oran.SK1
Triangharsher gear mesh
Harmonics at odd multiplesof nr of teeth (5)H1, H3, H5, ..
400 800 1200160020002400280032003600m Rev
-2.0
-1.0
0.0
1.0
2.0
V
Oran.SK1
400 800 1200160020002400280032003600m Rev
-2.0
-1.0
0.0
1.0
2.0
V
Oran.SK1
5.0 10.0 15.0 20.0 25.0 30.0 35.0 40.0 45.0 Ord
60
70
80
90
100
dBV
Oran.SK1
5.0 10.0 15.0 20.0 25.0 30.0 35.0 40.0 45.0 Ord
60
70
80
90
100
dBV
Oran.SK1
Sawtoothharsh gear mesh
Strong harmonics of number ofteeth (5)H1, H2, H3, ..
Gear with 5 teeth, 4 revolutions

9.11.2009 16
Fouriertransformation: Ordnungsspektrum
Time Domain Versus Order Domain II, Modulations
400 800 1200160020002400280032003600m Rev
-2.0
-1.0
0.0
1.0
2.0
V
Oran.SK1
400 800 1200160020002400280032003600m Rev
-2.0
-1.0
0.0
1.0
2.0
V
Oran.SK1
5.0 10.0 15.0 20.0 25.0 30.0 35.0 40.0 45.0 Ord
60
70
80
90
100
dBV
Oran.SK1
5.0 10.0 15.0 20.0 25.0 30.0 35.0 40.0 45.0 Ord
60
70
80
90
100
dBV
Oran.SK1
Sine with modulating sineSmooth gear mesh witheccentricity
Order at nr of teeth H1 with side bands +/- 1 order
5.0 10.0 15.0 20.0 25.0 30.0 35.0 40.0 45.0 Ord
60
70
80
90
100
dBV
Oran.SK1
5.0 10.0 15.0 20.0 25.0 30.0 35.0 40.0 45.0 Ord
60
70
80
90
100
dBV
Oran.SK1
400 800 1200160020002400280032003600m Rev
-2.0
-1.0
0.0
1.0
2.0
V
Oran.SK1
400 800 1200160020002400280032003600m Rev
-2.0
-1.0
0.0
1.0
2.0
V
Oran.SK1
Triang with modulating sineharsher gear mesh witheccentricity
Harmonics H1, .. withside bands +/- 1 order
400 800 1200160020002400280032003600m Rev
-2.0
-1.0
0.0
1.0
2.0
V
Oran.SK1
400 800 1200160020002400280032003600m Rev
-2.0
-1.0
0.0
1.0
2.0
V
Oran.SK1
5.0 10.0 15.0 20.0 25.0 30.0 35.0 40.0 45.0 Ord
60
70
80
90
100
dBV
Oran.SK1
5.0 10.0 15.0 20.0 25.0 30.0 35.0 40.0 45.0 Ord
60
70
80
90
100
dBV
Oran.SK1
Triang with modulating triangharsher gear mesh withseveral eccentricities
Harmonics H1, .. withside bands +/- n.Order
Gear with 5 teeth, 4 revolutions

9.11.2009 17
50 60 70 80 90 100 110 120 130 Ord
40
50
60
70
80
dBV
Mix
Antrieb
Revolution synchronous averaging gives periodic (cyclic) signals. This corresponds to the cyclic nature of the gear sets.
These signals can be transformed into the spectral domain without any time domain leakage windows.
This allows for high spectral resolution. Eccentricities can be easily distinguished from the gear mesh orders. The noise components can be attributed to their origins.
Blue: Conventional order spectrum with Kaiser Bessel Window
Green: Revolution synchronous order spectrum without window function
Synchronous Averaging III
GM 2 *GM
Ecc.. GhostOrders

9.11.2009 18
Order spectra of a lay shaft transmission
8.0 16.0 24.0 32.0 40.0 48.0 56.0 64.0 72.0 Ord
70
80
90
100
110
dBg
AW
SK1-lim
70
80
90
100
110
dBg
VGW
SK2-lim
70
80
90
100
110
dBg
HW
SK3-lim
70
80
90
100
110
dBg
Mix
Mix-lim
8.0 16.0 24.0 32.0 40.0 48.0 56.0 64.0 72.0 Ord
70
80
90
100
110
dBg
AW
SK1-lim
70
80
90
100
110
dBg
VGW
SK2-lim
70
80
90
100
110
dBg
HW
SK3-lim
70
80
90
100
110
dBg
Mix
Mix-lim
Input
VGW
HW
Mix
Input H1 Input H2
VZ1 H1 VZ1 H2VZ5 H1 VZ5 H2
5. Gg H1 5. Gg H2OW 5. Gg
-10 dB-12 dB
Limits:red
O-Spectra:black
Input: 26 ZVZ1: 35 ZVZ 4: 43 Z5. Gear 27 Zi = 1.1764

9.11.2009 19
Evaluation of Order Spectra
10 20 30 40 50 60 70 80 90 Ord
45
60
75
90
105
dBgVGW
VGW-lim
The order spectra of the synchronous channels and of the mix channel are compared with alimit curve. Every order of the limit curvehas an underlying error code. This error codeis generated from transmission ratios in a semiautomatic fashion. If the limit curveis exceeded, the error code gives rise to anerror message in plain text.
The limit curves consist of portions, whichare generated by a learning process and ofportions which are set to fixed values.
The learn rnode is used for those spectralportions, where there are results from driving experiments available yet. Generally thisholds true for tooth spacing problems,ghost orders and bearing noise (in themix channel).Fixed limits are adopted from driving experiments,usually for the gear mesh and for the side bands.

9.11.2009 20
Measurement Report
A protocol is generated for every unit. It holds information about unit type,serial number, time of measurementand defect report.
There are three kinds of report:
Short:: serial numbers only for goodunits, defect report for failing units.Normal: Report line for every unitLong: All measurement values in tabular form.
Around 300 measurement resultsare stored in a protocol database forstatistical evaluation. 5000 units useabout 20 Mbyte of disk space.
The test stand control system can request several protocol variantsfor own recording purposes.

9.11.2009 21
10 20 30 40 50 60 70 80 90 Ord
20
40
60
80
100
dBg
MaxBnd
MinBnd
StdDev
AW-avg
SK1-lim
10 20 30 40 50 60 70 80 90 Ord
20
40
60
80
100
dBg
MaxBnd
MinBnd
StdDev
AW-avg
SK1-lim
Spectral Limits
Limit curve from Average + Offset + n times standard deviation. Overridden by minimum and maximum polygons and by the fixed hats.
Hats for gear mesh orders and their side bands

9.11.2009 22
Learning
For all measurements, the following statisticalproperties are computed:
Average (AV) undStandard deviation (STD)
From these numbers, a limit L is generatedaccording to
L = AV + Offset + n* STD.
The offset and the multiplier of the standard deviation is selectable. For spectral measures,an offset of 5 dB and a std-factor of 3 is normally used. Maximum and minimum values set upper and lower bounds for the limit L.
A new learn consist of a base learn (usually 5 units), where all units are accepted that are below maximum polygons and below hats.
The base learn is followed by an additional learning (usually 100 units). Here every unit is evaluated against the already established limitcurves. Only error free units will be added to the learning sample.
Another available choice consists of a indefinite learn process with a selectable time constant.
During the whole learning process, the fixed limits apply. This assures, that all known data (like limits from car experiments) will be used as a guidance during the process.
What is learned Learning methods

9.11.2009 23
Cabin noise components
Noise sources
There are many different transfer paths for the sound and the vibration from the gearset to the drivers ear.
Each path has its own frequency dependent transfer function
Noise from the motor, wind and tires may mask certain frequency bands from the gears.
These effects induce the speed, torque and vehicle dependent noise perception of the gear sets.
Transfer paths
9.11.2009 24
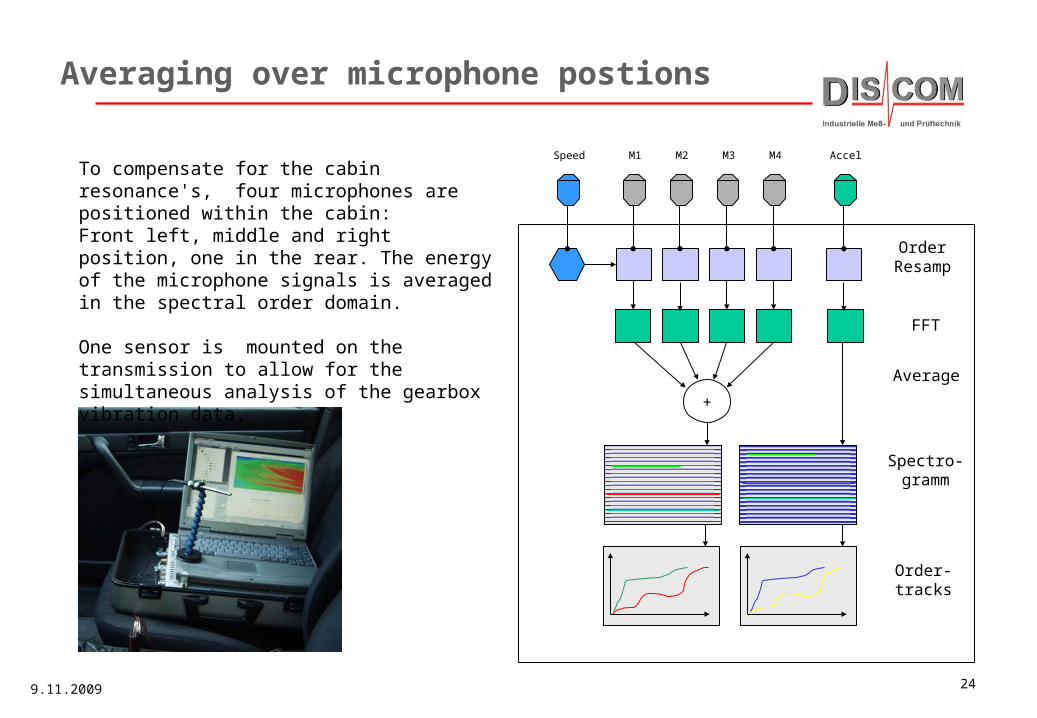
Averaging over microphone postions
M2M1 M3 M4 AccelSpeed
OrderResamp
FFT
+
Average
Spectro-gramm
Order-tracks
To compensate for the cabin resonance's, four microphones are positioned within the cabin:Front left, middle and right position, one in the rear. The energy of the microphone signals is averaged in the spectral order domain.
One sensor is mounted on the transmission to allow for the simultaneous analysis of the gearbox vibration data.

9.11.2009 25
Order spectrograms
Order spectrograms are recorded for the gearbox vibration signal and for the cabin sound field.
From these order tracks for arbitrary orders and order spectra for arbitrary speeds can be generated:
1) Ordnungs-Spektrogramm 4. Gang Zug
Order track for the 65. order
2) Order spectrum at 2241 RPM

9.11.2009 26
Vibration and Cabin Noise, Spectral Cuts
Spectral Cut Cabin Noise: 12 db higher than background at 2640 RPM/110 Km/h
12 dB
Spectral Cut Vibration: 50th order of 100 dBg at 2700 RPM

9.11.2009 27
Vibration and Cabin Noise, Order Cuts

9.11.2009 28
Order Tracking
The critical noise sources in a car are usually the gear mesh orders and their sidebands.
These noise sources are highly speed dependent. Detailed speed dependent evaluation uses the track of mesh orders and sidebands over speed.
The gear mesh H1 base order and its harmonics are tracked over speed and compared with speed dependet limit curves.
The track form depends on torque, drive/coast and on the resonances within the gearbox and the test stand.
Within speed bands, average and maximum amplitudes can be evaluated and compared to limits. The single values are ideal for statistical analysis over time. Speed band
Tracked Value Curve 1 Curve 2 H1 Max Bd1 79.1 dB 75.5 dBH1 Aver Bd1 76.2 dB 71.9 dB

9.11.2009 29
Shown are measurements with the GSW shift roboter, which measures forces and displacement directly at the transmission shift mechanism.
Shifting effort is shown versus displacement
Positive forces: Shift into a gear
Negative forces: Shifting out of gear
A: Synchronisation work when shifting into a gear. Good repeatability
B: Shifting through after synchronisation. Varying force.
C: Shifting out. Small forces for good transmissions
D: Synchron ring missing
Shift force evaluation
AB
C
AB
C
AB
C
A B
C
A B
C
A B
C
D
D

9.11.2009 30
Evaluation of shifting effort versus lever displacement.
The synchronization is evaluated via the work that is needed (F*s). Therefore, the area of the curve above a window A is computed (work = force * displacement) . D: a transmission without a synchron ring.
The maximum force during shifting into a gear are limited with the polygon B
The maximum forces when shifting out are limited with a polygon C.
End position: a settable end position must be reached when shifting is finished.
Evaluation of Shifting Effort
AB
C
D
Schaltkraft über Weg für 150 Seriengetriebe. Bewertungsfenster erkennen fehlende Synchronringe und Schwergängigkeiten.

9.11.2009 31
Management of Multiple Test Benches
Server
Parameter Setting and Statistical Evaluation
Test Benches
Intranet
DataParameter
PC withInternet Explorer
Central archive of test results Parameter setting and statistical evaluation from every PC with intranet access.

9.11.2009 32
RotasAnalyzerRotas
Analyzer
MeasurementDatabase
MeasurementDatabase
Measurement Archives
Measurement Archives
RotasPresentation
RotasPresentation
Intranet StatisticsIntranet Statistics
Rotas Data Flow
Server or Test Stand
Test Stand
Work Group PC
Work Group PC has presentation software installedCan use Intranet statistcis via Internet Explorer
9.11.2009 33
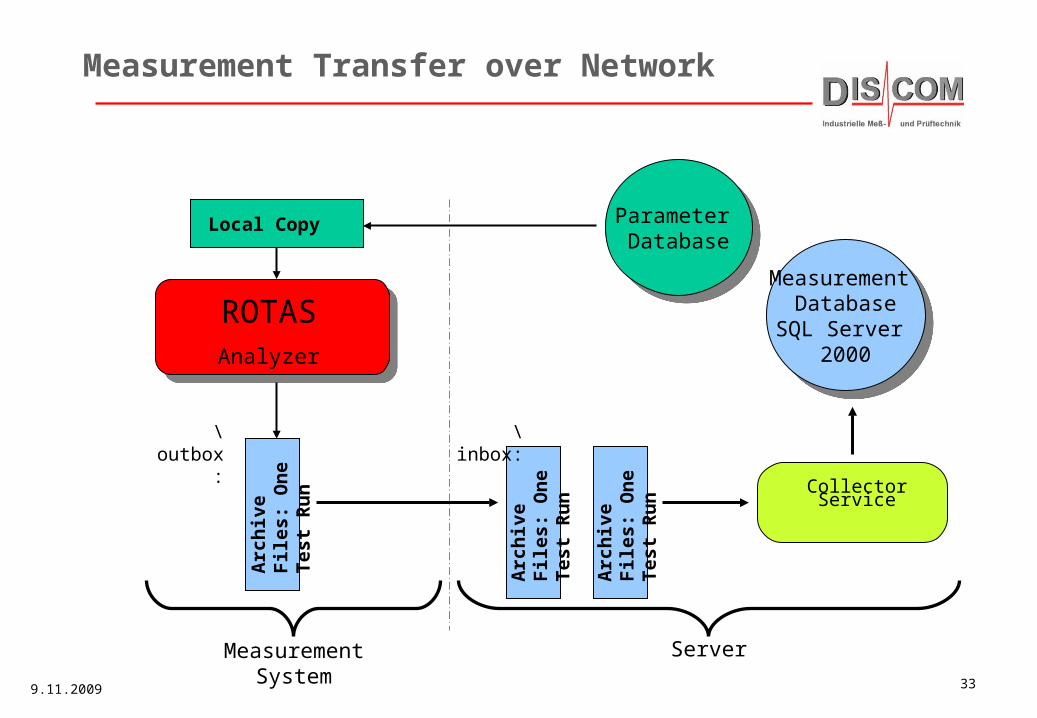
ROTASAnalyzer
Measurement System Server
Measurement Database
SQL Server 2000
Measurement Database
SQL Server 2000
Arc
hiv
e F
iles
: O
ne
Tes
t R
un
Arc
hiv
e F
iles
: O
ne
Tes
t R
un
Arc
hiv
e F
iles
: O
ne
Tes
t R
un
\outbox: \inbox:
Collector Service
Parameter Database
Parameter Database
Local Copy
Measurement Transfer over Network

9.11.2009 34
Order Spectra
Spectra are stored for the individual rotors in the transmission
An additonial Mix spectrum represents the order amplitudes of all parts combined
The spectra are either peak hold amplitudes or averaged amplitudes over a ramp
Limits can be self learned or manually set. The amplitude of gear mesh orders can be set individually by a database

9.11.2009 35
Order spectra of production units can be displayed in Campbell or in 3-D graphs. Cuts in the order or in the unit direction show order amplitude versus units or the spectrum of one unit. The pictures show the order spectra of 300 production units. A ghost order of 118 is present in the first 40 units tested.
Spectral Statistics

9.11.2009 36
Order Tracks
During the ramps, spectral components are evaluated over the speed.
Usually, the main gear mesh orders and their harmonics are tracked.
In addition, energy in order bands may be tracked as well.
Track limits (shown in red) can be self learned or set manually.
9.11.2009 37
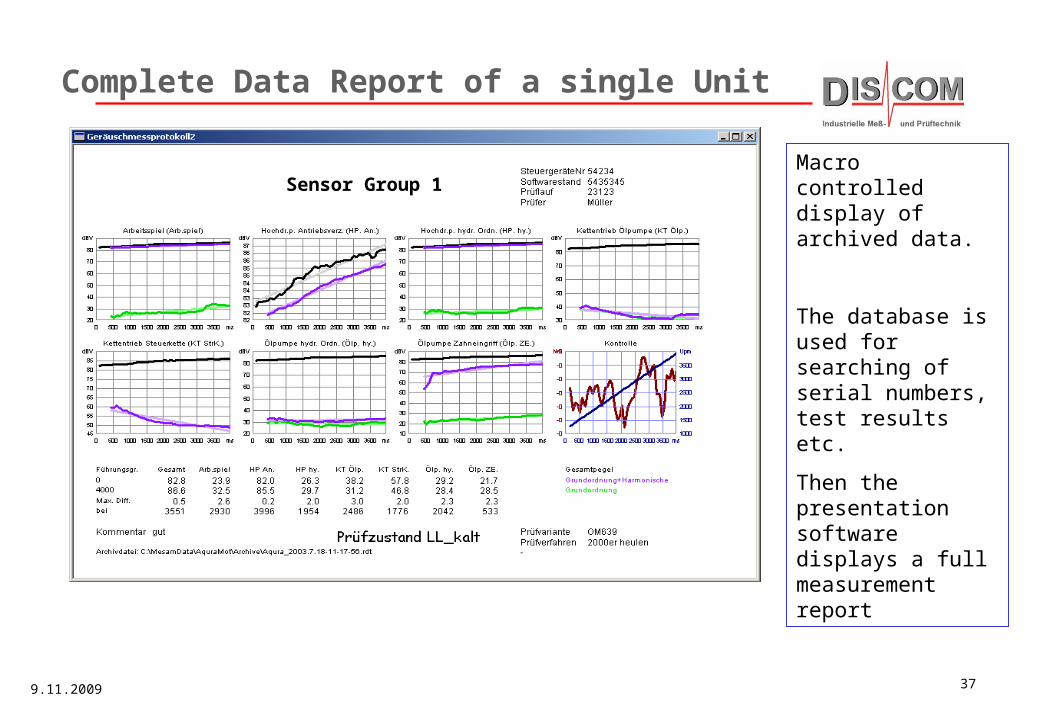
Complete Data Report of a single Unit
Macro controlled display of archived data.
The database is used for searching of serial numbers, test results etc.
Then the presentation software displays a full measurement report
Sensor Group 1

9.11.2009 38
Intranet Statistics
The information of the SQL measurement database can be retrieved via the intranet.
The production results and the measurements can be seen online.
An arbitrary time interval can be selected for the analysis.

9.11.2009 39
Statistical Evaulation for Types and Benches
Test results The evaluation can be done over gearbox types or over test benches.
Any time interval can be specified.

9.11.2009 40
Measurement Statistics and Bench Comparison
Over 300 individual measurement results can be evaluated.
The comparison of test benches makes it easy to administer large production facilities.
9.11.2009 41
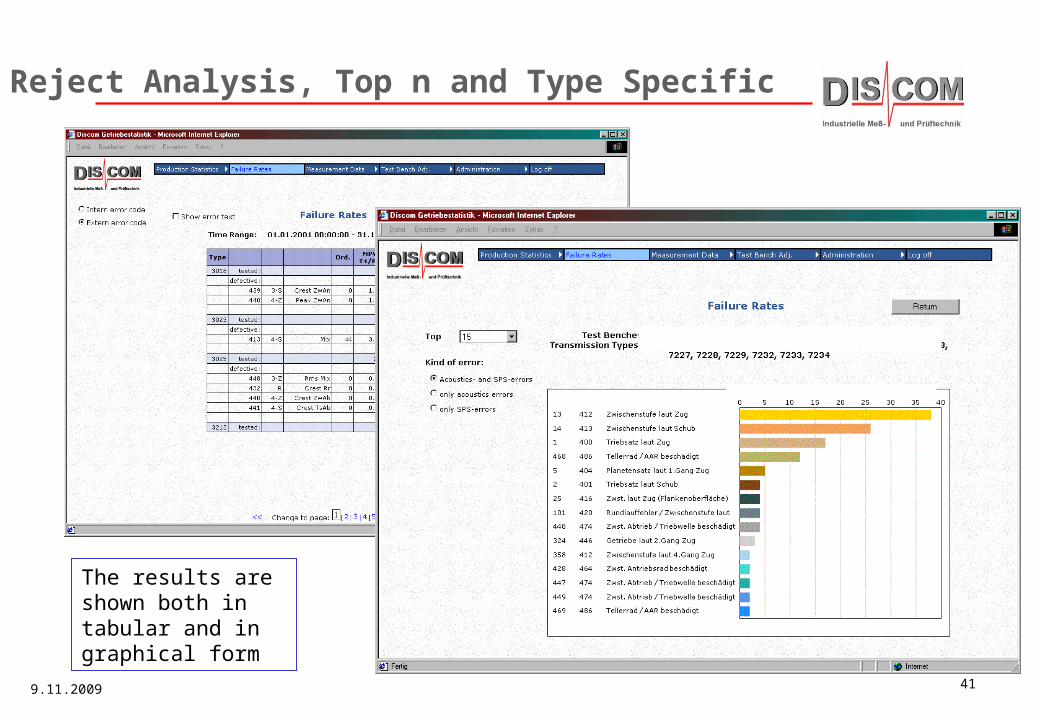
Reject Analysis, Top n and Type Specific
The results are shown both in tabular and in graphical form