90x90mm - SKYbrary1959 1962 1965 1968 1971 1974 1977 1980 1983 1986 1989 1992 1995 1998 2001 2004...
31
001 Airbus A Statistical Analysis of Commercial Aviation Accidents 1958-2016
Transcript of 90x90mm - SKYbrary1959 1962 1965 1968 1971 1974 1977 1980 1983 1986 1989 1992 1995 1998 2001 2004...

001
Airbus
A Statistical Analysis of Commercial Aviation Accidents 1958-2016
A490x90mm
Scope and definitions 02
#01 2016 & beyond 04
Accidents in 2016 06Beyond 2016 08
#02 Commercial aviation accidents since the advent of the jet age 10
Evolution of the number of flights & accidents 12Evolution of the yearly accident rate 13Evolution of the commercial air transport world fleet 14Impact of technology on aviation safety 16
#03Commercial aviation accidents over the last 20 years 18
Evolution of the yearly accident rate 20Accident rate 10 year moving average 21Accidents by flight phase 22Distribution of accidents by accident category 24 Evolution of the three main accident categories 25Controlled Flight Into Terrain 26Loss Of Control In-flight 27Runway Excursions 28 List of tables & graphs 29
Contents

02
This publication provides Airbus’ annual analysis of aviation accidents, with commentary on the year 2016, as well as a review of the history of Commercial Aviation’s safety record.
This analysis clearly demonstrates that our industry has achieved huge improvements in safety over the last decades. It also underlines the significant contribution that technology has made in ensuring that taking a flight in a commercial aircraft is an inherently low risk activity.
Since the goal of any review of aviation accidents is to help the industry further enhance safety, an analysis of forecasted aviation macro-trends is also provided. These highlight key factors influencing the industry’s consideration of detailed strategies for the further enhancement of Aviation Safety.
Scope and definitions
Scope of the Brochure
• All western-built commercial air transport jets above 40 passengers. The following aircraft are included in the statistics: 328 JET, A300, A300-600, A310, A318/319/320/321, A330, A340, A350, A380, Avro RJ series, B707, B717, B720, B727, B737, B747, B757, B767, B777, B787, BAC -111, BAE 146, Bombardier CRJ series, Caravelle, Comet, Concorde, Convair 880/990, DC-8,DC-9, DC-10, Embraer E series, Embraer ERJ series, F-28, F-70, F-100, L-1011, MD-11, MD-80/90, Mercure, Trident, VC-10, VFW 614.
Note: non-western-built jets are excluded due to lack of information and business jets are not considered due to their particular operating environment.
• Since 1958, the advent of commercial jets
• Revenue flights
• Operational accidents
• Hull loss and fatal types of accidents
Source of Data
• The accident data was extracted from official accident reports, as well as ICAO, Ascend and Airbus data bases.
• Flight operations data were extracted from the Ascend data base.

03Scope and definitions
Definitions
• Revenue flight: flight involving the transport of passengers, cargo or mail. Non revenue flight such as training, ferry, positioning, demonstration, maintenance, acceptance and test flights are excluded.
• Operational accident: an accident taking place between the time any person boards the aircraft with the intention of flight until such time as all such persons have disembarked, excluding sabotage, military actions, terrorism, suicide and the like.
• Fatal accident: an event in which at least one person is fatally or seriously injured as a result of:- being in the aircraft, or- direct contact with any part of the aircraft, including parts which have become
detached from the aircraft, or- direct exposure to jet blast, except when the injuries are from natural causes,
self-inflicted or inflicted by other persons, or when the injuries are to stowaways hiding outside the areas normally available to the passengers and crew.
• Hull loss: an event in which an aircraft is destroyed or damaged beyond economical repair.The threshold of economical repair is decreasing with the residual value of the aircraft. Therefore, as an aircraft is ageing, an event leading to a damage economically repairable years before may be considered a hull loss.
Definition of accident categories
Aviation organisations define more than 40 different accident categories. However the five listed below are the individual types which cause the most significant number of accidents.
• Runway Excursion (RE): A lateral veer off or longitudinal overrun off the runway surface, not primarily due to SCF or ARC.
• Loss of Control in Flight (LOC-I): Loss of aircraft control while in flight not primarily due to SCF.
• Controlled Flight Into Terrain (CFIT): In-flight collision with terrain, water, or obstacle without indication of loss of control.
• Abnormal Runway Contact (ARC): Hard or unusual landing, not primarily due to SCF, leading to an accident.
• System/Component Failure or Malfunction (SCF): Failure or malfunction of an aircraft system or component, related to either its design, the manufacturing process or a maintenance issue, which leads to an accident. SCF includes the powerplant, software and database systems.

#01 Accidents in 2016 and beyond 05
2016 & beyond
#01

06 Accidents in 2016
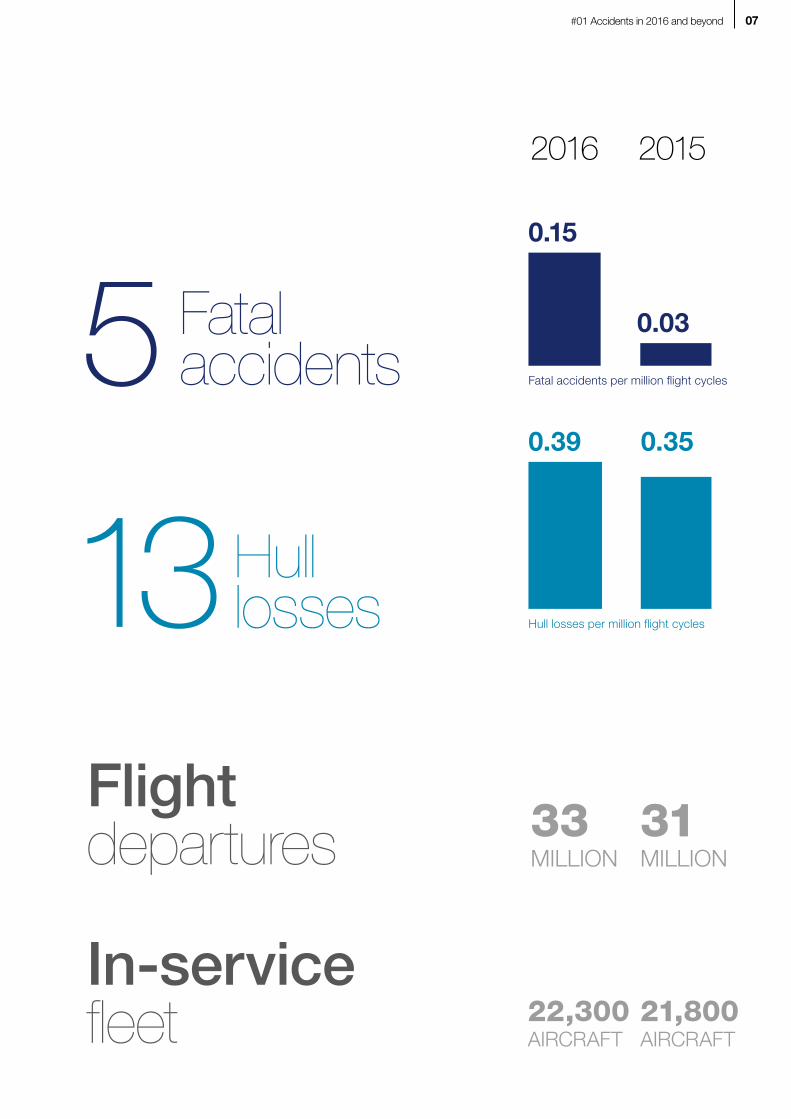
After the historically low result of one fatal accident in 2015, in 2016 we witnessed an average performance in terms of safety for the air transport industry with five fatal accidents in total.
These five fatal accidents continue to highlight the need for both vigilance and action across all types of operation, cargo as well as passenger, as well as in all kinds of operating environment.
But the overall picture remains positive, since the fatal accident rate for the most recent (4th) generation of jets remained at the same record low level as 2015 with one fatal accident.
In terms of hull losses, the industry performance remained consistent with rates achieved since 2010, with 13 aircraft hull losses resulting in a rate of 0.39 losses per million flight cycles.
#01 Accidents in 2016 and beyond 07
Fatal accidents
Flightdepartures
5
13
2016 2015
33 MILLION
31 MILLION
22,300AIRCRAFT
21,800AIRCRAFT
Hull losses
In-servicefleet
0.15
0.03
0.39 0.35
Fatal accidents per million flight cycles
Hull losses per million flight cycles

08
KEEPING AN EYE ON EMERGING THREATS
In the last 20 years, the industry-wide accident rate has been divided by around 8 for fatal accidents, and by around 3 for hull losses considering all generations of aircraft. Over the same period, traffic increased by more than 86%. This shows that investments in safety bear fruit, safety is enhanced, and accidents are largely prevented from happening.
However, when we observe the increasing levels of congestion in our airports and skies, the relative stability of the industry in current times could be considered as somewhat stressed.
Additionally, the fleet’s growth rate is tremendous, with traffic doubling every
15 years and the industry planning to be delivering over 2000 new aircraft per year by 2019. This growth must be supported by a proportional increase in the number of trained personnel including pilots, technicians, cabin crew, and air traffic controllers and beyond.
Considering these trends, we might conclude that if the accident rate stays the same, the industry’s increased exposure to accidents in numerical terms is in direct proportion to this increase in activity. To put it simply, more flights will mean more accidents unless we work to decrease the accident rate.
That is why we at Airbus believe there is no room for complacency. We believe we must be ambitious, inject even more vigour into our industry’s long tradition of improvement, and challenge ourselves to drive accident rates lower than ever before,
To achieve this, we will need to work co-operatively together, and increase our safety enhancement efforts by identifying the most promising opportunities we have for responding to the new hazards and threats which are arising.
0
2
4
6
8
10
12
14
16
18
2035203020252020201520102005200019951990198519801975
RPKs (millions)
ICAO total traf�c
x2x2
x2
Airbus GMF 2016
World annual traffic forecast
Traffic doubles every 15 years
Historical data shows air traffic doubles every 15 years
Airbus’ Global Market Forecast (GMF) is for the same doubling of global air traffic over the next next 15 years.
Such a significant growth of industry activity means there is no room for complacency in maintaining safety.
The industry will need to work co-operatively together to increase safety enhancement efforts in order to decrease the accident rate.
Beyond 2016

#01 Accidents in 2016 and beyond 09
North America
+1,940
South America
+1,630
Africa
+770
Middle East
+1,900
Europe
+3,560
CIS
+860
Asia-Paci�c
+9,030
Forecast increase in number of aircraft 2016-2035
+19,690
Increase in world fleet by 2035
Each aircraft delivered must be supported by a proportional increase in the number of trained pilots, technicians, cabin crew, air traffic controllers, etc.
Ensuring that sufficient numbers of suitably trained personnel will be available is one of the challenges facing our industry.

Commercial aviation accidents since the advent of the jet age
#02

12
35
Yearly number of �ights in millions
Yearly number of hull loss accidents
201620122008200420001996199219881984198019761972196819641960
201620122008200420001996199219881984198019761972196819641960
Hul
l lo
ss
Evolution of the number of flights and accidents
Accidents are rare occurrences, consequently their number may vary considerably from one year to the next. Therefore, focusing too closely on a single year’s figure may be misleading.
In addition, the volume of activity in aviation is constantly increasing and needs to be taken into account.
For these reasons it makes more sense to consider accident rates when making an analysis of trends.
No growth in the number of accidents despite a massive increase in exposure
Fat
al
Yearly number of fatal accidents
Yearly number of hull loss accidents
Evolution of the number of flights & accidents

13
20162013201020072004200119981995199219891986198319801977197419711968196519621959
14
Yearly fatal accident rate
Hul
l lo
ss
20162013201020072004200119981995199219891986198319801977197419711968196519621959
Yearly rate of hull losses
Evolution of the yearly accident rate
Rates of fatal accidents as well as hull-losses are steadily decreasing over time
The values of peak accident rate evidenced in the 1960s, when the number of flights was much lower than today, illustrate the difficulty of considering accident data from a period with a low volume of industry activity.
Therefore, any data from a year with under 1 million flight cycles is illustrated in this brochure with dotted lines.
Fat
al
Yearly fatal accident rate per million flights
Yearly hull loss rate per million flights
Evolution of the yearly accident rate

14
Fourth generation fleet in 2016
In 2016, over 33 million flight departures were made globally. Of these, nearly 15.8 million were made by fourth generation jets, of which Airbus models accounted for 12.3 million.
Airbus aircraft flew 78% of the flights made by fourth generation jets in 2016
Yearly number of flights by aircraft generation millions per year
0
5
10
15
20
25
30
35 In 2016
201620122008200420001996199219881984198019761972196819641960
Second generationFirst generation Third generation Fourth generation
47.5%
51.9%
The huge reduction in accident rate evidenced on the previous pages has only been achieved by a long and ongoing commitment by the commercial aviation industry to place safety at the heart of its mission. Whilst a significant part of this success is due to effective regulation and a strong safety culture and improvements in training, advances in technology have also been a critical element. Aircraft systems technology in particular has been conscientiously evolved with safety in mind.
The first generation of jets were designed in the 1950s & ‘60s with systems technologies which were
limited in their capabilities by the analogue electronics of the era. A second generation of jet aircraft with improved auto-flight systems, quickly appeared.
The third generation of jets was introduced in the early 1980s. This generation took advantage of digital technologies to introduce ‘glass cockpits’ with Navigation Displays and Flight Management Systems (FMS). Combined with improved navigation performance capabilities as well as Terrain Awareness and Warning System (TAWS), these capabilities were key to reducing Controlled Flight Into Terrain (CFIT) accidents.
The fourth and latest generation of civil aircraft was introduced in 1988 with the Airbus A320. Fourth generation aircraft use Fly-By-Wire (FBW) technology with Flight Envelope Protection functions. This additional protection helps to protect against Loss Of Control Inflight (LOC-I)accidents. FBW technology is now the industry standard and is used on all currently produced Airbus models, the Boeing B777 & B787, Embraer E-Jets, Bombardier C-Series, Sukhoi Superjet and the Mitsubishi MRJ.
Industry status at end 2016 Generation 1 Generation 2 Generation 3 Generation 4
Aircraft in-service 4 468 11,626 11,562
Total accumulated flight cycles (million) 40.6 254.2 361.1 148.0
Flight cycles in 2016 (milion) 0.0 0.2 17.1 15.8
Evolution of the commercial air transport fleet
#02 Commercial aviation accidents since the advent of the jet age 15
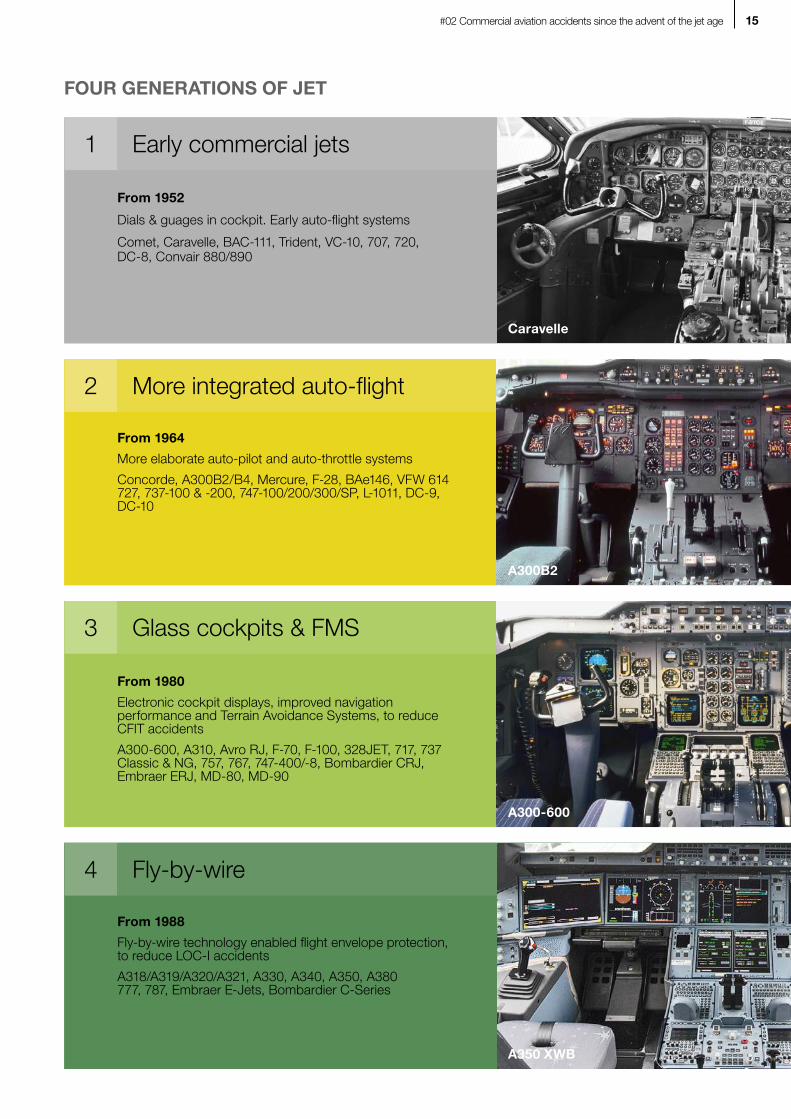
FOUR GENERATIONS OF JET
1
2
3
4
Early commercial jets
From 1952
Dials & guages in cockpit. Early auto-flight systems
Comet, Caravelle, BAC-111, Trident, VC-10, 707, 720, DC-8, Convair 880/890
From 1964
More elaborate auto-pilot and auto-throttle systems
Concorde, A300B2/B4, Mercure, F-28, BAe146, VFW 614 727, 737-100 & -200, 747-100/200/300/SP, L-1011, DC-9, DC-10
From 1980
Electronic cockpit displays, improved navigation performance and Terrain Avoidance Systems, to reduce CFIT accidents
A300-600, A310, Avro RJ, F-70, F-100, 328JET, 717, 737 Classic & NG, 757, 767, 747-400/-8, Bombardier CRJ, Embraer ERJ, MD-80, MD-90
From 1988
Fly-by-wire technology enabled flight envelope protection, to reduce LOC-I accidents
A318/A319/A320/A321, A330, A340, A350, A380 777, 787, Embraer E-Jets, Bombardier C-Series
More integrated auto-flight
Glass cockpits & FMS
Fly-by-wire
Caravelle
A300B2
A300-600
A350 XWB

16
Accidents per million flight departures
Average fatal accident rate by accident category 1958-2016
Comparison of accident rates by generation of aircraft provides a clear illustration of the value of our industry’s investments in technology for Safety.
Studying the statistics over the life of each generation of jets shows that an 85% reduction in fatal CFIT accidents has been achieved between the second and third generation of jets. In addition to this achievement, the fourth generation
of jets has added a 75% reduction in fatal LOC-I accidents compared to the third generation. These are great achievements, which we can properly put into context by studying the overall reduction in the fatal accident rate per generation.
The lowest sustained fatal accident rate of first generation jets was around 3.0 accidents per million flights, whilst for the second generation it was around 0.7, meaning
a reduction of fatal accidents of almost 80% between generations. In comparison, third generation jets now achieve about 0.2 accidents per million flights, a reduction of around a further 70%.
Finally, fourth generation jets have the lowest accident rate of all, at a stable average rate of about 0.1 fatal accidents per million flights, which is a further 50% reduction compared to the third generation.
-85% -75%from second to third generation from third to fourth generation
CFIT accidents LOC-I accidents
0
0.05
0.1
0.15
0.2
Generation 4Generation 3Generation 2Generation 1
0.61.01.41.8
Impact of technology on aviation safety

#02 Commercial aviation accidents since the advent of the jet age 17
10 year moving average hull-loss rate by aircraft generation
10 year moving average fatal accident rate by aircraft generation
0
0.5
1.0
1.5
2.0
20162012200920062003200019971994199119881985198219791976197319701967196419611958
4,06,08,0
10,012,0
Second generationFirst generation Third generation Fourth generation
7.09
1.86
0.19
0.09
0
0.5
1.0
1.5
2.0
2.5
3.0
20162012200920062003200019971994199119881985198219791976197319701967196419611958
8,0
13,0
18,0
23,0
28,0
Second generationFirst generation Third generation Fourth generation
14.17
6.36
0.60
0.24
Evolution of accident rates by aircraft generation
The graphs above and below highlight the long-term trend of reduced fatal and hull loss accident rates, achieved through investment in technology between generations.
Advances in technology have decreased accident rates for each generation
Fat
al
Accidents per million flight departures
Accidents per million flight departures
Hul
l lo
ssF
atal


Commercial aviation accidents over the last 20 years
#03

20H
ull l
oss
Evolution of the yearly accident rate
The hull loss rate has also been reduced significantly, by around 70%.
A significant proportion of these achievements can be attributed to investment in new technologies which enhance Safety.
Since 1997, the aviation industry has succeeded to reduce the fatal accident rate by around 80%
Fat
al
Yearly fatal accident rate per million flights
Yearly hull loss accident rate per million flights
0
0.1
0.2
0.3
0.4
0.5
0.6
20172015201320112009200720052003200119991997
0.15
0
0.25
0.50
0.75
1.00
1.25
1.50
20172015201320112009200720052003200119991997
0.39
Evolution of the yearly accident rate
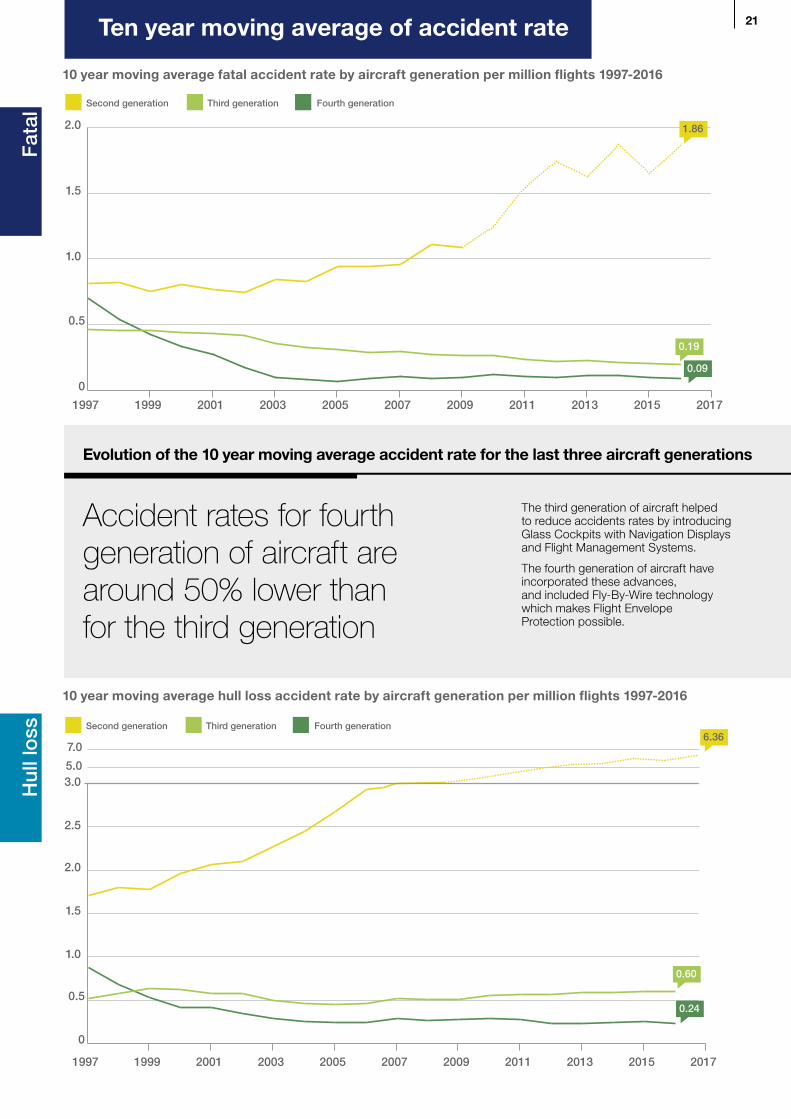
21
10 year moving average fatal accident rate by aircraft generation per million flights 1997-2016
10 year moving average hull loss accident rate by aircraft generation per million flights 1997-2016
0
0.5
1.0
1.5
2.0
20172015201320112009200720052003200119991997
Second generation Third generation Fourth generation
1.86
0.19
0.09
5.0
7.0
0
0.5
1.0
1.5
2.0
2.5
3.0
20172015201320112009200720052003200119991997
Second generation Third generation Fourth generation6.36
0.60
0.24
Hul
l lo
ssF
atal
Evolution of the 10 year moving average accident rate for the last three aircraft generations
Accident rates for fourth generation of aircraft are around 50% lower than for the third generation
The third generation of aircraft helped to reduce accidents rates by introducing Glass Cockpits with Navigation Displays and Flight Management Systems.
The fourth generation of aircraft have incorporated these advances, and included Fly-By-Wire technology which makes Flight Envelope Protection possible.
Ten year moving average of accident rate
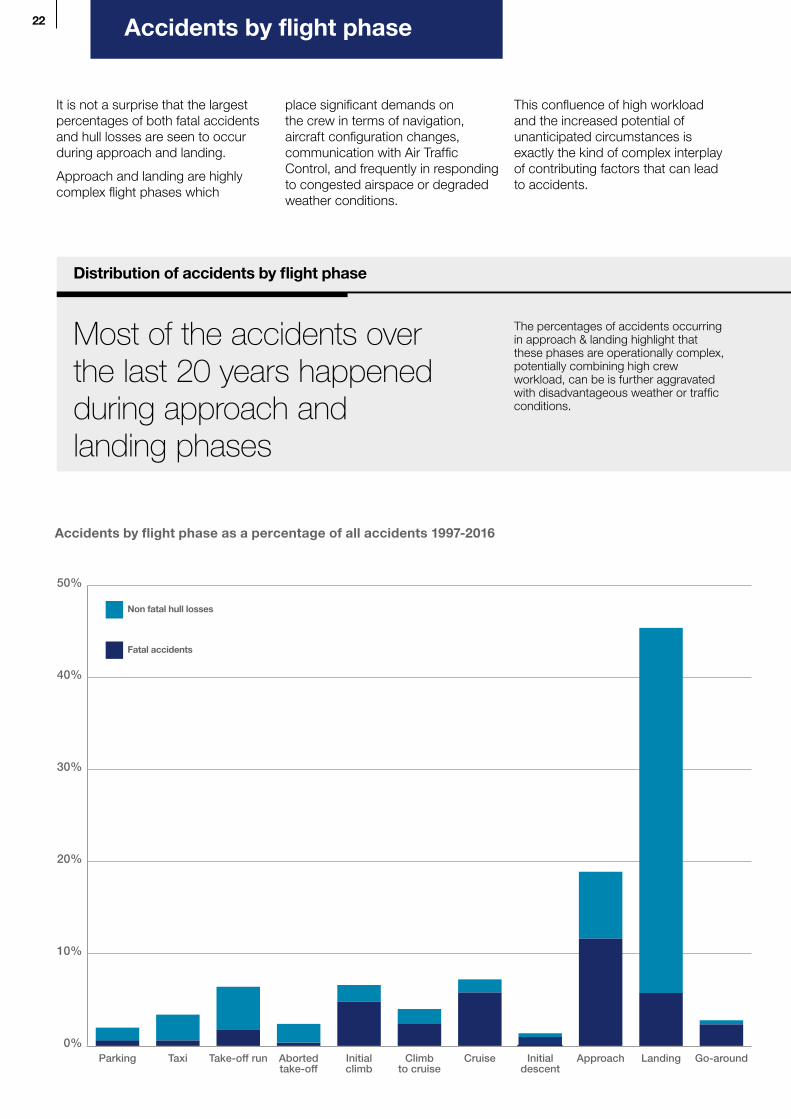
22 Accidents by flight phase
0%
10%
20%
30%
40%
50%
Go-aroundLandingApproachInitialdescent
CruiseClimbto cruise
Initialclimb
Abortedtake-off
Take-off runTaxiParking
Non fatal hull losses
Fatal accidents
Distribution of accidents by flight phase
Most of the accidents over the last 20 years happened during approach and landing phases
The percentages of accidents occurring in approach & landing highlight that these phases are operationally complex, potentially combining high crew workload, can be is further aggravated with disadvantageous weather or traffic conditions.
It is not a surprise that the largest percentages of both fatal accidents and hull losses are seen to occur during approach and landing.
Approach and landing are highly complex flight phases which
place significant demands on the crew in terms of navigation, aircraft configuration changes, communication with Air Traffic Control, and frequently in responding to congested airspace or degraded weather conditions.
This confluence of high workload and the increased potential of unanticipated circumstances is exactly the kind of complex interplay of contributing factors that can lead to accidents.
Accidents by flight phase as a percentage of all accidents 1997-2016

#03 Commercial aviation accidents over the last 20 years 23
Definitions of flight phases
• Parking: this phase ends and starts when the aircraft respectively begins or stops moving forward under its own power.
• Taxi: this phase includes both taxi-out and taxi-in. Taxi-out starts when the aircraft begins moving forward under its own power and ends when it reaches the takeoff position. Taxi-in normally starts after the landing roll-out, when the aircraft taxis to the parking area. It may, in some cases, follow a taxi-out.
• Takeoff run: this phase begins when the crew increases thrust for the purpose of lift-off. It ends when an initial climb is established or the crew aborts its takeoff.
• Aborted takeoff: this phase starts when the crew reduces thrust during the takeoff run to stop the aircraft. It ends when the aircraft is stopped or when it is taxied off the runway.
• Initial climb: this phase begins at 35 feet above the runway elevation. It normally ends with the climb to cruise. It may, in some instances, be followed by an approach.
• Climb to cruise: this phase begins when the crew establishes the aircraft at a defined speed and configuration enabling the aircraft to increase altitude for the cruise. It normally ends when the aircraft reaches cruise altitude. It may, in some cases end with the initiation of a descent.
• Cruise: this phase begins when the aircraft reaches the initial cruise altitude. It ends when the crew initiates a descent for the purpose of landing.
• Initial descent: this phase starts when the crew leaves the cruise altitude in order to land. It normally ends when the crew initiates changes in the aircraft’s configuration and/or speed in view of the landing. It may, in some cases end with a cruise or climb to cruise phase.
• Approach: this phase starts when the crew initiates changes in the aircraft’s configuration and/or speed in view of the landing. It normally ends when the aircraft is in the landing configuration and the crew is dedicated to land on a particular runway. It may, in some cases, end with the initiation of an initial climb or go-around phase.
• Go-around: this phase begins when the crew aborts the descent to the planned landing runway during the approach phase. It ends with the initiation of an initial climb or when speed and configuration are established at a defined altitude.
• Landing: this phase begins when the aircraft is in the landing configuration and the crew is dedicated to land on a particular runway. It ends when the aircraft’s speed is decreased to taxi speed.

24
Distribution of accidents by accident category
The single biggest cause of fatal accidents over the last 20 years is LOC-I
LOC-I accidents have been shown to be significantly reduced by technologies already existing on fourth generation aircraft.
CFIT accidents continue to be reduced in number thanks to the availability and continued development of glass cockpit and navigation technologies available on both third and fourth generation aircraft.
Runway Excursions (RE) including both lateral and longitudinal types, are the third major cause of fatal accidents by numbers, and the single biggest cause of hull losses. Emerging technologies (energy-based and performance-based) are very promising for addressing longitudinal events.
Percentage of fatal accidents by accident category 1997-2016
Percentage of hull losses by accident category 1997-2016
0%
5%
10%
15%
20%
25%
30%
35%
40%
OtherRECFITLOC-I
0%
5%
10%
15%
20%
25%
30%
35%
40%
OtherCFITARCLOC-ISCFRE
Hul
l lo
ssF
atal
Distribution of accidents by accident category

25
Evolution of the three main accident categories
In the last 20 years, the rate of CFIT reduced by a factor of 7, LOC-I by 2
Since 1997, the proportion of the flights flown by aircraft equipped with Terrain Awareness and Warning System (TAWS) technology to prevent CFIT accidents has grown from 65% to 99%. The wide adoption of this technology is a key element in the significant reduction of the CFIT accident rate evidenced on this page.
Regarding LOC-I, in 2016 the proportion of flights flown by generation four aircraft equipped with technology to reduce LOC-I accidents was 48%. Since the rate of LOC-I accidents is 75% lower on fourth generation aircraft than on third generation aircraft, we can expect the rate of LOC-I accidents to further decrease as the number of generation 4 aircraft in-service increases.
In terms of RE, the first deployment of technologies to address this cause of accidents was achieved towards the end of the last decade. The number of aircraft equipped with these technologies remains low, at around 5% of the in-service fleet. Therefore, whilst we may observe a decreasing trend in hull-losses due to RE, it remains too early to draw conclusions.
10 year moving average fatal accident rate by accident category per million flights
10 year moving average hull loss rate by accident category per million flights
0
0.05
0.10
0.15
0.20
0.25
20172015201320112009200720052003200119991997
0
0.05
0.10
0.15
0.20
0.25
0.30
0.35
0.40
20172015201320112009200720052003200119991997
Hul
l lo
ssF
atal
Evolution of the three main accident categories
#03 Commercial aviation accidents over the last 20 years26
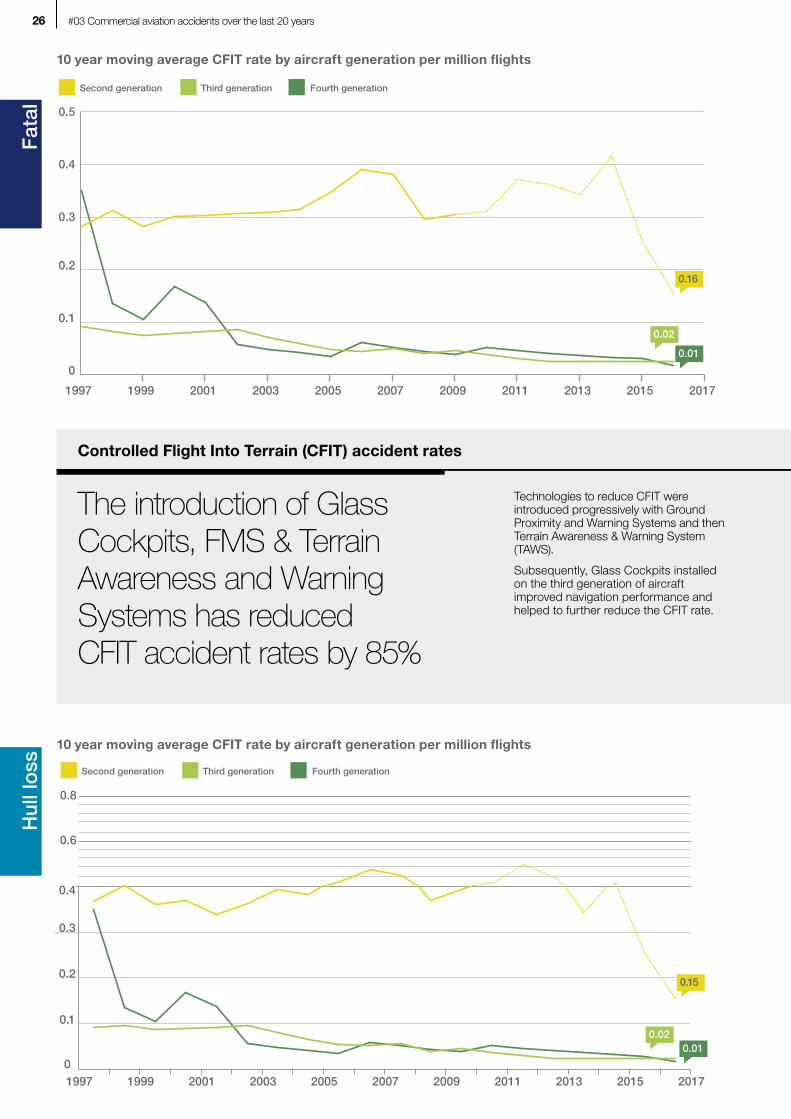
Controlled Flight Into Terrain (CFIT) accident rates
The introduction of Glass Cockpits, FMS & Terrain Awareness and Warning Systems has reduced CFIT accident rates by 85%
Technologies to reduce CFIT were introduced progressively with Ground Proximity and Warning Systems and then Terrain Awareness & Warning System (TAWS).
Subsequently, Glass Cockpits installed on the third generation of aircraft improved navigation performance and helped to further reduce the CFIT rate.
10 year moving average CFIT rate by aircraft generation per million flights
10 year moving average CFIT rate by aircraft generation per million flights
0
0.1
0.2
0.3
0.4
0.5
20172015201320112009200720052003200119991997
Second generation Third generation Fourth generation
0.16
0.02
0.01
0
0.1
0.2
0.3
0.4
20172015201320112009200720052003200119991997
0.6
0.8
Second generation Third generation Fourth generation
0.15
0.020.01
Hul
l lo
ssF
atal

#03 Commercial aviation accidents over the last 20 years 27
Loss Of Control In-flight (LOC-I) accident rates
Flight envelope protection has reduced LOC-I accident rates by 75% compared to third generation aircraft
The fourth generation of aircraft has now cumulated 29 years of experience since the introduction of the A320, back in 1988.
This represents a significant experience with more than 148 million accumulated flight cycles. This strong statistical basis illustrates the significant safety benefit of flight envelope protected aircraft to address LOC-I.
10 year moving average LOC-I rate by aircraft generation per million flights
10 year moving average LOC-I rate by aircraft generation per million flights
Second generation Third generation Fourth generation
0
0.1
0.2
0.3
0.4
20172015201320112009200720052003200119991997
0.6
0.8
0.62
0.08
0.02
Second generation Third generation Fourth generation
0
0.1
0.2
0.3
0.4
20172015201320112009200720052003200119991997
0.6
0.8
0.62
0.09
0.02
Hul
l lo
ssF
atal
#03 Commercial aviation accidents over the last 20 years28H
ull l
oss
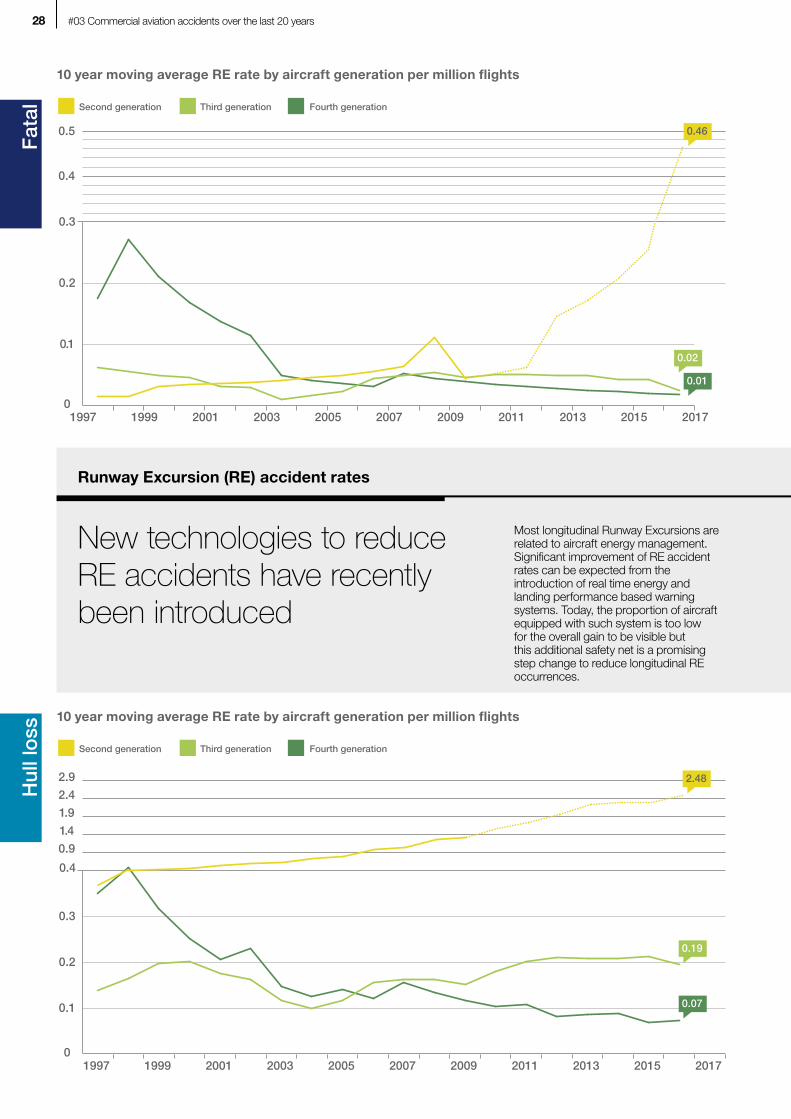
Runway Excursion (RE) accident rates
Most longitudinal Runway Excursions are related to aircraft energy management. Significant improvement of RE accident rates can be expected from the introduction of real time energy and landing performance based warning systems. Today, the proportion of aircraft equipped with such system is too low for the overall gain to be visible but this additional safety net is a promising step change to reduce longitudinal RE occurrences.
New technologies to reduce RE accidents have recently been introduced
Fat
al
10 year moving average RE rate by aircraft generation per million flights
10 year moving average RE rate by aircraft generation per million flights
Second generation Third generation Fourth generation
0
0.1
0.2
0.3
20172015201320112009200720052003200119991997
0.4
0.5 0.46
0.02
0.01
Second generation Third generation Fourth generation
0
0.1
0.2
0.3
0.4
20172015201320112009200720052003200119991997
0.9
1.4
1.9
2.4
2.9 2.48
0.19
0.07

#01 2016 & beyond 04
Fatal accident rate in 2016 7Hull loss rate in 2016 7Flight departures in 2016 7In-service fleet in 2016 7World annual traffic forecast 8World fleet forecast 9
#02 Commercial aviation accidents since the advent of the jet age 10
Yearly number of fatal accidents 1958-2016 12Yearly number of hull losses 1958-2016 12Yearly fatal accident rate 1958-2016 13Yearly hull loss rate 1958-2016 13Yearly number of flights by aircraft generation 1958-2016 14Industry aircraft and flight cycles status at end 2016 14Average fatal accident rate by accident category 1958-2016 16Fatal accident rate by generation 1958-2016 17Hull-loss rate by generation 1958-2016 17
#03 Commercial aviation accidents over the last 20 years 18
Yearly fatal accident rate 20Yearly hull-loss rate 2010 year moving average fatal accident rate by aircraft generation 2110 year moving average hull loss rate by aircraft generation 21Accidents by flight phase as a percentage of all accidents 22Percentage of fatal accidents by accident category 24Percentage of hull losses by accident category 2410 year moving average fatal accident rate by accident category 2510 year moving average hull-loss rate by accident category 2510 year moving average fatal CFIT rate by aircraft generation 2610 year moving average hull-loss CFIT rate by aircraft generation 2610 year moving average fatal LOC-I rate by aircraft generation 2710 year moving average hull-loss LOC-I rate by aircraft generation 2710 year moving average fatal RE rate by aircraft generation 2810 year moving average hull-loss RE rate by aircraft generation 28
List of tables and graphs
004
AIRBUS S.A.S. 31707 Blagnac Cedex, France © AIRBUS S.A.S. 2017 - All rights reserved, Airbus, its logo and the product names are registered trademarks.
Concept design by Airbus Multi Media Support 20170691. Photos by Airbus, S. Ramadier, K. Yolshin, J. Chalabala, Servickuz, A. Tchaikovski, F. Lancelot.
Reference: X00D17008863 Issue 1. June, 2017. Printed in France by Art & Caractère.
Confidential and proprietary document. This document and all information contained herein is the sole property of AIRBUS S.A.S. No intellectual property rights are granted by the delivery of this document or the disclosure of its content. This document shall not be reproduced or disclosed to a third party without the express written consent of AIRBUS S.A.S. This document and its content shall not be used for any purpose other than that for which it is supplied. The statements made herein do not constitute an offer. They are based on the mentioned assumptions and are expressed in good faith. Where the supporting grounds for these statements are not shown, AIRBUS S.A.S. will be pleased to explain the basis thereof.
This brochure is printed on Stucco. This paper is produced in factories that are accredited EMAS and certified ISO 9001-14001, PEFC and FSC CoC. It is produced using pulp that has been whitened without either chlorine or acid. The paper is entirely recyclable and is produced from trees grown in sustainable forest resources.
The printing inks use organic pigments or minerals. There is no use of basic dyes or dangerous metals from the cadmium, lead, mercury or hexavalent chromium group.
The printer, Art & Caractère (France 81500), is engaged in a waste management and recycling programme for all resulting by-products.