9,000,000 ANNUAL TOURISTS 18 312 - DowntownNY · HOTELS 309,500 WEEKDAY WORKERS 24 EXPRESS BUS...
36
YEARS LATER 9,000,000 ANNUAL TOURISTS 9 MUSEUMS 447 RESTAURANTS 86,372,000 SQUARE FEET OF OFFICE SPACE 39,380 PEOPLE ON WALL STREET EACH DAY 312 RESIDENTIAL BUILDINGS 8,428 COMPANIES 56,000 FRIENDLY RESIDENTS 12 SUBWAY LINES 18 HOTELS 309,500 WEEKDAY WORKERS 24 EXPRESS BUS ROUTES 626 PLACES TO SHOP 460 PUBLIC WASTEBASKETS 13 FREE ALLIANCE WI-FI SPOTS 37 CONNECTION BUS STOPS
Transcript of 9,000,000 ANNUAL TOURISTS 18 312 - DowntownNY · HOTELS 309,500 WEEKDAY WORKERS 24 EXPRESS BUS...

YEAR
S LA
TER
9,000,000 ANNUAL TOURISTS
9M
USEUMS
447RESTAURANTS
86,372,000SQUARE FEET OF OFFICE SPACE
39,380
PEOPLE ON WALL STREET EACH DAY
312 RESI
DENT
IAL
BUIL
DING
S
8,42
8CO
MPA
NIES
56,0
00FR
IEND
LY R
ESID
ENTS
12SUBWAY LINES
18HOTELS
309,500WEEKDAY WORKERS
24EXPRESS BUS ROUTES
626PL
ACES
TO S
HOP
460PUBLIC WASTEBASKETS
13FREE ALLIANCE WI-FI SPOTS
37 CONN
ECTI
ONBU
S ST
OPS

THE STATE OF LOWER MANHATTANWe are pleased to share the State of Lower Manhattan 2011 with you.
This comprehensive report provides information on leasing, development,
market trends and an analysis of economic and demographic activity
in Lower Manhattan since September 11, 2001. The area has undergone
major changes in the past decade—and its transformation continues.
Despite significant challenges, Lower Manhattan is better than ever.

Contents
4Lower Manhattan is Back
6Employment
10Commercial Office Market
15Residential
18Tourist Visits and Hotel Market
24Retail Market
26Rebuilding and Major Capital
Improvement Projects: A Chronology
30Where Everyone Wants to Be
32Lower Manhattan’s Information
Clearing House

A neighborhood that had been enjoy-ing a renaissance—with an influx of diverse new businesses and a growing residential population—was abruptly, unthinkably, brought to its knees.
Just 10 years later, Lower Manhattan is thriving as never before.
People from all walks of life and all corners of the earth joined fire fighters and police officers from New York City and the region to clear the site in heroic fashion. Business people, public officials and community leaders mapped out the details of recovery and reconstruction. The Governor and Mayor created the Lower Manhattan Development Corporation to plan and
coordinate the operation. Public and private entities invested a total of $30 billion in the neighborhood’s resurgence.
It was a momentous undertaking—filled with challenges, frustrations and complications —but by 2005, America’s fourth largest business district was back on its feet.
From the Chairman and President
LOWER MANHATTAN IS BACK — AND BETTER THAN EVER.
On September 11, 2001, a terrorist attack on the World Trade Center took 2,752 lives. Fourteen million square feet of commercial office space in Lower Manhattan were damaged or destroyed. Sixty-five thousand jobs were lost or relocated. More than 20,000 residents were at least temporarily displaced. Public transportation was profoundly disrupted, and hundreds of shops and restaurants closed, some temporarily, others permanently.
4

Today, the proof of success is as clear as the rising steel of 1 World Trade Center and 4 World Trade Center, which have already changed the Manhattan skyline. When these architectural icons open within the next three years, they will become part of a business district that has more brand-new, high-tech, green commercial office space than any other business district in the country.
Completion of the National September 11 Memorial this year, the Museum next year and the Performing Arts Center a few years later will bring millions of new guests to a global business and tourism destination that already hosts nine million visitors annually. Visitors can now stay in one of 18 Lower Manhattan hotels—triple the number that existed on September 10, 2001.
Lower Manhattan is currently one of the fastest-growing residential neighborhoods in the city, with a population that has more than dou-bled—to 56,000—over the last decade.
Residents like the quality of life— the ability to walk to work, the large, architecturally distinctive apartments with fantastic views, the great mass-transit network, the district’s eight museums, and schools that are among the city’s best. Six new primary and secondary schools have opened here in the last two years alone. Families constitute a majority of Lower Manhattan’s residents.
A decade later, there are 309,500 workers. Wall Street is the world’s best-known business address, and financial services remain Lower Manhattan’s signature industry. But since 2005, the district has added 307 new companies in an economy that has dramatically diversified. Eighteen percent of these new firms have been in creative services— including industry leaders like Condé Nast, BMI, the New York Daily News and American Lawyer Media. Sixteen percent are distinguished nonprofits, like the William J. Clinton Foundation, the New York Academy of Sciences and the College Art Association.
There is still much to do, but we know Lower Manhattan will continue to grow and flourish. With a 400-year track record of history and innovation, Lower Manhattan has survived wars, fires and economic uncertainty—and each time come back stronger.
Ten years after 9/11, Lower Manhattan has prevailed once again.
Robert R. DouglassChairman
Elizabeth H. BergerPresident
5

EMPLOYMENTBusiness Grows and Diversifies
Over the past 10 years, Lower Manhattan has seen a net increase in the number of companies as well as a diversification of businesses. While the area saw a decrease of 754 companies in the first two years after 9/11, its entrepreneurial power returned in 2004 with the arrival of 200 companies. The count has increased each subsequent year—even during the recent economic downturn. Today, the district has 8,428 companies, 130 more than were here on September 11, 2001.
Finance is still Lower Manhattan’s signature industry. Major institutions headquartered south of Chambers Street include American Express, Goldman Sachs, Bank of New York Mellon and Deutsche Bank. Finance—along with government—is dominant on the list of Lower Manhattan’s largest employ-ers and in the distribution of employment within the district.
But the local economy has grown more diverse. From 2002 to 2010, the proportion of people employed in the FIRE sector (Finance, Insurance and Real Estate) dropped 19%, while Professional Services increased 21%, Hotel and Retail increased 10%, and Education and Social Services increased 37%.
7,000
7,200
7,400
7,600
7,800
8,000
8,200
8,400
8,600
2001 2002 2003 2004 2005 2006 2007 2008 2009 2010
Source: New York State Department of Labor
TOTAL NUMBER OF FIRMS IN LOWER MANHATTAN
6
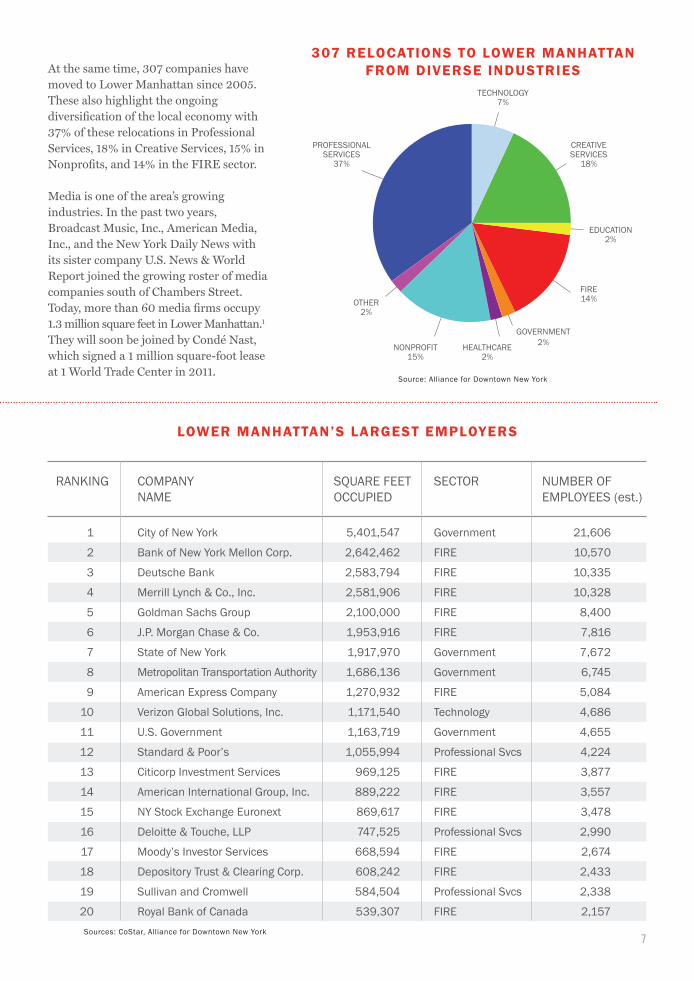
At the same time, 307 companies have moved to Lower Manhattan since 2005. These also highlight the ongoing diversification of the local economy with 37% of these relocations in Professional Services, 18% in Creative Services, 15% in Nonprofits, and 14% in the FIRE sector.
Media is one of the area’s growing industries. In the past two years, Broadcast Music, Inc., American Media, Inc., and the New York Daily News with its sister company U.S. News & World Report joined the growing roster of media companies south of Chambers Street. Today, more than 60 media firms occupy 1.3 million square feet in Lower Manhattan.1 They will soon be joined by Condé Nast, which signed a 1 million square-foot lease at 1 World Trade Center in 2011.
307 RELOCATIONS TO LOWER MANHATTANFROM DIVERSE INDUSTRIES
TECHNOLOGY7%
CREATIVESERVICES
18%
EDUCATION2%
FIRE14%
GOVERNMENT2%HEALTHCARE
2%NONPROFIT
15%
PROFESSIONALSERVICES
37%
OTHER2%
Source: Alliance for Downtown New York
Sources: CoStar, Alliance for Downtown New York
LOWER MANHATTAN’S LARGEST EMPLOYERS
1
2
3
4
5
6
7
8
9
10
11
12
13
14
15
16
17
18
19
20
City of New York
Bank of New York Mellon Corp.
Deutsche Bank
Merrill Lynch & Co., Inc.
Goldman Sachs Group
J.P. Morgan Chase & Co.
State of New York
Metropolitan Transportation Authority
American Express Company
Verizon Global Solutions, Inc.
U.S. Government
Standard & Poor’s
Citicorp Investment Services
American International Group, Inc.
NY Stock Exchange Euronext
Deloitte & Touche, LLP
Moody’s Investor Services
Depository Trust & Clearing Corp.
Sullivan and Cromwell
Royal Bank of Canada
5,401,547
2,642,462
2,583,794
2,581,906
2,100,000
1,953,916
1,917,970
1,686,136
1,270,932
1,171,540
1,163,719
1,055,994
969,125
889,222
869,617
747,525
668,594
608,242
584,504
539,307
Government
FIRE
FIRE
FIRE
FIRE
FIRE
Government
Government
FIRE
Technology
Government
Professional Svcs
FIRE
FIRE
FIRE
Professional Svcs
FIRE
FIRE
Professional Svcs
FIRE
COMPANYNAME
RANKING SQUARE FEET OCCUPIED
SECTOR NUMBER OFEMPLOYEES (est.)
21,606
10,570
10,335
10,328
8,400
7,816
7,672
6,745
5,084
4,686
4,655
4,224
3,877
3,557
3,478
2,990
2,674
2,433
2,338
2,157
7

A Resilient Workforce Is on the Upswing
The local economy proved its resilience twice in the last decade. In 2001, Lower Manhattan had approximately 325,352 employees.2 Yet the loss of office space on 9/11 and subsequent economic constraints caused employment to drop 5% from 2001 to 2005. After that period of decline, economic conditions improved, businesses began moving into Lower Manhattan again and employment increased 3%. But the nation’s Great Recession took another toll on employment, causing a 5% drop from 2007 to 2009.
Despite the loss of 13.4 million square feet of office space, the one square mile south of Chambers Street currently has a total of 309,500 employees—four percent fewer than it did on September 11, 2001. But it is on the upswing again. Employment jumped a remarkable 3% from 2009 to 2010. Much of that gain happened in the fall of 2010, when Lower Manhattan saw an increase of 4,000 employees. This growth is expected to continue as the city’s economy improves and 8.8 million square feet of office space is completed at the World Trade Center site.
3.2 Million
3.3 Million
3.4 Million
3.5 Million
3.6 Million
3.7 Million
3.8 Million
280,000
290,000
300,000
310,000
320,000
330,000
2001 2002 2003 2004 2005 2006 2007 2008 2009 2010
LOWER MANHATTANNEW YORK CITY
CITY
WID
E EM
PLOY
MEN
T LOW
ER MAN
HATTAN
EMPLOYM
ENT
Source: New York State Department of Labor
TOTAL EMPLOYMENT
0%
5%
10%
15%
20%
25%
30%
35%
200220052010
GOVERNMENTFIRE
PROFESSIONAL
SERVICES
HOTEL, RETAIL, A
ND
RESTAURANTS OTHER
DISTRIBUTION OF EMPLOYMENT BY INDUSTRY
Sources: New York State Department of Labor, Alliance for Downtown New York
8

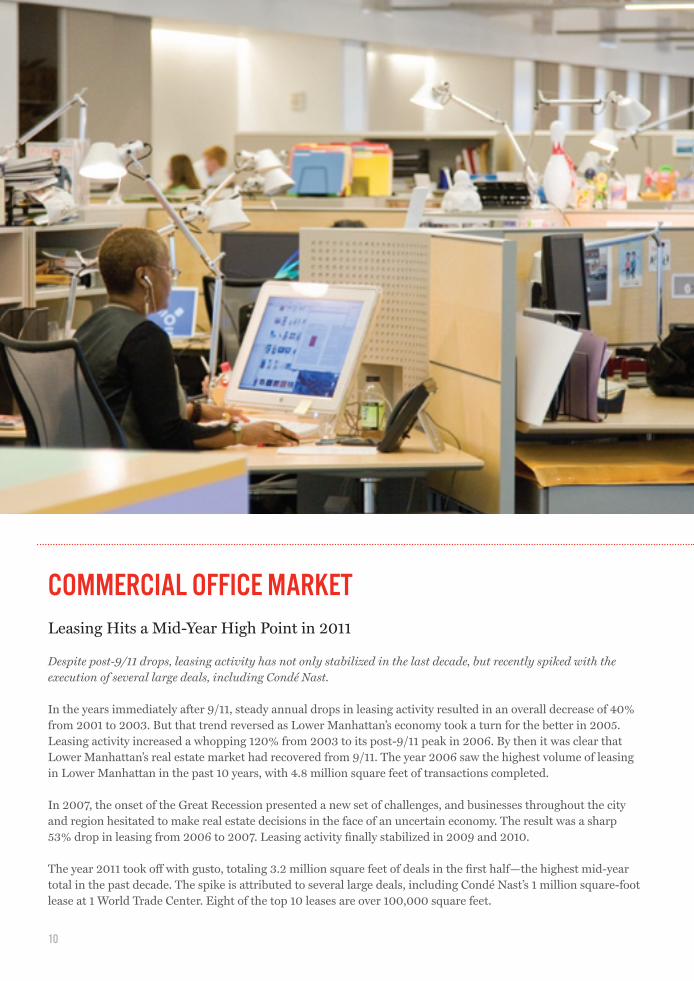
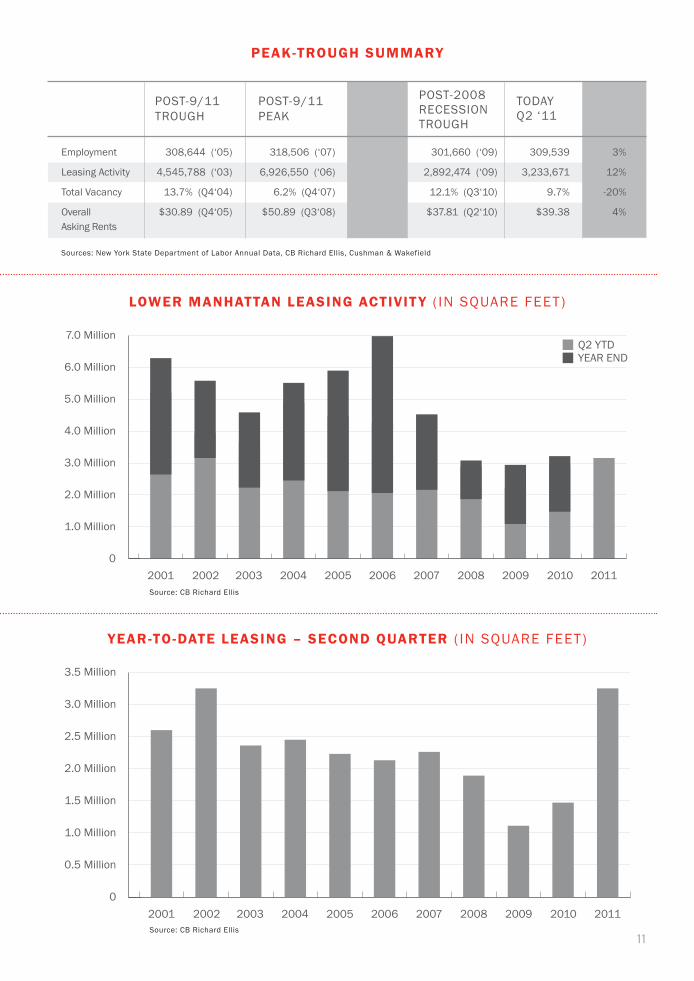
COMMERCIAL OFFICE MARKETLeasing Hits a Mid-Year High Point in 2011
Despite post-9/11 drops, leasing activity has not only stabilized in the last decade, but recently spiked with the execution of several large deals, including Condé Nast.
In the years immediately after 9/11, steady annual drops in leasing activity resulted in an overall decrease of 40% from 2001 to 2003. But that trend reversed as Lower Manhattan’s economy took a turn for the better in 2005. Leasing activity increased a whopping 120% from 2003 to its post-9/11 peak in 2006. By then it was clear that Lower Manhattan’s real estate market had recovered from 9/11. The year 2006 saw the highest volume of leasing in Lower Manhattan in the past 10 years, with 4.8 million square feet of transactions completed.
In 2007, the onset of the Great Recession presented a new set of challenges, and businesses throughout the city and region hesitated to make real estate decisions in the face of an uncertain economy. The result was a sharp 53% drop in leasing from 2006 to 2007. Leasing activity finally stabilized in 2009 and 2010.
The year 2011 took off with gusto, totaling 3.2 million square feet of deals in the first half—the highest mid-year total in the past decade. The spike is attributed to several large deals, including Condé Nast’s 1 million square-foot lease at 1 World Trade Center. Eight of the top 10 leases are over 100,000 square feet.
10
0
0.5 Million
1.0 Million
1.5 Million
2.0 Million
2.5 Million
3.0 Million
3.5 Million
2001 2002 2003 2004 2005 2006 2007 2008 2009 2010 2011Source: CB Richard Ellis
YEAR-TO-DATE LEASING – SECOND QUARTER ( IN SQUARE FEET)
0
1.0 Million
2.0 Million
3.0 Million
4.0 Million
5.0 Million
6.0 Million
7.0 Million
2001 2002 2003 2004 2005 2006 2007 2008 2009 2010 2011
Q2 YTDYEAR END
LOWER MANHATTAN LEASING ACTIVIT Y ( IN SQUARE FEET)
Source: CB Richard Ellis
PEAK-TROUGH SUMMARY
Employment
Leasing Activity
Total Vacancy
Overall Asking Rents
318,506 (‘07)
6,926,550 (‘06)
6.2% (Q4‘07)
$50.89 (Q3‘08)
POST-9/11TROUGH
POST-9/11PEAK
%CHANGE
308,644 (‘05)
4,545,788 (‘03)
13.7% (Q4‘04)
$30.89 (Q4‘05)
301,660 (‘09)
2,892,474 (‘09)
12.1% (Q3‘10)
$37.81 (Q2‘10)
POST-2008RECESSIONTROUGH
309,539
3,233,671
9.7%
$39.38
%CHANGE
3%
52%
-55%
65%
Sources: New York State Department of Labor Annual Data, CB Richard Ellis, Cushman & Wakefield
3%
12%
-20%
4%
TODAYQ2 ‘11
11

0.0%
5.0%
10.0%
15.0%
2001 2002 2003 2004 2005 2006 2007 2008 2009 2010 2011
Q1 Q3 Q1 Q3 Q1 Q3 Q1 Q3 Q1 Q3 Q1 Q3 Q1 Q3 Q1 Q3 Q1 Q3 Q1 Q3 Q1
LOWER MANHATTAN MIDTOWNSource: Cushman & Wakefield
TOTAL VACANCY
TOP TEN LEASES IN THE FIRST HALF OF 2011
Condé Nast
City of New York
OppenheimerFunds
WilmerHale
Financial ServicesRegulatory Authority
Commerzbank
Royal Bank ofCanada
Ambac FinancialGroup, Inc.
American Media, Inc.
NYC Department of Youth and Community Development
1 World TradeCenter
4 World TradeCenter
2 World FinancialCenter
7 World TradeCenter
1 World FinancialCenter
2 World FinancialCenter
3 World FinancialCenter
1 State Street Plaza
4 New York Plaza
156 William Street
1,000,000
582,000
235,000
210,841
204,067
175,000
112,597
103,484
99,054
95,927
Relocation
Direct
Expansion
Relocation
Expansion
Renewal, conversionto direct lease
Renewal andExpansion
Renewal
Relocation
Renewal
Creative Services,Media
Government
FIRE
ProfessionalServices
FIRE
FIRE
FIRE
FIRE
Creative Services,Media
Government
TENANTNAME
BUILDINGADDRESS
SQUARE FEET LEASED
TRANSACTION TYPE
INDUSTRY
Sources: CoStar, Alliance for Downtown New York
12
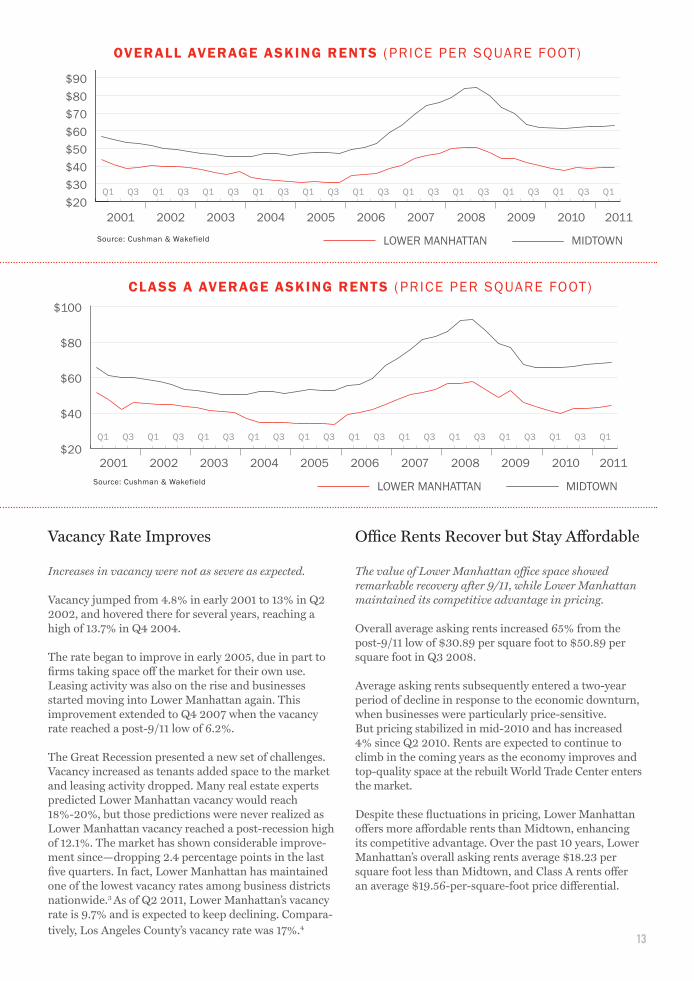
Vacancy Rate Improves
Increases in vacancy were not as severe as expected.
Vacancy jumped from 4.8% in early 2001 to 13% in Q2 2002, and hovered there for several years, reaching a high of 13.7% in Q4 2004.
The rate began to improve in early 2005, due in part to firms taking space off the market for their own use. Leasing activity was also on the rise and businesses started moving into Lower Manhattan again. This improvement extended to Q4 2007 when the vacancy rate reached a post-9/11 low of 6.2%.
The Great Recession presented a new set of challenges. Vacancy increased as tenants added space to the market and leasing activity dropped. Many real estate experts predicted Lower Manhattan vacancy would reach 18%-20%, but those predictions were never realized as Lower Manhattan vacancy reached a post-recession high of 12.1%. The market has shown considerable improve-ment since—dropping 2.4 percentage points in the last five quarters. In fact, Lower Manhattan has maintained one of the lowest vacancy rates among business districts nationwide.3 As of Q2 2011, Lower Manhattan’s vacancy rate is 9.7% and is expected to keep declining. Compara-tively, Los Angeles County’s vacancy rate was 17%.4
Office Rents Recover but Stay Affordable
The value of Lower Manhattan office space showed remarkable recovery after 9/11, while Lower Manhattan maintained its competitive advantage in pricing.
Overall average asking rents increased 65% from the post-9/11 low of $30.89 per square foot to $50.89 per square foot in Q3 2008.
Average asking rents subsequently entered a two-year period of decline in response to the economic downturn, when businesses were particularly price-sensitive. But pricing stabilized in mid-2010 and has increased 4% since Q2 2010. Rents are expected to continue to climb in the coming years as the economy improves and top-quality space at the rebuilt World Trade Center enters the market.
Despite these fluctuations in pricing, Lower Manhattan offers more affordable rents than Midtown, enhancing its competitive advantage. Over the past 10 years, Lower Manhattan’s overall asking rents average $18.23 per square foot less than Midtown, and Class A rents offer an average $19.56-per-square-foot price differential.
$20
$40
$60
$80
$100
2001 2002 2003 2004 2005 2006 2007 2008 2009 2010 2011
LOWER MANHATTAN MIDTOWN
Q1 Q3 Q1 Q3 Q1 Q3 Q1 Q3 Q1 Q3 Q1 Q3 Q1 Q3 Q1 Q3 Q1 Q3 Q1 Q3 Q1
Source: Cushman & Wakefield
CLASS A AVERAGE ASKING RENTS (PRICE PER SQUARE FOOT)
$20$30$40$50$60$70$80$90
$100
2001 2002 2003 2004 2005 2006 2007 2008 2009 2010 2011
LOWER MANHATTAN MIDTOWN
Q1 Q3 Q1 Q3 Q1 Q3 Q1 Q3 Q1 Q3 Q1 Q3 Q1 Q3 Q1 Q3 Q1 Q3 Q1 Q3 Q1
Source: Cushman & Wakefield
OVERALL AVERAGE ASKING RENTS (PRICE PER SQUARE FOOT)
13


RESIDENTIALA Fast-Growing Neighborhood Flourishes
Lower Manhattan—the nation’s fourth-largest business district—is one of New York City’s fastest-growing residential neighborhoods. Its population has more than doubled since 2001, and today an estimated 56,000 people live south of Chambers Street. With more development under way, Lower Manhattan’s population is expected to reach 60,000 by 2013.
According to a recent Downtown Alliance survey,5 the steady surge of newcomers has moved to Lower Manhattan for the quality of life, excellent housing stock, access to subways and other mass transit, walkability (30% of residents walk to work), superior schools and safety. Other top reasons are new parks, an inviting and programmed waterfront, the neighborhood’s character and the size and the value of apartments.
Residents are putting down roots in Lower Manhattan. Almost two-thirds have lived in the community for five or more years, and the overwhelming majority plan to continue living here for at least the next three years. Two-thirds of renters in the survey expressed an interest in purchasing an apartment, an indicator of residents' satisfaction with Lower Manhattan.
As a whole, Lower Manhattan residents are mature and family-oriented, though many residential buildings appeal to niche markets such as young singles. The neighborhood is home to more couples and households with children than singles and roommates, and the average household size is 2.2 people. Notably, the percentage of households with children—already 25%—will continue to rise because 40% of childless households say they plan to have children within the next three years.
Lower Manhattan’s population is affluent and well-educated. The median household income—$143,000—is almost three times the citywide median ($51,000) and more than double the Manhattan median ($69,000).6 Eighty-five percent of Lower Manhattan adult residents have a college degree and 42% have done post-graduate work. By comparison, 39% of residents citywide and 57% of Manhattan residents hold college degrees.
0
10,000
20,000
30,000
40,000
50,000
60,000
70,000
POPULATION UNITS
2001 2002 2003 2004 2005 2006 2007 2008 2009 2010 2011-2013
Source: Alliance for Downtown New York
RESIDENTIAL DEVELOPMENT & POPULATION GROW TH
15
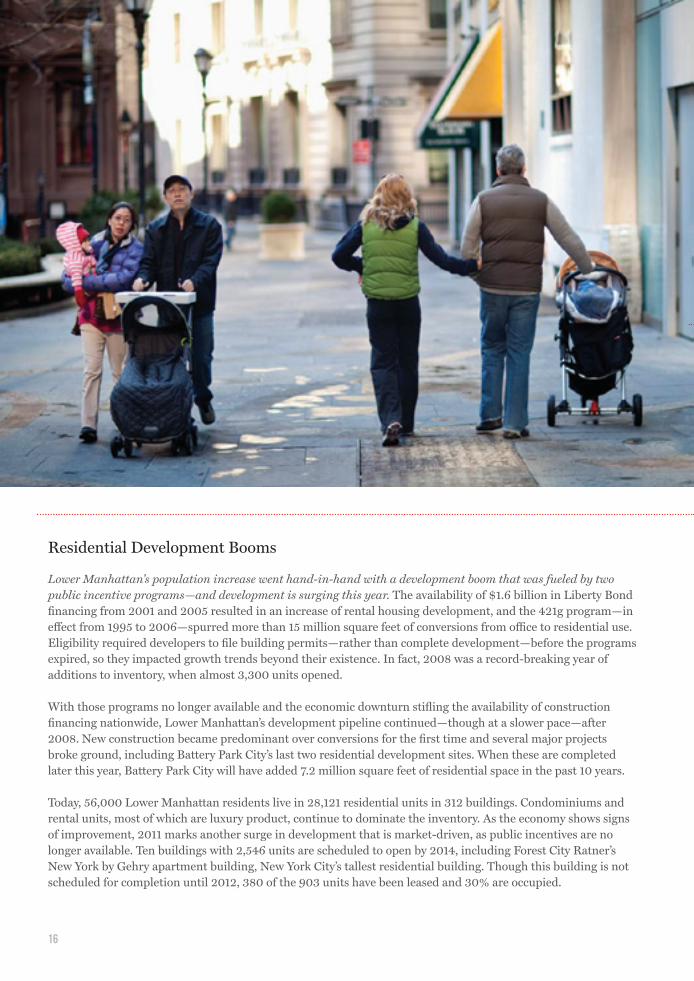
Residential Development Booms
Lower Manhattan’s population increase went hand-in-hand with a development boom that was fueled by two public incentive programs—and development is surging this year. The availability of $1.6 billion in Liberty Bond financing from 2001 and 2005 resulted in an increase of rental housing development, and the 421g program—in effect from 1995 to 2006—spurred more than 15 million square feet of conversions from office to residential use. Eligibility required developers to file building permits—rather than complete development—before the programs expired, so they impacted growth trends beyond their existence. In fact, 2008 was a record-breaking year of additions to inventory, when almost 3,300 units opened.
With those programs no longer available and the economic downturn stifling the availability of construction financing nationwide, Lower Manhattan’s development pipeline continued—though at a slower pace—after 2008. New construction became predominant over conversions for the first time and several major projects broke ground, including Battery Park City’s last two residential development sites. When these are completed later this year, Battery Park City will have added 7.2 million square feet of residential space in the past 10 years.
Today, 56,000 Lower Manhattan residents live in 28,121 residential units in 312 buildings. Condominiums and rental units, most of which are luxury product, continue to dominate the inventory. As the economy shows signs of improvement, 2011 marks another surge in development that is market-driven, as public incentives are no longer available. Ten buildings with 2,546 units are scheduled to open by 2014, including Forest City Ratner’s New York by Gehry apartment building, New York City’s tallest residential building. Though this building is not scheduled for completion until 2012, 380 of the 903 units have been leased and 30% are occupied.
16

Residential Sales and Rental Markets Thrive
Lower Manhattan’s rental market has been hot for 10 years, with apartments leasing as quickly as they are built. The vacancy rate is currently at a low of 0.7% and has stayed below 2.5% for the past 10 years.
With high demand, very new inventory and predominantly luxury product, Lower Manhattan commands higher rents and sees increases at a faster rate than the Manhattan average. Apartments increased from an average $2,954 per month in 2007 to $3,934 per month in mid-2011, a 33% increase. By comparison, the current Manhattan average is $3,353 per month.7
Lower Manhattan also has become one of Manhattan’s most popular places to buy an apartment. The volume of sales has increased by 151% since 2003,8 and apartment sales in Lower Manhattan accounted for 7.5% of all Manhattan sales between year-end 2001 and June 2011, although just 3.3% of the borough’s 847,090 housing units are here.9 The average price per square foot in Lower Manhattan has gone up 174% since 2001, while Manhattan experienced a 122% increase in average price per square foot during the same period. Today, the average price of an apartment south of Chambers Street is $975 per square foot.
$2,000$2,200$2,400$2,600$2,800$3,000$3,200$3,400$3,600$3,800$4,000
2002 2003 2004 2005 2006 2007 2008 2009 2010 2011
LOWER MANHATTAN MANHATTAN-WIDE
AVERAGE PRICE PER MONTH
Sources: Citi Habitats,Data not available 2000-2001
$0
$500
$1,000
$1,500
$2,000
2002
Apr 0
3
Aug
03
Dec
03
Apr 0
4
Aug
04
Dec
04
Apr 0
5Au
g 05
Dec
05
Apr 0
6
Aug
06
Dec
06
Apr 0
7
Aug
07
Dec
07
Apr 0
8
Aug
08
Dec
08
Apr 0
9
Aug
09
Dec
09
Apr 1
0
Aug
10
Dec
10
Apr 1
1
LOWER MANHATTAN MANHATTAN-WIDE
RESIDENTIAL SALES - AVERAGE PRICE PER SQUARE FOOT
Sources: New York City Department of Finance, Alliance for Downtown New York
17
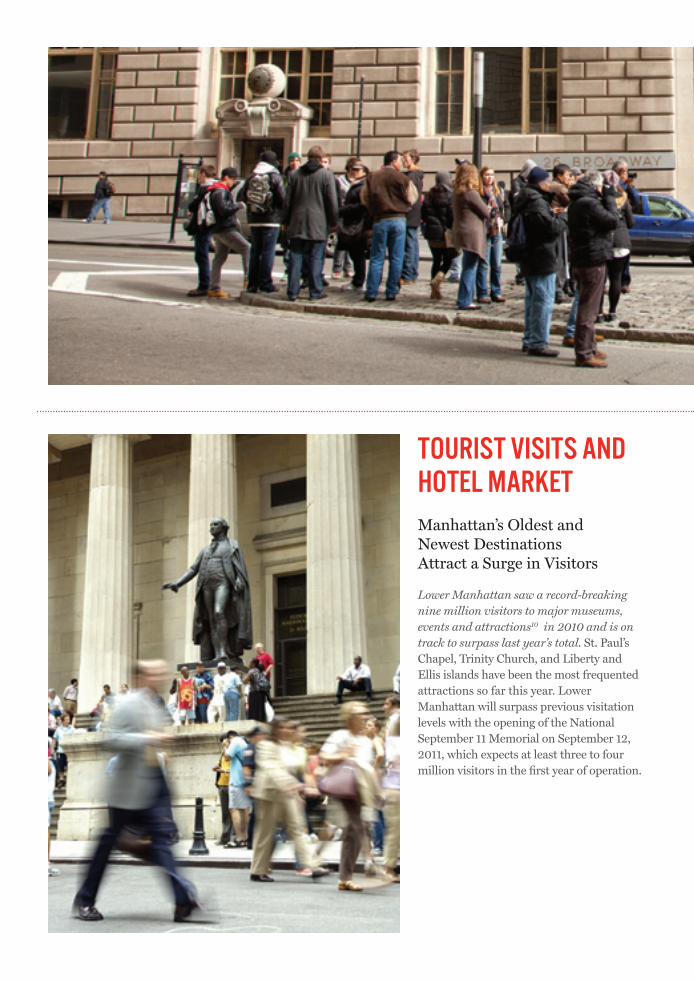
TOURIST VISITS AND HOTEL MARKETManhattan’s Oldest and Newest Destinations Attract a Surge in Visitors
Lower Manhattan saw a record-breaking nine million visitors to major museums, events and attractions10 in 2010 and is on track to surpass last year’s total. St. Paul’s Chapel, Trinity Church, and Liberty and Ellis islands have been the most frequented attractions so far this year. Lower Manhattan will surpass previous visitation levels with the opening of the National September 11 Memorial on September 12, 2011, which expects at least three to four million visitors in the first year of operation.

0
2 Million
4 Million
6 Million
8 Million
10 Million
12 Million
2002 2003 2004 2005 2006 2007 2008 2009 2010
TOTAL VISITORS
Lower Manhattan is home to the most iconic symbols of old New York, from the Brooklyn Bridge to the Statue of Liberty, Federal Hall where George Washington was sworn into office, the New York Stock Exchange, the Staten Island Ferry, and two branches of the Smithsonian. But the blocks south of Chambers Street also will occupy a prominent place on the postcards of 21st century New York City with architecturally significant destinations like the new PATH station, the Fulton Street Transit Center, the National September 11 Memorial and Museum, East River Waterfront Esplanade and the rebuilt World Trade Center.
Always a popular destination, Lower Manhattan’s attractions have remained must-sees over the past decade for local, regional and international tourists. Between 2002 and 2005, four million people visited annually. Visitation increased to eight million people between 2006 and 2009 as the community was rebuilt. This trend is expected to continue with the opening of the National September 11 Memorial & Museum and a revitalized Governors Island.
Source: Alliance for Downtown New York
19


Lower ManhattanMuseums
Ellis Island Museum
Fraunces Tavern Museum
Museum of American Finance (Smithsonian Affiliation)
Museum of Jewish Heritage -A Living Memorial to the Holocaust
National Museum of the American Indian - Smithsonian Institution,
George Gustav Heye Center
National September 11 Memorial Preview Center11
The New York City Police Museum
Seaport Museum New York
The Skyscraper Museum
African Burial Ground National MemorialAmerican Merchant Mariners Memorial
Battery Park Bowling Green Park
British Garden at Hanover SquareBrooklyn Bridge
Castle Clinton National Monument Charging Bull at Bowling Green
East River Waterfront EsplanadeFederal Hall National Memorial
Governors IslandImagination PlaygroundIrish Hunger Memorial
New York Stock ExchangePoet’s House
South Street SeaportSt. Paul’s Chapel and Trinity Church
Statue of Liberty and Ellis IslandTribute WTC Visitor Center
Vietnam Veterans Memorial
LOWER MANHATTAN ATTRACTIONS
21

A Destination of Choice for Business and Leisure Travelers Lower Manhattan has 18 hotels and 4,092 hotel rooms. This is triple the number of hotels and 78% more hotel rooms than were open in 2001, despite the loss of the 825-room Vista Hotel at 3 World Trade Center on 9/11. In all, 12 hotels have opened south of Chambers Street since 9/11. Hotel development peaked in 2010 when five new hotels opened.
The boom continues with the redevelop-ment of the former Embassy Suites Hotel, now closed for renovation, reopening later this year as the Conrad New York with 463 rooms. Seven additional hotels are in the pipeline: a 95-room hotel on John Street scheduled for completion later this year, a 21-story hotel at 53 Ann Street, a Hampton Inn at 32 Pearl Street, a 67-room boutique at the Battery Maritime Building, a Four Seasons Hotel at 99 Church Street, a Holiday Inn at 99 Washington Street, and a Sheraton Hotel at 217 Pearl Street. This new supply will bring Lower Manhattan’s inventory to 25 hotels with at least 4,948 rooms.
The development boom comes in response to significant demand from business and leisure travelers. According to a 2008 Downtown Alliance survey,12 55% of Lower Manhattan hotel guests are business travelers, 38% are leisure travelers and 7% come to Lower Manhattan for both business and leisure. The average business traveler stays 2.6 days, while the average leisure traveler stays 2.4 days. One out of six business travelers are from other countries, com-pared to one out of five leisure visitors.
Lower Manhattan hotel guests are a high-income demographic, with an average income for business travelers that exceeds $240,000. The average income for leisure travelers is $165,000.
22

Hotel Market Stays Strong
Lower Manhattan has successfully absorbed the increased hotel inventory. The hotel occupancy rate has grown with the additional inventory, increasing 11% since 2002. The average annual occupancy rate rose between 2002 and 2007—peaking in 2007 at 85%. Average annual occupancy rates declined slightly from 2008 to 2010, hovering between 80% and 85% because of the economic downturn. By comparison, citywide annual average occupancy rates hit 85% in 2008, before dropping to 84% in 2010.
Lower Manhattan hotel average daily room (ADR) rates and occupancy rates have outpaced, or been equal to, the citywide average over the last decade. Today, Lower Manhattan’s occupancy rate is a strong 85%, on par with the citywide average; Lower Manhattan’s ADR is $283 per night, 23% higher than the citywide average. The Lower Manhattan ADR was stable in 2007 and 2008, before dropping in 2009, rebounding in 2010, and continuing to increase through mid-2011. Lower Manhattan’s post-recession improvement outpaced the citywide average from 2009 to 2011.
50%
60%
70%
80%
90%
100%
2008 2009 2010
LOWER MANHATTAN NEW YORK CITY
2007
ANNUAL AVERAGE OCCUPANCY RATE
$0$50
$100$150$200$250$300$350$400
2007 2008 2009
LOWER MANHATTAN NEW YORK CITY
2010
ANNUAL AVERAGE DAILY ROOM RATE
Sources: NYC & Company Alliance for Downtown New York
Sources: NYC & Company Alliance for Downtown New York
Charts start in 2007. This is the first year a complete set of comparable data is available. Some data is available prior to 2007, as discussed in the text.
23

RETAIL MARKETA Luxury Retail Corridor and an Innovative Culinary Scene Appear
Lower Manhattan’s 309,500 workers, 56,000 residents, and nine million annual visitors generate powerful market fundamentals and $4.6 billion in annual spending power.13 Importantly, Lower Manhattan sits at the center of a competitive greater market with 370,050 households, an average household income of $96,600, and more than 2.7 million people within a three-mile radius.14
This is why the area south of Chambers Street has attracted a new class of retailers and become a shopping and dining capital with 1,076 stores and restaurants. Forty-eight new retailers have opened in the first half of 2011 alone, including the 23,310-square-foot Duane Reade at 40 Wall Street, the chain’s largest store, which features lavish amenities. Since 2007, the number of shops and storefront services has grown by 6%, reflecting a steady increase in retail activity.15
Lower Manhattan has 38 Zagat-rated restaurants and a bastion of high-end steakhouses and chef-driven eateries, from Delmonico’s—the city’s oldest steakhouse—to recent newcomers like SHO Shaun Hergatt, Wall & Water, Palm and The Capital Grille. Danny Meyer, the internationally recognized hospitality leader, opened his famed Shake Shack in Lower Manhattan in the spring of 2011 and plans to open two additional restaurants in Battery Park City by the end of the year: Blue Smoke and the white-tablecloth North End Grill.
The neighborhood offers a wide range of dining options—including power-lunch settings for the Wall Street crowd, swanky hotel bars, the 2 AM pizza place, pubs to watch a favorite sporting event, great locations for lazy Sunday brunches and dozens of places to grab a quick sandwich or cupcake on the run. Note that the upscale Financier Patisserie’s citywide success began in Lower Manhattan, and today four of 10 locations are south of Chambers Street.
24
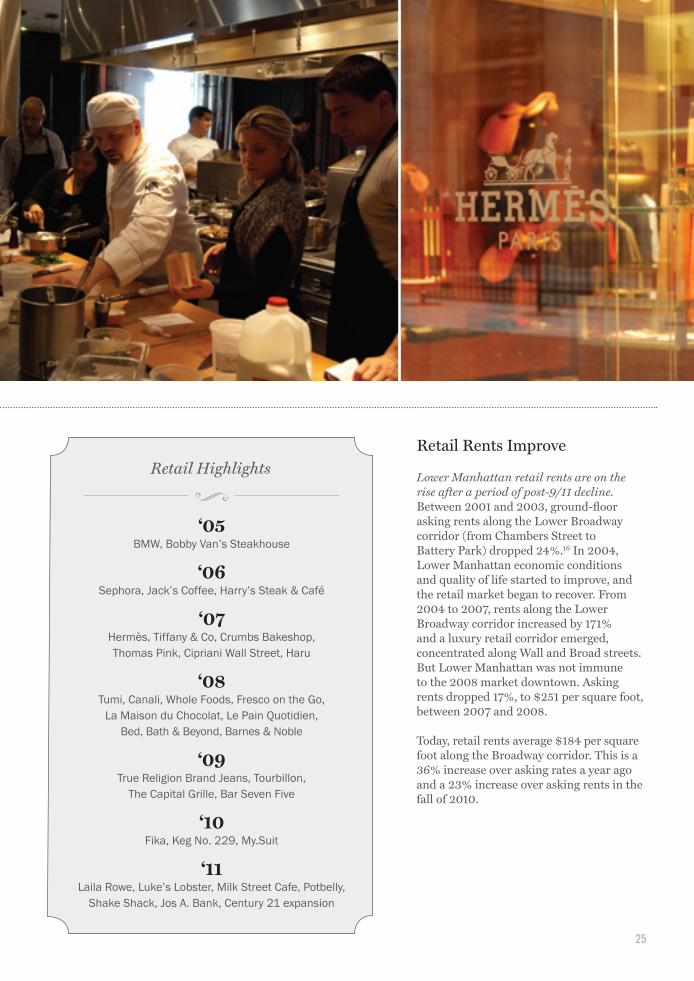
Retail Rents Improve
Lower Manhattan retail rents are on the rise after a period of post-9/11 decline. Between 2001 and 2003, ground-floor asking rents along the Lower Broadway corridor (from Chambers Street to Battery Park) dropped 24%.16 In 2004, Lower Manhattan economic conditions and quality of life started to improve, and the retail market began to recover. From 2004 to 2007, rents along the Lower Broadway corridor increased by 171% and a luxury retail corridor emerged, concentrated along Wall and Broad streets. But Lower Manhattan was not immune to the 2008 market downtown. Asking rents dropped 17%, to $251 per square foot, between 2007 and 2008.
Today, retail rents average $184 per square foot along the Broadway corridor. This is a 36% increase over asking rates a year ago and a 23% increase over asking rents in the fall of 2010.
Retail Highlights
‘05BMW, Bobby Van’s Steakhouse
‘06Sephora, Jack’s Coffee, Harry’s Steak & Café
‘07Hermès, Tiffany & Co, Crumbs Bakeshop, Thomas Pink, Cipriani Wall Street, Haru
‘08Tumi, Canali, Whole Foods, Fresco on the Go,
La Maison du Chocolat, Le Pain Quotidien, Bed, Bath & Beyond, Barnes & Noble
‘09True Religion Brand Jeans, Tourbillon,
The Capital Grille, Bar Seven Five
‘10Fika, Keg No. 229, My.Suit
‘11Laila Rowe, Luke’s Lobster, Milk Street Cafe, Potbelly,
Shake Shack, Jos A. Bank, Century 21 expansion
25

Working for the Future
Manhattan’s most exciting development projects are south of Chambers Street. With $30 billion dollars of public and private investment, Lower Manhattan is rebuilding for the future.
Ten years after a terrorist attack on the World Trade Center, the progress is profound. The 8.8 million square feet of Class A office space under construction at the World Trade Center site and the new 2.1 million square-foot Goldman Sachs headquarters represent 78% of the space damaged or destroyed on September 11, 2001. It is significant to note that commercial construction at the World Trade Center site represents 38% of construction under way in all national central business districts nationwide.17
Steel for the 104-story 1 World Trade Center has surpassed the 78th floor. Concrete has been poured beyond, the 69th floor, and façade work has been installed above the 51th floor. Steel for the 78-story 4 World Trade Center has surpassed the 46th floor, concrete has been poured beyond the 40th floor, and the glass curtain wall has been installed above the 15th floor.
Foundation work continues for 2 World Trade Center and 3 World Trade Center. Three World Trade Center will be built as a transit and retail podium by 2012, with construction of an office tower to follow when Silverstein Properties meets certain leasing and financing milestones. Two World Trade Center will be built to grade in a way that preserves the opportunity for future office development. The Port Authority of New York and New Jersey, New York City and New York State have agreed to backstop the financing once those milestones are met.
All 54 massive steel arches are in place at the World Trade Center Transportation Hub, designed by Santiago Calatrava.
All steel is in place and the façade is completed at the National September 11 Memorial Museum, designed by Norwegian architectural firm Snohetta, and more than 220 of nearly 400 trees have been planted at the Memorial Plaza. The plaza will open to the public on September 12, 2011.
Leasing activity has progressed with vigor around the World Trade Center site. Seven World Trade Center is 92% leased and Condé Nast, Beijing Vantone China Center, and the City of New York have signed major leases at 1 World Trade Center and 4 World Trade Center.
Upon completion of the World Trade Center redevel-opment program, and the 8.8 million square feet of world-class office space, Lower Manhattan will regain its ranking as the nation’s third-largest central business district.
The completed World Trade Center will also include 488,000 square feet of retail space and a 1,000-seat Performing Arts Center. Of note, the $3.4-billion World Trade Center Transportation Hub will house the New Jersey PATH station and connect underground to the Fulton Street Transit Center on the east, the World Financial Center on the west and to retail.
Lower Manhattan’s other physical improvements will include a rebuilt Borough of Manhattan Community College building, Fiterman Hall; upgraded parks, plazas and open space; and an expanded East River Waterfront Esplanade.
REBUILDING AND MAJOR CAPITAL IMPROVEMENT PROJECTS
26
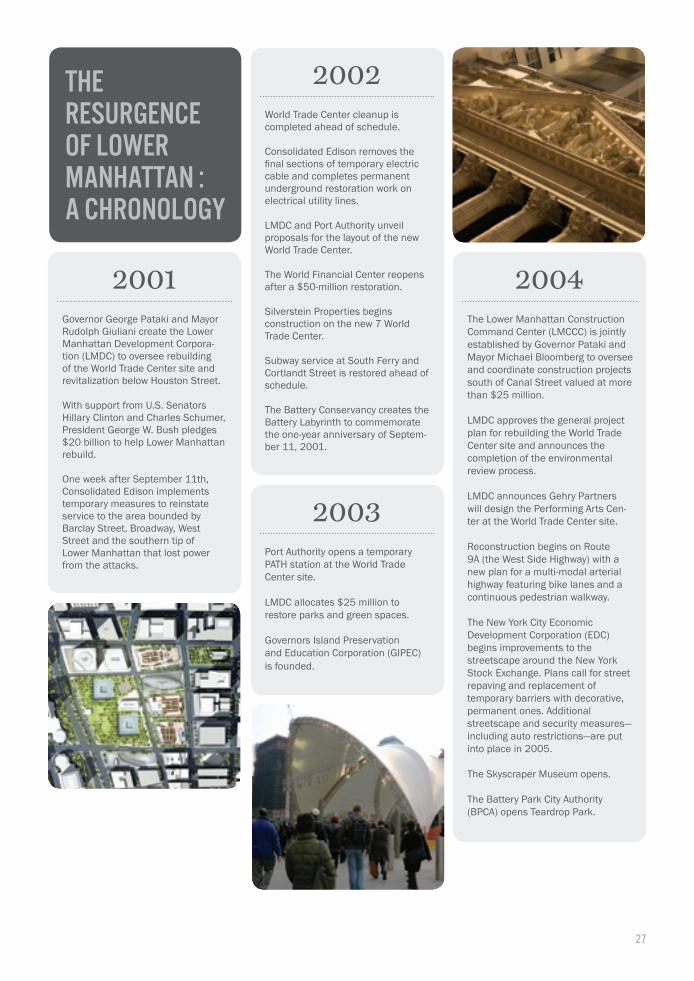
THE RESURGENCE OF LOWER MANHATTAN : A CHRONOLOGY
2002World Trade Center cleanup is completed ahead of schedule.
Consolidated Edison removes the final sections of temporary electric cable and completes permanent underground restoration work on electrical utility lines.
LMDC and Port Authority unveil proposals for the layout of the new World Trade Center.
The World Financial Center reopens after a $50-million restoration.
Silverstein Properties begins construction on the new 7 World Trade Center.
Subway service at South Ferry and Cortlandt Street is restored ahead of schedule.
The Battery Conservancy creates the Battery Labyrinth to commemorate the one-year anniversary of Septem-ber 11, 2001.
2003Port Authority opens a temporary PATH station at the World Trade Center site.
LMDC allocates $25 million to restore parks and green spaces.
Governors Island Preservation and Education Corporation (GIPEC) is founded.
2004The Lower Manhattan Construction Command Center (LMCCC) is jointly established by Governor Pataki and Mayor Michael Bloomberg to oversee and coordinate construction projects south of Canal Street valued at more than $25 million.
LMDC approves the general project plan for rebuilding the World Trade Center site and announces the completion of the environmental review process.
LMDC announces Gehry Partners will design the Performing Arts Cen-ter at the World Trade Center site.
Reconstruction begins on Route 9A (the West Side Highway) with a new plan for a multi-modal arterial highway featuring bike lanes and a continuous pedestrian walkway.
The New York City Economic Development Corporation (EDC) begins improvements to the streetscape around the New York Stock Exchange. Plans call for street repaving and replacement of temporary barriers with decorative, permanent ones. Additional streetscape and security measures—including auto restrictions—are put into place in 2005.
The Skyscraper Museum opens.
The Battery Park City Authority (BPCA) opens Teardrop Park.
2001Governor George Pataki and Mayor Rudolph Giuliani create the Lower Manhattan Development Corpora-tion (LMDC) to oversee rebuilding of the World Trade Center site and revitalization below Houston Street.
With support from U.S. Senators Hillary Clinton and Charles Schumer, President George W. Bush pledges $20 billion to help Lower Manhattan rebuild.
One week after September 11th, Consolidated Edison implements temporary measures to reinstate service to the area bounded by Barclay Street, Broadway, West Street and the southern tip of Lower Manhattan that lost power from the attacks.
27

2007MTA completes a new entrance at Broadway and Maiden Lane for northbound 4/5 trains, a new entrance at Broadway and Cortlandt Street for southbound 4/5 trains, and restores the mezzanine level for the 2/3 Fulton Street station.
EDC selects the Dermot Company and the Poulakakos family to develop a 9,000-square-foot programmed Great Hall, a boutique hotel, and a rooftop restaurant at the Battery Maritime Building.
Development of Peter Minuit Plaza begins.
The British Garden at Hanover Square opens.
2008Port Authority completes site excavation for 3 World Trade Center and 4 World Trade Center; Silverstein Properties begins foundation work.
A new temporary PATH Station at the base of the World Trade Center on Vesey Street opens to the public.
The Goldman Sachs world headquarters is completed in Battery Park City.
A decontamination plan for the Borough of Manhattan Community College’s Fiterman Hall at 30 West Broadway is approved by regulators. Crews begin cleaning and abate-ment work.
Underground work on Fulton Street begins and continues throughout 2009, including improvements to street-level access, visibility and connections between subway lines.
Reconstruction of Louise Nevelson Plaza begins. The project includes restoration of the Louise Nevelson sculptures, new stonework and benches and enhanced lighting.
2006Construction begins on the National September 11 Memorial & Museum and 1 World Trade Center.
Silverstein Properties completes 7 World Trade Center, reopening Greenwich Street in front of the building and adding a new park designed by landscape architect Ken Smith, with a public art sculpture by Jeff Koons. Reaching 52 stories, the tower is New York City’s first LEED Gold-certified building.
The Promenade South portion of Route 9A between Battery Place and West Thames Street opens.
Zuccotti Park is completed. The 33,000-square-foot park features new trees, flowerbeds, granite paving, significant public seating, and art by J. Seward Johnson Jr., and Mark DiSuvero.
2005Goldman Sachs breaks ground on its 43-story world headquarters, designed by Pei Cobb Freed & Partners, in Battery Park City.
The Metropolitan Transportation Authority (MTA) begins to modernize the 105-year-old South Ferry subway station, improving public space around the station and the connec-tion to the R/W lines at the Whitehall Street station.
MTA also begins demolition work on Broadway, between Fulton and John streets, to make way for the new Fulton Street Transit Center, including the closure of north and southbound 4/5 entrances on Broadway and the R/W entrance at Cortlandt Street. (Closing enables the MTA to build a 150-foot underpass connecting the new transit center’s Dey Street Concourse with the PATH station and the World Trade Center site.)
The new Old Slip Park, located beside the New York City Police Museum, opens.
The four-acre Battery Bosque, funded by an $8.5 million grant from the LMDC, opens. The Bosque features 60,000 square feet of new gardens.
Construction begins on the British Garden at Hanover Square, The garden features Unity by British sculptor Anish Kapoor, a “memorial railing” commemorating British victims of 9/11, carved stone that will form a map of the United Kingdom and new benches.
28

2011,Pre-9/11/11
Condé Nast signs a one-million- square-foot lease at 1 World Trade Center.
A topping-out ceremony marks the end of the structural steel phase of the new Fiterman Hall.
BPCA approves a 25-year lease of Pier A to the Poulakakos family and the Dermot Company, to create a 40,000-square-foot restaurant complex.
Louise Nevelson Plaza reopens.
The first phase of the East River Wa-terfront Esplanade, from Wall Street to Maiden Lane, opens.
Peter Minuit Plaza opens—with seat-ing, plantings, and the Amsterdam Plein & Pavilion, a gift from the Dutch government to commemorate the quadricentennial arrival of Henry Hudson’s into the New York Harbor.
Officials open a new subway entrance at William and Fulton streets—part of the Fulton Street Transit Center project.
The Cortlandt Street subway station reopens; it was seriously damaged on 9/11 and closed intermittently over the past decade.
Construction begins on a 5,200-square-foot Pearl Street playground.
2010Mayor Bloomberg and Governor David Paterson allocate $100 million to develop the Performing Arts Cen-ter at the World Trade Center site.
1 World Trade Center reaches 52 floors—halfway to the top of the 104-story building.
The first of nearly 400 trees are planted in the plaza at the 9/11 Memorial.
The Trust for Governors Island, the city entity charged with operating, planning, and redevelopment, is established. The Trust for Governors Island replaces GIPEC.
The new park at DeLury Square, Fulton and Gold streets opens. The 8,850-square-foot park includes a waterfall, benches and landscaping and will be linked to Pearl Street.
Construction begins on the Battery Park Conservancy’s SeaGlass Carousel, an innovative, aquatic-themed ride.
Imagination Playground is completed.
The nearly 10,000-square foot Titanic Park breaks ground and is completed in the same year.
2012-152012The 9/11 Memorial Museum is scheduled to open.
The new Fiterman Hall is scheduled for completion.
The Battery Garden Bikeway, which will link the Hudson River Park Bikeway to the East River Esplanade, is scheduled for completion.
Frank Gehry’s $10-million Battery Playspace in Battery Park is scheduled for completion, expanding the current playground by 40%.
The Pearl Street Playground is scheduled for completion.
The first phase of construction on infrastructure and the new Governors Island park and public spaces begins.
20134 World Trade Center is scheduled for completion.
Fulton Street reconstruction is scheduled for completion.
East River Waterfront Esplanade is scheduled for completion.
The restaurant complex at Pier A is scheduled for completion.
20141 World Trade Center and the World Trade Center Transportation Hub are scheduled for completion.
The Battery Maritime Building is scheduled for completion.
First phase of the Governors Island Park and Public Space Plan, featuring 22 new acres of green space including 2 new ball fields, is scheduled to open.
20153 World Trade Center is scheduled for completion.
2009Employees move into Goldman Sachs’ new Battery Park City headquarters.
Construction of the new 15- story Fiterman Hall for the Borough of Man-hattan Community College begins.
The new MTA South Ferry subway station opens to the public.
The R/W entrance at Cortlandt Street reopens to the public.
Construction of the East River Water-front Esplanade begins. Stretching from Battery Park to East River Park, it will include walking and bike trails, plantings, seating and recreational space, and a redeveloped Pier 15 featuring open space and a maritime educational pavilion and café.
Construction begins on Imagination Playground, an 18,000-square-foot park designed by architect David Rockwell.
9/11/11The 9/11 Memorial is to be dedicated on September 11, 2011 and open to the public on September 12, 2011.

WHERE EVERYONE WANTS TO BEThe Center of a Multi-Modal Regional Transportation Network
Lower Manhattan makes for an easy commute. With 12 subway lines, 30 bus routes, the PATH train to New Jersey, six ferry landings, a heliport, the city’s most-trafficked bikeways and easy vehicular access to the Brooklyn Battery Tunnel, Holland Tunnel and Brooklyn and Manhattan bridges, Lower Manhattan is the center of the region.
In all, Lower Manhattan saw 120 million public transit uses last year,18 plus 860,000 uses of the Downtown Connection, the Downtown Alliance’s free circulator bus that runs seven days a week —making it as easy to get around Lower Manhattan as it is to get here. This network will be strengthened by completion of the Fulton Street Transit Center and the World Trade Center Transportation Hub, which combined will serve more than 300,000 riders daily.
A lesser-known fact: The commute to Lower Manhattan from the Financial District, Tribeca, SoHo, the Village, Chelsea, brownstone Brooklyn, Williamsburg, the Jersey river towns and other points throughout the region is often shorter than a comparable commute to Rockefeller Center or to a Park Avenue address in
Midtown. On average, the commute from 12 popular locations throughout the region is 44 minutes to 7 World Trade versus 46 minutes to Rockefeller Center and 47 minutes to Park Avenue.
Lower Manhattan residents have an average commute time to their jobs of only 22 minutes, compared to the New York City average of 39 minutes. Fifty-two percent take the subway while 30% walk to work. Forty-one percent of employed residents work in Lower Manhattan, 45% work in other parts of the borough and 90% of Lower Manhattan employees take mass transit or walk to work.19
A Wealth of Parks and Recreational Opportunities
Every Lower Manhattan resident is within a half-mile of open space, including parks and public plazas. The neighborhood has almost 57 acres of designated open space—equivalent to 43 football fields—south of Chambers Street, twice the amount of open space and outdoor recreation available in Midtown from 34th to 59th streets. Construction of the National September 11 Memorial and Museum and East River Waterfront Esplanade will add another 25 to 30 acres of parkland to Lower Manhattan, which is the best place to board a boat, with water on three sides.
In addition, workers and residents enjoy an abundance of grocery options with eight green markets, 13 food stores, and more than 79 places to dine al fresco.

Education and Top-Rated Schools
Lower Manhattan has a growing and dynamic student population with 31 schools south of Worth Street: 11 preschools, 11 grade schools, and nine institutions of higher learning. Collectively, they educate 45,000 students annually.
Families are drawn to Lower Manhattan because of its top-performing kindergarten-12 schools, from PS 234 to Stuyvesant High School. With a booming residential population, demand for schools has grown tremen-dously. Six new schools have opened in the last two years alone, including Claremont Preparatory School’s expansion of a high school, making it one of the city’s largest private school campuses. This growth will continue. The Blue School is scheduled to move its kindergarten to third grade school from the East Village, and three additional public schools are planned south of Worth Street.
Lower Manhattan is also a center of post-secondary and graduate learning and creativity, with 40,000 students enrolled. Pace University, the Borough of Manhattan Community College and St John’s University, are all based south of Worth Street. Another six schools offer courses in Lower Manhattan, including New York University’s School of Continuing and Professional Studies and its Polytechnic Institute, as well as the City College of New York’s Center for Worker Education.
More is under way, as the Borough of Manhattan Community College and Pace University undertake 620,000 square feet of new capital projects, including classrooms, dorms, dining facilities, computer labs, and administration offices.
Public Art & Re:Construction
Art is part of daily life in Lower Manhattan. Perma-nent installations of large-scale sculptures include Noguchi’s Red Cube at 140 Broadway, Dubuffet’s Group of Four Trees on Chase Plaza, Mark diSuvero’s Joie de Vivre in Zuccotti Park and Jeff Koons’ Balloon Flower at 7 World Trade Center—in addition to approximately 130 other works.
Re:Construction, the Downtown Alliance’s innovative, award-winning temporary public art program, has turned construction barriers into canvases for visual art, with 25 completed projects since the program began in 2007. Re:Construction was funded by a $1.5 million grant from the LMDC. Artists include Richard Pasquarelli, Maya Barkai, and Caitlin Hurd. Their murals enrich Lower Manhattan streetscapes and complement other public art installations in the area.
New Ways of Working: Wi-Fi Usage and the Hive at 55
Lower Manhattan is at the forefront of New York City’s technology revolution. In 2003, the Downtown Alliance pioneered the city’s most extensive, free, public Wi-Fi initiative. Now there are 13 hotspots—covering nearly 500,000 square feet—with more on the way. About 15,000 people on average connect each month.
Lower Manhattan is also incubating new entrepreneurs. In 2009, the Downtown Alliance launched a co-work-ing facility—the Hive at 55—creating an affordable, convenient, and amenity-rich workspace for a mobile and independent workforce. Yet the Hive is more than a flexible office. Located in Rudin Management’s New York Information Technology Center, and run with support from the EDC, the Hive is a place where creative thinkers can work alone, together: networking, exchanging ideas and collaborating.
The Hive has had more than 177 subscribed members within the first 18-months of operating. Despite the transient nature of co-working, the retention rate topped 55% in the first year, while subscribed members and one-time users filled more than 4,600 co-worker seats. The Hive also hosts technology and business events, bringing approximately 4,500 people to Lower Manhattan since the workspace’s opening.
31

The Most Extensive and Dependable Source of Economic and Demographic Data
The Downtown Alliance offers information about Lower Manhattan in print and online, at our frequently updated website, www.DowntownNY.com, and in publications including tourism maps, quarterly newsletters, retail guides and this State of Lower Manhattan report.
Our active research program makes it easy to stay on top of a constantly changing market so brokers can offer clients top-tier service and match them with appropriate Lower Manhattan properties. We publish leasing activity and development updates on a quarterly basis and provide market, economic and demographic profiles for Lower Manhattan. We also provide a broad range of communications tools to meet more specific needs for businesses, real estate professionals, workers, residents, visitors, journalists and researchers.
LOWER MANHATTAN’S INFORMATION CLEARING HOUSE
Scan code to access the latest Downtown
Alliance researchor visit
DowntownNY.com
32

LOWER MANHATTAN’S INFORMATION CLEARING HOUSE
THANK YOU:
Andaz Wall StreetBest Western Plus Seaport Inn CB Richard EllisCiti HabitatsCoStarCushman & WakefieldDoubleTree HotelEmbassy Suites HotelGild HallHampton Inn – Manhattan-Seaport-Financial DistrictLower Manhattan Cultural CouncilMassey Knakal Realty ServicesMillenium Hilton HotelMuseum of the American IndianMuseum of Jewish HeritageNew York City Department of City PlanningNew York City Department of FinanceNew York State Department of LaborNew York City Department of Transportation
Metropolitan Transportation AuthorityNational Parks ServiceNational September 11th Memorial & MuseumNYC & CompanyNew York Marriott Financial CenterPort Authority of New York and New JerseyReal Estate Board of New YorkRitz Carlton Battery ParkSt Paul’s ChapelStatue CruisesTribute WTC Visitor CenterTrinity ChurchTrust for Governors IslandSeaport Museum New York9/11 Memorial Preview SiteSilverstein Properties, Inc.UGL Services – Equis OperationsWall Street Inn
33

Robert R. DouglassMilbank, Tweed, Hadley & McCloy LLPChairman, Alliance for Downtown New York
Hon. Michael R. BloombergMayor, City of New York
Peter BrausSierra Realty Corporation
Harry BridgwoodNew Water Street Corporation
Mark E. BrooksAmerican International Group
Hon. Margaret S. ChinCouncilmember, City of New York
Betty CohenCentury 21 Department Stores
John V. Connorton, Jr.Hawkins Delafield & Wood LLP
K. Thomas ElghanayanTF Cornerstone
David. V. FowlerBank of New York Mellon
Michael B. FrançoisPort Authority of New York & New Jersey
Rachelle FriedmanJ&R Music and Computer World
Stephen J. FriedmanPace University
Timur GalenGoldman Sachs & Company
Martha J. GalloJPMorgan Chase & Company
James F. GillBryan Cave LLP
Robert J. Giuffra, Jr.Sullivan & Cromwell LLP
Stanley E. GraysonM.R. Beal & Company
Francis J. GreenburgerTime Equities, Inc.
John K. HalveyNYSE Euronext
Thomas M. HughesResident Representative
Richard T. KennedyCushman & Wakefield, Inc.
Stephen LefkowitzFried, Frank, Harris, Shriver & Jacobson LLP
David W. LevinsonL&L Holding Company LLC
Janno LieberWorld Trade Center Properties LLC
Hon. John C. LiuComptroller, City of New York
Reverend Canon Anne MalloneeParish of Trinity Church
Hon. Julie MeninChair, Manhattan Community Board 1
Ross F. MoskowitzStroock & Stroock & Lavan LLP
Cherrie NanningaCB Richard Ellis, Inc.
Dr. Antonio PerezBorough of Manhattan Community College
Peter PoulakakosHarry’s Cafe/Harry’s Steak
Mitchell RudinBrookfield Office Properties Corporation
William C. RudinRudin Management Company, Inc.
Frank J. SciameF.J. Sciame Construction Company, Inc.
Alan M. ScottDeutsche Bank
Michael SkidmoreSkidmore Associates
Allan G. SperlingCleary Gottlieb Steen & Hamilton LLP
Hon. Scott M. StringerManhattan Borough President
Kent M. SwigSwigEquities LLC
Robert W. WalshCommissioner, New York CityDepartment of Small Business Services
Elizabeth H. BergerPresident, Alliance for Downtown New York
BOARD OF DIRECTORS

Page 4/5:Page 6:Page 9:
Page 14:Page 16:Page 18:
Page 20:
Page 21:Page 22:Page 24:
Page 25:
Page 26:Page 27:Page 28:
Page 29:Page 30:Page 31:
Page 32/33:
IMAGE CREDITS
Skyline Image, Silverstein PropertiesOffice Image, photo by Colin BrennanHive@55, photo by Colin BrennanResidents Gardening, photo by Downtown AllianceStreet Scene, photo by Robert Caplin/The New York Times/Redux Tourists and the Bull, photo by Tommy Agriodimas; Federal Hall, photo by Downtown AllianceMuseum of Jewish Heritage, photo by Downtown Alliance; NYSE, photo by Downtown Alliance; Museum of Finance, photo by Museum of Finance, National Museum of the American Indian, photo by Downtown AllianceSouth Street Seaport, photo by Tommy AgriodimasW New York - Downtown, photo by Tommy AgriodimasLa Maison du Chocolat, photo by Tommy Agriodimas; Whole Foods, photo by Photo BureauAndaz cooking class, photo by Downtown Alliance; Hermes photo by Downtown AllianceWTC construction, photo by Tommy AgriodimasWTC Rendering, Silverstein PropertiesRendering – Fulton Street Transit Center, by MTALouis Nevelson Park, photo by Downtown AllianceRendering – WTC, by Silverstein PropertiesBattery Park Trees, photo by Brian DiFeoRe:Construction, photo by Downtown AllianceChase, photo by Photo Bureau
COVER - ART DIRECTION: ROGERS ECKERSLEY DESIGNDESIGN: ALLIANCE FOR DOWNTOWN NEW YORK
Source: CB Richard Ellis.Source: New York State Department of Labor.Source: Cushman & Wakefield.Source: CB Richard Ellis.Source: Survey of Residents of Lower Manhattan, conducted by PKS Partners for the Alliance for Downtown New York, 2009.Sources: Survey of Residents of Lower Manhattan, conducted by PKS Partners for the Alliance for Downtown New York, 2009, U.S. Census Bureau American Community Survey, 2008.Source: Citi HabitatsSource: New York City Department of Finance. 2003 is the first-year that complete annual residential sales data, by month, is publicly available for all of Manhattan.Source: The Furman Center for Real Estate and Urban Policy, State of New York City’s Housing & Neighborhoods 2010.Source: The Downtown Alliance collects ticket sales and visitor information from 11 major museums and attractions to estimate visitation to Lower Manhattan.Source: The 9/11 Preview Memorial Site will remain open until the permanent Memorial Museum opens.Source: Lower Manhattan Guest Study, conducted by Audience Research & Analysis for the Alliance for Downtown New York, 2008.The 2011 annual estimated spending power of residents, workers, and hotel guests is $4.6 billion. This number accounts for the annual disposable income of Lower Manhattan residents, discretionary annual spending of Lower Manhattan workers, and the annual average spent by Lower Manhattan hotel guests. The greater-market area is the three-mile radius around Lower Manhattan. Population estimate: Census 2000.Source: The Downtown Alliance began tracking retail openings and closings in late 2007.Source: Real Estate Board of New YorkSource: Cushman & Wakefield, which tracks 76 commercial business districts nationwide.Source: Source: Metropolitan Transportation Authority.Source: Survey of Residents of Lower Manhattan, conducted by PKS Partners for the Alliance for Downtown New York, 2009.
12345
6
78
9
10
1112
13
14
1516171819
END NOTES

The mission of the Alliance for Downtown New York is to be the principal organization that provides Lower Manhattan’s historic financial district with a premier physical and economic environment, advocates for businesses and property owners and promotes the area as a world-class destina-tion for companies, workers, residents and visitors. The Downtown Alliance manages the Downtown-Lower Manhattan Business Improvement District (BID), serving an area roughly from City Hall to the Battery, from the East River to West Street.
Alliance for Downtown New York, Inc.120 Broadway, Suite 3340New York, New York 10271www.DowntownNY.com