8dtek waterfall
4
232 233 TELE-satellite International — The World‘s Largest Digital TV Trade Magazine — 12-01/2012 — www.TELE-satellite.com www.TELE-satellite.com — 12-01/2012 — TELE-satellite International — The World‘s Largest Digital TV Trade Magazine Waterfall Diagrams for 8dtek Satellite Meters • Detection of weak signals • Identification of all active satellites • Allows for highly precise antenna alignment • Long-term measurements for reliable feed detection • Ideal upgrade for 8dtek satellite meters FEATURE Upgrade for 8dtek Satellite Meters TELE-satellite Magazine Business Voucher www.TELE-satellite.info/12/01/8dtek-waterfall Direct Contact to Sales Manager
-
Upload
tele-audiovision-eng -
Category
Business
-
view
398 -
download
0
Transcript of 8dtek waterfall
232 233TELE-satellite International — The World‘s Largest Digital TV Trade Magazine — 12-01/2012 — www.TELE-satellite.com www.TELE-satellite.com — 12-01/2012 — TELE-satellite International — The World‘s Largest Digital TV Trade Magazine
Waterfall Diagrams for 8dtek Satellite Meters
•Detectionofweaksignals•Identificationofallactivesatellites•Allowsforhighlypreciseantennaalignment•Long-termmeasurementsforreliablefeeddetection•Idealupgradefor8dteksatellitemeters
FEATURE Upgrade for 8dtek Satellite Meters
TELE-satellite MagazineBusiness Voucher
www.TELE-satellite.info/12/01/8dtek-waterfallDirect Contact to Sales Manager
■
1234 TELE-satellite International — The World‘s Largest Digital TV Trade Magazine — 12-01/2012 — www.TELE-satellite.com
Satellite meters and satellite finders are used to professionally align satellite antennas and to identify flaws in an ex-isting setup. True satellite enthusiasts, however, also have additional purposes for meters: Satellite DXers are per-manently on the hunt for weak or rare signals, while feed hunters are on the lookout for undocumented transmis-sions (feeds).
Both target groups prefer satellite meters with spectrum analyzers, be-cause with the help of a satellite spec-trum it becomes possible to spot a sat-ellite long before a satellite receiver is capable of locking a signal. In addition, a spectrum display helps to identify and analyze transponders. It is even possi-ble to find out whether new transpond-ers have become active at short notice, which in many cases hints at new feeds. Real-time spectrums are the display of choice for those satellite enthusiasts, as they have a refresh rate of way less than one second.
Hence it’s no surprise that in recent
months a number of new satellite me-ters with spectrum analyzer have been launched. These analyzers are de-signed to display the current signal sit-uation – but what do you do if you need to monitor a specific signal for a certain length of time? This may be necessary when you rotate a motorised antenna, for manually aligning an antenna or for performing a long-term measurement.
In ham radio circles a so-called wa-terfall diagram is used for exactly those purposes: It shows the spectrum over a period of time using the three parame-ters of frequency, signal level and time. This would actually require a three-di-mensional diagram, something that can only be achieved with great effort. In order to display all required information without having to do 3D calculations, one parameter (signal level in our case) is colour-coded.
So in a waterfall diagram the x-ax-is refers to frequency and the y-axis shows time as well as – in a gradual col-our scheme – signal level. A waterfall
diagram is drawn up line by line from top to bottom, with each line describing a full spectrum. Actually, this is how the name was derived: Like in a waterfall, information flows from top to bottom.
We wanted to provide proof that a waterfall diagram can actually work for satellite meters as well and to that end we used three different 8dtek satel-lite meters: Xtra-S, Gifted and Desired (please refer to TELE-satellite issues 06-07/2011 and 08-09/2011 for test reports about these devices). They are absolute exceptions in their price seg-ment as all of them offer a functional spectrum analyzer.
It’s rather striking to discover that the manufacturer decided to focus on ei-ther speed or display resolution: While the 8dtek Xtra-S boasts a real-time spectrum display – albeit at low resolu-tion – the Gifted and Desired models impress with high-resolution displays at the cost of display build-up time.
All three models feature a video out-
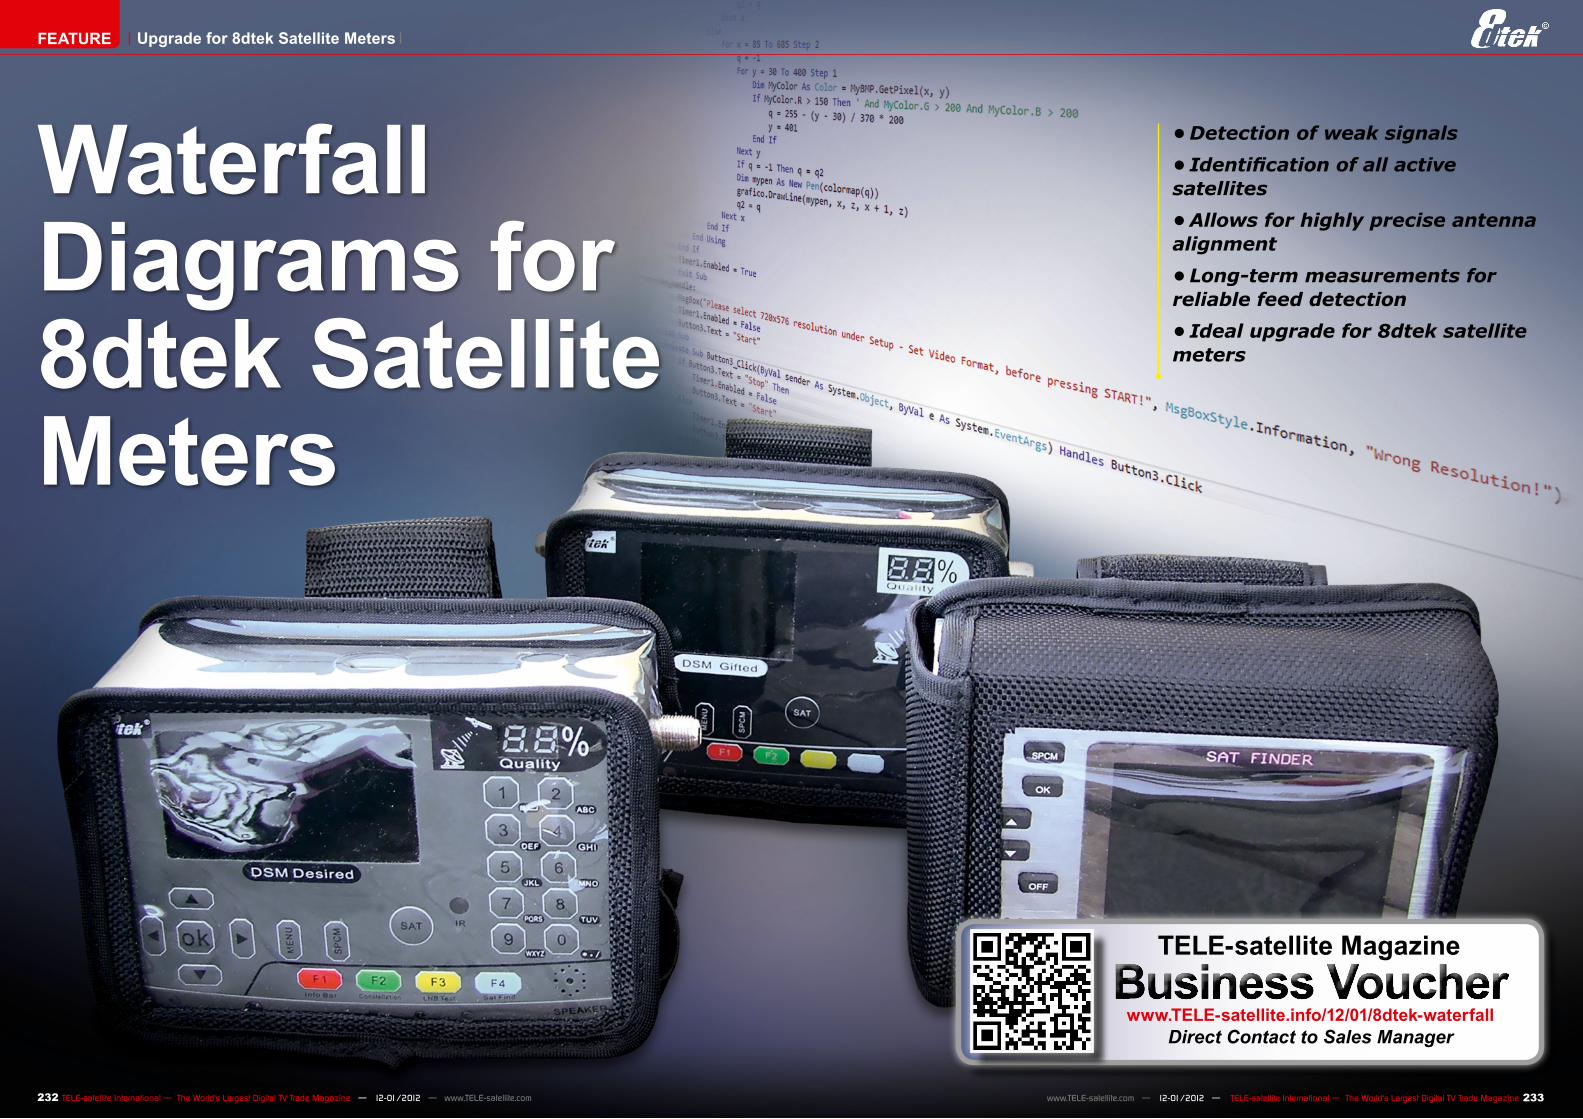
Unconventional thinking turns 8dtek satellite meters into genuinely professional tools – without costing a penny!Vitor Martins Augusto
Image 1: The three satellite meters Desired, Xtra-S and Gifted from manufacturer 8dtek were at our disposal for experimenting.
FEATURE Upgrade for 8dtek Satellite Meters
2
3
4
5
6
7
236 237TELE-satellite International — The World‘s Largest Digital TV Trade Magazine — 12-01/2012 — www.TELE-satellite.com www.TELE-satellite.com — 12-01/2012 — TELE-satellite International — The World‘s Largest Digital TV Trade Magazine
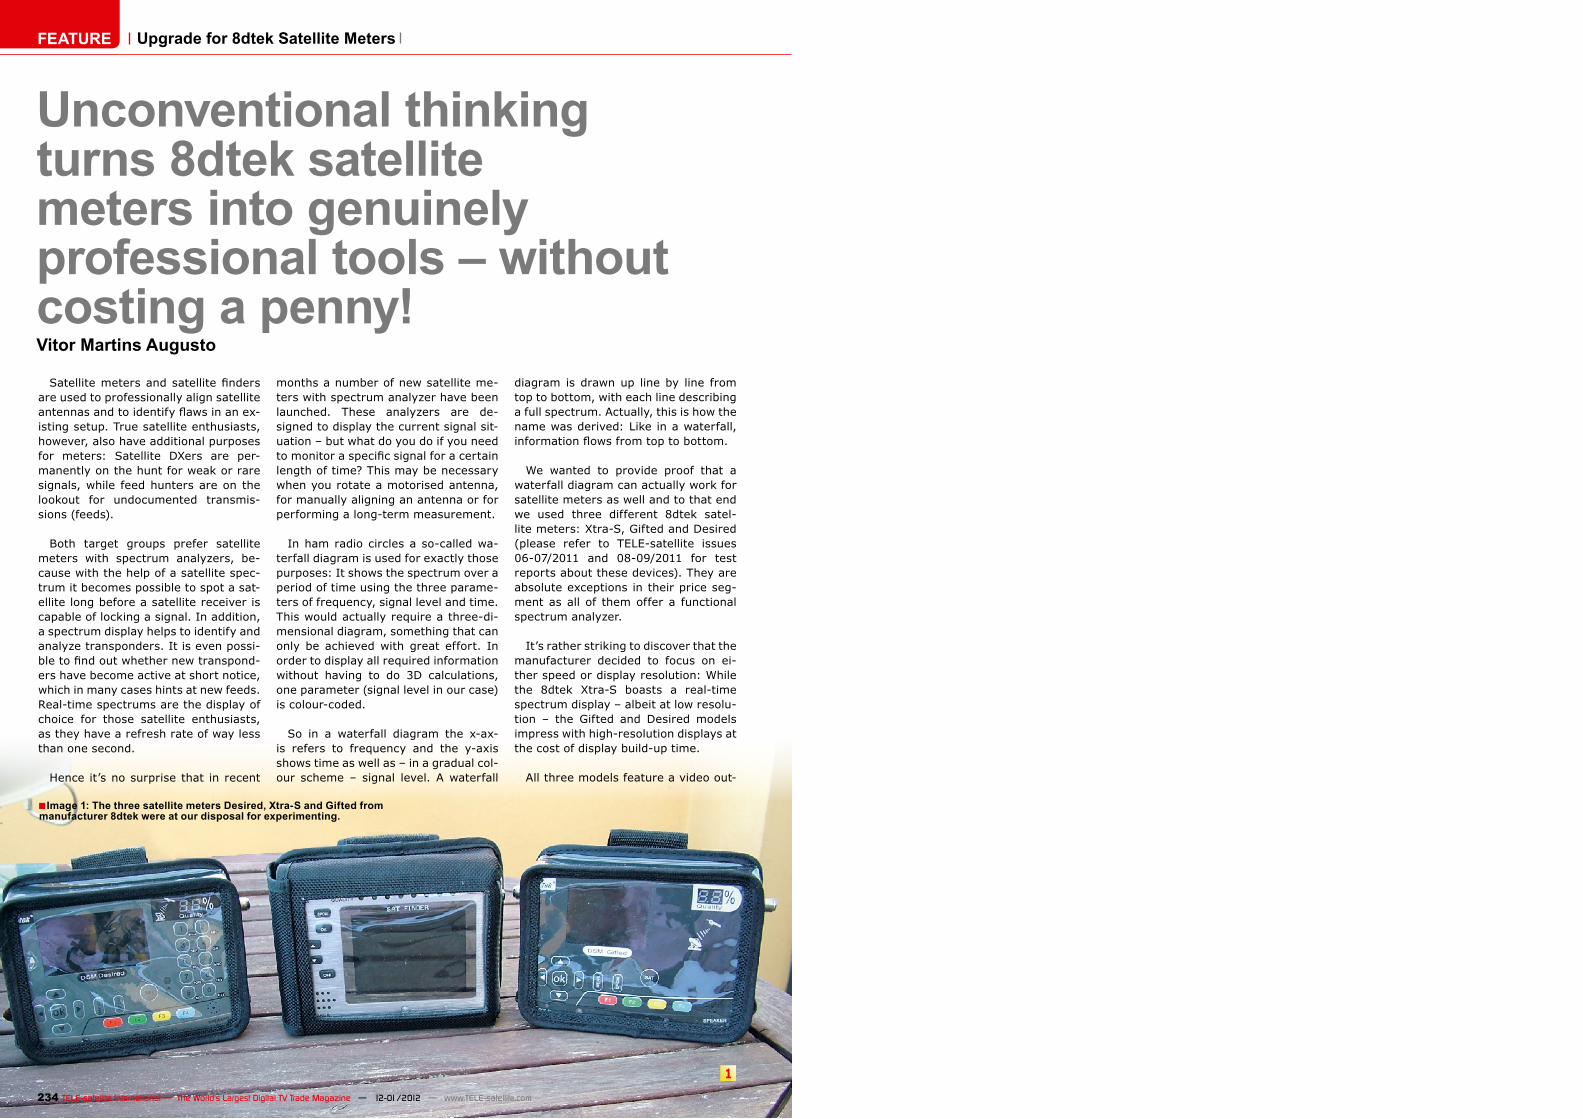
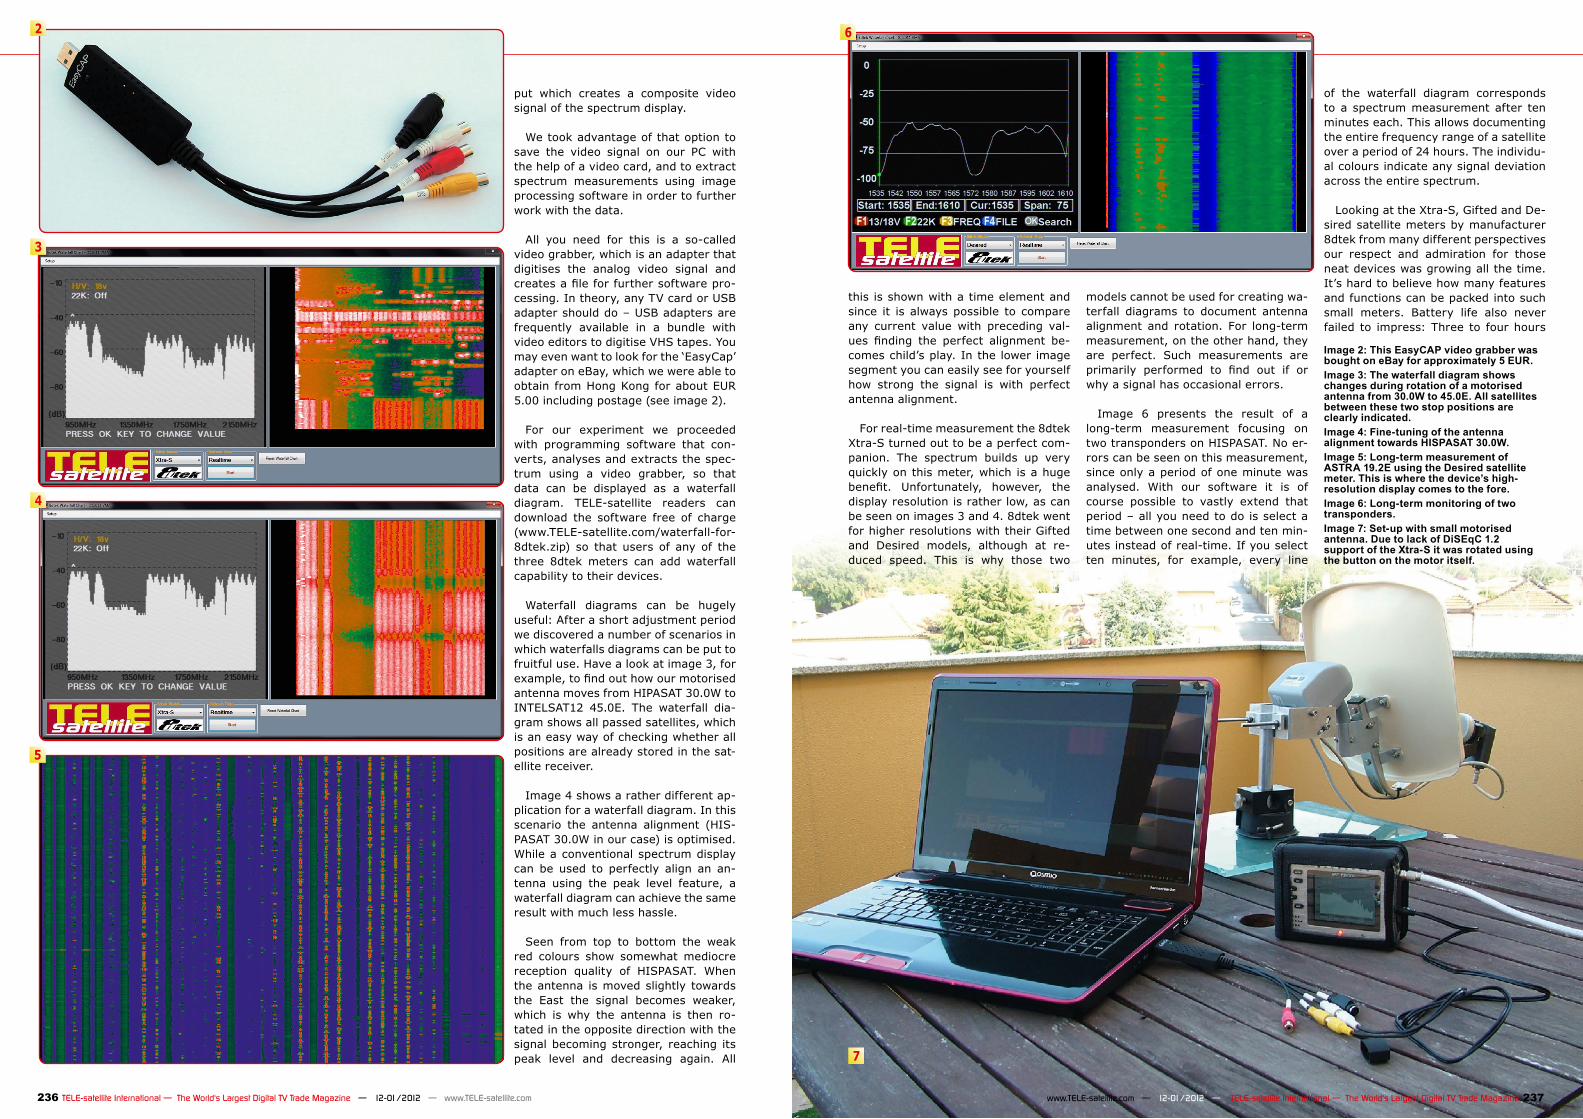
Image 2: This EasyCAP video grabber was bought on eBay for approximately 5 EUR.Image 3: The waterfall diagram shows changes during rotation of a motorised antenna from 30.0W to 45.0E. All satellites between these two stop positions are clearly indicated.Image 4: Fine-tuning of the antenna alignment towards HISPASAT 30.0W.Image 5: Long-term measurement of ASTRA 19.2E using the Desired satellite meter. This is where the device’s high-resolution display comes to the fore.Image 6: Long-term monitoring of two transponders.Image 7: Set-up with small motorised antenna. Due to lack of DiSEqC 1.2 support of the Xtra-S it was rotated using the button on the motor itself.
put which creates a composite video signal of the spectrum display.
We took advantage of that option to save the video signal on our PC with the help of a video card, and to extract spectrum measurements using image processing software in order to further work with the data.
All you need for this is a so-called video grabber, which is an adapter that digitises the analog video signal and creates a file for further software pro-cessing. In theory, any TV card or USB adapter should do – USB adapters are frequently available in a bundle with video editors to digitise VHS tapes. You may even want to look for the ‘EasyCap’ adapter on eBay, which we were able to obtain from Hong Kong for about EUR 5.00 including postage (see image 2).
For our experiment we proceeded with programming software that con-verts, analyses and extracts the spec-trum using a video grabber, so that data can be displayed as a waterfall diagram. TELE-satellite readers can download the software free of charge (www.TELE-satellite.com/waterfall-for- 8dtek.zip) so that users of any of the three 8dtek meters can add waterfall capability to their devices.
Waterfall diagrams can be hugely useful: After a short adjustment period we discovered a number of scenarios in which waterfalls diagrams can be put to fruitful use. Have a look at image 3, for example, to find out how our motorised antenna moves from HIPASAT 30.0W to INTELSAT12 45.0E. The waterfall dia-gram shows all passed satellites, which is an easy way of checking whether all positions are already stored in the sat-ellite receiver.
Image 4 shows a rather different ap-plication for a waterfall diagram. In this scenario the antenna alignment (HIS-PASAT 30.0W in our case) is optimised. While a conventional spectrum display can be used to perfectly align an an-tenna using the peak level feature, a waterfall diagram can achieve the same result with much less hassle.
Seen from top to bottom the weak red colours show somewhat mediocre reception quality of HISPASAT. When the antenna is moved slightly towards the East the signal becomes weaker, which is why the antenna is then ro-tated in the opposite direction with the signal becoming stronger, reaching its peak level and decreasing again. All
this is shown with a time element and since it is always possible to compare any current value with preceding val-ues finding the perfect alignment be-comes child’s play. In the lower image segment you can easily see for yourself how strong the signal is with perfect antenna alignment.
For real-time measurement the 8dtek Xtra-S turned out to be a perfect com-panion. The spectrum builds up very quickly on this meter, which is a huge benefit. Unfortunately, however, the display resolution is rather low, as can be seen on images 3 and 4. 8dtek went for higher resolutions with their Gifted and Desired models, although at re-duced speed. This is why those two
models cannot be used for creating wa-terfall diagrams to document antenna alignment and rotation. For long-term measurement, on the other hand, they are perfect. Such measurements are primarily performed to find out if or why a signal has occasional errors.
Image 6 presents the result of a long-term measurement focusing on two transponders on HISPASAT. No er-rors can be seen on this measurement, since only a period of one minute was analysed. With our software it is of course possible to vastly extend that period – all you need to do is select a time between one second and ten min-utes instead of real-time. If you select ten minutes, for example, every line
of the waterfall diagram corresponds to a spectrum measurement after ten minutes each. This allows documenting the entire frequency range of a satellite over a period of 24 hours. The individu-al colours indicate any signal deviation across the entire spectrum.
Looking at the Xtra-S, Gifted and De-sired satellite meters by manufacturer 8dtek from many different perspectives our respect and admiration for those neat devices was growing all the time. It’s hard to believe how many features and functions can be packed into such small meters. Battery life also never failed to impress: Three to four hours
8 9
10
11
238 TELE-satellite International — The World‘s Largest Digital TV Trade Magazine — 12-01/2012 — www.TELE-satellite.com
of continuous use was the rule rather than the exception.
Have we raised your interest? Simply go to www.TELE-satellite.com/water-fall-for-8dtek.zip to download our soft-ware from the TELE-satellite server. Of course you also need an 8dtek satellite meter as well as a TV card or USB video grabber.
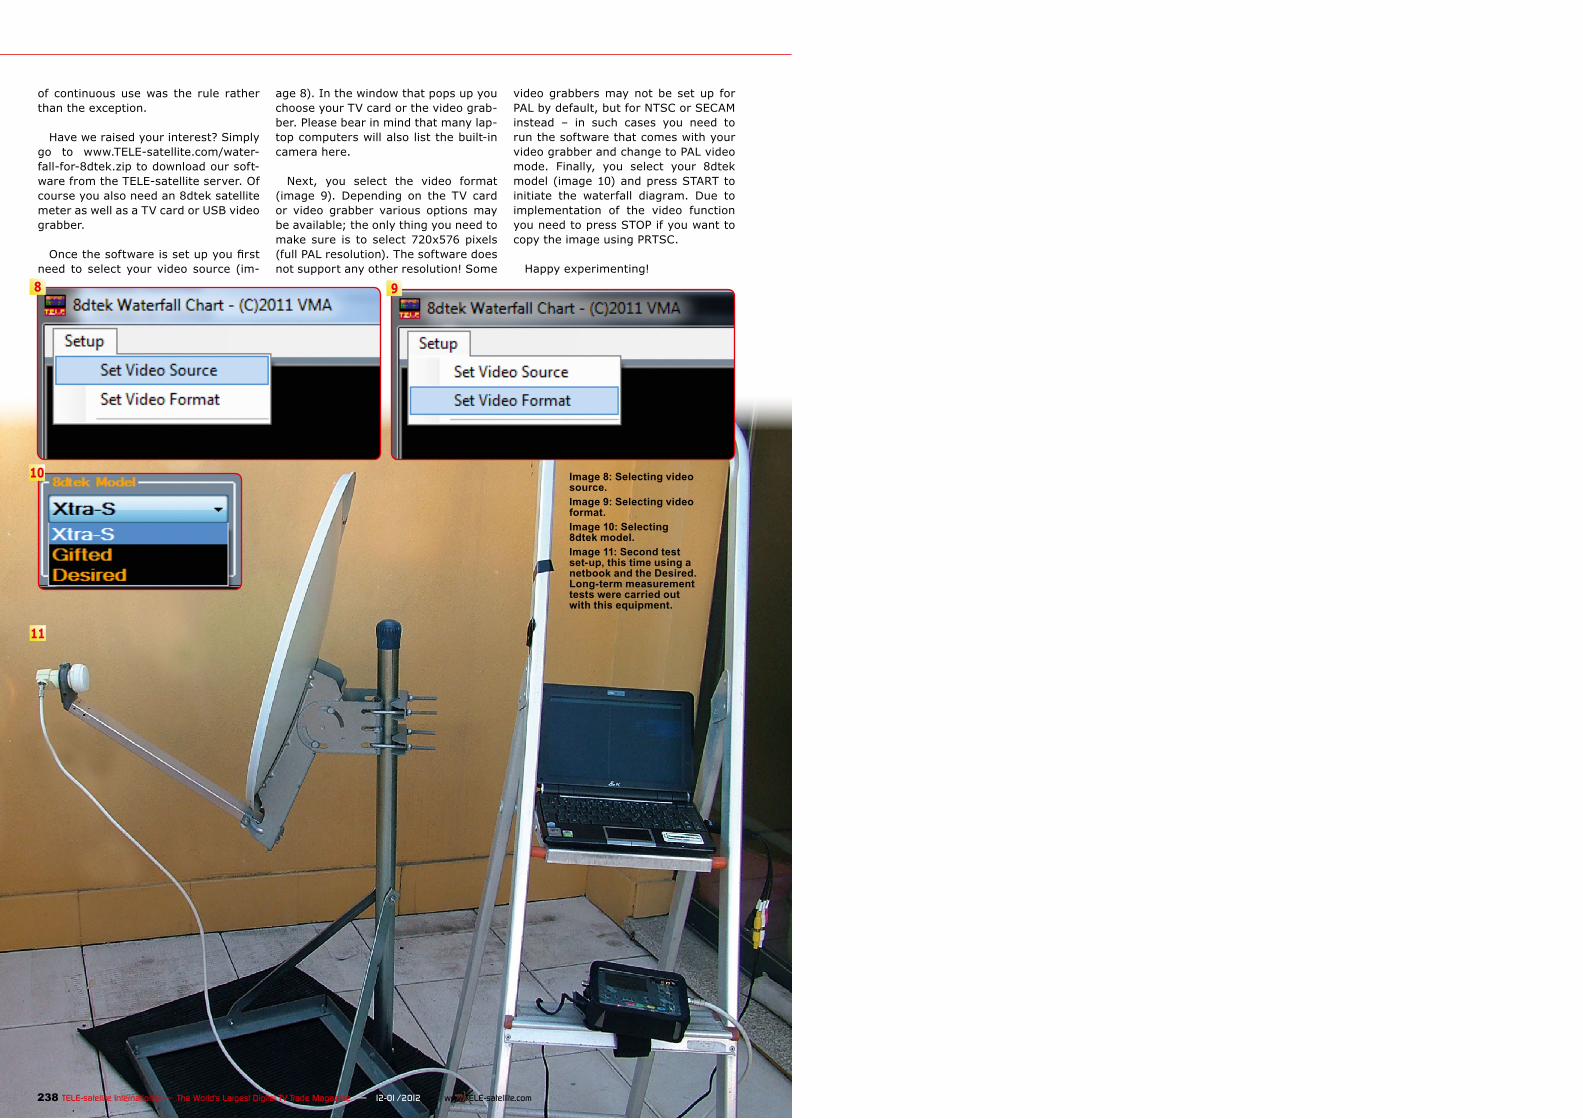
Once the software is set up you first need to select your video source (im-
age 8). In the window that pops up you choose your TV card or the video grab-ber. Please bear in mind that many lap-top computers will also list the built-in camera here.
Next, you select the video format (image 9). Depending on the TV card or video grabber various options may be available; the only thing you need to make sure is to select 720x576 pixels (full PAL resolution). The software does not support any other resolution! Some
video grabbers may not be set up for PAL by default, but for NTSC or SECAM instead – in such cases you need to run the software that comes with your video grabber and change to PAL video mode. Finally, you select your 8dtek model (image 10) and press START to initiate the waterfall diagram. Due to implementation of the video function you need to press STOP if you want to copy the image using PRTSC.
Happy experimenting!
Image 8: Selecting video source.Image 9: Selecting video format.Image 10: Selecting 8dtek model.Image 11: Second test set-up, this time using a netbook and the Desired. Long-term measurement tests were carried out with this equipment.