880 BROADWAY - LoopNet
4
www.ngkf.com 880 BROADWAY Retail For Lease 880 Broadway | Chula Vista, CA 91911 4655 Executive Drive, Suite 800, San Diego, CA 92121 T 858.875.3600 Corporate CA RE #01355491 For further information, please contact our exclusive agents: JUSTIN WESSEL Associate 858.875.5929 [email protected] CA RE License #01946177 JOHN JENNINGS Senior Managing Director 858.875.5927 [email protected] CA RE License #01215740 Retail 8,488 Square Feet Available Description • Excellent retail or showroom opportunity. • Great exposure and signage to Broadway with 31 on-site parking stalls. • Located just half a mile east of Interstate 5 which boasts a traffic count of over 159,000 average cars per day. • Located less than one mile south of Chula Vista Center, which includes major anchor tenants such as Sears, JCPenney, Macy’s and UltraStar Cinemas. • Trade area includes such notable tenants as Costco, Walmart, Target, Petco and many more. Traffic Count (SANDAG, 2013) • 27,500 Average Daily Traffic on Broadway. • 15,300 Average Daily Traffic on L Street. Demographics (ESRI, 2016) 1 MILE 3 MILES 5 MILES Population 2016 27,397 162,149 398,833 Population 2021 28,849 170,614 419,400 Average H.H. Income $52,834 $61,224 $67,027 Daytime Population 14,215 52,607 110,246
Transcript of 880 BROADWAY - LoopNet

www.ngkf.com
880 BROADWAY Retail For Lease880 Broadway | Chula Vista, CA 91911
4655 Executive Drive, Suite 800, San Diego, CA 92121 T 858.875.3600 Corporate CA RE #01355491
For further information, please contact our exclusive agents:
JUSTIN WESSEL Associate 858.875.5929 [email protected] CA RE License #01946177
JOHN JENNINGS Senior Managing Director 858.875.5927 [email protected] CA RE License #01215740
Retail
8,488 Square Feet AvailableDescription• Excellent retail or showroom opportunity.
• Great exposure and signage to Broadway with 31 on-site parking stalls.
• Located just half a mile east of Interstate 5 which boasts a traffic count of over 159,000 average cars per day.
• Located less than one mile south of Chula Vista Center, which includes major anchor tenants such as Sears, JCPenney, Macy’s and UltraStar Cinemas.
• Trade area includes such notable tenants as Costco, Walmart, Target, Petco and many more.
Traffic Count (SANDAG, 2013)
• 27,500 Average Daily Traffic on Broadway.
• 15,300 Average Daily Traffic on L Street.
Demographics (ESRI, 2016)
1 MILE 3 MILES 5 MILESPopulation 2016 27,397 162,149 398,833Population 2021 28,849 170,614 419,400Average H.H. Income $52,834 $61,224 $67,027Daytime Population 14,215 52,607 110,246

Procuring broker shall only be entitled to a commission, calculated in accordance with the rates approved by our principal only if such procuring broker executes a brokerage agreement acceptable to us and our principal and the conditions as set forth in the bro-kerage agreement are fully and unconditionally satisfied. Although all information furnished regarding property for sale, rental, or financing is from sources deemed reliable, such information has not been verified and no express representation is made nor is any to be implied as to the accuracy thereof and it is submitted subject to errors, omissions, change of price, rental or other conditions, prior sale, lease or financing, or withdrawal without notice and to any special conditions imposed by our principal.
www.ngkf.com
Retail
4655 Executive Drive, Suite 800, San Diego, CA 92121 T 858.875.3600 Corporate CA RE #01355491
880 BROADWAY Retail For Lease880 Broadway | Chula Vista, CA 91911
CONTACT:
JUSTIN WESSEL Associate 858.875.5929 [email protected] CA RE License #01946177
JOHN JENNINGS Senior Managing Director 858.875.5927 [email protected] CA RE License #01215740
8,488 SFAVAILABLE
60’-8”
119’
-4” 24’-0”
46’-0
”
70’-1
0.5”

www.ngkf.com
880 BROADWAY Retail For Lease880 Broadway | Chula Vista, CA 91911
4655 Executive Drive, Suite 800, San Diego, CA 92121 T 858.875.3600 Corporate CA RE #01355491
For further information, please contact our exclusive agents:
JUSTIN WESSEL Associate 858.875.5929 [email protected] CA RE License #01946177
JOHN JENNINGS Senior Managing Director 858.875.5927 [email protected] CA RE License #01215740
Retail
San DiegoCountry Club
San Diego Bay
SITE: 880 Broadway
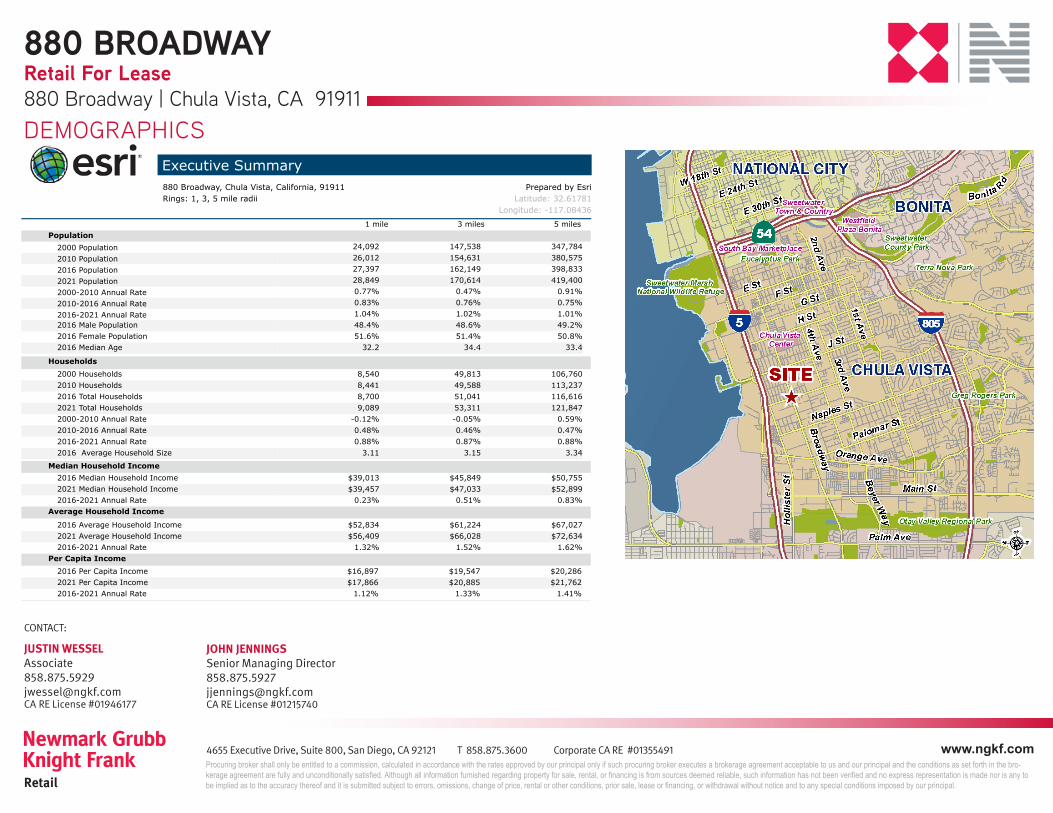
Executive Summary880 Broadway, Chula Vista, California, 91911 Prepared by EsriRings: 1, 3, 5 mile radii Latitude: 32.61781
Longitude: -117.08436
1 mile 3 miles 5 milesMedian Household Income
2016 Median Household Income $39,013 $45,849 $50,7552021 Median Household Income $39,457 $47,033 $52,8992016-2021 Annual Rate 0.23% 0.51% 0.83%
Average Household Income
2016 Average Household Income $52,834 $61,224 $67,0272021 Average Household Income $56,409 $66,028 $72,6342016-2021 Annual Rate 1.32% 1.52% 1.62%
Per Capita Income2016 Per Capita Income $16,897 $19,547 $20,2862021 Per Capita Income $17,866 $20,885 $21,7622016-2021 Annual Rate 1.12% 1.33% 1.41%
Households by IncomeCurrent median household income is $50,755 in the area, compared to $54,149 for all U.S. households. Median household income is projected to be $52,899 in five years, compared to $59,476 for all U.S. households
Current average household income is $67,027 in this area, compared to $77,008 for all U.S. households. Average household income is projected to be $72,634 in five years, compared to $84,021 for all U.S. households
Current per capita income is $20,286 in the area, compared to the U.S. per capita income of $29,472. The per capita income is projected to be $21,762 in five years, compared to $32,025 for all U.S. households Housing
2000 Total Housing Units 8,659 51,408 110,1482000 Owner Occupied Housing Units 2,987 23,347 53,2862000 Renter Occupied Housing Units 5,553 26,466 53,4742000 Vacant Housing Units 119 1,595 3,388
2010 Total Housing Units 8,810 52,643 119,7442010 Owner Occupied Housing Units 2,710 22,009 54,5282010 Renter Occupied Housing Units 5,731 27,579 58,7092010 Vacant Housing Units 369 3,055 6,507
2016 Total Housing Units 9,103 54,443 123,8992016 Owner Occupied Housing Units 2,619 21,699 54,0832016 Renter Occupied Housing Units 6,081 29,342 62,5322016 Vacant Housing Units 403 3,402 7,283
2021 Total Housing Units 9,516 56,881 129,3992021 Owner Occupied Housing Units 2,696 22,442 56,2432021 Renter Occupied Housing Units 6,392 30,869 65,6042021 Vacant Housing Units 427 3,570 7,552
Currently, 43.7% of the 123,899 housing units in the area are owner occupied; 50.5%, renter occupied; and 5.9% are vacant. Currently, in the U.S., 55.4% of the housing units in the area are owner occupied; 32.9% are renter occupied; and 11.7% are vacant. In 2010, there were 119,744 housing units in the area - 45.5% owner occupied, 49.0% renter occupied, and 5.4% vacant. The annual rate of change in housing units since 2010 is 1.53%. Median home value in the area is $365,085, compared to a median home value of $198,891 for the U.S. In five years, median value is projected to change by 3.60% annually to $435,616.
Data Note: Income is expressed in current dollarsSource: U.S. Census Bureau, Census 2010 Summary File 1. Esri forecasts for 2016 and 2021. Esri converted Census 2000 data into 2010 geography.
July 26, 2016
©2016 Esri Page 2 of 2
Procuring broker shall only be entitled to a commission, calculated in accordance with the rates approved by our principal only if such procuring broker executes a brokerage agreement acceptable to us and our principal and the conditions as set forth in the bro-kerage agreement are fully and unconditionally satisfied. Although all information furnished regarding property for sale, rental, or financing is from sources deemed reliable, such information has not been verified and no express representation is made nor is any to be implied as to the accuracy thereof and it is submitted subject to errors, omissions, change of price, rental or other conditions, prior sale, lease or financing, or withdrawal without notice and to any special conditions imposed by our principal.
DEMOGRAPHICSExecutive Summary880 Broadway, Chula Vista, California, 91911 Prepared by EsriRings: 1, 3, 5 mile radii Latitude: 32.61781
Longitude: -117.08436
1 mile 3 miles 5 milesPopulation
2000 Population 24,092 147,538 347,7842010 Population 26,012 154,631 380,5752016 Population 27,397 162,149 398,8332021 Population 28,849 170,614 419,4002000-2010 Annual Rate 0.77% 0.47% 0.91%2010-2016 Annual Rate 0.83% 0.76% 0.75%2016-2021 Annual Rate 1.04% 1.02% 1.01%2016 Male Population 48.4% 48.6% 49.2%2016 Female Population 51.6% 51.4% 50.8%2016 Median Age 32.2 34.4 33.4
In the identified area, the current year population is 398,833. In 2010, the Census count in the area was 380,575. The rate of change since 2010 was 0.75% annually. The five-year projection for the population in the area is 419,400 representing a change of 1.01% annually from 2016 to 2021. Currently, the population is 49.2% male and 50.8% female.
Median Age
The median age in this area is 32.2, compared to U.S. median age of 38.0.Race and Ethnicity
2016 White Alone 53.3% 55.8% 51.4%2016 Black Alone 4.5% 3.8% 4.4%2016 American Indian/Alaska Native Alone 0.9% 0.9% 0.8%2016 Asian Alone 4.6% 6.6% 12.1%2016 Pacific Islander Alone 0.6% 0.5% 0.6%2016 Other Race 30.7% 27.1% 25.2%2016 Two or More Races 5.2% 5.3% 5.5%2016 Hispanic Origin (Any Race) 76.4% 71.0% 65.8%
Persons of Hispanic origin represent 65.8% of the population in the identified area compared to 17.9% of the U.S. population. Persons of Hispanic Origin may be of any race. The Diversity Index, which measures the probability that two people from the same area will be from different race/ethnic groups, is 84.6 in the identified area, compared to 63.5 for the U.S. as a whole.
Households2000 Households 8,540 49,813 106,7602010 Households 8,441 49,588 113,2372016 Total Households 8,700 51,041 116,6162021 Total Households 9,089 53,311 121,8472000-2010 Annual Rate -0.12% -0.05% 0.59%2010-2016 Annual Rate 0.48% 0.46% 0.47%2016-2021 Annual Rate 0.88% 0.87% 0.88%2016 Average Household Size 3.11 3.15 3.34
The household count in this area has changed from 113,237 in 2010 to 116,616 in the current year, a change of 0.47% annually. The five-year projection of households is 121,847, a change of 0.88% annually from the current year total. Average household size is currently 3.34, compared to 3.28 in the year 2010. The number of families in the current year is 90,981 in the specified area.
Data Note: Income is expressed in current dollarsSource: U.S. Census Bureau, Census 2010 Summary File 1. Esri forecasts for 2016 and 2021. Esri converted Census 2000 data into 2010 geography.
July 26, 2016
©2016 Esri Page 1 of 2
Executive Summary880 Broadway, Chula Vista, California, 91911 Prepared by EsriRings: 1, 3, 5 mile radii Latitude: 32.61781
Longitude: -117.08436
1 mile 3 miles 5 milesPopulation
2000 Population 24,092 147,538 347,7842010 Population 26,012 154,631 380,5752016 Population 27,397 162,149 398,8332021 Population 28,849 170,614 419,4002000-2010 Annual Rate 0.77% 0.47% 0.91%2010-2016 Annual Rate 0.83% 0.76% 0.75%2016-2021 Annual Rate 1.04% 1.02% 1.01%2016 Male Population 48.4% 48.6% 49.2%2016 Female Population 51.6% 51.4% 50.8%2016 Median Age 32.2 34.4 33.4
In the identified area, the current year population is 398,833. In 2010, the Census count in the area was 380,575. The rate of change since 2010 was 0.75% annually. The five-year projection for the population in the area is 419,400 representing a change of 1.01% annually from 2016 to 2021. Currently, the population is 49.2% male and 50.8% female.
Median Age
The median age in this area is 32.2, compared to U.S. median age of 38.0.Race and Ethnicity
2016 White Alone 53.3% 55.8% 51.4%2016 Black Alone 4.5% 3.8% 4.4%2016 American Indian/Alaska Native Alone 0.9% 0.9% 0.8%2016 Asian Alone 4.6% 6.6% 12.1%2016 Pacific Islander Alone 0.6% 0.5% 0.6%2016 Other Race 30.7% 27.1% 25.2%2016 Two or More Races 5.2% 5.3% 5.5%2016 Hispanic Origin (Any Race) 76.4% 71.0% 65.8%
Persons of Hispanic origin represent 65.8% of the population in the identified area compared to 17.9% of the U.S. population. Persons of Hispanic Origin may be of any race. The Diversity Index, which measures the probability that two people from the same area will be from different race/ethnic groups, is 84.6 in the identified area, compared to 63.5 for the U.S. as a whole.
Households2000 Households 8,540 49,813 106,7602010 Households 8,441 49,588 113,2372016 Total Households 8,700 51,041 116,6162021 Total Households 9,089 53,311 121,8472000-2010 Annual Rate -0.12% -0.05% 0.59%2010-2016 Annual Rate 0.48% 0.46% 0.47%2016-2021 Annual Rate 0.88% 0.87% 0.88%2016 Average Household Size 3.11 3.15 3.34
The household count in this area has changed from 113,237 in 2010 to 116,616 in the current year, a change of 0.47% annually. The five-year projection of households is 121,847, a change of 0.88% annually from the current year total. Average household size is currently 3.34, compared to 3.28 in the year 2010. The number of families in the current year is 90,981 in the specified area.
Data Note: Income is expressed in current dollarsSource: U.S. Census Bureau, Census 2010 Summary File 1. Esri forecasts for 2016 and 2021. Esri converted Census 2000 data into 2010 geography.
July 26, 2016
©2016 Esri Page 1 of 2
Retail
www.ngkf.com
CONTACT:
JUSTIN WESSEL [email protected] RE License #01946177
JOHN JENNINGS Senior Managing Director 858.875.5927 [email protected] CA RE License #01215740
4655 Executive Drive, Suite 800, San Diego, CA 92121 T 858.875.3600 Corporate CA RE #01355491
880 BROADWAY Retail For Lease880 Broadway | Chula Vista, CA 91911