8.1 AIR QUALITY - Environmental Protection Agency By Appeal... · Nitrogen Annual Average 0.030 ppm...
95
Transcript of 8.1 AIR QUALITY - Environmental Protection Agency By Appeal... · Nitrogen Annual Average 0.030 ppm...


8.1 AIR QUALITY
8.1-2 PO062006001SAC/344005/062570015 (HBRP_008-1-REVSEP07.DOC)
The terrain in the vicinity of the Humboldt Bay Power Plant rises rapidly from the bay on the north side to an elevation of approximately 69 feet mean lower low water (MLLW) at Buhne Point peninsula. Terrain to the north and east of the site is generally flat. To the south and east, the terrain rises rapidly, forming Humboldt Hill, which reaches an elevation of over 500 feet within 2 miles of the project and is the site of several small neighborhoods. Humboldt County is mostly mountainous except for the level plain that surrounds Humboldt Bay. The coastal hills surrounding Humboldt Bay begin with Patrick’s Point, 30 miles to the north, then extend to the southeast, then to the southwest, ending in Cape Mendocino, 23 miles from the site. The tops of these hills range from 1,500 to 2,500 feet, with the highest point (Kings Peak) reaching 4,087 feet, 40 miles directly south of Eureka. These hills greatly modify the rainfall and temperatures of the region by creating a rain shadow and sheltering the region from the brunt of the heavier rainfall and temperature extremes. Figure 8.1-1 shows elevations and topography within 6 miles of the project site.
The project site is in the North Coast Unified Air Quality Management District (NCUAQMD), which in turn is part of the North Coast Air Basin.
8.1.1.2 Climate and Meteorology The climate of the greater Humboldt Bay region, including Eureka and the immediate coastal strip where the project site is located, is characterized as Mediterranean. Summers have little or no rainfall and low overcast and fog are frequently observed. Winters are wet, with frequent passage of Pacific storms, and temperatures are mild.
The overall climate at the project site is dominated by the semi-permanent eastern Pacific high pressure system centered off the coast of California. This high pressure system is centered between the 140° west (W) and 150° W meridians, and oscillates in a north-south direction. Its position governs California’s weather. In the summer, the high pressure system moves to its northernmost position, which results in strong northwesterly flows and negligible precipitation.
In the winter, the high pressure system moves southwestward toward Hawaii, which allows storms originating in the Gulf of Alaska to reach northern California, bringing wind and rain. As winter storms move in from the Pacific and Gulf of Alaska, the prefrontal winds are generally from the southeast to southwest. Over the Humboldt Bay area, the hills generally deflect these winds south to southeast. After frontal passage, the winds are generally from the north to northwest. During the rainy season, generally November through March, Eureka receives 75 percent of its average rainfall, with most of the rain falling during December and January. The average annual rainfall over the 100-year period of record is 38.87 inches. This is one of the lowest averages in northwest California and is caused by a rain shadow due to the surrounding hills and minimal uplifting along the immediate west-facing beaches. PM10 and PM2.5 (particulate matter with aerodynamic diameter less than or equal to 10 and 2.5 microns, respectively) levels are highest during the late fall and winter. Colder, more stagnant conditions during this time of the year are conducive to the buildup of PM, including the formation of secondary ammonium nitrate. In addition, increased emissions from residential fireplaces and wood stoves during this time of year contribute to increased direct particulate emissions.

Humboldt Bay PowerPlant Location
Pacific Ocean
FIGURE 8.1-1ELEVATION WITHIN SIX MILESOF THE PROJECT SITEHUMBOLDT BAY REPOWERING PROJECT
Scale: 1:112800
0 9,4004,700Feet
LEGENDHumboldt Bay Power Plant Boundary
6-Mile Buffer
Elevation in Meters0 - 100
100 - 150
151 - 200
201 - 250
251 - 300
301+
SAC \\GLACIER\PROJ\342077_HUMBOLDTBAY\MXDS\ELEVATION.MXD ELEVATION.PDF 9/19/2006 12:28:17
Humboldt Bay PowerPlant Location
Pacific Ocean
FIGURE 8.1-1ELEVATION WITHIN SIX MILESOF THE PROJECT SITEHUMBOLDT BAY REPOWERING PROJECT
Scale: 1:112800
0 9,4004,700Feet
LEGENDHumboldt Bay Power Plant Boundary
6-Mile Buffer
Elevation in Meters0 - 100
100 - 150
151 - 200
201 - 250
251 - 300
301+
PO062006001SAC figure_8.1-1.ai 09/22/06 sbm

8.1 AIR QUALITY
PO062006001SAC/344005/062570015 (HBRP_008-1-REVSEP07.DOC) 8.1-4
The average annual temperature is 52 degrees Fahrenheit (°F). The average July temperature is 56°F; winter temperatures average 48°F in January.1
Air quality is determined primarily by the type and amount of pollutants emitted into the atmosphere, the topography of the air basin, and local meteorological conditions. The predominant winds in California are shown in Figures 8.1B-1A through 8.1B-1D, Appendix 8.1B. As indicated in the figures, winds in California generally are light and easterly in the winter, but strong and westerly in the spring, summer, and fall.
Quarterly wind roses and wind frequency distribution tables are provided in Appendix 8.1. Wind patterns at the project site can be seen in Figures 8.1B-2A through 8.1B-6E, which show quarterly and annual wind roses for meteorological data collected at the Woodley Island meteorological station during 2001 through 2005. The annual wind rose for 2005 is shown as Figure 8.1-2. The wind roses show that the winds are variable, with up to 25 percent calm conditions, and on an annual basis, predominantly from the north and south. Winds are predominantly from the north and south during the first quarter, from the north during the second quarter, and from the south during the fourth quarter. Northwesterly and westerly winds appear during the third quarter but are mostly absent during the other quarters.
The mixing heights of the area are affected by the eastern Pacific high pressure system and marine influences. Often, the base of the inversion is found at the top of a layer of marine air, because the marine environment is cooler. Smith et al. (1984) reported that at Oakland, the nearest representative upper-level meteorological station (located 235 miles southeast of the project site), 50th percentile morning mixing heights for the period 1979-1980 were on the order of 1,770 feet (530 to 550 meters) in summer and fall, and 3,600 to 3,900 feet (1,100 to 1,200 meters) in winter and spring. The 50th percentile afternoon mixing heights ranged from 2,150 to 3,030 feet (660 to 925 meters) in summer and fall and over 3,900 feet (over 1,200 meters) in winter and spring. Such mixing heights provide generally favorable conditions for the dispersion of pollutants. Inland areas, where marine influence is weaker, often experience strong ground-based inversions during cold weather periods. These inversions, which inhibit dispersion of low-lying sources of air pollution such as cars and trucks and can result in high pollutant concentrations, are largely absent in coastal areas such as Eureka.
8.1.1.3 Criteria Pollutants and Air Quality Trends 8.1.1.3.1 State and National Ambient Air Quality Standards The U.S. Environmental Protection Agency (USEPA) has established national ambient air quality standards (NAAQS) for ozone, nitrogen dioxide (NO2), CO, sulfur dioxide (SO2), PM10, PM2.5, and airborne lead. Areas with air pollution levels above these standards can be considered “nonattainment areas” subject to planning and pollution control requirements that are more stringent than standard requirements.
In addition, the California Air Resources Board (CARB) has established standards for ozone, CO, NO2, SO2, sulfates, PM10, airborne lead, hydrogen sulfide, and vinyl chloride at levels designed to protect the most sensitive members of the population, particularly children, the elderly, and people who suffer from lung or heart diseases.
Both state and national air quality standards consist of two parts: an allowable concentration of a pollutant, and an averaging time over which the concentration is to be measured. 1 Eureka, CA NWS

8.1 AIR QUALITY
PO062006001SAC/344005/062570015 (HBRP_008-1-REVSEP07.DOC) 8.1-5
Allowable concentrations are based on the results of studies of the effects of the pollutants on human health, crops and vegetation, and, in some cases, damage to paint and other materials. The averaging times are based on whether the damage caused by the pollutant is more likely to occur during exposures to a high concentration for a short time (1 hour, for instance), or to a relatively lower average concentration over a longer period (8 hours, 24 hours, or 1 month). For some pollutants there is more than one air quality standard, reflecting both short-term and long-term effects. Table 8.1-1 presents the NAAQS and California ambient air quality standards for selected pollutants. The California standards are generally set at concentrations much lower than the federal standards and in some cases have shorter averaging periods.
TABLE 8.1-1 Ambient Air Quality Standards
Pollutant Averaging Time California National
1 hour 0.09 ppm — Ozone 8 hours 0.070 ppm 0.08 ppm
(3-year average of annual 4th-highest daily maximum)
8 hours 9.0 ppm 9 ppm Carbon Monoxide 1 hour 20 ppm 35 ppm
Annual Average 0.030 ppm 0.053 ppm Nitrogen Dioxide 1 hour 0.18 ppm –
Annual Average – 80 µg/m3
(0.03 ppm) 24 hours 0.04 ppm
(105 µg/m3) 365 µg/m3
(0.14 ppm) 3 hours – 1,300a µg/m3
(0.5 ppm)
Sulfur Dioxide
1 hour 0.25 ppm – Annual Arithmetic Mean 20 µg/m3 -- Suspended
Particulate Matter (10 Micron) 24 hours 50 µg/m3 150 µg/m3
Annual Arithmetic Mean 12 µg/m3 15 µg/m3
(3-year average) Suspended Particulate Matter (2.5 Micron) 24 hours – 35 µg/m3
(3-year average of 98th percentiles)
Sulfates 24 hours 25 µg/m3 – 30 days 1.5 µg/m3 – Lead
Calendar Quarter – 1.5 µg/m3 Hydrogen Sulfide 1 hours 0.03 ppm – Vinyl Chloride 24 hours 0.010 ppm – Visibility Reducing Particles
8 hours (10am to 6pm PST)
In sufficient amount to produce an extinction coefficient of 0.23 per kilometer due to particles when the relative humidity is less than 70 percent.
–
Notes: a This is a national secondary standard, which is designed to protect public welfare. ppm = parts per million µg/m3 = micrograms per cubic meter
Deleted: –
Deleted: 0.25
Deleted: 50 µg/m3
Deleted: 65

8.1 AIR QUALITY
8.1-6 PO062006001SAC/344005/062570015 (HBRP_008-1-REVSEP07.DOC)
FIGURE 8.1-2 2005 Annual Wind Rose, Woodley Island, CA
WRPLOT View - Lakes Environmental Software
WIND ROSE PLOT:
Woodley Island, CA - 2005January 1, 2005 through December 31, 2005
COMMENTS: COMPANY NAME:
MODELER:
DATE:
7/14/2006
PROJECT NO.:
NORTH
SOUTH
WEST EAST
4%
8%
12%
16%
20%
WIND SPEED (m/s)
>= 11.1
8.8 - 11.1
5.7 - 8.8
3.6 - 5.7
2.1 - 3.6
0.5 - 2.1
Calms: 23.94%
TOTAL COUNT:
8760 hrs.
CALM WINDS:
23.94%
DATA PERIOD:
2005 Jan 1 - Dec 3100:00 - 23:00
AVG. WIND SPEED:
2.09 m/s
DISPLAY:
Wind SpeedDirection (blowing from)

8.1 AIR QUALITY
PO062006001SAC/344005/062570015 (HBRP_008-1-REVSEP07.DOC) 8.1-7
8.1.1.3.2 Ambient Monitoring Stations To characterize existing air quality at the project site, ambient air quality readings were taken from nearby air monitoring stations in Eureka and at Trinidad Head, as well as more distant stations in Willits, Ukiah, and San Francisco. 23 The Eureka station, which is 6 miles northeast of the project site, is operated by the NCUAQMD. This station was chosen because of its proximity to the project site. The Eureka station collects data only for particulate matter.4 The Trinidad Head station, approximately 24 miles north of the project site, is operated by the National Oceanic and Atmospheric Administration (NOAA) as a special project site and measures surface ozone concentrations. This station has been in operation only since April 2002; therefore, the Willits and Ukiah station data were also used because they are the closest stations in the North Coast Air Basin that measure long-term ozone, NO2, and CO levels. Willits is 90 miles to the south of Eureka, and 30 miles inland. Ukiah is 110 miles to the south of Eureka, and 30 miles inland. For each gaseous pollutant, data for both stations are provided. For each pollutant, the data set from the station with the highest maximum relevant concentration was used for the impact analysis. The Arkansas Street station in San Francisco is the closest station on the Pacific coast that measures SO2. San Francisco is 210 miles south of Eureka. The limited data available for Ukiah and Willits are also presented for comparison.
All ambient air quality data presented in this section were taken from CARB, USEPA, and NOAA publications and data sources.
The NCUAQMD’s attainment status is “nonattainment” for the state 24-hour and annual PM10 ambient air quality standards. NCUAQMD’s status for all other pollutants is either “attainment” or “unclassified.”
8.1.1.3.3 Ozone Ozone is generated by a complex series of chemical reactions between reactive organic compounds (ROC) and NOx in the presence of ultraviolet radiation. Ambient ozone concentrations tend to follow a seasonal pattern: higher in the summertime and lower in the wintertime. The general area lacks most of the conditions that lead to the formation of ozone: persistent temperature inversions, clear skies, mountain ranges that trap the air mass, and exhaust emissions from millions of vehicles and stationary sources. Because the area lacks these conditions, ozone levels are not currently monitored by local or state air regulatory agencies in the vicinity of the project. Based upon ambient air measurements at stations in the southern part of the basin, the North Coast Air Basin is classified as an attainment area for ozone.
Ozone data have been collected closer to the project site by other agencies and in previous years. NOAA began collecting surface ozone data in 2002 as part of its Earth System Research Laboratory (ESRL) Global Monitoring Division (GMD). NOAA states that “[m]uch of the time the site experiences baseline conditions, but it also allows for the monitoring of regionally influenced air, affected mainly by forested lands, but to a lesser extent, air having 2 A more extensive discussion of why the data from these stations are considered to be representative of air quality in the vicinity of the proposed project is provided in Section 8.1.5.2.1.1. 3 The ozone tables and charts in this section have been updated with 2006 data. Updated 2006 data for the other pollutants is presented in Table 8.1-25. 4 The District established a second monitoring station in Eureka in December 2006 that monitors gaseous pollutants. However, there is not enough data available from that monitor to establish trends so those data are not included here.
Deleted: P

8.1 AIR QUALITY
8.1-8 PO062006001SAC/344005/062570015 (HBRP_008-1-REVSEP07.DOC)
a small urban influence.”5 Ozone was also monitored in Eureka from late 1990 through early 1992 and in Redwood National Park (about 42 miles north of the project site) through mid-1995. All of the data collected at these locations show higher ozone concentrations in the winter months, rather than the summer months. Because the higher ozone concentrations occur in the absence of conditions that would cause the formation of photochemical ozone, this indicates that the ozone in the Eureka area is not primarily photochemical but is mostly natural background or, under certain conditions, is related to stratospheric ozone intrusion.
Table 8.1-2 shows the annual maximum hourly ozone levels recorded at the Willits and Ukiah monitoring stations during the period 1997-2006, and at the Trinidad Head monitoring station during the period 2002-2006. No exceedances of the state and federal standards have been observed during this period. Maximum ozone concentrations at the Willits and Ukiah stations usually are recorded during the summer months; maximum concentrations at Trinidad Head are generally observed during the winter and spring.
TABLE 8.1-2 Ozone Levels at the Willits Monitoring Station, 1997-2006 (ppm)
1996 1997 1998 1999 2000 2001 2002 2003 2004 2005
Highest 1-Hour Average 0.065 0.070 0.066 0.054 0.062 0.086 0.090 0.060 0.067 0.058
Highest 8-Hour Average 0.058 0.059 0.059 0.046 0.047 0.057 0.055 0.048 0.050 0.052
Ozone Levels at the Ukiah Monitoring Station, 1997-2006 (ppm)
Highest 1-Hour Average 0.071 0.090 0.079 0.071 0.070 0.092 0.078 0.070 0.088 0.081
Highest 8-Hour Average 0.061 0.071 0.069 0.059 0.055 0.072 0.066 0.056 0.060 0.069
Ozone Levels at Trinidad Head, 2002-2006 (ppm)
Highest 1-Hour Average * * * * * 0.052 0.064 0.063 0.057 0.066
Highest 8-Hour Average * * * * * 0.050 0.060 0.058 0.055 *
Notes: Source: California Air Quality Data, California Air Resources Board website; USEPA AIRData website; NOAA website. * There were insufficient (or no) data available to determine the value.
The long-term trends of maximum 1-hour ozone readings are shown in Figure 8.1-3 for the Willits, Ukiah, and Trinidad Head monitoring stations. The data show that the state and federal ozone air quality standards have not been exceeded in the area in the past 10 years. Trends of maximum and 3-year average of the 4th highest daily concentrations of 8-hour average ozone readings at the Willits and Ukiah stations are shown in Figure 8.1-4. These levels are well below the federal 8-hour average standard. USEPA has designated the North Coast Air Basin as an attainment area for the 1-hour federal standard; CARB has requested an initial designation of attainment for the North Coast Air Basin for the 8-hour federal ozone standard.
5 NOAA ESRL GMD Trinidad Head monitoring website, http://www.cmdl.noaa.gov/obop/thd.
Deleted: 6…5…5
Deleted: 0.058
Deleted: 0.049
Deleted: 6…5
Deleted: 0.055
Deleted: 0.046
Deleted: 5
Deleted: *
... [2]
... [3]
... [1]
... [5]
... [6]
... [4]
... [7]

8.1 AIR QUALITY
PO062006001SAC/344005/062570015 (HBRP_008-1-REVSEP07.DOC) 8.1-9
0.00
0.02
0.04
0.06
0.08
0.10
0.12
0.14
1993 1994 1995 1996 1997 1998 1999 2000 2001 2002 2003 2004 2005 2006
Calendar Year
Ozo
ne (p
arts
per
mill
ion)
Willits Max Hourly ConcentrationWillits 3-Year AverageUkiah Max Hourly ConcentrationUkiah 3-Year AverageTrinidad Head Max Hourly ConcentrationTrinidad Head 3-Year AverageCalifornia Standard
FIGURE 8.1-3 Maximum 1-hour Ozone Levels: Willits, Ukiah and Trinidad Head: 1993-2006
0.00
0.02
0.04
0.06
0.08
0.10
0.12
1993 1994 1995 1996 1997 1998 1999 2000 2001 2002 2003 2004 2005 2006
Calendar Year
Ozo
ne (p
arts
per
mill
ion)
Willits Max 8-Hour ConcentrationWillits 3-Year Average 4th HighUkiah Max 8-Hour ConcentrationUkiah 3-Year Average 4th HighTrinidad Head Max 8-Hour ConcentrationFederal StandardCalifornia Standard
FIGURE 8.1-4 Maximum 8-hour Ozone Levels: Willits, Ukiah and Trinidad Head, 1993-2006
Deleted: <sp>
Deleted: 4
Deleted: 5
Deleted: 4
Deleted: 5

8.1 AIR QUALITY
8.1-10 PO062006001SAC/344005/062570015 (HBRP_008-1-REVSEP07.DOC)
8.1.1.3.4 Nitrogen Dioxide Atmospheric NO2 is formed primarily from reactions between nitric oxide (NO) and oxygen or ozone. NO is formed during high temperature combustion processes, when the nitrogen and oxygen in the combustion air combine. Although NO is much less harmful than NO2, it can be converted to NO2 in the atmosphere within a matter of hours, or even minutes, under certain conditions. For purposes of state and federal air quality planning, the NCUAQMD is in attainment for NO2.
Table 8.1-3 shows the long-term trend of maximum 1-hour NO2 levels recorded at the Willits and Ukiah stations, as well as the annual average level for each of those years. During this period there has not been a single violation of either the state 1-hour standard or the NAAQS of 0.053 ppm (annual average).
TABLE 8.1-3 Nitrogen Dioxide Levels, Willits Station, 1995-2005 (ppm)
1996 1997 1998 1999 2000 2001 2002 2003 2004 2005 Highest 1-Hour Average 0.030 0.061 0.052 0.056 0.035 0.044 0.080 0.053 0.036 0.028 Annual Average (NAAQS = 0.053 ppm)
* * 0.010 0.008 0.007 0.007 0.008 0.009 0.008 0.008
Nitrogen Dioxide Levels, Ukiah Station, 1995-2005 (ppm) Highest 1-Hour Average 0.044 0.049 0.052 0.066 0.042 0.052 0.038 0.042 0.037 0.037 Annual Average (NAAQS = 0.053 ppm)
* 0.010 0.009 0.010 0.011 0.010 0.010 0.009 0.009 0.008
Notes: Source: California Air Quality Data, California Air Resources Board website; USEPA AIRData website. * There were insufficient (or no) data available to determine the value.
Figure 8.1-5 shows the historical trend of maximum 1-hour NO2 levels at the Willits and Ukiah stations. The NO2 levels are approximately one-third of the state standard.
Deleted: fifth

8.1 AIR QUALITY
PO062006001SAC/344005/062570015 (HBRP_008-1-REVSEP07.DOC) 8.1-11
0.000
0.030
0.060
0.090
0.120
0.150
0.180
0.210
1993 1994 1995 1996 1997 1998 1999 2000 2001 2002 2003 2004 2005
Calendar Year
NO
2 (pa
rts
per m
illio
n)
Willits Max Hourly ConcentrationWillits 3-Year AverageUkiah Max Hourly ConcentrationUkiah 3-Year AverageCalifornia Standard
FIGURE 8.1-5 Maximum Hourly NO2 Levels: Willits and Ukiah, 1993-2005
8.1.1.3.5 Carbon Monoxide CO is a product of inefficient combustion, principally from automobiles and other mobile sources of pollution. In many areas of California, CO emissions from wood-burning stoves and fireplaces can also be measurable contributors to ambient CO levels. Industrial sources typically contribute less than 10 percent of ambient CO levels. Peak CO levels occur typically during winter months, due to a combination of higher emission rates and calm weather conditions with strong, ground-based inversions. Based upon ambient air quality monitoring, the North Coast Air Basin is classified as being in attainment for CO.
Table 8.1-4 shows the California and federal air quality standards for CO, and the maximum 1- and 8-hour average levels recorded at the Willits and Ukiah monitoring stations during the period 1996-2005.

8.1 AIR QUALITY
8.1-12 PO062006001SAC/344005/062570015 (HBRP_008-1-REVSEP07.DOC)
TABLE 8.1-4 Carbon Monoxide Levels in Willits, 1996-2005 (ppm)
1996 1997 1998 1999 2000 2001 2002 2003 2004 2005 Highest 1-hour average 3.0 7.4 3.7 2.9 2.0 2.9 2.0 5.3 1.8 1.7 Highest 8-hour average 1.55 3.04 2.06 1.82 1.47 1.42 1.3 1.59 1.17 1.05 Carbon Monoxide Levels in Ukiah, 1996-2005 (ppm)
Highest 1-hour average 4.8 4.6 4.8 5.2 4.4 4.0 3.1 4.8 2.3 2.6 Highest 8-hour average 2.72 3.21 3.46 3.66 2.57 2.34 2.55 2.18 1.78 1.51
Source: California Air Quality Data, California Air Resources Board website; USEPA AIRData website.
Trends of maximum 1- and 8-hour average CO concentrations are shown in Figures 8.1-6 and 8.1-7, which show that maximum ambient CO levels at the Willits and Ukiah monitoring station have been well below the state standards for many years.
0.0
5.0
10.0
15.0
20.0
25.0
1993 1994 1995 1996 1997 1998 1999 2000 2001 2002 2003 2004 2005
Calendar Year
CO
(par
ts p
er m
illio
n)
Willits Max Hourly ConcentrationWillits 3-Year AverageUkiah Max Hourly ConcentrationUkiah 3-Year AverageCalifornia Standard
FIGURE 8.1-6 Maximum 1-Hour Average CO Levels: Willits & Ukiah, 1993-2005

8.1 AIR QUALITY
PO062006001SAC/344005/062570015 (HBRP_008-1-REVSEP07.DOC) 8.1-13
0
1
2
3
4
5
6
7
8
9
10
1993 1994 1995 1996 1997 1998 1999 2000 2001 2002 2003 2004 2005
Calendar Year
CO
(par
ts p
er m
illio
n)
Willits Max 8-Hour ConcentrationWillits 3-Year AverageUkiah Max 8-Hour ConcentrationUkiah 3-Year AverageCalifornia StandardFederal Standard
FIGURE 8.1-7 Maximum 8-Hour Average CO Levels: Willits and Ukiah, 1993-2005
8.1.1.3.6 Sulfur Dioxide SO2 is produced when any sulfur-containing fuel is burned. It is also emitted by chemical plants that treat or refine sulfur or sulfur-containing chemicals. Natural gas contains negligible sulfur, while fuel oils contain larger amounts. Peak concentrations of SO2 occur at different times of the year in different parts of California, depending on local fuel characteristics, weather, and topography. The North Coast Air Basin is considered to be in attainment for SO2 for purposes of state and federal air quality planning.
Table 8.1-5 presents the state air quality standard for SO2 and the maximum levels recorded from 1996 through 2005 in Willits and Ukiah. The federal 24-hour average standard is 0.14 ppm; during the period shown, the average SO2 levels measured at the Willits station have been less than one-tenth of the federal standard. Figure 8.1-8 shows that for several years the maximum 24-hour SO2 levels at San Francisco typically have been less than one-third of the state standard.

8.1 AIR QUALITY
8.1-14 PO062006001SAC/344005/062570015 (HBRP_008-1-REVSEP07.DOC)
TABLE 8.1-5 Sulfur Dioxide Levels in San Francisco (ppm)
1996 1997 1998 1999 2000 2001 2002 2003 2004 2005
Highest 24-Hour Average 0.008 0.007 0.005 0.007 0.008 0.008 0.007 0.007 0.008 0.007
Annual Average 0.001 0.001 0.001 0.002 0.002 0.002 0.002 0.002 0.002 0.002
Sulfur Dioxide Levels in Mendocino County (ppm) 1992 1993 1994 1995 1996 1997 1998 1999 2000 2001
Highest 24-Hour Average 0.006 0.001 0.002 * * * * * * *
Annual Average 0.001 0.000 0.001 * * * * * * *
Source: California Air Quality Data, California Air Resources Board website; USEPA AIRData website. Note: 1992 and 1993 data are from Ukiah; 1994 data are from Willits. No other SO2 monitoring data are available from the North Coast Air Basin. * No data collected.
FIGURE 8.1-8 Maximum 24-Hour Average SO2 Levels: San Francisco Arkansas Street, 1994-2005
0.00
0.02
0.04
0.06
0.08
0.10
0.12
0.14
0.16
1994 1995 1996 1997 1998 1999 2000 2001 2002 2003 2004 2005Calendar Year
SO2 (
part
s pe
r mill
ion)
Max 24-Hour Concentration3-Year AverageCalifornia StandardFederal Standard

8.1 AIR QUALITY
PO062006001SAC/344005/062570015 (HBRP_008-1-REVSEP07.DOC) 8.1-15
8.1.1.3.7 Particulate Sulfates Particulate sulfates are the product of further oxidation of SO2. The NCUAQMD is in attainment of the state standard for sulfates (24-hour average < 25 µg/m3). There is no federal standard for sulfates.
No sulfate monitoring has been performed in the North Coast Air Basin in over 10 years.
Although no chemical composition data are available, based on similarities with the San Francisco Bay Area and northern Sacramento Valley air basins, CARB estimates that secondary ammonium nitrate and sulfate comprise approximately 30 percent of North Coast’s PM2.5. Based on speciation of PM2.5 in the Bay Area, as much as one-third of the secondary particulate could be sulfate. Based on these estimates, as much as 10 percent of PM2.5 could be sulfate.
The highest 24-hour PM2.5 level measured in Eureka in the last 10 years was 36.9 µg/m3. Sulfate levels in Eureka are therefore likely to be below 4 µg/m3, far below the state standard of 25 µg/m3.
8.1.1.3.8 Particulates (PM10 and PM2.5) Particulates in the air are caused by a combination of wind-blown fugitive dust; particles emitted from combustion sources and manufacturing processes; and organic, sulfate, and nitrate aerosols formed in the air from emitted hydrocarbons, sulfur oxides, and nitrogen oxides. In 1984, CARB adopted standards for PM10 and phased out the total suspended particulate (TSP) standards that had been in effect previously. PM10 standards were substituted for TSP standards because PM10 corresponds to the size range of particulates that can be inhaled into the lungs and therefore is a better measure to use in assessing potential health effects. In 1987, USEPA also replaced national TSP standards with PM10 standards. The North Coast Air Basin is in attainment of the federal PM10 standards but exceeds the state standards.
PM10 and PM2.5 levels are highest during the late fall and winter. Colder, more stagnant conditions during this time of the year are conducive to the buildup of PM, including the formation of secondary ammonium nitrate. In addition, increased activity from residential wood combustion may also occur.
Table 8.1-6 shows the federal and state air quality standards for PM10, maximum levels recorded at the Eureka Health Department monitoring station during 1996-2005, and geometric and arithmetic annual averages for the same period. The maximum 24-hour PM10 levels exceed the state standard, and the federal standard has not been exceeded during the past 10 years. The annual average PM10 levels have remained below the federal standards throughout the 10-year period. The federal annual PM10 standard was rescinded effective December 18, 2006.

8.1 AIR QUALITY
8.1-16 PO062006001SAC/344005/062570015 (HBRP_008-1-REVSEP07.DOC)
TABLE 8.1-6 PM10 Levels in Eureka, Health Dept Station, 1996-2005 (µg/m3)
1996 1997 1998 1999 2000 2001 2002 2003 2004 2005
Highest 24-Hour Average 87 56 45 60 53 67 38 71 64 71
Annual Arithmetic Mean (State Standard = 20 µg/m3)a
(Federal Standard = 50 µg/m3)c
19.0
18.4
21.0
21.2
15.9
14.8
19.9
19.2
21.8
20.9
21.3
20.8
b
18.5
b
21
b
20.7
b
22
Estimated Number of Days Exceeding:
State Standard (50 µg/m3, 24-hour)
12 6 0 13 6 13 0 3 2 1
Federal Standard (150 µg/m3, 24-hour)
0 0 0 0 0 0 0 0 0 0
Notes: Source: California Air Quality Data, California Air Resources Board website; USEPA AIRData website. a State statistics are based on California approved samplers; national statistics are based on samplers using federal
reference or equivalent methods. b There were insufficient (or no) data available to determine the value. c Federal annual average standard was rescinded in December 2006.
The trend of maximum 24-hour average PM10 levels is plotted in Figure 8.1-9, and the trend of expected violations of the state 24-hour standard of 50 µg/m3 is plotted in Figure 8.1-10. Note that since PM10 is measured only once every 6 days, expected violation days are six times the number of measured violations. The trend of maximum annual average PM10 readings and the California and federal standards are shown in Figure 8.1-11. Annual average PM10 concentrations are well below the old federal standard, but remain close to the state standard of 20 µg/m3.
0
20
40
60
80
100
120
140
160
1993 1994 1995 1996 1997 1998 1999 2000 2001 2002 2003 2004 2005
Calendar Year
PM10
(μg/
m3 )
Max 24-Hour Concentration
3-Year Average
California Standard
Federal Standard
FIGURE 8.1-9
Maximum 24-Hour Average PM10 Levels: Eureka, 1993-2005
Deleted: b
Deleted: b
Deleted: b
Deleted: b

8.1 AIR QUALITY
PO062006001SAC/344005/062570015 (HBRP_008-1-REVSEP07.DOC) 8.1-17
0
5
10
15
20
25
1993 1994 1995 1996 1997 1998 1999 2000 2001 2002 2003 2004 2005
Calendar Year
Expe
cted
Vio
latio
n D
ays
Expected Violations
3-Year Average
FIGURE 8.1-10 Expected Violations of the California 24-Hour PM10 Standards (50 μg/m3): Eureka, 1993-2005
FIGURE 8.1-11 Annual Average PM10 Levels: Eureka, 1993-2005
0
10
20
30
40
50
60
1993 1994 1995 1996 1997 1998 1999 2000 2001 2002 2003 2004 2005
Calendar Year
PM10
(μg/
m3 )
Federal Annual Average3-Year AverageState Annual Average3-Year AverageFederal StandardCalifornia Standard

8.1 AIR QUALITY
8.1-18 PO062006001SAC/344005/062570015 (HBRP_008-1-REVSEP07.DOC)
The NAAQS for particulates were revised by USEPA with new standards that went into effect on September 16, 1997; two new PM2.5 standards were added at that time. In June 2002, CARB established a new annual average standard for PM2.5. USEPA revised the federal 24-hour average standard in December 2006. PM2.5 data have been collected at the Eureka monitoring station since 1999, and are presented below.
Table 8.1-7 shows the state and federal air quality standards for PM2.5, maximum levels recorded at the Eureka monitoring station during 1999-2005, and 3-year averages for the same period. The 24-hour average concentrations have not exceeded the federal standard during the monitoring period. Annual average PM2.5 levels have not exceeded the state or federal standards. The North Coast Air Basin is unclassified for the state PM2.5 standard and is unclassified for the federal PM2.5 standard, although the state has requested that USEPA designate the North Coast Air Basin as being in attainment.
TABLE 8.1-7 PM2.5 Levels in Eureka, Health Dept Station, 1996-2005 (µg/m3)
1996 1997 1998 1999 2000 2001 2002 2003 2004 2005
Highest 24-Hour Average – – – 36.9 24.0 32.6 23.7 36.1 25.6 31.8
Number of Days Exceeding:
Federal Standard (35 µg/m3, 24-hour)
– – – 0 0 0 0 0 0 0
98th Percentile – – – 27.7 21.5 29 22.6 35 23.1 32
3-yr Average, 98th Percentile – – – * * * * * * *
Annual Arithmetic Mean (Federal Std = 15 µg/m3)
– – – 9.1 9.2 9.4 7.9 8.2 8.1 9.1
3-yr Annual Average (State Std = 12 µg/m3)
– – – – – 9 9 -- -- –
Note: Source: California Air Quality Data, California Air Resources Board website; USEPA AIRData website.
* There were insufficient (or no) data available to determine the value.
Maximum annual PM2.5 levels are plotted in Figure 8.1-12. The trend of maximum 24-hour average PM2.5 levels is plotted in Figure 8.1-13.
8.1.1.3.9 Airborne Lead The majority of lead in the air results from the combustion of fuels that contain lead. Twenty-five years ago, motor vehicle gasolines contained relatively large amounts of lead compounds used as octane-rating improvers, and ambient lead levels were relatively high. Beginning with the 1975 model year, new automobiles began to be equipped with exhaust catalysts, which were poisoned by the exhaust products of leaded gasoline. Thus, unleaded gasoline became the required fuel for an increasing fraction of new vehicles, and the phaseout of leaded gasoline began. As a result, ambient lead levels decreased dramatically. The North Coast Air Basin has been in attainment of state and federal airborne lead levels for air quality planning purposes for a number of years.
Deleted: 65
Deleted: –
Deleted: –
Deleted: 11.8
Deleted: 12.0
Deleted: (Federal Std = 15 µg/m3)

8.1 AIR QUALITY
PO062006001SAC/344005/062570015 (HBRP_008-1-REVSEP07.DOC) 8.1-19
FIGURE 8.1-12 Annual Arithmetic Mean PM2.5 Levels: Eureka, 1999-2005
0
5
10
15
20
25
30
35
40
45
50
1993 1994 1995 1996 1997 1998 1999 2000 2001 2002 2003 2004 2005Calendar Year
PM2.
5 (μg
/m3 )
98th Percentile Concentration
98th Percentile 3-Year Average
Federal Standard
FIGURE 8.1-13 98th Percentile 24-Hour Average PM2.5 Levels: Eureka, 1994-2005
0
2
4
6
8
10
12
14
16
1993 1994 1995 1996 1997 1998 1999 2000 2001 2002 2003 2004 2005Calendar Year
PM2.
5 (μg
/m3 )
National Annual Average
Federal Standard
State Standard
Deleted: <sp>Maximum and 98th Percentile 24-Hour
Deleted: Maximum Annual

8.1 AIR QUALITY
8.1-20 PO062006001SAC/344005/062570015 (HBRP_008-1-REVSEP07.DOC)
Table 8.1-8 lists the federal air quality standard for airborne lead and the levels reported at the Fort Bragg station between 1980 and 1987. Fort Bragg is on the California coast 90 miles south of Eureka. This site was selected because it was the closest station with lead monitoring data. Note that the data are for maximum daily levels, while the standard is a quarterly average. The elimination of airborne lead as a health issue is one of the great environmental success stories. Maximum levels are well below the federal standard.6
TABLE 8.1-8 Airborne Lead Levels in Fort Bragg, 1980-1987 (µg/m3)
1980 1981 1982 1983 1984 1985 1986 1987
Highest daily average 0.11 0.12 0.76 0.17 0.11 0.08 0.08 0.04
Number of Days Exceeding:
Federal Standard (1.5 μg/m3, quarterly)
0 0 0 0 0 0 0 0
8.1.2 Environmental Consequences This section discusses the environmental consequences of the construction and operation of the HBRP with respect to air quality. It describes the methodology for modeling the project’s air emissions and presents an analysis of air quality impacts from operation and construction. This section also discusses the screening-level human health risk assessment described in greater detail in Section 8.9, Public Health, and discusses specialized modeling analyses that include fumigation modeling, modeling of engine startups and shutdowns, engine commissioning, and cumulative impacts.
8.1.2.1 Significance Criteria The criteria used to determine the significance of project-related air quality impacts are as suggested in Appendix G, Environmental Checklist Form, of the California Environmental Quality Act (CEQA) (Public Resources Code Sections 21000 et seq.). Project-related impacts are determined to be significant if they:
• Conflict with or obstruct implementation of the applicable air quality plan;
• Violate any air quality standard or contribute substantially to an existing or projected air quality violation;
• Result in a cumulatively considerable net increase of any criteria pollutant for which the project region is nonattainment under an applicable federal or state ambient air quality standard (including releasing emissions which exceed quantitative thresholds for ozone precursors); or
• Expose sensitive receptors to substantial pollutant concentrations.
6 CARB no longer reports summary lead statistics on its website.

8.1 AIR QUALITY
PO062006001SAC/344005/062570015 (HBRP_008-1-REVSEP07.DOC) 8.1-21
8.1.2.2 Overview of the Analytical Approach to Estimating Facility Impacts The proposed project is subject to NCUAQMD Rule 110, which contains the District’s New Source Review (NSR) and Prevention of Significant Deterioration (PSD) permitting requirements. The project is also subject to Rules 1-200(c) and 1-220, adopted March 14, 1984, and approved by USEPA as part of the State Implementation Plan (SIP). These older rules constitute the District’s federally delegated PSD program. As discussed in Section 8.1.5.2.1.1 of this application, the District has been delegated the authority to perform PSD review in accordance with the requirements of the 1984 rules. The District’s review of compliance with the 1984 SIP-approved PSD rule is referred to here as “federal PSD review” to distinguish it from the District’s review of compliance with its current NSR/PSD requirements.7
The District NSR/PSD rule requires that best available control technology (BACT) be used, emission offsets be provided, and an air quality impact analysis be performed. Similarly, the federal PSD regulation requires the use of BACT and various analyses of the air quality impacts of the proposed project. Ambient air quality impact analyses have been conducted to satisfy both sets of regulatory requirements, as well as CEC requirements, for criteria pollutants (NOx, SO2, CO, ROC, and PM10/PM2.5) and noncriteria pollutants, during project construction and operation. The applicability of the District regulatory requirements and facility compliance with these requirements are based on facility emission levels and ambient air quality impact analyses.
Maximum pollutant emission rates and ambient impacts of the project have been evaluated to determine compliance with District and federal regulations. The new emissions sources at the HBRP include 10 Wärtsilä 18V50DF reciprocating internal combustion engines, an emergency diesel generator, and a diesel fire pump engine. Each reciprocating engine will be equipped with an SCR system for NOx control and an oxidation catalyst for control of CO. Emissions control systems will be fully operational during all operations except startups and shutdowns. Maximum annual emissions are based on operation of the reciprocating engines at maximum firing rates and include the expected maximum number of startups that may occur in a year. Each reciprocating engine startup will result in transient emission rates until steady-state operation for the engine and its emission control systems is achieved.
The two existing electric utility steam generating units and the two peaking combustion turbines at Humboldt Bay Power Plant will be shut down following commissioning of the new units.
The following sections describe the emission sources that have been evaluated, the results of the ambient impact analyses, and the evaluation of facility compliance with the applicable air quality regulations.
7 Although the District enforces its current PSD rule for major sources as defined in 40 CFR 52.21, this rule has not been approved by EPA as the basis for PSD program delegation. Therefore an applicant for a new major source or major modification that is subject to PSD review must also comply with the requirements of the District’s 1984 SIP-approved PSD rules.
Deleted: The reduced emissions from the shutdown of the existing equipment will be reflected in the assessment of air quality impacts for the proposed project.¶
8.1 AIR QUALITY
8.1-22 PO062006001SAC/344005/062570015 (HBRP_008-1-REVSEP07.DOC)
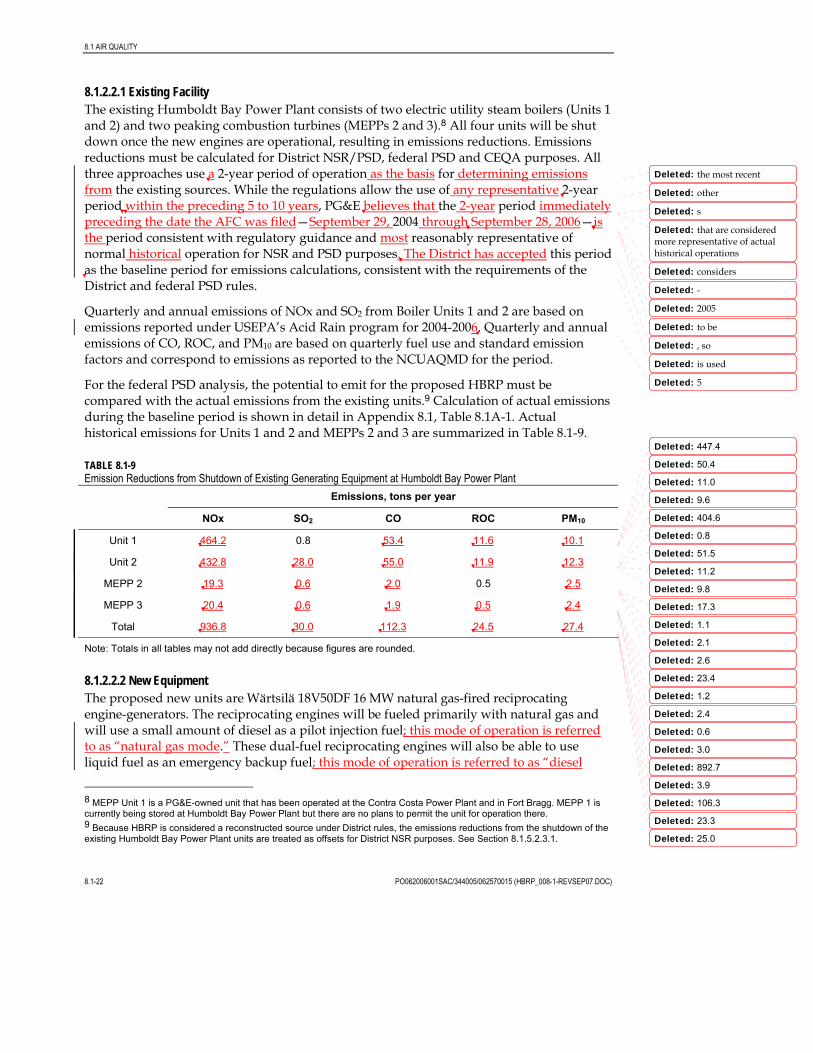
8.1.2.2.1 Existing Facility The existing Humboldt Bay Power Plant consists of two electric utility steam boilers (Units 1 and 2) and two peaking combustion turbines (MEPPs 2 and 3).8 All four units will be shut down once the new engines are operational, resulting in emissions reductions. Emissions reductions must be calculated for District NSR/PSD, federal PSD and CEQA purposes. All three approaches use a 2-year period of operation as the basis for determining emissions from the existing sources. While the regulations allow the use of any representative 2-year period within the preceding 5 to 10 years, PG&E believes that the 2-year period immediately preceding the date the AFC was filed—September 29, 2004 through September 28, 2006—is the period consistent with regulatory guidance and most reasonably representative of normal historical operation for NSR and PSD purposes. The District has accepted this period as the baseline period for emissions calculations, consistent with the requirements of the District and federal PSD rules.
Quarterly and annual emissions of NOx and SO2 from Boiler Units 1 and 2 are based on emissions reported under USEPA’s Acid Rain program for 2004-2006. Quarterly and annual emissions of CO, ROC, and PM10 are based on quarterly fuel use and standard emission factors and correspond to emissions as reported to the NCUAQMD for the period.
For the federal PSD analysis, the potential to emit for the proposed HBRP must be compared with the actual emissions from the existing units.9 Calculation of actual emissions during the baseline period is shown in detail in Appendix 8.1, Table 8.1A-1. Actual historical emissions for Units 1 and 2 and MEPPs 2 and 3 are summarized in Table 8.1-9.
TABLE 8.1-9 Emission Reductions from Shutdown of Existing Generating Equipment at Humboldt Bay Power Plant
Emissions, tons per year
NOx SO2 CO ROC PM10
Unit 1 464.2 0.8 53.4 11.6 10.1
Unit 2 432.8 28.0 55.0 11.9 12.3
MEPP 2 19.3 0.6 2.0 0.5 2.5
MEPP 3 20.4 0.6 1.9 0.5 2.4
Total 936.8 30.0 112.3 24.5 27.4
Note: Totals in all tables may not add directly because figures are rounded.
8.1.2.2.2 New Equipment The proposed new units are Wärtsilä 18V50DF 16 MW natural gas-fired reciprocating engine-generators. The reciprocating engines will be fueled primarily with natural gas and will use a small amount of diesel as a pilot injection fuel; this mode of operation is referred to as “natural gas mode.” These dual-fuel reciprocating engines will also be able to use liquid fuel as an emergency backup fuel; this mode of operation is referred to as “diesel
8 MEPP Unit 1 is a PG&E-owned unit that has been operated at the Contra Costa Power Plant and in Fort Bragg. MEPP 1 is currently being stored at Humboldt Bay Power Plant but there are no plans to permit the unit for operation there. 9 Because HBRP is considered a reconstructed source under District rules, the emissions reductions from the shutdown of the existing Humboldt Bay Power Plant units are treated as offsets for District NSR purposes. See Section 8.1.5.2.3.1.
Deleted: the most recent
Deleted: other
Deleted: s
Deleted: that are considered more representative of actual historical operations
Deleted: considers
Deleted: -
Deleted: 2005
Deleted: to be
Deleted: , so
Deleted: is used
Deleted: 5
Deleted: 447.4
Deleted: 50.4
Deleted: 11.0
Deleted: 9.6
Deleted: 404.6
Deleted: 0.8
Deleted: 51.5
Deleted: 11.2
Deleted: 9.8
Deleted: 17.3
Deleted: 1.1
Deleted: 2.1
Deleted: 2.6
Deleted: 23.4
Deleted: 1.2
Deleted: 2.4
Deleted: 0.6
Deleted: 3.0
Deleted: 892.7
Deleted: 3.9
Deleted: 106.3
Deleted: 23.3
Deleted: 25.0

8.1 AIR QUALITY
PO062006001SAC/344005/062570015 (HBRP_008-1-REVSEP07.DOC) 8.1-23
mode.” For the purpose of operating the HBRP in diesel mode, “emergency” means a shortage of natural gas supplies or transportation capacity sufficient to trigger the curtailment of natural gas to PG&E “interruptible” natural gas customers, or that would trigger such a curtailment but for the operation of one or more HBRP units on liquid fuel.10 Post-combustion air pollution controls will consist of SCR for NOx control and oxidation catalysts for CO control. Any or all of the reciprocating engines may be operated up to 24 hours per day, 7 days per week, with total plantwide heat input not to exceed the equivalent of 6,497 full-load engine hours per year, which is equivalent to a 70 percent annual average capacity factor.11 Each reciprocating engine will be limited to 50 hours per year of operation in diesel mode for testing and maintenance purposes to ensure its availability during emergency situations. Specifications for the new reciprocating engines are summarized in Table 8.1-10. Additional information regarding the Wärtsilä reciprocating engines is contained in Appendix 8.1A, Tables 8.1A-2 and 8.1A-3.
TABLE 8.1-10 New Wärtsilä 18V50DF Reciprocating Engine Design Specifications Manufacturer: Wärtsilä
Model: 18V50DF
Primary Fuel: Natural gas
Backup Fuel: CARB diesel
Design Ambient Temperature*: 67.5°F
Nominal Heat Input Rate (HHV): 143.9 MMBtu/hr natural gas plus 0.79 MMBtu/hr pilot fuel (natural gas mode) OR 148.9 MMBtu/hr emergency backup diesel fuel (diesel mode)
Nominal Power Generation Rate: 16 MW
Nominal Exhaust Temperature: 728°F
Exhaust Flow Rate: 121,502 acfm
Exhaust O2 Concentration, dry volume: 11.58%
Exhaust CO2 Concentration, dry volume: 5.32%
Exhaust Moisture Content, wet volume: 9.42%
Emission Controls: Lean burn technology and SCR (6 ppmv NOx @ 15% O2, primary fuel) Oxidation Catalyst (13 ppmv CO @ 15% O2, primary fuel)
Note: * Average-temperature scenario. MMBtu/hr = million British thermal units per hour acfm = actual cubic feet per minute
Typical natural gas and CARB diesel fuel analyses are summarized in Tables 8.1-11A and 8.1-11B, respectively.
10 The regulatory definition of “emergency” from the Diesel ATCM is shown in Section 8.1.5.2.2.2. 11 This 70 percent capacity factor is used as the basis for emissions calculations but is not intended to be applied as an operating limit. Emissions will be limited through a combination of heat input and emissions limits.
Deleted: on liquid fuel
Deleted: on CARB diesel fuel
Deleted: are

8.1 AIR QUALITY
8.1-24 PO062006001SAC/344005/062570015 (HBRP_008-1-REVSEP07.DOC)
TABLE 8.1-11A Nominal Fuel Properties—Natural Gas
Component Analysis Chemical Analysis
Component Average
Concentration, Volume Constituent Percent by Weight
CH4 95.64% C 73.03 %
C2H6 2.32% H 23.98 %
C3H8 0.25% N 1.72 %
C4H10 0.07% O 1.28 %
C5H12 0.02% S <1 gr/100 scf
N2 1.03%
CO2 0.67%
S <0.00%
Higher Heating Value 1021 Btu/scf 22,941 Btu/lb
Note: scf = standard cubic feet
TABLE 8.1-11B Nominal Fuel Properties— CARB Diesel
Parameter Specification
Gravity, deg API 30 min
Aromatics, % 10 max
Flash Point, °F 140 min
Cetane No 40 min
Sulfur, ppm 15 max
Ash, wt % 0.01 max
Higher Heating Value 136,903 Btu/gal 19,692 Btu/lb
The emergency diesel generator and diesel fire pump engine will be constructed adjacent to the reciprocating engines. Specifications for the emergency generator are shown in Table 8.1-12; specifications for the diesel fire pump engine are shown in Table 8.1-13.

8.1 AIR QUALITY
PO062006001SAC/344005/062570015 (HBRP_008-1-REVSEP07.DOC) 8.1-25
TABLE 8.1-12 Emergency Diesel Engine Generator Specifications
Parameter Value
Manufacturer Caterpillar or equivalent
Model DM8149 or equivalent
Fuel CARB diesel
Engine Output, kw 350
Engine Output, bhp 469
Heat Input, MMBtu/hr (HHV) 4.0
Heat Input, gal/hr 29.1
Operating hours per year* 50
Note: * Allowable hours per year for testing and maintenance.
TABLE 8.1-13 Emergency Diesel Fire Pump Engine Specifications
Parameter Value
Manufacturer Clarke
Model JU6H-UF50
Fuel CARB diesel
Engine Output, kw 157
Engine Output, bhp 210
Heat Input, MMBtu/hr (HHV) 1.68
Heat Input, gal/hr 12.3
Operating hours per year* 50
Note: * Allowable hours per year for testing and maintenance.
8.1.2.2.3 Facility Operations New Wärtsilä Reciprocating Internal Combustion Engines Wärtsilä provided engine performance specifications for natural gas and diesel modes for three temperature scenarios: high temperature (87°F), average temperature (67.5°F), and low temperature (21°F). The low-temperature scenario was used to characterize maximum emissions because it has the highest hourly heat input and emission rates. Maximum daily operations are based on full-load operation of 10 reciprocating engines for 24 hours with some restrictions on liquid fuel use and emissions (see Section 8.1.2.3.3). Maximum annual emissions are based on full-load operation of each engine for the equivalent of 6,497 full-load engine hours per year. Heat input limits, as summarized in Table 8.1-14, were established to provide the basis for the calculation of project and facility emissions. Values shown in bold are proposed permit conditions.
Deleted: Cummins
Deleted: DFEG
Deleted: 3.3
Deleted: 24.1
Deleted: on
Deleted: fuels
Deleted: 2

8.1 AIR QUALITY
8.1-26 PO062006001SAC/344005/062570015 (HBRP_008-1-REVSEP07.DOC)
TABLE 8.1-14 Wärtsilä 18V50DF Fuel Use
Heat Input, MMBtu (HHV)
Hourly Daily Annuala
Each Reciprocating Engine Natural gas 143.9 3,454 927,450
Diesel pilot fuel 0.8 19 5,100
Backup diesel fuel 148.9 3,574 7,450
Total Heat Input 148.9 MMBtu/hr 3,574 MMBtu/day 940,000 MMBtu/yr
Total, 10 Reciprocating Engines Natural gas 1439 34,536 9,274,500
Diesel pilot fuel 7.9 190 51,000
Backup diesel fuel 1489 35,736 74,500
Proposed Limits 1489 MMBtu/hr total heat input (total, 10 engines)
35,736 MMBtu/day total heat input (total, 10 engines)
9,400,000 MMBtu/yr total heat input (total, 10 engines) 125,500 MMBtu/yr diesel heat input for non-emergency operation (total, 10 engines) 50 hours/yr (per engine) of non-emergency operation on diesel fuel
Note: a The quantity of backup diesel fuel reflects the state regulatory limit of 50 hours per year per unit for non-emergency
(testing and maintenance) operations plus diesel pilot fuel for natural gas combustion.
New Emergency Diesel Engine Generator and Diesel Fire Pump Engine The emergency diesel engine generator will operate under emergency conditions to power basic plant utilities during a power outage. The diesel fire pump engine would also operate in case of power outage during a fire when the main electric fire water pump is not available. The engines may be operated up to 50 hours per year for testing and maintenance activities.
8.1.2.3 Emissions Assessment: Criteria Pollutants Criteria pollutants emitted from the reciprocating engines and the emergency equipment include NOx, sulfur dioxide (SO2), CO, ROC and fine particulate matter (PM10)12. This section of the application presents calculated emissions from the new equipment.
The reciprocating engines and emergency equipment also will emit trace levels of toxic air contaminants (TACs), including ammonia. This section presents the maximum TAC emissions from the proposed new units. Tables containing the detailed TAC emission calculations are included in Appendix 8.1A.
12 All of the particulate matter emitted from the reciprocating engines is assumed to be less than 2.5 microns in diameter. All
references to PM10 include PM2.5 as well.
Deleted: 15,437

8.1 AIR QUALITY
PO062006001SAC/344005/062570015 (HBRP_008-1-REVSEP07.DOC) 8.1-27
8.1.2.3.1 Criteria Pollutant Emissions: Reciprocating Engines Proposed maximum emissions from the 18V50DF reciprocating engines were estimated on an hourly, daily, and annual basis based on expected daily operation and proposed annual operating limitations.
Emissions During Normal Operations Emissions of NOx, CO, and ROC were calculated from emission limits (in ppmv @ 15 percent O2) and the exhaust flow rates. The NOx emission limit reflects the application of SCR. The ROC emission limit reflects the use of good combustion practices. The CO emission limit reflects the expected performance of the oxidation catalyst. Maximum emissions were based on the exhaust rates associated with the heat input rates for each fuel shown in Table 8.1-14.
SO2 emissions were calculated from the heat input (in MMBtu) and an SO2 emission factor (in lb/MMBtu). Short-term SO2 emissions during natural gas firing were calculated based on the maximum allowable fuel sulfur content of 1 grain per 100 standard cubic feet (scf), while annual average SO2 emissions were calculated from the maximum annual average sulfur content of 0.33 grain per 100 scf. SO2 emissions during emergency diesel firing were calculated based on the maximum allowable diesel fuel sulfur content of 15 ppmw. Maximum SO2 emissions were calculated using the heat input rates in Table 8.1-14.
Maximum hourly PM10 emissions were obtained from the manufacturer’s guarantees for these units. PM2.5 emissions were determined based on the assumption that all particulate matter emissions are less than 2.5 microns in size.
Maximum emission rates for the 18V50DF reciprocating engines are summarized in Table 8.1-15. The BACT analysis upon which the emission factors are based is presented in Appendix 8.1E and summarized in Section 8.1.5.2.1.1.

8.1 AIR QUALITY
8.1-28 PO062006001SAC/344005/062570015 (HBRP_008-1-REVSEP07.DOC)
TABLE 8.1-15 Maximum Emission Rates—Each Reciprocating Engine
Pollutant ppmv @ 15% O2 lb/MMBtu lb/hr
Natural Gas Mode (Natural Gas Firing with Pilot Diesel Injection) NOx 6.0a 0.022 3.1
SO2b 0.55 0.0028 0.4
CO 13.0a 0.029 4.1
ROC 28.0a 0.035 5.1
PM10/PM2.5c n/a n/a 3.6
Diesel Mode (Backup CARB Diesel Fuel Firing) NOx 35.0 0.134 19.6
SO2d 0.40 0.0016 0.22
CO 20.0 0.047 6.9
ROC 40.0 0.053 7.9
PM10/PM2.5c n/a n/a 10.8
Notes: a NOx, CO, ROC and PM10 emission rates exclude startups and shutdowns (see Table 8.1-16). b Based on maximum natural gas sulfur content of 1 gr/100 scf. See text. c Includes front and back half. d Based on a maximum CARB diesel content of 15 ppmw.
Emissions During Startup and Shutdown Each Wärtsilä reciprocating engine will reach steady state conditions and the emission control systems will reach their full abatement efficiency within 30 minutes of startup. Maximum emission rates expected to occur during a startup or shutdown are estimated based on vendor data and are shown in Table 8.1-16. Hourly startup emission rates are calculated assuming 30 minutes of startup and 30 minutes of full-load operation. SO2 and PM10 emissions are not included in this table because emissions of these pollutants will not be higher during startup than during baseload facility operation.
TABLE 8.1-16 Reciprocating Engine Startup Emission Rates
NOx CO ROC
Natural gas mode startup, lb/start 22 22 15.4
Natural gas mode startup, lb/hour 23.6 24.1 17.9
Diesel mode startup, lb/start 154 22 13.2
Diesel mode startup, lb/hour 164 25.4 17.2
The Applicant is proposing two permit conditions related to NOx emissions during startup. The first condition would limit NOx emissions during any hour to 392 pounds, and would apply during normal plant operations, including startup, shutdown, and maintenance and testing of the Wärtsilä engines on liquid fuel as well as on operation in natural gas mode.
Deleted: 4.9
Deleted: Backup d
Deleted: Backup d

8.1 AIR QUALITY
PO062006001SAC/344005/062570015 (HBRP_008-1-REVSEP07.DOC) 8.1-29
This limit is expected to be adequate under most operating conditions, as it will allow simultaneous startups of all 10 engines in natural gas mode as well as simultaneous startups of up to 2 engines in diesel mode while the other engines are in operation.13 The engines will be started up on natural gas most of the time, and startups on liquid fuel for testing and maintenance can be coordinated to ensure compliance with this hourly emission limit. Under emergency conditions, such as a natural gas curtailment or other failure of the natural gas supply, it might be necessary to start up several engines at one time on liquid fuel. Under these circumstances, the second permit condition would provide a higher hourly NOx limit of 676 pounds, which would apply only during emergency conditions, as defined in the permit. The notification and reporting condition in the permit that apply to emergency operations, as defined, would also apply during emergency startups.
Compliance with both limits will be enforced through the continuous NOx emissions monitors.
8.1.2.3.2 Criteria Pollutants: Emergency Equipment Maximum emissions from the emergency diesel engine generator and the diesel fire pump engine are based on manufacturers’ guaranteed emission rates for these units. Guaranteed emission rates and calculated hourly emissions for these units are shown in Appendix 8.1A, Tables 8.1A-3 and 8.1A-4.
8.1.2.3.3 Criteria Pollutant Emissions Summary for the New Equipment Maximum facility emissions are shown in Table 8.1-17. The emission calculations are based on the reciprocating engine emission rates shown in Tables 8.1-15 and 8.1-16, the fuel use limitations in Table 8.1-14, and the following assumptions:
• Each reciprocating engine may operate up to 24 hours per day.
• Combined daily PM10 emissions from the Wärtsilä engines will be limited on any day when one or more engines operate in diesel mode for any period of time. This limit is discussed below.
• Each reciprocating engine may have up to 3 startups per day, with a total of 3 hours of startup/shutdown activity for each reciprocating engine.
• All 10 reciprocating engines could be required to start up simultaneously, with a limit of 392 lb/hr of NOx emissions in any hour.14
• Under emergency conditions,15 a limit of 676 lb/hr of NOx would apply.
• Each reciprocating engine may have a total of 365 hours per year of startup/shutdown activity.
• Total annual fuel use by all 10 reciprocating engines will be limited to the equivalent of 6,497 full-load hours per engine per year for the facility.16
13 An engine can switch from natural gas mode to Diesel mode without shutting down and starting up. The startup emission
rates in Table 8.1-16 apply only to starting up an engine that has not previously been in operation. 14 This emission limit is proposed as a permit condition. NOx emissions during engine startup on liquid fuel will be managed to
maintain compliance with this limit. 15 See Section 8.1.5.2.2.2 for the definition of emergency operating conditions.
Deleted: Under certain conditions, a
Deleted: On an extreme worst case day
Deleted: engines could operate up to 24 hours per day on emergency diesel fuel
Deleted: , including up to 48 engine-hours per day at engine loads below 75 percent

8.1 AIR QUALITY
8.1-30 PO062006001SAC/344005/062570015 (HBRP_008-1-REVSEP07.DOC)
TABLE 8.1-17 Emissions from New Equipment
Emissions/Equipment NOx SO2d CO ROC PM10
Maximum Hourly Emissions
Reciprocating Enginesa 392e 4.0 254.6 179.5 108.0
Black Start Generator 2.7 <0.01 0.5 0.31 0.05
Fire Pump Engineb — — — — —
Total, pounds per hour 394.7 4.0 255.1 179.8 108.1
Maximum Daily Emissions
Reciprocating Enginesa 9,101.3 96.7 2,219.1 2,205.4 2,203.0
Black Start Generatorb 2.69 <0.01 0.5 0.31 0.05
Fire Pump Engineb 2.27 <0.01 0.3 0.23 0.06
Total, pounds per day 9,106.3 96.7 2,219.9 2,206.0 2,203.1
Maximum Annual Emissions, tons per year (tpy)
Reciprocating Enginesc 174.2 4.4 171.0 188.9 118.7
Black Start Generatorc 0.1 <0.1 <0.1 <0.1 <0.1
Fire Pump Enginec 0.1 <0.1 <0.1 <0.1 <0.1
Total, tons per year 174.3 4.4 171.0 188.9 118.7
Notes: a Maximum hourly reciprocating engine emissions include 30 minutes of startup and 30 minutes of operation on
emergency backup fuel. Maximum daily reciprocating engine emissions include 3 30-minute startups and 24 hours of operation on emergency backup fuel.
b Black start generator and fire pump engine will not be tested during the same hour or on the same day. Black start generator has higher hourly emissions so emissions from that unit are used to calculate maximum project hourly emissions. Maximum daily emissions from the emergency generator reflect 45 minutes of operation for testing or maintenance. Maximum daily emissions from the fire pump engine reflect 1 hour of operation for testing or maintenance.
c Maximum annual emissions reflect 50 hours per year per reciprocating engine on emergency backup fuel and 50 hours per year of testing and maintenance operation for the black start generator and fire pump engine, as limited by the Airborne Toxic Control Measures (ATCMs) (see Section 8.1.5.2.2.2).
d SO2 emissions based on natural gas sulfur content of 1 gr/100 scf for all averaging periods except annual. Annual SO2 emissions based on maximum annual average sulfur content of 0.33 gr/100 scf.
e NOx limit during emergency operating conditions would be 676 lb/hr.
16 As discussed above, this limit was used in calculating emissions but is not intended to be imposed as an operating limit. Emissions will be limited by limits on fuel use, as monitored through fuel meters, and emissions, as monitored by CEMS and calculated from source test results. 18 An analysis of the applicability of the ATCM to the reciprocating engines is presented in Section 8.1.5.2.2.2.
Deleted: e
Deleted: 830.0
Deleted: 171.7
Deleted: 4.5
Deleted: 0.6
Deleted: 0.06
Deleted: 834.5
Deleted: 255.2
Deleted: 171.
Deleted: 8
Deleted: 2,182.0
Deleted: 2,592.0
Deleted: 4.5
Deleted: 0.6
Deleted: 0.06
Deleted: 9,108.1
Deleted: 2,182.3
Deleted: 2,592.1
Deleted: for District Regulatory Compliance
Deleted: 160.7
Deleted: 160.7
Deleted: Maximum Annual Emissions for Federal PSD and CEQA Compliance, tpy
Deleted: M
Deleted: units
Deleted: for regulatory compliance
Deleted: Maximum annual emissions for PSD and CEQA compliance reflect reasonably foreseeable and proposed federally enforceable limit of 800 hours per year per reciprocating engine on backup fuel and 200 hours per year of emergency operation for the black start generator and fire pump engine, per USEPA guidance.¶e
... [8]

8.1 AIR QUALITY
PO062006001SAC/344005/062570015 (HBRP_008-1-REVSEP07.DOC) 8.1-31
• Annual emissions from the facility include 50 hours of operation per engine per year in diesel mode, the maximum allowed for emergency engines under the Air Toxics Control Measure for Stationary Diesel Engines (CCR Title 17, Section 93115). The ATCM, which applies to the reciprocating engines during backup diesel operation18, limits non-emergency operation of new stationary emergency standby compression ignition engines to 50 hours per year.
Detailed calculations are shown in Appendix 8.1A, Table 8.1A-6.
Total daily PM10 emissions from the Wärtsilä engines are proposed to be limited by three separate conditions. The first limit of 864 lb/day is the potential to emit for 10 engines in natural gas mode. Compliance with this limit, which will apply on any day when the Wärtsilä engines are operated only in natural gas mode, will be determined using the manufacturer’s guaranteed emission rate of 3.6 lb/hr and actual hours of operation in natural gas mode. The second limit, 2203 lb/day, is the potential to emit for the 10 engines when operated in natural gas or diesel mode. Compliance with the second limit, which would apply on any day when one or more engines are operated in diesel mode for any period of time, will be determined using the manufacturer’s guaranteed emission rates of 3.6 lb/hr for natural gas mode and 10.8 lb/hr for diesel mode, and actual hours of operation in natural gas and diesel mode, respectively.
The third limit, 1542 lb/day, reflects the maximum expected emissions from the engines on any day when one or more engines are operated in diesel mode. Compliance with this third limit will be determined using District-approved emission factors derived from source test data that reflect the actual performance of the engines and emission control systems, and the actual quantity of fuel consumed by each engine in each mode.
The daily PM10 emissions shown in Table 8.1-17 reflect the second limit, the potential to emit based on the manufacturer’s guaranteed emission rate. Annual PM10 emissions for regulatory applicability, including offsets and mitigation requirements, are also calculated using the manufacturer’s guaranteed emission rates.
8.1.2.3.4 Net Changes in Criteria Pollutant Emissions for the Repowering Project Net emissions changes as a result of the project are calculated on an annual basis for federal PSD purposes. These calculations are shown in Table 8.1-18. Because HBRP is considered a new source under District rules (see Section 8.1.5.2.3.1), the emissions reductions from the shutdown of Humboldt Bay Power Plant are treated as offsets for District NSR. The applicability of PSD to a project is based on the difference between the post-modification potential to emit (i.e., the maximum possible emissions allowed under the proposed permit) and the existing facility’s actual emissions. As discussed in Section 8.1.2.2.1, the baseline period for emissions from the existing facility is the 24-month period immediately preceding the filing of the AFC: September 29, 2004, through September 28, 2006.
Because a facility rarely operates at its full capacity for an entire year, the “net emissions increase” calculated by the actual-to-potential calculation may be much larger than the actual emission increase.
Deleted: for Federal PSD and CEQA Purposes
Deleted: project’s

8.1 AIR QUALITY
8.1-32 PO062006001SAC/344005/062570015 (HBRP_008-1-REVSEP07.DOC)
TABLE 8.1-18 Net Emissions Changes for the Repowering Project
Emissions, tons per year NOx SO2 CO ROC PM10
Potential to Emit, New Units 174.3 4.4 171.0 188.9 118.7
Reduction, Shutdown of Existing Units 936.8 30.0 112.3 24.5 27.4
Net Increase (Reduction) (789.5) (25.6) 68.7 164.4 91.3
8.1.2.4 Construction Emissions Emissions due to the construction phase of the project have been estimated, including an assessment of emissions from vehicle and equipment exhaust and the fugitive dust generated from material handling. A detailed analysis of the emissions and ambient impacts is included in Appendix 8.1D. Construction emissions mitigation and/or control techniques proposed for use at the HBRP site include but are not limited to the following:
• Operational measures, such as limiting time spent with the engine idling by shutting down equipment when not in use;
• Regular preventive maintenance to prevent emission increases due to engine problems;
• Use of low sulfur and low aromatic fuel meeting California standards for motor vehicle diesel fuel; and
• Use of low-emitting gas and diesel engines meeting state and federal emissions standards for construction equipment, including but not limited to catalytic converter systems and particulate filter systems.
The following mitigation measures are proposed to control fugitive dust emissions during construction of the project:
• Use either water application or chemical dust suppressant application to control dust emissions from onsite unpaved road travel and unpaved parking areas;
• Use vacuum sweeping and/or water flushing of paved road surface to remove buildup of loose material to control dust emissions from travel on the paved access road (including adjacent public streets impacted by construction activities) and paved parking areas;
• Cover all trucks hauling soil, sand, and other loose materials or require all trucks to maintain at least two feet of freeboard;
• Limit traffic speeds on all unpaved site areas to 15 mph;
• Install sandbags or other erosion control measures to prevent silt runoff to roadways;
• Replant vegetation in disturbed areas as quickly as possible;
• Use wheel washers or wash off tires of all trucks exiting construction site; and
• Mitigate fugitive dust emissions from wind erosion of areas disturbed from construction activities (including storage piles) by application of either water or chemical dust suppressant.
Deleted: , PSD and CEQA
Deleted: 263.7
Deleted: 4.7
Deleted: 181.3
Deleted: 198.8
Deleted: 182.8
Deleted: 892.7
Deleted: 3.9
Deleted: 106.3
Deleted: 23.3
Deleted: 25.0
Deleted: 629.0
Deleted: 0.8
Deleted: 75.0
Deleted: 175.5
Deleted: 157.8

8.1 AIR QUALITY
PO062006001SAC/344005/062570015 (HBRP_008-1-REVSEP07.DOC) 8.1-33
The HBRP construction site impacts are not unusual in comparison to most construction sites. Construction sites that use good dust suppression techniques and low-emitting vehicles typically do not cause violations of air quality standards. 8.1.2.5 Emissions Assessment: Toxic Air Contaminants Noncriteria pollutants are compounds that have been identified as pollutants that pose a significant health hazard. Nine of these pollutants are regulated under the federal New Source Review program: lead, asbestos, beryllium, mercury, fluorides, sulfuric acid mist, hydrogen sulfide, total reduced sulfur, and reduced sulfur compounds.19 In addition to these nine compounds, the federal Clean Air Act lists 189 substances as potential hazardous air pollutants (Clean Air Act Sec. 112(b)(1). The NCUAQMD incorporates the CARB Airborne Toxic Control Measures (ATCMs) in its Regulation III (Toxic Air Contaminant Control). Any pollutant that may be emitted from the HBRP and is on the federal New Source Review list, the federal Clean Air Act list, and/or the District toxic air contaminant list has been evaluated as part of the AFC.
8.1.2.5.1 Toxic Air Contaminant Emissions: Wärtsilä Reciprocating Engines Maximum hourly and annual TAC emissions were estimated for the proposed Wärtsilä reciprocating engines during natural gas firing based on the heat input rate (in MMBtu/hr and MMBtu/yr), emission factors (in lb/MMBtu), and the nominal higher heating value of 1021 Btu/scf. Hourly and annual emissions were based on the heat input rates shown in Table 8.1-14. The ammonia emission factor was derived from an ammonia slip limit of 10 ppmv @ 15 percent O2. Other emission factors were obtained from AP-42 (Table 3.2-2, 7/00) and from the California Air Resources Board’s CATEF database for lean-burn reciprocating IC engines, with a control efficiency of 40% from the oxidation catalysts applied for all organic TACs except formaldehyde.20 As discussed in Section 8.1.5.2.1.3, the new engines will also be required to comply with the Reciprocating Internal Combustion Engine (RICE) Maximum Achievable Control Technology (MACT) (40 CFR Part 63, Subpart ZZZZ), which limits the emissions of formaldehyde for new compression ignition reciprocating engines or, alternatively, requires 70 percent control of CO emissions.21 TAC emissions are summarized in Table 8.1-19. Detailed emissions calculations, including emission factors, are provided in Appendix 8.1A, Table 8.1A-8.
19 These pollutants are regulated under federal and state air quality programs; however, they are evaluated as noncriteria pollutants by the California Energy Commission. 20 Sources: BAAQMD PDOC for the Eastshore Energy Center, April 30, 2007; CEC PSA for Eastshore Energy Center, August 17, 2007. Formaldehyde emission factor provided by vendor reflects oxidation catalyst control. 21 Oxidation catalyst efficiency in controlling CO emissions is used as a surrogate for efficiency in controlling formaldehyde emissions and other HAPs that are the subject of the MACT rule. See Section 8.1.5.2.3.

8.1 AIR QUALITY
8.1-34 PO062006001SAC/344005/062570015 (HBRP_008-1-REVSEP07.DOC)
TABLE 8.1-19 Maximum Proposed TAC Emissions for the New Equipment
Maximum Emissions
Hourly (lb/hr) Compound Natural Gas Modea,g Diesel Mode
Annual (tpy)
10 Wärtsilä Reciprocating Engines
Ammoniab 19.3 21.1 62.8
Propylene 4.6 2.5 14.7
Hazardous Air Pollutants
Acetaldehyde 0.4 0.02 1.4
Acrolein 0.05 0.01 0.2
Benzene 0.2 0.7 0.6
1,3-Butadiene 0.3 -- 1.0
Diesel Particulate Matterc,d -- 55.6 1.4f
Ethylbenzene 0.1 -- 0.2
Formaldehyde 3.3 0.1 10.7
Hexane 1.0 -- 3.1
Naphthalene 0.02 0.1 0.1
PAHse 1.8x10⁻⁵ 4.1x10⁻⁵ 4.9x10⁻⁵
Toluene 0.2 0.2 0.6
Xylene 0.5 0.2 1.8
Diesel Emergency Generator
Diesel Particulate Matterc -- 0.25 6.2x10⁻³ f
Diesel Fire Pump Engine
Diesel Particulate Matterc -- 0.06 1.6x10⁻³ f
Total Hazardous Air Pollutants (HAPs) (excluding DPM) 19.7
Notes: a Obtained from AP-42 and CATEF database for natural gas-fired lean-burn IC engines. See Appendix 8.1A,
Table 8.1A-8. b Based on an exhaust NH3 limit of 10 ppmvd @ 15% O2. c In accordance with CARB policy, DPM is to be used as a surrogate for all TAC emissions from diesel IC
engines. At CEC staff’s request, individual constituents of diesel exhaust are also evaluated for acute health impacts in Sections 8.1.2.9 (Screening Health Risk Assessment) and 8.9 (Public Health).
d DPM portion of total PM10 emissions is front half only as defined in the ATCM and is limited to 0.15 gm/kw-hr.
e Carcinogenic PAHs only; naphthalene is considered separately. f Annual DPM emissions calculation based on 50 hours per year of allowable operation for testing and
maintenance per the ATCM. g Natural gas mode firing includes pilot diesel injection.
Deleted: 7.6
Deleted: 24.5
Deleted: 0.7
Deleted: 2.4
Deleted: 1
Deleted: 0.3
Deleted: 0.3
Deleted: 1.0
Deleted: 0.5
Deleted: 1.7
Deleted: 0.3
Deleted: 1.6
Deleted: 5.2
Deleted: 3.6x10⁻²
Deleted: 3.9x10⁻⁴
Deleted: 1.2x10⁻³
Deleted: 0.3
Deleted: 1.1
Deleted: 0.9
Deleted: 2.9
Deleted: 25.7

8.1 AIR QUALITY
PO062006001SAC/344005/062570015 (HBRP_008-1-REVSEP07.DOC) 8.1-35
Annual DPM emissions are calculated based on the 50 hours per year of allowable operation on diesel fuel for testing and maintenance and on the 0.15 gm/kw-hr (0.11 gm/bhp-hr) limit for stationary compression ignition engines measured in accordance with the requirements of the NSPS (see Section 8.1.5.2.1.2). In accordance with CARB policy, DPM is used as a surrogate for diesel reciprocating engine TACs for chronic and cancer health risks.
8.1.2.5.2 Toxic Air Contaminant Emissions: New Emergency Equipment Maximum hourly and annual TAC emissions from the diesel-fueled emergency equipment are equivalent to maximum hourly and annual diesel particulate matter emissions from these units. In accordance with CARB policy, DPM is used as a surrogate for diesel reciprocating engine TACs. TACs from the new emergency engines are also shown in Table 8.1-19.
8.1.2.6 Air Quality Impact Analysis NCUAQMD Rule 110 requires the Applicant to provide ambient air quality modeling analyses and other impact assessments. An ambient air quality impact assessment is also required for PSD review and by the CEC for CEQA review. These analyses are presented in this section.
8.1.2.6.1 Air Quality Modeling Methodology An assessment of impacts from the HBRP on ambient air quality has been conducted using USEPA-approved air quality dispersion models. These models are based on various mathematical descriptions of atmospheric diffusion and dispersion processes in which a pollutant source impact can be calculated over a given area.
Figure 8.1B-7 in Appendix 8.1B shows the building layout used in the modeling analysis. Since the new equipment will operate for some undetermined period of time with the existing Humboldt Bay Power Plant generating equipment in place, the modeling analysis included the existing structures to account for any potential influences from those structures. The impact analysis was used to determine the worst-case ground-level impacts of the new reciprocating engines. The results were compared with established state and federal ambient air quality standards and PSD significance levels. If the standards are not exceeded then it is assumed that, in the operation of the facility, no exceedances are expected under any conditions. In accordance with the air quality impact analysis guidelines developed by USEPA (40 CFR Part 51, Appendix W: Guideline on Air Quality Models) and CARB (Reference Document for California Statewide Modeling Guideline, April 1989), the ground-level impact analysis includes the following assessments:
• Impacts in simple, intermediate, and complex terrain; • Aerodynamic effects (downwash) due to nearby building(s) and structures; • Impacts from inversion breakup (fumigation); and • Impacts from shoreline fumigation conditions.
Simple, intermediate, and complex terrain impacts were assessed for all meteorological conditions that would limit the amount of final plume rise. Plume impaction on elevated terrain, such as on the slope of a nearby hill, can cause high ground-level concentrations, especially under stable atmospheric conditions. Another dispersion condition that can cause high ground-level pollutant concentrations is caused by building downwash. Building
Deleted: Maximum hourly and annual TAC emissions from the reciprocating engines during backup diesel fuel firing are equivalent to maximum hourly and annual diesel particulate matter (DPM) emissions from these units.

8.1 AIR QUALITY
8.1-36 PO062006001SAC/344005/062570015 (HBRP_008-1-REVSEP07.DOC)
downwash can occur when wind speeds are high and a building or structure is in close proximity to the emission stack. This can result in building wake effects where the plume is drawn down toward the ground by the lower pressure region that exists in the lee side (downwind) of the building or structure.
Fumigation conditions occur when the plume is emitted into a low-lying layer of stable air (inversion) that then becomes unstable, resulting in a rapid mixing of pollutants towards the ground. The low mixing height that results from this condition allows little diffusion of the stack plume before it is carried downwind to the ground. Although fumigation conditions rarely last as long as an hour, relatively high ground-level concentrations may be reached during that period. Fumigation tends to occur under clear skies and light winds, and is more prevalent in the summer. Because land surfaces tend to both heat and cool more rapidly than water, shoreline fumigation tends to occur on sunny days when the denser cooler air over water displaces the warmer, lighter air over land. During an inland sea breeze, the unstable air over land gradually increases in depth with inland distance. The boundary between the stable air over the water and the unstable air over the land and the wind speed determine if the plume will loop down before much dispersion of the pollutants has occurred.
The basic model equation used in this analysis assumes that the concentrations of emissions within a plume can be characterized by a Gaussian distribution about the centerline of the plume. Concentrations at any location downwind of a point source such as a stack can be determined from the following equation:
( )( ) ( ){ } ( ){ }[ ]C x y z HQ
ue e e
y z
y z H z Hy z z( , , , ) * */ / / / / /=⎛⎝⎜
⎞⎠⎟ +− − − − +
21 2 1 2 1 2
2 2 2
πσ σσ σ σ
where
C = the concentration in the air of the substance or pollutant in question
Q = the pollutant emission rate
σy,σz = the horizontal and vertical dispersion coefficients, respectively, at downwind distance x
u = the wind speed at the height of the plume center
x,y,z = the variables that define the 3-dimensional Cartesian coordinate system used; the downwind, crosswind, and vertical distances from the base of the stack
H = the height of the plume above the stack base (the sum of the height of the stack and the vertical distance that the plume rises due to the momentum and/or buoyancy of the plume)
Gaussian dispersion models are approved by USEPA for regulatory use and are based on conservative assumptions (i.e., the models tend to overpredict actual impacts by assuming steady-state conditions, no pollutant loss through conservation of mass, no chemical reactions, etc.). The USEPA models were used to determine if ambient air quality standards would be exceeded, and whether a more accurate and sophisticated modeling procedure would be warranted to make the impact determination. The following sections describe:

8.1 AIR QUALITY
PO062006001SAC/344005/062570015 (HBRP_008-1-REVSEP07.DOC) 8.1-37
• Screening modeling procedures • Refined air quality impact analysis • Existing ambient pollutant concentrations and preconstruction monitoring • Results of the ambient air quality modeling analyses • PSD increment consumption
8.1.2.6.1.1 AERMOD The screening and refined air quality impact analyses were performed using the American Meteorological Society/Environmental Protection Agency Regulatory Model Improvement Committee (AERMIC) modeling system, also known as AERMOD (version 06341). The AERMOD modeling system incorporates a steady-state, multiple-source, Gaussian dispersion model designed for use with stack emission sources situated in terrain where ground elevations can exceed the stack heights of the emission sources (i.e. complex terrain).22 The model is capable of estimating concentrations for a wide range of averaging times (from 1 hour to 1 year).
Inputs required by the AERMOD model include the following:
• Model options • Meteorological data • Source data • Receptor data
Model options refer to user selections that account for conditions specific to the area being modeled or to the emissions source that needs to be examined. Examples of model options include use of site-specific vertical profiles of wind speed and temperature; consideration of stack and building wake effects; and time-dependent exponential decay of pollutants. The model supplies recommended default options for the user for some of these parameters.
AERMOD uses hourly meteorological data to characterize plume dispersion. The representativeness of the data is dependent on the proximity of the meteorological monitoring site to the area under consideration, the complexity of the terrain, the exposure of the meteorological monitoring site, and the period of time during which the data are collected. The meteorological data used in this analysis were collected at the Woodley Island NWS monitoring station about 5 miles northeast of project site. This data set was selected to be representative of meteorological conditions at the project site and to meet the requirements of the USEPA “On-Site Meteorological Program Guidance for Regulatory Model Applications” (EPA-450/4-87-013, August 1995). The analysis used surface meteorological data collected between 2001 and 2005. There is no nearby location where satisfactory upper air data are gathered for the purpose of determining mixing heights and other surface boundary layer parameters. The nearest NWS sounding station is Medford, Oregon, which is 185 km (115 miles) away. That location is inland, and is not characteristic of either the meteorological data or project sites. Although the NWS station at Oakland Airport is farther from the site than Medford (378 km, or 235 miles away), it is in a comparable coastal location to the project site, so the upper air data collected there are representative of upper air conditions at the site.
22 AERMOD was adopted as a guideline model by USEPA as a replacement for ISCST3. AERMOD incorporates an improved downwash algorithm as compared to ISCST3 (Federal Register, November 9, 2005; Volume 70, Number 216, Pages 68218-68261).
Deleted: 04300
Deleted: s
Deleted:
Deleted:
Deleted:
Deleted: recently

8.1 AIR QUALITY
8.1-38 PO062006001SAC/344005/062570015 (HBRP_008-1-REVSEP07.DOC)
Therefore, Oakland sounding data were used for determining mixing heights and other surface boundary layer parameters.
The AERMET meteorological preprocessor was used to prepare the meteorological data for AERMOD. AERMET requires location-specific surface characteristics to construct realistic planetary boundary layer (PBL) similarity profiles. Values for surface roughness (zo), Albedo (r), and Bowen ratio (Bo) must be selected for wind direction sectors. In accordance with EPA guidance,23 since the HBRP was determined to be a rural source using rural NWS data, the value of zo for each sector was selected to reflect the meteorological station site. Source site values were used for Bo and r. The sectors and the values of zo, Bo and r used in creating the AERMOD meteorological data set are shown in Table 8.1-20. The sectors are illustrated in Appendix 8.1B, Figure 8.1B-8.
TABLE 8.1-20
Location-Specific Surface Characteristics Used in AERMET
Land Use Wind Direction
Sector, Deg. Met Station Project Site
Surface Roughness,
zoa Albedo, rb
Bowen Ratio, Bo
b
0-37 Water Water 0.001 0.14 0.1
37-90 Water Grassland 0.001 0.2 0.6
90-125 Desert shrubland
Grassland 0.0725c 0.2 0.6
125-200 Residential Coniferous Forest
0.6 0.12 0.4
200-230 Residential Water 0.6 0.14 0.1
230-330 Swamp Water 0.05 0.14 0.1
330-0 Water Water 0.001 0.14 0.1
Notes: a All values for surface roughness parameters except desert shrubland taken from Roland B Stull, “An
Introduction to Boundary Layer Meteorology,” Chapter 9 (Similarity Theory), p. 380, 1988. b All values for Albedo and Bowen ratio taken from USEPA, “User’s Guide for the AERMOD Meteorological
Preprocessor (AERMET),” EPA-454/B-03-002, November 2004. c Value for desert shrubland surface roughness based on the default option of AERMET VIEW by Lakes
Environmental, Inc.
The required emission source data inputs to AERMOD include source locations, source elevations, stack heights, stack diameters, stack exit temperatures and velocities, and emission rates. The source locations are specified for a Cartesian (x,y) coordinate system where x and y are distances east and north in meters, respectively. The Cartesian coordinate system used is the Universal Transverse Mercator Projection (UTM). The stack height that can be used in the model is limited by federal and NCUAQMD Good Engineering Practice (GEP) stack height restrictions, discussed in more detail below. In addition, AERMOD requires nearby building dimension data to calculate the impacts of building downwash.
23 USEPA, “AERMOD Implementation Guide,” September 27, 2005. http://www.epa.gov/scram001/7thconf/aermod.
Deleted:
Deleted:
Deleted:

8.1 AIR QUALITY
PO062006001SAC/344005/062570015 (HBRP_008-1-REVSEP07.DOC) 8.1-39
8.1.2.6.1.3 CTDMPLUS The USEPA- approved CTSCREEN (version number 94111) and CTDMPLUS (version number 93228) models were used for refined modeling of impacts in complex terrain. The CTDMPLUS model is a refined point-source Gaussian air quality model for use in all stability conditions for complex terrain applications; CTSCREEN is the screening mode version of CTDMPLUS. Because CTDMPLUS/CTSCREEN accounts for the dimensional nature of the plume and terrain interaction, the model requires digitized terrain of the nearby topography. The digitization of terrain was accomplished by the terrain preprocessors, FITCON and HCRIT. The wind direction used in CTDMPLUS is based on the source-terrain geometry, resulting in computation of the highest impacts likely to occur. Other meteorological variables are derived from possible combinations of a set of predetermined values. CTSCREEN provides maximum concentration estimates that are similar to, but on the conservative side of, those that would be calculated from the CTDMPLUS model, which employs representative meteorological data.
CTSCREEN and CTDMPLUS are appropriate for the following applications:
• Elevated point sources; • Terrain elevations above stack top elevation; • Rural or urban areas; and • 1 hour to annual averaging time periods.25
The terrain data required by the CTSCREEN and CTDMPLUS models were created by digitizing terrain contours at periodic intervals. A sufficient number of points were selected to define the basic shape of each contour. All digitized points were input to the preprocessor programs FITCON and HCRIT, and a terrain file was generated for use in the CTSCREEN and CTDMPLUS models.
CTDMPLUS requires an extensive suite of meteorological data composed not only of wind speed, direction, and temperature, but also of horizontal and vertical wind direction standard deviations (sigma theta and sigma phi, respectively) as well as vertical wind speed standard deviation (sigma w). The data set directed by the NCUAQMD for use in modeling the project, derived from measurements taken at Woodley Island, does not include these non-standard measurements.
Conservative values for these standard deviation parameters were developed that are consistent with the available meteorological data and were used to prepare a meteorological data set that is usable in CTDMPLUS and yields conservative (i.e., high) ground-level concentrations.
The following meteorological parameters are needed for CTDMPLUS and were taken directly from the AERMET files:
• Observed mixing height, provided as the height of the convective or planetary boundary layer (PBL);
25 CTSCREEN and CTDMPLUS produce one-hour average values which are converted to longer-term averages using published EPA default conversion factors. There is no published conversion factor for the 8-hour averaging period, so a conversion factor of 0.5 was used, as recommended by EPA Region 9 Regional Meteorologist Scott Bohning.
Deleted: model
Deleted: 94111
Deleted: was
Deleted: the
Deleted: located to the south of the project site
Deleted: CTSCREEN
Deleted: , which is the screening mode of CTDMPLUS,
Deleted: As a result of
Deleted: the model
Deleted: ing
Deleted: CTSCREEN
Deleted: chosen
Deleted: onsite
Deleted: .24
Deleted: is
Deleted:
Deleted: s

8.1 AIR QUALITY
8.1-40 PO062006001SAC/344005/062570015 (HBRP_008-1-REVSEP07.DOC)
• Calculated mixing height, provided as the height of the mechanical, or surface, boundary layer (SBL);
• Friction velocity (USTAR); • Monin-Obukhov length (L); and • Roughness length (ZO).
The remaining standard deviations (sigma values) are not available from AERMOD and must be obtained from the ISCST3 files. Stability classes determined by MPRM26 or PCRAMMET27 from the measured Woodley Island meteorological data were used to select the most conservative values from the ranges recommended in EPA’s Meteorological Monitoring Guidance document, as listed in Table 8.1-2128
TABLE 8.1-21
Sigma Values for Use in CTDMPLUS Modeling
Stability Category Sigma Phi (σΦ)/ Regulatory
Range (degrees) Sigma Theta (σθ)/ Regulatory
Range (degrees)
A 11.5 22.5
B 10.0 – 11.5 17.5 – 22.5
C 7.8 – 10.0 12.5 – 17.5
D 5.0 – 7.8 7.5 – 12.5
E 2.4 – 5.0 3.8 – 7.5
F < 2.4 < 3.8
The most conservative values (that is, the values that produce the highest modeled impacts) for sigma theta and sigma phi within each range were determined by conducting a sensitivity analysis for all combinations of stack conditions to be modeled using CTDMPLUS and receptor locations for which CTDMPLUS could be used (that is, receptors above stack height). The sensitivity analysis used the upper and lower values of each range for each stability category. For example, for stability category D, four combinations were evaluated as follows:
26 The Meteorological Processor for Regulatory Models 27 EPA meteorological preprocessor 28 Tables 6-8a and 6-9a in Meteorological Monitoring Guidance for Regulatory Modeling Applications, EPA-454/R-99-005, US EPA Office of Air and Radiation, Office of Air Quality Planning and Standards, February 2000.
Deleted: -

8.1 AIR QUALITY
PO062006001SAC/344005/062570015 (HBRP_008-1-REVSEP07.DOC) 8.1-41
σΦ σθ
5.0 7.5
5.0 12.5
7.8 7.5
7.8 12.5
For stability category A, maximum values for sigma phi and sigma theta of 15.0 and 27.0, respectively, were evaluated. For stability category F, minimum values for sigma phi and sigma theta of 1.0 and 2.0, respectively, were evaluated. For the sensitivity analysis, five hills surrounding the project site (shown in the figure in Attachment 8.1B-2) and stack parameters for eight operating cases (full load and part load, gas and liquid fuel operation) were evaluated. Four different combinations of the standard deviation parameters were used for each analysis:
• Bottom of both sigma theta and sigma phi ranges • Bottom of sigma theta range; top of sigma phi range • Top of sigma theta range; bottom of sigma phi range • Top of both sigma theta and sigma phi ranges
The results of the sensitivity analysis showed that while other combinations of parameters sometimes produce higher intermediate results, the project maxima are always associated with the lowest values for the two dispersion parameters. Based on these results, the lowest values for the two dispersion parameters were used in the final CTDMPLUS modeling analyses.29
Sigma-w was estimated by multiplying sigma-phi (after conversion from degrees to radians) by the horizontal wind speed.
8.1.2.6.3 Source Data For the refined modeling analyses, AERMOD was used to model impacts in terrain at all receptors and CTSCREEN and CTDMPLUS were used to refine the analyses for impacts in terrain above stack top. For both models, each Wärtsilä engine stack was modeled as an individual point source.
For the purposes of modeling, a stack height beyond what is required by Good Engineering Practices is not allowed (NCUAQMD Rule 110, Section 7.2). However, this requirement does not place a limit on the actual constructed height of a stack. GEP as used in modeling analyses is the height necessary to ensure that emissions from the stack do not result in excessive concentrations of any air pollutant in the immediate vicinity of the source as a result of atmospheric downwash, eddies, or wakes that may be created by the source itself, nearby structures, or nearby terrain obstacles. In addition, the GEP stack height modeling restriction assures that any required regulatory control measure is not compromised by the effect of that portion of the stack that exceeds the GEP height. The USEPA guidance 29 The results of this sensitivity analysis have been provided to the District under separate cover.
Deleted: below stack base
Deleted: was
Deleted: model
Deleted: base
Deleted: because of their proximity (the 5 individual stacks in each group are within approximately 1 diameter of each other) each cluster of 5 Wärtsilä engine stacks was modeled as a single equivalent stack with exhaust temperature and velocity equal to that of the individual stacks and diameter calculated as the square root of the sum of the squares of the individual stacks. Therefore the 2 clusters of five 1.62 meter diameter stacks were modeled as 2 equivalent stacks, each having a diameter of:¶
[(1.62)2 + (1.62)2 + (1.62)2 +(1.62)2 +(1.62)2]1/2 = 3.62 meters

8.1 AIR QUALITY
8.1-42 PO062006001SAC/344005/062570015 (HBRP_008-1-REVSEP07.DOC)
(“Guideline for Determination of Good Engineering Practice Stack Height,” Revised 6/85) for determining GEP stack height indicates that GEP is the lesser of 65 meters or Hg, where Hg is calculated as follows:
Hg =H + 1.5L
where
Hg = Good Engineering Practice stack height, measured from the ground-level elevation at the base of the stack
H = height of nearby structure(s) measured from the ground-level elevation at the base of the stack
L = lesser dimension, height or maximum projected width, of nearby structure(s)
In using this equation, the guidance document indicates that both the height and width of the structure are determined from the frontal area of the structure, projected onto a plane perpendicular to the direction of the wind. For the HBRP, the nearest influencing structure is the top of the engine hall, which is 44.8 feet above ground level. Therefore, GEP stack height is 2.5 times that height, or 112 feet. The proposed stack height of 100 feet will not exceed GEP stack height, so the full physical stack height may be used in the modeling analysis.
For regulatory applications, a building is considered sufficiently close to a stack to cause wake effects when the downwind distance between the stack and the nearest part of the building is less than or equal to five times the lesser of the height or the projected width of the building. Building dimensions for the buildings analyzed as downwash structures were obtained from plot plans. The building dimensions were analyzed using the Lakes Environmental Building Profile Input Program (BPIP) to calculate 36 wind-direction-specific building heights and projected building widths for use in building wake calculations. The building dimensions used in the GEP analysis are shown in Appendix 8.1B, Table 8.1B-1. As many of the existing power plant structures will remain in place for some period of time following the startup of the new reciprocating engines, those structures are reflected in the downwash analysis.
8.1.2.6.4 Screening Procedures for the HBRP Reciprocating Engines To ensure the impacts analyzed were for maximum emission levels and worst-case dispersion conditions, a screening procedure was used to determine the inputs to the impact modeling for the new generating units. The screening procedure analyzed the reciprocating engine operating conditions that would result in the maximum impacts on a pollutant-specific basis. The operating conditions examined in this screening analysis, along with their exhaust and emission characteristics, are shown in Appendix 8.1B, Table 8.1B-3. These operating conditions represent reciprocating engine operation at maximum and minimum ambient operating temperatures (87°F and 21°F), and at 100 percent, 75 percent and minimum (50 percent) loads on natural gas and emergency backup diesel fuels. The low-load operating cases (2G, 6G, 2D and 6D) were not evaluated for 24-hour or annual average impacts, and the mid-load cases (3G, 4G, 3D, 4D) were not evaluated for annual average impacts, because these operating cases are not expected to persist for more than a few hours
Deleted: 75
Deleted: 8.1.2.6.2 Impacts from the Existing Humboldt Bay Power Plant Generating Units¶Ambient impacts from the existing Humboldt Bay Power Plant generating units were modeled using actual emissions, operating, and fuel use data. For the 1-, 3- and 8-hour averaging periods, it was assumed that all four units were operating at full load. For the 24-hour averaging period, it was assumed that the two boilers were operating at full load and that each MEPP was operating at 50 percent load. Average historical emission rates over the past 2 years were used for the annual averaging period. Emission rates and stack parameters used in evaluating the air quality impacts from the existing generating units are shown in Table 8.1B-2, Appendix 8.1B. Maximum modeled impacts are summarized in Table 8.1-21.¶TABLE 8.1-21¶Maximum Modeled Impacts from Existing Generating Units at Humboldt Bay Power Plant ... [9]

8.1 AIR QUALITY
PO062006001SAC/344005/062570015 (HBRP_008-1-REVSEP07.DOC) 8.1-43
at any time. The 24-hour average PM10 impacts were modeled using the 1542 lb/day limit discussed in Section 8.1.2.3.2.
Ambient impacts for each of the operating cases were modeled using USEPA’s AERMOD model and five years of on-site meteorological data, as described above. The results of the unit impact analysis are presented in Appendix 8.1B, Table 8.1B-4. The analysis showed that for most pollutants and averaging periods, modeled impacts were highest under full load operating conditions, while 24-hour average PM10 impacts were highest under part load conditions.
8.1.2.7 Results of the Ambient Air Quality Modeling Analysis 8.1.2.7.1 Refined Air Quality Impact Analysis The stack parameters and emission rates used to model impacts from the Wärtsilä reciprocating engines and emergency equipment are shown in Appendix 8.1B, Table 8.1B-5. The unit impact/screening and refined analyses included simple, intermediate, and complex terrain. Terrain features were taken from USGS DEM data and 7.5-minute quadrangle maps of the area including Eureka, Cannibal Island, Fields Landing, McWhinney Creek, and Arcata South.
The model receptor grids were derived from 30-meter DEM data. The CEC guidance cited above was used to locate receptors. Twenty-five-meter refined receptor grids were used in areas where the coarse grid analyses indicated modeled maxima for each site plan would be located. In general, the CEC staff recommends extending the 25-meter fine grid to a distance of 1 km from the location of the coarse grid maximum for each pollutant and averaging period. For this analysis, and after discussion with the CEC staff, the extent of the AERMOD fine grids was reduced to a distance of two coarse grid spacings from the coarse grid maxima. Modeled concentrations at the edges of each fine grid were examined to ensure that the maxima were captured on these grids. Maps showing the layout of each receptor grid around the site plan are presented in Figures 8.1B-9A, 9B and 9C, Appendix 8.1B.
As discussed above, the refined modeling used CTSCREEN and CTDMPLUS to examine maximum impacts in the complex terrain surrounding the facility. The CTSCREEN coarse grids covered the terrain above stack top elevation nearest the facility, where the maximum complex terrain impacts from the initial AERMOD modeling analysis were shown to be located. The coarse grid resolution is 153 m by 153 m, extending 2.9 km in each direction to cover Humboldt Hill. Each CTSCREEN fine grid has a resolution of 25 m by 25 m and extends 500 m in each direction from the location of the CTSCREEN coarse grid maximum impacts. For CTDMPLUS, the coarse grid resolution is 250 m by 250 m, covering the entirety of each of five identified hills. The CTDMPLUS fine grid has a resolution of 25 m by 25 m and extends 400 m in each direction from the location of the CTDMPLUS coarse grid maximum 1-hr impact.
The higher of the impact in flat terrain (below stack base, from AERMOD) or in elevated terrain (above stack top from CTSCREEN or CTDMPLUS) is reported as the maximum modeled impact for each pollutant and averaging period. The CTSCREEN and CTDMPLUS receptor grids are shown in Figure 8.1B-9D, Appendix 8.1D.
Both normal and emergency operations were modeled for the engines. Normal operation reflects routine natural gas operation of the Wärtsilä reciprocating engines with up to 50 hours per year of testing and maintenance operation per engine on diesel fuel. Emergency
Deleted: and annual average
Deleted: south of
Deleted:
Deleted: base
Deleted: 0
Deleted: 0
Deleted: 3
Deleted: from the locations of the maximum impacts
Deleted:
Deleted: 250
Deleted:
Deleted: base.
Deleted: 50

8.1 AIR QUALITY
8.1-44 PO062006001SAC/344005/062570015 (HBRP_008-1-REVSEP07.DOC)
operation reflects worst-case daily operation of the Wärtsilä reciprocating engines on liquid fuel for short-term averaging periods (24 hours and less).
8.1.2.7.2 Inversion Breakup Fumigation Modeling Inversion breakup fumigation occurs when a stable layer of air lies a short distance above the release point of a plume and unstable air lies below. Under these conditions, an exhaust plume may be drawn to the ground, causing high ground-level pollutant concentrations. Although fumigation conditions rarely last as long as 1 hour, relatively high ground-level concentrations may be reached during that time. For this analysis, fumigation was assumed to occur for up to 90 minutes, per USEPA guidance.
The SCREEN3 model was used to evaluate maximum ground-level concentrations for short-term averaging periods (24 hours or less). Although this modeling analysis is not required by District regulation, guidance from USEPA30 was followed in evaluating fumigation impacts. Since SCREEN3 is a single-source model, a single engine was modeled and the results multiplied by 10. The maximum fumigation impact from this analysis, which is shown in more detail in Appendix 8.1B, Table 8.1B-6, showed that impacts under fumigation conditions are expected to be lower than the maximum concentrations calculated by AERMOD under downwash conditions. Fumigation impacts for the reciprocating engines occurred approximately 7 km to 9 km from the facility, depending upon engine load (the AERMOD maximum 1-hour impact occurs about 1 km from the engine stacks). Inversion breakup impacts are shown in Table 8.1-22 below.
30 USEPA-454/R-92-019, “Screening Procedures for Estimating the Air Quality Impact of Stationary Sources, Revised.”
Deleted: , and up to 800 hours per year of emergency backup operation on liquid fuel (annual average) for each engine
Deleted: 14
Deleted: 18

8.1 AIR QUALITY
PO062006001SAC/344005/062570015 (HBRP_008-1-REVSEP07.DOC) 8.1-45
TABLE 8.1-22 Results of the Specialized Modeling Analyses (Total Impacts for 10 Engines)
Modeled Concentration (μg/m3)
Pollutant Averaging
Period
Startup, Normal
Conditionsa Startup,
Liquid Fuelb
Inversion Breakup
Fumigatione Shoreline
Fumigatione
NO2 1 hourd 229.7 338 74.1 224.6
SO2 1 hour 3 hours
24 hours
c
c
c
c
c
c
1.5 1.2 0.5
10.7 5.3 0.7
CO 1 hour 8 hours
2,055 f
b
f 25.8 14.1
179.5 34.3
PM10 24 hours c c 8.7 12.9
Notes: a Modeled using the maximum hourly NOx and CO emission rates in Table 8.1-17. b Modeled using the higher hourly NOx emission limit, which would apply only under emergency conditions.
See discussion in Section 8.1.2.3.3 and 8.1.2.7.4 as well as definition of emergency conditions in Section 8.1.5.2.2.2.
c Not applicable, because emissions are not elevated above normal levels during startup. d Ozone limited using highest hourly ozone concentration at Ukiah during 2001-2005. e These analyses are for short-term phenomena and are evaluated only for short-term averaging periods.
PM10 impacts reflect 1542 lb/day limit. f Not applicable, because startup emissions are included in the 8-hour and longer-term modeling.
8.1.2.7.3 Shoreline Fumigation Modeling Shoreline fumigation modeling is used to determine the impacts as a result of over-water plume dispersion. Because land surfaces tend to both heat and cool more rapidly than water, shoreline fumigation tends to occur on sunny days when the denser cooler air over water displaces the warmer, lighter air over land. During an inland sea breeze, the unstable air over land gradually increases in depth with inland distance. The boundary between the stable air over the water and the unstable air over the land and the wind speed determine if the plume will loop down before much dispersion of the pollutants has occurred.
SCREEN3 can examine sources within 3,000 meters of a large body of water, and was used to calculate the maximum shoreline fumigation impact. The model uses a stable onshore flow and a wind speed of 2.5 meters per second; the maximum ground-level shoreline fumigation concentration is assumed by the model to occur where the top of the stable plume intersects the top of the well-mixed thermal inversion boundary layer (TIBL). The SCREEN3 default TIBL height of 6 was used to determine facility impacts due to shoreline fumigation, which is assumed to occur for up to 90 minutes. The shoreline fumigation modeling analysis is shown in more detail in Table 8.1B-7, Appendix 8.1B.
Shoreline fumigation impacts for the reciprocating engines were predicted to occur at a distance of approximately 0.5 km from the engine stacks (the AERMOD maximum 1-hour impact occurs about 1 km from the engine stacks). Shoreline fumigation impacts are
Deleted: (Natural Gas
Deleted: / Diesel)
Deleted: a
Deleted: a
Deleted: 198.1/262.8
Deleted: 27
Deleted: 176.9
Deleted:
Deleted: c
Deleted: 3
Deleted: 1.
Deleted:
Deleted: c
Deleted: c
Deleted: 60.20.1
Deleted: 0.2
Deleted:
Deleted: 9.42.5
Deleted: 61.6
Deleted: 786.1/843.2
Deleted: b
Deleted: /PM2.5
Deleted: 2.9
Deleted: 6.1
Deleted: These analyses are for short-term phenomena and are evaluated only for short-term averaging periods.
Deleted: Not applicable, because startup emissions are included in the 8-hour and longer-term modeling.
Deleted: 1.5

8.1 AIR QUALITY
8.1-46 PO062006001SAC/344005/062570015 (HBRP_008-1-REVSEP07.DOC)
summarized along with inversion breakup fumigation impacts and impacts during startup in Table 8.1-22.
8.1.2.7.4 Engine Startup Short-term ambient impacts from the facility during engine startup may be higher than impacts during normal operation because emission control systems are not fully operational during some part of the initial startup period. Therefore, facility impacts were also evaluated during the startup of all 10 engines simultaneously to evaluate short-term impacts under worst-case startup emissions. Although engines will typically be started up on natural gas, under emergency operating conditions it could be necessary to start up some of the engines on diesel fuel.31 Emission rates expected during startups were provided by Wärtsilä and were presented in Table 8.1-16. Engine exhaust parameters for 50 percent load operation on natural gas (Case 2G) and diesel (Case 6D) were used to characterize engine exhaust during startup, because those operating cases produced the highest modeled impacts in the engine screening analysis. CO and NOx emission rates from Table 8.1-17 were used for the modeling analysis. Startup impacts were evaluated for the 1-hour averaging period; startup impacts are included in the modeling of 8-hour average CO impacts under normal operating conditions. The emission rates and stack parameters used are shown in Table 8.1B-8, Appendix 8.1B. Startup impacts were modeled using AERMOD and complex terrain impacts were refined using CTSCREEN. The results of the analysis are summarized in Table 8.1-22.
8.1.2.7.5 Ozone Limiting For AERMOD, one-hour NO2 impacts were modeled using AERMOD_PVMRM. AERMOD_PVMRM uses hourly ozone data to perform ozone-limiting calculations on individual plumes on an hour-by-hour basis. Concurrent ozone data collected at the nearest representative monitoring station, Ukiah, were used for this analysis.32 CTSCREEN and CTDMPLUS do not include built-in ozone-limiting options. Concentrations modeled using CTSCREEN were ozone corrected using the highest hourly ozone reading during each year of the 5-year period. Annual NOx impacts were converted to NO2 using the EPA-guidance Ambient Ratio Method and the nationwide default conversion rate of 0.75.
8.1.2.7.6 Engine Commissioning The commissioning period begins when the engines are prepared for first fire and ends upon successful completion of initial performance testing. There are several high emissions scenarios possible during commissioning. The first is the period prior to SCR system and oxidation catalyst installation, when the engines are being tuned. Under this scenario, NOx emissions would be high because the NOx emissions control system would not be functioning and because the engines would not be tuned for optimum performance. CO emissions would also be high because engine performance would not be optimized and the CO emissions control system would not be functioning. The second high emissions scenario may occur when the engines have been tuned but the SCR and oxidation catalyst installation is not complete. Since the control system installation would not be complete,
31 See definition of emergency conditions in Section 8.1.5.2.2.2. 32 Ukiah hourly ozone data were selected instead of data from Willits because monitored hourly concentrations in Ukiah were generally higher than those in Willits. Contemporaneous Willits ozone data were used to fill in missing hours in the Ukiah data set. A discussion of why the Ukiah and Willits ozone data are representative of ozone at the project site is provided in Section 8.1.5.2.1.1.
Deleted: all 10 engines simultaneously
Deleted: used for this scenario were based on data provided by Wärtsilä
Deleted: One
Deleted: OLM
Deleted: OLM
Deleted: Section

8.1 AIR QUALITY
PO062006001SAC/344005/062570015 (HBRP_008-1-REVSEP07.DOC) 8.1-47
NOx and CO levels would again be high. Wärtsilä expects to perform initial commissioning activities on 5 engines at a time, for between 30 and 60 days. Performance and emission testing would follow, requiring an additional 45 to 90 days. Commissioning activities and expected emissions are shown in more detail in Table 8.1B-10, Appendix 8.1B.
The existing Humboldt Bay Power Plant generating units will be in operation during the commissioning of the HBRP engines. An assessment of the air quality impacts of this combined operation will be included in the cumulative impacts analysis, as discussed in the protocol provided in Appendix 8.1F.
Air quality impacts during the commissioning period were determined using the emission rates in Table 8.1B-10 and the screening modeling results in Table 8.1B-4. One-hour average NO2 impacts during commissioning were modeled using AERMOD_PVMRM and concurrent Ukiah ozone data. The CTSCREEN model was used to evaluate refined impacts in complex terrain. Modeled impacts are shown in Table 8.1-23.
TABLE 8.1-23
Ambient Impacts During Initial Commissioning
Maximum Modeled Impact During Commissioning, μg/m3
Operating Mode NO2,
1-hr avga CO,
1-hr avg CO,
8-hr avg PM10,
24-hr avg Test run and tuning 222.3 1,025 435.9 13.8 Alignment 233.3 1,247 266.2 3.7 SCR tuning on liquid fuel 177.1 176.1 74.8 13.7
Note: a Modeled using AERMOD_PVMRM and CTSCREEN and hourly ozone data from Ukiah.
8.1.2.8 Total Facility Impacts The maximum facility impacts calculated from the modeling analyses described above are summarized in Table 8.1-24. The highest modeled short-term impacts are expected to occur under startup and shoreline fumigation conditions.
Although EPA guidance (71 FR 6727) provides that compliance with the federal PM2.5 NAAQS should be evaluated using the PM10 NAAQS and not modeled directly, at the request of the District, compliance with both the federal 24-hour average AAQS and the state and federal annual average AAQS for PM2.5 have been addressed based on PM2.5 for non-PSD purposes. PM2.5 impacts are discussed separately below.
Deleted: OLM
Deleted: 104.0
Deleted: 396.3
Deleted: 184.8
Deleted: 5.8
Deleted: 127.0
Deleted: 476.0
Deleted: 113.0
Deleted: 1.6
Deleted: 31.3
Deleted: 68.6
Deleted: 31.6
Deleted: 5.8

8.1 AIR QUALITY
8.1-48 PO062006001SAC/344005/062570015 (HBRP_008-1-REVSEP07.DOC)
TABLE 8.1-24 Results of the Ambient Air Quality Modeling Analysis
Modeled Concentration (µg/m3)
Pollutant Averaging Time Normal
Operationa Emergency Operationb Startup
Shoreline Fumigation
NO2 1-hour Annual
174.7c 2.5
209.1i
n/a 229.7d
--e 224.6
--f
SO2 1-hour 3-hour 24-hour Annual
25.4 18.3 3.7 0.1
--g
--g
--g
n/a
--h --h
--h
--h
10.7 5.3 0.7 --f
CO 1-hour 8-hour
264.1 n/a
492.2i
242.3 1,925d
--d 179.5 34.2
PM10 24-hour Annual
18.7 3.1
34.1 n/a
--h --h
12.9 --f
Notes: a Wartsila generators operating on natural gas for short-term averaging periods; 50 hrs/yr of liquid fuel firing for
annual averaging period. b Wartsila generators operating on emergency backup diesel fuel for short-term averaging periods. c Includes emergency black start generator and fire pump engine testing. Black start generator limited to 45
minutes of operation for testing and maintenance in any hour. d Startup on natural gas fuel. e Not applicable, because startup emissions are included in the 8-hour and longer-term (“Normal Operation”)
modeling. f Not applicable, because shoreline fumigation is a short-term phenomenon and as such is evaluated only for
short-term averaging periods. g Short-term SO2 concentrations are highest during natural gas firing, because 1 gr/100 scf natural gas fuel
sulfur content is higher than 15 ppm CARB diesel fuel sulfur limit. h Not applicable, because emissions are not elevated above normal levels during startup. I Excludes emergency equipment. To determine a project’s air quality impacts, the modeled concentrations are added to the highest reported background ambient air concentrations and then compared to the applicable ambient air quality standards. The modeled concentrations have already been presented in earlier tables. The highest reported background ambient concentrations are listed in Table 8.1-25. More detailed discussions of why the data collected at these stations are representative of ambient concentrations in the vicinity of the project are provided in Sections 8.1.1.3.2 and 8.1.5.2.1.1.
Table 8.1-25 presents the highest reported concentrations of NOx, CO, SO2, and PM10 recorded between 2004 and 2006 from the Willits, Ukiah, and Eureka monitoring stations.
Deleted: 19.0c
1.7
Deleted: 160.42.4
Deleted: 262.8d
—e
Deleted: 176.9—f
Deleted: —
Deleted:
Deleted: —
Deleted: 3
Deleted: .
Deleted:
Deleted: —
Deleted: 1.8
Deleted:
Deleted:
Deleted: —
Deleted: 2
Deleted: 7
Deleted: —
Deleted: 51.3
Deleted: 55.8i
Deleted: 843.2j
d
Deleted: 61.6
Deleted: PM2.5/
Deleted: 21.7k¶
Deleted: 18.6l
Deleted: —g
Deleted: 8.9f
Deleted: .2
Deleted: 1.4
Deleted: ; 800 hrs/yr of liquid
Deleted: .
Deleted: Max. hourly NO2
Deleted: is 338.6µg/m3
Deleted: liquid
Deleted: Typical natural gas
Deleted: j. Startup on liquid
Deleted: As discussed earlier, 5
Deleted: and PM2.5
Deleted: 2003
Deleted: 2005
... [10]
... [14]
... [21]
... [13]
... [20]
... [23]
... [22]
... [15]
... [12]
... [24]
... [16]
... [25]
... [17]
... [26]
... [18]
... [11]
... [19]

8.1 AIR QUALITY
PO062006001SAC/344005/062570015 (HBRP_008-1-REVSEP07.DOC) 8.1-49
TABLE 8.1-25 Maximum Background Concentrations, 2004-2006 (µg/m3)
Pollutant Averaging Time 2004 2005 2006
NO2 1-hour, Willits 1-hour, Ukiah annual, Willits annual, Ukiah
67.7 69.6 15.1 17.0
52.6 69.6 15.1 15.1
75.2 73.3 17.0 15.1
SO2a 1-hour, SF
3-hour, SF 24-hour, SF Annual, SF
114.4 70.2 21.0 5.3
49.4 33.8 18.4 5.3
65.0 39.0 15.3 5.8
CO 1-hour, Willits 1-hour, Ukiah 8-hour, Willits 8-hour, Ukiah
2250 2875 1300 1978
2125 3250 1167 1678
2375 2750 1211 1800
PM10b 24-Hour
Annual 64
20.7 71
13.6 72.2 21.1
Notes: a SO2 background data collected at San Francisco Arkansas Street. b PM10 data collected at Eureka I Street.
8.1.2.8.1 Normal and Emergency Operations Maximum ground-level impacts due to operation of the HBRP are shown together with the ambient air quality standards in Table 8.1-26. The impacts shown in Table 8.1-26 reflect typical facility operation in natural gas mode, with operation of the emergency equipment (black start generator and fire pump engine) and of the Wärtsilä reciprocating engines in diesel mode only for allowable testing and maintenance hours (50 hours per year). The ambient air quality modeling results are extremely conservative and are designed to overpredict ambient concentrations because they evaluate impacts under a combination of worst-case conditions that are unlikely to occur simultaneously. The modeling combines the highest allowable emission rates with the most extreme meteorological conditions and the equipment operating load conditions that result in the highest ambient impact; therefore, it is extremely unlikely that the ambient concentrations predicted by the models will ever actually be realized. However, this analysis demonstrates that even under these combinations of conditions that overpredict impacts, the HBRP will not cause or contribute to violations of any state or federal air quality standards, with the exception of the state PM10 standards. For this pollutant, existing concentrations already exceed the state standards.
Deleted: 2003-2005
Deleted: 2003
Deleted: 2004
Deleted: 2005
Deleted: 99
Deleted: 67.7¶
Deleted: 52.6¶69.6¶15.1¶
Deleted: 79.0¶17.0¶
Deleted: 17.0
Deleted: 62
Deleted: 114
Deleted: 49.4¶33.
Deleted: 44
Deleted: 70.2¶21.0¶
Deleted: 18.4¶
Deleted: ¶18.4¶5.3
Deleted: 6,625¶6,000¶1,767¶2,422
Deleted: ,250
Deleted: ,125
Deleted: 2,875¶1,300¶1,978
Deleted: 3,250¶1,167¶1,678
Deleted: 71¶17.8
Deleted: 64¶20.7
Deleted: 71¶13.6
Deleted: PM2.5b
Deleted: c 24-hour average PM2.5 value shown is 98th percentile value as that is the basis of the ambient air quality
Deleted: s
Deleted: and 8.1-27
Deleted: on liquid backup
Deleted: Table 8.1-26
... [27]
... [28]
... [29]
... [30]

8.1 AIR QUALITY
8.1-50 PO062006001SAC/344005/062570015 (HBRP_008-1-REVSEP07.DOC)
TABLE 8.1-26 Modeled Maximum Impacts
Pollutant Averaging Time
Maximum Facility Impact
(µg/m3) Background
(µg/m3)
Total Impact (µg/m3)
State Standard (µg/m3)
Federal Standard (µg/m3)
NO2 1-hour, natural gas mode
1-hour, diesel mode Annuala
174.7
209.1
2.5
75.2 75.2 17.0
250 284 20
338 338 56
– --
100
SO2c 1-hour
3-hour 24-hour Annuala
25.4 18.3 3.7 0.1
114.4 70.2 21.0 5.8
140 88 25 5.9
650 –
109 –
– 1300 365 80
CO 1-hour, natural gas mode
1-hour, diesel mode 8-hour, diesel modeb
264.1
492.2
242.2
3,250 3,250 1,978
3,514 3,742 2,220
23,000 23,000 10,000
40,000 40,000 10,000
PM10 24-hour, natural gas mode
24-hour, diesel mode Annuala
18.7 34.1 3.1
72.2 72.2 21.1
91 106 24.2
50 50 20
150 150 50
Notes: a Operation in natural gas mode with up to 50 hours per year per engine of operation in diesel mode for testing
and maintenance. b All reciprocating engines operating on liquid fuel; includes one 1-hour startup. c SO2 emissions on natural gas are higher than SO2 emissions on diesel fuel, so modeled SO2 impacts for
emergency operations are lower than for normal operation and are not shown.
8.1.2.8.2 Impacts During Startup and Commissioning Maximum modeled 1-hour average NO2 and CO impacts during startup are summarized in Table 8.1-27. One-hour average NO2 and CO impacts during commissioning are lower than impacts during startup, as shown in Table 8.1-23. SO2 and PM10 impacts are not higher during startup or commissioning activities than during normal and emergency engine operation, so these pollutants are not included here.
Deleted: Maximum ground-level impacts due to operation of the HBRP are shown together with the ambient air quality standards in Tables 8.1-26 and 8.1-27. The impacts shown in Table 8.1-26 reflect typical facility operation, with operation of the emergency equipment (black start generator and fire pump engine) and of the Wärtsilä reciprocating engines on liquid backup fuel only for allowable testing and maintenance hours (50 hours per year). Table 8.1-26 shows maximum modeled impacts under reasonably foreseeable worst case conditions, with maximum anticipated operation
Deleted:
Deleted:
Deleted:
Deleted: 118
Deleted:
Deleted:
Deleted: .
Deleted:
Deleted:
Deleted:
Deleted:
Deleted:
Deleted:
Deleted:
Deleted: 7
Deleted: 3
Deleted:
Deleted:
Deleted: 786.1
Deleted:
Deleted:
Deleted: 460
Deleted: 2
Deleted: 71
Deleted:
Deleted: .2
Deleted: PM2.5
Deleted: Normal operations
Deleted: c
... [37]
... [34]
... [36]
... [39]
... [38]
... [40]
... [31]
... [33]
... [41]
... [35]
... [42]
... [32]

8.1 AIR QUALITY
PO062006001SAC/344005/062570015 (HBRP_008-1-REVSEP07.DOC) 8.1-51
TABLE 8.1-27 Modeled Maximum Impacts During Startup Activities
Pollutant Averaging Time
Maximum Facility Impact (µg/m3)
Background (µg/m3)
Total Impact (µg/m3)
State Standard (µg/m3)
Federal Standard (µg/m3)
NO2 1-hour, startupa 1-hour, emergency startupb
261.8 338.0
75.2 --
337 338
338 338
– --
CO 1-hour, startup 2,054.8 3,250 5,305 23,000 40,000
Notes: a Operation in compliance with 392 lb/hr limit. b Operation in compliance with 676 lb/hr limit.
8.1.2.8.3 Compliance with the Federal PM2.5 Standards As discussed above, the USEPA has indicated in several policy documents that modeling techniques for PM2.5 have not yet been developed, so compliance with the federal PM2.5 standards should be demonstrated through compliance with the PM10 standards. However, for this project the CARB and District staffs requested a demonstration, through modeling, that the proposed project would not cause a violation of the federal PM2.5 standards.
Compliance with the federal 24-hour average PM2.5 standard was demonstrated by combining modeled 24-hour average concentrations for each day with contemporaneous (with the meteorological data) 24-hour average PM2.5 concentrations from the Eureka monitor for each day during the 4-year modeling period (2001 through 200433). Since PM2.5 measurements are taken on a once-in-six-day basis, each PM2.5 measurement was presumed to represent the day of measurement and each subsequent day until a new monitored concentration was collected. Missing data (beyond these 5-day gaps) were filled in by interpolation using data from the monitoring days immediately preceding and following the missing data point. Compliance with the standard is calculated as the 98th percentile of 24-hour PM2.5 concentrations in a year, averaged over three years.
To calculate the 98th percentile 24-hour PM2.5 concentration from 365 daily values, the following formula was used:
P0.98y = X[i+1]
where:
P0.98y = 98th percentile value for year y
X[i+1] = the (i+1)th number in the ordered series of numbers
i = the integer part of the product of 0.98 and n
The three year average 24-hour 98th percentile is calculated by averaging 98th percentile annual values obtained for three consecutive years.
33 No monitored PM2.5 concentrations are available for the Eureka monitoring station between June 27 and November 27, 2005. Because of this large amount of missing data, 2005 was not included in the evaluation of PM2.5 impacts.
Deleted: ill
Deleted: be

8.1 AIR QUALITY
8.1-52 PO062006001SAC/344005/062570015 (HBRP_008-1-REVSEP07.DOC)
Solving for P on an annual basis produces:
0.98 x 365 = 357.7 == i+1 = 35834
which corresponds to the 8th highest value for each year.
A step-by-step description of the procedure is as follows:
• Perform refined modeling for two operating cases (natural gas mode and diesel mode) that produced highest concentration in screening step, using AERMOD for all receptors and CTDMPLUS for receptors above stack top elevation, and 4 years of Woodley Island meteorological data35. Obtain the highest modeled concentration for each receptor for each 24-hour period.
• Select the highest modeled concentrations for each calendar day for the gas and diesel cases.
• Add the modeled concentration for each day to the monitored background value from the Eureka monitor for the corresponding day.
• Select the 98th percentile value (8th highest total concentration) for each year. Calculate the three-year average for 2001 through 2003 and for 2002 through 2004. Compare the higher of the two averages with the ambient air quality standard, 35 µg/m3. If the three-year average of the 98th percentile values is less than the standard, compliance with the NAAQS has been demonstrated.
Tables showing the background values and the maximum modeled PM2.5 concentrations for each calendar day are provided in Appendix B. The 98th percentile modeling results and the 3-year averages are summarized in Table 8.1-28.
The 3-year average 98th percentile total 24-hour average PM2.5 concentration for natural gas mode operation is 30.6 µg/m3, while the 3-year average 98th percentile total 24-hour average PM2.5 concentration for diesel mode operation is 33.8 µg/m3. Both concentrations are below the federal standard of 35 µg/m3.
34 For a leap year, the 98th percentile value is the 359th sample, which is also the 8th highest value. 35 Because there are so many PM2.5 readings missing during the 2005 calendar year, CARB has determined that 2005 is not a valid year for calculating statistics and for determining attainment. For this reason, 2005 data were not included in the assessment of compliance with the PM2.5 standard..
Deleted: µ
Deleted: See footnote 1

8.1 AIR QUALITY
PO062006001SAC/344005/062570015 (HBRP_008-1-REVSEP07.DOC) 8.1-53
TABLE 8.1-28 Results of the 24-Hour Average PM2.5 Ambient Air Quality Modeling Analysis
Natural Gas Mode Diesel Mode
Calendar Year Modeled
Conc., μg/m3 Background Conc., μg/m3
98th Percentile
Total Conc., μg/m3
Modeled Conc., μg/m3
Background Conc., μg/m3
98th Percentile
Total Conc., μg/m3
2001 3.23 29.00 32.23 9.98 25.00 34.98
2002 2.67 15.25 17.92 14.04 15.25 29.29
2003 1.32 34.70 36.02 2.42 34.70 37.12
2004 18.75 7.80 26.55 29.38 4.80 34.18
Avg., 01-03 30.57 33.80
Avg., 02-04 28.67 31.93
Higher Average of the 98th Percentile
Values
30.6 33.8
8.1.2.9 Screening Health Risk Assessment The screening health risk assessment (SHRA) was conducted to determine expected impacts on public health of the noncriteria pollutant emissions from the facility. The SHRA was conducted in accordance with the California Office of Environmental Health Hazard Assessment (OEHHA)/CARB Risk Assessment Guidelines (August 2003). The SHRA estimated the offsite cancer risk to the maximally exposed individual (MEI), as well as indicated any adverse effects of non-carcinogenic compound emissions. The CARB/OEHHA Health Risk Assessment computer program was used to evaluate multipathway exposure to toxic substances. Because of the conservatism (overprediction) built into the established risk analysis methodology, the actual risks will be lower than those estimated.
A health risk assessment requires the following information:
• Unit risk factors (or carcinogenic potency values) for any carcinogenic substances that may be emitted
• Noncancer Reference Exposure levels (RELs) for determining non-carcinogenic health impacts
• One-hour and annual average emission rates for each substance of concern
• The modeled maximum offsite concentration of each of the pollutants emitted.
Pollutant-specific unit risk factors are the estimated probability of a person contracting cancer as a result of constant exposure to an ambient concentration of 1 µg/m3 over a 70-year lifetime. The SHRA uses unit risk factors specified by the OEHHA and implemented in CARB’s Hotspots Analysis and Reporting Program (HARP). The cancer risk for each

8.1 AIR QUALITY
8.1-54 PO062006001SAC/344005/062570015 (HBRP_008-1-REVSEP07.DOC)
pollutant emitted is the product of the unit risk factor and the modeled concentration. All of the pollutant cancer risks are assumed to be additive.
An evaluation of the potential noncancer health effects from long-term (chronic) and short-term (acute) exposures has also been included in the SHRA. Many of the carcinogenic compounds are also associated with noncancer health effects and are therefore included in the determination of both cancer and noncancer effects. RELs are used as indicators of potential adverse health effects. RELs are generally based on the most sensitive adverse health effect reported and are designed to protect the most sensitive individuals. However, exceeding the REL does not automatically indicate a health impact. The OEHHA reference exposure levels were used to determine any adverse health effects from noncarcinogenic compounds. A hazard index for each noncancer pollutant is then determined by the ratio of the pollutant annual average concentration to its respective REL for a chronic evaluation. The individual indices are summed to determine the overall hazard index for the project. Because noncancer compounds do not target the same system or organ, this sum is considered conservative. The same procedure is used for the acute evaluation.
The HBRP SHRA results are compared with the established risk management procedures for the determination of acceptability. The established risk management criteria include those listed below.
• If the potential increased cancer risk is less than 1 in 1 million, the facility risk is considered not significant.
• If the potential increased cancer risk is greater than 1 in 1 million but less than 10 in 1 million and Toxics-Best Available Control Technology (TBACT) has been applied to reduce risks, the facility risk is considered acceptable.
• If the potential increased cancer risk is greater than 10 in 1 million and there are mitigating circumstances that, in the judgment of a regulatory agency, outweigh the risk, the risk is considered acceptable.
• For noncancer effects, total hazard indices of one or less are considered not significant.
• For a hazard index greater than 1, OEHHA and the reviewing agency conduct a more refined review of the analysis and determine whether the impact is acceptable.
The SHRA includes the noncriteria pollutants listed above in Table 8.1-19. The receptor grid described earlier for criteria pollutant modeling was used for the SHRA. The SHRA results for the HBRP are presented in Table 8.1-29, and the detailed calculations are provided in Appendix 8.1C. The locations of the maximum modeled risks are shown in Figure 8.1C-1.

8.1 AIR QUALITY
PO062006001SAC/344005/062570015 (HBRP_008-1-REVSEP07.DOC) 8.1-55
TABLE 8.1-29 Screening Health Risk Assessment Results Cancer Risk to Maximally Exposed Individual: 8.6 in 1 million
Maximum Cancer Risk to Residents: 8.6 in 1 million
Maximum Cancer Risk to Workers: 1.3 in 1 million
Acute Health Hazard Index, Natural Gas Mode Operation: 0.56
Acute Health Hazard Index, Diesel Mode Operation: 0.09
Chronic Health Hazard Index: 0.09
The SHRA results indicate that the acute and chronic hazard indices are well below 1.0, so are not significant. The cancer risk to a maximally exposed individual is 8.6 in 1 million, well below the 10 in 1 million level. The generating units and emergency equipment comply with TBACT because their DPM emission rates will comply with the DPM limits of the ATCM, so this cancer risk is considered to be acceptable. The SHRA results indicate that, overall, the HBRP will not pose a significant health risk at any location.
To better place these estimated risks into perspective, it is important to note that the risk assessment methods used to transform emissions into health risk estimates involve a series of conservative assumptions. In this case “conservative” means that a particular assumption is selected or stated in a manner that deliberately overstates the magnitude of health impacts potentially associated with exposure to a chemical substance. Examples of conservative assumptions include the following:
• Selecting meteorological conditions that produce the highest concentration in air when modeling emissions;
• Estimating risks based on potential exposure to an individual who is assumed to be located continuously (24 hours/day, 365 days/year, for a 70-year lifetime) at the one point where the highest pollutant concentrations will be found; and
• Calculating the excess lifetime cancer risk associated with this highly unlikely scenario by statistically extrapolating to humans the maximum cancer incidence as observed from a laboratory study using the most sensitive animal species.
When using such estimates to evaluate the risks potentially associated with these emissions, it should be remembered that the actual risks are very likely to be much lower than projected in the risk assessment. The actual risks are highly unlikely to ever approach or exceed the risks projected in the risk assessment.
The risk assessment is discussed in more detail in Section 8.9, Public Health.
8.1.2.10 Construction Impacts Analysis Emissions due to the construction phase of the project have been estimated, including an assessment of emissions from vehicle and equipment exhaust and the fugitive dust generated from material handling. A dispersion modeling analysis was conducted based on these emissions. A detailed analysis of the emissions and ambient impacts is included in
Deleted: 8
Deleted: 6.5
Deleted: 6.5
Deleted: Cancer Burden:
Deleted: 0.15
Deleted: 0.39
Deleted: 0.05
Deleted: 6.5
... [49]

8.1 AIR QUALITY
8.1-56 PO062006001SAC/344005/062570015 (HBRP_008-1-REVSEP07.DOC)
these emissions. A detailed analysis of the emissions and ambient impacts is included in Appendix 8.1D. The results of the analysis indicate that the maximum construction impacts will be below the state and federal standards for all the criteria pollutants emitted. The best available emission control techniques will be used. The HBRP construction site impacts are not unusual in comparison to most construction sites; construction sites that use good dust suppression techniques and low-emitting vehicles typically do not cause violations of air quality standards.
Impacts from exposure to DPM generated during project construction have also been evaluated. The carcinogenic risk due to exposure to DPM during construction activities is expected to be between approximately 5 and 42 in 1 million.36 Although the high end of these risk estimates exceeds the significance level of 10 in 1 million, the area in which the risk may exceed 10 in 1 million extends barely beyond the freeway east of the Humboldt Bay Power Plant and does not include any residences, schools, or other potentially sensitive receptors.
The results of this risk screening analysis are presented in more detail in Appendix 8.1D.
8.1.3 Cumulative Air Quality Impacts Analysis An analysis of potential cumulative air quality impacts that may result from the HBRP and other reasonably foreseeable projects is generally required when project impacts are significant. The cumulative air quality impacts analysis presented in Appendix 8.1F demonstrates that the project is not expected to cause any local or regional cumulative air quality impacts.
8.1.4 Mitigation In addition to implementing BACT, District Rule 110 requires the HBRP to provide full emission offsets (emissions reduction credits, or ERCs) for net increases in any nonattainment pollutants or their precursors. Because the NCUAQMD is a nonattainment area for the state PM10 standard, HBRP must offset increases in NOx, SO2 and ROC as well as PM10, as all of these pollutants are considered to be precursors to PM10. Maximum hourly, daily, quarterly, and annual emissions from HBRP are based on expected operation of the HBRP, as discussed in Section 8.1.2.2 and presented in Appendix 8.1A.
Offsets must be provided on a quarterly basis. Because HBRP is considered a reconstructed facility (see Section 8.1.5.2.3.1), offsets must be provided for emissions from the reconstructed facility which exceed 25 tpy, as shown in Table 8.1-30. Mitigation for project emissions will be provided through the shutdown of the existing generating units and through acquisition of ERCs as delineated in Appendix 8.1G. The shutdown of the existing generating units will result in a large net reduction in NOx emissions, and increases in SO2, CO, ROC, and PM10. Offsets are not generally required for CO, provided an ambient air quality impact analysis demonstrates that the CO emissions from the facility will not cause or contribute to a violation of any CO standard. This demonstration was made in Section
36 The lower end of the cancer risk shown here was determined based on an exposure period that reflects the actual construction period, which is consistent with how cancer risk assessments have been carried out for previous AFCs. However, at the request of CARB staff, cancer risk during construction was also evaluated based on a 9-year exposure period, resulting in a high-end cancer risk of 42 in one million. See Appendix 8.1D.
Deleted: 8
Deleted: T
Deleted: are less than
Deleted: .
Deleted: T
Deleted: (DPM impact greater than or equal to approximately 0.1 µg/m3)
Deleted: extends only about 700 meters beyond the facility fenceline and does not include any residences.
Deleted: regional
Deleted: To ensure that potential local cumulative impacts of the HBRP and other nearby projects are adequately considered, a local cumulative impacts analysis will also be conducted in accordance with the protocol included as Appendix 8.1F. ¶

8.1 AIR QUALITY
PO062006001SAC/344005/062570015 (HBRP_008-1-REVSEP07.DOC) 8.1-57
8.1.2.7. The excess NOx reductions will be used to offset the increases in ROC and PM10, as all three pollutants are precursors to PM10.
TABLE 8.1-30 Net Emissions Increases and Required Offsets, tpy
Pollutant
HBRP Annual Emissions, District
NSR Rule, tpy Offset Threshold, tpy Offsets Required
NOx 174.3 25 Yes
SO2 4.4 25 No
ROC 188.9 25 Yes
PM10 118.7 25 Yes
The quarterly offset calculation and the analysis supporting the interpollutant offset ratios used for NOx to ROC and NOx to PM10 are included as Appendix 8.1G.
Table 8.1-31 shows the net emissions increases for HBRP as calculated under CEQA. Mitigation for the net increases in ROC and PM10 is provided by the large net reduction in NOx emissions, which results in overall net reductions in ozone and PM10 precursor emissions. This calculation is provided in Appendix 8.1G.
TABLE 8.1-31 CEQA Mitigation Requirements for HBRP
Pollutant
HBRP Annual Emissions for
CEQA
Reductions from Shutdown
of Humboldt Bay Power Plant
Net Emissions Increase
(Decrease)
Net Change in Emissions of
Ozone Precursorsa
Net Change in Emissions of
PM10 Precursorsb
NOx 174.3 936.8 (762.5) SO2 4.4 30.0 (25.6) ROC 188.9 24.5 164.4 PM10 118.7 27.4 91.3
(598.1) (532.4)
Notes: a Ozone precursors are NOx and ROC. b PM10 precursors are NOx, SO2, ROC, and PM10.
Rule 110 requires project denial if SO2, NO2, PM10, or CO air quality modeling results indicate emissions will interfere with the attainment or maintenance of the applicable ambient air quality standards or will exceed PSD increments. The modeling analyses show that facility emissions will not interfere with the attainment or maintenance of the applicable air quality standards.
8.1.5 Laws, Ordinances, Regulations and Standards This section provides a detailed discussion of LORS applicable to air quality for the HBRP. It begins with a description of the NAAQS. It then describes, in succession, the federal, state, and local LORS, respectively. Finally, this section includes an analysis of the HBRP’s compliance with federal, state, and local LORS.
Deleted: 160.7
Deleted: 263.7
Deleted: 892.7
Deleted: 629.0
Deleted: 4.7
Deleted: 3.9
Deleted: 0.8
Deleted: 453.5
Deleted: 294.9
Deleted: 198.8
Deleted: 23.3
Deleted: 175.5
Deleted: 182.8
Deleted: 25.0
Deleted: 157.8

8.1 AIR QUALITY
8.1-58 PO062006001SAC/344005/062570015 (HBRP_008-1-REVSEP07.DOC)
8.1.5.1 Applicable LORS 8.1.5.1.1 Federal LORS The USEPA implements and enforces the requirements of many of the federal environmental laws. USEPA Region IX, in San Francisco, administers federal USEPA programs in California.
The Federal Clean Air Act, as most recently amended in 1990, provides USEPA with the legal authority to regulate air pollution from stationary sources such as the HBRP. USEPA has promulgated the following stationary source regulatory programs to implement the requirements of the Clean Air Act:
• Prevention of Significant Deterioration; • New Source Review; • Title IV: Acid Deposition Control; • Title V: Operating Permits; • Standards of Performance for New Stationary Sources (NSPS); • National Emission Standards for Hazardous Air Pollutants (NESHAP); and • Compliance Assurance Monitoring (CAM) Rule.
Prevention of Significant Deterioration Program Authority: Clean Air Act §160-169A, 42 USC §7470-7491; 40 CFR Parts 51 and 52
Requirements: Requires PSD review and facility permitting for construction of new or modified major stationary sources of air pollution. PSD review applies with respect to attainment pollutants for which ambient concentrations are lower than the corresponding NAAQS. The following federal requirements apply on a pollutant-by-pollutant basis, depending on facility emission rates.
• Emissions must be controlled using BACT.
• Air quality impacts in combination with other increment-consuming sources must not exceed maximum allowable incremental increases for SO2, PM10, and NOx.
• Air quality impacts of all sources in the area plus ambient pollutant background levels cannot exceed NAAQS.
• Pre- and/or post-construction air quality monitoring may be required.
• The air quality impacts on soils, vegetation, and nearby PSD Class I areas (specific national parks and wilderness areas) must be evaluated. (Note: HBRP is located in a Class II area.)
PSD review jurisdiction had been delegated to the NCUAQMD for all attainment pollutants.
Administering Agency: USEPA Region IX.
New Source Review Authority: Clean Air Act §171-193, 42 USC §7501 et seq.; 40 CFR Parts 51 and 52
Requirement: Requires NSR facility permitting for construction or modification of specified stationary sources. New source review applies with respect to nonattainment pollutants for which ambient concentration levels are higher than the corresponding NAAQS. The

8.1 AIR QUALITY
PO062006001SAC/344005/062570015 (HBRP_008-1-REVSEP07.DOC) 8.1-59
following federal requirements apply on a pollutant-by-pollutant basis, depending on facility emission rates.
• Emissions must be controlled to the lowest achievable emission rate (LAER).
• Sufficient offsetting emissions reductions must be obtained following the requirements in the regulations to continue reasonable further progress toward attainment of applicable NAAQS.
• The owner or operator of the new facility has demonstrated that major stationary sources owned or operated by the same entity in California are in compliance or on schedule for compliance with applicable emissions limitations in this rule.
• The administrator must find that the implementation plan has been adequately implemented.
• An analysis of alternatives must show that the benefits of the proposed source significantly outweigh any environmental and social costs.
The North Coast Air Basin is in attainment with all federal ambient air quality standards. Federal NSR therefore does not apply.
Acid Rain Program Authority: Clean Air Act §401 (Title IV), 42 USC §7651
Requirement: Requires the reduction of the adverse effects of acid deposition through reductions in emissions of sulfur dioxide and nitrogen oxides. NCUAQMD has received delegation authority to implement Title IV. The proposed generating units at HBRP are rated at less than 25 MW each and will use ultralow sulfur fuel (less than 0.05 wt percent sulfur) and therefore are not subject to the acid rain program. A New Unit Exemption form must be filed for each generating unit.
Administering Agency: NCUAQMD, with USEPA Region IX oversight.
Title V Operating Permits Program Authority: Clean Air Act §501 (Title V), 42 USC §7661
Requirements: Establishes comprehensive operating permit program for major stationary sources. NCUAQMD has received delegation authority for this program.
Administering Agency: NCUAQMD, with USEPA Region IX oversight.
National Standards of Performance for New Stationary Sources Authority: Clean Air Act §111, 42 USC §7411; 40 CFR Part 60
Requirements: Establishes national standards of performance for new stationary sources. These standards are enforced at the local level with USEPA oversight. The reciprocating engines used for this project will be subject to Subpart IIII.
Administering Agency: NCUAQMD, with USEPA Region IX oversight.

8.1 AIR QUALITY
8.1-60 PO062006001SAC/344005/062570015 (HBRP_008-1-REVSEP07.DOC)
National Emission Standards for Hazardous Air Pollutants Authority: Clean Air Act §112, 42 USC §7412
Requirements: Establishes national emission standards for hazardous air pollutants. The reciprocating engines used for this project will be subject to Subpart ZZZZ. These standards are enforced at the local level with USEPA oversight.
Administering Agency: NCUAQMD, with USEPA Region IX oversight.
Compliance Assurance Monitoring Rule Authority: Clean Air Act § 501 (Title V), 42 USC §7414; 40 CFR Part 64
Purpose: Requires facilities to monitor the operation and maintenance of emissions control systems and report any control system malfunctions to the appropriate regulatory agency. If an emissions control system is not working properly, the CAM rule also requires a facility to take action to correct the control system malfunction. The CAM rule applies to emissions units with uncontrolled potential to emit levels greater than applicable major source thresholds. However, emission control systems governed by Title V operating permits requiring continuous compliance determination methods are exempt from the CAM rule. Since the project will be issued a Title V permit requiring the installation and operation of continuous emissions monitoring systems, the project will qualify for this exemption from the requirements of the CAM rule. Consequently, the CAM rule will not be further addressed.
Administering Agency: NCUAQMD, with USEPA Region IX oversight.
Administering Agency: USEPA Region IX.
8.1.5.1.2 State LORS Nuisance Regulation Authority: CA Health & Safety Code §41700
Requirements: Provides that “no person shall discharge from any source whatsoever such quantities of air contaminants or other material which causes injury, detriment, nuisance, or annoyance to any considerable number of persons or to the public or which endanger the comfort, repose, health, or safety of any such persons or the public, or which cause, or have a natural tendency to cause injury or damage to business or property.”
Administering Agency: NCUAQMD and CARB
Toxic “Hot Spots” Act Authority: H& SC §44300-44384; 17 CCR §93300-93347
Requirements: Requires preparation and biennial updating of inventory of facility emissions of hazardous substances listed by CARB, in accordance with CARB’s regulatory guidelines. Risk assessments are to be prepared by facilities required to submit emissions inventories according to local priorities.
Administering Agency: NCUAQMD and CARB

8.1 AIR QUALITY
PO062006001SAC/344005/062570015 (HBRP_008-1-REVSEP07.DOC) 8.1-61
CEC and CARB Memorandum of Understanding Authority: CA Pub. Res. Code §25523(a); 20 CCR §1752, 1752.5, 2300-2309 and Div. 2, Chap. 5, Art. 1, Appendix B, Part (k)
Requirements: Provides for the inclusion of requirements in the CEC’s decision on an application for certification to assure protection of environmental quality; application is required to include information concerning air quality protection.
Administering Agency: California Energy Commission
8.1.5.1.3 Local LORS District Regulations and Policies Authority: CA Health & Safety Code §40001
Requirements: Prohibit emissions and other discharges (such as smoke and odors) from specific sources of air pollution in excess of specified levels.
Administering Agency: NCUAQMD, with CARB oversight.
8.1.5.2 Conformance of Facility As addressed in this section, HBRP is designed, and will be constructed and operated, in accordance with all relevant federal, state, and local requirements and policies concerning protection of air quality.
8.1.5.2.1 Consistency with Federal Requirements The NCUAQMD has been delegated authority by the USEPA to implement and enforce most federal requirements that may be applicable to the repowering project, including the new source performance standards and prevention of significant deterioration regulations. Compliance with the District regulations ensures compliance and consistency with the corresponding federal requirements as well. Following the shutdown of the existing steam boilers, the HBRP will no longer be subject to the Federal Acid Rain requirements (Title IV) as the new Wärtsilä engines are rated at less than 25 MW each and use ultralow sulfur fuel (sulfur content less than 0.05 wt percent), and therefore are not acid rain units. A New Unit Exemption form will be filed for each new generating unit and a Retired Unit Exemption form will be filed for each existing unit when the Humboldt Bay Power Plant units are retired. HBRP will obtain an amended District Title V permit that includes applicable requirements for the repowered power plant and eliminates the existing Title IV Acid Rain provisions.
8.1.5.2.1.1 Federal Prevention of Significant Deterioration Program USEPA has promulgated PSD regulations for areas that are in compliance with national ambient air quality standards (40 CFR 52.21). The PSD program allows new sources of air pollution to be constructed, or existing sources to be modified, while preserving the existing ambient air quality levels, protecting public health and welfare, and protecting Class I areas (e.g., specific national parks and wilderness areas). USEPA has delegated the authority to implement the PSD program to various California air pollution control districts, including the NCUAQMD where HBRP is located (40 CFR 52.21[u]). The NCUAQMD will be responsible for issuing the PSD permit for the proposed project. The District’s SIP-approved

8.1 AIR QUALITY
8.1-62 PO062006001SAC/344005/062570015 (HBRP_008-1-REVSEP07.DOC)
PSD rule is Rule 1-220 (adopted March 14, 1984), and the requirements of this rule will govern the District’s federal PSD review process.
Although issuance of the PSD permit has been delegated to the NCUAQMD, the protection of Class I areas is still the responsibility of the Federal Land Managers (FLMs). The required assessment of project impacts on visibility, acid deposition, and air quality in the Class I areas within 100 km of HBRP was prepared and submitted to the FLMs in accordance with a protocol that was submitted to the FLMs on July 18, 2006.37 The assessment will be revised as necessary in response to FLM comments.
The five principal areas of the federal PSD program are as follows:
• Applicability; • Best available control technology; • Pre-construction monitoring; • Increments analysis; and • Air quality impact analysis.
Each of these elements of the program is discussed individually below.
Applicability The PSD program was established to allow emission increases (increments of consumption) that do not result in significant deterioration of ambient air quality in areas where criteria pollutants have not exceeded NAAQS. The federal PSD requirements apply on a pollutant-specific basis to any project that is a new major stationary source or a major modification to an existing stationary source. (These terms are defined in federal regulations.) (40 CFR 52.21) The determination of applicability is based on evaluating the emissions changes associated with the proposed project in addition to all other emissions changes at the same location since the applicable PSD baseline dates (40 CFR 52.21).
For the purposes of determining applicability of the PSD program requirements, the following regulatory procedure is used:
• Emissions from the existing Humboldt Bay Power Plant are compared with major source thresholds to determine whether the existing facility is a major source. This comparison is made in Table 8.1-32.
• Emissions increases from the project are compared with regulatory significance thresholds to determine whether the increases are significant. If the emissions increases exceed the significant emissions thresholds, the proposed modification may be subject to PSD review. The comparison in Table 8.1-33 indicates that the increases in ROC and PM10 emissions will be significant.
• Contemporaneous emissions increases and decreases at the facility are then included in the netting calculation to determine the net emissions changes at the facility. The net emissions changes are compared with the PSD significance levels in Table 8.1-34. Since there are no contemporaneous increases and decreases that need to be considered in this calculation, the increases and the net increases are the same for the proposed project.
37 The nearby Class I areas and the relevant FLMs are Redwood National Park (National Park Service) and Marble Mountain and Yolla Bolly Wilderness Areas (US Forest Service).
Deleted: will be
Deleted: HBRP facility-wide emissions
Deleted: facility is major
Deleted: and thus may be subject to PSD.
Deleted: facility
Deleted: se
Deleted: is
Deleted: emissions
Deleted: from HBRP
Deleted: , and thus the project is subject to PSD review

8.1 AIR QUALITY
PO062006001SAC/344005/062570015 (HBRP_008-1-REVSEP07.DOC) 8.1-63
Since the proposed project will result in significant net emissions increases in ROC and PM10, the project is subject to PSD review.
TABLE 8.1-32 Humboldt Bay Power Plant Emissions and PSD Major Source Thresholds
Pollutant Humboldt Bay Power Plant Emissions (tpy)
PSD Major Source Thresholds (tpy) Major?
NOx 936.8 250 Yes
SO2 30.0 250 No
CO 112.3 250 No
ROC 24.5 250 No
PM10 27.4 250 No
TABLE 8.1-33 Emissions Increases and PSD Significant Emissions Levels
Pollutant Project Emissions
Increases (tpy)a PSD Significance Thresholds (tpy) Significant?
NOx (762.5) 40 Yes
SO2 (25.6) 40 No
ROC 164.4 40 Yes
CO 58.7 100 No
PM10 91.3 15 Yes
Note: a Includes 10 Wärtsilä reciprocating engines, emergency generator and fire pump engine.
TABLE 8.1-34 Net Emission Increases and Significant Emissions Levels
Pollutant Facility Net Increase
(tpy) PSD Significance
Levels (tpy) Are Increases Significant?
NOx (762.5) 40 No
SO2 (25.6) 40 No
ROC 164.4 40 Yes
CO 58.7 100 No
PM10 91.3 15 Yes
Deleted: 892.7
Deleted: 3.9
Deleted: 106.3
Deleted: 23.3
Deleted: 25.0
Deleted: HBRP Proposed
Deleted: 263.7
Deleted: 4.7
Deleted: CO
Deleted: 181.3
Deleted: 100
Deleted: ROC
Deleted: 198.8
Deleted: 40
Deleted: Yes
Deleted: 182.8
Deleted: 573.8
Deleted: 0.8
Deleted: 166.0
Deleted: 75.0
Deleted: 157.8

8.1 AIR QUALITY
8.1-64 PO062006001SAC/344005/062570015 (HBRP_008-1-REVSEP07.DOC)
• If an ambient impact analysis is required, the analysis is first used to determine if the impact levels are significant. The determination of significance is based on whether the impacts exceed regulatory significance levels (40 CFR 51.165) shown in Table 8.1-35. If the significance levels are not exceeded, no further analysis is required.
TABLE 8.1-35 PSD Significant Impact Levels (SILs)
Pollutant Averaging Time Significant Impact Levels Maximum Allowable Class II
Increments PM10 24-Hour
Annual 5 µg/m3
1 µg/m3 30 µg/m3
17 µg/m3
The calculation of net emission increases was shown in Table 8.1-18 above. Table 8.1-32 shows that the existing Humboldt Bay Power Plant is a major source under the PSD regulations. Table 8.1-33 shows that the net increases of ROC and PM10 from the project are above the PSD significance thresholds, so the project is subject to PSD review for these pollutants.
If the significant impact levels (SILs) are exceeded, an analysis is required to demonstrate that the allowable increments will not be exceeded, on a pollutant-specific basis. Increments are the maximum increases in concentration that are allowed to occur above the baseline concentration. These PSD increments are also shown in Table 8.1-35. There are no SILs or increments for ROC.
Best Available Control Technology BACT is defined in 40 CFR 52.21(j) as:
“an emissions limitation…based on the maximum degree of reduction for each pollutant subject to regulation under the Clean Air Act which would be emitted from any proposed major stationary source or major modification which the Administrator, on a case-by-case basis, taking into account energy, environmental, and economic impacts and other costs, determines is achievable for such source or modification through application of production processes or available methods, systems, and techniques, including fuel cleaning or treatment or innovative fuel combustion techniques for control of such pollutant…”
A top-down BACT analysis is required for each pollutant subject to PSD review: that is, ROC and PM10. The required top-down BACT analysis is provided in Appendix 8.1E, and concludes that BACT for the proposed project is as shown in Table 8.1-36.
Deleted:
Deleted:
Deleted:
Deleted: s that emissions from HBRP will be significant, so the project will be a major modification to an existing major source and thus subject to PSD review. Table 8.1-33 above shows

8.1 AIR QUALITY
PO062006001SAC/344005/062570015 (HBRP_008-1-REVSEP07.DOC) 8.1-65
TABLE 8.1-36 BACT Required Under Federal PSD for the HBRP
Pollutant Controlled Emission Rate Control Technique
ROC 28 ppmca (primary fuel) good combustion practices
PM10 3.6 lb/hr (primary fuel) (0.04 gr/dscf)
natural gas fuel with CARB diesel fuel backup; good combustion practices
Note: a ppmc: parts per million by volume, dry, corrected to 15% O2
Preconstruction Monitoring To ensure that the impacts from the HBRP will not cause or contribute to a violation of an ambient air quality standard or an exceedance of a PSD increment, an analysis of the existing air quality in the project area is necessary. If a source is subject to PSD review, PSD regulations generally require preconstruction ambient air quality monitoring data for the purposes of establishing background pollutant concentrations in the impact area (42 CFR 52.21(m)). However, a facility may be exempted from this requirement if the predicted air quality impacts of the facility do not exceed the de minimis levels listed in Table 8.1-37.
TABLE 8.1-37 PSD Preconstruction Monitoring Exemption Levels
Pollutant Averaging Period De minimis Level
Ozonea n/a 100 tpy of ROC
PM10 24-hr average 10 µg/m3
Note: a No de minimis air quality level is provided for ozone. However, any net increase of 100 tons per year or more of
volatile organic compounds subject to PSD is considered significant and may be subject to preconstruction monitoring requirements for ozone.
There is no ambient preconstruction monitoring threshold for ozone impacts because Gaussian plume models are not suited to evaluating ambient impacts from individual stationary sources. Therefore, USEPA has established a ROC emissions threshold as a surrogate for determining the significance of project emissions on ambient ozone levels. As shown in Table 8.1-38, the net increase in ROC emissions exceeds the 100-tpy significant increase threshold for potential ozone impacts and the 24-hour average PM10 impacts exceed the ambient concentration threshold, so the preconstruction monitoring requirement for these pollutants must be addressed in more detail.
TABLE 8.1-38 Evaluation Of Preconstruction Monitoring Requirements
Maximum Modeled Concentration (µg/m3)
Pollutant Averaging
Time
Exemption Concentration
(µg/m3) Natural Gas Mode Diesel Mode
Exceed Monitoring Threshold?
Ozone n/a 100 tpy of ROCs 164.4 tpy of ROCs n/a yes
PM10 24-hr 10 18.7 34.1 yes
Deleted: 4.9
Deleted: Normal Operations
Deleted: Emergency Operations
Deleted: 179.0
Deleted: 189.3 tpy of ROCs
Deleted: 21.7
Deleted: 18.6

8.1 AIR QUALITY
8.1-66 PO062006001SAC/344005/062570015 (HBRP_008-1-REVSEP07.DOC)
The purpose of the preconstruction monitoring requirement is to ensure that background concentrations are adequately characterized to ensure that the national ambient air quality standards are protected. With the District’s approval, a facility may rely on air quality monitoring data collected at District monitoring stations to satisfy the requirement for preconstruction monitoring. In such a case, in accordance with Section 2.4 of the USEPA PSD guideline, the last 3 years of ambient monitoring data may be used if they are representative of the area’s air quality where the maximum impacts occur due to the proposed source.
The background data need not be collected on site, as long as the data are representative of the air quality in the subject area (40 CFR 51, Appendix W, Section 9.2). Three criteria are applied in determining whether the background data are representative: (1) location, (2) data quality, and (3) data currentness.38 These criteria are defined as follows:
• Location: The measured data must be representative of the areas where the maximum concentration occurs for the proposed stationary source, existing sources, and a combination of the proposed and existing sources.
• Data quality: Data must be collected and equipment must be operated in accordance with the requirements of 40 CFR Part 58, Appendices A and B, and PSD monitoring guidance.
• Currentness: The data are current if they have been collected within the preceding 3 years and they are representative of existing conditions.
All of the data used in this analysis meet the requirements of Appendices A and B of 40 CFR Part 58, and thus all meet the criterion for data quality. All of the data have been collected within the preceding 3 years, and thus all meet the criterion for currentness. The location and overall representativeness of the data are discussed further below.
Ozone/ROCs If ozone concentrations were near the ambient air quality standard, the construction and operation of a new major source of ROCs could theoretically result in a violation of the standard, because ROCs are precursors to ozone. The Applicant believes, however, that there are adequate ozone data from the project area to demonstrate that current ozone levels there are extremely low and that the operation of the proposed project will not cause the violation of state or federal ozone standards.
As discussed above, ozone concentrations are currently monitored at Ukiah and Willits, which are inland locations in Mendocino County (North Coast Air Basin). These ozone monitors are used to characterize ozone air quality in the air basin and are the basis for the NCAB’s designation as an attainment area for both state and federal ozone standards.
Ozone was monitored in the Redwood National Park, about 40 miles north of Eureka, until mid-1995. Ozone concentrations were monitored in Eureka from mid-1990 to mid-1992. A comparison of these measured concentrations with contemporaneous ozone measurements at Willits and Ukiah demonstrates that ozone concentrations in Eureka are expected to be
38 Ambient Monitoring Guidelines for Prevention of Significant Deterioration (PSD), USEPA, 1987.

8.1 AIR QUALITY
PO062006001SAC/344005/062570015 (HBRP_008-1-REVSEP07.DOC) 8.1-67
significantly lower than concentrations monitored in Willits and Ukiah. The contemporaneous monitoring results are shown in Table 8.1-39.
TABLE 8.1-39 Comparison of Regional Ozone Concentrations
Maximum Modeled Ozone Concentration, ppm (Month)
Location 1991 1992 1993 1994 1995
1-Hour Average
Eureka 0.050 (Feb) 0.040 (Feb) n/a n/a n/a
Redwood National Park 0.050 (Jan) 0.064 (Feb) 0.050 (Feb) 0.051 (Mar) 0.052 (Mar)
Willits n/a n/a 0.060 (Jul) 0.071 (Jul) 0.062 (Jul)
Ukiah n/a 0.060 (Oct) 0.080 (Oct) 0.087 (Sep) 0.085 (Jul)
8-Hour Average
Eureka 0.042 (Feb) 0.040 (Feb) n/a n/a n/a
Redwood National Park 0.048 (May) 0.060 (Feb) 0.050 (Feb) 0.048 (Mar) 0.048 (Mar)
Willits n/a n/a 0.050 (Oct) 0.061 (Jul) 0.049 (Jul)
Ukiah n/a 0.043 (Oct) 0.065 (Sep) 0.061 (Sep) 0.065 (Jul)
These monitoring data also show that the highest ozone concentrations were recorded along the coast (that is, at Eureka and Redwood National Park) during the winter months, when the weather tends to be overcast and rainy and there is little ultraviolet radiation available for photochemical activity. Because the formation of ozone from ROC and NOx is a photochemical reaction, the presence of ozone in the absence of ultraviolet radiation suggests that the ozone in these areas is mostly background ozone from natural sources, which is in the range of 0.015 to 0.035 ppm, with a maximum of about 0.040 ppm.39
Ozone data are also collected by the NOAA, Earth Systems Research Laboratory (ESRL) Global Monitoring Division at Trinidad Head, about 22 miles north of the project site. This monitoring project has been in operation since April 2002.40 The ozone data from Trinidad Head also indicate that the highest ozone concentrations occur in the spring (February through May), and that ozone levels in the project area are not much higher than background levels. The Trinidad Head ozone data were compared with the Ukiah and Willits data in Table 8.1-2 and in Figures 8.1-3 and 8.1-4 and are reproduced here as Table 8.1-40.
39 CARB, “Review of the California Ambient Air Quality Standard for Ozone,” October 2005 Revision, p. 4-12, October 27, 2005. 40 NOAA ESRL Global Monitoring Division Website, surface ozone data for Trinidad Head Observatory (THD), 2003-2005, downloaded from http://www.cmdl.noaa.gov/infodata/ftpdata.html.

8.1 AIR QUALITY
8.1-68 PO062006001SAC/344005/062570015 (HBRP_008-1-REVSEP07.DOC)
TABLE 8.1-40 Ozone Levels in the Vicinity of the Proposed Project (ppm)
2002 2003 2004 2005 NAAQS
Highest 1-Hour Average 0.052 0.064 0.063 0.057 0.12
Highest 8-Hour Average 0.050 0.060 0.058 0.055 0.08
Note: Ozone levels monitored by NOAA at Trinidad Head.
The Applicant believes that the existing, current data that are collected nearby are adequate to demonstrate that the ozone concentrations in the project area are extremely low and are mostly natural background rather than photochemical ozone. In addition, the ROC emissions increase from the HBRP will be completely offset by reductions in NOx from the shutdown of the existing Humboldt Bay Power Plant generating equipment, and NOx is also an ozone precursor. As a result, ozone levels in Eureka would not be expected to increase due to an increase in ROC emissions as a result of the proposed project, and we do not believe that preconstruction monitoring for ozone is necessary to ensure that the proposed project will not cause violations of the federal ozone standards.
PM10 Ambient PM10 and PM2.5 data are collected at the Eureka I Street monitoring station. This monitoring station is located approximately 5 miles northeast of the project site. The ambient pollution levels monitored at the I Street monitoring station reflect concentrations in the vicinity of the project, and thus meet the criterion for location.
The area in which modeling shows that PM10 impacts from the project will exceed the preconstruction monitoring threshold is shown in Appendix 8.1B, Figure 8.1B-11C. Based on the geography and meteorology of the area, it is highly unlikely that there are sources other than HBRP and the Humboldt Bay Power Plant that would cause a localized influence in that area that would not be represented in the ambient monitored concentrations in Eureka. Therefore, the Applicant believes that the existing, current PM10 data that are collected nearby are adequate to characterize PM10 concentrations in the study area and that no additional ambient monitoring is necessary to ensure that the proposed project will not cause violations of the federal PM10 standards.
PSD Increment Consumption The maximum modeled impacts from the HBRP facility are compared with the PM10 significance levels in Table 8.1-41. These comparisons show that the maximum modeled PM10 impacts from the proposed project exceed the significance levels.
Deleted: This area is adjacent to and immediately south of the power plant, with the impacts driven by strong northerly winds. As discussed earlier, a large part of the maximum modeled PM10 impact is due to an unusual 24-hour period of extreme meteorological conditions. The area in which the preconstruction monitoring threshold is exceeded even smaller when that unusual meteorological condition is eliminated, as shown in Appendix 8.1B, Figure 8.1B-11D.

8.1 AIR QUALITY
PO062006001SAC/344005/062570015 (HBRP_008-1-REVSEP07.DOC) 8.1-69
TABLE 8.1-41 Comparison of Maximum Modeled Impacts and PSD Significant Impact Levels
Pollutant Averaging Time
Maximum Modeled Impacts
(µg/m3) Significant Impact
Level (µg/m3) Significant? PM10 24-hour, Natural Gas Mode
24-hour, Diesel Mode Annual
18.7 34.1 3.1
5 5 1
yes yes yes
The project’s impact area is the geographical area in which the proposed project is predicted to have a significant ambient impact. Appendix 8.1B, Figure 8.1B-11E shows the area in the vicinity of the plant where the SILs are exceeded.
The ambient air quality impacts analysis provided in Section 8.1.2.7 is compared with the allowable increments in Table 8.1-42 to demonstrate that the highest second-highest (H2H, for the 24-hour averaging period) and highest (for the annual averaging period) modeled PM10 impacts from the project will not exceed the Class II increments.
TABLE 8.1-42 Comparison of Maximum Modeled Impacts and PSD Class II Increments
Pollutant Averaging Time Modeled Impacts (µg/m3) Class II Increment (µg/m3)
PM10 24-hour, Natural Gas Mode 24-hour, Diesel Mode
Annual
15.5 28.1 3.1
30 30 17
The PM10 increments analysis will be provided as a separate, supplemental report.
Air Quality Impacts Analysis An ambient air quality impacts analysis for PM10 was provided in Section 8.1.2.7.
8.1.5.2.1.2 Federal New Source Performance Standards The Standards of Performance for New Stationary Sources are source-specific federal regulations, limiting the allowable emissions of criteria pollutants (i.e., those that have a national ambient air quality standard). These regulations apply to certain sources depending on the equipment size, process rate, and/or the date of construction, modification, or reconstruction of the affected facility. Recordkeeping, reporting, and monitoring requirements are usually necessary for the regulated pollutants from each subject source; the reports must be regularly submitted to the reviewing agency (40 CFR 60.4). This program has been delegated by USEPA to the NCUAQMD.
Deleted: H
Deleted: Normal Operation
Deleted: 21.7
Deleted: Emergency Operation
Deleted: 18.6¶
Deleted: 1.35
Deleted: As discussed earlier, a large part of the maximum modeled PM10 impact is due to an unusual 24-hour period of extreme meteorological conditions. The area in which the SILs are exceeded is even smaller when that unusual meteorological condition is eliminated, as shown in Appendix 8.1B, Figure 8.1B-11F.
Deleted: maximum
Deleted: Table 8.1-42 shows the combined modeled impacts of HBRP with the reductions from the shutdown of the Humboldt Bay Power Plant generating units.
Deleted: Maximum
Deleted: H
Deleted: Normal Operation
Deleted: Emergency Operation
Deleted: 21.7¶18.6¶1.35
Deleted: ¶TABLE 8.1-42 ¶Comparison of Combined Modeled Impacts of HBRP and Humboldt Bay Power Plant and PSD Class II Increments ... [43]

8.1 AIR QUALITY
8.1-70 PO062006001SAC/344005/062570015 (HBRP_008-1-REVSEP07.DOC)
Applicability to Wärtsilä Reciprocating Engines Subpart IIII, Standards of Performance for Stationary Compression Ignition Internal Combustion Engines (40 CFR §60.4200 et seq.), became effective July 11, 2006. The new NSPS sets NOx, PM10, and, for some engines, CO and NMHC standards for compression ignition engines installed or modified after July 11, 2005.
The NSPS defines “compression ignition” as follows:
“Compression ignition means relating to a type of stationary internal combustion engine that is not a spark ignition engine.”
The engines meet the definition of “spark ignition” engines, which are not covered by the regulation. Section 60.4219 of the regulation defines “spark ignition” as follows:
“Spark ignition means relating to a gasoline, natural gas, or liquefied petroleum gas fueled engine or any other type of engine with a spark plug (or other sparking device) and with operating characteristics significantly similar to the theoretical Otto combustion cycle. Spark ignition engines usually use a throttle to regulate intake air flow to control power during normal operation. Dual-fuel engines in which a liquid fuel (typically diesel fuel) is used for CI and gaseous fuel (typically natural gas) is used as the primary fuel at an annual average ratio of less than 2 parts diesel fuel to 100 parts total fuel on an energy equivalent basis are spark ignition engines.”
When operated in natural gas mode for prime power generation, the ratio of diesel fuel to total fuel is less than 1 part per 100 parts on an energy equivalent basis (0.79 MMBtu/hr diesel fuel to 144.7 MMBtu/hr of total fuel), and the Wärtsilä reciprocating engines would qualify as spark ignition engines. However, when potential emergency operation in diesel mode is considered, the annual average ratio of diesel fuel to total fuel could exceed the 2 parts diesel fuel per 100 parts total fuel ratio. Because the new Wärtsilä reciprocating engines meet the definition of compression ignition engines in this regulation when operating in diesel mode, they are subject to the NSPS requirements.
The new reciprocating engines have a displacement of more than 30 liters per cylinder, and are subject to the following requirements:
• Reduce NOx emissions by 90 percent or more OR limit the NOx emissions in the exhaust to 1.6 gm/kw-hr (1.2 gm/bhp-hr); and
• Reduce particulate matter emissions by 60 percent or more OR limit the emissions of PM in the exhaust to 0.15 g/kw-hr (0.11 g/bhp-hr) at full load; and
• Use fuel with a sulfur content not to exceed 500 ppm.
As shown in Table 8.1A-3, NOx emissions from the engines in diesel mode will range from 0.53 to 0.56 gm/kw-hr, well below the 1.6 gm/kw-hr limit of the NSPS. For purposes of the NSPS, particulate matter is defined as filterable PM only, excluding condensibles (Table 7 to Subpart IIII).41 Filterable PM emissions from the engines in diesel mode, shown as DPM in Table 8.1A-3, will meet the 0.15 gm/kw-hr limit at full load. Finally, the liquid fuel used in 41 The test method for demonstrating compliance with the PM limit of the NSPS, EPA Method 5, is the same for both the NSPS and the ATCM (discussed in Section 8.1.5.2.2.2). Because the purpose of the ATCM is to regulate Diesel particulate matter, the filterable fraction of the PM is referred to in Table 8.1A-3 as DPM.
Deleted: on
Deleted: with diesel pilot ignition
Deleted: the 800 hours per year per engine of
Deleted: , testing, and maintenance and are
Deleted: included
Deleted: on an annual basis
Deleted: approximately 13 parts per 100 parts on an energy equivalent basis (123,631 MMBtu/yr of diesel fuel to 943,000 MMBtu/yr of total fuel)
Deleted: Therefore
Deleted: ,
Deleted: their emergency
Deleted: operating
Deleted: and
Deleted: during liquid fuel firing
Deleted: during liquid fuel firing

8.1 AIR QUALITY
PO062006001SAC/344005/062570015 (HBRP_008-1-REVSEP07.DOC) 8.1-71
the engines will be CARB diesel fuel with a sulfur content not to exceed 15 ppm, well below the 500 ppm limit that applies to engines of this size.
Applicability to Black Start Generator and Fire Pump Engine Both the black start generator and the emergency diesel fire pump engine will be subject to the NSPS. For engines in this size range, the NSPS requires manufacturers to provide engines that are certified to meet the NSPS emission standards. HBRP will assure compliance with the emission limitations of the NSPS by purchasing certified engines for these applications.
The NSPS also requires engines in this size range to use fuel with a sulfur content not to exceed 15 ppm. The emergency engines will comply with this requirement by using only CARB diesel fuel.
8.1.5.2.1.3 National Emissions Standards for Hazardous Air Pollutants The NESHAPs are either source-specific or pollutant-specific regulations, limiting the allowable emissions of hazardous air pollutants from the affected sources (40 CFR 61). Unlike criteria air pollutants, hazardous air pollutants do not have a national ambient air quality standard but have been identified by USEPA as causing or contributing to the adverse health effects of air pollution.
Administration of the hazardous air pollutants program has been delegated to the NCUAQMD, as described in Section 8.1.5.1.1 (40 CFR 61.04).
NESHAP Subpart ZZZZ—National Emissions Standards for Hazardous Air Pollutants for Stationary Reciprocating Internal Combustion Engines (40 CFR §63.6580 et seq.) applies to stationary reciprocating engines above 500 hp located at major sources of hazardous air pollutants (HAPs). Based on current estimates of TACs from the Wärtsilä reciprocating engines (see Table 8.1-20), annual emissions of formaldehyde may exceed 10 tpy and total HAP emissions from the facility are approximately 25 tpy, so the facility is expected to be a major source of HAPs. Therefore, the Wärtsilä natural-gas-fired engine/generator sets that comprise this project must comply with the applicable requirements of Subpart ZZZZ. For the purposes of the NESHAP, the engines to be used in this project meet the definition of “compression ignition engine:”
“Compression ignition engine means any stationary RICE [reciprocating internal combustion engine] in which a high boiling point liquid fuel injected into the combustion chamber ignites when the air charge has been compressed to a temperature sufficiently high for auto-ignition, including diesel engines, dual-fuel engines, and engines that are not spark ignition.”
The proposed engines are dual-fuel engines and do not meet the definition of “spark ignition” in this regulation:
“Spark ignition engine means a type of engine in which a compressed air/fuel mixture is ignited by a timed electric spark generated by a spark plug.”
New compression ignition engines are required by the NSPS to meet one of the following performance standards:
• Reduce CO emissions by 70 percent or more; or

8.1 AIR QUALITY
8.1-72 PO062006001SAC/344005/062570015 (HBRP_008-1-REVSEP07.DOC)
• Limit concentration of formaldehyde in the exhaust to 580 ppbvd or less at 15 percent O2.
HBRP will use oxidation catalysts on the Wärtsilä reciprocating engines to meet the requirements of the NESHAP, and will install and operate a CO CEMS. HBRP will comply with the testing, monitoring and recordkeeping requirements of Subpart ZZZZ by continuously monitoring CO and CO2 or O2 at both the inlet and outlet of the oxidation catalysts.
Although Subpart ZZZZ does not apply to the black start generator or the fire pump engine because both are below 500 hp, USEPA has proposed to amend Subpart ZZZZ42 to cover engines below 500 hp located at major sources of HAPs. The proposed amendment would require stationary compression ignition engines such as the black start generator and the fire pump engine to comply with the requirements of 40 CFR 60 Subpart IIII. Compliance with this requirement is discussed in Section 8.1.5.2.1.2 above.
8.1.5.2.1.4 Federal Clean Air Act Amendments of 1990 In November 1990, substantial revisions and updates to the federal Clean Air Act were signed into law. This complex enactment addresses a number of areas that could be relevant to the proposed HBRP, such as more extensive permitting requirements and new USEPA mandates and deadlines for developing rules to control air toxic emissions. The most significant of the new provisions applicable to this project is the Title V operating permit program.
Title V—Operating Permits This title establishes a comprehensive operating permit program for major stationary sources (42 USC §7661 et seq.). Under the Title V program, a single permit is required that includes a listing of all the stationary sources, applicable regulations, requirements, and compliance determination.
The NCUAQMD’s Title V Program (Rules 501-504) has been approved by USEPA. Consequently, the NCUAQMD has received delegation to implement the Title V program. The NCUAQMD Title V permit programs applicable to this project are summarized below.
8.1.5.2.2 Consistency with State Requirements State law sets up local air pollution control districts and air quality management districts with the principal responsibility for regulating emissions from stationary sources. As discussed above, the HBRP is under the local jurisdiction of the NCUAQMD, and compliance with NCUAQMD regulations will ensure compliance with most state air quality requirements.
8.1.5.2.2.1 California Clean Air Act AB 2595, the California Clean Air Act (CAA) was enacted by the California Legislature and became law in January 1989. The CAA requires the local air pollution control districts to attain and maintain both the federal and state ambient air quality standards at the “earliest practicable date.” The CAA contains several milestones for local districts and the CARB. The NCUAQMD was required to submit to the CARB an air quality plan, with updates as
42 Federal Register Vol. 71, No. 112, Monday June 12, 2006, p. 33804 et seq.

8.1 AIR QUALITY
PO062006001SAC/344005/062570015 (HBRP_008-1-REVSEP07.DOC) 8.1-73
necessary, defining the program for meeting the required emission reduction milestones in the North Coast.
Air quality plans must demonstrate attainment of the state ambient air quality standards and must result in a 5 percent annual reduction in emissions of nonattainment pollutants (PM10 and its precursors) in a given district (H&SC §40914). A local district may adopt additional stationary source control measures or transportation control measures, revise existing source-specific or new source review rules, or expand its vehicle inspection and maintenance program (H&SC §40918) as part of the plan. District air quality plans specify the development and adoption of more stringent regulations to achieve the requirements of the Act. The applicable regulations that will apply to HBRP are included in the discussion of NCUAQMD prohibitory rules in Section 8.1.5.2.3.2.
8.1.5.2.2.2 Airborne Toxic Control Measure for Stationary Compression Ignition Engines In 2004, CARB adopted an ATCM43 to reduce DPM and criteria pollutant emissions from stationary diesel-fueled compression ignition engines. The ATCM categorizes stationary diesel engines as either new or in-use, and as either prime or emergency. New emergency engines must meet a DPM emission limit of 0.15 g/bhp-hr upon installation. New prime engines must meet a DPM emission limit of 0.01 g/bhp-hr. The proposed HBRP will utilize multiple, dual-fueled reciprocating engines combusting primarily natural gas (over 99 percent of heat input), along with less than 1 percent diesel fuel to facilitate detonation. This natural gas mode would be the normal operating mode for the engines. During curtailments or interruptions of natural gas supply to the facility, one or more of the engines may operate on 100 percent CARB diesel fuel (in diesel mode) for limited periods of time to maintain local area grid reliability. As discussed in more detail below, the applicability of the ATCM is applied to each of two “virtual engines” that comprise each physical engine: a gas-fired pilot injection engine operating under the theoretical Otto cycle to produce prime power, and a diesel-fired engine operating under the theoretical diesel cycle to produce power under emergency situations.
Applicability of ATCM to Wärtsilä Engines in Natural Gas Operating Mode The emission limits of the ATCM apply to engines that are classified as being both “diesel-fueled” and “compression ignition.” As discussed above, in the recently adopted federal New Source Performance Standard for Compression Ignition Engines, USEPA uses a threshold of 2 percent energy input from diesel fuel to distinguish between “spark ignition” engines, which are exempt from the NSPS, and “compression ignition” engines, which are subject to the NSPS.
“Compression ignition means relating to a type of stationary internal combustion engine that is not a spark ignition engine.”
“Spark ignition means relating to a gasoline, natural gas, or liquefied petroleum gas fueled engine or any other type of engine with a spark plug (or other sparking device) and with operating characteristics significantly similar to the theoretical Otto combustion cycle. Spark ignition engines usually use a throttle to regulate intake air flow to control power during normal operation. Dual-fuel engines in which a liquid fuel (typically diesel fuel) is used for CI
43 CCR Title 17, Section 93115.
Deleted: Diesel
Deleted: Pilot Injection

8.1 AIR QUALITY
8.1-74 PO062006001SAC/344005/062570015 (HBRP_008-1-REVSEP07.DOC)
and gaseous fuel (typically natural gas) is used as the primary fuel at an annual average ratio of less than 2 parts diesel fuel to 100 parts total fuel on an energy equivalent basis are spark ignition engines.”44
When the engines are operated in natural gas mode, they clearly qualify as “spark ignition” and not “compression ignition” engines. The term “compression ignition” is defined in Section (d)(11) of the ATCM as “…operating characteristics significantly similar to the theoretical diesel combustion cycle. The regulation of power by controlling fuel supply in lieu of a throttle is indicative of a compression ignition engine.” These two criteria in the definition of “compression ignition” in the ATCM are discussed separately below.
1) “…Operating Characteristics Significantly Similar to the Theoretical Diesel Combustion Cycle”
The theoretical Diesel and Otto cycles are distinguished by the conditions that occur in the cylinder when the fuel is being combusted. During combustion, the chemical energy of the fuel is converted to heat by the exothermic oxidation of hydrocarbons with air. This is known as the “heat addition” phase, which occurs while the piston is at, or close to, top dead center (TDC) between the compression stroke and the power stroke. In the theoretical Diesel cycle, while combustion (heat addition) is occurring, the pressure in the cylinder remains constant while the volume of the cylinder increases due to movement of the piston. This is known as isobaric expansion. In the theoretical Otto cycle, when combustion (heat addition) occurs, the pressure in the cylinder increases while the volume remains constant. Because the diesel pilot injection engine uses 99 percent natural gas, which is well-mixed with air in the combustion chamber at the time of ignition, the combustion characteristics are significantly similar to the theoretical Otto cycle, and are fundamentally different from the theoretical Diesel cycle. Well-mixed conditions create rapid combustion and a rapid increase in cylinder pressure in a virtually isovolumetric process. For this reason, when operating in pilot injection mode, the HBRP engines do not meet the ATCM’s definition of compression ignition and therefore are not subject to the ATCM’s requirements.
2) “Regulation of power by controlling fuel supply in lieu of a throttle is indicative of a compression ignition.”
Another distinction between the Diesel and Otto cycles is that the Diesel cycle has a much slower rate of combustion compared to the Otto cycle. In traditional diesel-fueled engines, the liquid fuel is atomized and injected into the cylinder containing compressed air. The hot air vaporizes the droplets and oxidizes the resulting gaseous hydrocarbons. The rate of combustion is limited by the rate at which the fuel is injected. Engine power output is controlled by adjusting the amount of fuel that is injected into the cylinder while the amount of air remains essentially constant (per cylinder charge). Due to the kinetics of the system, combustion occurs much more slowly while work is being performed on the cylinder than in an Otto cycle engine.
44 40 CFR 60.4216.
Deleted: pilot injection
Deleted: Diesel

8.1 AIR QUALITY
PO062006001SAC/344005/062570015 (HBRP_008-1-REVSEP07.DOC) 8.1-75
In traditional Otto cycle engines, the fuel is either gaseous or a volatile liquid (gasoline). The fuel is injected during the compression stroke and forms a near homogenous gaseous mixture with combustion air. The mixture is detonated by a spark plug or other means and combustion occurs rapidly. Power is controlled by limiting or “choking” the amount of combustion air, in addition to varying the quantity of fuel.
Although the Wärtsilä engines regulate power mostly by controlling fuel supply, they operate under the theoretical Otto cycle, not the Diesel cycle, during natural gas mode. The ATCM’s statement that air throttling indicates compression ignition is evidence that CARB did not consider the Wartsila dual-fuel technology at issue here when developing the ATCM. Another example of a technology for which air throttling is not a definitive characteristic is the new BMW 7-series automobile, which uses a gasoline-fueled, spark-ignited engine which does not use air throttling during normal operation, yet operates under the theoretical Otto cycle.45
In conclusion, when the engines are operated in natural gas mode for prime power production, they are not subject to the ATCM because in this mode they do not operate as compression ignition engines, as they do when they operate in diesel mode and are used on an emergency basis.
Applicability of ATCM to Wärtsilä Engines Operating in Diesel Mode As discussed above, the proposed engines would operate on 100 percent CARB diesel during periods when natural gas service to the facility is curtailed or interrupted. Also as discussed above, the ATCM contains separate emission limits for prime and emergency standby engines. To qualify for the emergency standby limits, an engine must meet the two criteria of Section (d)(24):
• The engine is installed for the primary purpose of providing electrical power or mechanical work during an emergency use and is not the source of primary power at the facility; and
• The engine is operated to provide electrical power or mechanical work during an emergency use or during other limited circumstances.
The first criterion requires that the engine be installed primarily to operate in cases where the loss of electricity or natural gas supply is beyond the reasonable control of the owner or operator. The loss of power or natural gas supply cannot be the result of a contractual obligation with a third party.
The ATCM does not appear to anticipate the possibility that the serving electric utility uses an emergency standby engine to provide power to the electric grid. However, the fact that 100 percent diesel operation of the proposed engines would occur only during a qualifying emergency use is sufficient to conclude that the emergency standby engine limits apply during this mode of operation.
The CARB staff has concurred in this interpretation. Therefore, when operating in diesel mode, the Wärtsilä engines will be required to comply with the PM limit of 0.15 gm/hp-hr
45 With BMW’s Valvetronic engine control system, a traditional throttle is employed only under “limp home” mode.
Deleted: pilot injection
Deleted: the normal,
Deleted: -fired pilot injection
Deleted: o
Deleted: fuel
Deleted: During Emergency Use
Deleted: emergency backup
Deleted: on 100 percent liquid fuel

8.1 AIR QUALITY
8.1-76 PO062006001SAC/344005/062570015 (HBRP_008-1-REVSEP07.DOC)
over the ISO 8178 D1 cycle.46 The ATCM limit applies only to filterable PM, and the HBRP reciprocating engines will comply with this limit during emergency liquid fuel firing. As required by the ATCM, each reciprocating engine will be limited to 50 hours per year of operation in diesel mode for testing and maintenance purposes.
Emergency use is defined as follows:
Providing electrical power or mechanical work during any of the following events and subject to the following conditions:
a. The failure or loss of all or part of normal electrical power service or normal natural gas supply to the facility:
1. Which is caused by any reason other than the enforcement of a contractual obligation the owner or operator has with a third party or any other party; and
2. Which is demonstrated by the owner or operator to the district APCO’s satisfaction to have been beyond the reasonable control of the owner or operator;
b. The failure of a facility’s internal power distribution system:
1. Which is caused by any reason other than the enforcement of a contractual obligation the owner or operator has with a third party or any other party; and
2. Which is demonstrated by the owner or operator to the district APCO’s satisfaction to have been beyond the reasonable control of the owner or operator;
c. The pumping of water for fire suppression or protection.
Emergency operation cannot be related to fuel pricing (i.e., units will not be switched to diesel fuel operation simply because gas prices are higher than diesel prices). Emergency operation can be due to a curtailment of natural gas supply to the plant (either partial or total).
Further, natural gas curtailments will be required to meet the following criteria:
a. The curtailment must be directed by a regulatory agency, or automatically implemented by PG&E in accordance with procedures approved by a regulatory agency; and
b. Notice must be given to the District within 24 hours of when the plant receives notification of an anticipated curtailment that would result in the operation of one or more units in diesel mode.
Black Start Generator and Fire Pump Engine The black start generator and diesel fire pump engine are also subject to the ATCM requirements for new emergency engines. As required by the ATCM, PM emissions will not exceed 0.15 gm/hp-hr, and each reciprocating engine will be limited to 50 hours of operation on liquid fuel per year for testing and maintenance purposes.
46 The ISO 8178 D1 cycle is a weighted average of emissions at 100%, 75%, and 50% loads.
Deleted: o
Deleted: liquid fuel
Deleted: per year
Deleted: “
Deleted: ”
Deleted: “
Deleted: ”
Deleted: ¶

8.1 AIR QUALITY
PO062006001SAC/344005/062570015 (HBRP_008-1-REVSEP07.DOC) 8.1-77
8.1.5.2.3 Consistency with Local Requirements: North Coast Air Quality Management District 8.1.5.2.3.1 NCUAQMD New Source Review Requirements NCUAQMD Rule 110, New Source Review, requires that a pre-construction review be conducted for all proposed new or modified sources of air pollution. New Source Review contains three principal elements:
• BACT; • Emissions offsets; and • Air quality impact analysis.
Under the District definitions in Rule 110, HBRP is considered a reconstructed source. The Humboldt Bay Power Plant is a source undergoing physical modification. The fixed capital cost of the new components at HBRP is estimated at $250 million. The fixed capital cost of a comparable new stationary source—that is, replacing the Humboldt Bay Power Plant boilers and gas turbines with comparable new units—is estimated as approximately $377 million. Since the fixed capital cost of the new components exceeds 50 percent of the fixed capital cost of the new stationary source, HBRP meets the §4.22 definition of a reconstructed source. In accordance with §4.15, HBRP is treated as a new stationary source rather than a modification, so NSR requirements apply as for new sources.
BACT is required for any new emissions unit that results in an increase in emissions of any criteria pollutant and that has a potential to emit in excess of levels specified in Rule 110 §5.1 (shown in Table 8.1-43). As shown in Table 8.1-17, the daily emissions from the proposed Wärtsilä reciprocating engines will exceed these levels, so the engines are subject to BACT requirements for all pollutants. The BACT analysis is included as Appendix 8.1E.
TABLE 8.1-43 NCUAQMD Thresholds for BACT
Pollutant BACT Threshold (lb/day)
Asbestos 0.030
Beryllium 0.002
CO 500
Fluorides 15
Hydrogen Sulfide 50
Lead 3.2
Mercury 0.5
NOx 50
PM10 80
ROC 50
Reduced sulfur compounds 50
Sulfur oxides 80
Sulfuric acid mist 35
Total reduced sulfur compounds 50
Vinyl chloride 5
Deleted: 4
Deleted: 4

8.1 AIR QUALITY
8.1-78 PO062006001SAC/344005/062570015 (HBRP_008-1-REVSEP07.DOC)
Rule 110 §5.2 further requires that new sources at facilities with a potential to emit more than 25 tons per year of a nonattainment pollutant or its precursors must offset at least the portion of the potential to emit that exceeds 25 tpy. NCUAQMD is nonattainment for the state PM10 standard, and the HBRP has a potential to emit more than 25 tpy of PM10 and its precursors NOx and ROC. Offsets will therefore be required for these three pollutants. Offsets are not required for SO2 because the emissions for this pollutant are less than 25 tpy. Offsets are not required for CO if the Applicant demonstrates through ambient air quality modeling that the CO emissions from a proposed project will not cause or contribute to a violation of the air quality standards. The required analysis was provided in Section 8.1.2.7.
The required offsets for the project are being provided through a combination of onsite reductions, offsite ERCs, and interpollutant offsets. Compliance with the offset requirement is discussed in detail in Appendix 8.1G.
An air quality impact analysis is required to demonstrate that the project will not cause a violation or interfere with the maintenance of any ambient air quality standards or applicable increments. The required air quality impact analysis to demonstrate compliance with ambient air quality standards was provided in Section 8.1.2.8, Table 8.1-26.
Finally, the District may impose appropriate monitoring requirements to ensure compliance. The Applicant expects that the District will impose requirements for continuous monitoring of NOx and CO emissions from the Wärtsilä reciprocating engines and of fuel use and operating hours for the Wärtsilä reciprocating engines, the black start generator, and the fire pump engine.
Rule 110 §9 specifies procedures for review and standards for approval of Authorities to Construct power plants within the District. The District must conduct a Determination of Compliance review as part of the CEC certification process. The District considers the AFC to be the equivalent of an application for an Authority to Construct.
The NCUAQMD recently amended its PSD rule. Although the PSD rule has not been approved by USEPA to replace the existing SIP-approved rule, the requirements of the new rule must also be complied with. Under the NCUAQMD PSD program (Rule 110, Section 11), a separate air quality analysis must be submitted for each regulated pollutant that will be emitted in a significant amount from the new major stationary source. The existing Humboldt Bay Power Plant was shown to be an existing major stationary source in Table 8.1-32. The calculation of emissions from the proposed HBRP for District NSR was shown in Table 8.1-17. Emissions from the proposed project are compared with PSD significance thresholds in Table 8.1-44.
Compliance with this requirement has been demonstrated in the discussion of compliance with federal PSD (Section 8.1.5.2.1.1).47
47 For the purposes of the District’s PSD rule, the source is treated as a reconstructed (new) source; this is in contrast with the treatment of the project under the SIP-approved PSD program, under which the project is treated as a modification to an existing stationary source.
Deleted: 5

8.1 AIR QUALITY
PO062006001SAC/344005/062570015 (HBRP_008-1-REVSEP07.DOC) 8.1-79
TABLE 8.1-44 Emissions from New Equipment for District PSD
Pollutant HBRP Emissions, tpy PSD Significant
Emission Levels, tpy Significant?
NOx 174.3 40 Yes
SOx 4.4 40 No
CO 171.0 100 Yes
ROC 188.9 40 Yes
PM10 118.7 15 Yes
The source must also demonstrate that it will not cause the violation of any Class II increments. The ambient air quality impacts analysis provided in Section 8.1.2.5 is compared with the allowable Class II NO2 increment in Table 8.1-45 to demonstrate that the maximum modeled annual average NO2 impact from the project will not exceed the Class II increments. Compliance with the Class II PM10 increments is shown in Table 8.1-45.
TABLE 8.1-45 Comparison of Maximum Modeled Annual Average NO2 Impact and PSD Class II Increment
Pollutant Averaging Time Maximum Modeled
Impacts (µg/m3) Class II Increment (µg/m3)
NO2 Annual 2.5 25
8.1.5.2.3.2 Other NCUAQMD Regulatory Requirements The NCUQMD has developed regulations limiting emissions from specific sources. These regulations are collectively known as “prohibitory rules,” because they prohibit the construction or operation of a source of pollution that would violate specific emission limits.
The general prohibitory rules of the NCUAQMD applicable to the HBRP are as follows.
Rule 104 §1.1—Public Nuisance Prohibits emissions in quantities that adversely affect public health, other businesses, or property. The analyses provided in this application demonstrate that the proposed facility will comply with this rule.
Rule 104 §2.1—Visible Emissions Limits the visible emissions from the project to no darker than No. 2 when compared to a Ringelmann Chart for a period or periods aggregating more than 3 minutes in any hour. The analyses provided in this application indicate that the engines proposed for use in this project will be controlled to extremely low emission levels and will use clean fuels. Therefore, no exceedances of the visible emissions limitations are expected.
Rule 104 §3.1—Particulate Matter and Visible Emissions Particulate emission concentrations cannot exceed 0.20 grains per dry standard cubic foot of exhaust gas volume. The grain loading concentrations shown in Tables 8.1A-2 and 8.1A-3 of Appendix 8.1A show that the engines will easily comply with this limitation.
Deleted: 5
Deleted: 160.7
Deleted: 6
Deleted: 2
Deleted: Table 8.1-46 shows the combined NO2 modeled impacts of HBRP with the reductions from the shutdown of the Humboldt Bay Power Plant generating units. There are no increments for CO or ROC.
Deleted: 6
Deleted: 1.3
Deleted: ¶TABLE 8.1-46 ¶Comparison of Combined Modeled Annual Average NO2 Impacts of HBRP and Humboldt Bay Power Plant with PSD Class II Increment ... [44]

8.1 AIR QUALITY
8.1-80 PO062006001SAC/344005/062570015 (HBRP_008-1-REVSEP07.DOC)
Rule 104 §4.0—Fugitive Dust Emissions This rule requires the use of reasonable precautions to prevent particulate matter from becoming airborne. Relevant examples include the use of water or chemicals to control dust in demolition, construction, and grading operations (§4.2.4). As discussed in Section 8.1.2.4, mitigation measures will be used during construction and grading operations to minimize dust emissions.
Rule 104 §5.0—Sulfur Dioxide This rule limits stationary source emissions of sulfur dioxide to less than 1,000 ppm. The SO2 emissions concentrations shown in Tables 8.1A-2 and 8.1A-3 of Appendix 8.1A show that the engines will easily comply with this limitation.
Rule 303—Hexavalent Chromium Emissions From Cooling Towers NCUAQMD has adopted by reference Air Toxics Control Measures adopted by the California Air Resources Board. NCUAQMD Rule 303 (Section 93103, Subchapter 7.5, Chapter 1, Part III, Titles 17 and 26, Code of California Regulations) limits hexavalent chromium emissions from cooling towers by eliminating the use of chromium-based chemicals. This regulation is not applicable to the proposed project because no wet cooling towers will be utilized.
8.1.5.2.3.3 NCUAQMD Title V Program NCUAQMD Rules 501-504—Title V These rules implement the operating permit requirements of Title V of the federal Clean Air Act. The rules apply to major facilities, Phase II acid rain facilities, subject solid waste incinerator facilities, and any facility listed by USEPA as requiring a Title V permit. The HBRP will be required to obtain an amended Title V permit prior to commencing operation. HBRP will comply with this requirement by submitting an application for an amended Title V permit at least 12 months before the expected date of first fire for the engines.
The NCUAQMD has adopted by reference the federal Title IV (Acid Rain) Regulation and is now responsible for implementing the program through the Title V operating permit program. Under Title IV, a project must comply with maximum operating emissions levels for SO2 and NOx and is required to install and operate continuous monitoring systems for SO2, NOx, and CO2 emissions. Extensive recordkeeping and reporting requirements are also part of the acid rain program. The existing Humboldt Bay Power Plant boilers are subject to the requirements of the acid rain program. However, since the new engines that will replace the boilers are rated at less than 25 MW each, these new units will not be subject to acid rain program requirements.
All applicable LORS are summarized in Table 8.1-46. Deleted: 8

8.1 AIR QUALITY
PO062006001SAC/344005/062570015 (HBRP_008-1-REVSEP07.DOC) 8.1-81
TABLE 8.1-46 Laws, Ordinances, Regulations, Standards (LORS), and Permits for Protection of Air Quality
LORS Purpose Regulating Agency Permit or Approval Schedule and Status of Permit Conformance
(Section; Page)
Federal
Clean Air Act (CAA) §160-169A and implementing regulations, Title 42 United States Code (USC) §7470-7491 (42 USC 7470-7491), Title 40 Code of Federal Regulations (CFR) Parts 51 & 52 (40 CFR 51 & 52) (Prevention of Significant Deterioration Program)
Requires prevention of significant deterioration (PSD) review and facility permitting for construction of new or modified major stationary sources of air pollution. PSD review applies to pollutants for which ambient concentrations are lower than NAAQS.
NCUAQMD with USEPA oversight
After project review, issues Authority to Construct (ATC) with conditions limiting emissions.
Agency approval to be obtained before start of construction.
8.1.5.2.1.1, Appendices 8.1E and 8.1G; pp. 65-74
CAA §171-193, 42 USC §7501 et seq. (New Source Review) Requires new source review (NSR) facility permitting for construction or modification of specified stationary sources. NSR applies to pollutants for which ambient concentration levels are higher than NAAQS.
NCUAQMD with USEPA oversight
After project review, issues ATC with conditions limiting emissions.
Agency approval to be obtained before start of construction.
8.1.5.2.3.1, Appendices 8.1E and 8.1G; pp. 82-84
CAA §401 (Title IV), 42 USC §7651 (Acid Rain Program) Requires reductions in NOx and SO2 emissions. NCUAQMD with USEPA oversight
Issues Acid Rain permit after review of application.
Application to be made within 12 months of start of facility operation; HBRP not subject to this program.
8.1.5.1.1; p. 63
CAA §501 (Title V), 42 USC §7661 (Federal Operating Permits Program)
Establishes comprehensive permit program for major stationary sources.
NCUAQMD with USEPA oversight
Issues amended Title V permit after review of application.
Application for amendment to be made at least 12 months prior to start of facility operation.
8.1.5.2.3.3; p. 86
CAA §111, 42 USC §7411, 40 CFR Part 60 (New Source Performance Standards [NSPS])
Establishes national standards of performance for new stationary sources.
NCUAQMD with USEPA oversight
After project review, issues ATC with conditions limiting emissions.
Agency approval to be obtained before start of construction.
8.1.5.2.1.3; pp. 75-76
CAA §112, 42 USC §7412, 40 CFR Part 63 (NESHAP) Establishes national emission standards for hazardous air pollutants.
NCUAQMD with USEPA oversight
After project review, issues ATC with conditions limiting emissions.
Agency approval to be obtained before start of construction.
8.1.5.2.1.3; p. 77
State
California Health & Safety Code (H&SC) §41700 (Nuisance Regulation)
Outlaws discharge of such quantities of air contaminants that cause injury, detriment, nuisance, or annoyance.
NCUAQMD with CARB oversight
After project review, issues Final Determination of Compliance (FDOC) with conditions limiting emissions.
Agency approval to be obtained before start of construction.
8.1.5.2.2; p. 64
H&SC §44300-44384; California Code of Regulations (CCR) §93300-93347 (Toxic “Hot Spots” Act)
Requires preparation and biennial updating of facility emission inventory of hazardous substances; risk assessments.
NCUAQMD with CARB oversight
After project review, issues Final Determination of Compliance (FDOC) with conditions limiting emissions.
SHRA submitted before start of construction.
8.1.2.8, 8.1.5.2.2.2, Appendix 8.1C; pp. 57-58, 64
California Public Resources Code §25523(a); 20 CCR §1752, 2300-2309 (CEC & CARB Memorandum of Understanding)
Requires that CEC’s decision on AFC include requirements to assure protection of environmental quality; AFC required to address air quality protection.
CEC After project review, issues Final Determination of Compliance (FDOC) with conditions limiting emissions.
CEC approval of AFC, including all conditions contained in FDOC, to be obtained before start of construction.
8.1.5.1.2; p. 64
Local
NCUAQMD Rule 104 §1.1 (Public Nuisance) Prohibits emissions in quantities that adversely affect public health, other businesses, or property.
NCUAQMD with CARB oversight
After project review, issues Final Determination of Compliance (FDOC) with conditions limiting emissions.
Agency approval to be obtained before start of construction.
8.1.5.2.3.2; p. 85
NCUAQMD Rule 110 (New Source Review and Prevention of Significant Deterioration)
NSR and PSD: Requires that preconstruction review be conducted for all proposed new or modified sources of air pollution, including BACT, emissions offsets, and air quality impact analysis.
NCUAQMD with CARB oversight
After project review, issues Final Determination of Compliance (FDOC) with conditions limiting emissions.
Agency approval to be obtained before start of construction.
8.1.5.2.3.1, Appendices 8.1C and 8.1G; pp. 82-84
NCUAQMD Rules 501-504 (Title V) Implements operating permits requirements of CAA Title V NCUAQMD with USEPA oversight
Issues amended Title V permit after review of application.
Application for amendment to be made at least 12 months of start of facility operation.
8.1.5.2.4; p. 86
NCUAQMD Rules 501-504 (Title IV) Acid rain regulations of CAA Title IV. NCUAQMD with USEPA oversight
Title IV requirements incorporated into Title V permit after review of application
Application to be submitted 2 years before start of facility operation. HBRP not subject to this program.
8.1.5.1.1; p. 63
Deleted: 8

8.1 AIR QUALITY
PO062006001SAC/344005/062570015 (HBRP_008-1-REVSEP07.DOC) 8.1-83
TABLE 8.1-46 Laws, Ordinances, Regulations, Standards (LORS), and Permits for Protection of Air Quality
LORS Purpose Regulating Agency Permit or Approval Schedule and Status of Permit Conformance
(Section; Page)
NCUAQMD Rule 104 §2.1 (Visible Emissions) Limits visible emissions to no darker than Ringelmann No. 2 for periods greater than 3 minutes in any hour.
NCUAQMD with CARB oversight
After project review, issues Final Determination of Compliance (FDOC) with conditions limiting emissions.
Agency approval to be obtained before start of construction.
8.1.5.2.3.2; p. 85
NCUAQMD Rule 104 §3.1 (Particulate Matter) Limits PM emissions to less than 0.20 gr/dscf. NCUAQMD with CARB oversight
After project review, issues Final Determination of Compliance (FDOC) with conditions limiting emissions.
Agency approval to be obtained before start of construction.
8.1.5.2.3.2; p. 85
NCUAQMD Rule 104 §5.0 (Sulfur Dioxide) Limits SO2 emissions to <1,000 ppm NCUAQMD with CARB oversight
After project review, issues ATC with conditions limiting emissions.
Agency approval to be obtained before start of construction.
8.1.5.2.3.2; p. 85
Deleted: 7

8.1 AIR QUALITY
PO062006001SAC/344005/062570015 (HBRP_008-1-REVSEP07.DOC) 8.1-85
8.1.6 Agencies Involved and Agency Contacts The USEPA has responsibility for enforcing, on a national basis, the requirements of many of the country’s environmental and hazardous waste laws. California is under the jurisdiction of USEPA Region IX, located in San Francisco. Region IX is responsible for the local administration of USEPA programs for California, Arizona, Nevada, Hawaii, and certain Pacific trust territories. USEPA’s activities relative to the California air pollution control program focus principally on reviewing California’s submittals for the SIP. The SIP is required by the federal Clean Air Act to demonstrate how all areas of the state will meet the national ambient air quality standards within the federally specified deadlines.
The California Air Resources Board was created in 1968 by the Mulford-Carrell Air Resources Act, through the merger of two other state agencies. CARB’s primary responsibilities are to develop, adopt, implement, and enforce the state’s motor vehicle pollution control program; to administer and coordinate the state’s air pollution research program; to adopt and update as necessary the state’s ambient air quality standards; to review the operations of the local air pollution control districts; and to review and coordinate preparation of the SIP for achievement of the federal ambient air quality standards.
When the state’s air pollution statutes were reorganized in the mid-1960s, local air pollution control districts (APCDs) were required to be established in each county of the state. There are three types of districts: county, regional, and unified. In addition, special air quality management districts (AQMDs), with more comprehensive authority over non-vehicular sources as well as transportation and other regional planning responsibilities, have been established by the Legislature for several regions in California. The NCUAQMD is a unified air district established pursuant to Section 40150 of the Health and Safety Code.
Air pollution control districts and air quality management districts in California have principal responsibility for developing plans for meeting the state and federal ambient air quality standards; for developing control measures for non-vehicular sources of air pollution necessary to achieve and maintain both state and federal air quality standards; for implementing permit programs established for the construction, modification, and operation of sources of air pollution; for enforcing air pollution statutes and regulations governing non-vehicular sources; and for developing employer-based trip reduction programs.
Each level of government has adopted specific regulations that limit emissions from stationary combustion sources, several of which are applicable to this project. The other air agencies having permitting authority for this project are shown in Table 8.1-47. The applicable federal LORS and compliance with these requirements are discussed in more detail in the following sections. The NCUAQMD will review the AFC, filed with the CEC, as if it were an application for a District permit. It will provide the CEC with a Determination of Compliance, which provides the CEC with information on what the facility must do in order to be in compliance with air quality requirements. Additionally, the NCUAQMD is responsible for issuance of the federal Operating (Title V) permit. An application for the federal permit will be submitted in a timely fashion.
Deleted: 9

8.1 AIR QUALITY
8.10-86 PO062006001SAC/344005/062570015 (HBRP_008-1-REVSEP07.DOC)
TABLE 8.1-47 Air Quality Agencies
Agency Authority Contact
USEPA Region IX Oversight of permit issuance, enforcement
Gerardo Rios, Chief Permits Office USEPA Region IX 75 Hawthorne Street San Francisco, CA 94105 (415) 744-1259
California Air Resources Board
Regulatory oversight Mike Tollstrup, Chief Project Assessment Branch California Air Resources Board 2020 L Street Sacramento, CA 95814 (916) 322-6026
North Coast Unified Air Quality Management District
Permit issuance, enforcement Jason Davis, Permit Services Division Manager North Coast Unified Air Quality Management District 2300 Myrtle Ave Eureka, CA 95501 (707) 443-3093
8.1.7 Permits and Permit Schedule The Permit to Construct permit is required in accordance with NCUAQMD Rule 110. A complete application for a “Permit to Construct” will be filed with the NCUAQMD within 1 week (5-7 working days) of the HBRP AFC filing.
8.1.8 References California Air Resource Board (CARB). http://www.arb.ca.gov/adam.
California Air Resource Board (CARB). 1989. Reference Document for California Statewide Modeling Guideline. April.
California Air Resource Board (CARB). 1997. Emission Inventory Criteria and Guidelines Report for the Air Toxics “Hot Spots” Program. May 15.
California Air Resource Board (CARB). 1999. Proposed Guidance for Power Plant Siting and Best Available Control Technology. June 23.
California Air Resource Board (CARB). 2005. Hotspots Analysis and Reporting Program (HARP). Downloaded from http://www.arb.ca.gov/toxics/harp/harp.htm. August.
California Air Resource Board (CARB). 2006. California Air Toxics Emission Factor database at http://www.arb.ca.gov/ei/ catef/catef.htm. Accessed June 2006.
CAPCOA. 1993. Air Toxics “Hot Spots” Program Revised 1992 Risk Assessment Guidelines. October.
Deleted: 89
Deleted: Simona Altman

8.1 AIR QUALITY
PO062006001SAC/344005/062570015 (HBRP_008-1-REVSEP07.DOC) 8.1-87
National Oceanic and Atmospheric Administration (NOAA), ESRL Global Monitoring Division. 2006. ftp://140.172.192.211/ozwv/surfo3/ trinidad%20head. Accessed July 2006.
California Office of Environmental Health Hazard Assessment (OEHHA). 2002. Air Toxics Hot Spots Program Risk Assessment Guidelines. Part II. Technical Support Document for Describing Available Cancer Potency Factors. December.
California Office of Environmental Health Hazard Assessment (OEHHA). Acute and Chronic Exposure Levels Developed by OEHHA as of November 2003.
Smith, T. B., W.D. Sanders, and D.M. Takeuchi. 1984. Application of Climatological Analysis to Minimize Air Pollution Impacts in California, Final Report on ARB Agreement A2-119-32. August.
Stull, Roland B. 1988. An Introduction to Boundary Layer Meteorology, Chapter 9.
U.S. Department of Commerce, Weather Bureau. 1959. Climate of the States—California. December.
U.S. Environmental Protection Agency (USEPA). 1985. Guideline for Determination of Good Engineering Practice Stack Height. June.
U.S. Environmental Protection Agency (USEPA). 1987. Ambient Monitoring Guidelines for Prevention of Significant Deterioration (PSD), EPA-450/4-87-007. May.
U.S. Environmental Protection Agency (USEPA). 1992. Screening Procedures for Estimating the Air Quality Impact of Stationary Sources, Revised, EPA-454/R-92-019. October.
U.S. Environmental Protection Agency (USEPA). 1995. On-Site Meteorological Program Guidance for Regulatory Model Applications, EPA-450/4-87-013. August.
U.S. Environmental Protection Agency (USEPA). 1999. Guideline on Air Quality Models, 40 CFR, Part 51, Appendix W. July 1.
U.S. Environmental Protection Agency (USEPA). 2000. Compilation of Emission Factors. AP-42. Revised July.
U.S. Environmental Protection Agency (USEPA). 2004. User’s Guide for the AERMOD Meteorological Preprocessor (AERMET), EPA-454/B-03-002, November.
U.S. Environmental Protection Agency (USEPA). 2005. AERMOD Implementation Guide, www.epa.gov/scram001/17thconf/aermod. September 17.
Page 8: [1] Deleted nlm 9/6/2007 1:54:00 PM
6
Page 8: [1] Deleted nlm 9/6/2007 1:54:00 PM
5
Page 8: [1] Deleted nlm 9/6/2007 1:54:00 PM
5
Page 8: [2] Deleted nlm 9/6/2007 1:51:00 PM
0.058
Page 8: [2] Deleted nlm 9/6/2007 1:52:00 PM
0.065
Page 8: [2] Deleted nlm 9/6/2007 1:52:00 PM
0.070
Page 8: [2] Deleted nlm 9/6/2007 1:52:00 PM
0.066
Page 8: [2] Deleted nlm 9/6/2007 1:52:00 PM
0.054
Page 8: [2] Deleted nlm 9/6/2007 1:52:00 PM
0.062
Page 8: [2] Deleted nlm 9/6/2007 1:52:00 PM
0.086
Page 8: [2] Deleted nlm 9/6/2007 1:52:00 PM
0.090
Page 8: [2] Deleted nlm 9/6/2007 1:52:00 PM
0.060
Page 8: [2] Deleted nlm 9/6/2007 1:52:00 PM
0.067
Page 8: [3] Deleted nlm 9/6/2007 1:51:00 PM
0.049
Page 8: [3] Deleted nlm 9/6/2007 1:52:00 PM
0.058

Page 8: [3] Deleted nlm 9/6/2007 1:52:00 PM
0.059
Page 8: [3] Deleted nlm 9/6/2007 1:52:00 PM
0.059
Page 8: [3] Deleted nlm 9/6/2007 1:52:00 PM
0.046
Page 8: [3] Deleted nlm 9/6/2007 1:52:00 PM
0.047
Page 8: [3] Deleted nlm 9/6/2007 1:52:00 PM
0.057
Page 8: [3] Deleted nlm 9/6/2007 1:52:00 PM
0.055
Page 8: [3] Deleted nlm 9/6/2007 1:52:00 PM
0.048
Page 8: [3] Deleted nlm 9/6/2007 1:52:00 PM
0.050
Page 8: [4] Deleted nlm 9/6/2007 1:51:00 PM
6
Page 8: [4] Deleted nlm 9/6/2007 1:51:00 PM
5
Page 8: [5] Deleted nlm 9/6/2007 1:51:00 PM
0.055
Page 8: [5] Deleted nlm 9/6/2007 1:52:00 PM
0.071
Page 8: [5] Deleted nlm 9/6/2007 1:52:00 PM
0.090
Page 8: [5] Deleted nlm 9/6/2007 1:52:00 PM
0.079
Page 8: [5] Deleted nlm 9/6/2007 1:52:00 PM
0.071

Page 8: [5] Deleted nlm 9/6/2007 1:52:00 PM
0.070
Page 8: [5] Deleted nlm 9/6/2007 1:52:00 PM
0.092
Page 8: [5] Deleted nlm 9/6/2007 1:52:00 PM
0.078
Page 8: [5] Deleted nlm 9/6/2007 1:52:00 PM
0.070
Page 8: [5] Deleted nlm 9/6/2007 1:52:00 PM
0.088
Page 8: [6] Deleted nlm 9/6/2007 1:51:00 PM
0.046
Page 8: [6] Deleted nlm 9/6/2007 1:52:00 PM
0.061
Page 8: [6] Deleted nlm 9/6/2007 1:52:00 PM
0.071
Page 8: [6] Deleted nlm 9/6/2007 1:52:00 PM
0.069
Page 8: [6] Deleted nlm 9/6/2007 1:52:00 PM
0.059
Page 8: [6] Deleted nlm 9/6/2007 1:52:00 PM
0.055
Page 8: [6] Deleted nlm 9/6/2007 1:52:00 PM
0.072
Page 8: [6] Deleted nlm 9/6/2007 1:52:00 PM
0.066
Page 8: [6] Deleted nlm 9/6/2007 1:52:00 PM
0.056
Page 8: [6] Deleted nlm 9/6/2007 1:52:00 PM
0.060

Page 8: [7] Deleted nlm 9/6/2007 1:51:00 PM
*
Page 8: [7] Deleted nlm 9/6/2007 1:51:00 PM
0.052
Page 8: [7] Deleted nlm 9/6/2007 1:51:00 PM
0.064
Page 8: [7] Deleted nlm 9/6/2007 1:51:00 PM
0.063
Page 8: [7] Deleted nlm 9/6/2007 1:51:00 PM
0.057
Page 30: [8] Deleted nlm 8/22/2007 9:45:00 AM
Maximum Annual Emissions for Federal PSD and CEQA Compliance, tpy
Reciprocating Enginesd 263.1 4.7 181.2 198.8 182.8
Black Start Generatord 0.4 <0.1 0.1 <0.1 <0.1
Fire Pump Engined 0.2 <0.1 <0.1 <0.1 <0.1
Total, tons per year 263.7 4.7 181.3 198.8 182.8
Page 42: [9] Deleted nlm 8/22/2007 2:24:00 PM
8.1.2.6.2 Impacts from the Existing Humboldt Bay Power Plant Generating Units Ambient impacts from the existing Humboldt Bay Power Plant generating units were modeled using actual emissions, operating, and fuel use data. For the 1-, 3- and 8-hour averaging periods, it was assumed that all four units were operating at full load. For the 24-hour averaging period, it was assumed that the two boilers were operating at full load and that each MEPP was operating at 50 percent load. Average historical emission rates over the past 2 years were used for the annual averaging period. Emission rates and stack parameters used in evaluating the air quality impacts from the existing generating units are shown in Table 8.1B-2, Appendix 8.1B. Maximum modeled impacts are summarized in Table 8.1-21.
TABLE 8.1-21 Maximum Modeled Impacts from Existing Generating Units at Humboldt Bay Power Plant
Pollutant Averaging Time Modeled Concentration (µg/m3)
NO2 1-hour Annual
267.3a
9.1b
SO2 1-hour 3-hour
24-hour Annual
10.0 7.0 2.6 0.04
CO 1-hour 8-hour
110.3 55.1

PM2.5/PM10 24-hour
Annual 7.8 0.3
Notes: a 1-hour average NOx modeled using CTSCREEN; ozone limiting performed using highest 1-hour ozone
concentration during 2003-2005 from Ukiah. b Annual average NO2 calculated from modeled NOx using ARM and default 75% conversion factor.
8.1.2.6.3 Screening Procedures for the HBRP Reciprocating Engines To ensure the impacts analyzed were for maximum emission levels and worst-case dispersion conditions, a screening procedure was used to determine the inputs to the impact modeling for the new generating units. The screening procedure analyzed the reciprocating engine operating conditions that would result in the maximum impacts on a pollutant-specific basis. The operating conditions examined in this screening analysis, along with their exhaust and emission characteristics, are shown in Appendix 8.1B, Table 8.1B-3. These operating conditions represent reciprocating engine operation at maximum and minimum ambient operating temperatures (87°F and 21°F), and at 100 percent, 75 percent and minimum (50 percent) loads on natural gas and emergency backup diesel fuels.
Ambient impacts for each of the 12 operating cases were modeled using USEPA’s AERMOD model and 5 years of onsite meteorological data, as described above. The results of the unit impact analysis are presented in Appendix 8.1B, Table 8.1B-4. The analysis showed that for most pollutants and averaging period, modeled impacts were highest under full load operating conditions, while PM10 and annual average impacts were highest under minimum load conditions.
8.1.2.7 Results of the Ambient Air Quality Modeling Analysis 8.1.2.7.1 Refined Air Quality Impact Analysis
Page 48: [10] Deleted nlm 8/22/2007 2:24:00 PM
—
Page 48: [11] Deleted nlm 8/22/2007 2:24:00 PM
—
Page 48: [12] Deleted nlm 8/22/2007 2:24:00 PM
2.3
Page 48: [13] Deleted nlm 8/22/2007 2:24:00 PM
0.03
Page 48: [14] Deleted nlm 8/22/2007 2:24:00 PM 2 —
Page 48: [15] Deleted nlm 8/22/2007 2:24:00 PM

7 0.03
Page 48: [16] Deleted nlm 8/22/2007 2:24:00 PM 51.3 37.6
Page 48: [17] Deleted nlm 8/22/2007 2:24:00 PM 55.8i
37.6
Page 48: [18] Deleted nlm 8/22/2007 2:24:00 PM 843.2j
—d
Page 48: [19] Deleted nlm 8/22/2007 2:24:00 PM 61.6 11.8
Page 48: [20] Deleted nlm 8/22/2007 2:24:00 PM —g —g
Page 48: [21] Deleted nlm 8/22/2007 2:24:00 PM 8.9 —f
Page 48: [22] Deleted nlm 8/22/2007 2:24:00 PM
; 800 hrs/yr of liquid fuel firing for annual averaging period
Page 48: [23] Deleted nlm 8/27/2007 3:08:00 PM
Max. hourly NO2 during
Page 48: [24] Deleted nlm 8/27/2007 3:07:00 PM
Typical natural gas startup of 10 engines has maximum impact of 198.1 µg/m3.
Page 48: [25] Deleted nlm 8/27/2007 3:09:00 PM j. Startup on liquid fuel. Typical natural gas startup of 10 engines has maximum impact of 786.1µg/m3. k. I
When the 24-hour period of extreme meteorological conditions is eliminated from the met data set, the maximum modeled 24-hour average PM10 concentration during normal operation is reduced to 14.6 µg/m3. See text.
l. When the 24-hour period of extreme meteorological conditions is eliminated from the met data set, the maximum modeled 24-hour average PM10 concentration during emergency operation is reduced to 13.7 µg/m3. See text.
Page 48: [26] Deleted nlm 8/22/2007 2:24:00 PM
As discussed earlier, 5 years of meteorological data were used to evaluate the ambient impacts of the project. Results obtained using the 2004 met data set were consistently significantly higher than results from the other met data years. A closer examination of the 2004 met data set revealed that there was a 24-hour period during that year (November 3, 2004) during which the winds blew from the north at high speed for most of the 24-hour period. That combination created extreme downwash conditions, bringing the exhaust plumes to ground quickly and with very little dilution, and causing relatively high ground-level concentrations at the plant boundary. Comparing the persistence of the wind speed and direction to those of other days indicated that this day was highly unusual. When that day is eliminated, the maximum modeled 24-hour average PM10 concentrations drop by almost one-third. That the meteorological

conditions on a single day could have such a large effect on the modeling results emphasizes the overly conservative and overpredictive nature of this analysis.
Page 49: [27] Deleted nlm 8/22/2007 2:24:00 PM
PM2.5b 24-Hourc
Annual
35
8.2
23
8.1
32
9.1
Page 49: [28] Deleted nlm 8/22/2007 4:11:00 PM c 24-hour average PM2.5 value shown is 98th percentile value as that is the basis of the ambient air quality standard.
Page 49: [29] Deleted nlm 9/4/2007 3:57:00 PM
on liquid backup fuel
Page 49: [30] Deleted nlm 8/27/2007 3:11:00 PM
Table 8.1-26 shows maximum modeled impacts under reasonably foreseeable worst case conditions, with maximum anticipated operation of the emergency units: 200 hours per year for the black start generator and fire pump engine.
Page 50: [31] Deleted nlm 8/22/2007 2:24:00 PM
Maximum ground-level impacts due to operation of the HBRP are shown together with the ambient air quality standards in Tables 8.1-26 and 8.1-27. The impacts shown in Table 8.1-26 reflect typical facility operation, with operation of the emergency equipment (black start generator and fire pump engine) and of the Wärtsilä reciprocating engines on liquid backup fuel only for allowable testing and maintenance hours (50 hours per year). Table 8.1-26 shows maximum modeled impacts under reasonably foreseeable worst case conditions, with maximum anticipated operation of the units under emergency conditions: 800 hours per year of emergency diesel operation for the Wärtsilä reciprocating engines and 200 hours per year for the black start generator and fire pump engine. The ambient air quality modeling results are extremely conservative and are designed to overpredict ambient concentrations because they evaluate impacts under a combination of worst-case conditions that are unlikely to occur simultaneously. The modeling combines the highest allowable emission rates with the most extreme meteorological conditions and the equipment operating load conditions that result in the highest ambient impact. Therefore it is extremely unlikely that the ambient concentrations predicted by the models will ever actually be realized. However, this analysis demonstrates that even under these combinations of conditions that overpredict impacts, the HBRP will not cause or contribute to violations of any state or federal air quality standards, with the exception of the state PM10 standards. For this pollutant, existing concentrations already exceed the state standards. TABLE 8.1-26 Modeled Maximum Impacts, Normal Facility Operationsa
Page 50: [32] Deleted nlm 8/22/2007 2:24:00 PM
Annual
Page 50: [32] Deleted nlm 8/22/2007 2:24:00 PM

198.1 1.3
Page 50: [32] Deleted nlm 8/22/2007 2:24:00 PM
99.6
Page 50: [32] Deleted nlm 8/22/2007 2:24:00 PM
298b
18
Page 50: [32] Deleted nlm 8/22/2007 2:24:00 PM
470 –
Page 50: [33] Deleted nlm 8/22/2007 2:24:00 PM
118 73 22
Page 50: [34] Deleted nlm 8/22/2007 2:24:00 PM
2.3
Page 50: [35] Deleted nlm 8/22/2007 2:24:00 PM
7 0.03
Page 50: [36] Deleted nlm 8/22/2007 2:24:00 PM
786.1 37.6
Page 50: [36] Deleted nlm 8/22/2007 2:24:00 PM
6,625 2,422
Page 50: [36] Deleted nlm 8/22/2007 2:24:00 PM
7,411
Page 50: [37] Deleted nlm 9/6/2007 1:37:00 PM
Page 50: [37] Deleted nlm 9/6/2007 1:37:00 PM
Page 50: [38] Deleted nlm 8/22/2007 2:24:00 PM
Annual2
Page 50: [38] Deleted nlm 8/22/2007 2:24:00 PM

21.7c
Page 50: [39] Deleted nlm 8/22/2007 2:24:00 PM
71 20.7
Page 50: [39] Deleted nlm 8/22/2007 2:24:00 PM
93 22
Page 50: [40] Deleted nlm 9/6/2007 1:37:00 PM
Page 50: [40] Deleted nlm 9/6/2007 1:37:00 PM
Page 50: [41] Deleted nlm 8/22/2007 2:24:00 PM
PM2.5 24-Hour Annual
21.7c 1.2
35 9.1
57 10
– 12
65 15
Notes: a Normal operations reflect operation on natural gas fuel with up to 50 hours per year per engine of operation on
liquid fuel for testing and maintenance. b. Includes startup. Under normal operating conditions, total impact will be 119 µg/m3. c When the extreme 24-hour period of extreme meteorological conditions is eliminated from the met data set, the
highest modeled concentration drops to 14.6 µg/m3. See text.
TABLE 8.1-27 Modeled Maximum Impacts, Maximum Expected Emergency Facility Operationa
Pollutant Averaging Time
Maximum Facility Impact
(µg/m3) Background
(µg/m3)
Total Impact (µg/m3)
State Standard (µg/m3)
Federal Standard (µg/m3)
NO2 1-hour Annual
262.8 1.9
99.6 17.0
362 19
470 –
– 100
SO2 1-hour 3-hour
24-hour Annual
2.0 1.0 0.7
0.03
114.4 70.2 21.0 5.3
116 71 22 5
650 –
109 –
– 1,300 365 80
CO 1-hour 8-hour
843.2 37.6
6,625 2,422
7,468 2,460
23,000 10,000
40,000 10,000
PM10 24-hour Annual2
18.6b 1.4
71 20.7
90 22
50 20
150 50
PM2.5 24-Hour Annual
18.6b 1.4
35 9.1
54 11
– 12
65 15

Notes: a Emergency operations reflect worst-case conditions, including all reciprocating engines starting up and operating
on liquid fuel for a 24-hour period, as well as 800 hours per year per engine of emergency operation on liquid fuel. b When the extreme 24-hour period of extreme meteorological conditions is eliminated from the met data set, the
highest modeled concentration drops to 13.7 µg/m3. See text.
8.1.2.9 Screening Health Risk Assessment
Page 50: [42] Deleted nlm 8/27/2007 3:16:00 PM
Normal operations reflect o
Page 50: [42] Deleted nlm 9/4/2007 4:06:00 PM
o
Page 50: [42] Deleted nlm 9/4/2007 4:06:00 PM
fuel with
Page 50: [42] Deleted nlm 9/4/2007 4:06:00 PM
on liquid fuel
Page 69: [43] Deleted nlm 8/27/2007 4:19:00 PM
TABLE 8.1-42 Comparison of Combined Modeled Impacts of HBRP and Humboldt Bay Power Plant and PSD Class II Increments
Pollutant Averaging Time Maximum Modeled
Impacts (µg/m3)a Class II Increment (µg/m3)
PM10 24-Hour, Normal Operation 24-hour, Emergency Operation
Annual
21.7 18.6 1.14
30 30 17
HBRP will consult with the District staff to determine the appropriate baseline date for the PM10 increments analysis and to identify other increment-consuming and increment-expanding sources that need to be included in t
Page 79: [44] Deleted nlm 8/27/2007 4:21:00 PM
TABLE 8.1-46 Comparison of Combined Modeled Annual Average NO2 Impacts of HBRP and Humboldt Bay Power Plant with PSD Class II Increment
Pollutant Averaging Time Maximum Modeled
Impacts (µg/m3) Class II Increment (µg/m3)
NO2 Annual 0.3 25