
802.11n MAC layer simulation
15
802.11n MAC layer 802.11n MAC layer simulation simulation Submitted by: Submitted by: Niv Tokman Niv Tokman Aya Mire Aya Mire Oren Gur-Arie Oren Gur-Arie
-
Upload
uriel-petty -
Category
Documents
-
view
34 -
download
3
description
802.11n MAC layer simulation. Submitted by: Niv Tokman Aya Mire Oren Gur-Arie. Standard protocol transaction. 1. Data arrives at Tx FIFO of STA A from VoIP data generator. IAC is sent. 2. AP receives IAC, wait SIFS and respond with RAC. 3. RAC received. STA A sends non-aggregated VoIP data. - PowerPoint PPT Presentation
Transcript of 802.11n MAC layer simulation

802.11n MAC layer simulation802.11n MAC layer simulation
Submitted by:Submitted by:
Niv TokmanNiv Tokman
Aya MireAya Mire
Oren Gur-ArieOren Gur-Arie

Standard protocol transactionStandard protocol transaction
ST
A A
ctiv
ityP
HY
Tx
MA
C T
xA
P A
ctiv
ityP
HY
Tx
MA
C T
x
Bas
ic r
ate
non-
agg
IAC
MP
DU
(RT
S)
Bas
ic ra
te
non-
agg
RA
C M
PD
U
(CT
S)
ST
A A
ctiv
ityP
HY
Tx
MA
C T
xS
TA
Act
ivity
PH
Y R
xM
AC
Rx
Agg
P
PD
UD
ata
MP
DU
Dat
a M
PD
U
Bas
ic r
ate
non-
agg
Dat
a M
PD
U
Bas
ic r
ate
non-
agg
IAC
MP
DU
(RT
S)
Bas
ic r
ate
non-
agg
Dat
a M
PD
U
Bas
ic ra
te
non-
agg
IAC
MP
DU
(R
TS
)
Bas
ic r
ate
non-
agg
Rec
eive
d da
ta
NAV
NAVNAV
NAV
Bas
ic ra
te
non-
agg
RA
C M
PD
U
(CT
S)
NAV
NAV
DIFS
SIFS
1. Data arrives at Tx FIFO of STA A from VoIP data generator. IAC is sent.
2. AP receives IAC, wait SIFS and respond with RAC.
3. RAC received. STA A sends non-aggregated VoIP data
4. After DIFS, the operation is repeated by STA B5. Aggregation size is reached. AP send IAC followed by the aggregated data
6. Data is received by STA C

Simulation structure and flowSimulation structure and flowGUI
Simulation manager
STA
STA
STA
STA
STA
AP Network
Statistics
Simulation output files:- Analysis
- log
Main()
Packet Generator
Define “start conversation” events
Reached end of simulation time?
Handle next event
Last event in current time stamp?
NO
NO
Jump to next time stamp
YES
End Simulation
YES
Simulation assumptionsSimulation assumptions
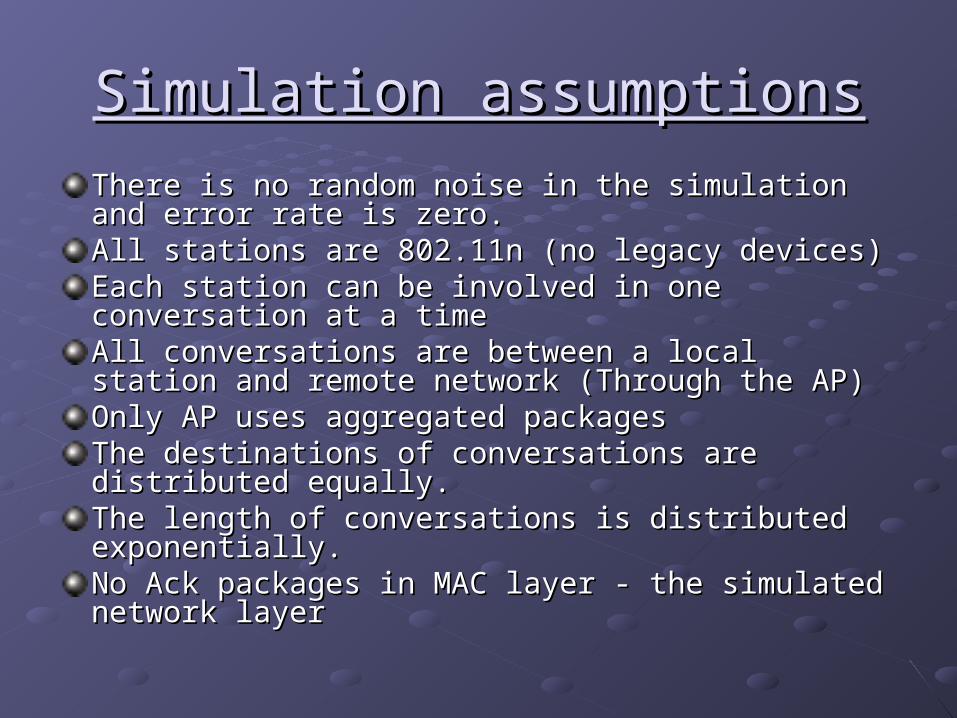
There is no random noise in the simulation and error rate There is no random noise in the simulation and error rate is zero.is zero.All stations are 802.11n (no legacy devices)All stations are 802.11n (no legacy devices)Each station can be involved in one conversation at a Each station can be involved in one conversation at a timetimeAll conversations are between a local station and remote All conversations are between a local station and remote network (Through the AP)network (Through the AP)Only AP uses aggregated packagesOnly AP uses aggregated packagesThe destinations of conversations are distributed equally. The destinations of conversations are distributed equally. The length of conversations is distributed exponentially.The length of conversations is distributed exponentially.No Ack packages in MAC layer - the simulated network No Ack packages in MAC layer - the simulated network layerlayer

Network capacity calculationNetwork capacity calculation
The idea: to create a standard reference point to network The idea: to create a standard reference point to network capacity, regardless of aggregation size used.capacity, regardless of aggregation size used.The network capacity is the percentage of bandwidth The network capacity is the percentage of bandwidth actually used. Due to different timing scheme, the actually used. Due to different timing scheme, the percentage differs between regular station and AP.percentage differs between regular station and AP.Thus we calculate them independently and perform a Thus we calculate them independently and perform a weighted sum.weighted sum.This is a static calculation. A dynamic calculation taking This is a static calculation. A dynamic calculation taking actual collisions and transmissions into account provide actual collisions and transmissions into account provide different capacity per aggregation, which makes different capacity per aggregation, which makes comparison impossible.comparison impossible.The equations are in the next slide:The equations are in the next slide:
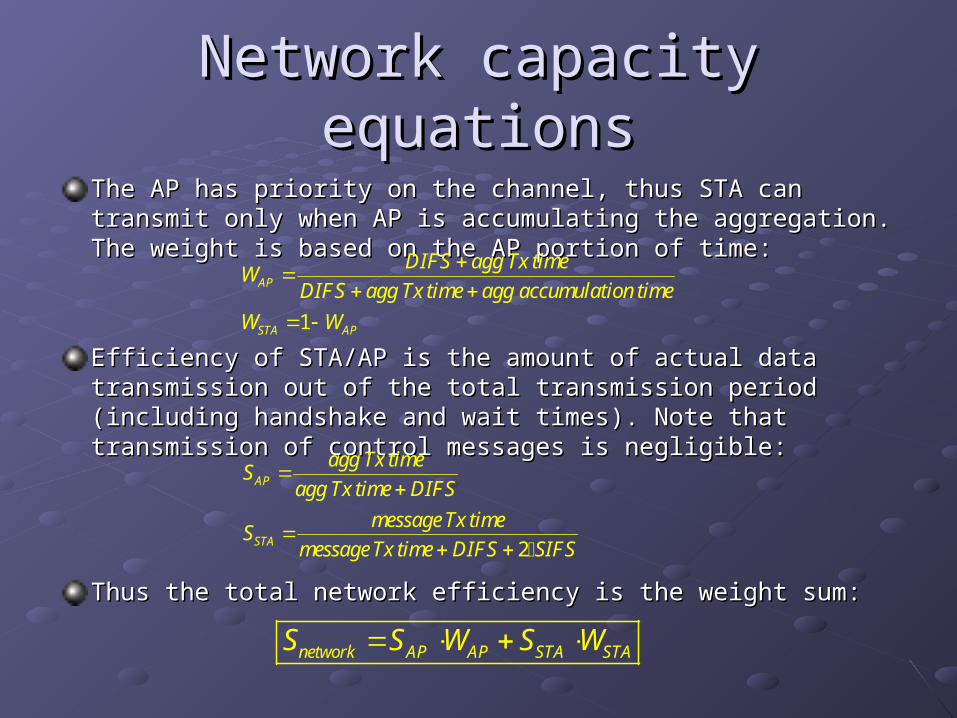
The AP has priority on the channel, thus STA can transmit only The AP has priority on the channel, thus STA can transmit only when AP is accumulating the aggregation. The weight is based on when AP is accumulating the aggregation. The weight is based on the AP portion of time:the AP portion of time:
Efficiency of STA/AP is the amount of actual data transmission out Efficiency of STA/AP is the amount of actual data transmission out of the total transmission period (including handshake and wait of the total transmission period (including handshake and wait times). Note that transmission of control messages is negligible:times). Note that transmission of control messages is negligible:
Thus the total network efficiency is the weight sum:Thus the total network efficiency is the weight sum:
Network capacity equationsNetwork capacity equations
1
AP
STA AP
DIFS agg Tx timeW
DIFS agg Tx time agg accumulation time
W W
2
AP
STA
agg Tx timeS
agg Tx time DIFS
messageTx timeS
messageTx time DIFS SIFS
network AP AP STA STAS S W S W

Packets reaching dst. before 1ms
0
20
40
60
80
100
120
15 23.75 32.5 41.25 50
Network capacity (MB/s)
Pa
ck
ets
(%
)
agg 100agg 200agg 300agg 400agg 500agg 600agg 700

Packets reaching dst. before 5ms
0
20
40
60
80
100
120
15 23.75 32.5 41.25 50
Network capacity (MB/s)
Pac
kets
(%
)
agg 100
agg 200
agg 300
agg 400
agg 500
agg 600
agg 700

Packets reaching dst. before 10ms
0
20
40
60
80
100
120
15 23.75 32.5 41.25 50Network capacity (MB/s)
Pa
ck
ets
(%
)
agg 100
agg 200
agg 300
agg 400
agg 500
agg 600
agg 700

Simulation analysisSimulation analysis
We can see that at lower network capacity, we get better We can see that at lower network capacity, we get better results for the higher aggregation sizes, while at higher results for the higher aggregation sizes, while at higher network capacities we get better performance for middle network capacities we get better performance for middle range of aggregation sizerange of aggregation sizeIn the current simulation configuration, the aggregated In the current simulation configuration, the aggregated AP has priority over the regular stations. When network AP has priority over the regular stations. When network capacity is low, it takes time to accumulate an capacity is low, it takes time to accumulate an aggregation, which gives equal opportunity to the aggregation, which gives equal opportunity to the stations to transmit their messages.stations to transmit their messages.When the network capacity is high, aggregations are When the network capacity is high, aggregations are accumulated in no time, and the AP starves the other accumulated in no time, and the AP starves the other stations, thus their messages expire and the success stations, thus their messages expire and the success rate is falling.rate is falling.
Simulation analysis (cont.)Simulation analysis (cont.)
Aggregation of 100 is like almost no Aggregation of 100 is like almost no aggregation at all. Success rate is poor at aggregation at all. Success rate is poor at lower network capacities, while at higher lower network capacities, while at higher rates the success rate is similar to higher rates the success rate is similar to higher aggregation sizes.aggregation sizes.
It can be seen that the trends are kept as It can be seen that the trends are kept as margin is raised.margin is raised.

Success rate relative to agg size (for different network capacities)
0
20
40
60
80
100
120
agg 100 agg 200 agg 300 agg 400 agg 500 agg 600 agg 700
Su
cces
sfu
l p
acke
ts (
%)
15
23.75
32.5
41.25
50
Network capacity (MB/s)
Success rate analysisSuccess rate analysis
It can be seen that for low-mid range It can be seen that for low-mid range network capacity, the largest aggregation network capacity, the largest aggregation is the best.is the best.
At higher network capacities, the larger At higher network capacities, the larger aggregations causes regular stations aggregations causes regular stations starvation, thus success rates are slightly starvation, thus success rates are slightly lower than at smaller aggregation sizes.lower than at smaller aggregation sizes.

ConclusionsConclusions
At all simulated network capacities, the larger At all simulated network capacities, the larger aggregations provide better results than smaller aggregations provide better results than smaller aggregation sizes. The only exception is at the highest aggregation sizes. The only exception is at the highest network capacities, at which a slight degradation can be network capacities, at which a slight degradation can be observed.observed.Higher aggregation size is better for almost all Higher aggregation size is better for almost all network capacities, even at a network were not all network capacities, even at a network were not all devices aggregate.devices aggregate.The degradation at higher network capacities is probably The degradation at higher network capacities is probably simulation dependent. In networks with better balance simulation dependent. In networks with better balance between AP and stations priorities (such as QoS), one between AP and stations priorities (such as QoS), one can assume that there will be no degradation.can assume that there will be no degradation.

Thank youThank you
Niv, Oren & AyaNiv, Oren & Aya