80 th and Foster Intersection Analysis Kevin Hace Chris Hass Matt Palmer CE 410/510: Bicycle and...
20
80 th and Foster Intersection Analysis Kevin Hace Chris Hass Matt Palmer CE 410/510: Bicycle and Pedestrian Engineering Design
-
date post
19-Dec-2015 -
Category
Documents
-
view
218 -
download
0
Transcript of 80 th and Foster Intersection Analysis Kevin Hace Chris Hass Matt Palmer CE 410/510: Bicycle and...
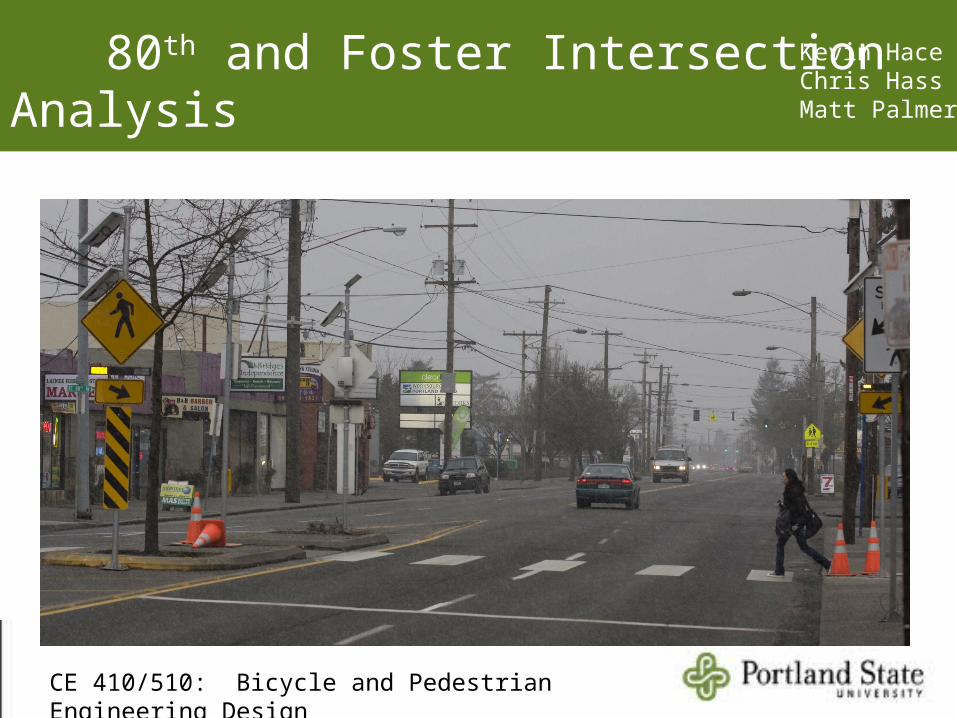
80th and Foster Intersection AnalysisKevin HaceChris HassMatt Palmer
CE 410/510: Bicycle and Pedestrian Engineering Design

Purpose
• Determine effectiveness of 2010 crosswalk enhancement project by comparing before and after video data.
• Recommend mobility and safety changes.

Project Vicinity

Zoning Designation and Crime Rates
Zoning: General Commercial 300-500 crimes annually

Previous ProjectsExisting Crossing Infrastructure (2004)• Crossing at street corner• Limited/ no signage
Crossing moved to Mid-Block (2005)•Pedestrian refuge•Added signage and striping

Issues at Mid-Block Crossing• Many vehicle-pedestrian accidents at
crossing• Limited warning of crossing
pedestrians to approaching vehicles• High volume arterial makes crossing
safely a difficult task.• Low visibility at night

Before Treatment (2005)• Crossing warning signs with arrows• Advance warning signs on both approaches• Center refuge for pedestrians• Continental road markings

After TreatmentIn addition to before items: • Rectangular signs (yellow and black striping)• Pedestrian-activated rectangular LED flash beacon (solar
powered)• Stop bar and associated signage to designate the area where
cars are to stop.

Research Methodology • Field site visit– Measurement of roadway geometrics– Flashing beacon phase time– Characterize surrounding neighborhoods and land uses
• Video review– Traffic video reviewed and analyzed by project team– Pedestrian wait times, non-compliance rates with regard
to pedestrian and vehicles, crossing times, etc.– Video data provided by PBOT

Analysis PeriodBefore Treatment:• Wednesday November 18,2009: 5pm – 6pm • Thursday November 19, 2009: 8am – 9am & 5pm – 6pm• Friday November 20, 2009: 8am – 9am
After Treatment:• Monday March 8, 2010: 5pm – 6pm • Tuesday March 8, 2010 : 8am – 9am & 5pm – 6pm• Wednesday March 8, 2010 : 8am – 9am
*Mondays and Fridays were originally going to be excluded, but were included to provide an adequate number of analysis periods.

Pedestrian and Bicycle Volumes
• Pedestrian movements dominate crossing (70-95%).
• When bicyclist dismount they are considered pedestrians in this research.
• Bicycle volumes are low possibly due to the lack of bicycle facilities in the surrounding area.
BEFOREMorning
BEFOREEvening
AFTERMorning
AFTEREvening
0%10%20%30%40%50%60%70%80%90%
100%
Pedestrians Bicycles

Crossing Direction
BEFOREMorning
BEFOREEvening
AFTERMorning
AFTEREvening
0%10%20%30%40%50%60%70%80%90%
100%
NE Bound SW Bound
• NE bound movements dominate.• Primary reasons:
• Fred Meyer on NE side of crossing• SW neighborhood accessing bus
stop to head downtown on NE side• SW crossings increase in the evenings
due to pedestrians returning to their homes from work.

Pedestrian Delay
• Increased wait times after crosswalk improvements.
• May be due to people becoming reliant on the flasher and not stepping out into the roadway, thereby completely relying on the beacon to stop traffic flow.
MorningAverage
EveningAverage
AFTERMorning
AFTEREvening
0.0
0.5
1.0
1.5
2.0
2.5
3.0
3.5
4.0BeforeAfter
Wai
t Tim
e (s
/ped
)

Average Crossing Times
0.0
2.0
4.0
6.0
8.0
10.0
12.0
14.0
16.0 BeforeAfter
Cros
sing
Tim
e (s
/ped
)
• Crossing times decreased after the crossing enhancement, although the decrease’s significance is questionable.
• Pedestrian crossing times may be decreasing due to the feeling of safety from the flashing beacon. People feel more confident when crossing when a beacon is notifying motorists.

Vehicle Violations per Pedestrians
• Increase in non-compliant vehicles after crossing enhancement.
• Based on our data, more notification is equating to less compliance.
• Commuter traffic may be conditioned to ignore beacon warning.
• Police enforcement may be necessary to minimize vehicle violations.
MorningAverage
EveningAverage
AFTERMorning
AFTEREvening
0.0
0.2
0.4
0.6
0.8
1.0
1.2Before
After
Vehi
cles
vio
latio
ns p
er p
edes
tria
n

Percentage of Pedestrian Violations
MorningAverage
EveningAverage
AFTERMorning
AFTEREvening
0%
2%
4%
6%
8%
10%
12%
14%
16%
Before After
Pede
stria
n Vi
olati
ons p
er T
otal
Ped
estr
ians
• Pedestrian violations (e.g. not crossing at the designated crosswalk) were statistically insignificant
• Before evening data was recorded as zero pedestrian violations.
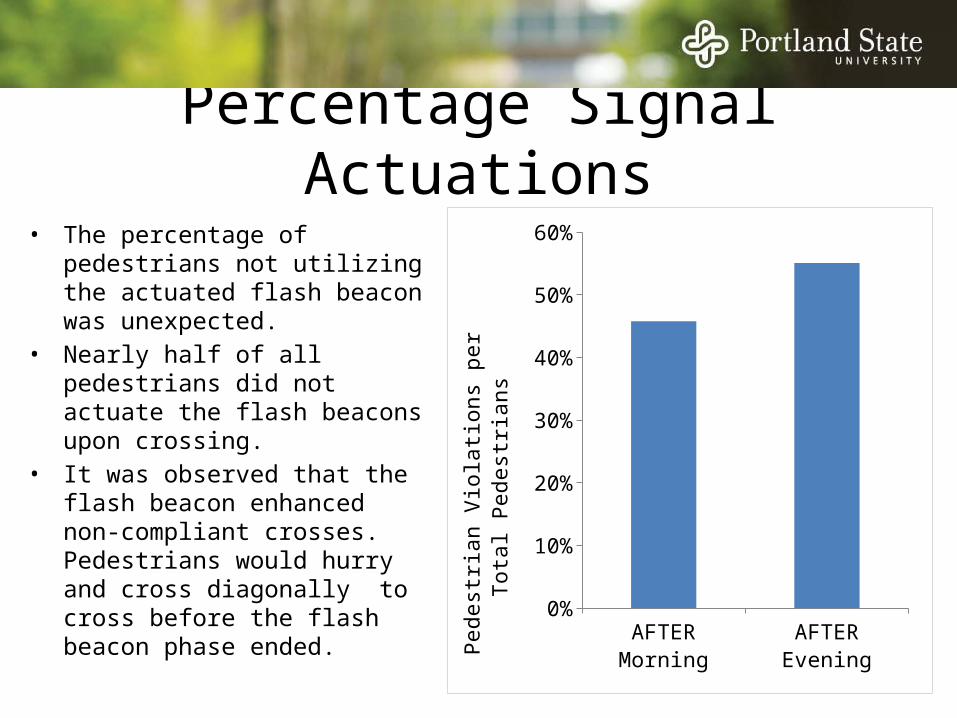
Percentage Signal Actuations
AFTERMorning
AFTEREvening
0%
10%
20%
30%
40%
50%
60%
Pede
stria
n Vi
olati
ons p
er
Tota
l Ped
estr
ians
• The percentage of pedestrians not utilizing the actuated flash beacon was unexpected.
• Nearly half of all pedestrians did not actuate the flash beacons upon crossing.
• It was observed that the flash beacon enhanced non-compliant crosses. Pedestrians would hurry and cross diagonally to cross before the flash beacon phase ended.

Recommendations• Increase beacon size
– Could increase vehicle compliance rates
• Medium-mount lighting on sidewalk– Vehicles can see pedestrians waiting to cross– Pedestrians waiting at bus stop feel more “safe”
• Bollards with low-mounted lighting– Bollards increase protection of pedestrians within refuge– Low-mounted lighting will assist pedestrians in navigating at night
• Reduce signal phase– For research data, the average crossing time is much lower than the
existing flashing phase.– Reducing the flashing length will result in increased traffic flows during
peak hours.

Lessons Learned• Just because infrastructure is installed does not mean that
pedestrians will utilize the infrastructure.– Pedestrians not utilizing flash beacon at high rates
• The beacon was not the primary reason for motorists to stop; it is the pedestrian in the roadway that prompts motorists to stop.
• More rigid review criteria for data analysis– E.g. how exactly will pedestrian delay be measured?

Questions?