
8 RiskManagementAcceptance
33
Risk Management and Risk Acceptance D. Diamantidis, University of Applied Sciences, Regensburg, Germany
-
Upload
arulazzikri -
Category
Documents
-
view
214 -
download
1
Transcript of 8 RiskManagementAcceptance

Risk Management and Risk Acceptance
D. Diamantidis, University of Applied Sciences, Regensburg, Germany

OUTLINE
1. Introduction2. Risk definition3. General risk acceptance criteria4. Developments in current standards5. Risk Management and Safety measures6. Conclusions

Risk definition
a) Individual Risk
b) Societal Risk
Risk = Likelihood x Consequences
R = p x C (expected losses per year)

4
Direct Consequences“ those first order consequences which occur
immediately after an event”
• Fatalities• Injuries• Repair and replacement of damaged or
destroyed public and private structures• Relocation costs/temporary housing• Loss of business inventory/agriculture• Loss of income/rental costs• Community response costs• Cleanup costs

5
Indirect Losses“ may emerge much later, and may be much less
easy to attribute directly to the event”• Loss of income• Input/output losses of businesses• Reductions in business /personal
spending – “ripple effects”• Loss of institutional knowledge• Mental illness• Bereavement

Factors affecting risk acceptance
» Voluntary vs. involuntary» Controllability vs. uncontrollability» Familiarity vs. unfamiliarity» Short/long-term consequences» Presence of existing alternatives» Type and nature of consequences» Derived benefits» Presentation in the media» Information availability» Personal involvement» Memory of consequences» Degree of trust in regulatory bodies.

General Risk Acceptance Criteria
• Human Safety (Societal Risk - ALARP)
• Calibration
• Optimization (including human life - LQI)

II General Risk Acceptance Criteria

II General Risk Acceptance Criteria

Domains of experienced fatalitiesDomains of experienced fatalitiesDomains of experienced fatalitiesDomains of experienced fatalities
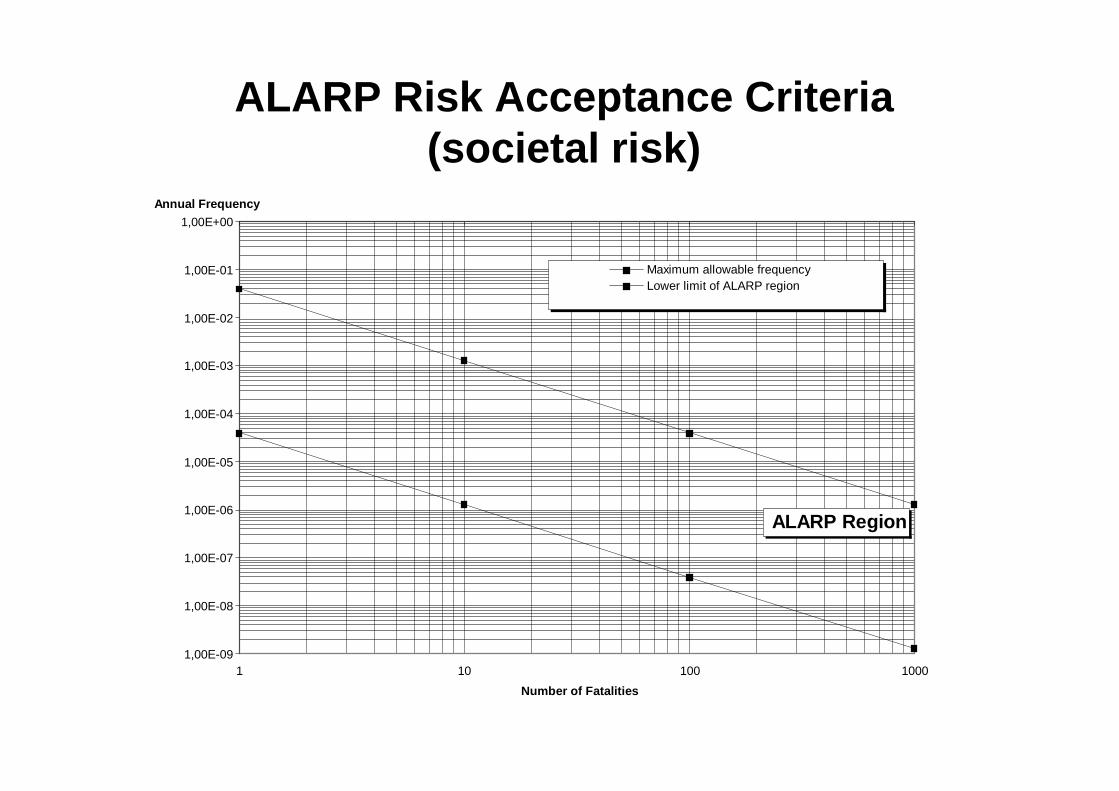
ALARP Risk Acceptance Criteria(societal risk)
1,00E-09
1,00E-08
1,00E-07
1,00E-06
1,00E-05
1,00E-04
1,00E-03
1,00E-02
1,00E-01
1,00E+00
1 10 100 1000
Number of Fatalities
Annual Frequency
Maximum allowable frequencyLower limit of ALARP region
ALARP Region

Hazard probability levels
Class Frequency Events / year
A frequent >10
B occasional 1-10
C remote 0.1-1
D improbable 0.01-0.1
E incredible 0.001-0.01

Hazard severity levels (Consequences)
Class SeverityCategory
Human losses
1 insignificant ---
2 marginal injuries
3 critical 1
4 severe 5
5 catastrophic 50

Risk Acceptability Matrixfor risk verification
AC: Acceptable NAC: Not AcceptableALARP: As Low As Reasonably Practicable
1 2 3 4 5
A ALARP NAC NAC NAC NAC
B ALARP ALARP NAC NAC NAC
C AC ALARP ALARP NAC NAC
D AC AC ALARP ALARP NAC
E AC AC AC ALARP ALARP

Example: dikes in Netherlands(Vrouwenvelder)
4.5 5 5.5 6 6.5 70
2
4
6
8
10x 10
8
H [m]
Economical optimal dike height
Optimum
Damage costs
Construction costs
Total costs

Relation between Failure Probability p f
and Reliability Index ββββ
p f 10-2 10-3 10-4 10-5 10-6 10-7 10-8 10-9
ββββ 2,33 3,09 3,72 4,27 4,75 5,20 5,61 6,00
Calibration through computation of ββββ values for various member types (piles, columns, beams etc. inherent i n the codes)

Cost evaluation including loss of human life
Life Quality Index (LQI)
LQI = gw e (1-w)
g: g: g: g: the gross domestic product per person per yearthe gross domestic product per person per yearthe gross domestic product per person per yearthe gross domestic product per person per yeare: the life expectancy at birthe: the life expectancy at birthe: the life expectancy at birthe: the life expectancy at birthw: w: w: w: the proportion of life spent in economic activity.the proportion of life spent in economic activity.the proportion of life spent in economic activity.the proportion of life spent in economic activity.

ICAF ICAF ICAF ICAF –––– ImpliedImpliedImpliedImplied costcostcostcost ofofofof avertingavertingavertingaverting a a a a fatalityfatalityfatalityfatality
ICAF = ge/4 (1-w)/(w)
ICAF = 2 – 5 Mio. $
� ∆∆∆∆gmax = g/2 (1-w)/(w)
g = gross domestic product
per year per person
e = life expectancy at birth
w =proportion of life spent in
economic activity

Optimization criterion
Costs:• Annualised investment costs• Annual maintenance/operation costs
Benefits:• Human risk reduction• Direct/Indirect financial loss reduction

Developments in current Standards
Limit State DesignPartial safety factor format (Eurocodes)LRFD format (ACI)Checks at member level
Performance Based DesignFEMA, ASCE, ATC, NZBCOverall check of the structure under extreme loads (earthquake, blast, fire)

Target Reliability (1 year ref. Period)new structures, ULS, component level
Minor Moderate Large
Large 3.1 3.3 3.7
Normal 3.7 4.2 4.4
Small 4.2 4.4 4.7
ConsequencesC
ost o
f saf
ety
Background Eurocodes, JCSS, 2001

Performance Based Design PBD
Loma Prieta earthquake, October 17, 1989Oakland, CaliforniaMagnitude: 6.9

Performance objectivesPerformance Level
NEHPR (ATC, 1996)
Performance LevelVision 2000
Short Description
Operational Fully FunctionalNo significant damage to
structural and non-structural components
Immediate Occupancy
Operational
No significant damage to structure; non-structural
components are secure and most could function if utilities
available
Life Safety Life SafetySignificant damage to
structural elements; non-structural elements are secured
but may not function
Collapse Prevention
Near CollapseSubstantial structural and non-structural damage; limit margin
against collapse

EQ Probability levels
EQ -Level Event Annual Exceedance Probability
Mean Return Period
I Frequent 4% 25
II Occasional 1.4% 72
III Rare 0.125% - 0.4% 250 - 800
IV Max Con-sidered
0.04% - 0.125% 800 - 2500

Performance Based Design
Hazard Levels Performance Levels
Hazard Levelfor EQ
Operatio-nal
OccupiableDamaged
Life Safe,Major Damage
Near Collapse
Frequent(50%/ 50yrs)
a b c d
Occasional(20%/50yrs)
e f g h
Rare(10%/50yrs)
i j k l
Max considered(2%/50yrs)
m n o p
Commonly selected performance objectives

PBD criteria
pE . pNP|E < pT
pE :propability of event
pNP|E:conditional probability of no
performance given event
pT :acceptable probability

PBD criteria (new structure)
pE . pNP|E < pT
pE : 2% in 50 years
pNP|E: 10%
pT : 4x10⁻⁵ per year

PBD criteria (old structure )
pE . pNP|E < pT
pE :4% in 50 years
pNP|E:25%
pT :2x10⁻⁴ per year (5 times larger)

P(C) = P(C|LE)P(L|E)P(E) < PA
P(E) : probability of occurrence of EP(L|E) : probability of local failure, L, given the occurrence of EP(C|LE): probability of collapse given the occurrence of L due to EPA : acceptable probability of global failure
RISK R:
R = P(C) x C < RA (acceptable Risk)
Probability of collapse
Consequences of collapse
Global failure extreme events (storm, flood)

Identifical and modellingof relevant accidental
hazards
Assessment of damage states to structure from
different hazards
Assessment of the performance of thedamaged structure
Assessment of the probability of occurence of different hazards
with different intensities
Assessment of the probability of different states of damage and corresponding consequences
for given hazards
Assessment of the probability of inadequate performance(s) of the damaged structure
together with the corresponding consequence(s)
Step 1 Step 2 Step 3
Identifical and modellingof relevant accidental
hazards
Assessment of damage states to structure from
different hazards
Assessment of the performance of thedamaged structure
Assessment of the probability of occurence of different hazards
with different intensities
Assessment of the probability of different states of damage and corresponding consequences
for given hazards
Assessment of the probability of inadequate performance(s) of the damaged structure
together with the corresponding consequence(s)
Step 1 Step 2 Step 3

Risk management and safety measures
a) Interpretation of new data
b) Definition of cost-based acceptance criteria
c) Implementation of safety measures
d) Periodic review

Evaluation of safety measures
• CIk investment costs (including design and construction costs)• CAk annual maintenance/operation costs• T desired lifetime of the measure • dRk risk reduction due to measure k divided into :
– dRHk reduction related to human risk– dRCk reduction related to economic risk (direct and indirect costs)
(CIk x δδδδ(T))/T + CAk < ICAF x dR Hk + dRCk

Conclusions
� Use of risk based methodologies� Implementation of risk acceptance criteria� Performance based approach� Protection/mitigation measures� Cost-benefit analyses� Periodic review


![[XLS] · Web view8 5573 8 5038.5 8 12250 8 8229.5499999999993 8 8662.33 7 5265.5 8 8103 8 8647.35 8 4093 7 5914 8 6425.5 8 10706.5 8 10000 8 10000 7 13325.27 8 6148 8 5453.5 8 7750](https://static.fdocuments.in/doc/165x107/5bd6d1de09d3f2e17c8bfdea/xls-web-view8-5573-8-50385-8-12250-8-82295499999999993-8-866233-7-52655.jpg)
![University of HawaiiTranslate this page of Hawaii System ... ÐÏ à¡± á> þÿ rŽ8 8 ‹8 8 8 8 8 8 8 8 8 8 8!8"8#8$8%8&8'8(8)8*8+8,8-8.8/808182838485868788898:8;88=8>8?8@8A8B8C8D8E8F8G8H8I8J8K8L8M8N8O8P8Q8R8S8T8U8V8W8X8Y8Z8[8\8]8^8_8](https://static.fdocuments.in/doc/165x107/5aabfa6d7f8b9a9c2e8c9b24/university-of-hawaiitranslate-this-of-hawaii-system-rz8-8-8-8-8-8-8-8-8.jpg)


![apdu.orgTranslate this pageapdu.org/wp-content/uploads/2011/12/2011-01-27_Research...ÐÏ à¡± á> þÿ r‘8 þÿÿÿ 8 8 8!8"8#8$8%8&8'8(8)8*8+8,8-8.8/808182838485868788898:8;88?8@8A8B8C8D8E8F8G8H8I8J8K8L8M8N8O8P8Q8R8S8T8U8V8W8X8Y8Z8[8\8]8^8_8`8a8b8c8d8e8f8g8h8i8j8k8l8m8n8o8p8q8r8s8t8u8v8w8x8y8z8{8|8](https://static.fdocuments.in/doc/165x107/5ae7f3457f8b9a87049010f1/apduorgtranslate-this-r8-8-8-8888888888888-888081828384858687888988888888a8b8c8d8e8f8g8h8i8j8k8l8m8n8o8p8q8r8s8t8u8v8w8x8y8z8888888a8b8c8d8e8f8g8h8i8j8k8l8m8n8o8p8q8r8s8t8u8v8w8x8y8z888.jpg)

