8. Ethnicity, reform and affirmative action in...
24
195 8. Ethnicity, reform and affirmative action in Malaysia This chapter examines some of the salient features of Malaysian affirmative action and some of the important challenges associated with it. As discussed earlier, Fiji and Malaysia enjoyed a special relationship over the years based on assumptions about shared ethnic problems and other historical links. Some aspects of British colonial policies in the two countries were similar, especially in relation to the co-option of traditional elites into the colonial governance structure, the importation of foreign labour and provision for protective cultural political mechanisms commonly referred to as “paramountcy of Fijian interest” and Malay “special privileges.” Affirmative action in Malaysia faced considerable dilemmas in relation to the authoritarian role of the state in determining resource redistribution, the interplay between state bureaucrats and business interests, the creation of an indigenous middle class through ethnic preferences and the issue of inequality within the Malay community itself. Nevertheless, despite their problems, Malaysian affirmative programs have been hailed as a model to be emulated by countries such as Fiji and South Africa. This chapter first discusses the relationship between ethnicity, socio-economic development and politics during the colonial period. It will then look at how economic disparity led to ethnic tension, culminating in the 1969 ethnic riots which accelerated the implementation of the New Economic Policy (NEP), the major development and affirmative action plan meant to address the issue of poverty and ethnic inequality. The chapter then examines attempts to eradicate poverty and how this transformed the rural sector. This is followed by a discussion of the growth of the Malay middle class as a result of the NEP. It also examines the processes of industrialization and privatization and their contribution in building up a Malay entrepreneurial class and the role of the state in actively encouraging and facilitating the process through preferential policies. As examples of Malay investment, the chapter discusses the operation of two of the biggest Malay trust companies, the Permodalan Berhad (PNB) and Amannah Sahm Nasioanale (ASN). The chapter then discusses some of the results of the affirmative action programs and implications on ethnic relations and national development.
-
Upload
nguyennhan -
Category
Documents
-
view
221 -
download
1
Transcript of 8. Ethnicity, reform and affirmative action in...

195
8. Ethnicity, reform and affirmative action in Malaysia
This chapter examines some of the salient features of Malaysian affirmative action and some of the important challenges associated with it. As discussed earlier, Fiji and Malaysia enjoyed a special relationship over the years based on assumptions about shared ethnic problems and other historical links. Some aspects of British colonial policies in the two countries were similar, especially in relation to the co-option of traditional elites into the colonial governance structure, the importation of foreign labour and provision for protective cultural political mechanisms commonly referred to as “paramountcy of Fijian interest” and Malay “special privileges.”
Affirmative action in Malaysia faced considerable dilemmas in relation to the authoritarian role of the state in determining resource redistribution, the interplay between state bureaucrats and business interests, the creation of an indigenous middle class through ethnic preferences and the issue of inequality within the Malay community itself. Nevertheless, despite their problems, Malaysian affirmative programs have been hailed as a model to be emulated by countries such as Fiji and South Africa.
This chapter first discusses the relationship between ethnicity, socio-economic development and politics during the colonial period. It will then look at how economic disparity led to ethnic tension, culminating in the 1969 ethnic riots which accelerated the implementation of the New Economic Policy (NEP), the major development and affirmative action plan meant to address the issue of poverty and ethnic inequality. The chapter then examines attempts to eradicate poverty and how this transformed the rural sector. This is followed by a discussion of the growth of the Malay middle class as a result of the NEP. It also examines the processes of industrialization and privatization and their contribution in building up a Malay entrepreneurial class and the role of the state in actively encouraging and facilitating the process through preferential policies. As examples of Malay investment, the chapter discusses the operation of two of the biggest Malay trust companies, the Permodalan Berhad (PNB) and Amannah Sahm Nasioanale (ASN). The chapter then discusses some of the results of the affirmative action programs and implications on ethnic relations and national development.
Politics of preferential development
196
Independence and Malay preferential policies
The ethnic division of labour in Malaysia had its origins in colonial capitalism. Tin mining was one of the major factors which attracted the British into the interior of Malaysia’s peninsula and Chinese miners began arriving in large numbers from China, lured by the new-found wealth. They formed loose mining confederations with local sultans in the states of Perak. Other Chinese made their fortune in retail trade.
Chinese immigration was followed by an influx of Indian immigrants, who mostly worked in government service and in rubber plantations. Some, like the Chinese, became merchants and retailers. Throughout the colonial period the Chinese and Indians dominated the mining, rubber plantation, manufacturing, service and retail trade sectors of the economy while the Malays were largely agricultural peasants and a few worked in government positions. Significantly, the relative class positions of various ethnic groups were tied to their occupational status (see Jomo 1986). This was a common tendency, where the colonial economy engendered the emergence of ‘racial-class’ groups which reflected identifiable parallels between economic division of labour and division by ethnicity. We have seen how this type of socio-economic differentiation also characterized the Fiji colonial economy, in which Indo-Fijians were largely engaged in sugar plantation work and indigenous Fijians remained locked into the communal semi-subsistence sector. The socio-economic disparity in Malaysia led to simmering ethnic tensions which needed to be addressed urgently upon independence.
To address potential conflict, the Malaysian independence constitution of 1957, like the 1970 Fiji independence constitution, was essentially a consociationalist compromise by political parties representing the major ethnic groups – the United Malays National Organization (UMNO), Malaysian Chinese Association (MCA) and Malaysian Indian Congress (MIC) for national consensus and unity under the umbrella Malaysian Alliance Party. Equally significant was the provision on the “Special Rights Programme” in Article 153 for preferential policies on economic development priority, obtaining business and professional licenses, civil service appointment and educational scholarships in respect of Malays (Lee 2005; Lee, Gomez & Yakob 2010).
By and large Malays interpreted the constitution as a mandate for their political ascendancy and this nationalistic interpretation became the ‘official’ version after it was adopted by the Bumiputera leadership of the UMNO. To cement this position, Malay traditional rulers who were co-opted into the British colonial system were made constitutional and religious heads of their respective states

8. Ethnicity, reform and affirmative action in Malaysia
197
(Lee 1990). Support amongst Chinese and Indians was canvassed through the MCA and MIC communal patrons by delivering economic and social development to the grassroots.
Meanwhile, class differentiation within the economy continued to widen and this had serious political consequences for the Alliance. For instance, between 1957 and 1970, intra-ethnic income disparity (in terms of Gini Coefficient ratio) grew by 36.2% for Malays and 21.6% for Chinese (Osman-Rani 1990: 8). This generated the feeling that the Alliance had failed to deliver on its promises and, as a result, the poorer classes of various communities withdrew support from the Alliance and support fell from 79.6% of the vote in 1955, to 51.5% in 1959, increasing to 58.5% in 1964 before plunging to 48.5% in 1969. Most of the poor Malays who deserted the UMNO supported the extremist nationalist Parti Islam Se Malaysia (PAS), which believed in total Malay supremacy and the declaration of Islam as the state religion. This shift in loyalty indicated the failure of the Alliance patronage system and the desire to “search for alternative and more effective communal patrons on the part of the racially clustered subordinate class fractions” (Brown 1994: 234). Fearing that PAS would hijack the Bumiputera agenda and break up its support base, UMNO began pursuing Bumiputera economic interests in earnest. With the threat from the PAS on one side and the non-Malay parties on the other, the UMNO had to achieve a delicate ethnic balancing act. The big test came during the 1959 election, when non-Malay parties, especially Chinese parties, made some gains on the basis of their opposition to Bumiputera special preferences. The UMNO lost some of its Chinese votes and had to rely largely on Bumiputera support (Hua 1983).
Nevertheless, the lack of substantive improvement in Malay socio-economic life increased the tempo of opposition the Alliance rule. The number of public enterprises increased from 22 in 1960 to 109 in 1970 and this was hardly satisfactory in a situation of dire inequality (Gomez and Jomo 1999). By 1970 only 2.4% of the total equity was owned by the Bumiputera while the non-Bumiputera Malaysians held 28.3% and foreigners 63.4%. From 1957 to 1970, the income share of the top 5% of households increased considerably. The average income for Chinese was 1.89 times higher in 1957 and increased to 2.47 in 1967, while Indian average income increased from 1.51 to 1.95 times higher in the same period (Anand 1981). The increasing disparity naturally heightened tension.

Politics of preferential development
198
The 1969 violence and the New Economic Policy
During the 1969 election the Alliance captured the majority of seats in Parliament but its majority shares of the vote actually declined from 58.4% in 1964 to 48.8%. A “victory march” by supporters of the opposition on 13 May triggered off a spate of violent attacks by Malays who felt threatened by the march. Four days of bloody violence led to the suspension of the constitution and the declaration of an emergency. The riots manifested the way in which longstanding socio-economic grievances were readily and spontaneously translated into ethnic violence when the circumstances were ripe.
One of the most significant lessons of the 1969 riots was the realization by the younger generation of UMNO leaders who assumed leadership after the demise of the old order that more aggressive socio-economic transformation was needed to avoid further crisis. This hastened the implementation of the New Economic Policy (NEP), which had been planned for some time. The NEP contained both a broad development framework for the nation and specific affirmative action provisions for the Bumiputera to address ethnic-based economic inequality.
First launched in association with the Second Malaysian Plan for 1971-75, the NEP consisted of two prongs: (a) the reduction and eventual eradication of poverty, by raising income levels and increasing employment opportunities for all Malaysians, irrespective of race and (b) the acceleration of the process of restructuring Malaysian society to correct economic imbalance, so as to reduce and eventually eliminate the identification of race with economic function (Malaysia 1973).
The NEP allocations for poverty eradication and restructuring society from 1971 to 1985 are shown in Table 8.1. The pattern shows that there was a gradual shift in emphasis from poverty eradication to restructuring. The ratio of allocation for restructuring compared to poverty eradication rose from 21.6% during 1971–75 to 37.3% during 1976–80. Under the Fourth Malaysian Plan, 1981–85, the ratio rose to 47.2%. During the Second Malaysian Plan, the poverty eradication allocation was 4.7 times that of allocation for restructuring but this ratio declined to 2.7 for the Third Malaysian Plan period (1976–80).

8. Ethnicity, reform and affirmative action in Malaysia
199
Table 8.1 Malaysian Development Plan allocation for poverty eradication and restructuring society, 1971-1985 (M$ million)
Second Plan(NEP),1970
Third Plan1976-80
Fourth Plan(Original) 1981-85
Expenditure 1981-3
Fourth Plan(Revised)
Poverty Eradication
2,350.0 6,373.4 9,319.2 6,699.1 10,497.0
Restructuring 508.3 2,376.0 4,397.6 5,406.8 6,576.8
Overlapping 3 .4 149.0 300.5 184.7 464 .5
Total 2,861 8,898.4 14,017.3 12,290.6 17,538.3
Source: Jomo 1986: 267.
The disparity between poverty eradication and redistribution showed a clear bias towards middle-class Malays, summed up by Jomo thus:
Since over half the Malay population were considered poor, theoretically, Malays would comprise the majority of the beneficiaries of poverty eradication measures such as race. On the other hand, the most well to-do, probably comprising no more than 3%, of the Bumiputera community, benefit directly and substantially from efforts to restructure society. Hence, shifting emphasis from poverty eradication to restructuring society would tend to increase inequality within the Malay community (Jomo 1986: 268).
The Politics of Poverty Eradication
Poverty was seen by the ruling UMNO elite as a potentially destabilising aspect in its attempt to unite the Malay community. Concern for poverty was in response to the 1969 riots which was seen as a consequence of the mass migration of rural poor into the urban areas; therefore the aim was to develop the rural areas to increase living standards and so to arrest this drift.
Rural development strategies did not include land reform because it would alienate landowners who were still influential within the UMNO. Thus there was emphasis only on infrastructural development, subsidising resettlement projects and provision of agricultural resources, such as irrigation schemes as a means of increasing productivity (Emsley 1996).
The main NEP targets of poverty alleviation in the rural areas were rubber, palm oil and rice cultivation. About 95% of the rice farmers were Malays. In 1970, the incidence of poverty in the rice sector was reported at 88.1% and at just below 91.8% for the mixed agricultural sector. In 1990, of the 10,500,000 acres

Politics of preferential development
200
of land under cultivation, 1,148,000 acres were for paddy and 7,907,000 for rubber and palm oil. However, because most of the rural farmers were Malays, it was important for political reasons to target them in the NEP poverty alleviation strategies (Ishida and Azizan 1998). As shown in Table 8.2, the incidence of poverty in 1970 for all ethnic groups was 49.3% of households. The target for 1990 was 16.7%, while the achieved figure was 15.0%. The highest incidence of poverty in 1970 was amongst Bumiputera with 65.0%, compared to 26.0% for Chinese and 39.0% for Indians. Within twenty years of the NEP, the incidence of poverty was dramatically reduced to 20.8% for Bumiputera, 5.7% for Chinese and 8.0% for Indians.
Table 8.2 Poverty eradication targets and achievements, 1976 and 1990 (% of households)
Target Achieved1970 1976 1990 1990
Peninsular Malaysia
Poverty incidence 49.3 16.7 15.0
By location
Rural 58.7 23.0 19.3
Urban 21 .3 9.1 7.3
By ethnicity
Bumiputera 65.0 20.8
Chinese 26.0 5.7
Indian 39.0 8.0
Others 44.8 18.0
Malaysia
Poverty incidence 42 .4 17.1
By location
Rural 50.9 21.8
Urban 18.7 7.5
By ethnicity
Bumiputera 56 .4 23.8
Chinese 19.2 5 .5
Indian 28.5 8.0
Others 44 .6 12.9
Source: Rasiah 1998: 127.
However, the success of the poverty eradication scheme is misleading for two reasons. First, part of the increase in production figures was achieved through heavy government subsidy. For instance, in 1984 about 69% of the estimated net annual income from rice cultivation was from subsidy. Second, the decline

8. Ethnicity, reform and affirmative action in Malaysia
201
in aggregate poverty levels amongst rice farmers camouflaged the widening gap between rich and poor farmers. There was decline in poverty but at the same time there was increased relative poverty.
The NEP ensured direct intervention of the state in rural development. Consequently, the interaction between the state actors and rural peasants increased, creating conditions for potential antagonism when circumstances dictated:
The state was once largely a bystander or mediator...It is now a direct participant, decision maker, allocator and antagonist in nearly all vital aspects of paddy growing. Most of the buffers between the state and rice farmers have fallen away, thereby vastly increasing both the role of politics and the possibilities for direct confrontation between the ruling party and its peasantry (Scott 1985: 53).
For instance, dissatisfied poor farmers withdrew support from the UMNO and supported PAS. Class frustrations were mobilised along ethnic-religious and cultural lines. Peasant resistance through religious mobilisation (especially the PAS fundamentalist variant) became a political irritant to UMNO hegemony in the rural areas.
Consolidating the Bumiputera middle class
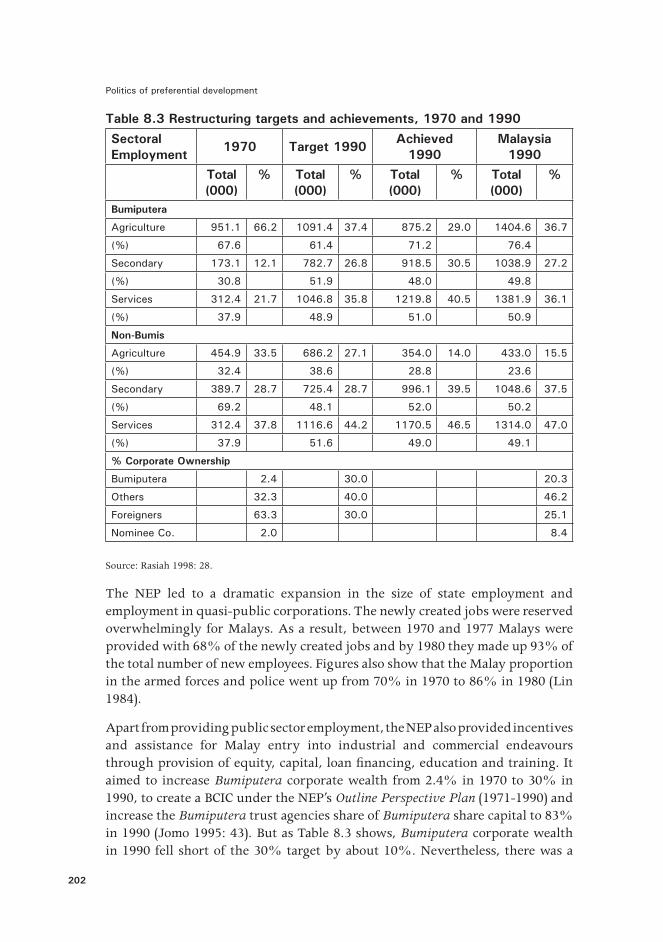
The second prong of the NEP was in effect an attempt to build up a Malay middle class through restructuring employment, ownership of share capital in the corporate sector and the creation of a Bumiputera Commercial and Industrial Community (BCIC). The focus of redistribution of share capital was most pronounced in the primary and service sectors, while export-oriented manufacturing was largely spared (Rasiah 1998). As Table 8.3 shows, in 1970 Bumiputera employment in the agricultural, secondary and service sectors was 66.2%, 12.1% and 21.7% respectively. The NEP aimed at decreasing reliance on the agricultural sector for Bumiputera by reducing it to 37.4% in 1990 and increasing employment in the secondary and services sectors by 26.8% and 35.8% respectively. In 1990 employment in the agricultural sector had decreased to 29.0% and secondary and service sectors had increased to 30.5% and 40.5% respectively.
Politics of preferential development
202
Table 8.3 Restructuring targets and achievements, 1970 and 1990Sectoral Employment 1970 Target 1990 Achieved
1990Malaysia
1990Total(000)
% Total(000)
% Total(000)
% Total(000)
%
Bumiputera
Agriculture 951.1 66 .2 1091.4 37.4 875.2 29.0 1404.6 36.7
(%) 67.6 61 .4 71.2 76.4
Secondary 173.1 12 .1 782.7 26.8 918.5 30.5 1038.9 27.2
(%) 30.8 51.9 48.0 49.8
Services 312 .4 21.7 1046.8 35.8 1219.8 40.5 1381.9 36 .1
(%) 37.9 48.9 51.0 50.9
Non-Bumis
Agriculture 454.9 33 .5 686.2 27.1 354.0 14.0 433.0 15 .5
(%) 32 .4 38.6 28.8 23 .6
Secondary 389.7 28.7 725.4 28.7 996.1 39.5 1048.6 37.5
(%) 69.2 48.1 52.0 50.2
Services 312 .4 37.8 1116 .6 44 .2 1170.5 46 .5 1314.0 47.0
(%) 37.9 51 .6 49.0 49.1
% Corporate Ownership
Bumiputera 2 .4 30.0 20.3
Others 32 .3 40.0 46 .2
Foreigners 63 .3 30.0 25 .1
Nominee Co . 2.0 8.4
Source: Rasiah 1998: 28.
The NEP led to a dramatic expansion in the size of state employment and employment in quasi-public corporations. The newly created jobs were reserved overwhelmingly for Malays. As a result, between 1970 and 1977 Malays were provided with 68% of the newly created jobs and by 1980 they made up 93% of the total number of new employees. Figures also show that the Malay proportion in the armed forces and police went up from 70% in 1970 to 86% in 1980 (Lin 1984).
Apart from providing public sector employment, the NEP also provided incentives and assistance for Malay entry into industrial and commercial endeavours through provision of equity, capital, loan financing, education and training. It aimed to increase Bumiputera corporate wealth from 2.4% in 1970 to 30% in 1990, to create a BCIC under the NEP’s Outline Perspective Plan (1971-1990) and increase the Bumiputera trust agencies share of Bumiputera share capital to 83% in 1990 (Jomo 1995: 43). But as Table 8.3 shows, Bumiputera corporate wealth in 1990 fell short of the 30% target by about 10%. Nevertheless, there was a

8. Ethnicity, reform and affirmative action in Malaysia
203
growth of state trusts, sheltering the interests of Bumiputera, in the mining and service sectors, while the number of public agencies swelled from 109 in 1970 to 656 in 1980 (Jomo 1994a: 8). Amongst these were the well-known and leading trust agencies, Perbadanan Nasional (PERNAS) and Permodalan Nasional Berhad (PNB). Public institutions such as the Majlis Amanah Rakyat (MARA) also extended their role in economic participation by providing generous loans and other assistance to Malays. The Fijian Holdings model was based on the Malay trust concept, and both the Nine Points Plan and the Ten Year Plan drew inspiration from the NEP’s provision for increased indigenous control of the corporate sector.
To facilitate rapid entry of Malays into the civil service and commerce, privileged access to education and scholarships was readily provided. Quotas were introduced in 1971 to counter Chinese dominance in higher education. As a result, the proportion of Malays enrolled for local degree courses increased from 35.6% to 66.7% between 1969 and 1980; and by 1995 Malay students took up about 64% of all university places (Emsley 1996: 40). Preferential entry into university became problematic because Chinese and Indian students had to work extra hard to obtain university places. The use of Bahasa Malaysia as the official language of instruction entrenched cultural and communal dominance of Malay students and marginalized non-Malay students, who were required to use the language. Malay students who benefited from the educational quota system and who had a “perception of inferiority” as a result of preferences also resorted to radical Islam to provide moral support and political direction while rejecting new ideas and competition from non-Muslims (Muzaffar 1989: 15).
Industrialization and Malay embourgeoisment
While the quantitative targets of the NEP were set out clearly (as shown in Tables 8.2 and 8.3), there was also an emphasis on achieving qualitative targets in the form of creating a Bumiputera business class “so that the NEP’s equity participation could be backed by managerial control” (Rasiah 1998: 128). This could be achieved only through a concerted drive towards industrialisation in order to speed up the consolidation of the middle class. At the same time, industrialisation was important for UMNO’s mass support by the working class through the creation of employment. Thus growth became a political imperative to gain the loyalty of UMNO’s diverse political support base (Jesudason 1996).
Industrialization was really the major economic engine for affirmative action. In the late 1960s import substitution industrialisation (ISI) gave way to labour intensive export-oriented industrialisation (EOI), accompanied by new labour policies, tax concessions and other incentives to facilitate EOI. This policy shift

Politics of preferential development
204
coincided with the introduction of the NEP. Increasingly, the NEP involved greater state intervention by way of public sector expansion and regulation of manufacturing sector investments. The export-oriented industrialisation came to be dominated by Free Trade Zones (FTZ) under the Free Trade Zones Act of 1971. The FTZs, especially the processing of primary products (rubber, tin, palm oil and timber and manufacture of electrical and electronic components), grew at a rapid rate and led to expansion of employment opportunities and rapid rural-urban migration.
In the 1980s, in an attempt to refocus industrialisation, Mahathir, the new Prime Minister, promoted heavy industries to balance the industrialisation process through private investment incentives. The heavy industries were spearheaded by companies relocated from East Asian economies such as Japan, South Korea and Taiwan – South Korea in particular was seen as a model economy by Malaysia. This “Big Push” industrialisation was to involve state corporations acting on behalf of the Bumiputera (Jomo 1994b).
However, the international recession of 1985 adversely affected Malaysia’s export earnings from palm oil, rubber, tin and electronics, leading to negative growth for the first time since independence. A year later the situation worsened with the collapse of the oil price and Malaysia’s option was to restructure along the lines of the Washington Consensus. This meant that the heavily state-subsidised and state-controlled NEP had to be quietly “suspended” in favour of accelerating liberalisation measures under the Guidelines for Privatisation, which spelt out the rationale and broad framework of Malaysia’s privatisation plans (Jomo 1994a). These were: first, to reduce the financial and administrative burden on the government of maintaining services and infrastructure; second, to promote competition and efficiency; third, to stimulate private entrepreneurship; fourth, to reduce the dominance of the public sector; and fifth, to help achieve the objectives of the NEP, given that Bumiputera entrepreneurship had progressed well and Bumiputera were ready to take up opportunities in the privatised services. Moreover, the political consequences of this low growth were significant, to say the least. Low growth intensified ethnic tension and factionalism within UMNO (Means 1991: 193-219). There was bitter rivalry for power between Mahathir and fellow cabinet member, Tengku Razaleigh, during the 1987 UMNO leadership elections. The economic recession made it difficult for the top leaders to unify disparate groups.
The privatisation program was closely controlled by the state and was channelled towards politically favoured corporations, thus impacting on ownership and employment patterns, income distribution and the control of vital economic sectors (Jones 1991). As a result there was rapid growth in the manufacturing sector, with eight-fold growth in employment in this sector by 1989. Employment

8. Ethnicity, reform and affirmative action in Malaysia
205
in manufacturing in this period accounted for more than 17% of the labour force. This employment trend was noticeable amongst Malays, whose share of the labour force grew from 20% in 1957 to 29% in 1970 and to 54% in 1980.
The NEP was succeeded in 1991 by the New Development Policy (NDP), which put more emphasis on human resource development as a means of achieving the 30% Bumiputera ownership target, set down by the NEP (Jomo 1993). While keeping the Bumiputera agenda intact, the NDP formed the basis of Mahathir’s ambitious “Vision 2020”, referring to the date when Malaysia would achieve developed country status. Fundamental to “Vision 2020” industrialisation would be the leading function of the private sector, which was the aim of the accelerated privatisation since 1991 (Chowdhry 1997).
Thus, despite the economic crisis of the early to mid-1980s, affirmative action in Malaysia took place in large measure under conditions of a rapidly growing economy. The NEP coincided with the OPEC oil price rise in the critical years of the new plan, enabling a state-led redistribution from incremental (oil-based) revenues throughout the 1970s rather than a reallocation of existing tight resources. This was in contrast to Fiji’s post-1987 affirmative action programs, which tried to create an indigenous capitalist class in a very inhibiting environment of low growth. Industrialisation in Fiji was never associated with affirmative action in any way. The shift from ISI to EOI in the 1970s was part of the general economic policy for growth rather than an attempt to restructure society in a way that favoured indigenous Fijians.
A critical aspect of the process of Bumiputera embourgeoisment was state supervision and control of the process of industrialization and privatization to ensure selective targeting. Mahathir himself suggested “The best way to keep the shares in the Bumiputera hands is to hand them over to the Bumiputera most capable of retaining them, which means the well-to-do” (FEER 13 April 1979). The state was directly involved in Bumiputera capitalism through State-Owned Corporations (SOEs) or “state capitalism” (which operated directly on behalf of Bumiputera interest), trust corporations and direct preferential deals with Bumiputera businesses (Gomez 1994).
The SOEs came to symbolise two fundamental but related aspects of the Malaysian state: first, because SOEs were to secure Bumiputera economic interest, they also came to represent an aspect of the state’s ethnocratic designs; and second, through state ownership, SOEs confirmed the state’s commitment to direct capital accumulation. The assumption was that through direct state accumulation the communal interest of the Bumiputera would be protected. Encouraged by this and in the absence of proper regulation, there was a dramatic increase in the number of SOEs, with an increase of about 100 per year by the mid-1970s. This resulted in the creation of companies with de facto management
Politics of preferential development
206
acting independently of any shareholder control. Importantly, however, it showed the government’s “ignorance of the extent of its assets and liabilities” (Adams and Cavendish 1995: 17).
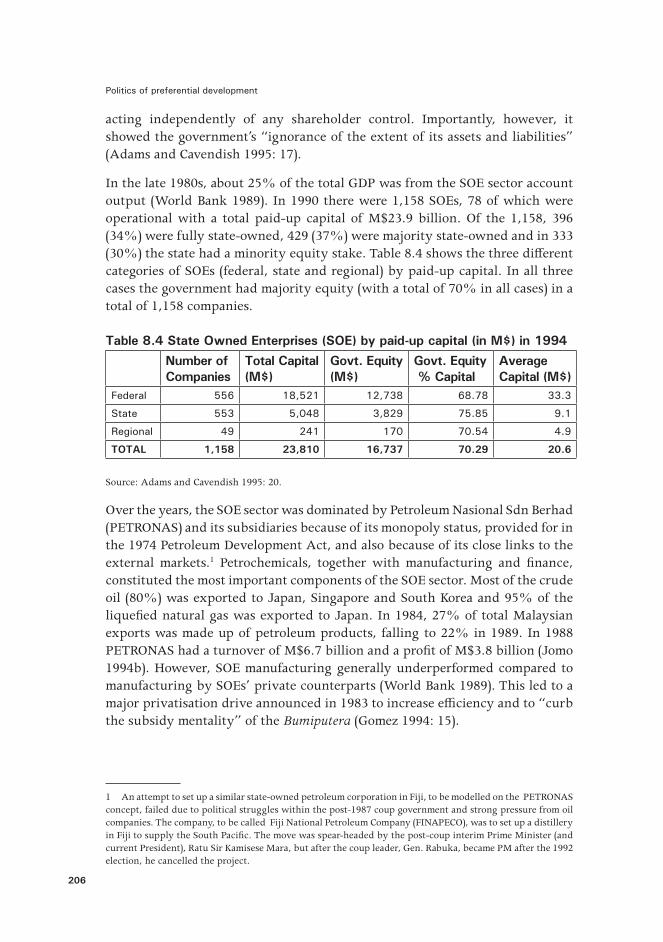
In the late 1980s, about 25% of the total GDP was from the SOE sector account output (World Bank 1989). In 1990 there were 1,158 SOEs, 78 of which were operational with a total paid-up capital of M$23.9 billion. Of the 1,158, 396 (34%) were fully state-owned, 429 (37%) were majority state-owned and in 333 (30%) the state had a minority equity stake. Table 8.4 shows the three different categories of SOEs (federal, state and regional) by paid-up capital. In all three cases the government had majority equity (with a total of 70% in all cases) in a total of 1,158 companies.
Table 8.4 State Owned Enterprises (SOE) by paid-up capital (in M$) in 1994Number of Companies
Total Capital(M$)
Govt. Equity(M$)
Govt. Equity % Capital
AverageCapital (M$)
Federal 556 18,521 12,738 68.78 33 .3
State 553 5,048 3,829 75.85 9.1
Regional 49 241 170 70.54 4.9
TOTAL 1,158 23,810 16,737 70.29 20.6
Source: Adams and Cavendish 1995: 20.
Over the years, the SOE sector was dominated by Petroleum Nasional Sdn Berhad (PETRONAS) and its subsidiaries because of its monopoly status, provided for in the 1974 Petroleum Development Act, and also because of its close links to the external markets.1 Petrochemicals, together with manufacturing and finance, constituted the most important components of the SOE sector. Most of the crude oil (80%) was exported to Japan, Singapore and South Korea and 95% of the liquefied natural gas was exported to Japan. In 1984, 27% of total Malaysian exports was made up of petroleum products, falling to 22% in 1989. In 1988 PETRONAS had a turnover of M$6.7 billion and a profit of M$3.8 billion (Jomo 1994b). However, SOE manufacturing generally underperformed compared to manufacturing by SOEs’ private counterparts (World Bank 1989). This led to a major privatisation drive announced in 1983 to increase efficiency and to “curb the subsidy mentality” of the Bumiputera (Gomez 1994: 15).
1 An attempt to set up a similar state-owned petroleum corporation in Fiji, to be modelled on the PETRONAS concept, failed due to political struggles within the post-1987 coup government and strong pressure from oil companies. The company, to be called Fiji National Petroleum Company (FINAPECO), was to set up a distillery in Fiji to supply the South Pacific. The move was spear-headed by the post-coup interim Prime Minister (and current President), Ratu Sir Kamisese Mara, but after the coup leader, Gen. Rabuka, became PM after the 1992 election, he cancelled the project.
8. Ethnicity, reform and affirmative action in Malaysia
207
Privatization and Bumiputera preferences
By the time privatisation started, a substantial portion of the corporate stock had already been secured by a small UMNO elite (either through “personal achievement” or proxies) who have been able to exploit their political influence to weave a web of cronyism and patronage within the corporate community. It was really after 1984 that privatisation gathered momentum. By the end of 1990 37 government projects had been privatised, 27 of which had been public enterprises. Another 93 projects were privatised during 1991 and 1992, including about 40 government-owned enterprises which were transferred to Bumiputera trust agencies such as the Permodalan Nasional Berhad (PNB) and Amanah Saham Nasional (ASN). About 120 SOEs were sold to the private sector (Gomez 1994).
Privatisation ended the state’s monopoly in areas like broadcasting, shipping, airlines, telecommunications and power generation. The listing of shares of these privatised companies on the Kuala Lumpur Stock Exchange (KLSE) expanded Malaysia’s capital market considerably, making it the fourth largest in Asia. Since the NDP was implemented, a number of major privatisations took place. By May 1994, the government had privatised 103 entities and over 15 previously government-owned companies. This included the national energy company, Tenaga Nasional, Heavy Industries Corporation of Malaysia (HICOM) and Telecom. Each was listed on the KLSE. A total of 78 projects were identified for privatisation under the Rolling Action Privatisation Plan 1994/95, followed by 77 projects in 1995. Privatisation under the 1994 program included the development of seaports in Penang, Johor and Kelang, commissioning of independent power producers and development of a new television station. The 1995 privatisation projects included aspects of the new Kuala Lumpur International Airport, the ports of Kuantan and Kemaman, the National Savings Bank and the housing loan division of the Ministry of Finance (Chowdhry 1997). Operations of financial institutions and equities under the privatization rubric were strictly controlled by the state to ensure conformity to the NEP requirements of 30% Bumiputera ownership by 1990. The bumiputerasation of the economy was a huge undertaking, given that in 1971 the Bumiputera owned only 4% of quoted equity. To achieve this, quotas were imposed on most types of government procurement. This ranged from 1% for sophisticated defence equipment to 100% for road haulage services for the Federal government. It was usual for Bumiputera tenders to be 10% in excess of those from non-Bumiputera. Quotas also determined the issuing of licences for a large number of services such as taxis (Emsley 1996).
The equity acquisition process was formalised in the form of the Industrial Co-ordination Act (ICA), which targeted a 30:40:30 (30% Bumiputera, 40%

Politics of preferential development
208
non-Bumiputera and 30% foreign) ownership formula by 1990. All companies involved in manufacturing were required to have a licence, the provision of which required that submitted plans must include 30% Bumiputera shares by 1990. Mechanisms were in place to ensure that the promise of the 30% equity was achieved. It was assumed that an annual growth of 9% was required to achieve the ICA goals. In fact Malaysia’s growth rate was 11.4% annually between 1970 and 1990 (Jomo 1994a).
There were exemptions from the ICA regulations. For instance, equity of less than M$0.10 million was excluded, but this was increased to M$0.25 million in 1977. There was also a limit on the value of fixed assets, set at M$0.5 million in 1977 but raised to M$1 million in 1985 and M$2.5 million in 1986. ICA was also strict on import-substitution foreign investment, while export-oriented establishments were allowed very high numbers of foreign equity shares. These restrictions were relaxed in the late 1980s. The ICA rules encouraged the growth of “Ali Baba” companies, where Chinese businesses were being fronted by Bumiputera (Lee, Gomez and Yakob 2010).
Because the privatization process was done in line with the NEP pro-Bumiputera objectives, political consideration was an important factor in determining equity. This led to allegations of extensive political nepotism and corruption. In the absence of a formal tender system, political leaders and politically aligned businessmen took advantage of the opportunity to secure stock (Gomez 2009). The privatisation process often meant the prearranged transfer of a state monopoly to private monopoly. The complex web of political patronage and cronyism formed part of the process whereby corporate interest was co-opted into the state system of patronage.
Despite privatisation, government still controlled a substantial share of various aspects of the economy. In 1994 more than 1,100 SOEs made up vital utilities such as transport, communications, water supply, energy, and finance; and SOEs were heavily involved in non-traditional sectors such as services, construction and manufacturing (Adams and Cavendish 1995: 15). By 1992 about 42% of Malaysian Airline System (MAS), 29% of Malaysian International Shipping Corporation (MISC), 75% of Syarikat Telecom (STM) and 77% of Tenaga Nasional (all of which are monopolies) were still under government control (Gomez 1994). But even state-controlled shares were still perceived as Bumiputera shares held in state trust.
Apart from the issuing of equity by large financial institutions, the government also provided subsidies for business premises, training, provision of credit and quotas in the issuing of licences and government procurement. In 1985 for instance, 63% of the works contracts by the three largest public sector bodies (Public Works Department, FELDA and telecommunications), worth M$887 million, and 42% of the supplies contracts, worth M$751 million, were

8. Ethnicity, reform and affirmative action in Malaysia
209
awarded to Bumiputera.2 As a result of state preferential policies such as these, there was a significant increase in the number of Bumiputera professional and other salaried workers. Between 1973 and 1987, the Bumiputera share of the employers’ category relative to other ethnic categories increased from 14.2% in 1973 to 32.7 in 1987. For instance within the “commercial” sector there was an increase in the Malay share from 8.6% in 1973 to 36.8% in 1987, while there was an increase in the “finance” sector from 0.0% in 1973 to 27.5% in 1987 (Malaysian Government 1973; 1987).
These figures do not tell the full story. In fact the shortcomings of heavily protected ventures were common – complacency, inability to take risks and lack of business innovation. The Malaysian Central Bank (Bank Negara) required the banking fraternity to reserve 20% of its loan portfolio to Bumiputera entrepreneurs, but this target was “overachieved” by 12.7%. The MARA, formed to help Bumiputera entrepreneurship, subsidised interest rates on its loans, but despite this only 6,000 of the 55,000 loans granted have been repaid. We have seen that a high arrears rate was also a feature of the Fiji Development Bank’s Commercial Loans to Fijian Scheme (CLFS). But, again, the differences were in terms of sheer scale. The banking system in Malaysia lent itself to massive wastage and corruption (Emsley 1996) but, despite the failures, one cannot deny the extent to which state patronage has strengthened the position of the Malay middle class. The middle class manifested “syncretic” characteristics through what Brown referred to as a “balancing act”, to provide a favourable climate that best served their interests:
The picture that emerges is of the state bureaucrats attempting a “balancing act”; employing the state machinery so as to promote their own interests and their emergence as the dominant class, but also willing to compromise their own interests in order to promote international capital, and to mediate between the other dominant and sub-ordinate classes. It is not suggested here that such a “balancing act” is unproblematic. Indeed it is the dynamics inherent in the politics of this venture, which provide the major explanatory focus for the analysis of political change (Brown 1994: 211).
The dynamic interplay between economic aspirations and political power bred widespread corruption. The prevalence of corruption and financial scandals involving senior politicians in the 1980s led to widespread dissatisfaction and the government had to face a broad front of dissenters, including opposition MPs, party dissidents, state land scheme settlers and a broad spectrum of government critics consisting of environmentalists, union leaders and Islamic fundamentalists.
2 These figures do not include joint ventures with non-Bumputera and foreigners or government procurement.

Politics of preferential development
210
The government’s reaction was, firstly, to deploy the Internal Security Act (ISA) in 1987, which was invoked to detain without trial about 130 people from a diverse range of dissident groups. Secondly, the government co-opted a number of important groups in a strategic approach towards national reconciliation. Most important of all was the attempt by the Prime Minister to move towards a “more consultative style” of government. This involved the setting up of the National Consultative Council in 1988, with 150 members from various interest groups, to formulate national economic policy after 1990, the year the NEP was scheduled to stop. These moves were necessary to appease non-Bumiputera demands for ending Bumiputera privilege and also because of pressure from the business sector for reduced government intervention in the economy.
The growth of the wealth of the Bumiputera elite was facilitated by the dominant UMNO political power and the attempt to keep excessive Chinese and foreign corporate interests in check. Between 1970 and 1990 there was a ten-fold increase in the proportion of share capital in the corporate sector held by Bumiputera. This represented an increase of 2.4% in 1970 to 20.3% in 1990, 10% or so short of the 30% target of the NEP. The details are shown in Table 8.5. Of the 20.3% of shares held by Bumiputera, which totalled $M22.3 billion, 14% were held by individuals and the rest by trust agencies. At the same time, the number of shares held by Chinese also showed a remarkable increase, from 27.2% in 1970 to 44.9% in 1990. The number of shares held by Indians showed a slight decrease, from 1.1% in 1970 to 1.0% of the total in 1990. The biggest decrease was for foreign investors: the number of shares held by foreigners plunged from 63.4% of the total in 1970 to 25.1% in 1990. However, one of the significant points of comparison with Fiji here is with regard to the difference in shares between individuals and trust agencies. Table 8.5 shows that the number of shares held by individual Bumiputera was much higher than of the number held by trust agencies (14.0% in 1990 for individuals, compared to 6.3% for trust agencies), signifying an emphasis on individual equity, as opposed to an emphasis on communal equity in the case of Fiji.
Table 8.5 Ownership of share capital, 1970-90 (in percentages)Ownership Category 1970 1990Bumiputera individuals 1 .6 14.0
Bumiputera trust agencies 0.8 6 .3
Chinese 27.2 44.9
Indians 1 .1 1.0
Other non-Bumiputera Malay residents - 0.3
Foreign residents 63 .4 25 .1
Nominee companies 6.0 8.4
Source: Gomez 1994: 23.

8. Ethnicity, reform and affirmative action in Malaysia
211
Nevertheless, the figures for shares held by Bumiputera may be misleading, because many Bumiputera politicians were involved in “nominee companies” and foreign-domiciled companies. It has also been shown that expatriate Chinese Malaysians invested from abroad (see Jomo 1991). The Bumiputera figures could also be exaggerated because over the years a number of Bumiputera businesses were subcontracted to non-Bumiputera and foreign companies in what has been referred to earlier as an Ali Baba arrangement. This involved Bumiputera business licence holders fronting corporations run by Chinese. While it is true that Bumiputera investment has dramatically expanded, part of this has been due to the “Ali Baba” phenomenon:
Statistics in the various industries seem to indicate considerable success in Malay participation; but the reality is less comforting. It is revealed time and time again, in almost every Malay economic conference, that most Malays resell their licenses or corporate control to non-Malays for a lucrative fee and allow their names to be used as fronts for non-Malays who run the enterprise and pay a tribute to the Malays. This problem of sleeping partnership, termed Ali Baba...is as intractable as it is ubiquitous...(Lin 1984: 259).
But this still does not detract from the fact that there has been a dramatic growth in the Bumiputera middle class, despite the fact that Chinese still predominated in the economy. Even contracting and sub-contracting licenses between Bumiputera and non-Bumiputera businessmen constituted a “business” deal in itself, however politically undesirable it might be. Within the cosy and paternalistic climate of UMNO hegemony, the Bumiputera who had been granted licences or who had corporate ownership found it easier to sublease or relinquish corporate control in return for a lucrative fee rather than having to operate the business themselves.
Chinese business, with a much longer history of development, had mostly been built up over years of “self-made” accumulation, while Bumiputera business had mostly been achieved through heavy state subsidy and political patronage. It has been argued that a significant part of the new Bumiputera and non-Bumiputera business class were not real entrepreneurs but rentier capitalists, contracting and sub-contracting business licences to each other. Bumiputera and Chinese business did not exist exclusive of each other, but intersected through UMNO political links. Many of these involved mergers, take-overs, management buyouts and share swapping, leading to conglomerisation through concentration of stock ownership and monopolies. The conglomerisation of the economy, facilitated by the centralised power of UMNO, has been a dominant trend of the NEP.
Politics of preferential development
212
Apart from its mediating role as a business broker, UMNO itself (like the MCA and MIC) has been directly involved in “party capitalism” by virtue of its easy access to funds through its undisputed political power, described thus:
…a range of practices whereby the beneficiaries of State economic sponsorship and protection are channelled to individuals, groups and private companies associated with ruling political parties, in particular UMNO...the rise of Money Politics has resulted in the blurring of State and UMNO business interests and the increasing dominance of UMNO and UMNO associated enterprises in the economy (Kahn 1992: 2).
Party capitalism had grown into a complex web of political and economic interests which constituted a powerful force in Malaysian political economy. This provided benefit for Malay business at all levels through special access to contracts; and also benefit for the UMNO itself through a steady flow of funds into party coffers (Kahn 1996: 61).
The NEP no doubt led to a rapid pace of political and economic transformation and accelerated growth, but these changes were basically horizontal in nature because instead of bridging the ‘vertical’ poverty gap it created a much more differentiated middle class and expanded and centralised state power in an increasingly authoritarian way. Thus policies that were meant to advance the political and economic dominance of an ethnic group ended up creating a strong fraction of middle class rentier profiteers.
An area of Bumiputera business which deserves special attention and which we examine next is Bumiputera trusts, because this area has been emulated as a framework for “communal investment” in Fiji, as we saw earlier. For instance, the Chief Executive of Fijian Holdings visited Malaysia through a Malaysia-Fiji bilateral agreement to study the operation of the PNB and ASN (which now enjoys a dominant position in Bumiputera finance) to learn relevant lessons for Fijian Holdings.
The Permodalan Berhad (PNB) and Amannah Sahm Nasioanale (ASN)
As early as the 1960s share reservations for the Bumiputera were introduced and implemented informally, but with little success. In 1964 for instance, of the M$15 million allocated to Bumiputera investors, only M$3.8 million was taken up, and of this the National Investment Company accounted for M$3.2 million (Jesudason 1990). To boost Bumiputera investment, the government-sponsored Yayasan Pelaburan Bumiputera (YPB) set up the PNB in March 1978. YPB was a

8. Ethnicity, reform and affirmative action in Malaysia
213
trust set up in January 1978 to facilitate investment trusts for the Bumiputera. PNB acted as a trust corporation to buy equities and hold them in trust until they were resold at a later stage to the Bumiputera (Adams and Cavendish 1995: 27). As the executive arm of the YPB, PBN was responsible for the evaluation, selection and purchasing of shares in public and private sector companies and distributed shares to individual Bumiputera through the ASN. PNB established the ASN in May 1979 as a subsidiary company to be responsible for administering and marketing a unit trust scheme for equity participation amongst Bumiputera.
Equity that was initially allocated for the Bumiputera was purchased by the Ministry of Trade and Industry and in 1978 the PNB was created to purchase shares on behalf of the Bumiputera. Under the Third Malaysia Plan (1976–80) the PNB received a budget of M$500 million, increasing to M$2,923 million under the Fourth Malaysian Plan (1981–85). The drive for Bumiputera equity was given impetus in 1981 when the Prime Minister, Hussein Onn, launched a two-stage “Scheme Transfer of Shares” to Bumiputera individuals through the PNB. The first stage saw the transfer of SOE shares to PNB at par value. By October 1986 shares for 37 companies with a par value of M$1,300 had been transferred to PNB and this increased to 93 companies in 1990. The next stage of the equity transfer involved transfer of the shares to ASN, which then issued par value units against the ASN share portfolio generally (Jomo 1994a).
PNB investments have been mostly of a secondary nature (redistribution mainly), rather than creating new assets. By March 1984 PNB had investments in 139 companies and 91 of these were listed on the KLSE. PNB held majority shares in 17 and 20% to 50% in another 17 companies, some of which were amongst Malaysia’s largest companies. PNB’s sector portfolio consisted of 51% plantations, 28% finance and 18% industrial. However, in 1981 a total of 660 million shares worth M$1.5 billion were transferred to ASN (552 million) and to subsidiaries of another Bumiputera trust company, Perbadan Nasional Berhad (PERNAS) (108 million) for sale to employees. As Table 8.6 shows, since 1981,PNB/ASN had a high rate of return compared to other investment institutions. From 1981 to 1987, due to heavy state subsidy, the nominal rate of return almost doubled those of other major investment institutions. It was really this diverse and high return investment which Fijian Holdings based its investment strategy on. The idea was to invest in blue chip companies which would generate a high return.

Politics of preferential development
214
Table 8.6 Nominal rates of return by institution, 1981-1987 (%)1981 1982 1983 1984 1985 1986 1987
PNB/ASN 20.0 18.0 18.1 17.2 17.2 10.1 10.1
Employees Provident Fund 8.0 8.0 8.5 8.5 8.5 8.5 8.5
Commercial Bank Deposits 7.0 6 .5 6.0 7.5 6.0 6.0 4.0
20 year Government Securities - - - 8.6 8.6 8.6 7.6
Kuala Lumpur Stock Exchange Equity 13.9 -18.9 40.8 -19.3 -17.3 12.8 0.5
Kuala Lumpur Stock Exchange Equity (ex-dividend)
-4.6 -4.6 -3.0 -5.1 -5.5 -4.7 -4.7
Source: Adams and Cavendish 1995: 39.
ASN’s role as an equity distribution mechanism through wide marketing of units provided high and guaranteed returns for investors. From 1980–89 the dividend averaged 9.8%, with a bonus of 6.3%, which meant that the total return was 16.1%. This was about 10% higher than that offered by commercial banks. Credit was usually made readily available by banks for purchase of the units. In 1990 the total holding was M$6.8 million, with an average of M$2,752 per unit holder (Emsley 1996).
While the PNB-ASN operation opened new windows of opportunity for many Bumiputera, the distribution of holdings has been largely unequal and in many instances reinforced the existing class structure within the Bumiputera community. Wealthy Bumiputera investors (who held as much as 25,000 to 50,000 units) constituted only 0.6% of all unit holders, but held as much as approximately M$381 million worth of equity, or one third of the total equity.3 The government’s decision to raise the investment ceiling to M$100,000 and to grant tax exemption for dividend income of up to M$5,000 was to the advantage of the rich. PNB-ASN shares were distributed on the basis of political patronage and cronyism and mostly benefited those who had close UMNO connections (Emsley 1996). A similar pattern of share distribution was seen in the case of Fijian Holdings, where those with close ties with the banking fraternity and state bureaucracy had the first chance to acquire the limited number of private shares. This also determined the extent of inequality of shares between unitholders. The major difference between PNB-ASN and Fijian Holdings was that the latter involved communal shareholders in the form of provinces, districts and village councils, compared to the former, which was based on individual and state unitholding.
The PNB-ASN was directly subsidised by the government at a zero-interest term without any apparent repayment obligation. In 1983 the value of PNB investment was M$3,650 million, making a profit of M$145 million. The ASN
3 One unit was worth M$1. Units could be purchased for as small a number as ten. The gini-coefficient put the distribution figure as high as 0.8.

8. Ethnicity, reform and affirmative action in Malaysia
215
profits were M$84 million out of an investment of M$1,000 million. The return for both investments was only 4.8%. Similarly the Fiji Government heavily subsidised Fijian Holdings operations through the FJ$20 million zero-interest loan for the “B Class” shares.
While the role of these Bumiputera financial institutions has been fundamental to the economy, there have also been growing concerns about their state-patronaged privileged positions. Their mode of operation created distortions and anomalies in the capital market, especially in relation to diversion of Bumiputera savings away from competitive investment through cross-subsidisation from other public resources. Through political patronage, PNB had been able to secure all new equity issues, which gave it a dominant role as a shareholder (Gomez 1994).
While large amounts of capital have been transferred to Bumiputera commerce, the 30% equity ownership target was still not met by 1990. Individual holdings grew substantially as a result of the ASN activities. There was a slowdown in equity growth after 1985, despite the tremendous growth in the early 1980s. Under the Fifth Malaysian Plan (1986–1990) the budget of the PNB was reduced and there was relaxation of the equity purchasing rules for foreigners and Chinese companies (Jesudason 1990). This considerably decreased the proportional value of equity for the Bumiputera.
Furthermore, a lot of the so-called Bumiputera equity was held by nominee companies, whose ethnic origins could not be identified. Nominee companies controlled 11.55% of the manufacturing sector’s capital stock in 1974–75, and this rose to 20.4% by 1983. Some of these were proxy companies which were used to hide the extent of the corporate wealth of politicians and political parties. Nominee companies were the majority shareholders in the 15 UMNO-linked companies.
While the NEP, through the PNB-ASN secured Bumiputera equity, “the equity shift has been both highly skewed to the benefit of the richer Bumiputera and has offered only very indirect control over the corporate sector...it has acted in large part as an income transfer to the wealthy...” (Emsley 1996: 62). So in a way, the PNB-ASN system provided a false sense of ownership for the Bumiputera. I had made the same observation as Emsley, with regards to Fijian Holdings, which under the guise of indigenous business has in fact helped to consolidate the wealth of a few indigenous Fijians through state subsidy. The subsidy also extended to foreign and local non-indigenous corporations in which Fijian Holdings invested. But shares for ordinary indigenous Fijians were held by communal institutions such as the FAB, NLTB, provinces, districts and villages in a way that inhibited individual entrepreneurship.

Politics of preferential development
216
Some results of affirmative action
Affirmative action in the corporate sector helped build up a Malay middle class as envisaged. As shown in Table 8.7, the share capital ownership for Bumiputera increased steadily over the years from 1.5% in 1969 when the NEP was launched to 21.9% in 2008. However, Chinese shareholding has been consistent and between 1969 and 2008 still predominated. Indian shareholding, without the benefit of affirmative action, remained below 2% within the same period.
Table 8.7 Share capital ownership (at par value) by ethnic group, 1970-2008 (%)
1969 1970 1975 1980 1985 1990 1995 1999 2004 2006 2008Bumiputera individuals & trust agencies
1 .5 2 .4 9.2 12 .5 19.1 19.2 20.6 19.1 18.9 19.4 21.9
Chinese 22.8 27.2 n.a n.a 33 .4 45 .5 40.9 37.9 39.0 42 .4 34.9
Indians 0.9 1 .1 n.a n.a 1 .2 1.0 1 .5 1 .5 1 .2 1 .1 1 .6
Other – – – – – – – 0.9 0.4 0.4 0.1
Nominee companies
2 .1 6.0 n.a n.a 1 .3 8.5 8.3 7.9 8.0 6 .6 3 .5
Locally controlled firms
10.1 – – – 7.2 0.3 1.0 – – – –
Foreigners 62 .1 63 .4 53 .3 42.9 26.0 25 .4 27.7 32.7 32 .5 30.1 37.9
n.a. = not available.
Notes: Par value denotes the price at which the share was first issued; Government ownership is omitted.
Source: Gomez 2009.
The Asian financial crisis in 1997 to 1998 greatly undermined the performance of many state-sponsored Malay entrepreneurs and conglomerates and the response was to re-nationalize them. Many large government-linked companies (GLC) re-emerged and continued to form the backbone of the Bumiputera corporate sector (Lee et al. 2010). Even after the exit of Mahathir in 2003, the new government still maintained a commitment to supporting the GLCs while nurturing the growth of small and medium-sized enterprises (SMEs) through loans and other facilities. Part of the support was to link SMEs to large trans-national corporations (TNCs) as a way of accessing local and foreign markets. Both the 2007 and 2008 national budgets encouraged companies to award contracts to Bumiputera vendors to encourage diversity and to develop human resources. Despite this, the role of the SMEs remained stagnant and did not show signs of the economic dynamism once envisaged (Lee et al. 2010).
One of the shortcomings of affirmative action in the corporate sector was the failure to reduce the involvement of the state in Bumiputera business. In 2009

8. Ethnicity, reform and affirmative action in Malaysia
217
not a single Bumiputera company was listed in the top 10 firms, although five of these were GLCs, three were Chinese-owned and one Indian-owned. Likewise, no Bumiputera company was in the top 20 firms in the industrial sector. One of the concerns is that, left to their own devices, Bumiputera would find it difficult to compete in the liberalized market. This has the potential to cause dissatisfaction and has potential political ramifications.
In the area of professional development, the Bumiputera have gained enormously compared to other ethnic groups. Table 8.8 shows that the proportion of Bumiputera in the various professional categories rose from 4.9% in 1970 to 38.8% in 2005. This contrasts with the decline in the proportion of Chinese and Indians in the same professional categories.
Table 8.8 Registered professionalsa by race (% of total)Bumiputera Chinese Indian Others
1970b 4.9 61.0 23 .3 10.8
1975c 6.7 64 .1 22 .1 7.1
1980 14.9 63 .5 17.4 4 .2
1985 22 .2 61 .2 13.9 2.7
1990 29.0 55.9 13 .2 1.9
1995 33 .1 52 .4 12.9 1 .6
2000 35 .5 51 .2 12.0 1 .3
2005 38.8 48.7 10.6 1.9
a. Architects, accountants, dentists, doctors, engineers, lawyers, surveyors, veterinarians.
b. Excludes surveyors and lawyers.
c. Excludes surveyors.
Sources: Gomez 2009; Lee, et al. 2010.
By and large, affirmative action has helped to advance the economic and social situation of many Bumiputera and many goals of the NEP had been achieved. For instance, poverty amongst Bumiputera had been substantially reduced from 65% in 1970 to 3.6% in 2007 and there was growth in equity ownership from 2.4% in 1969 to 19.4% in 2006. One of the impacts of the 2009 crisis was to loosen affirmative action policies and allow for greater diversity of government subsidy of corporations and the labour market.
Conclusion
Malaysia’s attempt to address ethnic and socio-economic inequality has by some accounts been a success. It is no wonder that countries like Fiji and South
Politics of preferential development
218
Africa saw it as a model to emulate. However, not all Malays benefitted: intra-communal inequality increased and selected individuals became beneficiaries through state patronage.
Malaysia had some advantages in comparison with Fiji. It had a vibrant economy, driven by industrialization and abundant natural resources and an export-oriented economy. Fiji’s economy did not have the same capacity and vibrancy. Malaysia’s NEP was also much broader in scope and incorporated a framework for national development including poverty alleviation and affirmative action. In comparison, affirmative action programs in Fiji were largely communally driven and were separate from the national development strategy.
The growth and consolidation of the Malay middle class was a major affirmative action project but the process of achieving this was complex and fraught with patronage and corruption. The role of the middle class was significant because it was the powerhouse of national development and investment as well as having a role as a symbol of progress, achievement and status for the Malay people.
Affirmative action in Malaysia was a major social engineering undertaking which involved restructuring the economy and transforming the civil service and class structure with the hope of achieving peace and stability after the 1969 riots, which still remains as the most significant political watershed in the Malay political consciousness. The strategy for social and political harmony involved experimentation with multi-party and multi-ethnic coalitions, but with Bumiputera political hegemony as well as affirmative action. As in Fiji, the politically and demographically dominant indigenous group also became the target group for affirmative action.
One of the original intentions of affirmative action was the gradual withdrawal of state support as a precondition for greater self-reliance. This has been difficult to achieve as Bumiputera business had to compete on a level playing field with large and seasoned global corporate players. Thus it seems that state preferences for Malays may last some time yet.