8 Digital Color Reproduction - Stanford University
36
281 CHAPTER CONTENTS Digital Color Reproduction BrianA.Wandell 1 and Louis D.Silverstein 2 1 Department of Psychology Stanford University, Stanford CA. 94305-2130, USA 2 VCD Sciences, Inc. 9695 E.Yucca Street, Scottsdale, AZ 85260-6201, USA 8 8.1 Introduction 282 8.2 Imaging as a communications channel 282 8.2.1 Trichromacy 283 8.2.2 Spatial resolution and color 283 8.3 Image capture 285 8.3.1 Overview 285 8.3.1.1 Visible and hidden portions of the signal 286 8.3.2 Scanners for reflective media 287 8.3.3 Digital cameras 288 8.3.4 Calibration and characterization 289 8.3.4.1 Dynamic range and quantization 290 8.3.4.2 Wavelength 291 8.3.4.3 Characterization of noncolorimetric sensors 292 8.3.5 Color rendering of acquired images 293 8.4 Electronic image displays 294 8.4.1 Overview 294 8.4.2 CRT devices 294 8.4.3 LCD devices 295 8.4.3.1 Other LCD display technologies 298 8.4.4 Display characterization 299 8.4.4.1 Frame buffers 300 8.4.4.2 Primary spectra and transduction 300 8.4.4.3 Tristimulus and chromaticity values 302 8.5 Printing 304 8.5.1 Overview 304 8.5.2 Inks and subtractive color calculations 304 8.5.2.1 Density 305 8.5.3 Continuous tone printing 306 8.5.4 Halftoning 307 8.5.4.1 Traditional halftoning 307 8.5.5 Digital halftoning 308 8.5.5.1 Cluster dot dither 310 8.5.5.2 Bayer dither and void and cluster dither 310 8.5.5.3 Error diffusion 311 8.5.5.4 Color digital halftoning 312 8.5.6 Print characterization 313 8.5.6.1 Transduction: the tone reproduction curve 313 8.6 Key words 314 8.7 Conclusions 314 8.8 Acknowledgments 314 8.9 References 314 The Science of Color Copyright © 2003 Elsevier Ltd ISBN 0–444–512–519 All rights of reproduction in any form reserved
Transcript of 8 Digital Color Reproduction - Stanford University

281
CHAPTER CONTENTS
Digital ColorReproduction
BrianA.Wandell1 and Louis D.Silverstein2
1 Department of PsychologyStanford University, Stanford CA.94305-2130,USA2 VCD Sciences, Inc.9695 E.Yucca Street, Scottsdale, AZ 85260-6201, USA
8
8.1 Introduction 282
8.2 Imaging as a communications channel 282
8.2.1 Trichromacy 2838.2.2 Spatial resolution and color 283
8.3 Image capture 2858.3.1 Overview 285
8.3.1.1 Visible and hidden portions of thesignal 286
8.3.2 Scanners for reflective media 2878.3.3 Digital cameras 2888.3.4 Calibration and characterization 289
8.3.4.1 Dynamic range and quantization 2908.3.4.2 Wavelength 2918.3.4.3 Characterization of noncolorimetric
sensors 2928.3.5 Color rendering of acquired images 293
8.4 Electronic image displays 2948.4.1 Overview 2948.4.2 CRT devices 2948.4.3 LCD devices 295
8.4.3.1 Other LCD display technologies 2988.4.4 Display characterization 299
8.4.4.1 Frame buffers 3008.4.4.2 Primary spectra and transduction 3008.4.4.3 Tristimulus and chromaticity values 302
8.5 Printing 3048.5.1 Overview 3048.5.2 Inks and subtractive color calculations 304
8.5.2.1 Density 3058.5.3 Continuous tone printing 3068.5.4 Halftoning 307
8.5.4.1 Traditional halftoning 3078.5.5 Digital halftoning 308
8.5.5.1 Cluster dot dither 3108.5.5.2 Bayer dither and void and cluster
dither 3108.5.5.3 Error diffusion 3118.5.5.4 Color digital halftoning 312
8.5.6 Print characterization 3138.5.6.1 Transduction: the tone reproduction
curve 3138.6 Key words 314
8.7 Conclusions 314
8.8 Acknowledgments 314
8.9 References 314
The Science of Color Copyright © 2003 Elsevier LtdISBN 0–444–512–519 All rights of reproduction in any form reserved
8.1 INTRODUCTION
In this chapter we describe how principles ofhuman vision are used to design image captureand display devices. The chapter is divided intofour sections. First, we provide an overview oftwo properties of human vision that are essentialin designing color imaging technologies. Thenext three sections describe the application ofthese and related principles along with the specifictechnologies. The second section reviews digitalcameras and scanners. The third section reviewsdisplays with a particular emphasis on cathoderay tube (CRT) and liquid crystal display (LCD)technologies. The fourth section describesaspects of color printing.
A number of topics in color technologies arenot covered in this chapter. We do not includeimplementation details or discussions of anyspecific technology. This is a fascinating andrapidly developing area, but the advances are sorapid that our discussion would be out of dateby the time an archival chapter is published orread. Also, we do not discuss image processingmethods, such as compression standards orgraphics rendering techniques, even though thecolor vision principles described here are funda-mental to these methods. We have excluded thistopic because this chapter is a compromisebetween breadth of coverage and existence.
Our focus is on the fundamental principles ofcolor imaging technology that must be addressedin the design of capture and display technology.Quantitative methods useful for certain specificdevices are described, and we expect that thesemethods will be useful for future generations ofdisplay and capture technologies as well. It is inthis sense that we hope this chapter will serve asa practical reference for the general principles ofcolor imaging technologies.
8.2 IMAGING AS ACOMMUNICATIONSCHANNEL
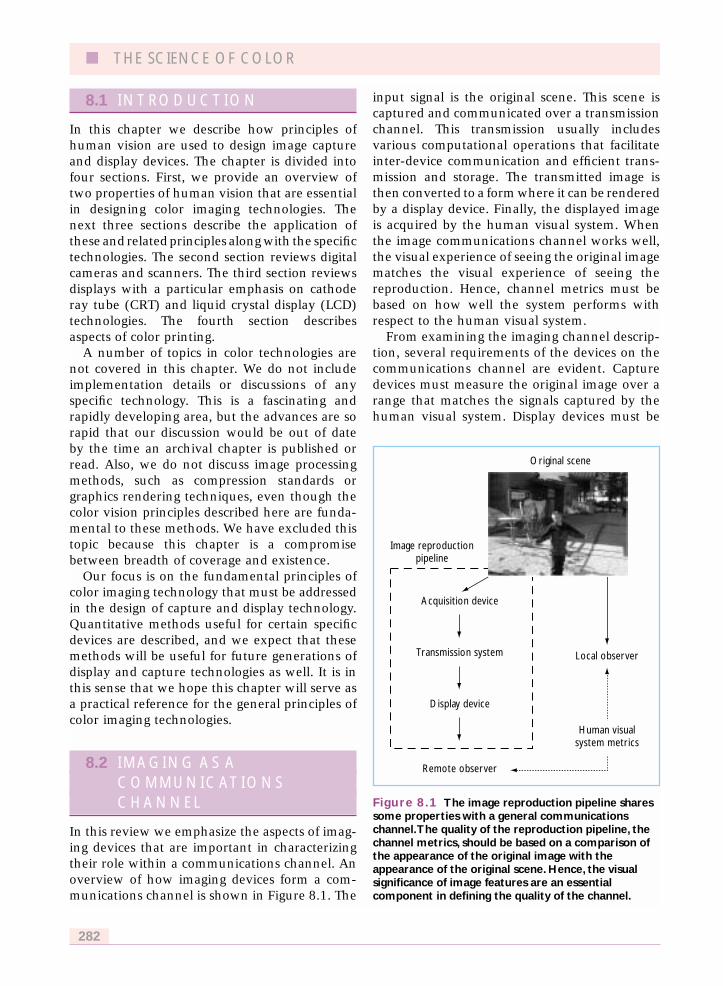
In this review we emphasize the aspects of imag-ing devices that are important in characterizingtheir role within a communications channel. Anoverview of how imaging devices form a com-munications channel is shown in Figure 8.1. The
input signal is the original scene. This scene iscaptured and communicated over a transmissionchannel. This transmission usually includesvarious computational operations that facilitateinter-device communication and efficient trans-mission and storage. The transmitted image isthen converted to a form where it can be renderedby a display device. Finally, the displayed imageis acquired by the human visual system. Whenthe image communications channel works well,the visual experience of seeing the original imagematches the visual experience of seeing thereproduction. Hence, channel metrics must bebased on how well the system performs withrespect to the human visual system.
From examining the imaging channel descrip-tion, several requirements of the devices on thecommunications channel are evident. Capturedevices must measure the original image over arange that matches the signals captured by thehuman visual system. Display devices must be
■ THE SCIENCE OF COLOR
282
Figure 8.1 The image reproduction pipeline sharessome properties with a general communicationschannel.The quality of the reproduction pipeline, thechannel metrics, should be based on a comparison ofthe appearance of the original image with theappearance of the original scene. Hence, the visualsignificance of image features are an essentialcomponent in defining the quality of the channel.
Original scene
Image reproductionpipeline
Remote observer
Display device
Transmission system
Acquisition device
Local observer
Human visualsystem metrics

able to deliver accurately controlled signals tothe human visual system. Measures evaluatingthe quality of the communications channel mustinclude comparisons of the visual appearance, apsychological quantity, associated with theoriginal scene and the image delivered by thereproduction.
Two properties of human vision are central inthe design of color imaging technologies. Thefirst is trichromacy, a principle that has alreadybeen introduced in this book from the point ofview of the behaviorist (see Chapter 3) and fromthe point of view of the physiologist (see Chapter6). Here, we will introduce the principle fromthe point of view of the technologist. The secondis the spatial resolution of the eye, and in partic-ular spatial resolution limits for various typesof colored stimuli. We briefly touch on each ofthese topics in the introduction. In the course ofthe chapter, we will return to explain how bothaspects of human vision are important in thedesign of various technologies.
8.2.1 TRICHROMACY
The color-matching experiment coupled withthe physiological and anatomical measurementsof the three cone types (trichromacy) forms abeautiful story that relates brain and behavior.From the technologist’s point of view, abstract-ing the story into mathematical terms, the color-matching experiment can be summarized by avery brief mathematical expression using simplelinear algebra. Suppose the spectral power distri-bution of a light is E(�). Trichomacy tells usthat the visual system makes a linear, three-dimensional measurement of this function. Thethree measurements can be expressed as theinner product of the cone photopigment absorp-tion functions with the input spectral power dis-tribution. For the L, M, and S cones the valuesare �L(�), E(�)�, �M(�), E(�)� and �S(�),E(�)�. It is efficient to use matrix notation toexpress these three inner products. Create amatrix, A, whose columns are the three coneabsorption functions. The photopigments meas-ure the three values At E. The photopigments donot change their absorption rates to any inputsignal in the null space of the matrix At.
Seen from the technologist’s viewpoint, themajor goal of the image communications
channel can be expressed by a color-reproductionequation. At a point in the original scene, the eyeencodes three values, At E. When the ambientviewing conditions at the time of capture are thesame as the ambient viewing conditions at thetime of redisplay, the color-reproduction equa-tion defines how to obtain a perfect color match:the transmission system must capture the origi-nal image and display a new image, with spectralcomposition, E’(�), such that At E � At E’. Thissimple equation is fundamental to the engineer-ing of all color devices. Color engineers mustanalyze how design decisions influence theability to satisfy the match in this equation.
Imaging systems never make a perfect matchin terms with respect to the color-reproductionequation. Consequently, color metrics (e.g.,CIELAB) are an essential tool for analyzing howwell the imaging pipeline succeeds. A fewmoments of thought suggest that certain types oferrors are far worse than others. For example, ifthe original, At E, differs from the reproduction,At E’, only by a common scale factor across theentire image, the two scenes will look quitesimilar. In that case, the scenes will look ratherlike one another because it is as if we are look-ing at the original through dark glasses. If theoriginal and reproduction differ by an additiveoffset, however, the color appearance in manycolor regions will be changed and the reproduc-tion will not be satisfactory.
The color-reproduction equation is onlyaccurate when the original and reproduction areviewed in the same general viewing conditions,including size and ambient lighting. If the repro-duction covers a very large portion of the visualfield, the reproduction context may not beimportant. On the other hand, if the reproduc-tion covers only a small part of the visual fieldthe context must be taken into account when con-sidering the color-reproduction errors. Attemptsto generalize the color-reproduction equationwhen the viewing conditions at time of imagecapture and redisplay differ are an importantopen problem in color engineering.
8.2.2 SPATIAL RESOLUTION ANDCOLOR
The spatial and temporal resolutions of humanvision are also of great importance in the design
DIGITAL COLOR REPRODUCTION ■
283
of capture and reproduction devices. One reasonfor their importance is that there will be noimprovement in image quality if the reproduc-tion exceeds the spatial or temporal resolution ofhuman vision. Hence, manufacturing cost issensitive to these limits. There is a second subtlerbut equally important reason. The ability to con-trol the acquisition and reproduction of spectralinformation is quite limited. Often, capture anddisplay devices trade spatial and temporal infor-mation for color information. For example, colorprints are often made by printing dots of coloredinks adjacent to one another on the page (half-toning). When the dots are finely spaced, theyblur together and are not individually resolved.Color is adjusted by varying the relative areacovered by dots, effectively trading spatial resolu-tion for color control. The spatial and temporalresolution limits of the human eye, and howthese depend on color, are a key factor in design-ing this and other color imaging technologies.
The main properties of human spatial andtemporal resolution are described in severalreference sources (e.g., De Valois and De Valois,1988; Wandell, 1995). An important feature ofhuman vision is the poor spatial resolution for
certain types of colors. The largest effect arises inthe short-wavelength region of the spectrum. Inthis region, chromatic aberration of the humancornea and lens limits spatial resolution to 6cycles per degree (cpd) (see Chapter 2; Wandell,1995: ch. 2). But, there are other effects, too.Perceptual experiments show that certain pat-terns seen by the L and M cones can be difficultto detect as well. For example, if the sum of theL and M cone absorptions is constant across theimage (L � M � constant), so that the pattern isdefined only by a change in the difference (L � M)of the absorptions, spatial resolution is reducedto below 20 cpd (Mullen, 1985; Anderson et al.,1991; Sekiguchi et al., 1993a, 1993b). An inten-sity variation, however, in which the value ofL � M varies, can be seen at spatial frequenciesof 50 cpd or more.
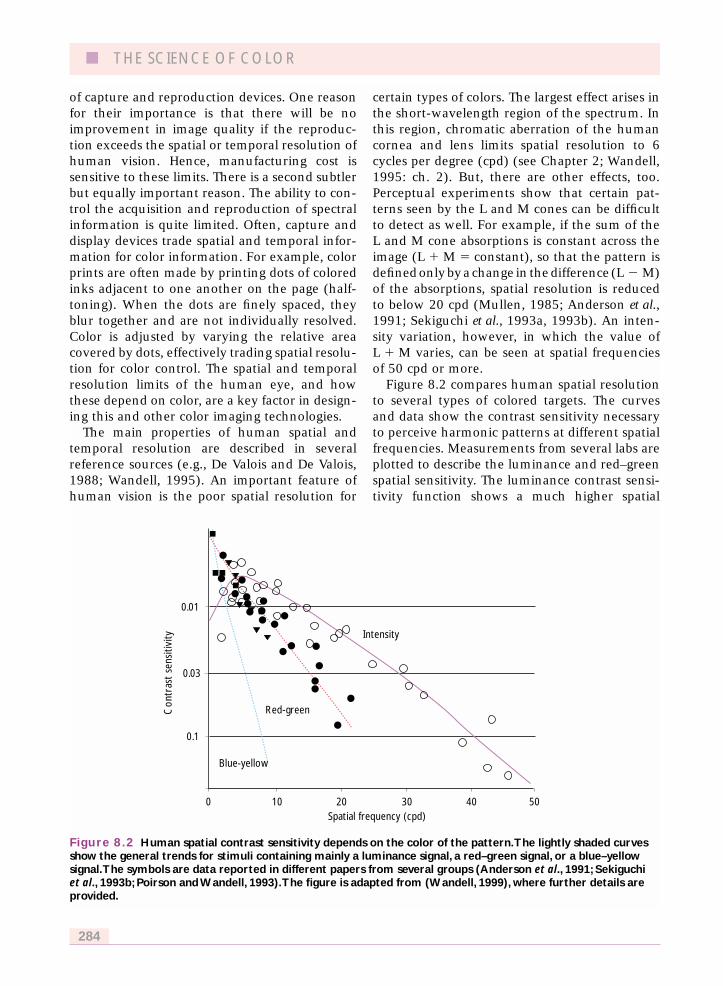
Figure 8.2 compares human spatial resolutionto several types of colored targets. The curvesand data show the contrast sensitivity necessaryto perceive harmonic patterns at different spatialfrequencies. Measurements from several labs areplotted to describe the luminance and red–greenspatial sensitivity. The luminance contrast sensi-tivity function shows a much higher spatial
■ THE SCIENCE OF COLOR
284
Figure 8.2 Human spatial contrast sensitivity depends on the color of the pattern.The lightly shaded curvesshow the general trends for stimuli containing mainly a luminance signal, a red–green signal, or a blue–yellowsignal.The symbols are data reported in different papers from several groups (Anderson et al., 1991; Sekiguchiet al., 1993b; Poirson and Wandell, 1993).The figure is adapted from (Wandell, 1999), where further details areprovided.
Con
tras
t se
nsiti
vity
Spatial frequency (cpd)
0.01
0.03
0.1
100 20 30 5040
Intensity
Blue-yellow
Red-green
frequency limit and also a pronounced low-frequency decline. The spatial resolution tored–green stimuli falls off at higher spatialfrequencies and has no low frequency fall off.The lowest resolution, limited to less than 8cycles per degree, is for the blue–yellow stimuli.These values show that image capture, imagecoding, and image display devices require morespatial detail for luminance stimuli thanred–green stimuli; very little spatial informationabout S cone (blue–yellow) image data isrequired.
8.3 IMAGE CAPTURE
8.3.1 OVERVIEW
In this section we review general principles ofcolor image acquisition and how these principlesare applied to the design of color cameras andscanners. We consider only image captureintended for subsequent display to a humanobserver, excluding devices designed for com-puter vision or other physical experiments. Ouremphasis is on the capture of wavelength infor-
mation, though we will consider how this inter-acts with spatial variables as well.
The general goal of wavelength capture forscanners and cameras is to acquire enoughinformation about the input material to enablecreation of a reproduction that will look similarand pleasing to the human eye. Because of thelimited sensitivity of the human eye to variationsin the wavelength composition, a complete spec-tral measurement of the image is unnecessary.The very existence of inexpensive color capturedevices is possible only because of the savingsthat are possible because of human trichromacy:image capture devices achieve enormous effi-ciencies in representing the wavelength compo-sition of the original source by measuring onlythose portions of the signal that human observersperceive. Capturing more wavelength informa-tion is wasteful of resources, needlessly drivingup the cost of the device; capturing less willcause perceptually significant differences in thereproduction.
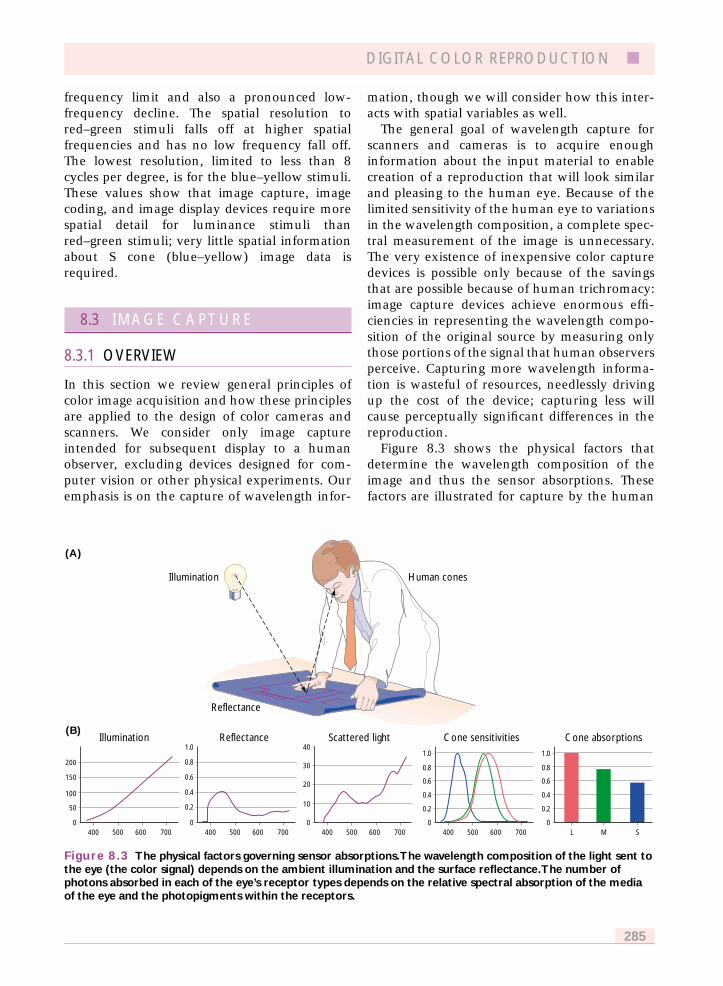
Figure 8.3 shows the physical factors thatdetermine the wavelength composition of theimage and thus the sensor absorptions. Thesefactors are illustrated for capture by the human
DIGITAL COLOR REPRODUCTION ■
285
Figure 8.3 The physical factors governing sensor absorptions.The wavelength composition of the light sent tothe eye (the color signal) depends on the ambient illumination and the surface reflectance.The number ofphotons absorbed in each of the eye’s receptor types depends on the relative spectral absorption of the mediaof the eye and the photopigments within the receptors.
0 0 0 0
(B)
(A)
Illumination Human cones
Reflectance
Illumination Reflectance Scattered light Cone sensitivities Cone absorptions
200
150
100
50
0400 500 600 700
1.0
0.8
0.6
0.4
0.2
400 500 600 700
30
40
20
10
400 500 600 700
1.0
0.8
0.6
0.4
0.2
1.0
0.8
0.6
0.4
0.2
400 500 600 700 L M S
visual system, but the general formulationapplies to other capture devices as well.
Suppose the illumination is diffuse and hasradiance E(�) (measured in watts per squaremeter per steradian per nanometer). Given theparticular viewing geometry, the illuminantradiance produces an irradiance at the surfacethat is specified in terms of watts per squaremeter per nanometer. The surface absorbs a por-tion of the irradiance and scatters a proportionback to the eye. The angular distribution of thescattered light depends on the imaging geometryand the properties of the surface. The angulardistribution can be measured using goniopho-tometers (ASTM, 1991) or, more recently, cono-scopic measurement systems (Fritsch andMlynski, 1991; Leroux and Rossignol, 1995;Saleh, 1996). Fully predicting this geometryrequires extensive theory and modeling of thesurface properties. Because our emphasis isonly the wavelength, and not the angulardistribution of light, we restrict our calculationsto Lambertian surfaces, that is surfaces thatscatter uniformly in all directions. As a firstapproximation, the light emitted from CRTsand many printed materials follow Lambert’slaw. A somewhat better approximation, usefulin some applications of illuminant estimation,is the dichromatic reflectance model (Lee,1985; Shafer, 1985; Tominaga and Wandell,1989).
Using a Lambertian model, the effect of thesurface on the scattered wavelengths is describedby the surface reflectance function, S(�), a dimen-sionless quantity. The scattered light is againdefined by a radiance measurement, and it isgiven by the product C(�) � E(�)S(�) and (unitsof watts per steradian per meter squared pernanometer).
After passage through the optics of the eye, animage is formed at the retina. This can beexpressed as irradiance at the retina (Rodieck,1998). The sensor absorptions by the photore-ceptors (or camera sensors) are calculated by aninner product between the image irradiance atthe retina and the absorption function of thephotoreceptor photopigment. For the ith receptorclass this value is
730
ai � � Ai(�)E(�)S(�)d� (8.1)
370
where Ai(�) is the spectral absorption of the rel-
evant sensor class.For practical calculations, the wavelength func-
tions are sampled and the integral is replaced bya summation. A matrix can then be used to findthe predicted responses as follows. Place thethree device spectral absorption functions, A
i(�),
in the columns of an absorption matrix, A. Toconvert the continuous functions into discretevectors, the CIE recommends using samplingintervals of 5 nm steps ranging from 380 to780 nm. Most sensor absorption functions aresmooth with respect to wavelength, so that theproper wavelength-sampling rate is limited bythe expected variation in the irradiance signals,C(�). Expressing the image irradiance as a vectorwith the same sampling interval, C, the threeresponse values are predicted by the matrixproduct At C.
8.3.1.1 Visible and hidden portions ofthe signal
Most cameras and scanners have three sensors.The three wavelength measurements, a
i, repre-
sent only a coarse sampling of the wavelengthfunction C(�). Consequently, many differentspectral power distributions can cause the sametriplet of responses. A pair of lights, (C, C’), thatcause the same responses in the capture devicebut that have different spectral power distribu-tions are called metamers.
Once the sensor wavelength response func-tions of a device are known, it is straightforwardto specify its metamers. Two lights C and C’ aremetamers if At C � At C’, or equivalently if At
(C–C’) � 0. That is, two lights are metamers ifand only if their difference falls in the null spaceof At.
Again using conventional linear algebra, thesignal measured by any image capture device canbe divided into two parts. One part of the signalinfluences the sensor response. We say this partis visible to the device. It can be expressed as aweighted sum of the columns of the sensormatrix, A. The part that is hidden from the deviceis orthogonal to the columns of A. Metamers dif-fer only in their ‘hidden’ part.
Because image capture devices serve as a sub-stitute for the visual system, it is desirable theyencode precisely the same part of the input signalas the visual system. An ideal image capture
■ THE SCIENCE OF COLOR
286

device must encode only those parts of thewavelength signal as the human visual system.Responding to portions of the signal to whichhumans are blind (e.g., infra-red), or failing torespond to portions the human visual systemsees, usually will introduce errors into the imagereproduction pipeline.
As a practical matter, the sensors in consumerdevices do not align precisely, in the sensedescribed above, with human vision. Much ofthe engineering of capture devices involves com-pensating for this basic difference in acquisition.These methods will be discussed after describingsome of the basic features of practical capturedevices.
8.3.2 SCANNERS FOR REFLECTIVEMEDIA
Figure 8.4 shows two designs of scanners used tocapture signals from printed material. The scan-ners illuminate the page with an internal lamp.In the one-pass designs shown here, three sen-sors encode light scattered from the print sur-face. Most modern scanners use a one-passdesign, though original designs were often basedon three separate measurements acquired usingone sensor and three different colored lightsources.
Figure 8.4 shows an overview of the scanningelements in two patented designs. In the Canondesign a small region in the image is focused
onto an array of three parallel sensors (Tamura,1983). In most modern implementations, thesensors are linear arrays of charged-coupled devices(CCDs) whose spectral sensitivities may bealtered by the superposition of small colored fil-ters. In this design, as the imaging element of thescanner moves across the document each line isfocused, in turn, on one of the three differenttypes of CCD arrays. By the time the entire doc-ument has been scanned all three arrays havescanned the entire page. By registering the sig-nals acquired at different times, color images areobtained.
Hewlett–Packard has patented a design inwhich the capture device acquires signalsthrough a set of dichroic mirrors (Vincent andNeuman, 1989). These mirrors reflect all wave-lengths less than a cutoff wavelength and trans-mit all wavelengths above that cutoff. Byarranging two sets of stacked mirrors, light indifferent wavebands is separated onto threeidentical linear CCD arrays. Using this method,all of the light analyzed at a single moment intime comes from the same source. Also, almostevery photon in the visible range is acquired byone of the sensors. In this design the three sen-sor arrays are the same; the different spectraltuning of the sensors arises because of the prop-erties of the dichroic mirrors along the light path.
The design of the Hewlett–Packard scannerforces the sensor wavelength responsivities to beessentially block functions, unlike the sensors in
DIGITAL COLOR REPRODUCTION ■
287
Figure 8.4 One-pass color scanner designs. In panel (A) the light from a line is measured three times as thethree linear arrays pass. Because of this pipeline architecture, the total time to scan in three sensors is onlyslightly longer than the time to scan with a single (monochrome) sensor. In panel (B) light from a line isseparated by means of dichroic mirrors into three wavelength regimes. Each of these separate wavelengthregimes is imaged on a different sensor to produce the color image. See text for details.
(A) (B)
the human eye. Consequently, it is impossible touse this design to measure the wavelength spec-trum in the same way as the human eye. Eventhough it is impossible to guarantee that thecolor of the reproduction and original match, thesimplicity and elegance of this engineering designhas many practical advantages so that the designis still used in scanners and cameras. We will dis-cuss how problems introduced by the mismatchbetween the acquisition device and the humaneye can be minimized later in this section.
Finally, we conclude with a few of the proper-ties of the capture environment that make thedesign of scanners relatively simple. First, scan-ners work in a closed environment: The illumi-nant is known, unlike the operating environmentfor cameras or the human eye. Knowledge of theilluminant simplifies color estimation and elimi-nates problems caused by the need to manageexposure duration and color balancing. Second,scanners mainly acquire data about a limited setof inputs: flat, printed material. It is possible tomake a best guest, or even have the user specify,the type of printed material in the scanner. Know-ledge about the source of the input can be asignificant advantage for color processing. Whenthe properties of the input material are known,better inferences about the input can be made.We will describe this principle at greater lengthafter introducing color acquisition with digitalcameras.
8.3.3 DIGITAL CAMERAS
There are two basic digital cameras designs. Inone design, three or four color sensors are inter-
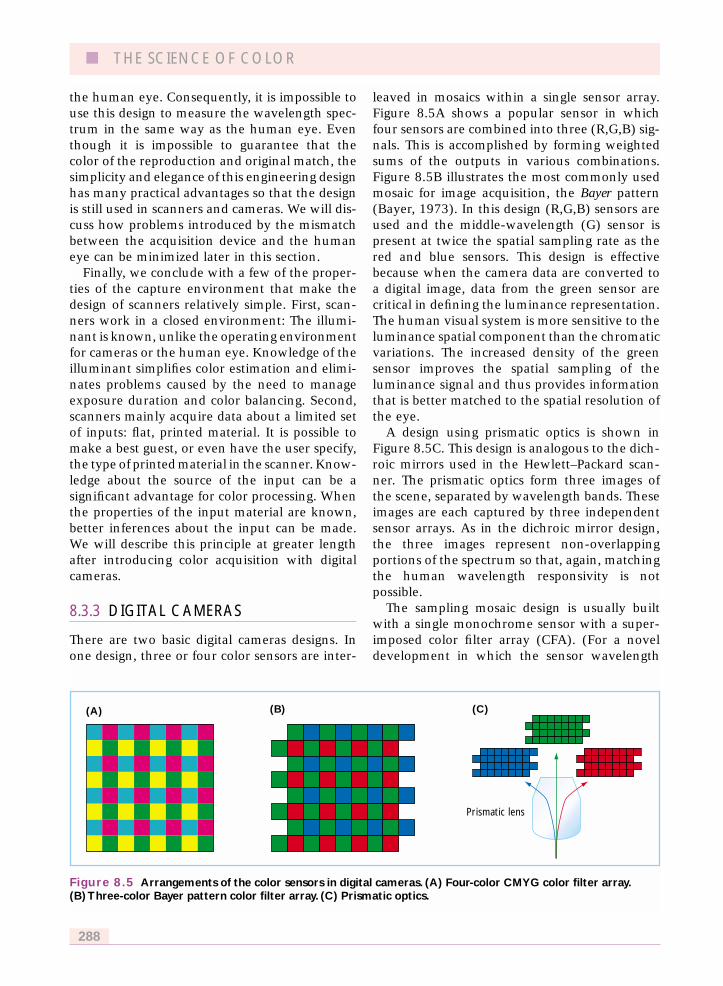
leaved in mosaics within a single sensor array.Figure 8.5A shows a popular sensor in whichfour sensors are combined into three (R,G,B) sig-nals. This is accomplished by forming weightedsums of the outputs in various combinations.Figure 8.5B illustrates the most commonly usedmosaic for image acquisition, the Bayer pattern(Bayer, 1973). In this design (R,G,B) sensors areused and the middle-wavelength (G) sensor ispresent at twice the spatial sampling rate as thered and blue sensors. This design is effectivebecause when the camera data are converted toa digital image, data from the green sensor arecritical in defining the luminance representation.The human visual system is more sensitive to theluminance spatial component than the chromaticvariations. The increased density of the greensensor improves the spatial sampling of theluminance signal and thus provides informationthat is better matched to the spatial resolution ofthe eye.
A design using prismatic optics is shown inFigure 8.5C. This design is analogous to the dich-roic mirrors used in the Hewlett–Packard scan-ner. The prismatic optics form three images ofthe scene, separated by wavelength bands. Theseimages are each captured by three independentsensor arrays. As in the dichroic mirror design,the three images represent non-overlappingportions of the spectrum so that, again, matchingthe human wavelength responsivity is notpossible.
The sampling mosaic design is usually builtwith a single monochrome sensor with a super-imposed color filter array (CFA). (For a noveldevelopment in which the sensor wavelength
■ THE SCIENCE OF COLOR
288
Figure 8.5 Arrangements of the color sensors in digital cameras. (A) Four-color CMYG color filter array.(B) Three-color Bayer pattern color filter array. (C) Prismatic optics.
Prismatic lens
(A) (B) (C)

responsivity is changed electronically see SiliconVision, 2000.) In this design camera spatial reso-lution is traded for color information. To renderimages captured with this design, the data fromthe three types of color sensors must be interpo-lated to form an image with (R,G,B) values atevery location. This interpolation process iscalled demosaicing, and a variety of demosaicingalgorithms have been proposed (see, e.g., Adamset al., 1998).
Demosaicing algorithms are a very importantcomponent of the digital camera system design.Some of the artifacts that can be introduced byusing poor demosaicing algorithms are illus-trated in Figure 8.6. The original image is shownin panel (A). This image was sampled to simulatean image acquired by a Bayer color filter array.The reconstructed image from a linear interpola-tion of the missing values is shown in panel (B).The reconstructed image formed by replicatingpixel values is shown in (C). Neither method isacceptable and a variety of linear and nonlinearmethodshavebeenproposedandused inproducts(Brainard and Sherman, 1995; Adams et al.,1998).
There are three advantages of the prismaticoptics approach. First, for the same spatial reso-lution as the mosaic design, the sensor arrayscan be smaller, and it is less expensive to buildthree smaller sensor arrays than one larger one.Second, nearly every photon is captured, produc-ing a very efficient capture device. The mosaicdesign intentionally permits photons to fall onsensors that will not respond to them. Efficientphoton capture is an important element of finalimage quality, giving the prismatic optics adesign advantage. Finally, prismatic optics elimi-
nates the need for demosaicing. The main disad-vantage, of course, is the complexity of the pris-matic optics, including the packaging andadditional electronics needed to accommodatethe additional sensor arrays.
8.3.4 CALIBRATION ANDCHARACTERIZATION
In modern image capture applications, colorcharacterization means finding a method toconvert the measured (R,G,B) values into adescription based on the CIE tristimulus values(or equivalently the human cone absorptions).For most image capture devices the conversionprocess will depend on the specific state of thedevice; calibration refers to the process of adjust-ing the device parameters so that the device is ina known state where the characterization isaccurate. Because the (R,G,B) responses in ascanner or camera are unique to that device, themeasured values are called device-dependent.Because the CIE values are not tied to the device,but rather to human vision, these are calleddevice-independent.
The characterization process is usually dividedinto two parts. First, measurements are made ofthe relationship between light input intensityand scanner or camera output. The functionrelating these quantities is called the transduc-tion function, also called the gamma function. Inmost systems, the output follows the same func-tion of intensity no matter what the spectralcomposition of the input source. The sensorsthemselves respond linearly to the input signal,and any nonlinearities arise from processingafter the initial capture. A simple model for this
DIGITAL COLOR REPRODUCTION ■
289
Figure 8.6 Spatial artifacts caused by demosaicing algorithms.The original image is shown in (A).Interpolation errors when using (B) linear interpolation and (C) pixel replication are shown.
(A) (B) (C)
type of system is given by the formula for a staticnonlinearity:
d � F(� s(�)r(�)d�)
where d is the digital value from the system, s(�)is the input signal spectral power distribution,r(�) is the sensor spectral responsivity, and F( ) isa monotonic function. Because F( ) is a fixed,monotonic, nonlinearity, it is possible to estimatethe function and remove its effect. After correct-ing for F( ), the sensor wavelength responsivitycan be estimated using standard linear methods.In the following sections, we describe some ofthe basic features of the nonlinear function usedin most cameras. Then, we describe estimationmethods for the sensor spectral responsivity.
8.3.4.1 Dynamic range andquantization
The dynamic range of a capture system is theratio of the light level that produces a responsejust below system saturation and the light levelneeded to produce a response just above thedark noise. The device quantization describeshow many intensity levels are classified in thedigital output. For example, an 8-bit device clas-sifies the input intensities into 256 levels. Eachof these factors plays a significant role in deter-mining the camera image quality.
The dynamic range and quantization proper-ties are determined by different parts of thecamera system. The dynamic range is an input-referred measurement; that is, its value is theratio of two input light levels. Signal quantiza-tion is a description of the number of signal out-put levels and does not depend on the inputsignal at all. Despite this huge difference, oneoften hears the dynamic range of a devicedescribed in terms of the number of bits it codes.This is incorrect. A system that quantizes theoutput signal to 12 bits can have the samedynamic range as a system that quantizes theoutput to 8 bits. Two 8-bit systems can have verydifferent dynamic ranges. To link the twomeasures, one must make a set of assumptionsabout how the camera designer chose thequantization levels, the properties of the sensor,and other system features. There is no guaranteethat these assumptions will be met.
The dynamic range of commonly used CCD
sensors is on the order of a factor of 500–1000(60 dB), though devices with much higherdynamic range exist. Operationally, call one stan-dard deviation of the sensor noise variability 1.Then, if the maximum response that we canread out prior to sensor saturation is 100, thedynamic range is 100. Photomultiplier tubes, anolder but still important technology, have adynamic range in excess of 1000. Dynamic rangeis commonly described in log units or decibels(20 log units). Hence, it is often said that CCDsensors have a dynamic range of 2–3 log units(40–60 dB) and photomultiplier tubes have adynamic range of 3–4 log units (60–80 dB)(Janesick, 1997; dpreview.com, 2000). It is diffi-cult tocompare thedynamic rangeof thesedeviceswith that of the human eye; while the responses ofthese devices is roughly linear with input inten-sity, the visual system encodes light intensityusing a nonlinear (compressive) transductionfunction (Cornsweet, 1970; Wandell, 1995).
How much is enough dynamic range? If weconsider only the surface reflectances of objects,a range of two log units is quite large. This spansreflectances from that of white reflective paper(100%) to very black ink (1%). The dynamicrange of a CCD sensor is adequate to encode thedynamic range of printed material. Slides canrepresent a somewhat larger range of densities,exceeding two log units, so that in these applica-tions either specially cooled CCDs or photomul-tiplier tubes may be appropriate. Natural scenesmay have even larger dynamic ranges due to (a)geometric relationship between the light source,surface, and viewer, and (b) shadows. Imagescontaining a portion in direct sunlight and a sec-ond portion in dark shadow, or a shadow withina shade, can span 4 log units or more.
The analog-to-digital converters (ADCs) in theimage capture system determine the signalquantization. In many early designs, uniformquantization steps were used, and the mostfrequently asked question was: How many bitsof output are needed to capture the intensitydifferences seen by the human eye? The mainprinciples of the answer are well understood: Tomatch the intensity discrimination abilities of thehuman eye, the quantizer must classify intensi-ties present at the finest discriminability. Thefinest human intensity resolution occurs atintensity levels somewhat lower than the mean
■ THE SCIENCE OF COLOR
290
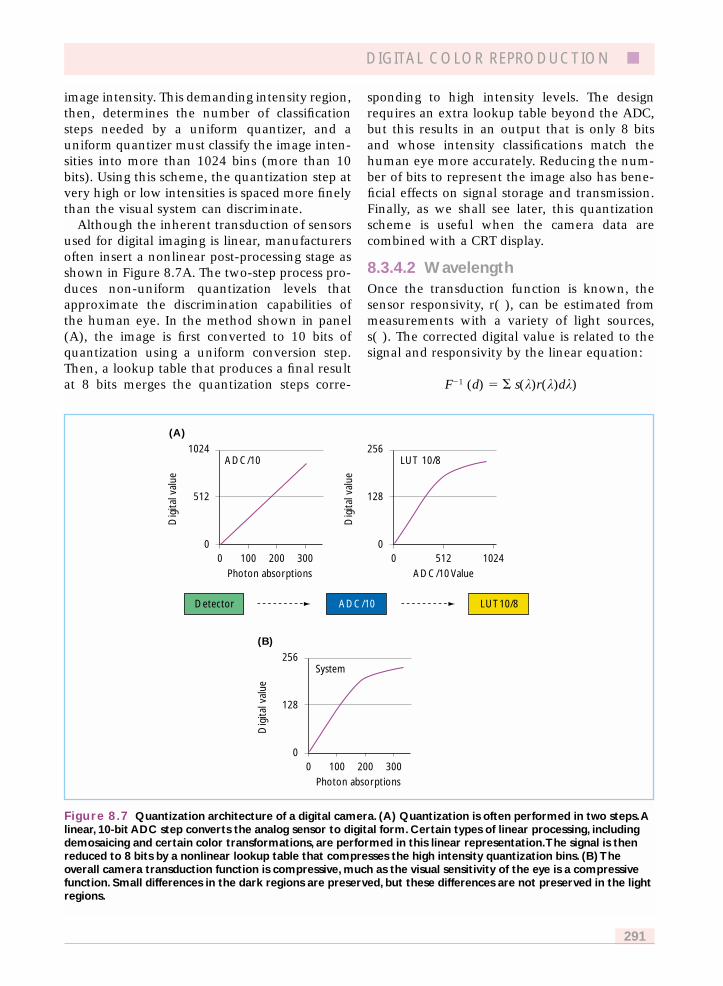
image intensity. This demanding intensity region,then, determines the number of classificationsteps needed by a uniform quantizer, and auniform quantizer must classify the image inten-sities into more than 1024 bins (more than 10bits). Using this scheme, the quantization step atvery high or low intensities is spaced more finelythan the visual system can discriminate.
Although the inherent transduction of sensorsused for digital imaging is linear, manufacturersoften insert a nonlinear post-processing stage asshown in Figure 8.7A. The two-step process pro-duces non-uniform quantization levels thatapproximate the discrimination capabilities ofthe human eye. In the method shown in panel(A), the image is first converted to 10 bits ofquantization using a uniform conversion step.Then, a lookup table that produces a final resultat 8 bits merges the quantization steps corre-
sponding to high intensity levels. The designrequires an extra lookup table beyond the ADC,but this results in an output that is only 8 bitsand whose intensity classifications match thehuman eye more accurately. Reducing the num-ber of bits to represent the image also has bene-ficial effects on signal storage and transmission.Finally, as we shall see later, this quantizationscheme is useful when the camera data arecombined with a CRT display.
8.3.4.2 WavelengthOnce the transduction function is known, thesensor responsivity, r( ), can be estimated frommeasurements with a variety of light sources,s( ). The corrected digital value is related to thesignal and responsivity by the linear equation:
F�1 (d) � � s(�)r(�)d�)
DIGITAL COLOR REPRODUCTION ■
291
Figure 8.7 Quantization architecture of a digital camera. (A) Quantization is often performed in two steps.Alinear, 10-bit ADC step converts the analog sensor to digital form. Certain types of linear processing, includingdemosaicing and certain color transformations, are performed in this linear representation.The signal is thenreduced to 8 bits by a nonlinear lookup table that compresses the high intensity quantization bins. (B) Theoverall camera transduction function is compressive, much as the visual sensitivity of the eye is a compressivefunction. Small differences in the dark regions are preserved, but these differences are not preserved in the lightregions.
Dig
ital v
alue
Photon absorptions
Detector ADC/10 LUT10/8
0
512
1024ADC/10
System
0 100 300200
(A)
Dig
ital v
alue
Photon absorptions
0
128
256
0 100 300200
(B)
Dig
ital v
alue
ADC/10 Value
0
128
256
0 512 1024
LUT 10/8
One can only guarantee that the sensor responsemeasures the same spectral image as the humancones if the sensor responsivities are linearlyrelated to the human cones, or equivalently tothe CIE Standard Observer functions x–, y–, and zz–.That is, suppose there are three sensor respon-sivities, r
i(�). Then the image capture system will
be guaranteed to see the same portion of the vis-ible spectrum as the human eye if and only ifthere are weights, w
ij, such that
x � w11
r1
� w12
r2
� w12
r3
Two similar equations must hold for y– and z–.When such a linear relationship exists, the sen-sors are colorimetric, and it is possible to guaran-tee that the sensor (R,G,B) responses can beconverted to CIE tristimulus coordinates. Theconversion step requires multiplying the (R,G,B)values by a 3 � 3 linear transformation com-prised of the weights. It is possible to determinethese weights from only a few measurements.Suppose that we know the (X,Y,Z) values ofthree color patches, and we know the linearizedsensor values, F�1(R,G,B). Then one can deter-mine the linear transformation that maps the(X,Y,Z) values into the linear sensor values.
In general, limitations on the cost of manufac-turing make it impractical for the spectral sensi-tivity of these sensors to match the spectralsensitivity of the cones or the tristimulus func-tions. It is straightforward to show that when the
sensors are not within a linear transformation ofthe tristimulus functions, there will be pairs ofsurfaces such that: (a) the sensor responses tothe two surfaces are identical, but (b) the tri-stimulus coordinates of the surfaces differ. Forsuch a pair of surfaces, it is impossible to guar-antee a correct estimate of the tristimulus coor-dinates from the measured responses.
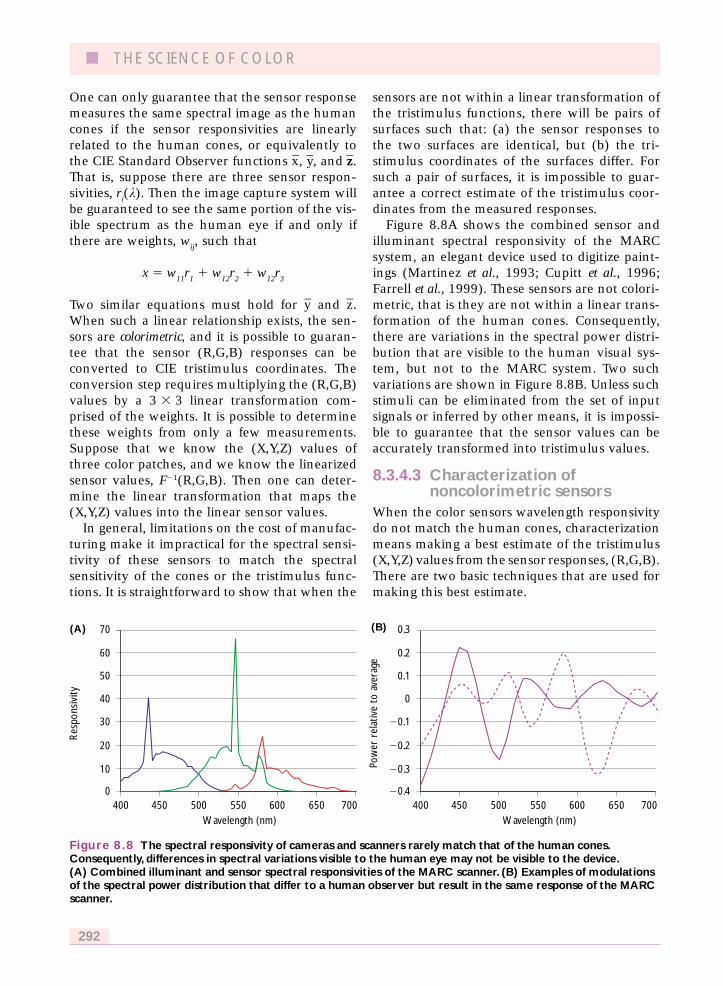
Figure 8.8A shows the combined sensor andilluminant spectral responsivity of the MARCsystem, an elegant device used to digitize paint-ings (Martinez et al., 1993; Cupitt et al., 1996;Farrell et al., 1999). These sensors are not colori-metric, that is they are not within a linear trans-formation of the human cones. Consequently,there are variations in the spectral power distri-bution that are visible to the human visual sys-tem, but not to the MARC system. Two suchvariations are shown in Figure 8.8B. Unless suchstimuli can be eliminated from the set of inputsignals or inferred by other means, it is impossi-ble to guarantee that the sensor values can beaccurately transformed into tristimulus values.
8.3.4.3 Characterization ofnoncolorimetric sensors
When the color sensors wavelength responsivitydo not match the human cones, characterizationmeans making a best estimate of the tristimulus(X,Y,Z) values from the sensor responses, (R,G,B).There are two basic techniques that are used formaking this best estimate.
■ THE SCIENCE OF COLOR
292
Figure 8.8 The spectral responsivity of cameras and scanners rarely match that of the human cones.Consequently, differences in spectral variations visible to the human eye may not be visible to the device.(A) Combined illuminant and sensor spectral responsivities of the MARC scanner. (B) Examples of modulationsof the spectral power distribution that differ to a human observer but result in the same response of the MARCscanner.
Res
pons
ivity
Pow
er r
elat
ive
to a
vera
ge
Wavelength (nm)
0
10
20
30
40
50
60
70
700550400 450 500 600 650Wavelength (nm)
�0.4
�0.3
�0.2
�0.1
0
0.1
0.2
0.3
700550400 450 500 600 650
(A) (B)
First, characterization can involve makingmeasurements of multiple stimuli to find a func-tional form that relates the measured (R,G,B) tothe (X,Y,Z) values. The functional forms that arecommonly used include simple global lineartransformations (3 � 3 matrix), linear transfor-mations that vary smoothly with the input data(interpolation), nonlinear polynomial functions,and methods based on simple neural networks.
Tetrahedral interpolation is an elegant compu-tational method that can be reduced to veryefficient hardware computation. This methodapplies a linear transformation to the measureddata, but the linear transform coefficients vary asa function of the measured (R,G,B) values. Themethod is called tetrahedral because the inputspace is partitioned into a set of non-overlappingtetrahedra using a characterization data set. Thelinear transformation applied to any (R,G,B)value depends on the measured characterizationvalues at the vertices of the tetrahedra(Hardeberg and Schmitt, 1997; Gill, 1999). Thetetrahedral shape is preferred to cubes becausetetrahedra are preserved across transformationsfrom RGB to XYZ representations, so that trans-formations in either direction can be based onthe same control points. Other geometric shapes,such as squares, can be transformed into curvedshapes that are problematic when partitioningthe response space. A patent has been obtainedon the use of tetrahedral interpolation for colorcharacterization (Sakamoto and Itooka, 1981).
The second technique that is helpful for char-acterization purposes is to specify the propertiesof the input signals. This can be a very powerfultechnique, particularly if the input signals fall ina sufficiently restricted set. For example, it ispossible to use noncolorimetric camera sensorsto estimate the tristimulus coordinates of a colordisplay system that has only three independentprimary lights (Horn, 1984; Wandell, 1986).
In many practical applications, for examplewhen mainly processing a particular type of filmprint, the input material is restricted. Calibratingspecifically for this print should lead to a rela-tively precise system compared to calibrating forarbitrary inputs. Hence, a target designed to spanthe color range of the print medium is helpful.Such a target, the ANSI (American NationalStandards Institute) IT8.7, has been standardizedand is now provided by various vendors. These
targets include examples of particular printedoutputs and the manufacturer provides the tris-timulus values of these prints. Hence, they forma good basis for calibrating a scanner or camerasystem that will be used regularly with one of asmall set of targets. These targets may be pur-chased from a number of vendors.
8.3.5 COLOR RENDERING OFACQUIRED IMAGES
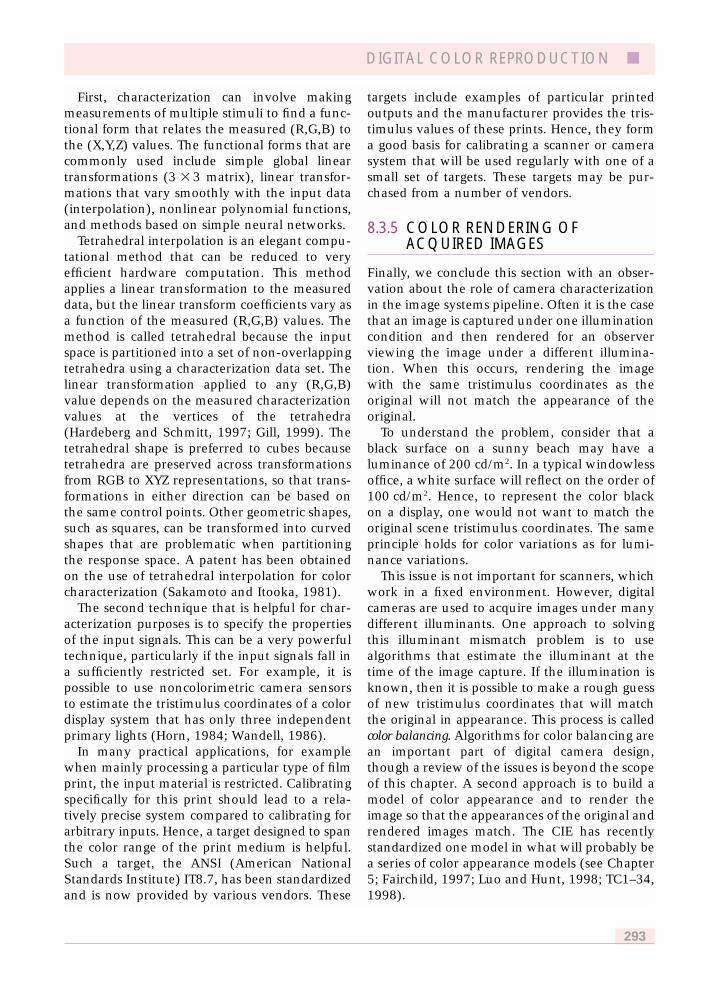
Finally, we conclude this section with an obser-vation about the role of camera characterizationin the image systems pipeline. Often it is the casethat an image is captured under one illuminationcondition and then rendered for an observerviewing the image under a different illumina-tion. When this occurs, rendering the imagewith the same tristimulus coordinates as theoriginal will not match the appearance of theoriginal.
To understand the problem, consider that ablack surface on a sunny beach may have aluminance of 200 cd/m2. In a typical windowlessoffice, a white surface will reflect on the order of100 cd/m2. Hence, to represent the color blackon a display, one would not want to match theoriginal scene tristimulus coordinates. The sameprinciple holds for color variations as for lumi-nance variations.
This issue is not important for scanners, whichwork in a fixed environment. However, digitalcameras are used to acquire images under manydifferent illuminants. One approach to solvingthis illuminant mismatch problem is to usealgorithms that estimate the illuminant at thetime of the image capture. If the illumination isknown, then it is possible to make a rough guessof new tristimulus coordinates that will matchthe original in appearance. This process is calledcolor balancing. Algorithms for color balancing arean important part of digital camera design,though a review of the issues is beyond the scopeof this chapter. A second approach is to build amodel of color appearance and to render theimage so that the appearances of the original andrendered images match. The CIE has recentlystandardized one model in what will probably bea series of color appearance models (see Chapter5; Fairchild, 1997; Luo and Hunt, 1998; TC1–34,1998).
DIGITAL COLOR REPRODUCTION ■
293

8.4 ELECTRONIC IMAGEDISPLAYS
8.4.1 OVERVIEW
Image rendering technologies can be dividedinto two major categories: electronic displaysand printers. Electronic displays can be furthersubdivided into emissive and non-emissivetypes. Emissive displays are those in which theimage-forming element also serves as the sourceof light, while non-emissive displays modulatesome aspect of an extrinsic illumination source.There are currently a large number of displaytechnologies for rendering an electronic image,but two types dominate the market: the cathoderay tube (CRT) is the dominant emissive tech-nology while the liquid crystal display (LCD) isthe pervasive non-emissive technology. Printingis a non-emissive rendering technology.
We have separated the discussion of image dis-plays into emissive and non-emissive technolo-gies because the methods used to control lightintrinsic to the device and those used to controltransmitted or reflected light from an externalsource differ significantly. In this section wedescribe the basic principles of CRTs and LCDs.While there are many ways to utilize liquid crys-tals to modulate light and create a display device,we focus our attention on the ubiquitous trans-
missive, twisted-nematic (TN) color LCD thatcontains a separate but integrated illuminationsource. The basic principles of color synthesisand color control for these LCDs and CRTdevices are similar and will play a role in most, ifnot all, of the display technologies that are envi-sioned over the next decade. We show howthese color synthesis principles are used to satisfythe color-reproduction equation, described in theintroduction to this chapter. We also review thegeneral methods and computational tools thatare used to characterize such electronic displaydevices.
8.4.2 CRT DEVICES
The venerable CRT has dominated the displaymarket for the past 45 years, despite repeatedclaims of its imminent demise. The principaltechnology for generating color in direct-viewCRTs is the shadow-mask CRT, illustrated inFigure 8.9.
In this design, the three electron guns (one foreach primary color phosphor) house a thermioniccathode that serves as a source of electrons.Video input voltages are applied to each electrongun assembly, which includes control grids formodulating the beam current flowing from thecathodes as well as electrodes to accelerate,shape and focus the electron beams on thephosphor-coated faceplate. The applied video
■ THE SCIENCE OF COLOR
294
Figure 8.9 The shadow-mask CRT.The basic architecture of a shadow mask color CRT display is shown in (A),and the geometric relations between the cathodes, shadow mask and phosphor-coated faceplate in determiningcolor selection are shown in (B).
(A) (B)
Cathode
Focuselectrode
Deflectionyoke
Electronbeam
Faceplate
Shadowmask
Cathode Red
Green
Blue
Controlsignal
g rb g rb
g rb g rbg rb grb
g rb grb
signals cause the intensity of the electron beamsto vary synchronously as the beams sweep out araster path. The electrons that pass through theshadow-mask apertures excite the R, G, and Bphosphors. The geometry of the apertures iscoordinated with the phosphor pattern on theCRT faceplate. Electron absorptions cause thephosphors to emit light in a process called catho-doluminescence. As illustrated in Figure 8.9b,color selection and registration are determinedby the position of the electron guns and theirgeometric relations to the shadow-mask andphosphor-coated faceplate.
Although there are several places in the CRTimage pathway where sampling artifacts areintroduced, sampling artifacts are minimizedbecause theelectronbeamcross-section isapprox-imately Gaussian and spans several groupings ortriads of color phosphor dots. This shape impartsa low-pass spatial filter to the signal path so thatthe sampling rate does not introduce any appre-ciable spatial aliasing (Lyons and Farrell, 1989).
In designing CRTs, the positions of the elec-tron guns, shadow-mask apertures and phos-phors must all be taken into account and manyconfigurations are currently available. In recentyears there has been a trend toward the use ofin-line configurations of electron guns, in whichthe electron beams are arrayed along a linerather than in a triangular configuration, due totheir simpler alignment and deflection consider-ations (Silverstein and Merrifield, 1985; Sherr,1993). In addition, slotted-mask and strip-mask(e.g., the familiar Sony Trinitron tube) colorCRTs which use continuous vertical RGB phos-phor stripes on the CRT faceplate have becomepopular. Current technology has enabled mask-pitch and associated phosphor component pitch(i.e., the center-to-center distance between RGBphosphor groupings or between like-color phos-phor components) to be reduced to the range of0.25 to 0.31 mm (Lehrer, 1985; Silverstein andMerrifield, 1985; Sherr, 1993).
The CRT design reduces spatial resolution andphoton efficiency in exchange for color. It isimportant that the spatial patterning of the red,green, and blue phosphors be invisible undernormal operation. At a nominal display viewingdistance of 61.0 cm, this spacing translates into arange of subtended visual angles from approxi-mately 1.41 to 1.75 arc minutes. Given the
resolving capability of the chromatic channels ofthe human visual system (also see Chapters 2and 6 of the present volume), this spacing issufficient to ensure reliable spatial-additivecolor synthesis (Schade, 1958; VanderHorstand Bouman, 1969; Glenn et al., 1985; Mullen,1985).
Color CRTs are inefficient compared to mono-chrome displays because of the shadow mask.The presence of the mask reduces the percentageof electrons that result in an electron absorptionand subsequent photon emission, and suchmasks are not needed in monochrome displays.The market has demonstrated that to most con-sumers the value of color information is thetradeoff.
8.4.3 LCD DEVICES
Direct-view color LCDs are commonplace inportable computer and miniature color televi-sion applications. They are beginning to pene-trate the market for larger, high-resolution,high-performance color displays.
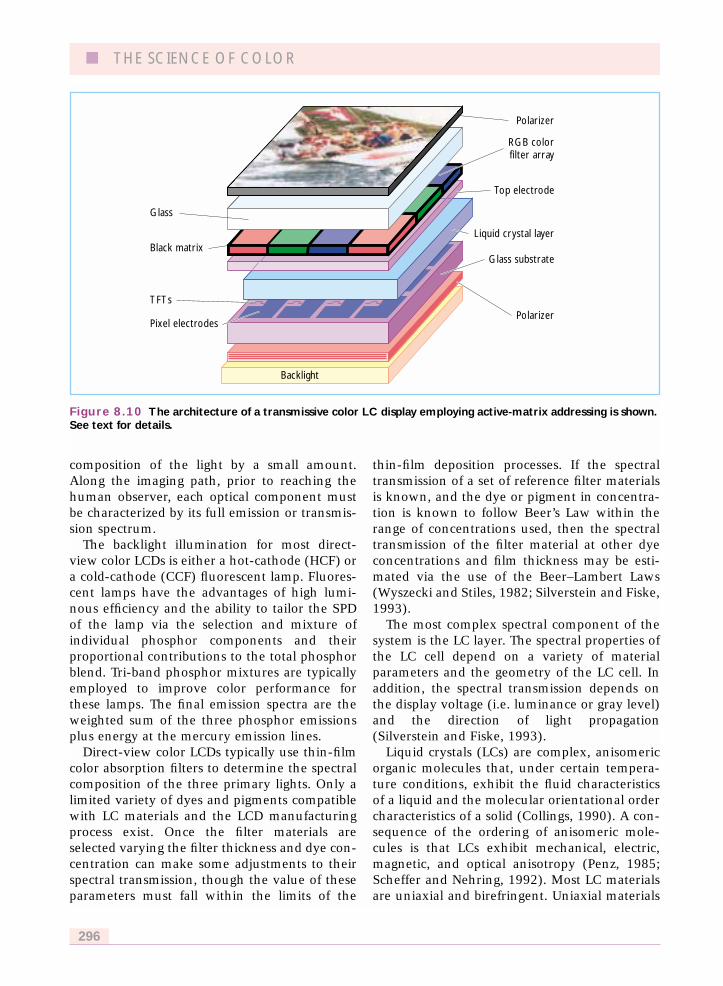
Figure 8.10 shows the major optical compo-nents of an active-matrix addressed transmissiveTN LCD. The color LCD is composed of a back-light illumination source, diffuser, rear linearpolarizer, glass sheets with transparent thin-filmindium-tin-oxide (ITO) electrodes and thin-filmtransistors (TFTs), optically active layer of bire-fringent LC material, absorbing thin-film colorselection filters, and a front polarizer. The opera-tion of the LCD depends mainly on the polariza-tion properties of light. Light from theillumination source is plane polarized by the rear(entrance) polarizer. The light passes throughthe liquid crystal (LC) layer where its polari-zation state can be altered. Depending on thepolarization state after passing through the LC,the light is either absorbed or transmitted by thefront (analyzing) polarizer.
Three components have the principal effectson the colorimetric and photometric characteris-tics of the emitted light: the spectral powerdistribution (SPD) of the illumination source;the spectral transmission of the thin-film colorselection filters; and the spectral transmission ofthe LC cell (Silverstein, 2000). The largely clearoptical elements, such as the glass containingthe ITO electrodes, only modify the spectral
DIGITAL COLOR REPRODUCTION ■
295
composition of the light by a small amount.Along the imaging path, prior to reaching thehuman observer, each optical component mustbe characterized by its full emission or transmis-sion spectrum.
The backlight illumination for most direct-view color LCDs is either a hot-cathode (HCF) ora cold-cathode (CCF) fluorescent lamp. Fluores-cent lamps have the advantages of high lumi-nous efficiency and the ability to tailor the SPDof the lamp via the selection and mixture ofindividual phosphor components and theirproportional contributions to the total phosphorblend. Tri-band phosphor mixtures are typicallyemployed to improve color performance forthese lamps. The final emission spectra are theweighted sum of the three phosphor emissionsplus energy at the mercury emission lines.
Direct-view color LCDs typically use thin-filmcolor absorption filters to determine the spectralcomposition of the three primary lights. Only alimited variety of dyes and pigments compatiblewith LC materials and the LCD manufacturingprocess exist. Once the filter materials areselected varying the filter thickness and dye con-centration can make some adjustments to theirspectral transmission, though the value of theseparameters must fall within the limits of the
thin-film deposition processes. If the spectraltransmission of a set of reference filter materialsis known, and the dye or pigment in concentra-tion is known to follow Beer’s Law within therange of concentrations used, then the spectraltransmission of the filter material at other dyeconcentrations and film thickness may be esti-mated via the use of the Beer–Lambert Laws(Wyszecki and Stiles, 1982; Silverstein and Fiske,1993).
The most complex spectral component of thesystem is the LC layer. The spectral properties ofthe LC cell depend on a variety of materialparameters and the geometry of the LC cell. Inaddition, the spectral transmission depends onthe display voltage (i.e. luminance or gray level)and the direction of light propagation(Silverstein and Fiske, 1993).
Liquid crystals (LCs) are complex, anisomericorganic molecules that, under certain tempera-ture conditions, exhibit the fluid characteristicsof a liquid and the molecular orientational ordercharacteristics of a solid (Collings, 1990). A con-sequence of the ordering of anisomeric mole-cules is that LCs exhibit mechanical, electric,magnetic, and optical anisotropy (Penz, 1985;Scheffer and Nehring, 1992). Most LC materialsare uniaxial and birefringent. Uniaxial materials
■ THE SCIENCE OF COLOR
296
Figure 8.10 The architecture of a transmissive color LC display employing active-matrix addressing is shown.See text for details.
Glass
Polarizer
Top electrode
Glass substrate
Polarizer
Backlight
Liquid crystal layer
RGB colorfilter array
Black matrix
TFTs
Pixel electrodes

possess one unique axis, the optic axis, which isparallel to the liquid crystal director (i.e., thelong axis of the molecules). The anisotropicnature of LC materials gives them the opticalproperty of birefringence, which refers to thephenomenon of light traveling with differentvelocities in crystalline materials depending onthe propagation direction and the orientation ofthe light polarization relative to the crystallineaxes (Collings, 1990). For a uniaxial LC, thisimplies different dielectric constants and refrac-tive indices for the unique or ‘extraordinary’direction and for other ‘ordinary’ directions inthe LC material.
As mentioned above, the predominant LC cellconfiguration for high-performance color LCDsis the TN cell, whose basic principles of operationare illustrated in Figure 8.11. An entrance polar-izer linearly polarizes the source light. In thefield-off state (panel A), with no voltage applied,the LC layer optically rotates the axis of polar-ization of the incoming light. The typical twist orrotation angle used for most TN LCDs is 90,
although other twist angles may be used toachieve certain desired optical characteristics(Scheffer and Nehring, 1990, 1992). In the field-on state (panel B), the dielectric anisotropy ofthe LC material enables the applied electric fieldto deform the LC layer, destroying the twistedstructure and eliminating the LC birefringencefor normally incident incoming light. The LClayer does not rotate the axis of polarization ofthe incoming light. The difference in polarizationstate is the key variable for determining thedisplay output.
After passage through the LC layer, the exitpolarizer or ‘analyzer’ analyzes the polarizationstate of light exiting the LC layer. Light polarizedparallel to the analyzer polarization vector istransmitted, light polarized perpendicular to theanalyzer polarization direction is extinguished,and light polarized at intermediate angles fol-lows Malus’ Law; I’ � I cos2 �, where (I) is theintensity of polarized incident light from a firstlinear polarizer, (I’) is the intensity of light out-put and (�) is the relative angle between the
DIGITAL COLOR REPRODUCTION ■
297
Figure 8.11 The composition of a TN LCD cell is shown.Applying voltage to the liquid crystal controls thetransmission of light through the cell.These voltages alter the polarization of light passing through the cell. In(A), zero voltage is applied so that the twist structure is left undisturbed and rotates the polarization of the light90 where it passes through the exit polarizer. In (B) a supra-threshold voltage is applied such that the LC twiststructure is destroyed, leaving the initial polarization of light intact as it passes through the LC layer where it isfinally absorbed by the orthogonal exit polarizer.
(A)Unpolarized light
Polarizer
Polarizer
Field off (V=0) Field on (V>Vthreshold)
No light escapes
Glass
Glass
ITO
ITO
Polymer
Polymer
Liquid crystal
(B)Unpolarized light
V
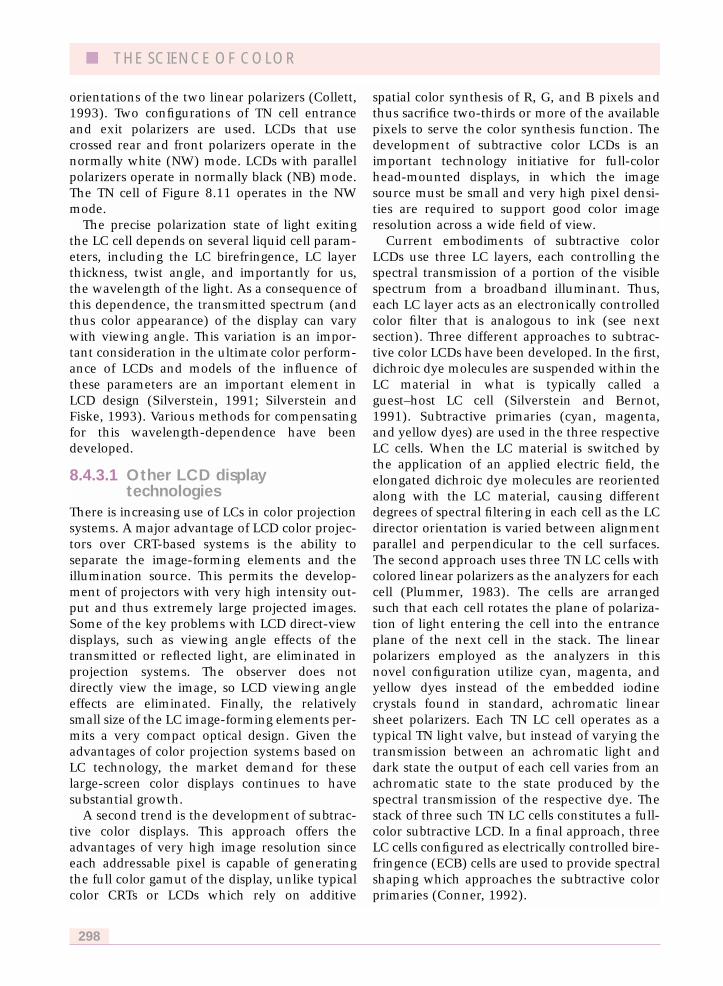
orientations of the two linear polarizers (Collett,1993). Two configurations of TN cell entranceand exit polarizers are used. LCDs that usecrossed rear and front polarizers operate in thenormally white (NW) mode. LCDs with parallelpolarizers operate in normally black (NB) mode.The TN cell of Figure 8.11 operates in the NWmode.
The precise polarization state of light exitingthe LC cell depends on several liquid cell param-eters, including the LC birefringence, LC layerthickness, twist angle, and importantly for us,the wavelength of the light. As a consequence ofthis dependence, the transmitted spectrum (andthus color appearance) of the display can varywith viewing angle. This variation is an impor-tant consideration in the ultimate color perform-ance of LCDs and models of the influence ofthese parameters are an important element inLCD design (Silverstein, 1991; Silverstein andFiske, 1993). Various methods for compensatingfor this wavelength-dependence have beendeveloped.
8.4.3.1 Other LCD displaytechnologies
There is increasing use of LCs in color projectionsystems. A major advantage of LCD color projec-tors over CRT-based systems is the ability toseparate the image-forming elements and theillumination source. This permits the develop-ment of projectors with very high intensity out-put and thus extremely large projected images.Some of the key problems with LCD direct-viewdisplays, such as viewing angle effects of thetransmitted or reflected light, are eliminated inprojection systems. The observer does notdirectly view the image, so LCD viewing angleeffects are eliminated. Finally, the relativelysmall size of the LC image-forming elements per-mits a very compact optical design. Given theadvantages of color projection systems based onLC technology, the market demand for theselarge-screen color displays continues to havesubstantial growth.
A second trend is the development of subtrac-tive color displays. This approach offers theadvantages of very high image resolution sinceeach addressable pixel is capable of generatingthe full color gamut of the display, unlike typicalcolor CRTs or LCDs which rely on additive
spatial color synthesis of R, G, and B pixels andthus sacrifice two-thirds or more of the availablepixels to serve the color synthesis function. Thedevelopment of subtractive color LCDs is animportant technology initiative for full-colorhead-mounted displays, in which the imagesource must be small and very high pixel densi-ties are required to support good color imageresolution across a wide field of view.
Current embodiments of subtractive colorLCDs use three LC layers, each controlling thespectral transmission of a portion of the visiblespectrum from a broadband illuminant. Thus,each LC layer acts as an electronically controlledcolor filter that is analogous to ink (see nextsection). Three different approaches to subtrac-tive color LCDs have been developed. In the first,dichroic dye molecules are suspended within theLC material in what is typically called aguest–host LC cell (Silverstein and Bernot,1991). Subtractive primaries (cyan, magenta,and yellow dyes) are used in the three respectiveLC cells. When the LC material is switched bythe application of an applied electric field, theelongated dichroic dye molecules are reorientedalong with the LC material, causing differentdegrees of spectral filtering in each cell as the LCdirector orientation is varied between alignmentparallel and perpendicular to the cell surfaces.The second approach uses three TN LC cells withcolored linear polarizers as the analyzers for eachcell (Plummer, 1983). The cells are arrangedsuch that each cell rotates the plane of polariza-tion of light entering the cell into the entranceplane of the next cell in the stack. The linearpolarizers employed as the analyzers in thisnovel configuration utilize cyan, magenta, andyellow dyes instead of the embedded iodinecrystals found in standard, achromatic linearsheet polarizers. Each TN LC cell operates as atypical TN light valve, but instead of varying thetransmission between an achromatic light anddark state the output of each cell varies from anachromatic state to the state produced by thespectral transmission of the respective dye. Thestack of three such TN LC cells constitutes a full-color subtractive LCD. In a final approach, threeLC cells configured as electrically controlled bire-fringence (ECB) cells are used to provide spectralshaping which approaches the subtractive colorprimaries (Conner, 1992).
■ THE SCIENCE OF COLOR
298
Prototype subtractive LCDs yielding excellentcolor performance have been demonstrated forthe guest–host configuration using appropriatelyselected dichroic dyes and for the stacked TN cellapproach with high-quality color polarizers. Thethree-layer ECB cell configuration has been usedin color projection panels for overhead projec-tors for a number of years, although good colorsaturation and precise color control have beendifficult to achieve with ECB cells. Thus, whilehigh-performance subtractive color LCDs are stillin their early stages of development, their techni-cal feasibility has been demonstrated. The poten-tial advantages of subtractive color displays arecompelling, and the technology will surely find aplace in the future of electronic color imaging.
Color LCD technology is still relatively new andevolving at a rapid pace. Continuing advances inall key LCD technologies; LC materials, opticalsystems configurations, illumination sources,color filters, optical compensation techniques,driver chips, and LC controllers, promise to raisethe level of performance for each successivegeneration of color LCDs. Research into thespatial and temporal imaging characteristics ofcolor matrix displays, including the effects ofcolor mosaic patterns and methods of luminancequantization, remains a highly active area ofinvestigation (Silverstein et al., 1990). As theevolution of color LCD technology progresses,those concerned with electronic color imagingcan look forward to brighter, higher contrast dis-plays that exceed the color performance andimage quality of today’s color workstationstandards.
8.4.4 DISPLAY CHARACTERIZATION
The purpose of display characterization is tospecify the relationship between the values thatcontrol the input to the display and the lightemitted by the display (Brainard, 1989; Berns,Gorzynski, and Motta, 1993; Berns, Motta, andGorzynski, 1993. Hence, while the devicephysics of CRTs and transmissive color LCDs arecompletely different, the principles and methodsof display characterization are quite similar(Silverstein, 2000). In this section we describethe principles of characterization of a specificdisplay at a specific point in time, and we pro-vide example measurements.
A digital frame buffer controls most displays.The intensities emitted by the three primariescomprising each pixel are specified by three dig-ital values (R,G,B). The potential scope of acomplete characterization is enormous. Theindustry standard for color applications allocates8 bits of intensity control for each displayprimary and a total of 28 (3) or approximately16.8 million combinations. Multiplied by roughlya million pixels on the screen, and taking intoaccount interactions between pixels, makes itimpossible to perform an exhaustive characteri-zation. Instead, characterizations are alwaysbased on simple models of the device that makepowerful assumptions about the relationshipsbetween the display primaries and the spatialinteractions between pixels.
With respect to color control, the most impor-tant modeling assumption is that the primaryintensities can be controlled independently.Specifically, a control signal to the red primarywill produce the same emission no matter whatstate the green or blue primaries. This assump-tion, primary independence, can and should beempirically verified during characterization. Werecommend working only with display systemsthat satisfy primary independence. A secondimportant assumption is that the SPDs of the dis-play primaries are invariant as their intensitiesare changed. If the SPDs of the primaries changewith intensity level, characterization becomesmore complex. If these two assumptions hold,the characterization task is simplified and only afew dozen measurements need to be made.
There are many other issues that one might beconcerned about in characterization. The spatialand temporal distribution of the signals mayinteract with the primary levels; the display maynot be perfectly stable across time or withtemperature; there can be variations across thesurface of the display or with viewing angle. Ingeneral, complete characterization is not possibleand some assumptions about these effects mustbe made and hopefully evaluated.
In many scientific studies, experiments areoften based on only a small number of stimuli. Insuch cases, it is best to measure each of thestimuli individually. If too large a set of stimuli isused to measure them all, the first question tocheck is primary independence. To evaluateindependence, measure the light emitted by the
DIGITAL COLOR REPRODUCTION ■
299

R primary alone, the G primary alone, and thesum of the R and G primaries (R � G). The sumof the R and G measurements alone shouldequal the measurement of R � G. Then, stimuliwith spatial and temporal configurations similarto the ones that will be used in the experimentsshould be calibrated.
To specify the characterization process, wemust measure the relationship between thedigital control signals (frame buffers), the lightemitted by each of the primaries (primaryspectra and transduction), and the effect thislight will have on the human observer (tristimu-lus and chromaticity values). An excellentreview of the principles and issues of displaycharacterization may be found in (Brainard,1989). A discussion can also be found in(Wandell, 1995, Appendix B) and publicationsfrom the Rochester Institute of Technology(Berns, Gorzynski, and Motta, 1993; Berns,Motta, and Gorzynski, 1993), and CIE technicalreports (CIE, 1996).
8.4.4.1 Frame buffersThe primary roles of the frame buffer are thestorage, conditioning, and output of the videosignals that drive the display device. The industrystandard for color applications allocates 8 bits ofintensity control for each display primary orapproximately 16.8 million discretely address-able colors. The match between the sampledvalues and human color sensitivity is imperfect,however. Consequently, not all displayed colorscan be discriminated from one another, andmany colors that differ by a single bit in theirdigital representation are significantly above thethreshold discriminability of the eye. This resultsin various types of color artifacts, such ascontouring artifacts on shaded graphics. High-quality rendering and other demanding applica-tions, such as psychophysical measurements, canrequire finer (10 or 12 bits) control over theprimary intensity level.
Many of the features of the frame buffer aredetermined by cost considerations, and the pri-mary costs relate to the size and speed of theframe buffer memory. Consider a display systemwith 1280 � 1024 addressable pixel resolutionand each pixel controlled by a 24-bit value. Thissystem requires 4 million bytes of (fast) memoryto represent the frame. An economical alterna-
tive is the lookup table (LUT) architecture. Inthis design, the intensity levels of the primarycolors are controlled by a list of entries in alookup table. Hence, a single number representsthe three voltage levels that control the primaryintensities, say between 0 and 255. At displaytime, the system retrieves the primary valuesfrom the LUT. In this way, each pixel is repre-sented by one 8-bit quantity. While the precisionof intensity control is established by the 8-bitresolution of the digital-to-analog converters(DACs), the number of entries in the LUT limitsthe total number of colors available for simulta-neous display.
One benefit of a LUT design is to reduce imagememory. There are other benefits as well, forcertain types of display conditions. For example,LUTs provide an efficient means for implement-ing image operations that depend only on dis-play value, and not on display position. To alterthe image luminance or contrast one can re-writethe 256 LUT entries rather than the entire imagebuffer. In this way various image processingoperations, spanning the control of drifting andflickering patterns, can be implemented by con-trolling only the LUT.
8.4.4.2 Primary spectra andtransduction
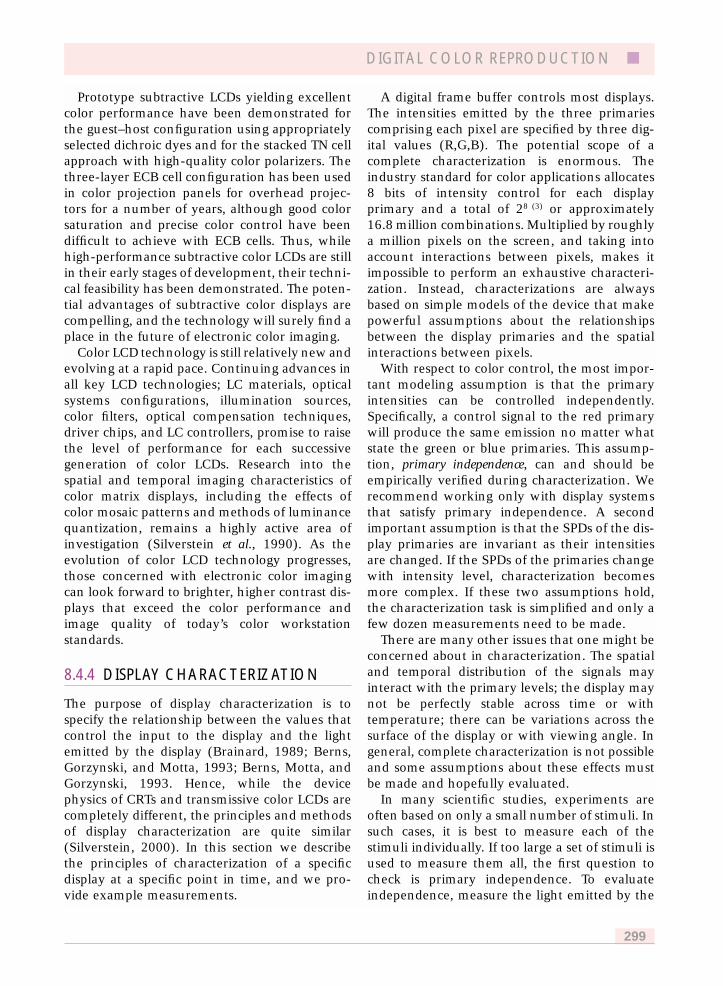
Figure 8.12A shows the SPDs of the primaryphosphor emissions in a modern, high-perform-ance color CRT monitor. The phosphors in thisparticular display were from the P22 family.There are many different phosphors available tomanufacturers. Notice that the red phosphorSPD has several discrete spikes. Such spikes arenot commonly found in nature, and conse-quently the CRT emissions almost never matchthe spectral power distribution found in the orig-inal scene. The color match can only be arrangedbecause of the analysis, based on the color-matching experiment, of the eye’s inability todistinguish between different spectral powerdistributions (metamerism).
Figure 8.12B shows a typical transductionfunction for a CRT. The digital count, shown onthe horizontal axis, is related to the primaryluminance by a nonlinear function. The nonlin-ear relationship is a characteristic of the CRTtube itself, not the surrounding circuitry.Typically, the relationship is close to a power
■ THE SCIENCE OF COLOR
300
function, Luminance � a(Digital count)c � b, orone of a set of other similar equations. Hence,because of the common use of gamma for theexponent, the transduction function is oftencalled a ‘gamma’ curve. The value of the expo-nent differs between displays, but is generallybetween 1.7 and 2.2 for CRT displays, and itsvalue is not under user control. User-controlledknobs manipulate the values of the gain (a) andoffset (b) parameters. Extensive discussions ofthis curve and its implications for imaging can befound in the literature (Poynton, 1996).
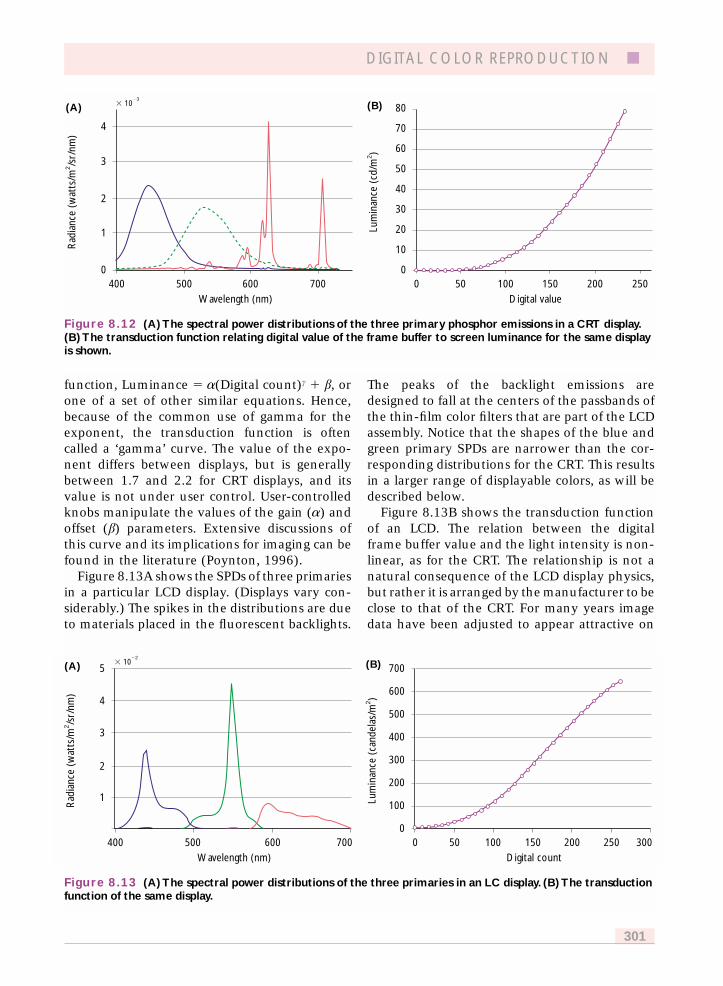
Figure 8.13A shows the SPDs of three primariesin a particular LCD display. (Displays vary con-siderably.) The spikes in the distributions are dueto materials placed in the fluorescent backlights.
The peaks of the backlight emissions aredesigned to fall at the centers of the passbands ofthe thin-film color filters that are part of the LCDassembly. Notice that the shapes of the blue andgreen primary SPDs are narrower than the cor-responding distributions for the CRT. This resultsin a larger range of displayable colors, as will bedescribed below.
Figure 8.13B shows the transduction functionof an LCD. The relation between the digitalframe buffer value and the light intensity is non-linear, as for the CRT. The relationship is not anatural consequence of the LCD display physics,but rather it is arranged by the manufacturer to beclose to that of the CRT. For many years imagedata have been adjusted to appear attractive on
DIGITAL COLOR REPRODUCTION ■
301
Figure 8.12 (A) The spectral power distributions of the three primary phosphor emissions in a CRT display.(B) The transduction function relating digital value of the frame buffer to screen luminance for the same displayis shown.
Rad
ianc
e (w
atts
/m2 /s
r/nm
)
Lum
inan
ce (
cd/m
2 )
Wavelength (nm)
0
1
2
3
4
400 500 600 700Digital value
0
20
30
40
50
60
70
80
10
1500 50 100 200 250
� 10�3
(A) (B)
Figure 8.13 (A) The spectral power distributions of the three primaries in an LC display. (B) The transductionfunction of the same display.
Rad
ianc
e (w
atts
/m2 /s
r/nm
)
Lum
inan
ce (
cand
elas
/m2 )
Wavelength (nm)
1
2
3
4
5
4000
300
200
100
400
500
600
700
600500 700 0 10050 250200150 300Digital count
(A) (B)� 10�2
CRT displays. Were the LCD transduction differ-ent from the CRT function, these images wouldnot appear attractive, and customers would bedissatisfied.
The difference between the CRT and LCDproperties raises the following question: Howcan one be sure that image data will appear asintended without knowing the display? Anindustry consortium, the International ColorConsortium (ICC), has worked on proposals tosolve this problem. The ICC recommends a solu-tion in which display device characteristics arerepresented in a device profile file. Software man-ufacturers are urged to include routines thatread and interpret the device profile. Hardwaremanufacturers and third-party vendors areurged to provide enough characterization data topermit accurate color rendering. The device pro-file is based on the CIE system (e.g., tristimuluscoordinates or CIELAB coordinates) and severalbasic operators. Detail about these proposals,which continue to evolve, is available at<http://www.color.org>.
8.4.4.3 Tristimulus and chromaticityvalues
For most applications, it is not necessary to knowthe complete SPD of light emitted from a display.Rather, it is enough to know the effect of thislight on the human cones. Usually, this is speci-fied using CIE standard tristimulus coordinates.There are three major sets of color-matchingfunctions (CMFs) used in display colorimetry(Wyszecki and Stiles, 1982). First, the CIE 19312 standard observer CMFs, which are appropri-ate for the calculation of tristimulus values whencolor fields spanning less than 4 are used.Second, the CIE 1964 10 degree supplementarystandard observer CMFs, which are appropriatefor color fields > 4 and reflect the shift towardincreased short-wavelength sensitivity for largecolor fields. Finally, the Judd modification of theCIE 1931 2 CMFs correct for underestimates ofthe short-wavelength photopic sensitivity (i.e.,< 460 nm) for the original 1931 CMFs. This lastset of CMFs are important in basic color visionresearch and are the basis for a number of lineartransformations to the cone absorption curves.They also serve as the basis for the CIE 1988 2supplementary luminous efficiency function forphotopic vision (CIE, 1990).
The tristimulus values of the three primarycolor phosphor emissions can be computed fromthe color rendering equation described in section8.2.1. Suppose that the columns of the matrix Ccontain the color matching functions and thecolumns of the matrix P contain the spectralpower distributions of the three primary lights atmaximum intensity. The tristimulus coordinatesof the three primaries are contained in thecolumns of the matrix product CtP. To predictthe tristimulus coordinates of a light emittedwhen the frame buffer values are v’ � (r’,g’,b’),first correct for the nonlinear transduction func-tion, Fi( ). This produces three linear primary in-tensity values, v � (r,g,b) � (Fr(r), Fg(g), Fb (b)).The tristimulus coordinates, c, are c � CtPv.To find the frame buffer values that will displaya given set of tristimulus coordinates, c, invertthe calculation to find v � (CtP)-1 c and thenapply the inverse of the transduction value toobtain v’. If the resulting values are negative orexceed the maximum intensity of one of the pri-maries, the desired color is called out of gamut.
The tristimulus calculations specify the part ofthe emitted light that is visible to the humanobserver. Two lights presented in the same con-text that have the same visible components willhave the same color appearance. Even two lightswith the same spectral power distribution mayappear different when presented in differentcontexts (see Chapter 3).
It is common to express the tristimulus coordi-nates in a form that captures separately theluminance and color of the signal. To do this, thevalues (X,Y,Z), are converted to the form (Y,x,y)� (Y,X/(X � Y � Z), Y/(X � Y � Z)). The Y valueis luminance and the values, (x,y), are chromatic-ity coordinates. These coordinates are invariantwith the intensity of the signal. Doubling theintensity of a light doubles its Y (luminance)value, but leaves the (x,y) chromaticity coordi-nates unchanged.
The three pairs of chromaticity coordinates(one pair for each primary) define the range ofcolors that can be produced by the display.Figure 8.14 shows the chromaticity coordinatesof each of the three primaries in a CRT display(panel A) and an LCD display (panel B). The tri-angle that connects these three points definesthe device color gamut. The gamut represents therange of colors that can be displayed by the
■ THE SCIENCE OF COLOR
302

device. The smooth curve on the graph denotesthe chromaticity coordinates of spectral lights.This curve is called the spectrum locus and all
lights must have chromaticity coordinates withinthis area.
The color gamut of LCDs can be made largerthan that of CRTs. This is because the choice ofbacklights and thin film color filters in LCDsoffer display designers additional degrees of free-dom, including primaries with narrower spectraldistributions that fall closer to the spectrumlocus than the broadband phosphors in CRTs.The difference in color gamuts between devicesposes a problem for color reproduction. Supposethat an image is designed on an LCD, but wewish to display it on a CRT. It may be impossibleto reproduce a light with the same tristimuluscoordinates. This is called the gamut-mappingproblem. How to compensate for mismatches inthe gamut between display devices or betweendisplays and printers is an active area of research.
Although direct-view LCDs are generallybrighter and can have larger gamuts than CRTs,they do have one significant problem. A verydesirable feature of a display is that scaling thedigital counts of the frame buffer should pre-serve the chromaticity coordinates. Perhaps themost important values to preserve (for customersatisfaction) are the gray series, comprised of thedigital values, say (10,10,10), (20,20,20) and soforth. Figure 8.14C shows the spectral power dis-tribution of an LCD at a series of gray values. Thechromaticity values of a gray series are shown inthe center of the panels (A) and (B) for the CRTand LCD. The chromaticity shifts are muchlarger for the LCD than the CRT. This is causedby a change in the SPD passed by the liquid crys-tal layer and the polarizers. Panel (C) shows theSPD of the gray series at several mean levels.Were the SPDs invariant with level, the curveswould be shifted copies of one another on thislog radiance axis. The curves are not shiftedcopies, and notice that there are significantdifferences in the spacing in the long- andshort-wavelength regions compared to themiddle-wavelength regions. These differencesoccur because the LC polarization is not preciselythe same for all wavelengths and also as a resultof spectral variations in polarizer extinction. Forthe viewer, this results in a shift in display chro-maticity of the primaries when they are pre-sented at different intensity levels. It is possibleto compensate for these changes using algo-rithms described by Spiegle and Brainard (1999).
DIGITAL COLOR REPRODUCTION ■
303
Figure 8.14 The color gamuts of (A) a CRT displayand (B) an LC display plotted in the (x,y)-chromaticitydiagram.The chromaticity coordinates of a series ofgrays are shown as the points in the middle of thegraphs. (C) The spectral power distribution of theLCD gray series.
y
x
0.2
0.4
0.6
0.8
0 0.2 0.4 0.6 0.8
(A)
y
0.2
0.4
0.6
0.8
0 0.2 0.4 0.6 0.8x
(B)
Rad
ianc
e (w
atts
/m2 /s
r/nm
)
Wavelength (nm)
0.001
0.003
0.01
0.03
0.1
400 500 600 700
(C)
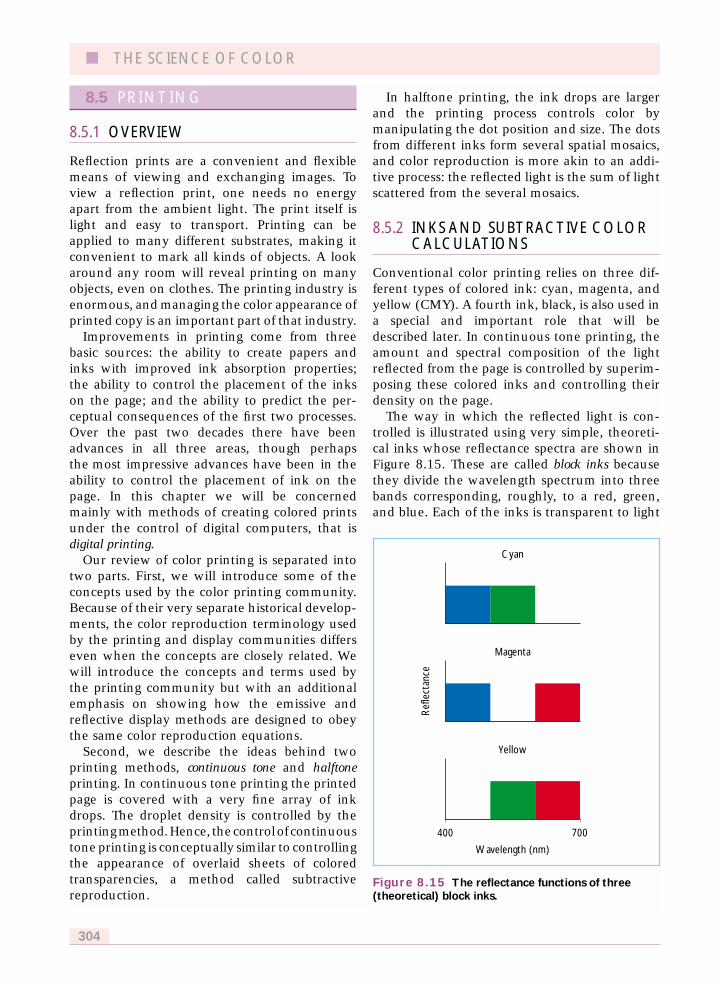
8.5 PRINTING
8.5.1 OVERVIEW
Reflection prints are a convenient and flexiblemeans of viewing and exchanging images. Toview a reflection print, one needs no energyapart from the ambient light. The print itself islight and easy to transport. Printing can beapplied to many different substrates, making itconvenient to mark all kinds of objects. A lookaround any room will reveal printing on manyobjects, even on clothes. The printing industry isenormous, and managing the color appearance ofprinted copy is an important part of that industry.
Improvements in printing come from threebasic sources: the ability to create papers andinks with improved ink absorption properties;the ability to control the placement of the inkson the page; and the ability to predict the per-ceptual consequences of the first two processes.Over the past two decades there have beenadvances in all three areas, though perhapsthe most impressive advances have been in theability to control the placement of ink on thepage. In this chapter we will be concernedmainly with methods of creating colored printsunder the control of digital computers, that isdigital printing.
Our review of color printing is separated intotwo parts. First, we will introduce some of theconcepts used by the color printing community.Because of their very separate historical develop-ments, the color reproduction terminology usedby the printing and display communities differseven when the concepts are closely related. Wewill introduce the concepts and terms used bythe printing community but with an additionalemphasis on showing how the emissive andreflective display methods are designed to obeythe same color reproduction equations.
Second, we describe the ideas behind twoprinting methods, continuous tone and halftoneprinting. In continuous tone printing the printedpage is covered with a very fine array of inkdrops. The droplet density is controlled by theprintingmethod.Hence, thecontrolof continuoustone printing is conceptually similar to controllingthe appearance of overlaid sheets of coloredtransparencies, a method called subtractivereproduction.
In halftone printing, the ink drops are largerand the printing process controls color bymanipulating the dot position and size. The dotsfrom different inks form several spatial mosaics,and color reproduction is more akin to an addi-tive process: the reflected light is the sum of lightscattered from the several mosaics.
8.5.2 INKS AND SUBTRACTIVE COLORCALCULATIONS
Conventional color printing relies on three dif-ferent types of colored ink: cyan, magenta, andyellow (CMY). A fourth ink, black, is also used ina special and important role that will bedescribed later. In continuous tone printing, theamount and spectral composition of the lightreflected from the page is controlled by superim-posing these colored inks and controlling theirdensity on the page.
The way in which the reflected light is con-trolled is illustrated using very simple, theoreti-cal inks whose reflectance spectra are shown inFigure 8.15. These are called block inks becausethey divide the wavelength spectrum into threebands corresponding, roughly, to a red, green,and blue. Each of the inks is transparent to light
■ THE SCIENCE OF COLOR
304
Figure 8.15 The reflectance functions of three(theoretical) block inks.
Ref
lect
ance
Wavelength (nm)
Yellow
400 700
Magenta
Cyan

in two block regions, while absorbing light in athird block region. The inks take their namesfrom the two regions in which they do notabsorb. The cyan ink does not absorb in the blueand green bands, the magenta does not absorb inthe red and blue, and the yellow does not absorbin the red and green.
The amount of light absorbed by ink is con-trolled by the amount of ink on the page. If avery thin layer of, say, cyan ink is placed downon white paper a small amount of the longwavelengths will be absorbed; the page willappear mainly white. If a great deal of cyan inkis placed on the page, a great deal of the long-wavelength region will be absorbed and the inkwill take on its characteristic cyan appearance.Seen from this perspective, controlling theamount of the ink on the page is analogous tocontrolling the intensity of a display primary.
8.5.2.1 DensityTo control any display technology, it is necessaryto understand the relationship between the con-trol variables and their action on the light arriv-ing at the observer’s eye. To understand thereflected light in the continuous tone process,we must predict the effect of altering the amountof ink on the page and the consequence ofsuperimposing inks.
Suppose we place a very thin layer of ink, ofthickness , on a piece of paper. The probabilitythat a monochromatic ray of light, at wavelengthk, will be absorbed by the ink is proportional to
the thickness of the layer, a(k). Next, considerwhat will happen when the thickness of the inkis increased. Figure 8.16 shows some possiblelight paths as ambient light passes through theink and is scattered towards an observer.Imagine that the average optical path length,including both passage towards the white pageand passage back towards the eye, is D. Dividethis path into N thin layers, each of thickness � D/N. The absorption process follows the pro-portionality law within each thin layer. Conse-quently the chance that a ray will be reflectedafter traversing the entire optical path, D, isequal to the chance that it is not absorbed in anyof the thin N layers, namely (1 � a(�))N. As thethickness is subdivided into more layers, N, theprobability of absorption is expressed as Beer’slaw:
Dlim �1 � a(k) �N
� e�Da(k) (8.2)n→ N
The proportion of reflected light depends onthe optical path length, D, which is controlled bythe amount of ink placed on the page. As Dincreases, the fraction of light reflected becomeszero (unless a(k) � 0). The constant of propor-tionality, a(k), is the absorption function of the ink.
Conventionally, the ink is described using byan optical density function od(k) � � log
10(a(k)).
From equation 8.2 we find that optical density isproportional to the thickness,
od(�) � 2.3Da(�) (8.3)
DIGITAL COLOR REPRODUCTION ■
305
Figure 8.16 The scattered reflection from a layer of ink includes rays with different path lengths.Consequently, accurate prediction of the reflected light is a theoretically challenging problem.
Incident light Interface reflection
Body reflection
Paper
Ink
Colorant particles

Moreover, the optical density of two inks thatare superimposed to form a single layer shouldadd. Suppose the absorption functions of theinks are a
i(k). Then probability of absorption
after traversing through the two layers is theproduct of the individual absorption functions,P
i�1,2(1 � a
i(k)). Since the absorption probabilities
multiply, the optical densities add:
od(�) � log10[ P
i�1,2(1 � a
i(k))] � od
1(�) � od
2(�)
(8.4)
Equation 8.4 shows that when two inks areoverlaid there is a linear relationship betweendensity and the control variable (density of col-orant in the ink) and the optical density. This isthe key reason why it is convenient to use opti-cal density, rather than reflectance, in describinginks. In meeting the requirements of the colorreproduction equations, however, the observersees the reflected light and the observer’s coneabsorptions must be predicted. The nonlinearrelationship between the control variable (inkdensity) and the light absorption by the cones issignificantly more complex than the parallelnonlinear relationship between frame bufferintensity and cone absorptions that must beaddressed in display technology. In displays, thespectral shape of the phosphors does not changea great deal with level. In the case of ink reflec-tions, however, the spectral reflectance functionchanges considerably with density level. Thuspredicting and controlling the light signal inprinting is a much more difficult computationalchallenge.
8.5.3 CONTINUOUS TONE PRINTING
The physical principles described above are onlya general overview of the reflection process; theydo not capture many of the details necessary tomake a precise prediction of the properties ofcolor prints. In practice, a number of factors arisethat make the predictions based on these verysimple calculations inaccurate. Figure 8.16 showsone aspect of the reflection process that we haveomitted: the light that is scattered to theobserver’s eye from a single point on the pagemay have traversed one of many different opti-cal paths. The optical path will depend on theviewing geometry and on microscopic details of
the paper and surrounding inks. Hence, comput-ing the true optical path is very difficult and thecalculations we have reviewed only serve as afirst order approximation to the true reflection.
Finally, there are a great many limitations onthe inks that can be used. Many perfectly goodinks are destroyed by exposure to the humanenvironment and conversely perfectly goodhumans are destroyed by exposure to the ink’senvironment. Consequently, the supply of possi-ble inks is limited and none is very close to thetheoretical block inks. In addition, for all butthe theoretical block inks, the shape of thereflectance function varies with density. Figure8.17A shows the reflectance functions of fourinks in a modern printer. The real inks overlap intheir spectral reflection and absorption regions,unlike the perfect block inks. Panel (B) showshow the reflectance function of the magenta pri-mary varies as a function of ink density. Noticethat unlike the ideal block inks, the reflectancein both the short and middle wavelengthschange as the magenta density varies.
The overlap in the absorption functions of theinks and the change in reflectance as a functionof density make characterization calculationsvery difficult. We describe some of the basicmethods later in this section. In addition, thereare a great many ingenious efforts to under-stand and control such effects in order to makeattractive prints. An excellent overview of thesetechnologies, and many of the technologiesdescribed in this chapter, can be found in R.W.Hunt’s book The Reproduction of Colour (Hunt,1987).
Finally, we conclude with a discussion of thevery important role of the black ink in printing.To form a black or gray color using the CMY inksrequires mixing all three together. These inks aregenerally very expensive, and even worse, com-bining the three inks results in a very wet pieceof paper. To reduce cost and to reduce bleedingwithin the paper, it is very effective to replace anequal mixture of the three colored inks with asingle black ink in the appropriate density. Thespecific implementation of this will depend onthe paper, colored inks, and black ink. Theprocesses for substituting black ink for the coloredinks are called gray component removal (GCR) orundercolor removal (UCR). Often, this process alsoimproves the appearance of the print because
■ THE SCIENCE OF COLOR
306
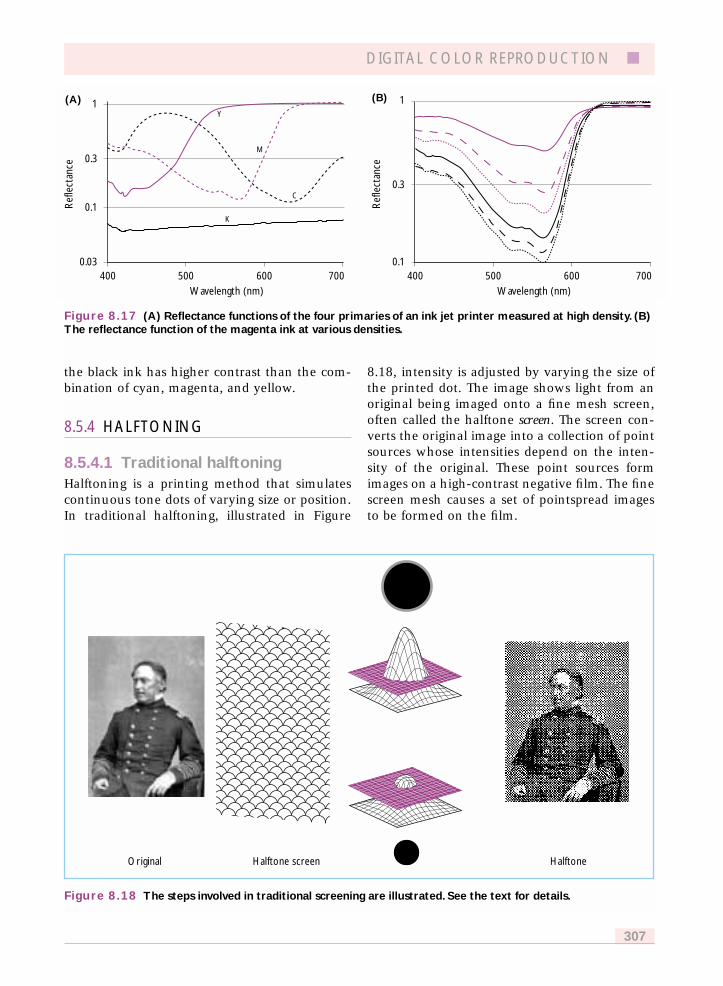
the black ink has higher contrast than the com-bination of cyan, magenta, and yellow.
8.5.4 HALFTONING
8.5.4.1 Traditional halftoningHalftoning is a printing method that simulatescontinuous tone dots of varying size or position.In traditional halftoning, illustrated in Figure
8.18, intensity is adjusted by varying the size ofthe printed dot. The image shows light from anoriginal being imaged onto a fine mesh screen,often called the halftone screen. The screen con-verts the original image into a collection of pointsources whose intensities depend on the inten-sity of the original. These point sources formimages on a high-contrast negative film. The finescreen mesh causes a set of pointspread imagesto be formed on the film.
DIGITAL COLOR REPRODUCTION ■
307
Figure 8.17 (A) Reflectance functions of the four primaries of an ink jet printer measured at high density. (B)The reflectance function of the magenta ink at various densities.
Ref
lect
ance
Ref
lect
ance
Wavelength (nm)
0.03
0.1
0.3
1
700400 500 600Wavelength (nm)
0.1
0.3
1
700400 500 600
(A) (B)Y
M
K
C
Figure 8.18 The steps involved in traditional screening are illustrated. See the text for details.
Original Halftone screen Halftone
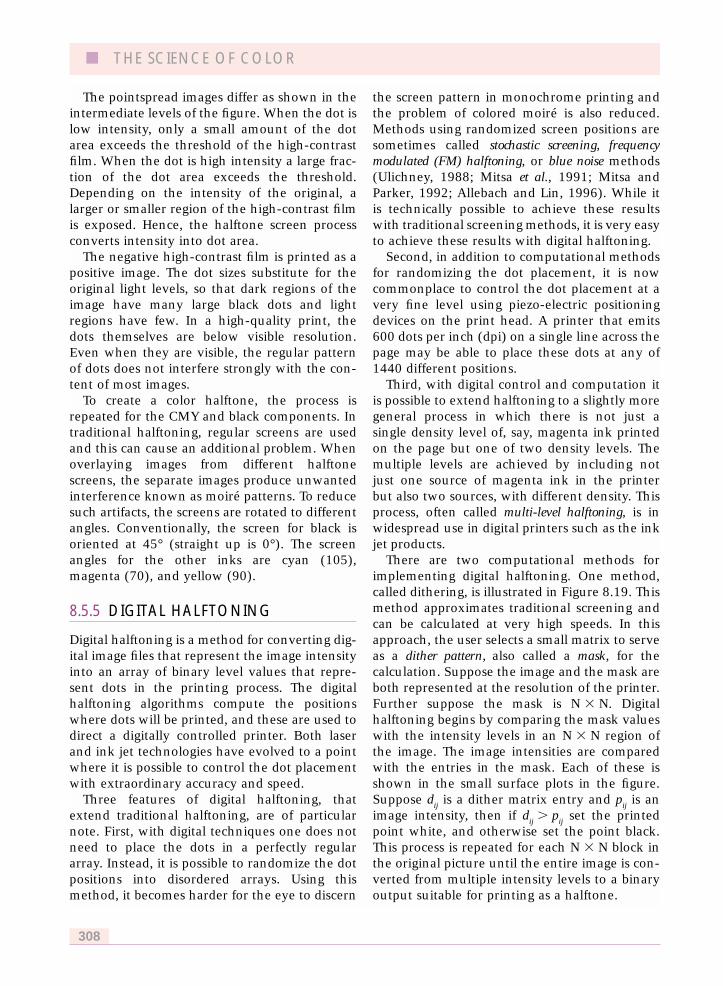
The pointspread images differ as shown in theintermediate levels of the figure. When the dot islow intensity, only a small amount of the dotarea exceeds the threshold of the high-contrastfilm. When the dot is high intensity a large frac-tion of the dot area exceeds the threshold.Depending on the intensity of the original, alarger or smaller region of the high-contrast filmis exposed. Hence, the halftone screen processconverts intensity into dot area.
The negative high-contrast film is printed as apositive image. The dot sizes substitute for theoriginal light levels, so that dark regions of theimage have many large black dots and lightregions have few. In a high-quality print, thedots themselves are below visible resolution.Even when they are visible, the regular patternof dots does not interfere strongly with the con-tent of most images.
To create a color halftone, the process isrepeated for the CMY and black components. Intraditional halftoning, regular screens are usedand this can cause an additional problem. Whenoverlaying images from different halftonescreens, the separate images produce unwantedinterference known as moiré patterns. To reducesuch artifacts, the screens are rotated to differentangles. Conventionally, the screen for black isoriented at 45° (straight up is 0°). The screenangles for the other inks are cyan (105),magenta (70), and yellow (90).
8.5.5 DIGITAL HALFTONING
Digital halftoning is a method for converting dig-ital image files that represent the image intensityinto an array of binary level values that repre-sent dots in the printing process. The digitalhalftoning algorithms compute the positionswhere dots will be printed, and these are used todirect a digitally controlled printer. Both laserand ink jet technologies have evolved to a pointwhere it is possible to control the dot placementwith extraordinary accuracy and speed.
Three features of digital halftoning, thatextend traditional halftoning, are of particularnote. First, with digital techniques one does notneed to place the dots in a perfectly regulararray. Instead, it is possible to randomize the dotpositions into disordered arrays. Using thismethod, it becomes harder for the eye to discern
the screen pattern in monochrome printing andthe problem of colored moiré is also reduced.Methods using randomized screen positions aresometimes called stochastic screening, frequencymodulated (FM) halftoning, or blue noise methods(Ulichney, 1988; Mitsa et al., 1991; Mitsa andParker, 1992; Allebach and Lin, 1996). While itis technically possible to achieve these resultswith traditional screening methods, it is very easyto achieve these results with digital halftoning.
Second, in addition to computational methodsfor randomizing the dot placement, it is nowcommonplace to control the dot placement at avery fine level using piezo-electric positioningdevices on the print head. A printer that emits600 dots per inch (dpi) on a single line across thepage may be able to place these dots at any of1440 different positions.
Third, with digital control and computation itis possible to extend halftoning to a slightly moregeneral process in which there is not just asingle density level of, say, magenta ink printedon the page but one of two density levels. Themultiple levels are achieved by including notjust one source of magenta ink in the printerbut also two sources, with different density. Thisprocess, often called multi-level halftoning, is inwidespread use in digital printers such as the inkjet products.
There are two computational methods forimplementing digital halftoning. One method,called dithering, is illustrated in Figure 8.19. Thismethod approximates traditional screening andcan be calculated at very high speeds. In thisapproach, the user selects a small matrix to serveas a dither pattern, also called a mask, for thecalculation. Suppose the image and the mask areboth represented at the resolution of the printer.Further suppose the mask is N � N. Digitalhalftoning begins by comparing the mask valueswith the intensity levels in an N � N region ofthe image. The image intensities are comparedwith the entries in the mask. Each of these isshown in the small surface plots in the figure.Suppose d
ijis a dither matrix entry and p
ijis an
image intensity, then if dij
� pij
set the printedpoint white, and otherwise set the point black.This process is repeated for each N � N block inthe original picture until the entire image is con-verted from multiple intensity levels to a binaryoutput suitable for printing as a halftone.
■ THE SCIENCE OF COLOR
308
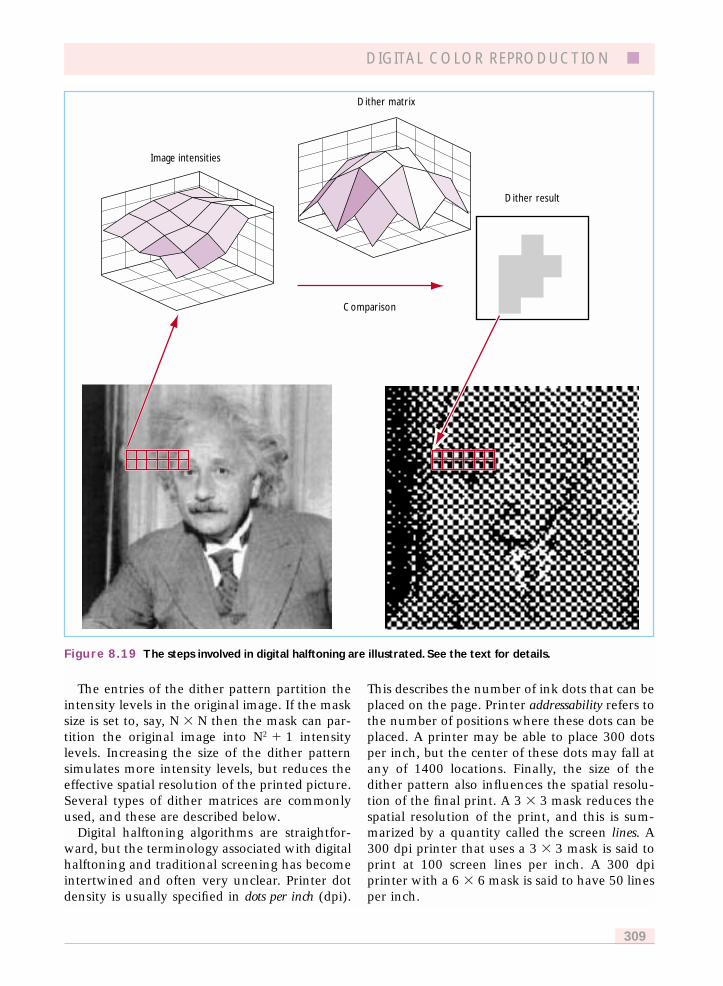
The entries of the dither pattern partition theintensity levels in the original image. If the masksize is set to, say, N � N then the mask can par-tition the original image into N2 � 1 intensitylevels. Increasing the size of the dither patternsimulates more intensity levels, but reduces theeffective spatial resolution of the printed picture.Several types of dither matrices are commonlyused, and these are described below.
Digital halftoning algorithms are straightfor-ward, but the terminology associated with digitalhalftoning and traditional screening has becomeintertwined and often very unclear. Printer dotdensity is usually specified in dots per inch (dpi).
This describes the number of ink dots that can beplaced on the page. Printer addressability refers tothe number of positions where these dots can beplaced. A printer may be able to place 300 dotsper inch, but the center of these dots may fall atany of 1400 locations. Finally, the size of thedither pattern also influences the spatial resolu-tion of the final print. A 3 � 3 mask reduces thespatial resolution of the print, and this is sum-marized by a quantity called the screen lines. A300 dpi printer that uses a 3 � 3 mask is said toprint at 100 screen lines per inch. A 300 dpiprinter with a 6 � 6 mask is said to have 50 linesper inch.
DIGITAL COLOR REPRODUCTION ■
309
Figure 8.19 The steps involved in digital halftoning are illustrated. See the text for details.
Comparison
Image intensities
Dither matrix
Dither result

8.5.5.1 Cluster dot ditherThe cluster dot or ordered dither mask is designedto be similar to traditional screening. An exampleof a 5 � 5 dither pattern for a cluster dot is:
1 9 16 8 710 17 21 20 15
255� 2 22 25 24 6 � � �11 18 23 19 14
26
3 12 4 13 5
Consider the results of comparing this mask withuniform intensity patterns ranging from 0 to255. The mask has twenty-five entries and canpartition the input regions into 26 differentlevels. When the image intensity is very low(�255/26), all of the points are set black. As theimage intensity increases the size of the dotshrinks, so that at a value just less than25*(255/26) only a single dot is left in the middle.
A variant of this mask is shown in Figure8.20A. While basically a cluster dot, the thresh-
olds in the mask are arranged so that the growthin dot size occurs on a diagonal pattern. This hasthe effect of arranging the dots to fall on the 45°line, as in traditional screening. The result ofapplying this mask to an image is illustrated inFigure 8.20B.
8.5.5.2 Bayer dither and void andcluster dither
The Bayer (Bayer, 1973) dither pattern repre-sented an early and important innovation thatshowed how digital halftoning might improveon traditional screening. The Bayer dither patternwas chosen so that the spatial structure of theprinted dots would be less visible than theordered dither dots. Figure 8.21A shows the resultof applying an 8 � 8 Bayer dither mask to animage. The Bayer output compares favorablywith the results of applying a traditional screen-ing pattern, this time using an 8 � 8 digitaldither pattern structured to give dots along the45° diagonal (see Figure 8.20B).
■ THE SCIENCE OF COLOR
310
Figure 8.20 Cluster dot halftoning is illustrated.The dot masks are shown in (A).The result of applying thesemasks to an image is shown in (B).
60 56 52 48
44 40 36 32
28 24 20 16
12 8 4
002
24 46 6
8
10203040506070
(B)(A)
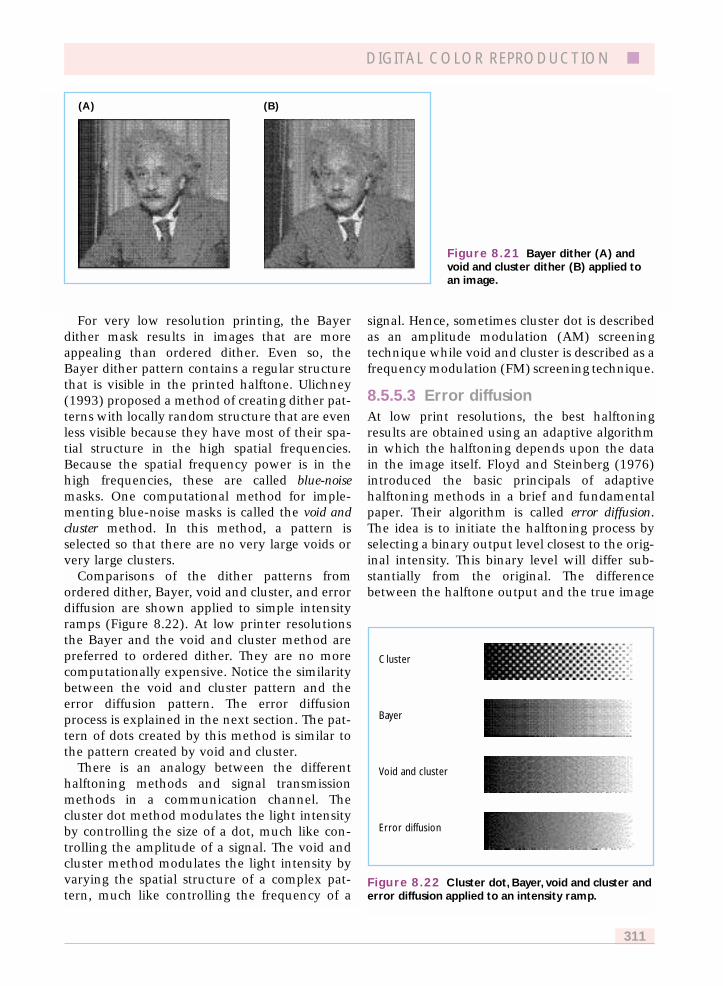
For very low resolution printing, the Bayerdither mask results in images that are moreappealing than ordered dither. Even so, theBayer dither pattern contains a regular structurethat is visible in the printed halftone. Ulichney(1993) proposed a method of creating dither pat-terns with locally random structure that are evenless visible because they have most of their spa-tial structure in the high spatial frequencies.Because the spatial frequency power is in thehigh frequencies, these are called blue-noisemasks. One computational method for imple-menting blue-noise masks is called the void andcluster method. In this method, a pattern isselected so that there are no very large voids orvery large clusters.
Comparisons of the dither patterns fromordered dither, Bayer, void and cluster, and errordiffusion are shown applied to simple intensityramps (Figure 8.22). At low printer resolutionsthe Bayer and the void and cluster method arepreferred to ordered dither. They are no morecomputationally expensive. Notice the similaritybetween the void and cluster pattern and theerror diffusion pattern. The error diffusionprocess is explained in the next section. The pat-tern of dots created by this method is similar tothe pattern created by void and cluster.
There is an analogy between the differenthalftoning methods and signal transmissionmethods in a communication channel. Thecluster dot method modulates the light intensityby controlling the size of a dot, much like con-trolling the amplitude of a signal. The void andcluster method modulates the light intensity byvarying the spatial structure of a complex pat-tern, much like controlling the frequency of a
signal. Hence, sometimes cluster dot is describedas an amplitude modulation (AM) screeningtechnique while void and cluster is described as afrequency modulation (FM) screening technique.
8.5.5.3 Error diffusionAt low print resolutions, the best halftoningresults are obtained using an adaptive algorithmin which the halftoning depends upon the datain the image itself. Floyd and Steinberg (1976)introduced the basic principals of adaptivehalftoning methods in a brief and fundamentalpaper. Their algorithm is called error diffusion.The idea is to initiate the halftoning process byselecting a binary output level closest to the orig-inal intensity. This binary level will differ sub-stantially from the original. The differencebetween the halftone output and the true image
DIGITAL COLOR REPRODUCTION ■
311
(A) (B)
Figure 8.21 Bayer dither (A) andvoid and cluster dither (B) applied toan image.
Figure 8.22 Cluster dot, Bayer, void and cluster anderror diffusion applied to an intensity ramp.
Cluster
Bayer
Void and cluster
Error diffusion
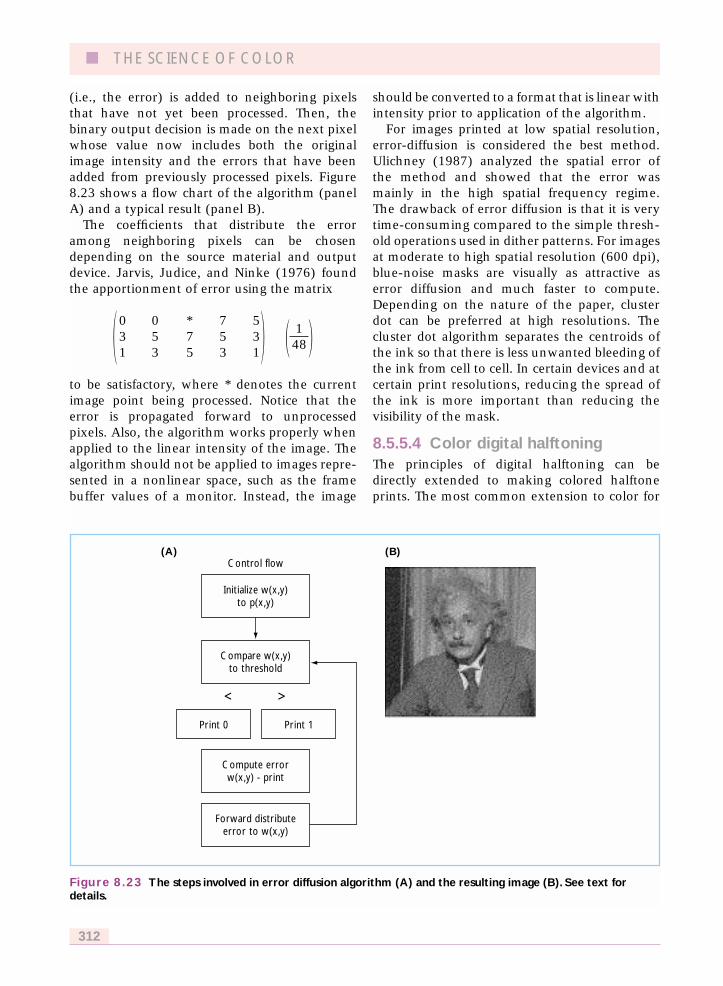
(i.e., the error) is added to neighboring pixelsthat have not yet been processed. Then, thebinary output decision is made on the next pixelwhose value now includes both the originalimage intensity and the errors that have beenadded from previously processed pixels. Figure8.23 shows a flow chart of the algorithm (panelA) and a typical result (panel B).
The coefficients that distribute the erroramong neighboring pixels can be chosendepending on the source material and outputdevice. Jarvis, Judice, and Ninke (1976) foundthe apportionment of error using the matrix
0 0 * 7 5 1�3 5 7 5 3� � �
1 3 5 3 1 48
to be satisfactory, where * denotes the currentimage point being processed. Notice that theerror is propagated forward to unprocessedpixels. Also, the algorithm works properly whenapplied to the linear intensity of the image. Thealgorithm should not be applied to images repre-sented in a nonlinear space, such as the framebuffer values of a monitor. Instead, the image
should be converted to a format that is linear withintensity prior to application of the algorithm.
For images printed at low spatial resolution,error-diffusion is considered the best method.Ulichney (1987) analyzed the spatial error ofthe method and showed that the error wasmainly in the high spatial frequency regime.The drawback of error diffusion is that it is verytime-consuming compared to the simple thresh-old operations used in dither patterns. For imagesat moderate to high spatial resolution (600 dpi),blue-noise masks are visually as attractive aserror diffusion and much faster to compute.Depending on the nature of the paper, clusterdot can be preferred at high resolutions. Thecluster dot algorithm separates the centroids ofthe ink so that there is less unwanted bleeding ofthe ink from cell to cell. In certain devices and atcertain print resolutions, reducing the spread ofthe ink is more important than reducing thevisibility of the mask.
8.5.5.4 Color digital halftoningThe principles of digital halftoning can bedirectly extended to making colored halftoneprints. The most common extension to color for
■ THE SCIENCE OF COLOR
312
Figure 8.23 The steps involved in error diffusion algorithm (A) and the resulting image (B). See text fordetails.
(A) (B)
Initialize w(x,y)to p(x,y)
Control flow
Print 0 Print 1
Compare w(x,y)to threshold
Compute errorw(x,y) - print
Forward distributeerror to w(x,y)
< >
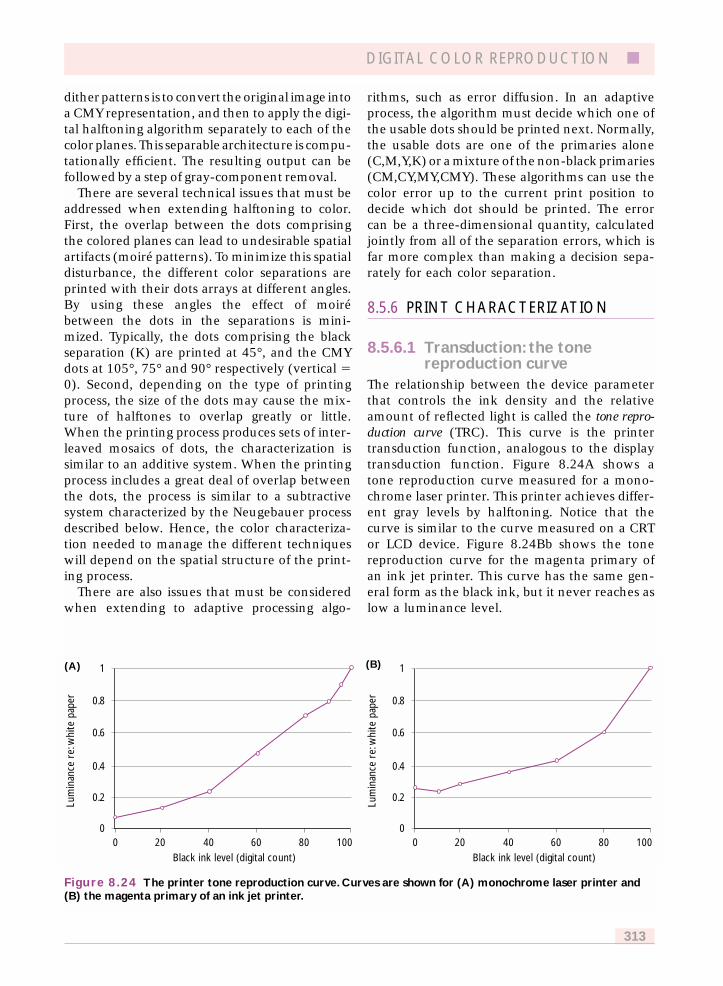
dither patterns is to convert the original image intoa CMY representation, and then to apply the digi-tal halftoning algorithm separately to each of thecolor planes. This separable architecture is compu-tationally efficient. The resulting output can befollowed by a step of gray-component removal.
There are several technical issues that must beaddressed when extending halftoning to color.First, the overlap between the dots comprisingthe colored planes can lead to undesirable spatialartifacts (moiré patterns). To minimize this spatialdisturbance, the different color separations areprinted with their dots arrays at different angles.By using these angles the effect of moirébetween the dots in the separations is mini-mized. Typically, the dots comprising the blackseparation (K) are printed at 45°, and the CMYdots at 105°, 75° and 90° respectively (vertical �0). Second, depending on the type of printingprocess, the size of the dots may cause the mix-ture of halftones to overlap greatly or little.When the printing process produces sets of inter-leaved mosaics of dots, the characterization issimilar to an additive system. When the printingprocess includes a great deal of overlap betweenthe dots, the process is similar to a subtractivesystem characterized by the Neugebauer processdescribed below. Hence, the color characteriza-tion needed to manage the different techniqueswill depend on the spatial structure of the print-ing process.
There are also issues that must be consideredwhen extending to adaptive processing algo-
rithms, such as error diffusion. In an adaptiveprocess, the algorithm must decide which one ofthe usable dots should be printed next. Normally,the usable dots are one of the primaries alone(C,M,Y,K) or a mixture of the non-black primaries(CM,CY,MY,CMY). These algorithms can use thecolor error up to the current print position todecide which dot should be printed. The errorcan be a three-dimensional quantity, calculatedjointly from all of the separation errors, which isfar more complex than making a decision sepa-rately for each color separation.
8.5.6 PRINT CHARACTERIZATION
8.5.6.1 Transduction: the tonereproduction curve
The relationship between the device parameterthat controls the ink density and the relativeamount of reflected light is called the tone repro-duction curve (TRC). This curve is the printertransduction function, analogous to the displaytransduction function. Figure 8.24A shows atone reproduction curve measured for a mono-chrome laser printer. This printer achieves differ-ent gray levels by halftoning. Notice that thecurve is similar to the curve measured on a CRTor LCD device. Figure 8.24Bb shows the tonereproduction curve for the magenta primary ofan ink jet printer. This curve has the same gen-eral form as the black ink, but it never reaches aslow a luminance level.
DIGITAL COLOR REPRODUCTION ■
313
Figure 8.24 The printer tone reproduction curve. Curves are shown for (A) monochrome laser printer and(B) the magenta primary of an ink jet printer.
Lum
inan
ce r
e: w
hite
pap
er
Lum
inan
ce r
e: w
hite
pap
er
Black ink level (digital count)
0
0.2
0.4
0.6
0.8
1
00
0.2
0.4
0.6
0.8
1
4020 8060 100 0 4020 8060 100Black ink level (digital count)
(A) (B)
The TRC is a fundamental measurement ofprinter performance. For two reasons, however,the TRC cannot be combined easily with the inkprimary reflectance functions to predict reflectedlight or solve the color-reproduction equation.First, the reflectance functions of the CMYKprimaries do not combine additively. Overprint-ing inks and blending of the ink spots can causelight to follow optical paths whose spectraltransmission is very complicated to predict.Second, even for pure ink, Beer’s law (equation8.4) shows that the ink reflectance functionvaries with density. Consequently, the tristimulusvalues of the reflected light will vary withdensity, making it impossible to use the simpleprinciples that are applied to monitor character-ization. Specifically, ink mixtures do not followthe rules of primary independence that areessential to the simple characterization of displaydevices.
An influential theory for predicting inkreflectance functions was provided by the bril-liant color engineer Neugebauer (1937). Theidea introduced in the Neugebauer equations isbased on the following physical intuition.Imagine partitioning the printed page intoextremely small areas over which each regioncontains only an infinitesimal (binary) amountof ink. At this spatial scale, we will find onlyeight possible combinations of ink (C,M,Y,CM,CY,MY,K); other combinations are eliminatedbecause K combined with anything is equivalentto K. Any small region will contain many ofthese infinitesimal dots, and the reflectancefunction of the small region will be a weightedsum of these eight basic terms. The weights willdepend on the area allocated to the infinitesimaldots, and any small region is predicted to have areflectance function that is the weighted sum ofeight possible basis terms. Predicting these basisterms from the ink primaries, and then predict-ing the ink reflectance functions is the mainapplication of the theory. Practical difficulties incompensating for scatter into the paper andcomplicated light paths represent a continuingchallenge to the theory, which continues to bean active area of investigation. For a modernupdate the reader may wish to consult the specialsymposium on this topic (Neugebauer, 1989).
Because of the difficulties in predicting the inkreflectance functions from first principles, printer
characterization methods mainly rely on the useof extensive lookup tables. These tables arebased on measurements of the tristimulus valuesmeasured from a variety of print samples on avariety of paper types. Tetrahedral lookup tablesare often used for this purpose.
8.6 KEY WORDS
Color, displays, image capture, digital cameras,printing, scanning, LCD.
8.7 CONCLUSIONS
Color imaging technologies are central to manyfeatures of modern-day life. The breadth andvitality of the industry that creates these tech-nologies is extraordinary. In reviewing a smallpart of these technologies, we have tried toexplain how knowledge of the human visualsystem plays an important role in many designdecisions. The widespread use of tristimuluscoordinates for characterization represents onemajor contribution of vision science to imagingtechnology. Understanding when spatial andwavelength measurements can be safely tradedfor one another is a second contribution.
Equally, the contributions of color technologyhave propelled forward experiments in visionscience. Improvements in color characterizationand color displays have made new experimentalmethods and precise control possible. The inter-action between these fields, as represented bythe inclusion of this chapter in this volume,enriches both.
8.8 ACKNOWLEDGMENTS
We thank P. Catrysse, A. El Gamal, J. Farrell, andG. Starkweather. This work was supported inpart by the Programmable Digital Camera projectat Stanford University.
8.9 REFERENCES
Adams, J., Parulski, K., and Spaulding, K. (1998)Color processing in digital cameras. IEEE Micro, 18(6), 20–30.
■ THE SCIENCE OF COLOR
314
Allebach, J., and Lin, Q. (1996) FM screen designusing DBS algorithm. Paper presented at the 1996IEEE International Conference on Image Process-ing, ICIP’96. Part 1 (of 3), Lausanne, Switzerland.
Anderson, S., Mullen, K., and Hess, R. (1991) Humanperipheral spatial resolution for achromatic andchromatic stimuli: limits imposed by optical andretinal factors. Journal of Physiology, 442, 47–64.
ASTM (1991) Standard recommended practice forgoniophotometry of objects and materials. ASTMStandards on Color and Appearance Measurement, 3rdedn. Philadelphia: ASTM.
Bayer, B.E. (1973) An optimum method for two-levelrendition of continuous-tone pictures. Paper pre-sented at the IEEE Conference on Communications.
Berns, R.S., Gorzynski, M.E., and Motta, R.J. (1993)CRT colorimetry, Part I: Theory and practice. ColorResearch and Application, 18, 299–314.
Berns, R.S., Motta, R.J., and Gorzynski, M.E. (1993)CRT colorimetry, Part II: Metrology. Color Researchand Application, 18, 315–25.
Brainard, D.H. (1989) Calibration of a computer con-trolled color monitor. Color Research and Application,14, 23–34.
Brainard, D.H. and Sherman, D. (1995) Reconstruct-ing images from trichromatic samples: from basicresearch to practical applications. Proceedings of theThird IS&T/SID Color Imaging Conference: Color Science,Systems and Applications. 4–10.
CIE (1990) CIE 1988 2 deg Spectral Luminous EfficiencyFunction for Photopic Vision (CIE 86). CommissionInternationale de L’Eclairage (CIE).
CIE (1996) The Relationship Between Digital andColorimetric Data for Computer-Controlled CRT Display(technical report 122–1996). Commission Inter-nationale de L’Eclairage (CIE).
Collett, E. (1993) Polarized Light: Fundamentals andApplications. New York: Marcel Dekker, Inc.
Collings, P.J. (1990) Liquid Crystals: Nature’s DelicatePhase of Matter. Princeton, NJ: Princeton UniversityPress.
Conner, A.R. (1992) The evolution of the stackedcolor LCD. Society for Information Display ApplicationsNotes, pp. 109–12.
Cornsweet, T.N. (1970) Visual Perception. New York:Academic Press.
Cupitt, J., Martinez, K., and Saunders, D. (1996) Amethodology for art reproduction in colour: TheMARC project. Computers and the History of Art, 6(2),1–19.
DeValois, R.L. and DeValois, K.K. (1988) Spatial vision.New York: Oxford University Press.
dpreview.com. (2000) Measuring Dynamic Range.Available: http://www.dpreview.com/news/0011/00111608dynamicrange.aspThursday,16November.
Fairchild, M. (1997) Color Appearance Models. Reading,MA: Addison–Wesley Longman.
Farrell, J., Saunders, D., Cuppitt, J., and Wandell, B.(1999) Estimating spectral reflectance of art work.Paper presented at the Chiba Conference onMultispectral Imaging, Chiba, Japan.
Floyd, R.W. and Steinberg, L. (1976) An adaptivealgorithm for spatial greyscale. Proceedings of theSociety for Information Display, 17, 75–7.
Fritsch, M.W. and Mlynski, D.A. (1991) Faster con-trast measurement of LCDs with improved cono-scopic methods. Proceedings of the Society forInformation Display, 32, 207–11.
Gill, G. (1999) ICC profile I/O library (icclib), READMEfile. Available: http://web.access.net.au/argyll/icc_readme.html99/11/29.
Glenn, W.E., Glenn, K.G., and Bastian, C.J. (1985)Imaging system design based on psychophysicaldata. Proceedings of the Society for Information Display,26, 71–8.
Hardeberg, J.Y. and Schmitt, F. (1997) Color printercharacterization using a computational geometryapproach. Proceedings of the Fifth IS&T/SID ColorImaging Conference: Color Science, Systems andApplications, 96–9.
Horn, B.K.P. (1984) Exact reproduction of coloredimages. Computer Vision, Graphics and ImageProcessing, 26, 135–67.
Hunt, R.W.G. (1987) The Reproduction of Colour. {AQ?}Janesick, J. (1997) CCD Transfer method – standard
for absolute performance of CCDs and digital CCDcamera systems. Paper presented at the Solid StateSensor Arrays: Development and Applications, SanJose.
Jarvis, J.F., Judice, C.N., and Ninke, W.H. (1976) Asurvey of techniques for the display of continuoustone pictures on bilevel displays. Computer Graphicsand Image Processing, 5 (1), 13–40.
Lee, H.C. (1985) Method for Determining the Color of aScene Illuminant from a Color Image. US: Kodak.
Lehrer, N.H. (1985) The challenge of the cathode-ray tube. In J.L.E. Tannas (ed.), Flat-Panel Displaysand CRTs. New York: Van Nostrand Reinhold, pp.138–76.
Leroux, T. and Rossignol, C. (1995) Fast analysis ofcontrast and color coordinates vs. viewing angle.Society for Information Display Digest of Technical Papers,739–42.
Luo, M.R. and Hunt, R.W.G. (1998) The structure ofthe CIE 1997 color appearance model. Color Researchand Application, 23, 138–46.
Lyons, N.P. and Farrell, J.E. (1989) Linear systemsanalysis of CRT displays, Society for InformationDisplay Digest of Technical Papers, 220–3.
Martinez, K., Cupitt, J., and Perry, S. High resolutionColorimetric ImageBrowsingontheWeb.WWW.Elsevier.30(1–7), 4 1998. http://www.ecs.soton.ac.uk.km/papers/www7/149.html.
Mitsa, T. and Parker, K.J. (1992) Digital halftoningtechnique using a blue-noise mask. Journal of theOptical Society of America A, 9 (11), 1920–9.
Mitsa, T., Ulichney, R., Parker, K.J., and Andre, J.(1991) The construction and evaluation of halftonepatterns with manipulated power spectra. RasterImaging and Digital Typography II. Cambridge:Cambridge University Press.
Mullen, K. (1985) The constrast sensitivity of human
DIGITAL COLOR REPRODUCTION ■
315
colour vision to red–green and blue–yellow chro-matic gratings. Journal of Physiology, 359, 381–400.
Neugebauer, H.E.J. (1990) Neugebauer MemorialSeminar on Color Reproduction. SPIE ProceedingsVol. 1184 14–15 Dec. 1989. Tokyo, Japan. ISBN:0-8194-0220-6.
Neugebauer, H.E.J. (1937) Die TheoretischenGrundlagen des Mehrfarbendruckes. In Z. Wiss.Photogr., Volume 36, pages 73–89.
Penz, P.A. (1985) Nonemissive displays. In J.L.E.Tannas (ed.), Flat-Panel Displays and CRTs. New York:Van Nostrand Reinhold, pp. 415–57.
Plummer, W.T. (1983) Color filter. US Patent No.4,416,514.
Poirson, A.B. and Wandell, B.A. (1993) The appear-ance of colored patterns: pattern-color separability.Journal of the Optical Society of America A, 10 (12):2458–71.
Poynton, C. (1996) A Technical Introduction to DigitalVideo. New York: John Wiley and Sons.
Rodieck, R.W. (1998) The First Steps in Seeing.Sunderland, MA: Sinauer Press.
Sakamoto, T. and Itooka, A. (1981) Linear interpola-tor for color correction. US Patent No. 4,275,413.
Saleh, B.E.A. (1996) The Fourier scope: an opticalinstrument for measuring LCD viewing-angle char-acteristics. Journal of the Society for InformationDisplay, 4 (1), 33–9.
Schade, O. (1958) On the quality of color-televisionimages and the perception of colour detail. Journalof the Society of Motion Pictures and Television Engineers,67, 801–19.
Scheffer, T. and Nehring, J. (1990) Twisted nematicand supertwisted nematic mode LCDs. In LiquidCrystals: Applications and Uses, Volume I. River Edge,NJ: World Scientific Publishing.
Scheffer, T. and Nehring, J. (1992) Twisted nematic(TN) and super-twisted nematic LCDs. Society for Infor-mation Display Seminar Lecture Notes, 1, M1/1?1/52.
Sekiguchi, N., Williams, D.R., and Brainard, D.H.(1993a) Aberration-free measurements of the visi-bility of isoluminant gratings. Journal of the OpticalSociety of America A, 10 (10), 2105–17.
Sekiguchi, N., Williams, D.R., and Brainard, D.H.(1993b) Efficiency in detection of isoluminant andisochromatic interference fringes. Journal of theOptical Society of America A, 10 (10), 2118–33.
Shafer, S.A. (1985) Using color to separate reflectioncomponents. Color Research and Application, 10,210–18.
Sherr, S. (1993) Electronic Displays, 2nd edn. New York:John Wiley and Sons.
Silicon Vision (2000) TFA Color Image Sensor (COSIMA)Available: http://www.siliconvision.de/produkte/cosima-e. htm 2000.
Silverstein, L.D. (1991) Description of an on-axis col-orimetric/photometric model for twisted-nematiccolor liquid crystal displays. Unpublished technicalreport for the NASA/ARPA Visual Display Engineer-ing and Optimization System (ViDEOS) project.NASA/ARPA.
Silverstein, L.D. (2000) Color in electronic displays.Society for Information Display Seminar LectureNotes, 1, M6/1–M6/88.
Silverstein, L.D. and Bernot, A.J. (1991) Apparatusand method for an electronically controlled colorfilter for use in information display applications. USPatent No. 5,032,007.
Silverstein, L.D. and Fiske, T.G. (1993) Colorimetricand photometric modeling of liquid crystal displays.Proceedings of the First IS&T/SID Color ImagingConference: Transforms & Transportability of Color,149–56.
Silverstein, L.D., Krantz, J.H., Gomer, F.E., Yei-Yu, Y.,and Monty, R.W. (1990) Effects of spatial samplingand luminance quantization on the image quality ofcolor matrix displays. Journal of the Optical Society ofAmerica A, 7 (10), 1955–68.
Silverstein, L.D. and Merrifield, R.M. (1985) TheDevelopment and Evaluation of Color DisplaySystems for Airborne Applications: Phase I – Funda-mental Visual, Perceptual, and Display System Con-siderations. Technical Report DOT/FAA/PM-85–19.FAA.
Speigle, J.M. and Brainard, D.H. (1999) Predictingcolor from gray: the relationship between achro-matic adjustment and asymmetric matching.Journal of the Optical Society of America A, 16 (10),2370–6.
Tamura, Y. (1983) Color Original Readout Apparatus.Japan: Canon Kabushiki Kaisha.
TC1–34, C.C. (1998) Final CIE TC1–34 specification.Available: http://www.cis.rit.edu/people/faculty/fairchild/PDFs/CIECAM97s_TC_Draft.pdf.
Tominaga, S. and Wandell, B.A. (1989) The standardsurface reflectance model and illuminant estima-tion. Journal of the Optical Society of America A, 6,576–84.
Ulichney, R. (1987) Digital Halftoning. Boston, MA:MIT Press.
Ulichney, R. (1993) The void-and-cluster method forgenerating dither arrays. Paper presented to theSPIE, San Jose, CA.
Ulichney, R.A. (1988) Dithering with blue noise.Proceedings of the IEEE, 76 (1), 56–79.
VanderHorst, G.J.C. and Bouman, M.A. (1969)Spatiotemporal chromaticity discrimination. Journalof the Optical Society of America, 59, 1482–8.
Vincent, K. and Neuman, H. (1989) Color Combiner andSeparator and Implementations. USA: Hewlett–Packard.
Wandell, B.A. (1986) Color rendering of camera data.Color Research and Application (Supplement), 11,S30–S33.
Wandell, B.A. (1995) Foundations of Vision.Sunderland, MA: Sinauer Press.
Wandell, B. (1999) Computational neuroimaging:color representations and processing. In M.S.Gazzaniga (ed.), The New Cognitive Neurosciences, 2ndedn. Cambridge, MA: MIT Press.
Wyszecki, G. and Stiles, W.S. (1982) Color Science:Concepts and Methods, Quantitative and Formulae. NewYork: Wiley.
■ THE SCIENCE OF COLOR
316