8 1 /2 & . ,1
54
UNLOCKING CLIMATE SOLUTIONS
Transcript of 8 1 /2 & . ,1

UNLOCKINGCLIMATE SOLUTIONSIdentifying Key Performance Indicators for Climate Change Mitigation
Jelise Schokker
JULY 12TH, 2021
University of Twente, Creative Technology
Supervisor: Dr. Andreas Kamilaris
Critical Observer: Dr. Jacob Kamminga

Abstract
Human caused climate change has become an undeniable problem. Monitoring and mitigating this
climate change is a priority for many countries and cities. Key performance Indicators (KPIs) related
to climate change can be used to develop appropriate climate change mitigation policies. This
study aims to identify useful KPIs and determine their units, values and use. 63 KPIs across eight
main topics are presented in this study. These topics are pollution, resource use, climate hazards,
biodiversity, transport, land use, health, and others. The use of these KPIs in 193 countries is
evaluated and visualized. Together, the KPIs that are selected provide a step in the right direction
towards a consistent and comparable index of global, well-defined metrics that can be used to monitor
and mitigate climate change.
2

Contents
1 Introduction 6
1.1 Background . . . . . . . . . . . . . . . . . . . . . . . . . . . . . . . . . . . . . . . 6
1.2 Research Questions . . . . . . . . . . . . . . . . . . . . . . . . . . . . . . . . . . . 6
1.3 Outline . . . . . . . . . . . . . . . . . . . . . . . . . . . . . . . . . . . . . . . . . . 7
2 Related Work 8
2.1 Carbon Disclosure Project . . . . . . . . . . . . . . . . . . . . . . . . . . . . . . . . 8
2.2 Hristov and Chirico . . . . . . . . . . . . . . . . . . . . . . . . . . . . . . . . . . . 8
2.3 Angelakoglou et al. . . . . . . . . . . . . . . . . . . . . . . . . . . . . . . . . . . . 8
2.4 Amrina and Yusof . . . . . . . . . . . . . . . . . . . . . . . . . . . . . . . . . . . . 9
2.5 Sustainable Development Goals . . . . . . . . . . . . . . . . . . . . . . . . . . . . . 9
2.6 Climate Change Performance Index . . . . . . . . . . . . . . . . . . . . . . . . . . . 10
2.7 Conclusion . . . . . . . . . . . . . . . . . . . . . . . . . . . . . . . . . . . . . . . . 11
3 Methodology 12
3.1 Theoretical Framework . . . . . . . . . . . . . . . . . . . . . . . . . . . . . . . . . 12
3.1.1 Pollution . . . . . . . . . . . . . . . . . . . . . . . . . . . . . . . . . . . . . 12
3.1.1.1 Air Pollution . . . . . . . . . . . . . . . . . . . . . . . . . . . . . 12
3.1.1.2 Greenhouse Gases . . . . . . . . . . . . . . . . . . . . . . . . . . . 13
3.1.1.3 Plastic Pollution . . . . . . . . . . . . . . . . . . . . . . . . . . . 13
3.1.1.4 Solid Waste . . . . . . . . . . . . . . . . . . . . . . . . . . . . . . 13
3.1.1.5 Recycling . . . . . . . . . . . . . . . . . . . . . . . . . . . . . . . 14
3.1.1.6 Soil Pollution . . . . . . . . . . . . . . . . . . . . . . . . . . . . . 14
3.1.1.7 Water Pollution . . . . . . . . . . . . . . . . . . . . . . . . . . . . 14
3.1.2 Resource Use . . . . . . . . . . . . . . . . . . . . . . . . . . . . . . . . . . 15
3.1.2.1 Water . . . . . . . . . . . . . . . . . . . . . . . . . . . . . . . . . 15
3.1.2.2 Energy . . . . . . . . . . . . . . . . . . . . . . . . . . . . . . . . . 15
3.1.2.3 Food . . . . . . . . . . . . . . . . . . . . . . . . . . . . . . . . . . 15
3.1.3 Climate Hazards . . . . . . . . . . . . . . . . . . . . . . . . . . . . . . . . . 16
3.1.3.1 Climate Hazards . . . . . . . . . . . . . . . . . . . . . . . . . . . 16
3.1.4 Biodiversity . . . . . . . . . . . . . . . . . . . . . . . . . . . . . . . . . . . 16
3.1.4.1 Biodiversity Intactness . . . . . . . . . . . . . . . . . . . . . . . . 16
3.1.4.2 Threatened Species . . . . . . . . . . . . . . . . . . . . . . . . . . 16
3.1.4.3 Protected Land . . . . . . . . . . . . . . . . . . . . . . . . . . . . 17
3

3.1.5 Transport . . . . . . . . . . . . . . . . . . . . . . . . . . . . . . . . . . . . 17
3.1.5.1 Public and Private Transport . . . . . . . . . . . . . . . . . . . . . 17
3.1.5.2 Electric Vehicles . . . . . . . . . . . . . . . . . . . . . . . . . . . 17
3.1.5.3 Aviation . . . . . . . . . . . . . . . . . . . . . . . . . . . . . . . . 17
3.1.6 Land Use . . . . . . . . . . . . . . . . . . . . . . . . . . . . . . . . . . . . 18
3.1.6.1 Deforestation . . . . . . . . . . . . . . . . . . . . . . . . . . . . . 18
3.1.6.2 Agriculture . . . . . . . . . . . . . . . . . . . . . . . . . . . . . . 18
3.1.7 Health . . . . . . . . . . . . . . . . . . . . . . . . . . . . . . . . . . . . . . 18
3.1.7.1 Public Health . . . . . . . . . . . . . . . . . . . . . . . . . . . . . 18
3.1.7.2 Illnesses and Mortality . . . . . . . . . . . . . . . . . . . . . . . . 18
3.1.8 Others . . . . . . . . . . . . . . . . . . . . . . . . . . . . . . . . . . . . . . 19
3.1.8.1 Global Temperature . . . . . . . . . . . . . . . . . . . . . . . . . . 19
3.1.8.2 Sea Level . . . . . . . . . . . . . . . . . . . . . . . . . . . . . . . 19
3.1.9 Conclusion . . . . . . . . . . . . . . . . . . . . . . . . . . . . . . . . . . . . 19
3.2 Identification of KPIs . . . . . . . . . . . . . . . . . . . . . . . . . . . . . . . . . . 19
3.2.1 Selection of KPIs . . . . . . . . . . . . . . . . . . . . . . . . . . . . . . . . 20
3.2.2 Definition of KPIs . . . . . . . . . . . . . . . . . . . . . . . . . . . . . . . . 20
3.2.2.1 Unit and Benchmarks . . . . . . . . . . . . . . . . . . . . . . . . . 20
3.3 Visualizing the KPIs . . . . . . . . . . . . . . . . . . . . . . . . . . . . . . . . . . . 20
4 Results 22
4.1 Table of KPIs . . . . . . . . . . . . . . . . . . . . . . . . . . . . . . . . . . . . . . 22
4.2 Definition KPIs . . . . . . . . . . . . . . . . . . . . . . . . . . . . . . . . . . . . . 28
4.2.1 Pollution . . . . . . . . . . . . . . . . . . . . . . . . . . . . . . . . . . . . . 28
4.2.1.1 Air Pollution . . . . . . . . . . . . . . . . . . . . . . . . . . . . . 28
4.2.1.2 Greenhouse Gases . . . . . . . . . . . . . . . . . . . . . . . . . . . 28
4.2.1.3 Plastic Pollution . . . . . . . . . . . . . . . . . . . . . . . . . . . 28
4.2.1.4 Solid Waste . . . . . . . . . . . . . . . . . . . . . . . . . . . . . . 29
4.2.1.5 Recycling . . . . . . . . . . . . . . . . . . . . . . . . . . . . . . . 29
4.2.1.6 Soil Pollution . . . . . . . . . . . . . . . . . . . . . . . . . . . . . 29
4.2.1.7 Water Pollution . . . . . . . . . . . . . . . . . . . . . . . . . . . . 29
4.2.2 Resource Use . . . . . . . . . . . . . . . . . . . . . . . . . . . . . . . . . . 30
4.2.2.1 Water . . . . . . . . . . . . . . . . . . . . . . . . . . . . . . . . . 30
4.2.2.2 Energy . . . . . . . . . . . . . . . . . . . . . . . . . . . . . . . . . 30
4.2.2.3 Food . . . . . . . . . . . . . . . . . . . . . . . . . . . . . . . . . . 31
4

4.2.3 Climate Hazards . . . . . . . . . . . . . . . . . . . . . . . . . . . . . . . . . 31
4.2.3.1 Climate Hazards . . . . . . . . . . . . . . . . . . . . . . . . . . . 31
4.2.4 Biodiversity . . . . . . . . . . . . . . . . . . . . . . . . . . . . . . . . . . . 32
4.2.4.1 Biodiversity Intactness . . . . . . . . . . . . . . . . . . . . . . . . 32
4.2.4.2 Terrestrial Animal Diversity . . . . . . . . . . . . . . . . . . . . . . 32
4.2.4.3 Marine Animal Diversity . . . . . . . . . . . . . . . . . . . . . . . 32
4.2.5 Transport . . . . . . . . . . . . . . . . . . . . . . . . . . . . . . . . . . . . 33
4.2.5.1 Public Transport . . . . . . . . . . . . . . . . . . . . . . . . . . . 33
4.2.5.2 Private Transport . . . . . . . . . . . . . . . . . . . . . . . . . . . 33
4.2.5.3 Electric Vehicles . . . . . . . . . . . . . . . . . . . . . . . . . . . 34
4.2.5.4 Aviation . . . . . . . . . . . . . . . . . . . . . . . . . . . . . . . . 34
4.2.6 Land Use . . . . . . . . . . . . . . . . . . . . . . . . . . . . . . . . . . . . 34
4.2.6.1 Deforestation . . . . . . . . . . . . . . . . . . . . . . . . . . . . . 34
4.2.6.2 Agriculture . . . . . . . . . . . . . . . . . . . . . . . . . . . . . . 34
4.2.7 Health . . . . . . . . . . . . . . . . . . . . . . . . . . . . . . . . . . . . . . 35
4.2.7.1 Public Health . . . . . . . . . . . . . . . . . . . . . . . . . . . . . 35
4.2.7.2 Mortality . . . . . . . . . . . . . . . . . . . . . . . . . . . . . . . 35
4.2.7.3 Illnesses . . . . . . . . . . . . . . . . . . . . . . . . . . . . . . . . 35
4.2.8 Others . . . . . . . . . . . . . . . . . . . . . . . . . . . . . . . . . . . . . . 36
4.2.8.1 Global Temperature . . . . . . . . . . . . . . . . . . . . . . . . . . 36
4.2.8.2 Sea Level . . . . . . . . . . . . . . . . . . . . . . . . . . . . . . . 36
4.3 Visualizing KPIs . . . . . . . . . . . . . . . . . . . . . . . . . . . . . . . . . . . . . 37
5 Discussion 38
5.0.1 KPIs Related to Climate Change . . . . . . . . . . . . . . . . . . . . . . . . 38
5.0.2 Units and Values . . . . . . . . . . . . . . . . . . . . . . . . . . . . . . . . 42
5.0.3 Use of the KPIs . . . . . . . . . . . . . . . . . . . . . . . . . . . . . . . . . 42
5.1 Limitations . . . . . . . . . . . . . . . . . . . . . . . . . . . . . . . . . . . . . . . . 42
5.2 Future Work . . . . . . . . . . . . . . . . . . . . . . . . . . . . . . . . . . . . . . . 43
6 Conclusion 44
7 Bibliography 45
5

1 Introduction
1.1 Background
In the past couple of years, climate change has become an undeniable problem. The year 2020 was
tied with 2016 as the warmest year on record. The average temperature of the earth has risen over 1.2
degrees Celsius since the late nineteenth century. [1] Climate change and the environmental issues
it causes affect life for many people around the world. As temperatures keep rising, an increasing
amount of climate-related issues arise. It is important that cities and countries form appropriate
policies to combat climate change and the problems that ensue.
Key Performance Indicators (KPIs) can be used to formulate policies and to reach climate goals.
According to Lo-Iacono-Ferreira et al. [2], KPIs are measures that are used to assess essential factors
related to a given objective, such as reducing the effects of climate change. The effectiveness of a
country or organization in achieving these objectives can be determined by these factors. Because
KPIs are always tied to a certain objective [3], they are very important in developing useful policies.
Having a comprehensive index of KPIs is important because it would provide a method for
policymakers to consistently monitor their performance and take appropriate actions based on that.
This would in turn lead to a more straightforward way of policy-making, where policies can easily
be developed based on current performance. The importance of globally defined KPIs lies in the
ability to compare performance across countries and cities. This would give not only an absolute
performance, but also relative to the achievements of other regions.
1.2 Research Questions
The main objective is giving insight into which Key Performance Indicators can be used to form
policies on climate change. Relevant KPIs can be used by policymakers to set and achieve clear
goals, therefore it is important to focus on the correct KPIs. Previous research has resulted in useful
lists, but the goal of this thesis is to fill gaps in the literature by creating a more comprehensive
index that includes all relevant KPIs. This done by listing, describing and understanding important
KPIs related to climate change. As a result, the main research question may be stated as follows:
Which KPIs can be used by countries or cities to monitor and mitigate climate change?
In order to answer the main research question, the following sub-questions must be answered:
1. What are the KPIs that relate to climate change?
2. Which units and values are associated with these KPIs?
6

3. Which countries use these KPIs to monitor their environmental impact and set climate change
mitigation goals?
1.3 Outline
First, an overview of related work is given in section 2. Section 3 discusses a review of the existing
literature and the methods used to answer the research questions. Section 4 presents the results that
were obtained. In section 5, a discussion of the results is given based on the formulated research
questions. In the discussion, limitations and possibilities for future work are also identified. Finally,
section 6 presents a conclusion of the research.
7

2 Related Work
In this section, an overview will be given of existing work similar to what will be done in this
project. First, the Carbon Disclosure Project is discussed. Next, three efforts on sustainability are
addressed: Hristov and Chirico, Angelakoglou et al. and Amrina and Yusof. Then, the Sustainable
Development Goals presented by the United Nations are considered. Finally, the Climate Change
Performance Index is discussed.
2.1 Carbon Disclosure Project
Each year, thousands of cities, businesses and regions submit data on their environmental impacts
to the Carbon Disclosure Project (CDP), a non-profit organization with the goal of building the
world’s most comprehensive data set on environmental action [4]. The framework that they have
developed has resulted in unprecedented global engagement on environmental issues. In order to
reduce emissions, improve resilience, and to protect themselves against a changing climate, over 810
cities provide information on their environmental impact to the CDP [5]. This data can be very
useful in developing KPIs related to a city’s environmental impact and to climate change. For their
data collection, the CDP uses a set list of questions and indicators that make comparing performance
across cities possible.
The CDP questionnaire for disclosing cities is divided into eleven categories: governance and
data management, climate hazards and vulnerability, adaptation, city-wide emissions, emissions
reduction, opportunities, energy, transport, food, waste, and water security [6]. Together, these
categories cover a wide range of climate change related topics and can provide useful comparisons
between cities.
2.2 Hristov and Chirico
One effort to identify KPIs related to climate and sustainability is [7]. This paper aims to identify
KPIs that measure a company’s performance, and proposes a way in which sustainability can be
integrated in company strategies. Out of all KPIs found in the study, 24 were related to environmental
targets. These KPIs were grouped according to 4 goals: reducing gas emissions, improving the use of
renewables, reducing natural resources consumption, and reducing waste and improving green-ness.
2.3 Angelakoglou et al.
Another study that investigates KPIs related to sustainability is [8]. This paper primarily focuses
on monitoring and evaluating Smart City Solutions though the proposed indicators. 75 KPIs are
8
identified across six topics and include technical, environmental, economic, social, ICT and legal
KPIs.
2.4 Amrina and Yusof
A third study that investigates KPIs related to climate change is [9]. This study focuses on sus-
tainability in the automotive industry. 41 KPIs are presented, 10 of which relate to environmental
performance. These indicators are grouped into the following categories: emissions, resource uti-
lization, and waste.
2.5 Sustainable Development Goals
The United Nations’ 2030 Agenda for Sustainable Development [10] is a roadmap for prosperity,
peace and stability for humanity and for the planet. It consists of 17 Sustainable Development Goals
(SDGs), 169 targets and 231 unique indicators that can be used to achieve sustainable development.
Three categories are presented: economic, social and environmental sustainable development. The
indicators in the latter category in particular are of relevance to this research.
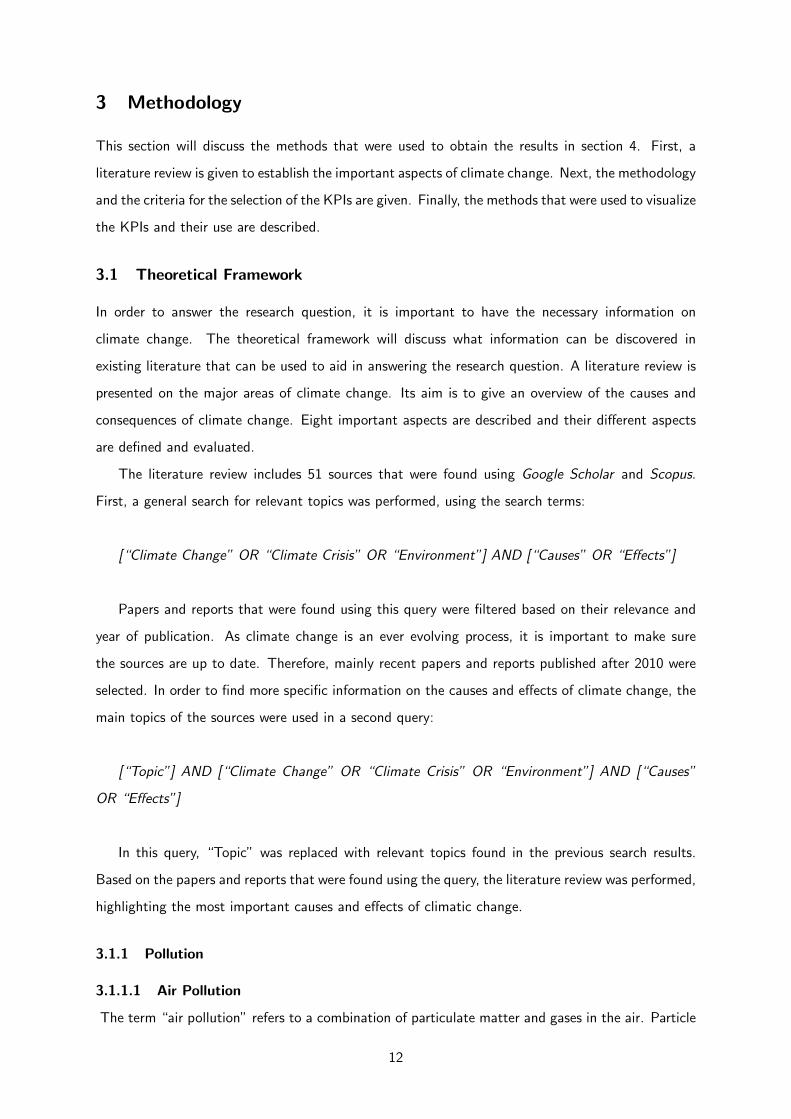
Goal 13, “Take urgent action to combat climate change and its impacts,” is one of the most
relevant SDGs. Eight indicators are associated with this goal. These indicators are shown in table 1.
Additionally, there are also other goals that focus on climate change mitigation and sustainability in
a more indirect manner, and several of the indicators overlap with goal 13. These are the following
goals:
2. End hunger, achieve food security and improved nutrition and promote sustainable agriculture.
6. Ensure availability and sustainable management of water and sanitation for all.
7. Ensure access to affordable, reliable, sustainable and modern energy for all.
9. Build resilient infrastructure, promote inclusive and sustainable industrialization and foster
innovation.
11. Make cities and human settlements inclusive, safe, resilient and sustainable.
12. Ensure sustainable consumption and production patterns .
14. Conserve and sustainably use the oceans, seas and marine resources for sustainable develop-
ment.
9

15. Protect, restore and promote sustainable use of terrestrial ecosystems, sustainably manage
forests, combat desertification, and halt and reverse land degradation and halt biodiversity
loss.
# Indicator [11]
13.1.1 Number of deaths, missing persons and directly affected persons attributed to disasters per 100,000 population
13.1.2 Number of countries that adopt and implement national disaster risk reduction strategies in line with the Sendai
Framework for Disaster Risk Reduction 2015-2030
13.1.3 Proportion of local governments that adopt and implement local disaster risk reduction strategies in line with national
disaster risk reduction strategies
13.2.1 Number of countries with nationally determined contributions, long-term strategies, national adaptation plans and
adaptation communications, as reported to the secretariat of the United Nations Framework Convention on Climate
Change
13.2.2 Total greenhouse gas emissions per year
13.3.1 Extent to which (i) global citizenship education and (ii) education for sustainable development are mainstreamed in
(a) national education policies; (b) curricula; (c) teacher education; and (d) student assessment
13.a.1 Amounts provided and mobilized in United States dollars per year in relation to the continued existing collective
mobilization goal of the $100 billion commitment through to 2025
13.b.1 Number of least developed countries and small island developing States with nationally determined contributions,
long-term strategies, national adaptation plans and adaptation communications, as reported to the secretariat of
the United Nations Framework Convention on Climate Change
Table 1: List of indicators used for goal 13 of the SDGs.
2.6 Climate Change Performance Index
The final effort to introduce KPIs related to climate change is the Climate Change Performance
Index (CCPI) [12] proposed by the organization Germanwatch. Currently, the CCPI assesses and
analyses the climate change mitigation performance of 57 countries and the European Union (EU),
which collectively account for over 90 percent of global GHG emissions. The CCPI seeks to improve
transparency in international climate politics by allowing comparisons between efforts and progress on
climate protection between countries. It measures countries’ performance based on four categories:
GHG emissions, renewable energy, energy use, and climate policy. The indicators that are used in
the CCPI are shown in table 2.
# CCPI indicator [12]
1 Current Level of GHG Emissions per Capita
2 Past Trend of GHG Emissions per Capita
3 Current Level of GHG Emissions per Capita compared to a well- below-2°C compatible pathway
10

4 GHG Emissions Reduction 2030 Target compared to a well- below-2°C compatible pathway
5 Current Share of Renewables per Total Primary Energy Supply (TPES)
6 Development of Energy Supply from Renewable Energy Sources
7 Current Share of Renewables per TPES compared to a well-below-2°C compatible pathway
8 Renewable Energy 2030 Target compared to a well-below-2°C compatible pathway
9 Current Level of Energy Use (TPES/Capita)
10 Past Trend of TPES/Capita
11Current Level of TPES/Capita
compared to a well-below-2°C compatible pathway
12 TPES/Capita 2039 Target compared to a well-below-2°C compatible pathway
13 National Climate Policy
14 International Climate Policy
Table 2: List of indicators used in the CCPI.
2.7 Conclusion
Many KPIs have already been proposed to address elements of sustainability and sustainable devel-
opment in corporations and organizations, as well as smart cities. Some of these efforts, such as
Hristov and Chirico and Amrina and Yusof, do not address the performance of cities and countries
in regard to climate change, but that of companies. The CCPI, SDGs, and the CDP do focus on
countries or cities and cover a wide range of topics related to climate change and sustainability.
11
3 Methodology
This section will discuss the methods that were used to obtain the results in section 4. First, a
literature review is given to establish the important aspects of climate change. Next, the methodology
and the criteria for the selection of the KPIs are given. Finally, the methods that were used to visualize
the KPIs and their use are described.
3.1 Theoretical Framework
In order to answer the research question, it is important to have the necessary information on
climate change. The theoretical framework will discuss what information can be discovered in
existing literature that can be used to aid in answering the research question. A literature review is
presented on the major areas of climate change. Its aim is to give an overview of the causes and
consequences of climate change. Eight important aspects are described and their different aspects
are defined and evaluated.
The literature review includes 51 sources that were found using Google Scholar and Scopus.
First, a general search for relevant topics was performed, using the search terms:
[“Climate Change” OR “Climate Crisis” OR “Environment”] AND [“Causes” OR “Effects”]
Papers and reports that were found using this query were filtered based on their relevance and
year of publication. As climate change is an ever evolving process, it is important to make sure
the sources are up to date. Therefore, mainly recent papers and reports published after 2010 were
selected. In order to find more specific information on the causes and effects of climate change, the
main topics of the sources were used in a second query:
[“Topic”] AND [“Climate Change” OR “Climate Crisis” OR “Environment”] AND [“Causes”
OR “Effects”]
In this query, “Topic” was replaced with relevant topics found in the previous search results.
Based on the papers and reports that were found using the query, the literature review was performed,
highlighting the most important causes and effects of climatic change.
3.1.1 Pollution
3.1.1.1 Air Pollution
The term “air pollution” refers to a combination of particulate matter and gases in the air. Particle
12
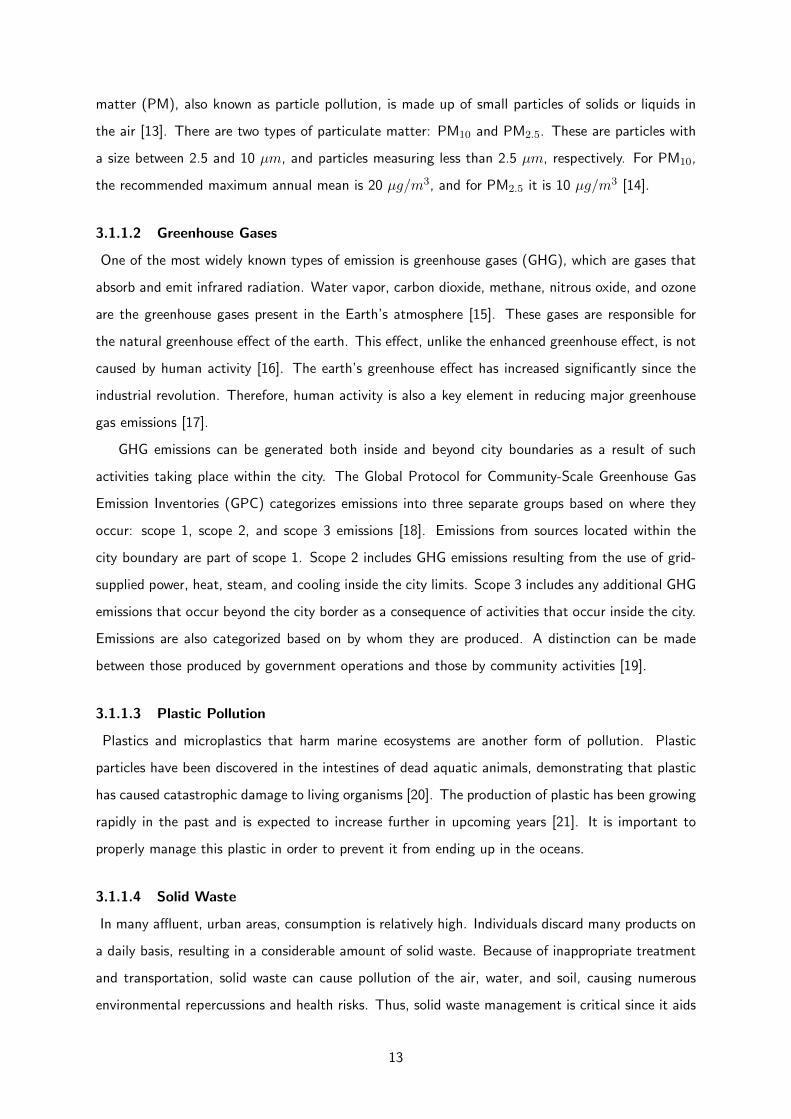
matter (PM), also known as particle pollution, is made up of small particles of solids or liquids in
the air [13]. There are two types of particulate matter: PM10 and PM2.5. These are particles with
a size between 2.5 and 10 µm, and particles measuring less than 2.5 µm, respectively. For PM10,
the recommended maximum annual mean is 20 µg/m3, and for PM2.5 it is 10 µg/m3 [14].
3.1.1.2 Greenhouse Gases
One of the most widely known types of emission is greenhouse gases (GHG), which are gases that
absorb and emit infrared radiation. Water vapor, carbon dioxide, methane, nitrous oxide, and ozone
are the greenhouse gases present in the Earth’s atmosphere [15]. These gases are responsible for
the natural greenhouse effect of the earth. This effect, unlike the enhanced greenhouse effect, is not
caused by human activity [16]. The earth’s greenhouse effect has increased significantly since the
industrial revolution. Therefore, human activity is also a key element in reducing major greenhouse
gas emissions [17].
GHG emissions can be generated both inside and beyond city boundaries as a result of such
activities taking place within the city. The Global Protocol for Community-Scale Greenhouse Gas
Emission Inventories (GPC) categorizes emissions into three separate groups based on where they
occur: scope 1, scope 2, and scope 3 emissions [18]. Emissions from sources located within the
city boundary are part of scope 1. Scope 2 includes GHG emissions resulting from the use of grid-
supplied power, heat, steam, and cooling inside the city limits. Scope 3 includes any additional GHG
emissions that occur beyond the city border as a consequence of activities that occur inside the city.
Emissions are also categorized based on by whom they are produced. A distinction can be made
between those produced by government operations and those by community activities [19].
3.1.1.3 Plastic Pollution
Plastics and microplastics that harm marine ecosystems are another form of pollution. Plastic
particles have been discovered in the intestines of dead aquatic animals, demonstrating that plastic
has caused catastrophic damage to living organisms [20]. The production of plastic has been growing
rapidly in the past and is expected to increase further in upcoming years [21]. It is important to
properly manage this plastic in order to prevent it from ending up in the oceans.
3.1.1.4 Solid Waste
In many affluent, urban areas, consumption is relatively high. Individuals discard many products on
a daily basis, resulting in a considerable amount of solid waste. Because of inappropriate treatment
and transportation, solid waste can cause pollution of the air, water, and soil, causing numerous
environmental repercussions and health risks. Thus, solid waste management is critical since it aids
13

in the reduction of solid waste pollution and contributes to a pollution-free and healthy environment
[22].
There are several ways of waste disposal, some of them are more harmful than others. Solid
waste disposal into landfills is still a common method of disposal, despite the health hazards and
pollution that are linked to this way of waste disposal [23]. Other ways of waste disposal, such
as recycling, incineration, or pyrolysis, are used to manage solid waste pollution and its harmful
consequences [22].
3.1.1.5 Recycling
Recycling is also a popular method of waste disposal. It entails reusing certain waste components
and it therefore saves resources, reduces the manufacturing of new resources, and minimizes pollution
[22]. However, recycling is not yet a sufficiently widespread practice, as a considerable amount of
waste still ends up in landfills or in nature. Since 1950, only nine percent of plastic waste has been
properly recycled [24].
3.1.1.6 Soil Pollution
Additional chemicals are frequently introduced into the soil as a result of how land is used [25].
This soil contamination can have major effects on biodiversity. Because of the toxicity produced
by the pollutants, the number of organisms present in an ecosystem can decrease. However, there
can also be changes at the community level, with tolerant or resistant species benefiting over those
susceptible to the contaminants [26].
3.1.1.7 Water Pollution
As a consequence of increased industrialization and urbanization, the stress on our water sources
is growing rapidly, decreasing the clean water availability. Polluted water is harmful to marine
life, plants, humans, and the environment [27]. While companies and treatment plants make use
of different wastewater treatment procedures, some industries continue to dispose of untreated
wastewater into bodies of water. This causes pollutants such as heavy metals and organic pollutants
to enter the water.
In the 1979s and 1980s, heavy metal concentrations in rivers and lakes were relatively low. How-
ever, they have been higher since the 1990s up until now. The predominant sources of heavy metal
contamination in water bodies around the world have shifted over time from mining and production
to metal waste disposal. Metal pollution can have negative impacts on people through the food
chain, drinking water, air inhalation, or skin absorption [28]. The second type of pollutants found
in water, organic pollutants, come in a wide range of types and toxicity levels [27]. Dyes, pharma-
14
ceuticals, product waste, and petroleum organic pollutants are several of the organic pollutants that
have posed a significant threat to aquatic species, plants, and people.
3.1.2 Resource Use
3.1.2.1 Water
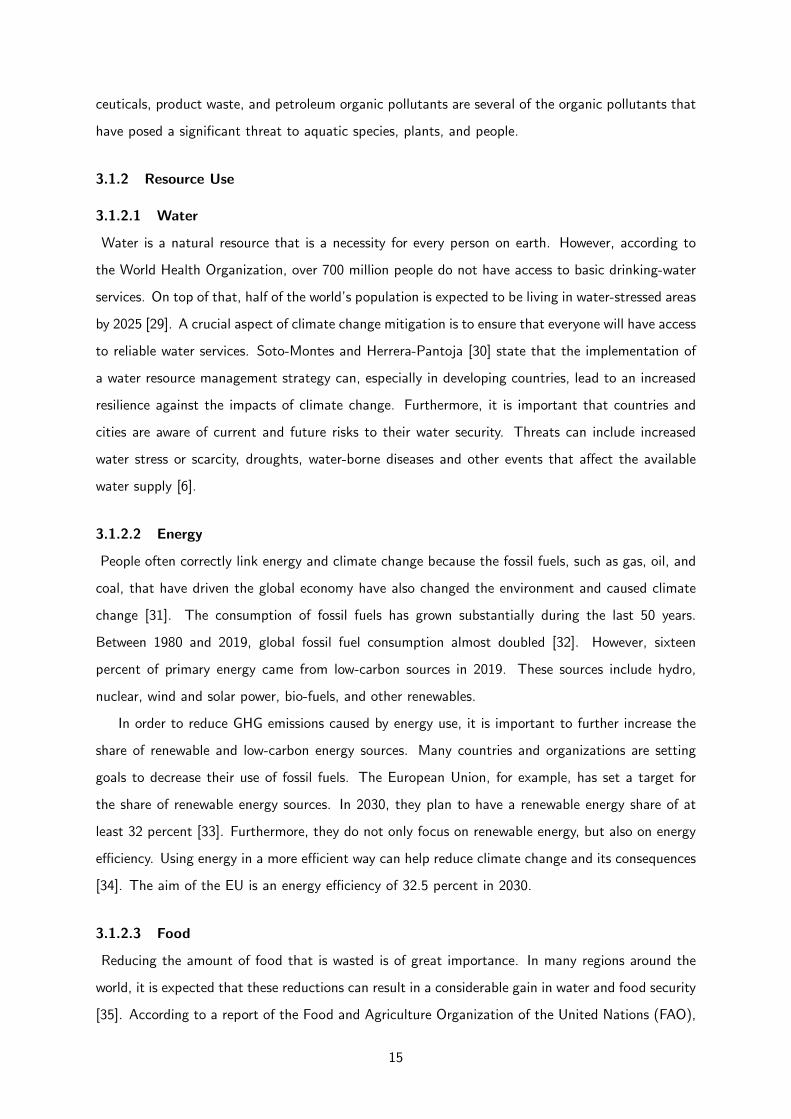
Water is a natural resource that is a necessity for every person on earth. However, according to
the World Health Organization, over 700 million people do not have access to basic drinking-water
services. On top of that, half of the world’s population is expected to be living in water-stressed areas
by 2025 [29]. A crucial aspect of climate change mitigation is to ensure that everyone will have access
to reliable water services. Soto-Montes and Herrera-Pantoja [30] state that the implementation of
a water resource management strategy can, especially in developing countries, lead to an increased
resilience against the impacts of climate change. Furthermore, it is important that countries and
cities are aware of current and future risks to their water security. Threats can include increased
water stress or scarcity, droughts, water-borne diseases and other events that affect the available
water supply [6].
3.1.2.2 Energy
People often correctly link energy and climate change because the fossil fuels, such as gas, oil, and
coal, that have driven the global economy have also changed the environment and caused climate
change [31]. The consumption of fossil fuels has grown substantially during the last 50 years.
Between 1980 and 2019, global fossil fuel consumption almost doubled [32]. However, sixteen
percent of primary energy came from low-carbon sources in 2019. These sources include hydro,
nuclear, wind and solar power, bio-fuels, and other renewables.
In order to reduce GHG emissions caused by energy use, it is important to further increase the
share of renewable and low-carbon energy sources. Many countries and organizations are setting
goals to decrease their use of fossil fuels. The European Union, for example, has set a target for
the share of renewable energy sources. In 2030, they plan to have a renewable energy share of at
least 32 percent [33]. Furthermore, they do not only focus on renewable energy, but also on energy
efficiency. Using energy in a more efficient way can help reduce climate change and its consequences
[34]. The aim of the EU is an energy efficiency of 32.5 percent in 2030.
3.1.2.3 Food
Reducing the amount of food that is wasted is of great importance. In many regions around the
world, it is expected that these reductions can result in a considerable gain in water and food security
[35]. According to a report of the Food and Agriculture Organization of the United Nations (FAO),
15

the world is currently not on course to achieve the hunger and malnutrition targets that had been
set for 2030 [36]. Although the number of people suffering from hunger had been declining for
decades, this is not the case anymore. The number has been slowly increasing since 2014. The
projections for 2030 are not optimistic, and that is without taking into account the possible effects
of the COVID-19 pandemic on world hunger.
Human demand as well as the availability of natural resources are dispersed unevenly across the
world [37]. The ecological footprint of consumption shows the amount of production and waste per
person. These levels vary across the world as a result of differences in lifestyle and consumption
habits. The target level of the ecological footprint also varies, as hunger and malnutrition are still
an important problem. Certain countries can benefit from increasing their carbon footprint, if this
means their food security and quality of food can increase as well [36].
3.1.3 Climate Hazards
3.1.3.1 Climate Hazards
Climate hazards are an important aspect of climate change. Extreme events will most likely change
in frequency and severity as the environment changes as a result of climate change [38]. One example
is North America, where there are increasingly more and worse wildfires [39]. Alternatively, climate
change can also cause changes in precipitation. This in turn can result in more precipitation-induced
flooding [40]. It is important for cities and countries to know what climate hazards may pose a
threat, either today or in the future.
3.1.4 Biodiversity
3.1.4.1 Biodiversity Intactness
Climate change is speeding up as a result of increased greenhouse gas emissions, which has an
impact on both people and ecosystems [41]. Because even a minor shift in the climate can result
in the extinction of some of the world’s most vulnerable species, it is important to ensure that they
are monitored and protected. The Biodiversity Intactness Index (BII) shows how native terrestrial
species’ average abundance compares to their abundance before human intervention [42]. It is
necessary to use this index to comprehend the interactions between plants, animals, and biodiversity,
and implement strategies to improve biodiversity based on that understanding.
3.1.4.2 Threatened Species
Climate change currently threatens 19 percent of the IUCN Red List’s endangered species, increasing
their chances of extinction [43]. This can have harmful effects on humans too, as species have
16

important functions in ecosystems that provide essential benefits to people. Therefore it is crucial
to not only keep track of threatened animals, but to also try to protect them.
3.1.4.3 Protected Land
Protected areas are the most common method of preserving vulnerable species and protecting
biodiversity across the world [44]. It is important that in these protected areas, all threats to
threatened animals are removed, in order to prevent their extinction. Adequate funding, careful
design, and proper organization are all important when it comes to protected areas to preserve
biodiversity.
3.1.5 Transport
3.1.5.1 Public and Private Transport
Transport is an important part of everyday life and it also has a significant impact on the envi-
ronment. Over sixteen percent of all GHG emissions in 2016 can be attributed to transportation
[45]. Especially in urban areas, a lot of energy is used in transportation services. One way to reduce
transport emissions is the implementation of a good public transit network [46], [47]. If this network
is of good quality and accessible to as many people as possible, it can reduce the use of private
transport methods [47]. One example is New York, where private car ownership and emissions are
much lower than in the rest of the United States, due to the extensive public transport system in
the city [48].
3.1.5.2 Electric Vehicles
In 2016, almost twelve percent of global GHG emissions were caused by road transport alone [45].
This is quite a high percentage, as the total transport sector accounts for 16 percent, which means
that electrification of road transport could make a significant impact on GHG emissions. Nanaki
and Koroneos also supports this claim, stating that the implementation of alternative fuels can lead
to low carbon cities, and positively impact the environment [49].
3.1.5.3 Aviation
Aviation is one of the fastest-growing emitters of greenhouse gases [50]. Carbon dioxide and water
vapor are among the most significant emissions of airplanes [51]. However, it is difficult to measure
the emissions caused by aviation of an individual country or city, because of disagreements on where
the emissions should be allocated [48]. This mainly poses a problem for international flights, as it is
not clear if the country of origin or the country of destination should be held responsible.
17

3.1.6 Land Use
3.1.6.1 Deforestation
One important aspect to consider when it comes to land use is deforestation. Forests and rain forests
all around the world are threatened by increasing rates of deforestation [52]. Brazil, for example,
saw 40,000 hectares of forest cut down in just fifteen years, from 1990 to 2005. However, Brazil
managed to reduce deforestation rates by 84 percent in 2012, relative to historically high levels in
2004 [53]. But rates have begun to rise again in recent years, with 2020 reaching the highest rate
in the past decade.
3.1.6.2 Agriculture
Food often goes a long way before it is consumed. It is produced, processed, packed, shipped,
and prepared. Every step causes GHG emissions to be released into the earth’s atmosphere [54].
Agriculture emits an especially high amount of greenhouse gases. It contributes 17 percent directly
through agricultural operations and 7-14 percent indirectly via land use changes [55]. However,
agriculture not only contributes to climate change, but is also particularly vulnerable to it. Most of
the risks associated with agriculture are caused by adverse climatic conditions and climate variability,
with climate change posing an additional concern [56].
3.1.7 Health
3.1.7.1 Public Health
Public health and good health systems are crucial for a city, but they can face several risks related to
climate change. These risks include diseases as a result of climate change, the disruption of health
services, threats to food security, and many more [6]. The CDP asks cities to indicate whether they
are aware of such threats, in order to be prepared and provide an early response.
3.1.7.2 Illnesses and Mortality
Climate change has a wide range of effects on human health. It has the potential to exacerbate
current health hazards while also introducing new risks [57]. One common way in which this happens
is through air pollution. Reduced lung function, increased hospital admissions for asthma, and an
increase in premature mortality have all been linked to air pollution [58].
The effects of climate change can also lead to excess mortality, especially in vulnerable groups.
One cause that is linked to climate change is the occurrence of heatwaves. Heatwaves can increase
the death risk of especially elderly people, according to Can et al. [59]. Moreover, since 1950, the
frequency and intensity of heat waves has increased, and with it the threat to vulnerable people [60].
18

3.1.8 Others
3.1.8.1 Global Temperature
The mean global temperature is an important measure when it comes to climate change, as the
increasing temperature can negatively affect the environment. Temperature rises may have a variety
of negative consequences, including an increase in the likelihood of flooding, droughts, and heat
waves, so it is an important indicator to consider [61].
3.1.8.2 Sea Level
Sea-level rise is a worldwide phenomenon with potentially massive consequences, including coastal
erosion and marine habitat destruction [62]. Countries in low-lying areas and small islands, in
particular, are concerned that coastal erosion and floods will decrease their land areas.
3.1.9 Conclusion
There are eight important topics that should be considered when developing KPIs to monitor and
mitigate climate change. These topics are pollution, resource use, climate hazards, biodiversity,
transport, land use, health, and others. The latter includes information that cannot be categorized
in any of the other topics, namely the global temperature and the sea level.
3.2 Identification of KPIs
After establishing the relevant background information in section 3.1, this research was used to find
and select KPIs. First, the eight clusters and the research described in section 3.1 were used to find
research papers, reports and databases on climate change related indicators. Relevant KPIs in these
sources were identified and subsequently selected based on the criteria in the section 3.1.1.
The papers, reports and databases were found using the following query:
[“Topic”] AND [“Key Performance Indicators” OR “Metrics” OR “Units”] AND
[“Climate” OR ”Climate change” OR “Environment]
In place of “Topic”, the title of the corresponding topic was used, e.g. air pollution or greenhouse
gases. The search engines that were used are Google Scholar and Scopus. Finally, Google Search
was also used, mainly to find databases.
Several KPIs are also based on the CDP questionnaire of disclosing cities [6] that was discussed
in section 2.1.
19

3.2.1 Selection of KPIs
The KPIs that were found were then filtered according to three criteria. The first criterion is that the
KPI should be adopted by some country or city. This means that at least one country or city uses the
indicator to measure their performance on climate change. Secondly, the KPI should be measurable.
It should have a quantitative or qualitative metric that can be used to establish benchmarks. Finally,
the KPI should have a value in some country or city.
3.2.2 Definition of KPIs
After selecting the KPIs, they are defined based on a set of principles [63], to ensure the KPI
captures the important aspects of the topic. The first principle is comprehensiveness. This entails
that for every topic, the KPIs combined should give a clear understanding of every facet of the
topic. Secondly, the KPIs should be defined in such a way that they can be compared across
different cities or countries, but also over time. The third, independence, entails that the KPIs
should be independent and overlap as little as possible with the other indicators. Each KPI should
be a separate indicator. Finally, the KPIs must be straightforward and simple to comprehend.
3.2.2.1 Unit and Benchmarks
After defining the KPIs, a search was conducted to find the appropriate units of measurement for the
KPIs. This data was found using the sources of the KPIs and Google Search. Both qualitative and
quantitative units are used. For some indicators, multiple possible units of measurement exist. In
these cases, either the unit that is used in the available data is chosen, or the unit that is used most
frequently. Using the same sources that were used to find the KPIs, benchmarks were established.
Two categories are provided, “+” for values that represent good performance, and “-” for values
that represent bad performance.
3.3 Visualizing the KPIs
In order to give an indication of which KPIs are used in which country, a categorical heatmap is
created. The heatmap displays all KPIs that are used by countries and have both recent data and
data for individual countries. To define recent data, the time period of 2010-present was used. KPIs
that are based on more regional data or global data were not included in the heatmap, as these
cannot be compared across countries.
In the heatmap, the 193 member states of the United Nations are visualized. These nations were
chosen in order to present a consistent comparison in the graph.
20

Data was found using the sources of the KPIs and Google Search. This data was preprocessed
using Tableau Prep Builder 2021.1 and Microsoft Excel. After preprocessing the data, the heatmap
was created using Tableau 2020.4.
21
4 Results
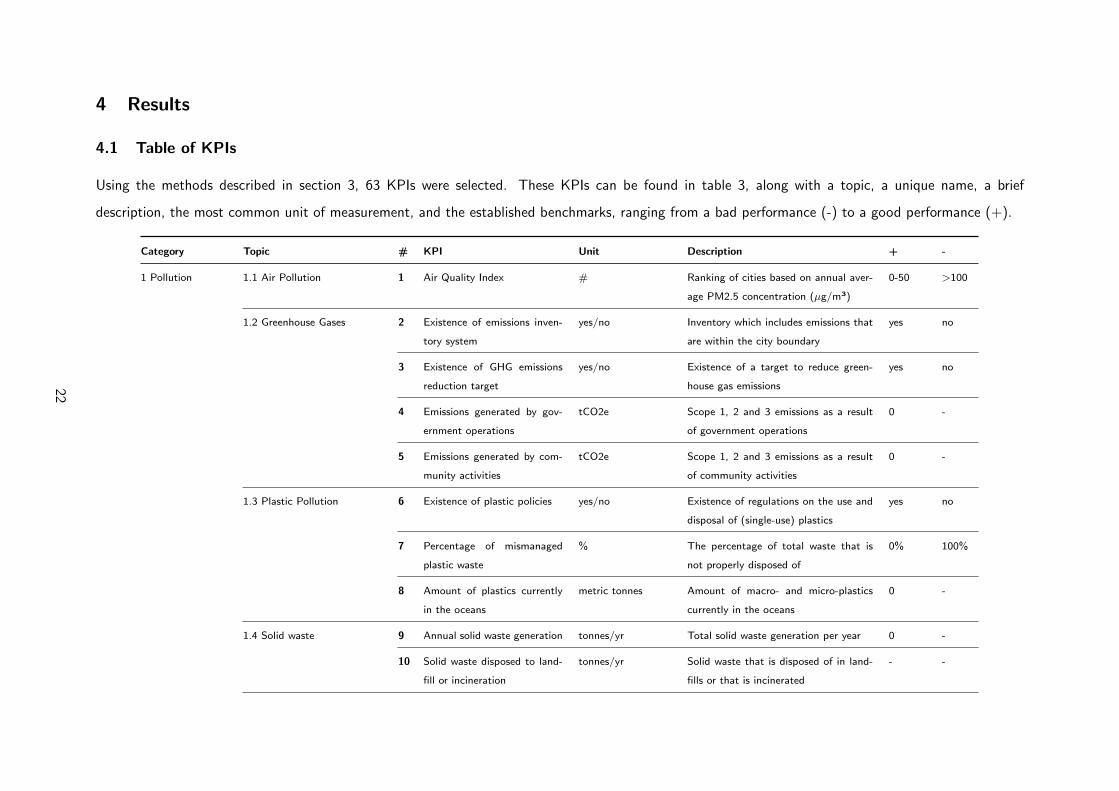
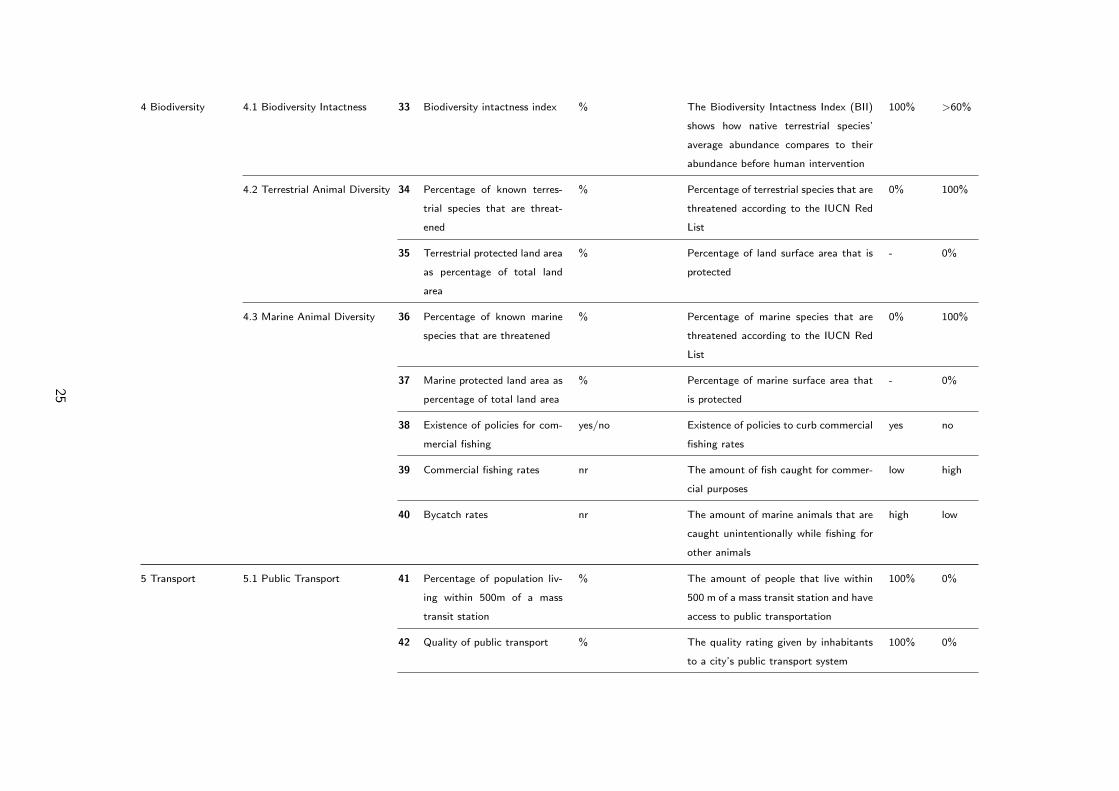
4.1 Table of KPIs
Using the methods described in section 3, 63 KPIs were selected. These KPIs can be found in table 3, along with a topic, a unique name, a brief
description, the most common unit of measurement, and the established benchmarks, ranging from a bad performance (-) to a good performance (+).
Category Topic # KPI Unit Description + -
1 Pollution 1.1 Air Pollution 1 Air Quality Index # Ranking of cities based on annual aver-
age PM2.5 concentration (µg/m³)
0-50 >100
1.2 Greenhouse Gases 2 Existence of emissions inven-
tory system
yes/no Inventory which includes emissions that
are within the city boundary
yes no
3 Existence of GHG emissions
reduction target
yes/no Existence of a target to reduce green-
house gas emissions
yes no
4 Emissions generated by gov-
ernment operations
tCO2e Scope 1, 2 and 3 emissions as a result
of government operations
0 -
5 Emissions generated by com-
munity activities
tCO2e Scope 1, 2 and 3 emissions as a result
of community activities
0 -
1.3 Plastic Pollution 6 Existence of plastic policies yes/no Existence of regulations on the use and
disposal of (single-use) plastics
yes no
7 Percentage of mismanaged
plastic waste
% The percentage of total waste that is
not properly disposed of
0% 100%
8 Amount of plastics currently
in the oceans
metric tonnes Amount of macro- and micro-plastics
currently in the oceans
0 -
1.4 Solid waste 9 Annual solid waste generation tonnes/yr Total solid waste generation per year 0 -
10 Solid waste disposed to land-
fill or incineration
tonnes/yr Solid waste that is disposed of in land-
fills or that is incinerated
- -
22

1.5 Recycling11 Solid waste diverted away
from landfill or incineration
% Solid waste that does not end up in land-
fills or incineration because of recycling
100% 0%
12 Percentage of population with
access to recycling
% Percentage of the population that have
access to a recycling point
100% 0%
1.6 Soil Pollution 13 Percentage of land that is pol-
luted
% Percentage of surface area that is af-
fected by soil pollution
0% -
1.7 Water Pollution 14 Percentage of heavy metal
concentration in river and lake
water bodies
% Heavy metal concentration in global
river and lake water bodies as a cause
of water pollution
0% 100%
15 Biochemical Oxygen Demand mg/L Measurement of non toxic organics in
water
<1
mg/L
>8
mg/L
16 Chemical Oxygen Demand mg/L Measurement of total toxic and non
toxic organics in water
- -
2 Resource Use 2.1 Water 17 Water consumption L/person/day The average liters of water used by one
person in one day
- -
18 Water stress level low-high The ability to meet a region’s demand
for water
low high
19 Existence of a public Water
Resource Management strat-
egy
yes/no Existence of a plan for dealing with wa-
ter use and resources
yes no
20 Existence of any current or fu-
ture risks to the city’s water
security
yes/no Existence of (climate change related)
risks that will decrease the city’s water
security
no yes
21 Percentage of population with
access to potable water supply
% Percentage of people that have access
to clean and safe drinkwater
100% 0%
2.2 Energy 22 Energy consumption kWh/household/yr The average amount of energy con-
sumed by one household per year
0 kWh -
23

23 Share of renewable energy
sources
% The share of a city’s energy mix that
consists of renewable sources
100% 0%
24 Existence of renewable energy
or electricity target
yes/no Existence of a target to increase the use
of renewable energy
yes no
25 Existence of target to increase
energy efficiency
yes/no Existence of a target to use energy more
efficiently and eliminating energy waste
yes no
26 Percentage of energy grid that
is zero carbon
% Zero carbon includes solar, wind, hydro,
biomass and geothermal as the source
to produce electricity
100% 0%
2.3 Food 27 Annual food waste tonnes/yr Amount of food that is wasted each year 0
tonnes/yr
-
28 Ecological footprint of con-
sumption per person
gha/person The Ecological Footprint per person is
a measure of the rates of consumption
and the total population of a country
<1.6 >5
3 Climate Hazards 3.1 Climate Hazards 29 Global Climate Risk Index # The Global Climate Risk Index shows
the level of exposure and vulnerability
to extreme weather events
>100 0-50
30 Existence of inventory of rele-
vant climate hazards
yes/no Existence of an inventory to keep track
of relevant current or future climate haz-
ards in a city
yes no
31 Most significant climate haz-
ards faced by the city
n/a Identification of the most important cli-
mate hazard a city faces or will face
no risks many
risks
or no
identifi-
cation
32 Existence of a climate change
risk and vulnerability assess-
ment
yes/no Existence of an assessment of current or
future risks and the city’s vulnerability
yes no
24
4 Biodiversity 4.1 Biodiversity Intactness 33 Biodiversity intactness index % The Biodiversity Intactness Index (BII)
shows how native terrestrial species’
average abundance compares to their
abundance before human intervention
100% >60%
4.2 Terrestrial Animal Diversity 34 Percentage of known terres-
trial species that are threat-
ened
% Percentage of terrestrial species that are
threatened according to the IUCN Red
List
0% 100%
35 Terrestrial protected land area
as percentage of total land
area
% Percentage of land surface area that is
protected
- 0%
4.3 Marine Animal Diversity 36 Percentage of known marine
species that are threatened
% Percentage of marine species that are
threatened according to the IUCN Red
List
0% 100%
37 Marine protected land area as
percentage of total land area
% Percentage of marine surface area that
is protected
- 0%
38 Existence of policies for com-
mercial fishing
yes/no Existence of policies to curb commercial
fishing rates
yes no
39 Commercial fishing rates nr The amount of fish caught for commer-
cial purposes
low high
40 Bycatch rates nr The amount of marine animals that are
caught unintentionally while fishing for
other animals
high low
5 Transport 5.1 Public Transport 41 Percentage of population liv-
ing within 500m of a mass
transit station
% The amount of people that live within
500 m of a mass transit station and have
access to public transportation
100% 0%
42 Quality of public transport % The quality rating given by inhabitants
to a city’s public transport system
100% 0%
25

43 GHG emissions caused by
public transport
tCO2e The total amount of GHG emissions
caused by public transport
0 -
5.2 Private Transport 44 Percentage of population that
owns a private car
% Describes how many people own a pri-
vate car
0% 100%
45 GHG emissions caused by pri-
vate transport
tCO2e The amount of GHG emissions caused
by private transport
0 -
46 Existence of a zero- or low-
emission in the city
yes/no The existence of an area in the city
where only zero- or low-emission vehi-
cles are allowed
yes no
5.3 Electric Vehicles 47 Percentage of private cars
that are electric
% The percentage of total private cars that
are electric
100% 0%
48 Public access EV charging
points per capita
nr The number of charging points for elec-
tric vehicles per capita
>1 0
5.4 Aviation 49 GHG emissions caused by avi-
ation
tCO2e The amount of GHG emissions caused
by air travel
0 -
50 Per capita emissions from
domestic and international
flights
kg The total combined emissions caused by
domestic and international flights per
capita
0 >500
6 Land Use 6.1 Deforestation 51 Deforestation rate Mha/yr The total forest surface area that is cut
down each year
0 -
52 Percentage of global land
cover that is tree cover
% The percentage of total land area that
is covered by trees
>30 0
6.2 Agriculture 53 GHG emissions caused by
agriculture
tCO2e The amount of GHG emissions caused
by agriculture
0 -
54 Percentage of land used for
agriculture
% The percentage of total land area used
for agriculture
- -
26

55 Surface area of potential agri-
cultural spaces in a city
km2 The total land area that has the poten-
tial to be turned into agricultural space
- -
56 Vulnerability to climate
change related agricultural
risks
n/a The vulnerability to climate related agri-
cultural risks such as droughts
not vul-
nerable
very
vulner-
able
7 Health 7.1 Public Health 57 Identification of risks to public
health or health systems asso-
ciated with climate change
yes/no Identification of risks to the public
health or health systems of a city
no risks many
risks
or no
identifi-
cation
7.2 Mortality 58 Excess mortality caused by ex-
treme heat
% Addresses the number of people that die
from extreme heat
0% 100%
59 Deaths caused by air pollution deaths per 100.000
people
Mortality rate linked to household and
ambient air pollution
0 >1
7.3 Illnesses 60 Number of heat related ill-
nesses
nr Identifies the amount of illnesses that
were caused by extreme heat
0 >1
61 Number of respiratory dis-
eases caused by increased air
pollution
nr Identifies the amount of respiratory dis-
eases that were caused by an increase in
air pollution
0 >1
8 Other8.1 Global Temperature 62 Annual rise in global temper-
ature
°C/yr The rise in global temperature per year <1.5 >2
8.2 Sea Level 63 Annual sea level rise mm/yr The rise of the sea level per year 0 3
Table 3: List of Key Performance Indicators related to climate change, as recorded through this study.
27

4.2 Definition KPIs
4.2.1 Pollution
4.2.1.1 Air Pollution
1. Air Quality Index
The Air Quality Index is a ranking of countries based on their ‘annual average PM2.5 concentration
weighted by population’ [64]. PM2.5 was chosen since it is generally considered to be the most
hazardous pollution to human health.
4.2.1.2 Greenhouse Gases
2. Existence of emissions inventory system
3. Existence of GHG emissions reduction target
4. Emissions generated by government operations
5. Emissions generated by community activities
The first indicator on greenhouse gases is the existence of an emissions inventory system [6]. This
is essential because without such an inventory, cities likely do not have data available for the other
indicators in this category. The next indicator is the existence of a reduction target of GHG emissions
[6]. Then there are two indicators focusing on emission generation. Emissions are separated into
those generated by government operations and those caused by community activities [19].
4.2.1.3 Plastic Pollution
6. Existence of plastic policies
7. Percentage of mismanaged plastic waste
8. Amount of plastics currently in the oceans
An indicator that is especially important when it comes to plastic pollution is whether cities or
countries have any policies in place on plastic use and disposal. Another relevant KPIs is the
amount of mismanaged plastic waste. This KPI is especially relevant in coastal cities or cities
directly connected to the ocean in some other way, for example by rivers. Mismanaged plastics can
directly lead to pollution of bodies of water. Furthermore, the amount of macro and microplastics
currently in the oceans is also an important KPI to consider, as this can have damaging effects on
marine ecosystems.
28

4.2.1.4 Solid Waste
9. Annual solid waste generation
10. Annual solid waste generation
It is important to both look into how much waste is generated and the way it is disposed of, to get
a full understanding of solid waste pollution. Therefore, the first KPI in this category is the annual
solid waste generation of a city or country. This is the total amount of waste that is generated in a
country or city in tonnes per year. As stated in section 3.1, disposal to controlled landfills is one of
the most common methods, followed by incineration and recycling. The second KPI for solid waste
is the amount of solid waste that is disposed of in landfills is incinerated. Recycling is not taken into
account here, because it is covered in the next section.
4.2.1.5 Recycling
11. Solid waste diverted away from landfill or incineration
12. Percentage of population with access to recycling
As mentioned above, waste can be disposed of in landfills or through incineration. However, another
important metric is how much waste is diverted away from landfills and incineration and is recycled
instead. This KPI is measured as the percentage of total waste that is recycled. The higher this
percentage, the smaller the amount of waste that ends up polluting the environment. In order to
increase this percentage, it is important to look at the next KPI in this category, the percentage of
people with access to recycling.
4.2.1.6 Soil Pollution
13. Percentage of land that is polluted
4.2.1.7 Water Pollution
14. Percentage of heavy metal concentration in river and lake water bodies
15. Biochemical Oxygen Demand
16. Chemical Oxygen Demand
The two types of pollutants found in water are heavy metal and organic pollutants [27], [28]. The
former can be described by the percentage of heavy metal concentration in water [65]. The Biological
Oxygen Demand (BOD) and the Chemical Oxygen Demand (COD) are two water quality indicators
29

that show the degree of organic pollution of water [66]. COD refers to the measurement of total
organics, including both toxic and non toxic organics, which means it is an indirect measure of
organic waste. BOD, on the other hand, is solely a measure for non toxic organics.
4.2.2 Resource Use
4.2.2.1 Water
17. Water consumption
18. Water stress level
19. Existence of a public Water Resource Management strategy
20. Existence of any current or future risks to the city’s water security
21. Percentage of population with access to potable water supply
There are many areas important to the use of water. The first KPI that can be considered is the
water consumption. This refers to the total amount of water that is used by the inhabitants of a
country or city over a specific time period. Another important KPI related to water use is the water
stress level of a country, which is a region’s ability to satisfy the water demand. The ratio between
all freshwater withdrawals and total available freshwater resources is used to determine the level of
water stress. Additionally, the percentage of people that have access to potable water supplies is a
key metric to consider, as there are still many people that do not have access to drinking water [29].
When it comes to cities in particular, there are two more KPIs based on the data collected by
the CDP. The first is the existence of a public Water Resource Management strategy. This is a
plan cities make for dealing with water use and resources. The second KPI is the existence of any
current and future risks to the city’s water security. This is important because when cities are aware
of potential risks, they can take actions to mitigate this.
4.2.2.2 Energy
22. Energy consumption
23. Share of renewable energy sources
24. Existence of renewable energy or electricity target
25. Existence of target to increase energy efficiency
26. Percentage of energy grid that is zero carbon
30

Energy consumption also includes a wide range of KPIs that are relevant to the topic. The first
KPI is energy consumption, which is the average amount of energy consumed by one household per
year. Secondly, the share of renewable energy sources in a city or country is a key metric. This KPI
measures the percentage of the energy mix that consists of renewable sources. Related to this is the
percentage of the energy grid that is zero carbon, which takes into account sources such as wind,
nuclear, hydro and solar power [34].
Two other KPIs in this topic aim to reduce energy use, especially that of non renewable resources.
The amount of energy needed to generate one unit of economic output is referred to as energy
intensity. That is why the next KPI is the existence of a target to increase energy efficiency. This
metric also relates to target 7.3 of the SDGs [67]. Additionally, the existence of a target for renewable
energy or electricity is important. The more renewable energy is consumed, the less non-renewable
energy is used, causing a decrease in CO2 emissions [68].
4.2.2.3 Food
27. Annual Food Waste
28. Ecological footprint of consumption per person
Based on the research in section 3.1, there are two important indicators related to food. The first
KPI is the annual food waste of a country or city. This is mainly relevant because a reduction
in food waste can improve water and food security [35]. Furthermore, the ecological footprint of
consumption per person should also be considered. This is an indicator based on consumption rates
and a country’s total population.
4.2.3 Climate Hazards
4.2.3.1 Climate Hazards
29. Global Climate Risk Index
30. Existence of inventory of relevant climate hazards
31. Most significant climate hazards faced by the city
32. Existence of a climate change risk and vulnerability assessment
For climate hazards, one main indicator is the Global Climate Risk Index (CRI) [69]. The Global
Climate Risk Index indicates the extent to which countries are exposed to and vulnerable to extreme
weather occurrences. Storms, floods, and heat waves are among the extreme weather occurrences
covered, and a ranking is given of the most affected countries.
31

The following indicators focus on a wider range of climate hazards. The first KPI is the existence
of an inventory of relevant climate hazards. Identifying current or future hazards is important for
the next KPI, which describes the most significant climate hazards that are faced by a city or
country. Keeping track of relevant climate hazards may teach countries a lot about how to reduce
susceptibility and increase resilience in the face of future climate-related disasters [70]. The last
indicator is the existence of a climate change risk and vulnerability assessment. This assessment is
based on various aspects: the projected climate threat, the geographic setting, and the sectors and
systems that are affected by the risks [71].
4.2.4 Biodiversity
4.2.4.1 Biodiversity Intactness
33. Biodiversity Intactness Index
One KPI that gives a clear indication of the biodiversity in a region is the Biodiversity Intactness
Index (BII). The BII compares the average abundance of native terrestrial species to their abundance
prior to human involvement.
4.2.4.2 Terrestrial Animal Diversity
34. Percentage of known terrestrial species that are threatened
35. Terrestrial protected land area as percentage of total land area
For terrestrial animal diversity, there are two relevant KPIs. The first is the percentage of known
terrestrial species that are threatened. Threatened species include those that are classified as critically
endangered, endangered, or vulnerable [72]. Apart from the species that are threatened, it is also
important to look at what is being done to preserve biodiversity. That is why the next indicator is
the percentage of total terrestrial land area that is protected.
4.2.4.3 Marine Animal Diversity
36. Percentage of known marine species that are threatened
37. Marine protected land area as percentage of total land area
38. Existence of policies for commercial fishing
39. Commercial fishing rates
40. Bycatch rates
32

The first two KPIs in this category are very similar to those in the previous category for terrestrial
animals. These indicators include the percentage of known marina species that are threatened and
the percentage of total marine areas that are protected.
Further indicators cover a more specific aspect of marine life. The first is the existence of policies
for commercial fishing. Policies such as limiting overfishing, outlawing harmful fishing methods, and
controlling unlawful fishing can all help to improve biodiversity protection [73]. It is also important
to consider the commercial fishing rates, and the bycatch rates, to give a clear indication of the
state of marine biodiversity.
4.2.5 Transport
4.2.5.1 Public Transport
41. Percentage of population living within 500m of a mass transit station
42. Quality of public transport
43. GHG emissions caused by public transport
For public transport, it is important to look into the accessibility and quality, but also the impact it
has on greenhouse gas emissions. Therefore, the first KPI is the percentage of people living within
500 meters of a mass transit station. This indicator is also used by the CDP in their questionnaire for
cities [6]. The next indicator is the quality of public transport. This is relevant because high-quality
public transport can lead to a decrease in the use of private modes of transportation [74]. Finally,
an indicator that covers the influence that public transport has on emissions is the GHG emissions
caused by public transport.
4.2.5.2 Private Transport
44. Percentage of population that owns a private car
45. GHG emissions caused by private transport
46. Existence of a zero- or low-emission zone in the city
There are three important KPIs that cover the topic of private transportation. The first is the
percentage of the population that owns a private car. Similarly to public transport, the emissions
should also be taken into account. That is why the next indicator is the GHG emissions caused by
private transport. The last KPI in this category, the existence of a zero- or low-emission zone in a
city, focuses on the aim to reduce emissions. This is an area in a city where only vehicles that cause
very little to zero emissions are allowed, such as electric cars.
33

4.2.5.3 Electric Vehicles
47. Percentage of private cars that are electric
48. Public access EV charging points per capita
Two indicators cover the important aspects of electric vehicles. First of all, the percentage of private
cars that are electric should be taken into account. Alternative fuels can lead to lower emissions, as
stated in section 3.1, so the higher this percentage, the larger the positive impact on the environment.
Secondly, the accessibility of electric vehicles can be looked at. That is why the next indicator is the
number of public access charging points for electric vehicles, per capita.
4.2.5.4 Aviation
49. GHG emissions caused by aviation
50. Per capita emissions from domestic and international flights
The final topic in the category of transport is aviation. One way in which air travel contributes to
climate change is through CO2 emissions [75]. That is why the first indicator describes the GHG
emissions caused by aviation. The second indicator also relates to emissions, but compares it based
on a country’s population. The emissions from domestic and international flights per capita can
differ a lot per country. One reason for this is that there are many countries where a large portion
of the population does not fly at all [76].
4.2.6 Land Use
4.2.6.1 Deforestation
51. Deforestation rate
52. Percentage of global land cover that is tree cover
Deforestation can be measured by two KPIs. The first is the deforestation rate. This is the total
forest surface area that is cut down per year. Secondly, the total percentage of global land cover
that is covered by trees is also an important indicator to take into account, in order to give a clear
indication of the current status of deforestation.
4.2.6.2 Agriculture
53. GHG emissions caused by agriculture
34

54. Percentage of land used for agriculture
55. Surface area of potential agricultural spaces in a city
56. Vulnerability to climate change related agricultural risks
One KPI that can be used to measure the impacts of agriculture on climate change is the GHG
emissions caused by agricultural activities. Additionally, two relevant indicators are the percentage
of land that is used for agriculture, and the surface area of potential agricultural spaces in a region.
A balance between these indicators is important because agriculture provides food security, but also
contributes to climate change. Finally, the vulnerability to climate change related agricultural risks,
such as droughts, should be considered.
4.2.7 Health
4.2.7.1 Public Health
57. Identification of risks to public health or health systems associated with climate change
To get a clear indication of the public health in relation to climatic change, the identification of
risks to public health or health systems associated with climate change is an important KPI. This
indicator is also used in the CDP questionnaire [6], and it makes cities aware of potential threats so
that they can be prepared.
4.2.7.2 Mortality
58. Excess mortality caused by extreme heat
59. Deaths caused by air pollution
Two climate change related mortality KPIs are important to consider. The first is the excess mortality
caused by extreme heat. As stated in section 3.1, climate change can increase the frequency and
intensity of heat waves, which in turn can lead to an increased death risk for vulnerable groups of
people. Secondly, the number of deaths caused by air pollution, both household and ambient air
pollution, is an important indicator. It directly relates to goal 3.9 of the SDGs [67]. This states
that in 2030, the number of deaths and diseases from hazardous chemicals and pollution should be
reduced.
4.2.7.3 Illnesses
60. Number of heat related illnesses
35

61. Number of respiratory diseases caused by increased air pollution
There are also two indicators when it comes to climate change related illnesses. The first is the
number of heat related illnesses. Section 3.1 states that heat waves have increased in frequency and
intensity, which can bring about illnesses such as heat stroke or heat exhaustion [77]. Furthermore,
air pollution can also cause illnesses, which is why the second KPI in this category is the number
of respiratory diseases caused by increased air pollution. These illnesses can include asthma, lung
cancer, and other serious diseases [78].
4.2.8 Others
4.2.8.1 Global Temperature
62. Annual rise in global temperature
The annual rise in global temperature is an important KPI for climate change. The speed, intensity,
and duration of global warming determine future climate-related hazards [79]. Some consequences,
such as ecosystem loss, may be long-term or permanent. This makes the rise in the earth’s temper-
ature a very relevant metric.
4.2.8.2 Sea Level
63. Annual sea level rise
The final KPI is the annual sea level rise. Sea levels are projected to keep rising for years to come,
which makes it important to monitor and decelerate the rise [79]. Small islands, low-lying coastal
regions, and deltas in particular benefit from a slower pace of sea level rise.
36

4.3 Visualizing KPIs
In figure 1, the categorical heatmap which depicts the use of several KPIs can be seen. 25 KPIs and
193 countries were included in the heatmap. The countries in the heatmap are separated into two
parts to make it legible, but both parts show the same KPIs.
Figure 1: Categorical heatmap showing the use of KPIs per country [69], [80]–[98]
37

5 Discussion
5.0.1 KPIs Related to Climate Change
The aim of this study was to investigate which KPIs can be used by countries or cities to monitor
and mitigate climate change. The first sub-question was “What are the KPIs that relate to climate
change?” This study found a total of 63 KPIs across eight main categories. All of these KPIs are
used to measure the performance of some country or city in relation to climate change. Together,
the eight clusters give a clear and complete picture of the current status of climate change, and
what can be changed based on these indicators.
These clusters build upon existing efforts described in section 2. While Hristov and Chirico,
Angelakoglou et al. and Amrina and Yusof focus on smart cities and organizations, this study has
found KPIs that can be used by cities and countries. Furthermore, the index covers more areas of
climate change than the aforementioned lists of KPIs. While all efforts discussed in section 2 cover
a varied range of topics related to sustainability and climate change, these topics are not consistent
over the different indexes, and often lack several of the important categories discussed in section
3.1. Although some of the efforts may cover the most essential KPIs for businesses, the lists are
insufficient for countries or cities to utilize.
With regards to cities in particular, the CDP is a promising effort. Many useful topics are covered
and data is available directly from the source, namely from the cities themselves. This research built
upon the efforts of the CDP by including more topics, and expanding it to countries as well.
As part of the related work in section 2, the SDGs are also discussed. Nine out of those goals
relate to climate change in some way, but one goal in particular: “Take urgent action to combat
climate change and its impacts” (goal 13). In table 4, a comparison between these indicators and
the KPIs found in this thesis can be seen. Only four of the KPIs defined in this thesis are also
covered by the indicators of goal 13, as can be seen the table. These KPIs are number 4, 5, 29 and
32 (Emissions generated by government operations, Emissions generated by community activities,
Global Climate Risk Index, Existence of a climate change risk and vulnerability assessment). Thus,
it can be concluded that the great majority of indicators are not utilized in the SDG that addresses
climate change.
Additionally, there are also indicators used for goal 13 that are not covered in this thesis. Some
indicators of the SDGs are very specific towards one of the targets set for 2030 and have therefore
not been found using the methods in this research. Others,
Another effort that is similar to this research is that of the CCPI. However, more aspects of
climate change have been covered in this study. Where the CCPI focuses on four topics, the index
38

presented in this thesis covers eight. There are five topics that are not associated with KPIs in the
CCPI. These are climate hazards, biodiversity, transport, land use, and health. As was established in
section 3.1, these are all important aspects to consider when it comes to climate change. Therefore,
including these topics helps make the presented index more complete.
A more thorough comparison is shown in table 5. The table lists the CCPI indicators and the
corresponding KPIs presented in this thesis. One insight that can be concluded from this is that only
six KPIs are also covered in the CCPI, namely number 3, 4, 5, 22, 23, and 24 (Existence of GHG
emissions reduction target, Emissions generated by government operations, Emissions generated
by community activities, Energy consumption, Share of renewable energy sources, Existence of
renewable energy or electricity target). This means that the vast majority of the KPIs are not
included in the CCPI.
However, as can be seen in table 5 there are also several indicators in the CCPI that are not
included in the index of KPIs. The CCPI uses indicators that compare a metric to a “well-below-
2°C compatible pathway” [12]. These metrics show the absolute difference between the current
performance and country-specific benchmarks for reaching the targets set for 2030. The list of KPIs
in this thesis does not include such comparisons in the indicators, but solely defines the indicators
that could be used for comparisons. Additionally, the CCPI uses separate indicators for current and
future performance, while in the KPIs in this thesis, no such distinction is made. Additional metrics
such as time can be used to compare the KPIs over time.
39

SDG indicator for goal 13 [11] Corresponding KPI(s) Comparison with the presented index
Number of deaths, missing persons and directly af-
fected persons attributed to disasters per 100,000
population
Global Climate Risk Index
(29)
Although this indicator is not directly
covered by the index, the number of
deaths is included in the Global Cli-
mate Risk Index.
Number of countries that adopt and implement na-
tional disaster risk reduction strategies in line with
the Sendai Framework for Disaster Risk Reduction
2015-2030
Existence of a climate change
risk and vulnerability assess-
ment (32)
A similar but slightly less specific indi-
cator is included in the index.
Proportion of local governments that adopt and im-
plement local disaster risk reduction strategies in
line with national disaster risk reduction strategies
Existence of a climate change
risk and vulnerability assess-
ment (32)
The same indicator is used for coun-
tries and local governments.
Number of countries with nationally determined
contributions, long-term strategies, national adap-
tation plans and adaptation communications, as
reported to the secretariat of the United Nations
Framework Convention on Climate Change
n/a No specific indicator on the general
contribution and strategies of countries
is included in the index.
Total greenhouse gas emissions per year Emissions generated by gov-
ernment operations (4) and
emissions generated by com-
munity activities (5)
The SDGs focus on GHG emissions in
general, while this index separates it
into government and community emis-
sions.
Extent to which (i) global citizenship education and
(ii) education for sustainable development are main-
streamed in (a) national education policies; (b) cur-
ricula; (c) teacher education; and (d) student as-
sessment
n/a No indicators for education are in-
cluded in the index.
Amounts provided and mobilized in United States
dollars per year in relation to the continued exist-
ing collective mobilization goal of the $100 billion
commitment through to 2025
n/a No indicators for financial help for de-
veloping countries are included in the
index.
Number of least developed countries and small is-
land developing States with nationally determined
contributions, long-term strategies, national adap-
tation plans and adaptation communications, as
reported to the secretariat of the United Nations
Framework Convention on Climate Change
n/a The indicators in the index make no
distinction between developing and de-
veloped countries.
Table 4: Comparison of the SDGs for goal 13 and the KPIs presented in this thesis.
40

CCPI indicator [12] Corresponding KPI(s) Comparison with the presented index
Current Level of GHG Emissions per
Capita
Emissions generated by govern-
ment operations (4) and emis-
sions generated by community
activities (5)
The CCPI focuses on GHG emissions in general,
while this index separates it into government and
community emissions.
Past Trend of GHG Emissions per
Capita
Emissions generated by govern-
ment operations (4) and emis-
sions generated by community
activities (5)
Unlike the CCPI, this index does not have separate
indicators for current and past emissions.
Current Level of GHG Emissions per
Capita compared to a well- below-
2°C compatible pathway
n/a This index does not include comparisons in the
KPIs, it solely states the KPIs that can be used
for comparisons.
GHG Emissions Reduction 2030 Tar-
get compared to a well- below-2°C
compatible pathway
Existence of GHG emissions re-
duction target (3)
This index does not include comparisons in the
KPIs, it solely states the KPIs that can be used for
comparisons. However, targets for GHG emissions
are covered in the index.
Current Share of Renewables per To-
tal Primary Energy Supply (TPES)
Share of renewable energy
sources (23)
Both indexes include a similar KPI on the share of
renewables.
Development of Energy Supply from
Renewable Energy Sources
n/a No specific KPI on the development of renewables
is included in the index.
Current Share of Renewables per
TPES compared to a well-below-2°C
compatible pathway
n/a This index does not include comparisons in the
KPIs, it solely states the KPIs that can be used
for comparisons.
Renewable Energy 2030 Target com-
pared to a well-below-2°C compati-
ble pathway
Existence of renewable energy or
electricity target (24)
This index does not include comparisons in the
KPIs, it solely states the KPIs that can be used for
comparisons. However, targets for renewable energy
are covered in the index.
Current Level of Energy Use
(TPES/Capita)
Energy consumption (22) Both indexes include a similar KPI on energy use.
Past Trend of TPES/Capita Energy consumption (22) Unlike the CCPI, this index does not have separate
indicators for current and past emissions.
Current Level of TPES/Capita com-
pared to a well-below-2°C compati-
ble pathway
n/a This index does not include comparisons in the
KPIs, it solely states the KPIs that can be used
for comparisons.
TPES/Capita 2039 Target com-
pared to a well-below-2°C compat-
ible pathway
n/a This index does not include comparisons in the
KPIs, it solely states the KPIs that can be used
for comparisons.
National Climate Policy n/a No KPI for general climate policy is included in this
index.
International Climate Policy n/a No KPI for general climate policy is included in this
index.
Table 5: Comparison of the CCPI and the KPIs presented in this thesis.
41

5.0.2 Units and Values
The information in table 3 helps to answer the second sub-question “Which units and values are
associated with these KPIs?” The table shows a qualitative or quantitative unit for each KPI that
was found. Alongside the units, two benchmarks are given for many KPIs. These benchmarks, based
either on theoretical data or on current use in policies, give an indication of what values the KPIs
can take. It also shows when a country or city performs well on a specific KPI, or when countries
should take extra actions.
5.0.3 Use of the KPIs
The heatmap presented in figure 1 provides insight into the final sub-question, “Which countries use
these KPIs to monitor their environmental impact and set climate change mitigation goals?” There
are six countries that use all of the KPIs included in the heatmap. These countries are Ireland, Italy,
the Netherlands, Poland, Portugal, and Spain. Additionally, there are seven more countries that use
all KPIs but one. These countries include Denmark, Estonia, France, Lithuania, Romania, Sweden,
and the United Kingdom. It is worth noting that these are all European countries.
Furthermore, out of the 25 KPIs used in the heatmap, twelve are used by more than 150 out
of 193 countries included in the heatmap. These indicators are number 9, 17, 18, 21, 22, 24, 27,
28, 29, 52, 54, and 59 (Annual solid waste generation, Water consumption, Water stress level,
Percentage of population with access to potable water supply, Energy consumption, Existence of
renewable energy or electricity target, Annual Food Waste, Ecological footprint of consumption per
person, Global Climate Risk Index, Percentage of global land cover that is tree cover, Percentage of
land used for agriculture, Deaths caused by air pollution). The only KPI that is used by all countries
and also has available data for each of them is number 27, the annual food waste in the countries.
One reason for this could be that food waste is a universal problem. Therefore, it is understandable
that each country aims to measure and monitor their food waste.
Overall, these results indicate that although there are several countries that make use of almost
all of the established KPIs, there are still many more that do not use them all. Additionally, the
majority of the KPIs are not yet used by many countries.
5.1 Limitations
One important limitation of this study is the available data. As stated before, all countries that
use every KPI are European. Data for other countries might not be available in the languages that
were used to search for the data. This can affect the accuracy of the information presented in the
heatmap, and thereby the answer to the question of which KPIs are used by countries to monitor
42
their environmental impact and set climate change mitigation goals.
Another limitation is the fact that all KPIs that were documented and included in this thesis
are based upon the criterion that they have been adopted by a country or city. This may leave out
certain important KPIs that have yet to be implemented. One such KPI is the “number of living
organisms lost per square kilometer of cut-down forest” [99]. This is an example of an indicator that
can be impactful, but is not currently used by countries or cities to establish policies. Moreover, this
study does not include the development of new KPIs that are not already covered by the selected
indicators, as this is outside the scope of this research.
One final limitation of this study was the lack of results KPIs related to economy and climate
policy. First of all, using the methods described in section 3, no economy related indicators were
found. Such indicators could be of importance, as climate change can have harmful effect on
economies and economic stability [100]. Secondly, the comparison with the CCPI in table 5 showed
that there is no KPI that covers general climate policies in the presented index. Indicators similar
to the ones in the CCPI could be added in order to make the index more complete.
5.2 Future Work
For future work, the heatmap could be expanded by including not only whether a country uses a KPI
or not, but also how that country performs on a particular KPIs. For performance measurements,
the benchmarks proposed in table 3 can be used. This could give a clear indication of what KPIs
countries perform well on, and for which KPIs it is necessary to take additional actions.
Moreover, the heatmap that was was developed for countries can also be made for cities. As
certain KPIs are mainly relevant for cities, such an additional heatmap could provide more insight
into the use of KPIs in cities. However, making this was outside the scope of this study, because
it would take a lot of time and data to develop. Furthermore, an indicator can be developed that
combines all or almost all of the KPIs included in this thesis. This indicator can be based on the
benchmarks in table 3, and it can provide a method to easily compare the overall performance of
countries
43
6 Conclusion
This study was performed to answer the research question “Which KPIs can be used by countries or
cities to monitor and mitigate climate change?” After conducting a thorough literature research of
relevant papers, 63 KPIs were identified and selected, across eight main topics: pollution, resource
use, climate hazards, biodiversity, transport, land use, health, and other.
Looking at the results in section 4, it can be concluded that although there already are many KPIs
that are used to measure climate change performance, many are not yet used on a large scale. While
individual policies can lead to specific desirable results, what is important is that the KPIs found in
this study are all used in unison to give a complete and comprehensive representation of countries’
efforts to mitigate climatic change. When implemented in a majority of countries, the indicators
can be used to monitor and mitigate climate change by providing a consistent and comparable
measure across countries and cities. The benchmarks give a clear indication of whether a country
or city performs well or not. When the performance is not sufficient, the appropriate action would
be for governments and policymakers to develop strategies to improve the performance. Therefore,
monitoring the individual KPIs and corresponding data is very important for giving insight into where
intervention is necessary.
This is why the KPIs aim to cover each important aspect of climate change and its consequences.
Although certain topics, such as economy and climate policy, are not yet included in the list presented
in this research, it does provide a more complete index than was found in related work. More topics
are covered and the indicators are aimed specifically at cities and countries. A more complete index
can be useful to develop in the future, but this research provides a good step in the right direction.
44

7 Bibliography
[1] T. Greene and P. Jacobs, 2020 Tied for Warmest Year on Record, NASA Analysis Shows –
Climate Change: Vital Signs of the Planet, 2021. [Online]. Available: https://www.nasa.
gov/press-release/2020-tied-for-warmest-year-on-record-nasa-analysis-
shows%20https://climate.nasa.gov/news/3061/2020-tied-for-warmest-year-
on-record-nasa-analysis-shows/.
[2] V. G. Lo-Iacono-Ferreira, S. F. Capuz-Rizo, and J. I. Torregrosa-Lopez, “Key Performance
Indicators to optimize the environmental performance of Higher Education Institutions with
environmental management system – A case study of Universitat Politecnica de Valencia,”
Journal of Cleaner Production, vol. 178, pp. 846–865, Mar. 2018, issn: 09596526. doi:
10.1016/j.jclepro.2017.12.184.
[3] P. Bosch, S. Jongeneel, V. Rovers, H.-M. Neumann, M. Airaksinen, and A. Huovila, “CITYkeys
CITYkeys indicators for smart city projects and smart cities,” Tech. Rep. January, 2020, pp. 1–
306. doi: 10.13140/RG.2.2.17148.23686.
[4] CDP, About us - CDP. [Online]. Available: https://www.cdp.net/en/info/about-us.
[5] CDP, Cities - CDP. [Online]. Available: https://www.cdp.net/en/cities.
[6] CDP, “Cities 2020 Questionnaire - CDP Cities disclosure cycle 2020,” 2020.
[7] I. Hristov and A. Chirico, “The role of sustainability key performance indicators (KPIs) in
implementing sustainable strategies,” Sustainability (Switzerland), vol. 11, no. 20, 2019,
issn: 20711050. doi: 10.3390/su11205742.
[8] K. Angelakoglou, N. Nikolopoulos, P. Giourka, I.-L. Svensson, P. Tsarchopoulos, A. Tryferidis,
and D. Tzovaras, “A Methodological Framework for the Selection of Key Performance Indica-
tors to Assess Smart City Solutions,” Smart Cities, vol. 2, no. 2, pp. 269–306, 2019. doi: 10.
3390/smartcities2020018. [Online]. Available: www.mdpi.com/journal/smartcities.
[9] E. Amrina and A. L. Vilsi, “Key performance indicators for sustainable manufacturing evalua-
tion in cement industry,” in Procedia CIRP, vol. 26, 2015, pp. 19–23, isbn: 9781457707391.
doi: 10.1016/j.procir.2014.07.173.
[10] United Nations, Transforming our world: the 2030 Agenda for Sustainable Development,
2015.
[11] United Nations, Global indicator framework for the Sustainable Development Goals and tar-
gets of the 2030 Agenda for Sustainable Development.
45

[12] J. Burck, U. Hagen, C. Bals, N. Hohne, and L. Nascimento, “Climate Change Performance
Index,” Germanwatch, Bonn, Tech. Rep., 2020, p. 13. [Online]. Available: https://www.
germanwatch.org/en/CCPI.
[13] EPA, Particulate Matter (PM) Pollution, 2016. [Online]. Available: https://www.epa.gov/
pm-pollution/particulate-matter-pm-basics.
[14] Occupational and Environmental Health Team, “WHO Air Quality Guidelines for Particulate
Matter, Ozone, Nitrogen Dioxide and Sulfur Dioxide,” World Health Organization, Occu-
pational and Environmental Health Team, Tech. Rep., 2006. [Online]. Available: https:
//apps.who.int/iris/handle/10665/69477.
[15] D. Easterbrook, “Greenhouse Gases,” in Evidence-Based Climate Science, Elsevier, 2016,
pp. 163–173, isbn: 9780123859563. doi: 10.1016/B978-0-12-804588-6.00009-4. [On-
line]. Available: https://linkinghub.elsevier.com/retrieve/pii/B9780128045886000094.
[16] J. Houghton, Global Warming The Complete Briefing, Third Edit. Cambridge University
Press, 2004, isbn: 0-511-21276-3.
[17] A. L. El Zein, “The Effect of Greenhouse Gases on Earth’s Temperature,” International
Journal of Environmental Monitoring and Analysis, vol. 3, no. 2, p. 74, 2015, issn: 2328-
7659. doi: 10.11648/j.ijema.20150302.16.
[18] W. K. Fong, M. Doust, and C. Deng-Beck, “Global Protocal for Community-Scale Greehouse
Gas Emission Inventories Execute Summary,” Tech. Rep., 2014, p. 12. [Online]. Available:
www.ghgprotocol.org/city-accounting.
[19] D. Dodman, “Forces driving urban greenhouse gas emissions,” Current Opinion in Environ-
mental Sustainability, vol. 3, no. 3, pp. 121–125, 2011, issn: 18773435. doi: 10.1016/j.
cosust.2010.12.013.
[20] S. B. Kurniawan, S. R. S. Abdullah, M. F. Imron, and N. I. Ismail, “Current state of marine
plastic pollution and its technology for more eminent evidence: A review,” Journal of Cleaner
Production, vol. 278, p. 123 537, 2021, issn: 09596526. doi: 10.1016/j.jclepro.2020.
123537. [Online]. Available: https://doi.org/10.1016/j.jclepro.2020.123537.
[21] G. Billard and J. Boucher, “The challenges of measuring plastic pollution,” Field Actions
Science Report, vol. 2019, no. Special Issue 19, pp. 68–75, 2019, issn: 1867-8521.
[22] S. Chadar and C. Keerti, “Solid Waste Pollution: A Hazard to Environment,” Recent Ad-
vances in Petrochemical Science, vol. 2, no. 3, 2017. doi: 10.19080/rapsci.2017.02.
555586. [Online]. Available: https://juniperpublishers.com/online-submission..
46

[23] G. Hamer, “Solid waste treatment and disposal: effects on public health and environmental
safety,” Biotechnology Advances, vol. 22, no. 1-2, pp. 71–79, Dec. 2003, issn: 07349750.
doi: 10.1016/j.biotechadv.2003.08.007. [Online]. Available: www.elsevier.com/
locate/biotechadvBiotechnologyAdvances22%20https://linkinghub.elsevier.
com/retrieve/pii/S0734975003001289.
[24] W. d’Ambrieres, “Plastics recycling worldwide: current overview and desirable changes,” The
Veolia Institute, Tech. Rep. Special Issue 19, 2019, pp. 12–21.
[25] European Environment Agency, Land and soil pollution — widespread, harmful and growing,
2020. [Online]. Available: https://www.eea.europa.eu/signals/signals- 2020/
articles/land-and-soil-pollution.
[26] FAO and UNEP, Global assessment of soil pollution: Report. Rome: FAO and UNEP, Jun.
2021, ch. 4, isbn: 978-92-5-134469-9. doi: 10.4060/cb4894en. [Online]. Available: http:
//www.fao.org/documents/card/en/c/cb4894en.
[27] A. A. Inyinbor, B. O. Adebesin, O. P. Abimbola, T. A. Adelani-Akande, D. O. Adewumi,
and T. A. Oreofe, “Water Pollution: Effects, Prevention, and Climatic Impact,” in Water
Challenges of an Urbanizing World, InTech, Mar. 2018. doi: 10.5772/intechopen.72018.
[Online]. Available: http://dx.doi.org/10.5772/intechopen.72018%20http://
www.intechopen.com/books/water-challenges-of-an-urbanizing-world/water-
pollution-effects-prevention-and-climatic-impact.
[28] C. Popa and M. Petrus, “Heavy metals impact at plants using photoacoustic spectroscopy
technology with tunable CO2 laser in the quantification of gaseous molecules,” Microchemical
Journal, vol. 134, pp. 390–399, 2017, issn: 0026265X. doi: 10.1016/j.microc.2017.07.
006. [Online]. Available: http://dx.doi.org/10.1016/j.microc.2017.07.006.
[29] World Health Organization, Drinking Water Fact Sheet, 2019. [Online]. Available: https:
//www.who.int/news-room/fact-sheets/detail/drinking-water.
[30] G. Soto-Montes and M. Herrera-Pantoja, “Implications of Climate Change on Water Resource
Management in Megacities in Developing Countries: Mexico City Case Study,” Environmental
Management and Sustainable Development, vol. 5, no. 1, p. 47, 2015. doi: 10.5296/emsd.
v5i1.8807.
[31] M. Stephenson, “Energy and Climate Change: Geological Controls, Interventions, and Miti-
gations,” in Energy and Climate Change, Elsevier, 2018, pp. 175–178, isbn: 9780128120224.
doi: 10.1016/B978-0-12-812021-7.00009-9. [Online]. Available: https://doi.org/
47

10.1016/B978-0-12-812021-7.00009-9%20https://linkinghub.elsevier.com/
retrieve/pii/B9780128120217000099.
[32] H. Ritchie and M. Roser, Energy, 2020. [Online]. Available: https://ourworldindata.
org/energy.
[33] European Commission, 2030 Climate & Energy Framework, 2018. [Online]. Available: https:
/ / ec . europa . eu / clima / policies / strategies / 2030 _ en # tab - 0 - 0 % 20https :
//ec.europa.eu/clima/policies/strategies/2030_en.
[34] European Commission, Energy Efficiency Targets, 2014. [Online]. Available: https://ec.
europa.eu/energy/topics/energy-efficiency/targets-directive-and-rules/
eu-targets-energy-efficiency_en.
[35] M. Kummu, H. de Moel, M. Porkka, S. Siebert, O. Varis, and P. J. Ward, “Lost food,
wasted resources: Global food supply chain losses and their impacts on freshwater, cropland,
and fertiliser use,” Science of the Total Environment, vol. 438, pp. 477–489, 2012, issn:
00489697. doi: 10.1016/j.scitotenv.2012.08.092. [Online]. Available: http://dx.
doi.org/10.1016/j.scitotenv.2012.08.092.
[36] FAO, IFAD, UNICEF, WFP, and WHO, “The State of Food Security and Nutrition in the
World 2020,” Rome, Tech. Rep., 2020. doi: 10.4060/ca9692en. [Online]. Available: https:
//doi.org/10.4060/ca9692en%20http://www.fao.org/documents/card/en/c/
ca9692en.
[37] R. Almond, M. Grooten, and T. ( Petersen, “WWF Living Planet Report 2020,” Tech. Rep.
2, 2020, pp. 43–7. [Online]. Available: https://f.hubspotusercontent20.net/hubfs/
4783129/LPR/PDFs/ENGLISH-FULL.pdf.
[38] S. Banholzer, J. Kossin, and S. Donner, “The Impact of Climate Change on Natural Disas-
ters,” in Reducing Disaster: Early Warning Systems For Climate Change, vol. 9789401785,
Dordrecht: Springer, 2014, pp. 21–49, isbn: 9789401785983. doi: 10.1007/978-94-017-
8598-3{\_}2. [Online]. Available: http://link.springer.com/10.1007/978-94-017-
8598-3_2.
[39] T. Schoennagel, J. K. Balch, H. Brenkert-Smith, P. E. Dennison, B. J. Harvey, M. A.
Krawchuk, N. Mietkiewicz, P. Morgan, M. A. Moritz, R. Rasker, M. G. Turner, and C. Whit-
lock, Adapt tomore wildfire in western North American forests as climate changes, 2017. doi:
10.1073/pnas.1617464114. [Online]. Available: www.pnas.org/lookup/suppl/doi:
10.1073/pnas.1617464114/-/DCSupplemental..
48
[40] K. Hore, I. Kelman, J. Mercer, and J. Gaillard, “Climate Change and Disasters,” in Handbook
of Disaster Research, Springer International Publishing, 2018, pp. 145–159. doi: 10.1007/
978-3-319-63254-4{\_}8. [Online]. Available: https://doi.org/10.1007/978-3-
319-63254-4_8%20http://link.springer.com/10.1007/978-3-319-63254-4_8.
[41] Y. T. Aparna Rahtore Jasrai, “Biodiversity : Importance and Climate Change Impacts,”
International Journal of Scientific and Research Publications, vol. 3, no. 3, p. 5, 2013.
[42] T. Newbold, L. N. Hudson, A. P. Arnell, S. Contu, A. De Palma, S. Ferrier, S. L. L. Hill,
A. J. Hoskins, I. Lysenko, H. R. P. Phillips, V. J. Burton, C. W. T. Chng, S. Emerson, D.
Gao, G. Pask-Hale, J. Hutton, M. Jung, K. Sanchez-Ortiz, B. I. Simmons, S. Whitmee, H.
Zhang, J. P. W. Scharlemann, and A. Purvis, “Has land use pushed terrestrial biodiversity
beyond the planetary boundary? A global assessment,” Science, vol. 353, no. 6296, pp. 288–
291, Jul. 2016, issn: 0036-8075. doi: 10.1126/science.aaf2201. [Online]. Available:
https://www.sciencemag.org/lookup/doi/10.1126/science.aaf2201.
[43] IUCN, Species and Climate Change, 2019.
[44] S. G. Kearney, V. M. Adams, R. A. Fuller, H. P. Possingham, and J. E. Watson, “Estimating
the benefit of well-managed protected areas for threatened species conservation,” ORYX,
vol. 54, no. 2, pp. 276–284, 2020, issn: 13653008. doi: 10.1017/S0030605317001739.
[Online]. Available: https://doi.org/10.1017/S0030605317001739.
[45] H. Ritchie and M. Roser, CO2 and Greenhouse Gas Emissions, 2020. [Online]. Available:
https://ourworldindata.org/co2-and-other-greenhouse-gas-emissions.
[46] American Public Transportation Association, Public Transportation Reduces Greenhouse
Gases and Conserves Energy, 2008.
[47] D. Banister, “Cities, mobility and climate change,” Journal of Transport Geography, vol. 19,
no. 6, pp. 1538–1546, 2011, issn: 09666923. doi: 10.1016/j.jtrangeo.2011.03.009.
[48] D. Dodman, “Blaming cities for climate change? An analysis of urban greenhouse gas emis-
sions inventories,” Environment and Urbanization, vol. 21, no. 1, pp. 185–201, 2009, issn:
09562478. doi: 10.1177/0956247809103016. [Online]. Available: www.sagepublications.
com.
[49] E. A. Nanaki and C. J. Koroneos, “Climate change mitigation and deployment of electric
vehicles in urban areas,” Renewable Energy, vol. 99, pp. 1153–1160, 2016, issn: 18790682.
doi: 10.1016/j.renene.2016.08.006.
[50] European Commission, Reducing emissions from aviation. [Online]. Available: https://ec.
europa.eu/clima/policies/transport/aviation_en.
49

[51] J. E. Penner, D. H. Lister, D. J. Griggs, D. J. Dokken, and M. McFarland, Aviation and the
Global Atmosphere: A Special Report of the Intergovernmental Panel on Climate Change,
J. E. Penner, D. H. Lister, D. J. Griggs, D. J. Dokken, and M. McFarland, Eds. Geneva:
Cambridge University Press, 1999.
[52] L. Bennett, “Deforestation and climate change,” Climate Institute, 2017.
[53] C. H. L. Silva Junior, A. C. M. Pessoa, N. S. Carvalho, J. B. C. Reis, L. O. Anderson, and
L. E. O. C. Aragao, “The Brazilian Amazon deforestation rate in 2020 is the greatest of the
decade,” Nature Ecology & Evolution, vol. 5, no. 2, pp. 144–145, Feb. 2021, issn: 2397-334X.
doi: 10.1038/s41559-020-01368-x. [Online]. Available: https://doi.org/10.1038/
s41559-020-01368-x.%20http://www.nature.com/articles/s41559-020-01368-x.
[54] European Environment Agency, Agriculture and climate change, 2015.
[55] Organisation for Economic Co-operation and Development, Agriculture and Climate Change:
Towards Sustainable, Productive and Climate-Friendly Agricultural Systems, 2016.
[56] R. Selvaraju, “Climate risk assessment and management in agriculture,” in Building resilience
for adaptation to climate change in the agriculture sector, 2012, pp. 71–90. [Online]. Avail-
able: http://www.fao.org/3/i3084e/i3084e06.pdf.
[57] CDC, Climate Effects on Health, 2020. [Online]. Available: https : / / www . cdc . gov /
climateandhealth/effects/default.htm%0Ahttps://www.cdc.gov/climateandhealth/
effects / default . htm % 0Ahttps : / / www . cdc . gov / climateandhealth / effects /
default.htm%20(Zugriff%20am%2028.06.2020)].
[58] CDC, Air Pollution, 2020. [Online]. Available: https://www.cdc.gov/climateandhealth/
effects/air_pollution.htm.
[59] G. Can, U. Sahin, U. Sayılı, M. Dube, B. Kara, H. C. Acar, B. Inan, O. Aksu Sayman, G.
Lebel, R. Bustinza, H. Kucukali, U. Guven, and P. Gosselin, “Excess Mortality in Istanbul
during Extreme Heat Waves between 2013 and 2017,” International Journal of Environmental
Research and Public Health, vol. 16, no. 22, p. 4348, Nov. 2019, issn: 1660-4601. doi: 10.
3390/ijerph16224348. [Online]. Available: www.mdpi.com/journal/ijerph%20https:
//www.mdpi.com/1660-4601/16/22/4348.
[60] S. E. Perkins, L. V. Alexander, and J. R. Nairn, “Increasing frequency, intensity and dura-
tion of observed global heatwaves and warm spells,” Geophysical Research Letters, vol. 39,
no. 20, 2012GL053361, Oct. 2012, issn: 0094-8276. doi: 10.1029/2012GL053361. [Online].
Available: https://onlinelibrary.wiley.com/doi/abs/10.1029/2012GL053361.
50

[61] N. W. Arnell, J. A. Lowe, A. J. Challinor, and T. J. Osborn, “Global and regional impacts of
climate change at different levels of global temperature increase,” Climatic Change, vol. 155,
no. 3, pp. 377–391, 2019, issn: 15731480. doi: 10.1007/s10584-019-02464-z. [Online].
Available: https://doi.org/10.1007/s10584-019-02464-z.
[62] N. Mimura, Sea-level rise caused by climate change and its implications for society, 2013.
doi: 10.2183/pjab.89.281.
[63] International Telecommunications Union, Key performance indicators related to the sustain-
ability impacts of information and communication technology in smart sustainable cities,
2015.
[64] IQAir, “2019 World Air Quality Report,” Tech. Rep., 2019, pp. 1–22. [Online]. Available:
https://www.iqair.com/world- most- polluted- cities/world- air- quality-
report-2019-en.pdf.
[65] Q. Zhou, N. Yang, Y. Li, B. Ren, X. Ding, H. Bian, and X. Yao, “Total concentrations and
sources of heavy metal pollution in global river and lake water bodies from 1972 to 2017,”
Global Ecology and Conservation, vol. 22, e00925, 2020, issn: 23519894. doi: 10.1016/j.
gecco.2020.e00925. [Online]. Available: https://doi.org/10.1016/j.gecco.2020.
e00925.
[66] A. S. Grover and M. Wats, “Pollution prevention and wastewater treatment in fish canning
industries of Northern Portugal,” in International Conference on Energy and Environmental
Science, vol. 54, 2013, pp. 48–52. doi: 10.7763/IPCBEE.
[67] UN General Assembly, “Transforming our world : the 2030 Agenda for Sustainable Devel-
opment,” vol. 16301, no. October, pp. 1–35, 2015. [Online]. Available: https://www.
refworld.org/docid/57b6e3e44.html.
[68] E. H. Lysen, “The Potential of Renewable Energy to Reduce CO2 Emissions,” in Climate
and Energy: The Feasibility of Controlling CO2 Emissions, P. A. Okken, R. J. Swart, and S.
Zwerver, Eds., Dordrecht: Springer Netherlands, 1989, pp. 78–94, isbn: 978-94-009-0485-9.
doi: 10.1007/978-94-009-0485-9{\_}6. [Online]. Available: https://doi.org/10.
1007/978-94-009-0485-9_6.
[69] D. Eckstein, V. Kunzel, and L. Schafer, “Global climate risk index 2021,” Germanwatch,
Bonn, Tech. Rep., 2021, p. 28. [Online]. Available: https://germanwatch.org/sites/
default/files/Global%20Climate%20Risk%20Index%202021_2.pdf.
51

[70] UNFCCC, Climate-related risks and extreme events. [Online]. Available: https://unfccc.
int / topics / resilience / resources / climate - related - risks - and - extreme -
events.
[71] The Covenant of Mayors for Climate and Energy, Assessing climate change risks and vul-
nerabilities. [Online]. Available: https://climate-adapt.eea.europa.eu/knowledge/
tools/urban-ast/step-2-4.
[72] Organisation for Economic Co-operation and Development, Threatened species, Dec. 2013.
doi: 10.1787/9789264202887-graph9-en. [Online]. Available: https://stats.oecd.
org/%20https://www.oecd- ilibrary.org/environment/oecd- environmental-
performance-reviews-south-africa-2013/threatened-species_9789264202887-
graph9-en.
[73] R. Barnes, “Fisheries and marine biodiversity,” Research Handbook on International Envi-
ronmental Law, no. September, pp. 542–563, 2010. doi: 10.4337/9781849807265.00038.
[74] J. L. Schofer, Mass transit, 2017. [Online]. Available: https://www.britannica.com/
topic/mass-transit.
[75] H. Ritchie and M. Roser, Emissions by sector. [Online]. Available: https://ourworldindata.
org/emissions-by-sector.
[76] H. Ritchie, Where in the world do people have the highest CO2 emissions from flying? 2020.
[Online]. Available: https://ourworldindata.org/carbon-footprint-flying.
[77] EPA, Climate Change Indicators: Heat-Related Illnesses, 2016. [Online]. Available: https:
//www.epa.gov/climate-indicators/heat-related-illnesses.
[78] A. R. Lara, Air Pollution-Related Illness, 2020. [Online]. Available: https://www.msdmanuals.
com/professional/pulmonary-disorders/environmental-pulmonary-diseases/
air-pollution%E2%80%93related-illness.
[79] M. R. Allen, O. Pauline Dube, W. Solecki, F. Aragon-Durand, W. Cramer France, S. Humphreys,
P. Dasgupta, R. Millar, O. Dube, W. Solecki, F. Aragon-Durand, W. Cramer, S. Humphreys,
M. Kainuma, J. Kala, N. Mahowald, Y. Mulugetta, R. Perez, M. Wairiu, K. Zickfeld, P. Zhai,
H.-o. Portner, D. Roberts, J. Skea, P. Shukla, A. Pirani, W. Moufouma-Okia, C. Pean, R.
Pidcock, S. Connors, J. Matthews, Y. Chen, X. Zhou, M. Gomis, E. Lonnoy, T. Maycock, M.
Tignor, and T. Waterfield, “Framing and Context,” in Global Warming of 1.5◦C. An IPCC
Special Report on the impacts of global warming of 1.5◦C above pre-industrial levels and
related global greenhouse gas emission pathways, in the context of strengthening the global
52

response to the threat of climate change, I. E. Idris, A. Fischlin, and X. Gao, Eds., Aus-
tralia, 2018, ch. 1, pp. 49–91. [Online]. Available: https://www.ipcc.ch/site/assets/
uploads/sites/2/2019/02/SR15_Chapter1_Low_Res.pdf.
[80] IQAir, “World Air Quality Report,” 2020 World Air Quality Report, no. August, pp. 1–35,
2020. [Online]. Available: https://www.iqair.com/world-most-polluted-cities/
world-air-quality-report-2019-en.pdf.
[81] United Nations Environmental Programme (UNEP), “Legal Limits on Single-Use Plastics
and Microplastics,” Tech. Rep., 2018, p. 118.
[82] J. R. Jambeck, R. Geyer, C. Wilcox, T. R. Siegler, M. Perryman, A. Andrady, R. Narayan,
and K. L. Law, “Plastic waste inputs from land into the ocean,” Science, vol. 347, no. 6223,
pp. 768–771, 2015, issn: 10959203. doi: 10.1126/science.1260352. [Online]. Available:
www.plasticseurope.org/Document/plastics-the-facts-.
[83] The World Bank, What a Waste Global Database, 2018. [Online]. Available: https://
datacatalog.worldbank.org/dataset/what-waste-global-database.
[84] FAO, AQUASTAT Core Database. [Online]. Available: http://www.fao.org/aquastat/
en/databases/maindatabase.
[85] H. Ritchie, Energy Production and Consumption, 2019. [Online]. Available: https : / /
ourworldindata.org/energy-production-consumption.
[86] H. Ritchie and M. Roser, Renewable Energy, 2020. [Online]. Available: https://ourworldindata.
org/renewable-energy.
[87] G. Kieffer and T. D. Couture, “Renewable Energy Target Setting,” Tech. Rep. June, 2015,
p. 80.
[88] European Commission, “2019 assessment of the progress made by Member States towards
the national energy efficiency targets for 2020,” Brussels, Tech. Rep., 2020, p. 18.
[89] United Nations Environment Programme, “Food Waste Index Report 2021,” Tech. Rep.,
2021, p. 99.
[90] Global Footprint Network, Ecological Footprint per Person, 2019. [Online]. Available: https:
//www.footprintnetwork.org/resources/data/.
[91] Organisation for Economic Co-operation and Development, Protected Areas. [Online]. Avail-
able: https://stats.oecd.org/.
[92] European Commission, Fishing Quotas, 2021. [Online]. Available: https://ec.europa.eu/
oceans-and-fisheries/fisheries/rules/fishing-quotas_en.
53

[93] H. Ritchie, Where in the world do people have the highest CO2 emissions from flying? 2020.
[Online]. Available: https://ourworldindata.org/carbon-footprint-flying.
[94] H. Ritchie, Deforestation and Forest Loss. [Online]. Available: https://ourworldindata.
org/deforestation.
[95] H. Ritchie, Forest Area. [Online]. Available: https://ourworldindata.org/forest-area.
[96] Organisation for Economic Co-operation and Development, Greenhouse gas emissions. [On-
line]. Available: https://stats.oecd.org.
[97] H. Ritchie and M. Roser, Land Use, 2019. [Online]. Available: https://ourworldindata.
org/land-use.
[98] H. Ritchie and M. Roser, Air Pollution, 2017. [Online]. Available: https://ourworldindata.
org/air-pollution.
[99] I. Vieira, P. Toledo, J. Silva, and H. Higuchi, “Deforestation and threats to the biodiversity
of Amazonia,” Brazilian Journal of Biology, vol. 68, no. 4 suppl, pp. 949–956, Nov. 2008,
issn: 1519-6984. doi: 10.1590/S1519-69842008000500004. [Online]. Available: http://
www.scielo.br/scielo.php?script=sci_arttext&pid=S1519-69842008000500004&
lng=en&tlng=en.
[100] Stanford Institute for Economic Policy Research (SIEPR), “Ten Facts about the Economics
of Climate Change and Climate Policy,” no. October, pp. 1–19, 2019.
54