7TH MASS MEDIA IN 2008
40
Excerpts from the TOMIAHONEN CONSULTING Report "7 TH MASS MEDIA IN 2008" This document is a free excerpt. It may be freely forwarded and may be quoted fully, without any prior permissions. TomiAhonen Consulting has a blog about the 7th Mass Media opportunity at www.7thmassmedia.com
description
This 7th Mass Media 2008 Report puts the overall 7th Mass Media business into context andexplains the scale and gives clarity to confusing terminology. While there are nearly 4 billionsubscribers, that is not 4 billion people with a mobile phone. One in four subscriptions is a second orthird subscription for the same user. The total unique mobile phone owner number is only 3 billion -still twice the number of the next biggest industry by reach. And of those 3 billion people, they do notactively carry around 4 billion phones. Some users have multiple SIM cards to switch betweennetworks and only have one phone. So the total installed base of mobile phones in use by the threebillion unique phone owners, is 3.4 billion mobile phones. Similarly the Report looks at the migrationof connectivity and the penetration rates of 2G, 2.5G and 3G. The Report also looks at the handsetmarket, on both the basis of new phone sales and installed base, of cameraphones, musicphones,smartphones, browser phones, etc. The data has breakdowns by region and by age.
Transcript of 7TH MASS MEDIA IN 2008

Excerpts from the TOMIAHONEN CONSULTING
Report "7TH MASS MEDIA IN 2008"
This document is a free excerpt. It may be freely forwarded and may be quoted fully, without any prior permissions. TomiAhonen Consulting has a blog about the 7th Mass Media opportunity at www.7thmassmedia.com

Excerpt from Report 7th Mass Media in 2008 By TomiAhonen Consulting December 1, 2008
This file may be freely forwarded www.7thMassMedia.com All information in this file may be quoted 2
Opinions on Tomi Ahonen and his insights into the m obile industry: "Tomi Ahonen has been always 2 years ahead of the mainstream industry analysts to predict trends in 3G and mobile content distribution."
Voytek Siewierski, Senior Executive Director, NTT DoCoMo Japan "Tomi knows that in the tumult of convergence between mobile and media, there lies opportunity."
Daniel Appelquist, Senior Technology Strategist, Vodafone Group UK "Marketers would do well to heed Tomi Ahonen’s call to action and understand the scale of the opportunity presented by mobile as a mass media."
Pekka Ala-Pietilä CEO and Co-Founder, Blyk Uk, Past President, Nokia Finland “Tomi Ahonen has always been a visionary and lucid thinker about media in general, but especially ahead of the pack in his insight about digital mobile phones."
Trip Hawkins, Chairman & CEO Digital Chocolate, Founder of Electronic Arts USA “Tomi offers a deep comprehension into how advertising concepts can be built using mobile phones."
BJ Yang, CEO AirCross South Korea
"I am a believer in Tomi's insight and forecast. Wireless technology has enabled the consumer to reject much of the one-way messaging they receive and re-sort the dialogue that's relevant to them."
Stephen C Jones, Chief Marketing Officer, Coca Cola USA
“Tomi Ahonen is the most thoughtful commentator on the mobile industry: his theory that mobile is a new mass media is spot on.”
Mark Curtis, CEO Flirtomatic UK, Author of Distraction: Being Human in a Digital Age "Tomi explains the compelling services the wireless industry will be able to develop and deploy."
Jeff Lawrence, Director of Technology, Intel USA "Tomi makes complex theories easy to understand, using practical examples from leading innovative countries in the world which can be applied to telecoms markets in Europe, Asia and North America."
Mark S Weisleder, Director of Channel Development, Bell Mobility Canada "Tomi has built a compelling story not just of how the mobile platform will evolve, but how the other 6 media platforms will ultimately be part of the 7th mobile platform."
Garrett Johnston, Chief Marketing Officer, MTS Russia "Tomi Ahonen brings out reasons why mobile is different, personal and independent of location."
Mike Short, VP of R&D, O2 UK, Chairman Mobile Data Association UK "When it comes to making money using mobile social networks I am now convinced that Tomi Ahonen is the man."
Oliver Starr Mobile Crunch USA "As he writes about and evaluates the possibilities and future markets for mobile services, Tomi Ahonen holds his finger at exactly the appropriate pulse of our times."
Teppo Turkki, Executive Advisor, Elisa Corporation Finland "Tomi Ahonen provides world references in a balanced, simple and elegant way with thoughtful and comparative benchmarking of the relevance of the world class mass market case studies."
Dr Hyun-oh Yoo, Chief Executive Officer, SK Communications , South Korea "About 5 years ago I saw a talk from Tomi Ahonen where he discussed multiple SIM ownership in Finland and mentioned the number of devices he carried. "Yeah yeah" I thought, filing him mentally under "crazy Finn" and getting back to business. But he was, of course, completely right."
Tom Hume, Managing Director Future Platforms UK
Excerpt from Report 7th Mass Media in 2008 By TomiAhonen Consulting December 1, 2008
This file may be freely forwarded www.7thMassMedia.com All information in this file may be quoted 3
Executive Summary TomiAhonen Consulting has released the world's first report on the 7th Mass Media channel, on December 1, 2008. The Seven Mass Media taxonomy first postulated by Tomi T Ahonen in 2005 and is now receiving global acceptance and referenced in five published books and several of the major industry giants from Nokia to Microsoft. This 7th Mass Media in 2008 Report makes the distinction of separating traditional "6th mass media channel" internet, ie the legacy "dumb and poor" internet content and services - even if delivered by a new smartphone such as an iPhone, Blackberry or N-Series, from the richer and lucrative "7th mass media" mobile-specific content and services. The mobile content industry was born in the Autumn of 1998 in Finland when the first downloadable ringing tone service launched. Since then the mobile content ("7th mass media") industry has grown by leaps and bounds, and is worth 71 billion dollars ten years later, in 2008. With this content split roughly 60:40 between mobile telecoms network operators (carriers), and the content owners, the 7th mass media space already supports four individual content categories worth roughly ten billion dollars each, led by mobile music at nearly 12 billion dollars in global revenues; gaming at 10 billion; television and video content at 10 billion; and mobile social networking at 9 billion dollars in annual revenues in 2008. Several other content categories that exceed one billion dollars in annual revenues include news services, adult entertainment, advertising, picture downloads, gambling, education etc. Each of the major content categories is surveyed in this Report and analyzed by user numbers, revenues, the installed base of handsets to support that category of service, and average revenues, revenues by active users, etc. Major content categories include breakdowns by regions and user age. At the start of the decade, mobile telecoms was just one high-tech industry among many. The global media and IT industries became fascinated by the mobile telecoms opportunity when they observed the rapidly expanding scale of mobile. As of December 31, 2008, there are 3.95 billion mobile phone subscriptions. These compare with 1.5 billion unique holders of credit cards, 1.4 billion television sets, 1.3 billion internet users, 1.2 billion fixed landine telephone subscriptions, 950 million personal computers, 850 million automobiles and 800 million cable/satellite TV subscribers. This 7th Mass Media 2008 Report puts the overall 7th Mass Media business into context and explains the scale and gives clarity to confusing terminology. While there are nearly 4 billion subscribers, that is not 4 billion people with a mobile phone. One in four subscriptions is a second or third subscription for the same user. The total unique mobile phone owner number is only 3 billion - still twice the number of the next biggest industry by reach. And of those 3 billion people, they do not actively carry around 4 billion phones. Some users have multiple SIM cards to switch between networks and only have one phone. So the total installed base of mobile phones in use by the three billion unique phone owners, is 3.4 billion mobile phones. Similarly the Report looks at the migration of connectivity and the penetration rates of 2G, 2.5G and 3G. The Report also looks at the handset market, on both the basis of new phone sales and installed base, of cameraphones, musicphones, smartphones, browser phones, etc. The data has breakdowns by region and by age. This Report also looks at mobile messaging, being a bearer for the 7th Mass Medium, and also being an interactivity channel and tool for the viral spreading of 7th Mass Media content. The global base of active mobile messaging users has passed the 3 billion user level in 2008 with 76% of all mobile phone subscribers actively using mobile messaging, and in almost every case this means that the majority of the mobile messaging is simple text messaging on SMS or equivalent services. Still, 2008 marks the first year when the global MMS multimedia messaging ("picture messaging") user number at 1.3 billion active users passes that of worldwide active users of internet-based email at 1.2 billion. The 7th Mass Media in 2008 report was authored by Tomi T Ahonen, the global authority on the statistics for the mobile industry, who is the former Global Head of Business Consultancy at Nokia and now CEO of TomiAhonen Consulting. Mr Ahonen has provided quantitative analysis leadership to the mobile side of the telecoms industry for over a decade chairing countless forecasting conferences and authoring dozens of articles about the state of the industry, as well as his six bestselling books. Tomi Ahonen is referenced in over 300 press articles including most of the major business press and is regulary quoted on the industry statistics and forecasts. Being a vocal critic of any discrepancies in published statistics for the mobile telecoms industry, Mr Ahonen is also often called the "stats police" for his stinging rebukes at his widely syndicated blog whenever a given analyst or periodical publishes outdated data or wildly implausible forecasts.
Excerpt from Report 7th Mass Media in 2008 By TomiAhonen Consulting December 1, 2008
This file may be freely forwarded www.7thMassMedia.com All information in this file may be quoted 4
Mobile Industry Revenues 2008
Operator Voice
Operator Data
Content Partners
Handset Vendors
Network Infrastructure
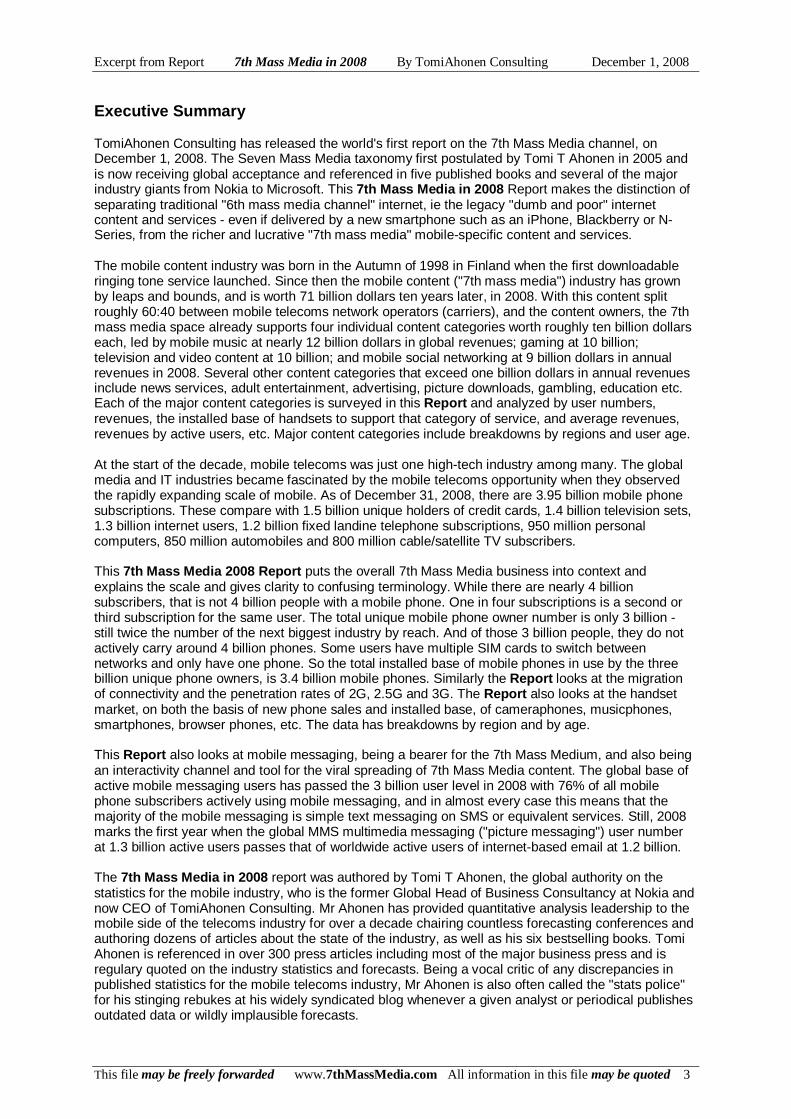
EXCERPTS FROM SECTION ON MOBILE INDUSTRY Mobile Industry Size In 2008 the mobile telecoms industry passed the Trillion dollar (1,000 Billion dollar) annual revenue level in total business and TomiAhonen Consulting projects the year to end with annual revenues of 1,039 Billion dollars. This total includes both services revenues and hardware sales revenues. This Report will not examine the rest of the mobile telecoms industry such as voice calls, enterprise applications, telematics, mobile commerce etc., except in passing that the 7th mass media content industry is part of the newest Trllion-dollar global industry. As the planet's aggregate GDP is 40 Trillion dollars, there is room for only a handful industries that reach this enormous size. Major industries such as television, movies, music, videogaming, print and advertising are all far less than half that number. The global beverages industry, hotel industry, financial services industry, etc are all far less than a Trillion dollars in size. Now mobile telecoms is similar in scale to the few giant industries of the world, such as the automobiles business, the food industry and the armaments business, each of which is roughly worth more than one Trillion dollars annually. Figure 1.1 Mobile Industry Revenues 2008, by major types Note that for the purposes of this Report, most of the revenues for the mobile telecoms industry are not within the scope of the Report. The total value of mobile mass-market media content in 2008 are 71 billion dollars, and the closely related person-to-person mobile messaging revenue is 132 billion dollars. As this forms 25% of the worldwide mobile telecoms software revenues in 2008, it can be reasonably also allocated to the hardware sector in the same percentage, that of the handset sales and infrastructure sales in 2008, 25% was related to content and messaging, and thus a total value of the 7th Mass Media related industries can be said to be 253 Billion dollars in 2008. By strict definition, however, at a minimum, 71 billion dollars of content revenues are generated by mass media content delivered on mobile phones in 2008.
Excerpt from Report 7th Mass Media in 2008 By TomiAhonen Consulting December 1, 2008
This file may be freely forwarded www.7thMassMedia.com All information in this file may be quoted 5
Mobile Subscribers, Phones in Use and Unique Owners
0
0.5
1
1.5
2
2.5
3
3.5
4
4.5
1998
1999
2000
2001
2002
2003
2004
2005
2006
2007
2008
Total Subscribers
Phones in Use
Unique Owners
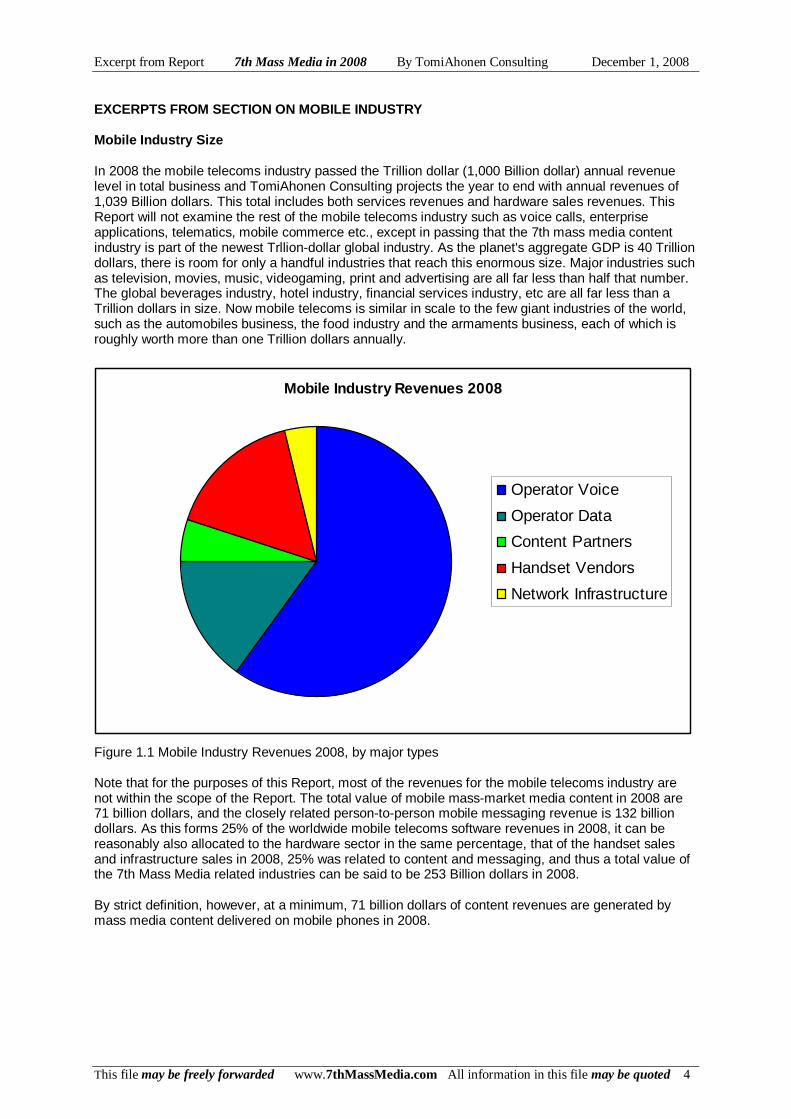
Subscribers, Subscriptions and Phones The global mobile phone subscriber base is about to hit 4 billion subscriptions. It is at 3.95 billion at the end of 2008. This number corresponds with 59% of the total population of the planet. In reality the subscription count is not an accurate measure of unique mobile phone owners. Since first observed in Finland in 1999, the phenomenon of the multiple subscription has spread everywhere and today one in four subscriptions is a second or third or even fourth subscription. TomiAhonen Consulting has been tracking the multiple subscription phenomenon and regularly reported on this little-understood phenomenon since 2001. Currently the count of unique mobile phone owners is 3.05 billion or 46% of the total population of the planet. Figure 2.1 Total mobile phones in use, compared with total mobile subscribers and unique mobile phone owners. Some subscribers who have two subscriptions will have two phones, such as today someone may carry an iPhone and a Blackberry. There is, however, a significant group of often less wealthy mobile phone owners, who have two or more subscriptions but cannot afford two phones, and switch two or more SIM cards on one phone, to select networks. There also are some customers who do this out of preferring to not carry two phones. Many manufacturers have introduced dual SIM card slot mobile phones to cater to this customer group, such as Samsung did earlier in 2008. For the purposes of the 7th mass media market, the practical maximum market size can be assumed to be the total mobile phone installed base of 3.4 billion. It is reasonable to assume, that while lower income moble phone owners with more than one subscription can indeed be consumers of mobile content, it is most likely, that they would only do so on one of their subscriptions, while perhaps optimizing some traffic on one or another account, such as music on one network and SIM card, and games on another. With the more affluent mobile subscribers who have two phones for their two subscriptions, it is reasonable to assume that they are prospective customers for content on both devices, while many will no doubt still optimize their traffic.
Excerpt from Report 7th Mass Media in 2008 By TomiAhonen Consulting December 1, 2008
This file may be freely forwarded www.7thMassMedia.com All information in this file may be quoted 6
Unique Mobile Phone Owners and Multiple Subscriptio ns, by Region
0200400600800
1,0001,2001,4001,600
USA & C
anad
a
Europ
e Wes
t
Europ
e Eas
t
APAC adv
ance
d
Asia d
evel
oping
Middle
Eas
t
Africa
Latin
Amer
ica
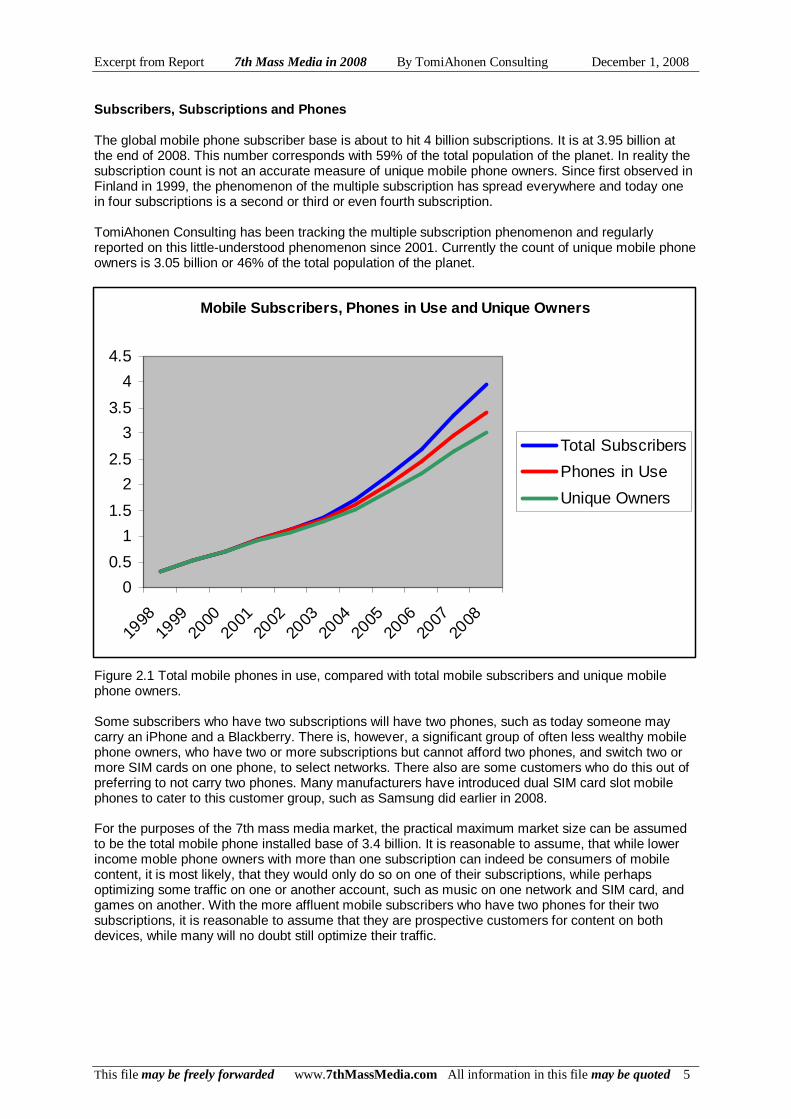
Multiple Subscripitions While there are 3.95 billion mobile phone subscribers at the end of 2008, that does not mean 3.95 billion individual people owning a mobile phone. Similar to how people may own multiple radio sets (or a single young employed adult may own two TV sets), the world has witnessed the emergence of the multiple mobile phone subscription. This was first observed in Finland starting in 1999 and first reported by Tomi T Ahonen at a Nokia conference in Vienna Austria in 2000. Today 32% of all mobile phone owners worldwide have more than one subscription. The phenomenon is universal, and only the relative scale of difference between continents is visible due to the degree of how far the penetration rates have grown in that part of the world. Europe leads in this area with well over half of Western Europeans, and nearly three fourths of East Europeans with a mobile phone, having two or more subscriptions. Even the USA is witnessing the phenomenon. Figure 1.4 Regional subscriptions and unique mobile phone owners 2008, millions The reasons for multiple subscriptions vary ranging from network coverage issues to pricing plan issues to specific phone or service availability issues to family reasons (family pricing plans for children etc). Having a free phone from the employer often results in wanting a second private phone, where the business phone number would be given out on business cards etc. The Report includes a full analysis of the mobile industry overall, and adds the following tables Figure 1.2 Total mobile subscriptions and total unique mobile phone subscribers Figure 1.3 Mobile Phone ownership globally, by age Figure 1.5 Multiple subscription distribution by age, Figure 1.7 Enterprise customers out of the total mobile subscriber base. Figure 1.9 Mobile phone penetration rates regionally, per capita.
Excerpt from Report 7th Mass Media in 2008 By TomiAhonen Consulting December 1, 2008
This file may be freely forwarded www.7thMassMedia.com All information in this file may be quoted 7
Mobile Subscribers by Network Generation
0%
10%
20%
30%
40%
50%
60%
70%
80%
90%
100%
2000 2001 2002 2003 2004 2005 2006 2007 2008
3G
2.5G
2G
1G
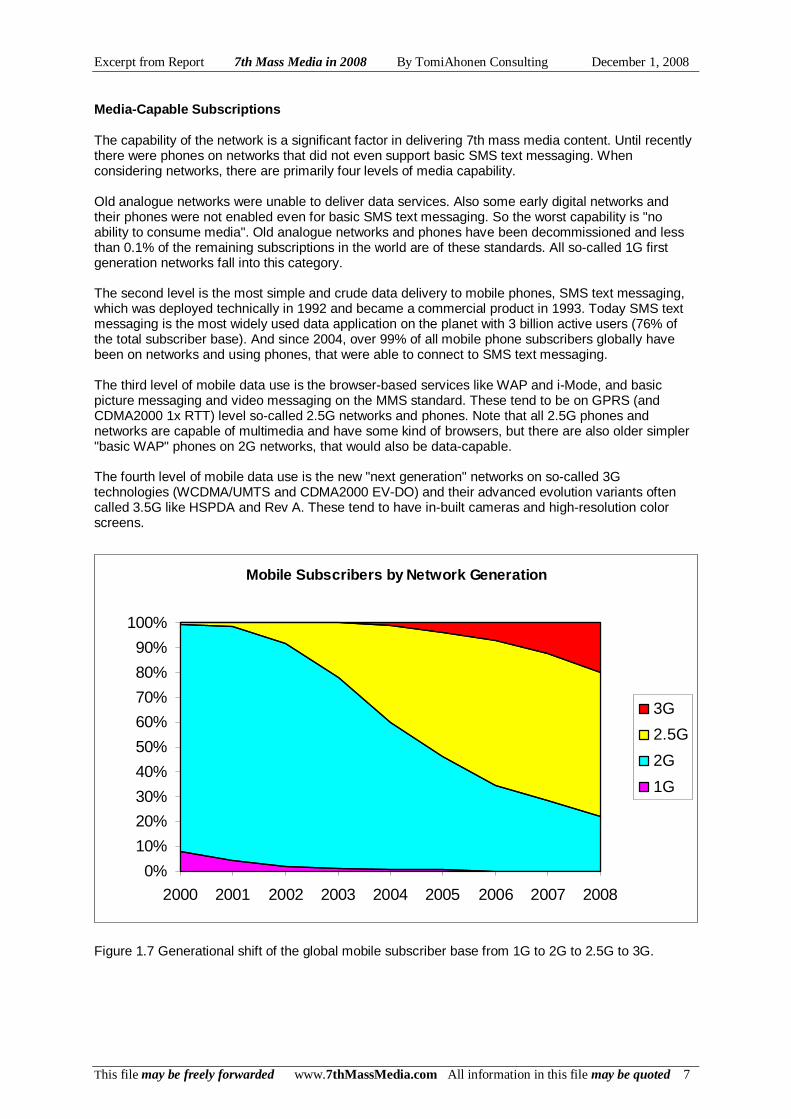
Media-Capable Subscriptions The capability of the network is a significant factor in delivering 7th mass media content. Until recently there were phones on networks that did not even support basic SMS text messaging. When considering networks, there are primarily four levels of media capability. Old analogue networks were unable to deliver data services. Also some early digital networks and their phones were not enabled even for basic SMS text messaging. So the worst capability is "no ability to consume media". Old analogue networks and phones have been decommissioned and less than 0.1% of the remaining subscriptions in the world are of these standards. All so-called 1G first generation networks fall into this category. The second level is the most simple and crude data delivery to mobile phones, SMS text messaging, which was deployed technically in 1992 and became a commercial product in 1993. Today SMS text messaging is the most widely used data application on the planet with 3 billion active users (76% of the total subscriber base). And since 2004, over 99% of all mobile phone subscribers globally have been on networks and using phones, that were able to connect to SMS text messaging. The third level of mobile data use is the browser-based services like WAP and i-Mode, and basic picture messaging and video messaging on the MMS standard. These tend to be on GPRS (and CDMA2000 1x RTT) level so-called 2.5G networks and phones. Note that all 2.5G phones and networks are capable of multimedia and have some kind of browsers, but there are also older simpler "basic WAP" phones on 2G networks, that would also be data-capable. The fourth level of mobile data use is the new "next generation" networks on so-called 3G technologies (WCDMA/UMTS and CDMA2000 EV-DO) and their advanced evolution variants often called 3.5G like HSPDA and Rev A. These tend to have in-built cameras and high-resolution color screens. Figure 1.7 Generational shift of the global mobile subscriber base from 1G to 2G to 2.5G to 3G.
Excerpt from Report 7th Mass Media in 2008 By TomiAhonen Consulting December 1, 2008
This file may be freely forwarded www.7thMassMedia.com All information in this file may be quoted 8
Penetration Rates of Mobile per Capita, Regionally
0%
20%
40%
60%
80%
100%
120%
140%
USA & C
anad
a
Europe
Wes
t
Europe
East
APAC adva
nced
Asia d
evelo
ping
Midd
le Eas
t
Africa
Latin
Americ
a
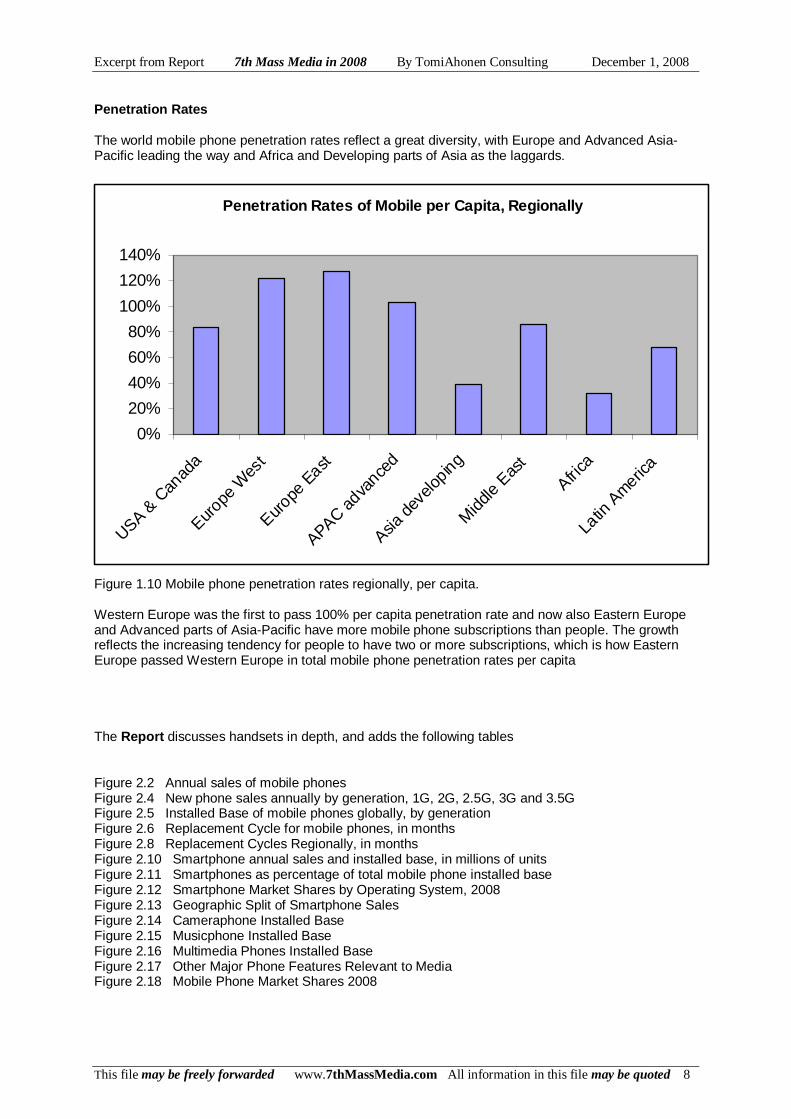
Penetration Rates The world mobile phone penetration rates reflect a great diversity, with Europe and Advanced Asia-Pacific leading the way and Africa and Developing parts of Asia as the laggards. Figure 1.10 Mobile phone penetration rates regionally, per capita. Western Europe was the first to pass 100% per capita penetration rate and now also Eastern Europe and Advanced parts of Asia-Pacific have more mobile phone subscriptions than people. The growth reflects the increasing tendency for people to have two or more subscriptions, which is how Eastern Europe passed Western Europe in total mobile phone penetration rates per capita The Report discusses handsets in depth, and adds the following tables Figure 2.2 Annual sales of mobile phones Figure 2.4 New phone sales annually by generation, 1G, 2G, 2.5G, 3G and 3.5G Figure 2.5 Installed Base of mobile phones globally, by generation Figure 2.6 Replacement Cycle for mobile phones, in months Figure 2.8 Replacement Cycles Regionally, in months Figure 2.10 Smartphone annual sales and installed base, in millions of units Figure 2.11 Smartphones as percentage of total mobile phone installed base Figure 2.12 Smartphone Market Shares by Operating System, 2008 Figure 2.13 Geographic Split of Smartphone Sales Figure 2.14 Cameraphone Installed Base Figure 2.15 Musicphone Installed Base Figure 2.16 Multimedia Phones Installed Base Figure 2.17 Other Major Phone Features Relevant to Media Figure 2.18 Mobile Phone Market Shares 2008
Excerpt from Report 7th Mass Media in 2008 By TomiAhonen Consulting December 1, 2008
This file may be freely forwarded www.7thMassMedia.com All information in this file may be quoted 9
Phone Replacement Cycles by Age
0 5 10 15 20 25
65+
56-65
46-55
36-45
26-35
16-25
6-15
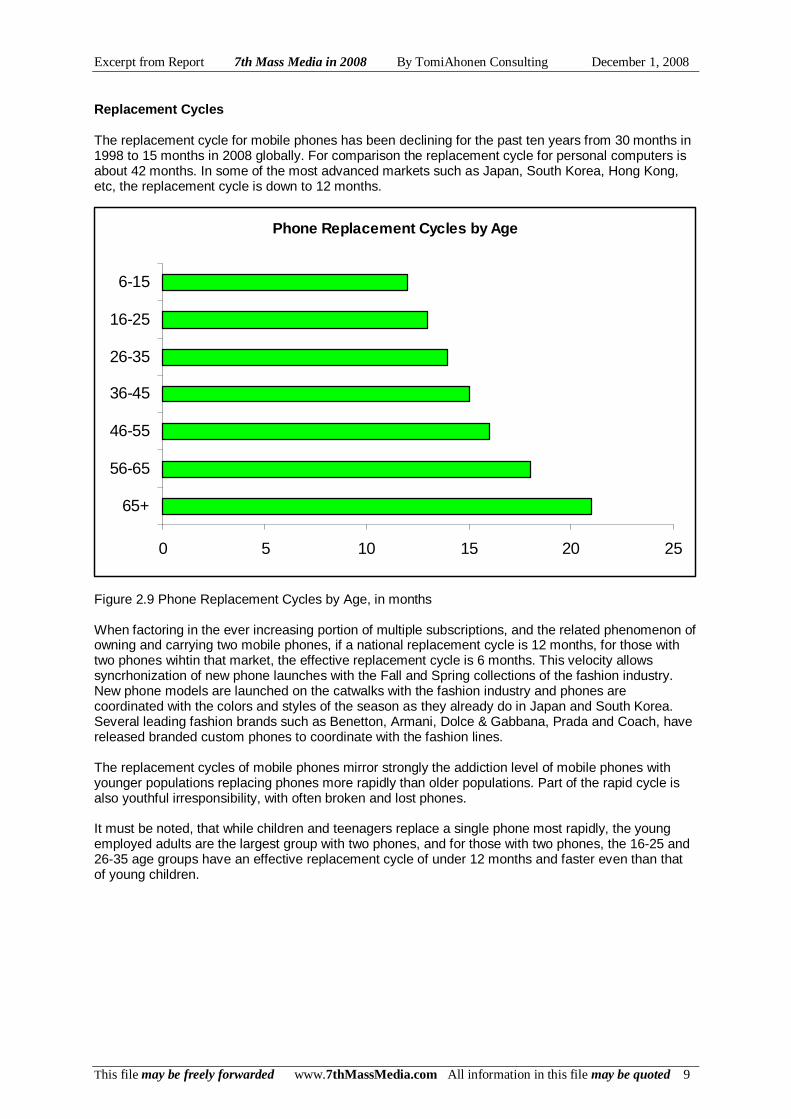
Replacement Cycles The replacement cycle for mobile phones has been declining for the past ten years from 30 months in 1998 to 15 months in 2008 globally. For comparison the replacement cycle for personal computers is about 42 months. In some of the most advanced markets such as Japan, South Korea, Hong Kong, etc, the replacement cycle is down to 12 months. Figure 2.9 Phone Replacement Cycles by Age, in months When factoring in the ever increasing portion of multiple subscriptions, and the related phenomenon of owning and carrying two mobile phones, if a national replacement cycle is 12 months, for those with two phones wihtin that market, the effective replacement cycle is 6 months. This velocity allows syncrhonization of new phone launches with the Fall and Spring collections of the fashion industry. New phone models are launched on the catwalks with the fashion industry and phones are coordinated with the colors and styles of the season as they already do in Japan and South Korea. Several leading fashion brands such as Benetton, Armani, Dolce & Gabbana, Prada and Coach, have released branded custom phones to coordinate with the fashion lines. The replacement cycles of mobile phones mirror strongly the addiction level of mobile phones with younger populations replacing phones more rapidly than older populations. Part of the rapid cycle is also youthful irresponsibility, with often broken and lost phones. It must be noted, that while children and teenagers replace a single phone most rapidly, the young employed adults are the largest group with two phones, and for those with two phones, the 16-25 and 26-35 age groups have an effective replacement cycle of under 12 months and faster even than that of young children.

Excerpt from Report 7th Mass Media in 2008 By TomiAhonen Consulting December 1, 2008
This file may be freely forwarded www.7thMassMedia.com All information in this file may be quoted 10
ORDER NOW The TomiAhonen Consulting Report "7th Mass Media in 2008" is now available directly from the consultancy. The 212 page report is released in electronic file form as a corporate licence and costs only 499 UKP (699 Euro / 899 US dollars) The 7th Mass Media Report covers the full mass media opportunity for mobile and covers the overall industry size; the factors that enable the services, such as hand- sets, networks, subscribers and subscriptions, revenue-sharing, etc. The 7th Mass Media in 2008 Report includes in-depth analysis of all major content categories such as music, gaming, video, TV picture downloads, news, adver- tising, adult entertainment, jokes, gambling, education, etc. Analysis includes user numbers, revenues, content-specific installed base of handsets, age and regional breakdowns, Ave- rage Revenues, Revenues per active users, etc. For orders and info, write to [email protected] Don't Forget Companion Volume Tomi T Ahonen's brand new hardcover book, Mobile as 7th of the Mass Media The 322 page book about how to make money with mobile as the newest mass media channel - the book includes 16 case studies such as Blyk, Flirtomatic, Cyworld, Kamera Jiten, i-Channel and SeeMeTV. The book is available at Amazon and all major booksellers. ISBN 978-0-9556069-5-3 For bulk orders contact publisher directly at www.futuretext.com
Excerpt from Report 7th Mass Media in 2008 By TomiAhonen Consulting December 1, 2008
This file may be freely forwarded www.7thMassMedia.com All information in this file may be quoted 11
Mobile Data Users by Different Definitions
00.5
11.5
22.5
33.5
4
Tot
al S
ubs
Mob
ile D
ata
incl
SM
S
SM
S u
sers
Mob
ile D
ata
Sub
scrip
tions
incl
inac
tives
Pre
miu
m D
ata
Use
rs
MM
S A
ctiv
eus
ers
Dow
nloa
ding
incl
rin
gton
e
Bro
wsi
ngU
sers
incl
WA
P
Pre
miu
mS
MS
Use
rs
Rea
l Int
erne
tA
cces
s ph
one
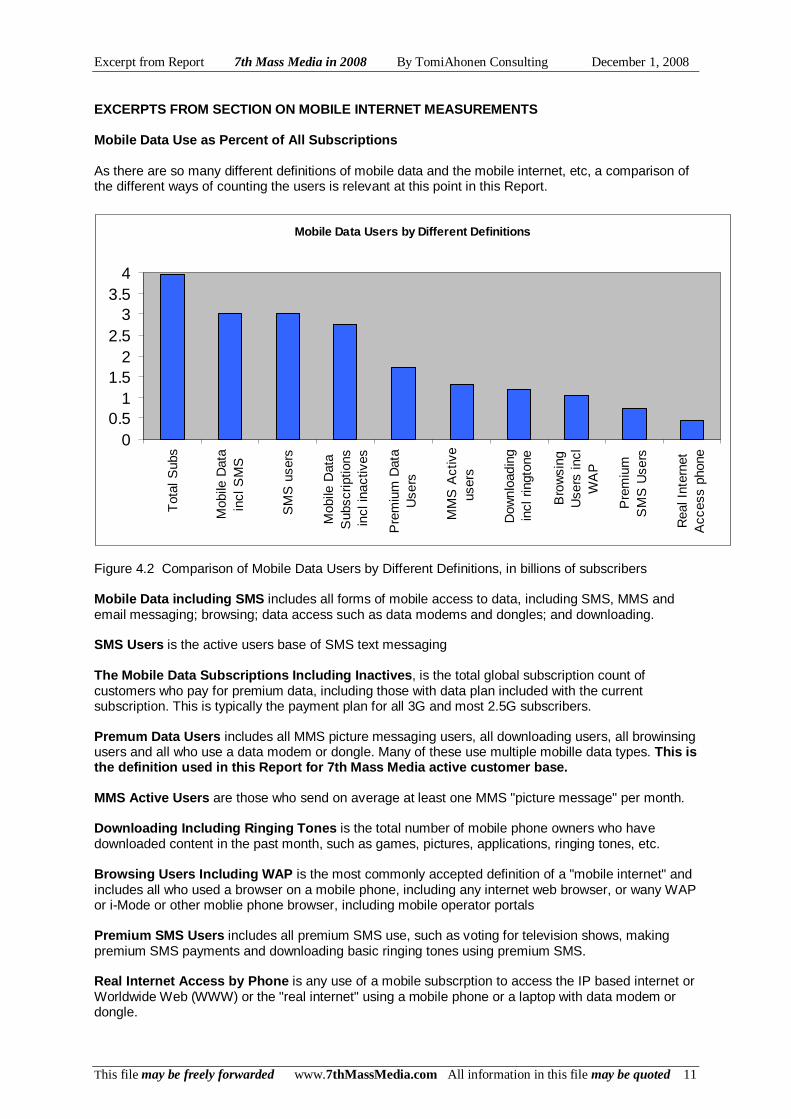
EXCERPTS FROM SECTION ON MOBILE INTERNET MEASUREMENTS Mobile Data Use as Percent of All Subscriptions As there are so many different definitions of mobile data and the mobile internet, etc, a comparison of the different ways of counting the users is relevant at this point in this Report. Figure 4.2 Comparison of Mobile Data Users by Different Definitions, in billions of subscribers Mobile Data including SMS includes all forms of mobile access to data, including SMS, MMS and email messaging; browsing; data access such as data modems and dongles; and downloading. SMS Users is the active users base of SMS text messaging The Mobile Data Subscriptions Including Inactives , is the total global subscription count of customers who pay for premium data, including those with data plan included with the current subscription. This is typically the payment plan for all 3G and most 2.5G subscribers. Premum Data Users includes all MMS picture messaging users, all downloading users, all browinsing users and all who use a data modem or dongle. Many of these use multiple mobille data types. This is the definition used in this Report for 7th Mass Media active customer base. MMS Active Users are those who send on average at least one MMS "picture message" per month. Downloading Including Ringing Tones is the total number of mobile phone owners who have downloaded content in the past month, such as games, pictures, applications, ringing tones, etc. Browsing Users Including WAP is the most commonly accepted definition of a "mobile internet" and includes all who used a browser on a mobile phone, including any internet web browser, or wany WAP or i-Mode or other moblie phone browser, including mobile operator portals Premium SMS Users includes all premium SMS use, such as voting for television shows, making premium SMS payments and downloading basic ringing tones using premium SMS. Real Internet Access by Phone is any use of a mobile subscrption to access the IP based internet or Worldwide Web (WWW) or the "real internet" using a mobile phone or a laptop with data modem or dongle.
Excerpt from Report 7th Mass Media in 2008 By TomiAhonen Consulting December 1, 2008
This file may be freely forwarded www.7thMassMedia.com All information in this file may be quoted 12
Internet Users by Device
0
0.2
0.4
0.6
0.8
1
1.2
1998 1999 2000 2001 2002 2003 2004 2005 2006 2007 2008
PC
Phone
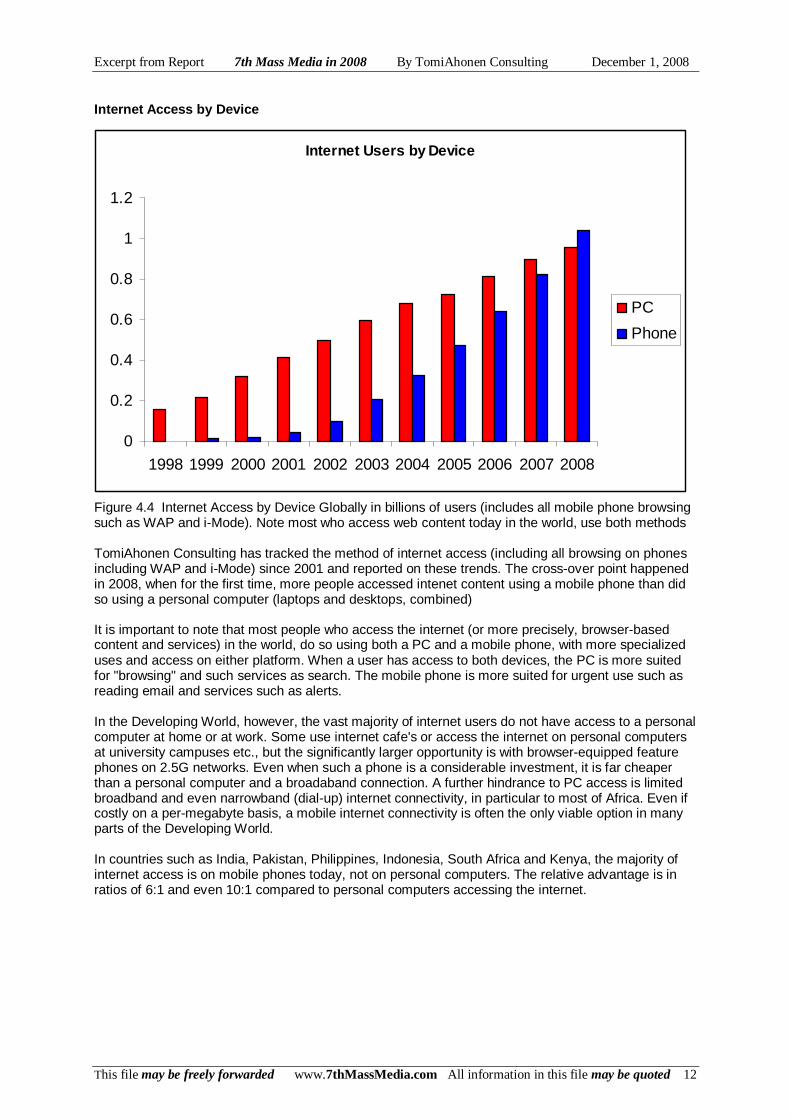
Internet Access by Device Figure 4.4 Internet Access by Device Globally in billions of users (includes all mobile phone browsing such as WAP and i-Mode). Note most who access web content today in the world, use both methods TomiAhonen Consulting has tracked the method of internet access (including all browsing on phones including WAP and i-Mode) since 2001 and reported on these trends. The cross-over point happened in 2008, when for the first time, more people accessed intenet content using a mobile phone than did so using a personal computer (laptops and desktops, combined) It is important to note that most people who access the internet (or more precisely, browser-based content and services) in the world, do so using both a PC and a mobile phone, with more specialized uses and access on either platform. When a user has access to both devices, the PC is more suited for "browsing" and such services as search. The mobile phone is more suited for urgent use such as reading email and services such as alerts. In the Developing World, however, the vast majority of internet users do not have access to a personal computer at home or at work. Some use internet cafe's or access the internet on personal computers at university campuses etc., but the significantly larger opportunity is with browser-equipped feature phones on 2.5G networks. Even when such a phone is a considerable investment, it is far cheaper than a personal computer and a broadaband connection. A further hindrance to PC access is limited broadband and even narrowband (dial-up) internet connectivity, in particular to most of Africa. Even if costly on a per-megabyte basis, a mobile internet connectivity is often the only viable option in many parts of the Developing World. In countries such as India, Pakistan, Philippines, Indonesia, South Africa and Kenya, the majority of internet access is on mobile phones today, not on personal computers. The relative advantage is in ratios of 6:1 and even 10:1 compared to personal computers accessing the internet.
Excerpt from Report 7th Mass Media in 2008 By TomiAhonen Consulting December 1, 2008
This file may be freely forwarded www.7thMassMedia.com All information in this file may be quoted 13
Internet Access Method Globally 2008
Only Phone access 32%
Both PC & Phone 38%
Only PC access 28%
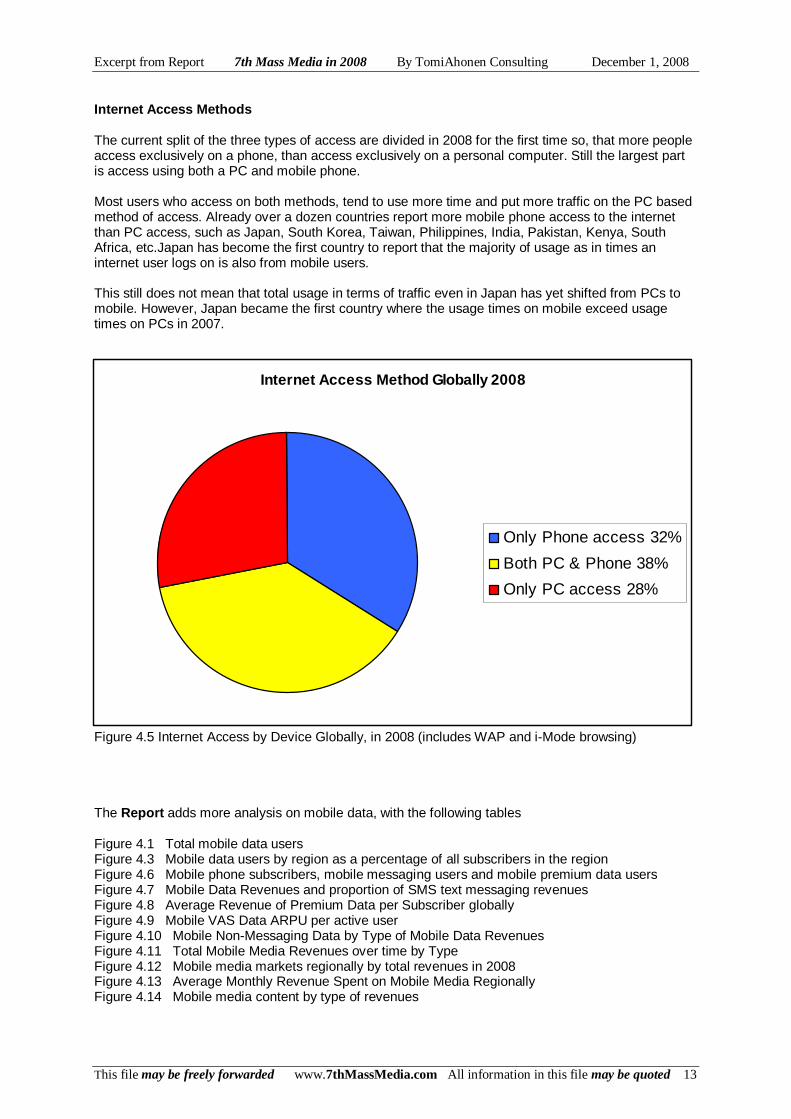
Internet Access Methods The current split of the three types of access are divided in 2008 for the first time so, that more people access exclusively on a phone, than access exclusively on a personal computer. Still the largest part is access using both a PC and mobile phone. Most users who access on both methods, tend to use more time and put more traffic on the PC based method of access. Already over a dozen countries report more mobile phone access to the internet than PC access, such as Japan, South Korea, Taiwan, Philippines, India, Pakistan, Kenya, South Africa, etc.Japan has become the first country to report that the majority of usage as in times an internet user logs on is also from mobile users. This still does not mean that total usage in terms of traffic even in Japan has yet shifted from PCs to mobile. However, Japan became the first country where the usage times on mobile exceed usage times on PCs in 2007. Figure 4.5 Internet Access by Device Globally, in 2008 (includes WAP and i-Mode browsing) The Report adds more analysis on mobile data, with the following tables Figure 4.1 Total mobile data users Figure 4.3 Mobile data users by region as a percentage of all subscribers in the region Figure 4.6 Mobile phone subscribers, mobile messaging users and mobile premium data users Figure 4.7 Mobile Data Revenues and proportion of SMS text messaging revenues Figure 4.8 Average Revenue of Premium Data per Subscriber globally Figure 4.9 Mobile VAS Data ARPU per active user Figure 4.10 Mobile Non-Messaging Data by Type of Mobile Data Revenues Figure 4.11 Total Mobile Media Revenues over time by Type Figure 4.12 Mobile media markets regionally by total revenues in 2008 Figure 4.13 Average Monthly Revenue Spent on Mobile Media Regionally Figure 4.14 Mobile media content by type of revenues
Excerpt from Report 7th Mass Media in 2008 By TomiAhonen Consulting December 1, 2008
This file may be freely forwarded www.7thMassMedia.com All information in this file may be quoted 14
Subscribers, Messaging Users, Data Users
00.5
11.5
22.5
33.5
44.5
1998
1999
2000
2001
2002
2003
2004
2005
2006
2007
2008
Total subscribers
Messaging users
Premium data users
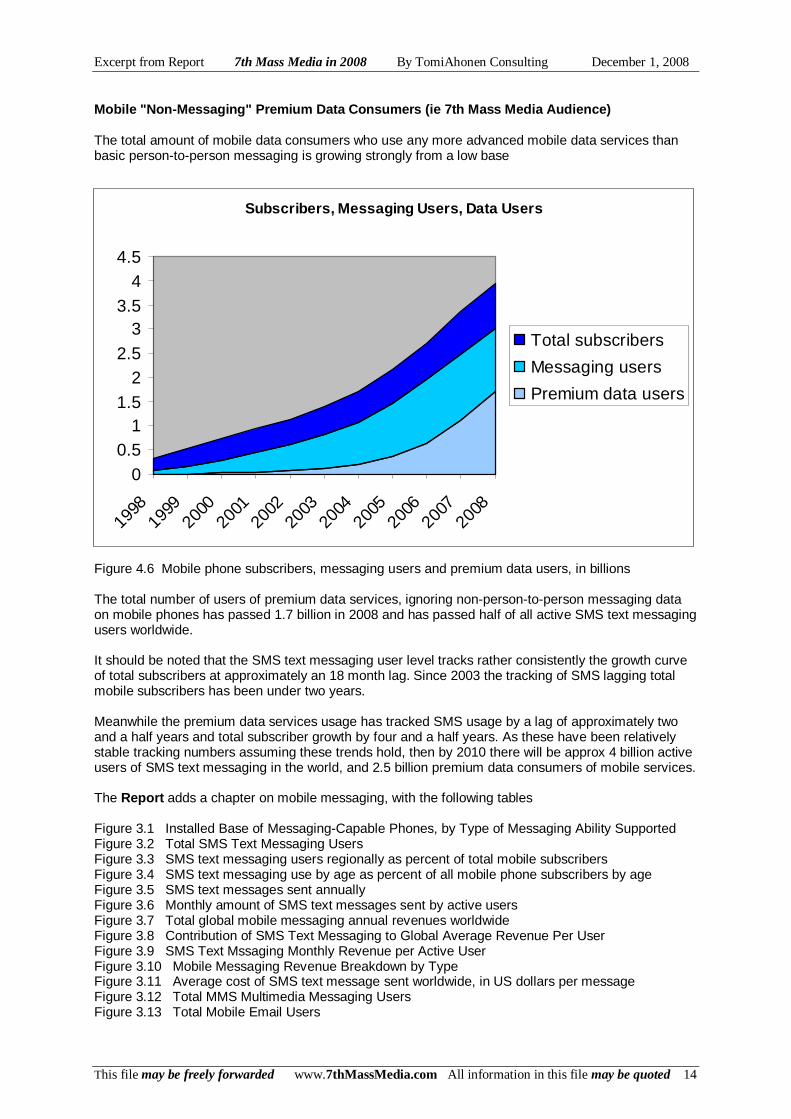
Mobile "Non-Messaging" Premium Data Consumers ( ie 7th Mass Media Audience) The total amount of mobile data consumers who use any more advanced mobile data services than basic person-to-person messaging is growing strongly from a low base Figure 4.6 Mobile phone subscribers, messaging users and premium data users, in billions The total number of users of premium data services, ignoring non-person-to-person messaging data on mobile phones has passed 1.7 billion in 2008 and has passed half of all active SMS text messaging users worldwide. It should be noted that the SMS text messaging user level tracks rather consistently the growth curve of total subscribers at approximately an 18 month lag. Since 2003 the tracking of SMS lagging total mobile subscribers has been under two years. Meanwhile the premium data services usage has tracked SMS usage by a lag of approximately two and a half years and total subscriber growth by four and a half years. As these have been relatively stable tracking numbers assuming these trends hold, then by 2010 there will be approx 4 billion active users of SMS text messaging in the world, and 2.5 billion premium data consumers of mobile services. The Report adds a chapter on mobile messaging, with the following tables Figure 3.1 Installed Base of Messaging-Capable Phones, by Type of Messaging Ability Supported Figure 3.2 Total SMS Text Messaging Users Figure 3.3 SMS text messaging users regionally as percent of total mobile subscribers Figure 3.4 SMS text messaging use by age as percent of all mobile phone subscribers by age Figure 3.5 SMS text messages sent annually Figure 3.6 Monthly amount of SMS text messages sent by active users Figure 3.7 Total global mobile messaging annual revenues worldwide Figure 3.8 Contribution of SMS Text Messaging to Global Average Revenue Per User Figure 3.9 SMS Text Mssaging Monthly Revenue per Active User Figure 3.10 Mobile Messaging Revenue Breakdown by Type Figure 3.11 Average cost of SMS text message sent worldwide, in US dollars per message Figure 3.12 Total MMS Multimedia Messaging Users Figure 3.13 Total Mobile Email Users

Excerpt from Report 7th Mass Media in 2008 By TomiAhonen Consulting December 1, 2008
This file may be freely forwarded www.7thMassMedia.com All information in this file may be quoted 15
Tomi T Ahonen available to provide seminars, workshops on 7th Mass Media TomiAhonen Consulting provides seminars and workshops that feature Tomi T Ahonen providing his invaluable insights and the latest of his "pearls". His workshops and seminars have been run on all six inhabited continents and are regularly booked by the leading global players in the seventh mass media space. His workshop has also been adapted into a university short course by Oxford University. Typical subjects that 7th Mass Media seminars and workshops cover include the mass media taxonomy and lessons learned from previous transitions such as when recordings (the first "new media" one hundred years ago) were introduced, of how recordings later adjusted to the advent of radio; how television cannibalized cinema and radio content, and how those media channels adapted, etc. The common misconception, that "the real internet" is the answer to the mobile phone content opportunity, is usually discussed, showing where the internet (6th mass media channel) had its unique competitive advantages compared with the five legacy media, and then how mobile replicates all of those, but adds seven unique benefits that no legacy mass media, including the internet, can copy. Typical 7th Mass Media seminars and workshops include the primary tool for creating compelling content for mobile, The Ahonen-Barrett-Goldberg tool of the Six M's (referenced in a dozen books and used by all major industry players from Nokia and Motorola to Vodafone and NTT DoCoMo) 7th Mass Media workshops and seminars will feature latest commercially launched services and innovations. The major content categories will be covered, and focus areas can be provided for specific content areas such as mobile advertising, mobile social networking, etc. Write to [email protected] to request a propo sal and book a seminar or workshop. In Johannesburg South Africa with Vodacom Strategy Keynote at 3GSM in Cannes France Keynote at Siemens Academy in Oman
Excerpt from Report 7th Mass Media in 2008 By TomiAhonen Consulting December 1, 2008
This file may be freely forwarded www.7thMassMedia.com All information in this file may be quoted 16
At Vodafone's Mobile Advertising in London In Kuala Lumpur Malaysia with Celcom Speaking to AIB Broadcast Awards London In San Francisco at Mobile Monday In Perth Australia with ITS With Ericsson Multimedia Club in Moscow Russia Press Interviews at 3G Mobile World Congress in Tokyo Japan

Excerpt from Report 7th Mass Media in 2008 By TomiAhonen Consulting December 1, 2008
This file may be freely forwarded www.7thMassMedia.com All information in this file may be quoted 17
Mobile Music by Type in 2008
Realtone
Ringback
Basic ringtones
MP3
Music video
Music stream
Other
EXCERPTS FROM SECTIONS ON MOBILE CONTENT TYPES Mobile Music The first content was the humble ringing tone, launched by Saunalahti (now part of Elisa) and first downloaded on the Radiolinja (now also part of Elisa) network, onto only five models of only Nokia phones, that had that peculiar feature, that they accepted "user-installed" ringing tones. The mass-market phone model that was most popular at the time, was the Nokia 5110 and that phone was the most used to consume mobile content in its first year. The total costs of setting up the business was so modest, that Saunalahti broke even after 10,000 songs were sold. In fifteen months they had sold a million songs and for the internet service provider, that Saunalahti/Jippii was at the time, more than half of all of their revenues were generated by this "silly" mobile music concept. Soon ringing tones would propel famed artists to enormous profits - such as 50 Cent with his hit In Da Club, which in 2003 earned more as ringing tone than all other music formats combined - and more notoriously the Crazy Frog - to the tune of 500 million dollars of global sales of their ring tones and related services in 2005 - one ringing tone earning more than all of iTunes global sales that year. Mobile Music by Type Figure 5.8 Mobile Music by Type in 2008, divided by percentage of total mobile music revenues The Report includes a full analysis of the mobile music market, and includes the following tables Figure 5.1 Installed base of music-capable phones globally Figure 5.2 Musicphone Market Shares in 2008 by manufacturer Figure 5.3 Mobile music consumers Figure 5.4 Total Mobile Music Revenues annually Figure 5.5 Monthly average revenue for music per mobile subscriber Figure 5.6 Monthly mobile music revenues per active consumer of mobile music Figure 5.7 Mobile Music spending regionally Figure 5.9 Consumers of Mobile Music by Age, as Percent of All Mobile Subscribers Figure 5.10 Mobile Music Revenues Operator Share

Excerpt from Report 7th Mass Media in 2008 By TomiAhonen Consulting December 1, 2008
This file may be freely forwarded www.7thMassMedia.com All information in this file may be quoted 18
Gaming Revenues Regionally
0
1
2
3
4
5
6
USA & C
anad
a
Europe
Wes
t
Europe
East
APAC adva
nced
Asia d
evelo
ping
Midd
le Eas
t
Africa
Latin
Americ
a
Mobile Gaming Mobile phone gaming started when Nokia installed the original Snake game on selected mobile phones in 1998. Since then, Snake and its later evolutions has become the worlds most-played videogame, estimated to be played by more than a billion casual gamers on their phones. The mass media opportunity for gaming is generally considered to exclude built-in games on phones, and only to include games that users download or side-load to phones, and any games that users play on the phones through the network, in anything from simple puzzle games via SMS text messaging, such as quizzes Who Wants to be a Millionaire, to massively multiplayer games such as Disney's Pirates of the Caribbean on mobile phones. Mobile Gaming Regional Split The vast majority of mobile gaming revenues come from two countries, Japan and South Korea. These two countries have delivered half of the total global gaming revenues up to 2007. Now some other advanced Asian "Tiger Economy" countries are delivering significant mobile gaming revenues as well, lead by Taiwan. European and US mobile gaming also grows in relevance, but the biggest rival to Japan's and South Korea's dominance in mobile gaming is China which alone delivers more than a billion dollars of mobile gaming income in 2008. Figure 6.8 Mobile Gaming Revenues Regionally in 2008, in Billions of US Dollars The Report includes a full analysis of the mobile gaming market, and includes the following tables Figure 6.1 Total mobile gaming consumers in the world Figure 6.2 Gaming-capable phone installed base by major gaming abilities Figure 6.3 Global Mobile Gaming Revenues Figure 6.4 Global Contribution of Mobile Gaming to Average Revenue per Subscriber Figure 6.5 Monthly Average Revenue of Mobile Gaming by Active Mobile Gamer Figure 6.6 Mobile Gaming by Type Figure 6.7 Moblie Gaming by Age Figure 6.9 Mobile Gaming Revenues Operator Share
Excerpt from Report 7th Mass Media in 2008 By TomiAhonen Consulting December 1, 2008
This file may be freely forwarded www.7thMassMedia.com All information in this file may be quoted 19
Installed Bsae of Videoclip Capable Phones by Type
0%
20%
40%
60%
80%
100%
1998
1999
2000
2001
2002
2003
2004
2005
2006
2007
2008
Basic
Color Screen
3G
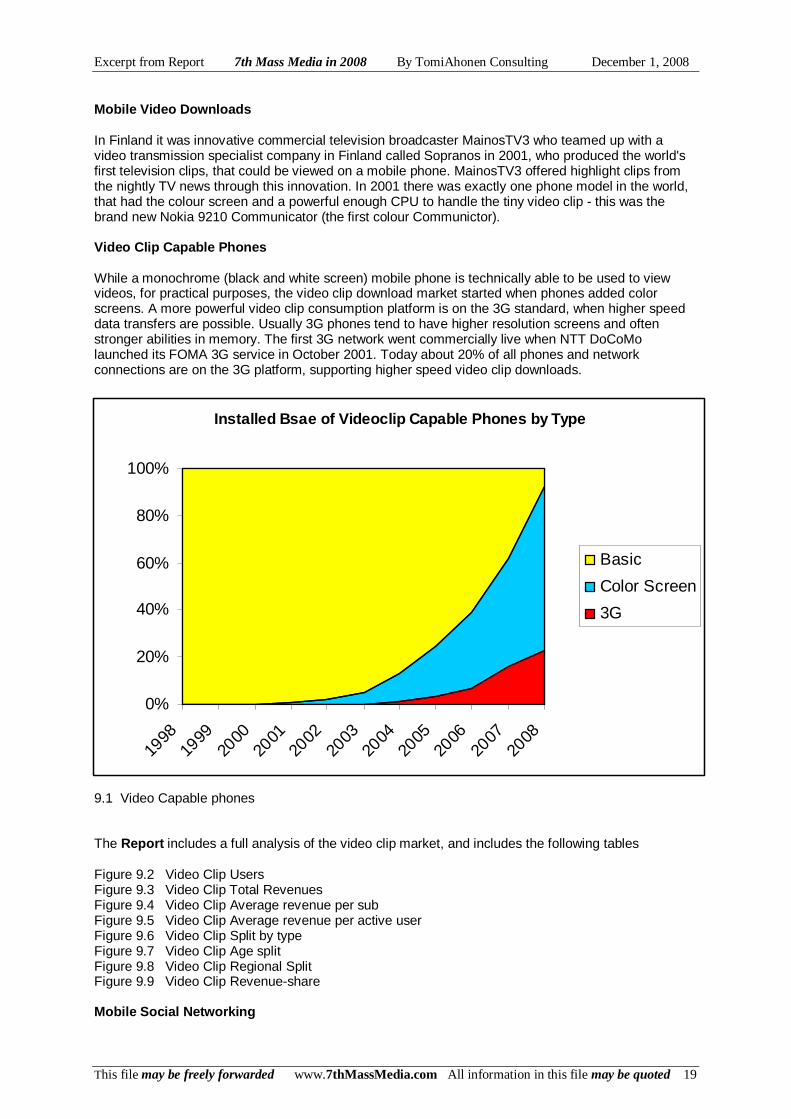
Mobile Video Downloads In Finland it was innovative commercial television broadcaster MainosTV3 who teamed up with a video transmission specialist company in Finland called Sopranos in 2001, who produced the world's first television clips, that could be viewed on a mobile phone. MainosTV3 offered highlight clips from the nightly TV news through this innovation. In 2001 there was exactly one phone model in the world, that had the colour screen and a powerful enough CPU to handle the tiny video clip - this was the brand new Nokia 9210 Communicator (the first colour Communictor). Video Clip Capable Phones While a monochrome (black and white screen) mobile phone is technically able to be used to view videos, for practical purposes, the video clip download market started when phones added color screens. A more powerful video clip consumption platform is on the 3G standard, when higher speed data transfers are possible. Usually 3G phones tend to have higher resolution screens and often stronger abilities in memory. The first 3G network went commercially live when NTT DoCoMo launched its FOMA 3G service in October 2001. Today about 20% of all phones and network connections are on the 3G platform, supporting higher speed video clip downloads. 9.1 Video Capable phones The Report includes a full analysis of the video clip market, and includes the following tables Figure 9.2 Video Clip Users Figure 9.3 Video Clip Total Revenues Figure 9.4 Video Clip Average revenue per sub Figure 9.5 Video Clip Average revenue per active user Figure 9.6 Video Clip Split by type Figure 9.7 Video Clip Age split Figure 9.8 Video Clip Regional Split Figure 9.9 Video Clip Revenue-share Mobile Social Networking

Excerpt from Report 7th Mass Media in 2008 By TomiAhonen Consulting December 1, 2008
This file may be freely forwarded www.7thMassMedia.com All information in this file may be quoted 20
Mobile Social Networking Users
0
20
40
60
80
100
120
140
1998 1999 2000 2001 2002 2003 2004 2005 2006 2007 2008
Social networking in some forms has existed on personal computer networks and early internet user groups from the 1980s. The first social networking service for mobile phones was launched in South Korea in 2003 when SK Communication's recently-purchased Cyworld online social networking service launched its Mobile Cyworld version. It evolved into the the fastest-growing industry in the economic history of mankind. In just two years from launch, mobile social networking passed the billion dollar annual revenue level. Two years later mobile social networks were appearing in all major markets and the industry passed the 5 billion dollars in annual revenues. Companies from T-Mobile to Nokia to Vodafone to Orange said their startegic focus was in connecting communities, social networking on mobile and user-generated content. This year this young industry passed 9 billion in annual revenues.From zero to 9 billion dollars in five years. Mobile social networking is by far the fastest-growing billion dollar industry ever. Active Users of Mobile Social Networking The user base of mobile social networking reflects both the regional beginnings in South Korea and the Far East, and also that it is closely related to more advanced phones such as in picture sharing and video sharing. Figure 7.2 Total Mobile Social Networking Users, Globally, in Millions The Report includes a full analysis of mobile social networking, and includes the following tables Figure 7.1 Installed Base of Mobile Phones Capable of Mobile Social Networking Figure 7.3 Mobile Social Networking Total Revenues Globally Figure 7.4 Average Revenue of Mobile Social Networking per Global Subscriber Figure 7.5 Monthly Revenue per Active User of Mobile Social Networking Figure 7.6 Mobile Social Networking by Type Figure 7.8 Regional Split of Revenues in Mobile Social Networking in 2008 Figure 7.9 Mobile Social Networking Revenues, Operator Share
Excerpt from Report 7th Mass Media in 2008 By TomiAhonen Consulting December 1, 2008
This file may be freely forwarded www.7thMassMedia.com All information in this file may be quoted 21
Average Revenues out of Mobile News per All Subscri bers
0.00
0.05
0.10
0.15
0.20
0.25
1998 1999 2000 2001 2002 2003 2004 2005 2006 2007 2008
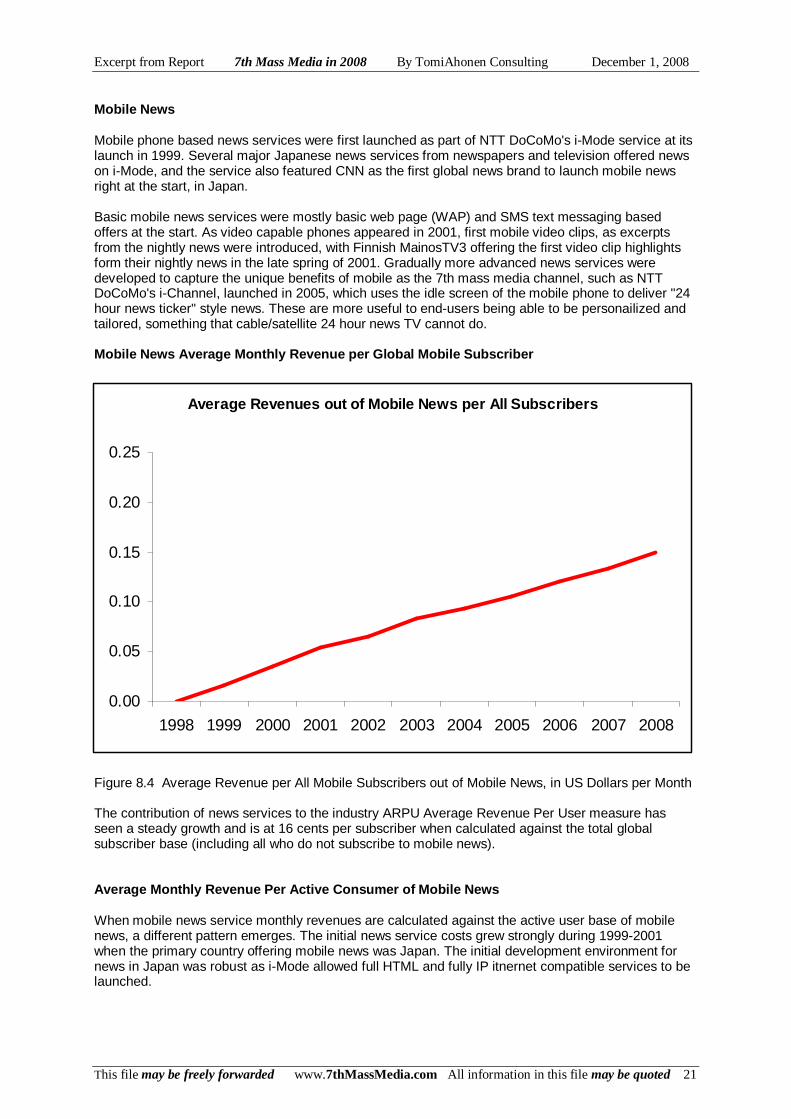
Mobile News Mobile phone based news services were first launched as part of NTT DoCoMo's i-Mode service at its launch in 1999. Several major Japanese news services from newspapers and television offered news on i-Mode, and the service also featured CNN as the first global news brand to launch mobile news right at the start, in Japan. Basic mobile news services were mostly basic web page (WAP) and SMS text messaging based offers at the start. As video capable phones appeared in 2001, first mobile video clips, as excerpts from the nightly news were introduced, with Finnish MainosTV3 offering the first video clip highlights form their nightly news in the late spring of 2001. Gradually more advanced news services were developed to capture the unique benefits of mobile as the 7th mass media channel, such as NTT DoCoMo's i-Channel, launched in 2005, which uses the idle screen of the mobile phone to deliver "24 hour news ticker" style news. These are more useful to end-users being able to be personailized and tailored, something that cable/satellite 24 hour news TV cannot do. Mobile News Average Monthly Revenue per Global Mobi le Subscriber Figure 8.4 Average Revenue per All Mobile Subscribers out of Mobile News, in US Dollars per Month The contribution of news services to the industry ARPU Average Revenue Per User measure has seen a steady growth and is at 16 cents per subscriber when calculated against the total global subscriber base (including all who do not subscribe to mobile news). Average Monthly Revenue Per Active Consumer of Mobi le News When mobile news service monthly revenues are calculated against the active user base of mobile news, a different pattern emerges. The initial news service costs grew strongly during 1999-2001 when the primary country offering mobile news was Japan. The initial development environment for news in Japan was robust as i-Mode allowed full HTML and fully IP itnernet compatible services to be launched.
Excerpt from Report 7th Mass Media in 2008 By TomiAhonen Consulting December 1, 2008
This file may be freely forwarded www.7thMassMedia.com All information in this file may be quoted 22
Average Revenues out of Mobile News by Active Users
0.00
0.50
1.00
1.50
2.00
2.50
3.00
1998 1999 2000 2001 2002 2003 2004 2005 2006 2007 2008
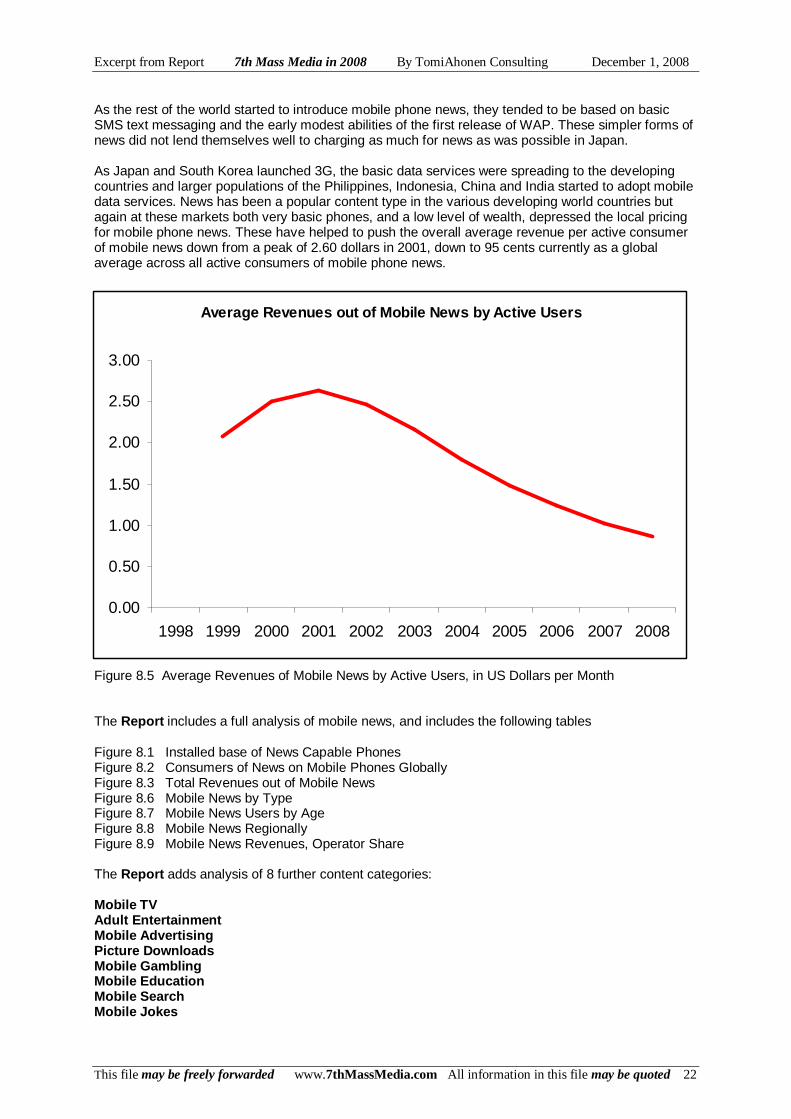
As the rest of the world started to introduce mobile phone news, they tended to be based on basic SMS text messaging and the early modest abilities of the first release of WAP. These simpler forms of news did not lend themselves well to charging as much for news as was possible in Japan. As Japan and South Korea launched 3G, the basic data services were spreading to the developing countries and larger populations of the Philippines, Indonesia, China and India started to adopt mobile data services. News has been a popular content type in the various developing world countries but again at these markets both very basic phones, and a low level of wealth, depressed the local pricing for mobile phone news. These have helped to push the overall average revenue per active consumer of mobile news down from a peak of 2.60 dollars in 2001, down to 95 cents currently as a global average across all active consumers of mobile phone news. Figure 8.5 Average Revenues of Mobile News by Active Users, in US Dollars per Month The Report includes a full analysis of mobile news, and includes the following tables Figure 8.1 Installed base of News Capable Phones Figure 8.2 Consumers of News on Mobile Phones Globally Figure 8.3 Total Revenues out of Mobile News Figure 8.6 Mobile News by Type Figure 8.7 Mobile News Users by Age Figure 8.8 Mobile News Regionally Figure 8.9 Mobile News Revenues, Operator Share The Report adds analysis of 8 further content categories: Mobile TV Adult Entertainment Mobile Advertising Picture Downloads Mobile Gambling Mobile Education Mobile Search Mobile Jokes
Excerpt from Report 7th Mass Media in 2008 By TomiAhonen Consulting December 1, 2008
This file may be freely forwarded www.7thMassMedia.com All information in this file may be quoted 23
ORDER REPORT NOW The TomiAhonen Consulting Report "7th Mass Med ia in 2008" is now available directly from the consu ltancy. The 212 page report is released in electronic file form as a corporate licence and costs only 499 UKP (699 Euro / 899 US dollars) The 7th Mass Media Report covers the full mass media opportunity for mobile and covers the overall industry size; the factors that enable the services, such as handsets, networks, subscribers and subscriptions, revenue-sharing, etc. The 7th Mass Media in 2008 Report includes in- depth-analysis of all major content categories such as music, gaming, video, TV picture downloads, news, advertising, adult entertainment, jokes, gambling, education, etc. Analysis includes user numbers, revenues, content-specific installed base of handsets, age and regional breakdowns, Average Revenues, Revenues per active users, etc. For orders and info, write to Report@tomiahone n.com DON'T FORGET COMPANION VOLUME Tomi T Ahonen's brand new hardcover book, Mobile as 7th of the Mass Media The 322 page book about how to make money with mobile as the newest mass media channel - the book includes 16 case studies such as Blyk, Flirtomatic, Cyworld, Kamera Jiten, i-Channel and SeeMeTV. The book is available at Amazon and all major booksellers. ISBN 978-0-9556069-5-3 For bulk orders contact publisher directly at www.futuretext.com AND READ THE BLOG The blog related to the 7th Mass Media space is at www.7thMassMedia.com Tomi T Ahonen blogs daily about concepts relating to the industries, services and innovations related to the 7th Mass Media channel. A related Wikipedia page is Seven Mass Media
Excerpt from Report 7th Mass Media in 2008 By TomiAhonen Consulting December 1, 2008
This file may be freely forwarded www.7thMassMedia.com All information in this file may be quoted 24
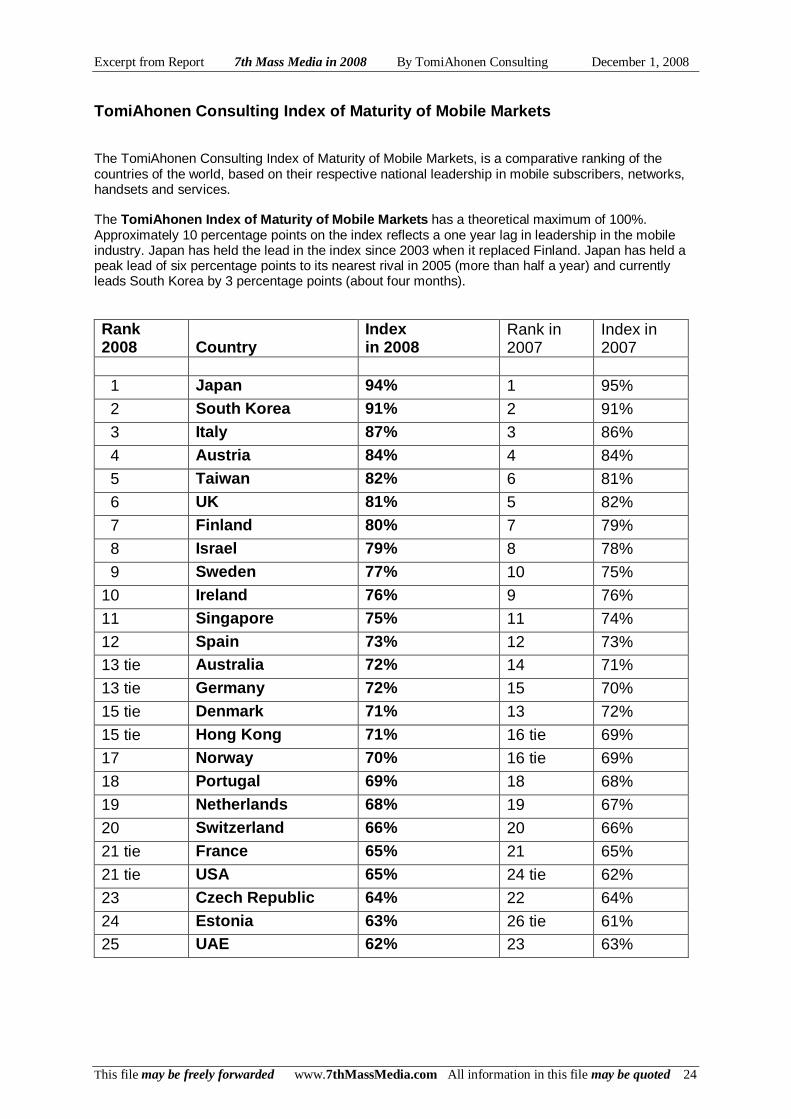
TomiAhonen Consulting Index of Maturity of Mobile M arkets The TomiAhonen Consulting Index of Maturity of Mobile Markets, is a comparative ranking of the countries of the world, based on their respective national leadership in mobile subscribers, networks, handsets and services. The TomiAhonen Index of Maturity of Mobile Markets has a theoretical maximum of 100%. Approximately 10 percentage points on the index reflects a one year lag in leadership in the mobile industry. Japan has held the lead in the index since 2003 when it replaced Finland. Japan has held a peak lead of six percentage points to its nearest rival in 2005 (more than half a year) and currently leads South Korea by 3 percentage points (about four months). Rank 2008
Country
Index in 2008
Rank in 2007
Index in 2007
1 Japan 94% 1 95%
2 South Korea 91% 2 91%
3 Italy 87% 3 86%
4 Austria 84% 4 84%
5 Taiwan 82% 6 81%
6 UK 81% 5 82%
7 Finland 80% 7 79%
8 Israel 79% 8 78%
9 Sweden 77% 10 75%
10 Ireland 76% 9 76%
11 Singapore 75% 11 74%
12 Spain 73% 12 73% 13 tie Australia 72% 14 71%
13 tie Germany 72% 15 70%
15 tie Denmark 71% 13 72%
15 tie Hong Kong 71% 16 tie 69%
17 Norway 70% 16 tie 69%
18 Portugal 69% 18 68%
19 Netherlands 68% 19 67%
20 Switzerland 66% 20 66%
21 tie France 65% 21 65%
21 tie USA 65% 24 tie 62%
23 Czech Republic 64% 22 64%
24 Estonia 63% 26 tie 61% 25 UAE 62% 23 63%
Excerpt from Report 7th Mass Media in 2008 By TomiAhonen Consulting December 1, 2008
This file may be freely forwarded www.7thMassMedia.com All information in this file may be quoted 25
Listing of Tables and Figures in 7th Mass Media in 2008 Report Figure 1.1 Mobile Industry Revenues 2008 Figure 1.2 Total mobile subscriptions and total unique mobile phone subscribers Figure 1.3 Mobile Phone ownership globally, by age Figure 1.4 Mobile subscribers and unique mobile phone owners, Regionally Figure 1.5 Multiple subscription distribution by age, Figure 1.6 Generational shift of the global mobile subscriber base from 1G to 2G to 2.5G to 3G Figure 1.7 Enterprise customers out of the total mobile subscriber base. Figure 1.8 Growth of Mobile phone penetration rate per capita worldwide Figure 1.9 Mobile phone penetration rates regionally, per capita. Figure 2.1 Total mobile phones in use, total mobile subscribers and unique mobile phone owners. Figure 2.2 Annual sales of mobile phones Figure 2.3 Regional sales of new mobile phones in 2008 Figure 2.4 New phone sales annually by generation, 1G, 2G, 2.5G, 3G and 3.5G Figure 2.5 Installed Base of mobile phones globally, by generation Figure 2.6 R eplacement Cycle for mobile phones, in months Figure 2.8 Replacement Cycles Regionally, in months Figure 2.9 Phone Replacement Cycles by Age, in months Figure 2.10 Smartphone annual sales and installed base, in millions of units Figure 2.11 Smartphones as percentage of total mobile phone installed base Figure 2.12 Smartphone Market Shares by Operating System, 2008 Figure 2.13 Geographic Split of Smartphone Sales Figure 2.14 Cameraphone Installed Base Figure 2.15 Musicphone Installed Base Figure 2.16 Multimedia Phones Installed Base Figure 2.17 Other Major Phone Features Relevant to Media Figure 2.18 Mobile Phone Market Shares 2008 Figure 3.1 Installed Base of Messaging-Capable Phones, by Type of Messaging Ability Supported Figure 3.2 Total SMS Text Messaging Users Figure 3.3 SMS text messaging users regionally as percent of total mobile subscribers Figure 3.4 SMS text messaging use by age as percent of all mobile phone subscribers by age Figure 3.5 SMS text messages sent annually Figure 3.6 Monthly amount of SMS text messages sent by active users Figure 3.7 Total global mobile messaging annual revenues worldwide Figure 3.8 Contribution of SMS Text Messaging to Global Average Revenue Per User Figure 3.9 SMS Text Mssaging Monthly Revenue per Active User Figure 3.10 Mobile Messaging Revenue Breakdown by Type Figure 3.11 Average cost of SMS text message sent worldwide, in US dollars per message Figure 3.12 Total MMS Multimedia Messaging Users Figure 3.13 Total Mobile Email Users Figure 4.1 Total mobile data users Figure 4.2 Comparison of Mobile Data Users by Different Definitions Figure 4.3 Mobile data users by region as a percentage of all subscribers in the region Figure 4.4 Internet Access by Device Globally Figure 4.5 Internet Access by Device Globally in 2008 Figure 4.6 Mobile phone subscribers, mobile messaging users and mobile premium data users Figure 4.7 Mobile Data Revenues and proportion of SMS text messaging revenues Figure 4.8 Average Revenue of Premium Data per Subscriber globally Figure 4.9 Mobile VAS Data ARPU per active user Figure 4.10 Mobile Non-Messaging Data by Type of Mobile Data Revenues Figure 4.11 Total Mobile Media Revenues over time by Type Figure 4.12 Mobile media markets regionally by total revenues in 2008 Figure 4.13 Average Monthly Revenue Spent on Mobile Media Regionally Figure 4.14 Mobile media content by type of revenues Figure 5.1 Installed base of music-capable phones globally Figure 5.2 Musicphone Market Shares in 2008 by manufacturer Figure 5.3 Mobile music consumers Figure 5.4 Total Mobile Music Revenues annually Figure 5.5 Monthly average revenue for music per mobile subscriber
Excerpt from Report 7th Mass Media in 2008 By TomiAhonen Consulting December 1, 2008
This file may be freely forwarded www.7thMassMedia.com All information in this file may be quoted 26
Figure 5.6 Monthly mobile music revenues per active consumer of mobile music Figure 5.7 Mobile Music spending regionally Figure 5.8 Mobile Music by Type Figure 5.9 Consumers of Mobile Music by Age, as Percent of All Mobile Subscribers Figure 5.10 Mobile Music Revenues Operator Share Figure 6.1 Total mobile gaming consumers in the world Figure 6.2 Gaming-capable phone installed base by major gaming abilities Figure 6.3 Global Mobile Gaming Revenues Figure 6.4 Global Contribution of Mobile Gaming to Average Revenue per Subscriber Figure 6.5 Monthly Average Revenue of Mobile Gaming by Active Mobile Gamer Figure 6.6 Mobile Gaming by Type Figure 6.7 Moblie Gaming by Age Figure 6.8 Mobile Gaming Revenues Operator Share Figure 7.1 Installed Base of Mobile Phones Capable of Mobile Social Networking Figure 7.2 Total Mobile Social Networking Users Figure 7.3 Mobile Social Networking Total Revenues Globally Figure 7.4 Average Revenue of Mobile Social Networking per Global Subscriber Figure 7.5 Monthly Revenue per Active User of Mobile Social Networking Figure 7.6 Mobile Social Networking by Type Figure 7.8 Regional Split of Revenues in Mobile Social Networking in 2008 Figure 7.9 Mobile Social Networking Revenues, Operator Share Figure 8.1 Installed base of News Capable Phones Figure 8.2 Consumers of News on Mobile Phones Globally Figure 8.3 Total Revenues out of Mobile News Figure 8.4 Average Revenue per All Mobile Subscribers out of Mobile News Figure 8.5 Average Revenues of Mobile News by Active Users Figure 8.6 Mobile News by Type Figure 8.7 Mobile News Users by Age Figure 8.8 Mobile News Regionally Figure 8.9 Mobile News Revenues, Operator Share Figure 9.1 Video Capable phones Figure 9.2 Video Clip Users Figure 9.3 Video Clip Total Revenues Figure 9.4 Video Clip Average revenue per sub Figure 9.5 Video Clip Average revenue per active user Figure 9.6 Video Clip Split by type Figure 9.7 Video Clip Age split Figure 9.8 Video Clip Regional Split Figure 9.9 Video Clip Revenue-share Figure 10.1 Moble TV Capable phones Figure 10.2 Mobile TV Consumer Figure 10.3 Mobile TV Total Revenues Figure 10.4 Moblle TV Average revenue per sub Figure 10.5 Mobile TV Average revenue per active user Figure 10.6 Mobile TV Split by type Figure 10.7 Mobile TV Age split Figure 10.8 Mobile TV Regional Split Figure 10.9 Mobile TV Revenue-share Figure 11.1 Adult Entertainment Capable phones Figure 11.2 Adult Entertainment Users Figure 11.3 Adult Entertainment Total Revenues Figure 11.4 Adult Enterrainment Average revenue per sub Figure 11.5 Adult Entertainment Average revenue per active user Figure 12.1 Mobile Advertising Capable phones Figure 12.2 Mobile Advertising Consumers Figure 12.3 Mobile Advertising Total Revenues Figure 12.4 Mobile Advertising Average revenue per sub Figure 12.5 Mobile Advertising Average revenue per active user Figure 12.6 Mobile Advertising Split by type Figure 12.7 Mobile Advertising Consumers Age split

Excerpt from Report 7th Mass Media in 2008 By TomiAhonen Consulting December 1, 2008
This file may be freely forwarded www.7thMassMedia.com All information in this file may be quoted 27
Figure 12.8 Mobile Advertising Regional Split Figure 13.1 PIcture Download/Upload Capable phones Figure 13.2 Picture Download/Upload Users Figure 13.3 Picture Download./Upload Total Revenues Figure 13.4 Picture Download/Upload Average revenue per sub Figure 13.5 Picture Download/Upload Average revenue per active user Figure 13.6 Picture Download/Upload Split by type Figure 14.1 Mobile Gambling Capable phones Figure 14.2 Mobile Gambling Users Figure 14.3 Mobile Gambling Total Revenues Figure 14.4 Mobile Gambling Average revenue per Figure 14.5 Mobile Gambling Average revenue per active user Figure 14.6 Mobile Gambling Regional Split Figure 15.1 Mobile Education Capable phones Figure 15.2 Mobile Education Users Figure 15.3 Mobile Education Total Revenues Figure 15.4 Mobile Education Average revenue per sub Figure 15.5 Mobile Education Average revenue per active user Figure 15.6 Mobile Education Regional Split Figure 16.1 Search Capable phones (Basic, WAP, 2.5G, 3G) Figure 16.2 Mobile Search Users Figure 16.3 Mobile Search Total Revenues Figure 16.4 Mobile Search Average revenue per sub Figure 16.5 Mobile Search Average revenue per active user Figure 16.6 Mobile Search Regional Split Figure 17.1 Jokes Capable phones Figure 17.2 Mobile Jokes Users Figure 17.3 Mobile Jokes Total Revenues Figure 17.4 Mobile Jokes Average revenue per sub Figure 17.5 Mobile Jokes Average revenue per active user Figure 18.1 TomiAhonen Index - Advanced Mobile Countries Figure 19.1 Forecast Subscribers Figure 19.2 Forecast Handset Sales Figure 19.3 Forecast 3G Migration Figure 19.4 Forecast Telecoms Revenues Figure 19.5 Forecast Mobile Content Revenues Figure 19.6 Forecast Music Figure 19.7 Forecast Gaming Figure 19.8 Forecast Mobile Social Networking Figure 19.9 Forecast News Figure 19.10 Forecast Video Clips Figure 19.11 Forecast Television Figure 19.12 Forecast Advertising Figure 19.13 Forecast ARPU
Excerpt from Report 7th Mass Media in 2008 By TomiAhonen Consulting December 1, 2008
This file may be freely forwarded www.7thMassMedia.com All information in this file may be quoted 28
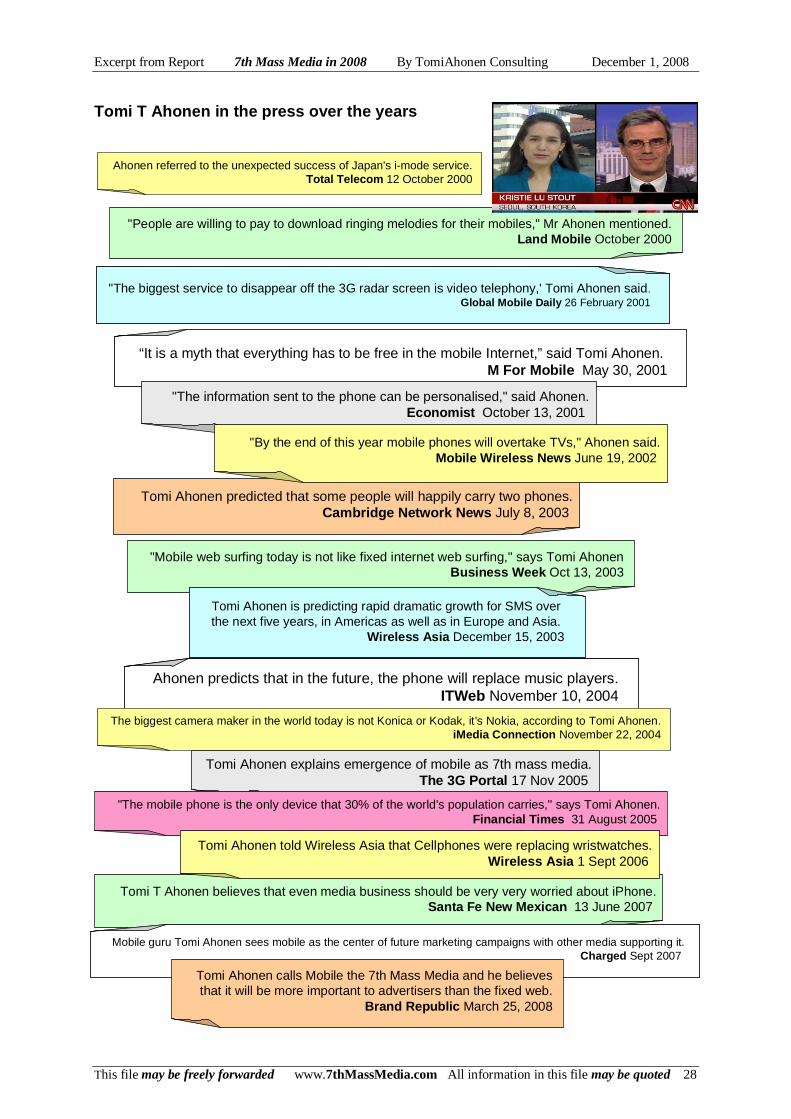
Tomi Ahonen explains emergence of mobile as 7th mass media.The 3G Portal 17 Nov 2005
Ahonen predicts that in the future, the phone will replace music players. ITWeb November 10, 2004
Ahonen predicts that in the future, the phone will replace music players. ITWeb November 10, 2004
Tomi Ahonen predicted that some people will happily carry two phones.Cambridge Network News July 8, 2003
"People are willing to pay to download ringing melodies for their mobiles," Mr Ahonen mentioned.Land Mobile October 2000
Ahonen referred to the unexpected success of Japan's i-mode service. Total Telecom 12 October 2000
"The biggest service to disappear off the 3G radar screen is video telephony,' Tomi Ahonen said. Global Mobile Daily 26 February 2001
"The biggest service to disappear off the 3G radar screen is video telephony,' Tomi Ahonen said. Global Mobile Daily 26 February 2001
“It is a myth that everything has to be free in the mobile Internet,” said Tomi Ahonen. M For Mobile May 30, 2001
“It is a myth that everything has to be free in the mobile Internet,” said Tomi Ahonen. M For Mobile May 30, 2001
"The information sent to the phone can be personalised," said Ahonen.Economist October 13, 2001
"By the end of this year mobile phones will overtake TVs," Ahonen said.Mobile Wireless News June 19, 2002
"Mobile web surfing today is not like fixed internet web surfing," says Tomi Ahonen Business Week Oct 13, 2003
Tomi Ahonen is predicting rapid dramatic growth for SMS over the next five years, in Americas as well as in Europe and Asia.
Wireless Asia December 15, 2003
Tomi Ahonen is predicting rapid dramatic growth for SMS over the next five years, in Americas as well as in Europe and Asia.
Wireless Asia December 15, 2003
The biggest camera maker in the world today is not Konica or Kodak, it’s Nokia, according to Tomi Ahonen. iMedia Connection November 22, 2004
Tomi T Ahonen believes that even media business should be very very worried about iPhone.Santa Fe New Mexican 13 June 2007
"The mobile phone is the only device that 30% of the world's population carries," says Tomi Ahonen.Financial Times 31 August 2005
Tomi Ahonen told Wireless Asia that Cellphones were replacing wristwatches.Wireless Asia 1 Sept 2006
Mobile guru Tomi Ahonen sees mobile as the center of future marketing campaigns with other media supporting it.Charged Sept 2007
Mobile guru Tomi Ahonen sees mobile as the center of future marketing campaigns with other media supporting it.Charged Sept 2007
Tomi Ahonen calls Mobile the 7th Mass Media and he believes that it will be more important to advertisers than the fixed web.
Brand Republic March 25, 2008
Tomi T Ahonen in the press over the years

Excerpt from Report 7th Mass Media in 2008 By TomiAhonen Consulting December 1, 2008
This file may be freely forwarded www.7thMassMedia.com All information in this file may be quoted 29
About the publisher of this Report, TomiAhonen Cons ulting TomiAhonen Consulting is a boutique strategy, technology and media consultancy, specializing in mobile telecoms, digital convergence and media, headquartered in Hong Kong. TomiAhonen Consulting is used at leading technology, media and telecoms companies for strategy, innovation and business development. While not predominantly a market research organization, TomiAhonen Consulting is also known for periodic statistics and industry metrics that it publishes reflecting the unique insights of its CEO, Tomi T Ahonen. These are widely disseminated and quoted regularly in various media and referenced by other industry leaders. TomiAhonen Consulting customers include Aller Denmark, Amdocs USA, BBC UK, Buongiorno Italy, BT UK, Celcom Malaysia, China Mobile, Comverse Israel, DHL Belgium, Digita Finland, Elisa Finland, Emap UK, Ericsson Sweden, Etisalat UAE, France Telecom, Gemplus France, Globe Philippines, Hewlett-Packard USA, Hrvatski Telecom Croatia, HSBC UK, Intel USA, LG South Korea, MiTV Malaysia, MobileOne Singapore, Motorola USA, Motricity USA, MTS Russia, MTV UK, Nokia Finland, NTT DoCoMo Japan, O2 UK, Ogilvy UK, Orange UK, Partner/Orange Israel, Polkomtel Poland, Royal Bank of Scotland UK, Siemens Germany, SK Telecom South Korea, Sprint USA, T-Mobile Germany, TDC Denmark, Telenor Norway, TeliaSonera Sweden, Vodacom South Africa and Vodafone UK. The Consultancy has also worked with dozens of the local country affiliates of the major global players such as Ericsson, Nokia, Orange, Vodafone, T-Mobile, Telenor, etc on all six inhabited continents. TomiAhonen Consulting has also provided strategy consultancy and advice to numerous industry bodies including the AIB Association of International Broadcasters, GSA GSM Suppliers Association, MCUG Mobile Computer Users Group, MDA Mobile Data Association, MoMo Mobile Monday, PPA PeriodicalPublishers Association, WAA Wireless Advertising Association. Support and advice has also been provided to regional expert associations such as AMI Asian Mobility Initiative in Asia and ANDICOM in Latin and Central America. TomiAhonen Consulting also has worked with numerous national regulators and domestic industry associations in various capacities including ASOCEL Asociacion de la Industria Celular en Colombia , CIAJ Communications Industry Association of Japan, CWTA Canadian Wireless Telecoms Association, DiViA - Digital Communications and Customer Relationship association of Finland, IDA Infocomm Development Agency of Singapore, IDATE Institut de l'Audiovisuel et des Télécommunications en Europe in France, IMIF Israel Mobile Internet Forum, ITK Institute for Telecommunications of Slovenia, KIPA Korean IT Promotion Agency, MII Marketing Institution of Ireland, MMC Multimedia Club of Russia, MMF Mobile Messaging Forum of Ireland. Slovenian Marketing Association, WASP Forum Wireless Application Service Provider Forum of South Africa. For more information, write to [email protected]
Excerpt from Report 7th Mass Media in 2008 By TomiAhonen Consulting December 1, 2008
This file may be freely forwarded www.7thMassMedia.com All information in this file may be quoted 30
About author of this report, Tomi T Ahonen Tomi T Ahonen, the CEO of TomiAhonen Consulting is a leading expert on the business of mobile content. The author of six bestselling books on these topics, Mr Ahonen has been seen at over 220 conferences on six continents, and has been quoted in over 300 press articles worldwide. Mr Ahonen is quoted in 40 books by other authors. He coined the term "Seven Mass Media", discussed in five books and referenced by companies from Nokia to Microsoft. Wikipedia page is Seven Mass Media. The 7th Mass Media opportunity reflects a convergence of three global industries: the five legacy mass media industries (print, recordings, cinema, radio and TV); the sixth mass media, the internet; and now on mobile, the 7th mass media. Mr Ahonen brings strong knowhow into the opportunity as he has been employed in each of the three industry sectors - media, internet and mobile. Early in his career Tomi Ahonen has worked part-time with regional and local newspapers in Finland and the USA as photographer and news journalist, and from 2001 seen the print industry as a full-time author. He has also some insights into the recordings industry from several years working part time as a club DJ. Early in the 1980s Mr Ahonen was exposed to television when full-time employed on the technical crew at a Finnish broacaster. He has also produced and directed a half-hour documentary that aired twice at a public TV station in the USA. While not a deep expert on the mass media industries, these professional experiences give Mr Ahonen insights into different sides of the media business. He has supplemented that insight with positions of trust later in his career serving on the boards of a book publisher, a videogaming company and a creative/advertising agency. His fourth book Communities Dominate Brands is primarily a media book. While most became aware of the internet when it was on the cover of Time in 1994, Tomi Ahonen was first exposed to the internet in 1985 when as a university student he made FTP file transfers and used email between university computers. In New York he worked for OCSNY from 1991-1995, which became the first internet service provider of New York. There Mr Ahonen created the first computer company advertisement on the internet. Mr Ahonen continued internet consulting while employed with the management consultancy Brooks International in Finland in 1995. At Nokia in 1998 he joined Nokia's digital convergence unit, authoring the first White Paper by Nokia to discuss the internet on mobile networks. Each of his books has discussed the internet, a major theme of Digital Korea. Tomi Ahonen was first exposed to mobile when employed by Elisa in Finland, and he headed Elisa's fixed-mobile convergence project in 1996, the world's first commercial fixed-mobile solution. Mr Ahonen then chaired fixed-mobile standardization at the international level from 1997. Later at Nokia he worked in digital convergence in 1998 and then joined Nokia's strategic 3G project. Mr Ahonen wrote the world's first book about mobile services and content, Services for UMTS, as well as the first business book for the mobile industry, m-Profits. Mr Ahonen lectures at Oxford University on mobile. While Tomi Ahonen is better known for thought-leadership in the mobile business; within the industry he is also considered the foremost authority on the statistics and metrics for the mobile industry. He is often referenced as the "stats police" for monitoring the reported statistics by other analysts of the industry. Tomi Ahonen's roots into market research trace to working for the Gallup organization in Helsinki Finland in 1978 rising to senior researcher developing research instruments. After completing his university studies in the USA, Mr Ahonen conducted several market reserach projects the USA and Finland. Later, when employed by Elisa in Finland, Mr Ahonen set up the company's market and competitor analysis system in 1997. Later when heading consulting at Nokia, Mr Ahonen oversaw Nokia's end-user research centre and managed the annual research budget of several million Euros which conducted in total over 150,000 end-user interviews in over 30 countries between 1999-2001. Equally experienced in computer simulations, Mr Ahonen achieved programmer skills at college and wrote his first computerized forecasting tool in 1984, run on a mainframe and programmed in Fortran. During the 1980s Tomi Ahonen became a registered Lotus Developer. Since then Mr Ahonen has built or co-designed over 110 forecasting models for his employers and customers, including the pricing tool for OCSNY in 1991; the competitive bidding tool for Elisa in 1996; and the "indirect access revenue model" for Nokia, in 1999. Tomi Ahonen has personally run over 85 econometric simulations in the mobile telecoms space for the strategic departments of his customers. Companies such as Telenor, Vodafone and Orange acknowledging that they have worked specifically with Tomi Ahonen. Mr Ahonen's forecasts and industry statists have been quoted in almost all major business press such as Business Week, Economist, Barrons, Wall Street Journal and Financial Times.
Excerpt from Report 7th Mass Media in 2008 By TomiAhonen Consulting December 1, 2008
This file may be freely forwarded www.7thMassMedia.com All information in this file may be quoted 31
Previous Famous Forecasts on the Mobile Telecoms In dustry by Tomi T Ahonen Tomi T Ahonen significant public forecasts, where his view has been controversial at the time, and often been the first in the industry to voice that view; that can now be determined for accuracy: 1998: Mobile phone penetrations will exceed landline penetrations (correct) 1999: Ringing tones will be international success (correct) 1999-2005: Saturation ceiling is a myth (widely held myth that mobile penetrations cannot exceed x percent, where the percent shifted gradually up from 60%-100%) (correct) 2000: Mobile phone penetration rates will exceed human population in industrialized countries (correct) 2000: Majority of US citizens will become active users of SMS text messaging (correct) 2000: Videocalls will become a significant revenue source in 3G (wrong, changed mind in 2001) 2000: Location-based services will become major source of revenues (wrong, changed mind in 2002) 2001: MVNOs will take up to 20% of national subscriber numbers (correct) 2001: Concept of location-based push "spam" ads is not going to succeed (correct) 2001: It will become commonplace that people will carry two phones (correct) 2001: Stand-alone PDAs will lose their market to smartphones (correct) 2001: SMS text messaging is addictive (correct) 2001: MMS picture messaging usage will follow pattern of SMS usage (wrong, changed mind in 2004) 2001: Videocalls will not form significant revenue source in 3G (correct, note this is change from 2000) 2002: Ringback tones will become billion dollar industry (correct) 2002: MVNOs will be short-lived phenomenon in most markets (correct) 2002: Mobile telecoms revenues will exceed fixed telecoms revenues (correct) 2002: Mobile content revenues will exceed internet content revenues (correct) 2002: More people will access internet on mobile phones than personal computers (correct) 2002: Location-based services will not become major mass-market success (correct, change from 2000) 2002: Inspite of very bad reputation of early WAP launches, WAP is not crap, will become success (correct) 2002: Inspite of the success of the Blackberry, more US cellphone users will use SMS than will use wireless email (correct) 2003: Inspite of the telco bubble burst and 100 billion dollar 3G licences, 3G will become commercial success (correct) 2003: Stand-alone cameras will lose market to cameraphones (correct) 2004: MMS picture messaging not follow SMS, yet will become success (correct, note is change from 2001) 2005: Mobile social networking is first killer application for 3G (correct) 2005: iPods will lose musicplayer market to musicphones (correct) 2005: Engagement marketing on mobile phones will produce satisifed mobile advertising customers (correct) (note more recent Tomi T Ahonen forecasts cannot yet be determined for their accuracy)
Excerpt from Report 7th Mass Media in 2008 By TomiAhonen Consulting December 1, 2008
This file may be freely forwarded www.7thMassMedia.com All information in this file may be quoted 32
Methodology This Report is developed from the proprietary tracking database managed at TomiAhonen Consulting, which monitors all published public data from the main official industry data sources, and continuously updates a short-term forecast to the end of the current year. As the offical numbers, such as those from the ITU, the GSM Association, and individual national regulators, tend to come with significant delays, TomiAhonen Consulting also monitors all reported industry analyst reports. These are never considered for their forecasts, only for their reported "current" data. These reported numbers are indexed based on the reliability that TomiAhonen Consulting experts allocate to each given industry expert organization, at times to the level of the individual researcher and that person's recent accuracy. TomiAhonen Consulting then adjusts the overall tracking database with each such additional finding, and makes corrections to the overall forecast for the year. As the model learns from the known propensities for error by each major analyst organization, and corrects the assumed base data the moment the official numbers are released, the model has a very strong foundation to be near the mark in most forecasts for a time span of one year or less. However, using several of Tomi T Ahonen's proprietary models, theories and benchmarks, and the deep insights of Mr Ahonen and the lead analysts of TomiAhonen Consulting, the model is often adjusted to reflect the considered opinion of TomiAhonen Consulting. This has resulted in an uncanny accuracy where countless times TomiAhonen Consulting has given forecasts that run counter to the mainstream considered opinions of the industry, and found to be right in the end. TomiAhonen Consulting has been the most accurate short-term forecaster for the industry for the current decade. It is even more distinguished in the 3-5 year window, where rival forecasters have had errors in the magnitude of 50% or more, where TomiAhonen Consulting has had errors of less than 10% on most of the industry's biggest tracked numbers, such as subscriber counts, SMS text messaging use, multiple subscriptions, penetration rates, ARPU levels, etc. Holding a passion for accuracy in analysis, TomiAhonen Consulting is also known for rapidly acknowledging changes in any forecasts, if emerging data does not support the earlier published forecast such as with MMS and LBS forecasts. Equally, TomiAhonen Consulting is also known for steadfastly holding onto positions where other analysts and forecasters have changed their minds, when the company is certain of its view, such as not changing its position on USA adoption of SMS rather than the wireless email following the early success of the Blackberry, and not abandoning the trust in the 3G business case while the dot-com bubble burst and the auctioned 3G licenses cost 100 billion dollars. The reader must remember, that every forecast is by definition a guess, and no forecaster can be 100% accurate. Every effort has been made to ensure the best source data, and the most rigorous analysis of the information, with the best available tools, to produce the numbers into this report. However, past performance is no guarantee of future performance.
Excerpt from Report 7th Mass Media in 2008 By TomiAhonen Consulting December 1, 2008
This file may be freely forwarded www.7thMassMedia.com All information in this file may be quoted 33
Sources Used Sources used as inputs and to recalibrate and update the TomiAhonen Consulting Mobile Industry Database include: Major research and analysis organizations including 160 Characters, AMF Ventures, AMI, Asia Digital Marketing Yearbook, AT Kearney, BBDO, CIAJ, Computer Industry Almanac, Carphone Warehouse, CDMA Development Group, Chetan Sharrma, CMG Logica, CTIA, CWTA, DB, Deloitte, EBU, Economist and Economist Intelligence Unit, Eurobarometer, Financial Times, Forrester, Forum Oxford, Gallup, Gartner/Dataquest, GSM Association, GSM Suppliers Association, Guardian, IDATE, IDC, IFPI, Informa, Ipsos, Irdeto, ITS, ITU, JD Power, Juniper, Jupiter, KIPA, M:Metrics, MMA. Mobikyo, Mobile Data Association, Mobile Monday, Morgan Stanley, Netsize Guide, NIDA, Nielsen, OPA, Ovum, Pew, Portio, Pyramid, PWC, Q Research, Radicati, RIAJ, SIA, SMLXL, Strategy Analytics, Statesman's Yearbook, Tanla, Telephia, Textually, TNS, United Nations, Vision Gain, Wall Street Journal, WCNC, Wikipedia, Wireless Watch Japan, Wireless World Forum, Yankee Group, and YouGov. National regulator/official data including the European Union, as well as Australia, Austria, Belgium, Brazil, Canada, Chile, China, Colombia, Denmark, Finland, France, Germany, Greece, Hong Kong, India, Indonesia, Ireland, Israel, Japan, Jordan, Malaysia, Mexico, Netherlands, Norway, Pakistan, Philippines, Poland, Portugal, Saudi Arabia, South Africa, South Korea, Singapore, Spain, Sweden, Switzerland, Taiwan, Thailand, UK and USA. Academic Research published at Cambridge University, Cathholic University of Leuwen, Copenhagen Business School, Curtin University, Eisenstadt University, Ghent University, Helsinki University of Technology, Helsinki University of Economics, Instituto Superior de Engehara de Lisboa, Jonkoping University, Kalmers University, Keio University, London School of Economics, Lulea University, MIT, Oxford University, Pia University, Rocherster Institute of Technology, Queensland University, Stanford University, Technici Vjesik, University of Calgary, University of Oslo, University of Preoria, University of Tampere and University of Zagreb. Manufacturer and supplier data including Alcatel, Alcatel-Lucent, Apple, Ericsson, Huawei, Intel, LG, Lucent, Microsoft, Motorola, NEC, Nokia, NokiaSiemens, Nortel, Panasonic, Qualcomm, RIM, Sharp, Siemens, Sony, SonyEricsson and Symbian. Operator data from all major mobile operator groups and all significant individual mobile operators
Excerpt from Report 7th Mass Media in 2008 By TomiAhonen Consulting December 1, 2008
This file may be freely forwarded www.7thMassMedia.com All information in this file may be quoted 34
ORDERING INFO The TomiAhonen Consulting Report "7th Mass Med ia in 2008" is now available directly from the consu ltancy. The 212 page report is released in electronic file form as a corporate licence and costs only 499 UKP (699 Euro / 899 US dollars) The 7th Mass Media Report covers the full mass media opportunity for mobile and covers the overall industry size; the factors that enable the services, such as handsets, networks, subscribers and subscriptions, revenue-sharing, etc. The 7th Mass Media in 2008 Report includes in- depth-analysis of all major content categories such as music, gaming, video, TV picture downloads, news, advertising, adult entertainment, jokes, gambling, education, etc. Analysis includes user numbers, revenues, content-specific installed base of handsets, age and regional breakdowns, Average Revenues, Revenues per active users, etc. For orders and info, write to Report@tomiahone n.com BOOK TOMI T AHONEN FOR SEMINARS AND WORKSHOPS Tomi T Ahonen lectures globally on 7th Mass Me dia Contact Mr Ahonen for seminars, workshops, lecturing and strategy sessions about the 7th Mass Media Space Write to [email protected] DON'T FORGET COMPANION VOLUME Tomi T Ahonen's brand new hardcover book, Mobile as 7th of the Mass Media The 322 page book about how to make money with mobile as the newest mass media channel - the book includes 16 case studies such as Blyk, Flirtomatic, Cyworld, Kamera Jiten, i-Channel and SeeMeTV. The book is available at Amazon and all major booksellers. ISBN 978-0-9556069-5-3 For bulk orders contact publisher directly at www.futuretext.com AND READ THE BLOG The blog related to the 7th Mass Media space is at www.7thMassMedia.com
Excerpt from Report 7th Mass Media in 2008 By TomiAhonen Consulting December 1, 2008
This file may be freely forwarded www.7thMassMedia.com All information in this file may be quoted 35
Excerpt from companion piece, the new book Mobile as 7th of the Mass Media Cellphone, Cameraphone, iPhone, Smartphone by Tomi T Ahonen 322 pages hardcover, August 2008 ISBN 978-0-9556069-3-9 futuretext Ltd. USD $39.95 / UKP £19.95 / Euro €29.95 Available at all major booksellers, at Amazon and directly from the publisher: www.futuretext.com "In this book, building on his earlier themes, Tomi presents his ideas with characteristic wit and charm, handily demystifying this new media landscape. A most enjoyable and remarkably practical book, his best yet!"
Daniel Appelquist, Senior Technology Strategist, Vodafone Group UK From the back cover:
Mobile as 7th of the Mass Media Cellphone, cameraphone, iPhone, smartphone ...On the other hand, you have your other cellphone. The cellphone is emerging as a mass media. Twice as many cellphones as TV sets, three times as many cellphone subscribers as internet users, four times as many cellphones as Personal Computers, five times as many cellphones as cars. 31% of all music dollars spent worldwide already go to a wide array of cellphone based music services. 20% of videogaming software revenues. Advertising, news, TV, internet giants, social networking and even Hollywood movies and printed books are now rushing to capture their share of the 7th of the Mass Media. How addicted is the youth to cellphones? Why is SMS text messaging used by twice as many people as email worldwide? How can banks, libraries, dentists and airlines serve customers better through the 7th of the Mass Media? What are the seven unique benefits that none of the legacy six media, including the internet, can replicate? Why is small screen size and limited keypad only a myth? Cellphones are not the dumb little brothers to the internet; rather mobile is to the internet, like TV is to radio, a far more compelling and complete media platform that will soon dominate. Packed with up-to-the-minute statistics and bursting with international comparisons, Mobile as 7th of the Mass Media includes media concepts, service examples and user statistics covering 40 countries. It features 16 insightful case studies from Japan, South Korea, Hong Kong, China, Finland, the UK, the Netherlands and the USA including such trailblazing 7th Mass Media innovators as Blyk, Cyworld, Virgin Mobile, SeeMeTV, i-Channel and Flirtomatic. The book also provides the latest thinking on how to build successful wireless services using the 6 M's service creation tool. This is the must-read book for anyone who thinks that their business might have a role on devices which are becoming increasingly even more powerful than the radical Apple iPhone. FIRST OPINIONS ON THE BOOK: "Tomi Ahonen's latest book adds to the wealth of insights he has given to the industry, and has useful perceptions of how the Japanese market is evolving as it adjusts to cellphones as a mass media channel."
Ted Matsumoto, Executive Vice President and Chief Strategy Officer, Softbank Japan “Tomi's book takes us through the changes and opportunities in this new converged world of voice, data and broadcast media. With fascinating examples from around the world he lays out the potential for an industry that could become one of the largest in the world. Anyone who is interested in the future of mobile should read this.”
Colin Crawford, Executive VP Interactive, IDG Communications USA
Excerpt from Report 7th Mass Media in 2008 By TomiAhonen Consulting December 1, 2008
This file may be freely forwarded www.7thMassMedia.com All information in this file may be quoted 36
EXCERPTS FROM THE COMPANION PIECE, AHONEN LATEST BOOK
"The internet in every pocket." Jorma Ollila, CEO of Nokia
Chapter 1 - Introduction Cellphone, the only universal gadget Because the need to communicate is more powerful than the need to compute, to be entertained, or to be informed. At the end of 2007 there were almost three times as many cellphone subscriptions as there were total users on the internet. There were four times as many cellphones as there are personal computers of all kinds laptops, desktops and servers combined. There were more than five times as many cellphone subscriptions in the world as there were cars. Twice as many people had cellphones as had credit cards. The population of cellphones was twice as big as the population of TV sets in use. There were 2.5 times as many cellphones as there were fixed landline phones. In fact, by late November 2007 there was a cellphone subscription for a staggering 50% of the world's total population. Since Taiwan first did it in 2001, today over 60 countries have achieved cellphone penetration rates of over 100% per capita. For comparison, the USA cellphone penetration rate was about 85% at the end of 2007, placing it second-to-last among industrialized countries. Canada was in last place with about 65% penetration. In the most advanced mobile markets such as Hong Kong, Taiwan, Italy and Finland, the typical first-time cellphone customer is well under the age of eight. How can you reach over 100% per capita penetration rates? Hong Kong, Taiwan, Italy, Israel, the UK are all at 130% or above - means that an increasing part of the employed population has two or more subscriptions. Informa measured that by 2007 already 28% of all cellphone owners in the world already have two or more subscriptions. Moreover, in most cases this means also carrying two phones. Half of Western Europeans with a cellphone actually have two or more subscriptions - and most of them carry two phones. There is no other gadget that is even remotely as widely adopted and spread across the planet as the cellphone. Anyone with a job and disposable income has a cellphone, so if you want to sell anything, anyone who is "economically viable" on the planet, carries a cellphone. Even in China (40% penetration rate per capita), India (20%) and Africa (15%) cellphones are everywhere. I will discuss the overall economics, the big picture numbers and contrasts to other major technologies in the next chapter about the numbers involved in this industry soon to hit a Trillion dollars in value. 60% take it to bed every night Then I will examine the owners of cellphones and how they use the devices. I will explore the society and how our behavior is changing with this technology. Earlier, the only gadget the "whole population" used to carry was the wristwatch. However, even here the cellphone is trumping the watch: young people have stopped using wristwatches and rely only upon the cellphone to tell time. A global Nokia survey of cellphone users in 2006 found that 73% of cellphone owners use the clock on the phone. Not all of these have abandoned wearing a wristwatch, but an increasing portion of the world uses the phone as the only time-keeping device. The cellphone is the only universal device. As the cellphone has become a universal gadget, it is also inducing remarkably addictive signs of behavior. Almost every cellphone user, 91% in fact, keeps the cellphone literally within arm's reach 24 hours, seven days a week, 365 days of the year according to Morgan Stanley in 2007. A 2005 study of global cellphone use by BBDO revealed that 60% of us actually take the cellphone physically to bed with us! When I was telling this to audiences around the world in 2005, I got a lot of smiles and laughter in the conferences. But then when I asked the audience members to raise their hands if they did so, invariably about half of the hands went up. In advanced wireless telecoms countries like Finland, Singapore and South Korea it was nearly the whole audience who admitted to sleeping with the phone. Why to bed? Some use the cellphone now as the alarm clock - Nokia's 2006 survey found that 72% of the total phone owner population does this. Others use it to send or receive messages still late into the night, or to make (or expect) a nighttime call. A study by the Catholic University of Leuwen in Belgium found that the majority of teenagers send text messages from bed. I will have a whole chapter looking at young people and their cellphone behavior. The cellphone is the last thing we look at before we fall asleep and again the first thing we see when we wake up. If you are into media, this is a powerful device. A study by Unisys revealed that if we lose our wallet we report it in 26 hours. If we lose our cellphone, we report it in 68 minutes. As to those who are new to these phenomena, no, we do not only use the cellphone outdoors. A study by NTT DoCoMo the largest wireless carrier (mobile operator) of Japan discovered that 60% of all wireless data access by cellphone is done indoors, often in parallel with watching TV or surfing the internet on a PC. To help readers develop successful services, I discuss how to build magic for wireless services in one chapter, and use my theory of the 6 M's, the very widely referenced mobile service development system, in examining service concepts.
Excerpt from Report 7th Mass Media in 2008 By TomiAhonen Consulting December 1, 2008
This file may be freely forwarded www.7thMassMedia.com All information in this file may be quoted 37
EXCERPTS FROM THE COMPANION PIECE, AHONEN LATEST BOOK Center of convergence The cellphone is becoming the evolution target for much of the digitally converging industries. I will show how the battle for the pocket saw the rapid victories by smartphones over stand-alone PDAs, soon outselling them by more than 10 to 1; cameraphones over stand-alone digital cameras by more than 4 to 1; and more musicphones than iPods and other stand-alone MP3 players by a ratio of 7 to 1. Towards the back of the book I take brief looks at convergence also from the industries that are involved, in how the internet, TV and cellphones are converging today; and how the banking/credit card industry and advertising are joining into that convergence soon. I touch upon the features creeping onto the cellphone and show how the phone has added new functionalities from one, communication, to eight functionalities today in the chapter on the Eight C's. In the Disruption chapter, I also examine the role of the Apple iPhone as a disruptive technology, as well as the concept of the MVNO as a disruptive business model for the industry. Powerful media platform In the book, I devote several chapters to examine the early popular media categories for cellphones. I start with the music business. As 31% of all consumer dollars spent on music worldwide is already spent on cellphone music, I devote a chapter to this phenomenon. Yes, it starts with ringing tones, of course, but there is a bewildering array of more advanced music services in the 9.3 billion dollars that people spend on cellphone music services worldwide today, such as true-tones (mastertones), ringback tones (waiting tones), music videos, music streaming, karaoke, welcoming tones, background tones, etc. In videogaming we see the same pattern. Growing rapidly, in 2007 already 20% of videogaming software revenues came from cellphone games. Advertising is another industry headed to your cellphone, and by the end of 2007, the worldwide advertising spend on cellphones had reached 2.2 billion dollar in value. Spreading fast, more than half of all cellphone owners in countries as diverse as Japan, UK and Spain received ads on their phones. The latest industry to discover the cellphone as a delivery platform is TV. The first cellphones with digital TV tuners (i.e. built-in "set-top boxes") went already on sale in South Korea in the Summer of 2005 an by the end of 2007 there were seven million of such advanced TV-phones in Korea, or 17% of the total cellphone subscriber base watching full broadcast TV on cellphones. I will discuss music, gaming, TV and advertising for cellphones each in detail in their respective chapters later in the book. The texting divide The impact of cellphones to communication is enormous, and that communication is shifting away from voice calls to cellphone messaging. Not wireless email like on a Blackberry, no: the big cellphone messaging system is SMS text messaging. Over 2.5 billion people were active users of SMS text messaging in 2007. For contrast, while there were only 1.3 billion users of the internet, only 1.2 billion active users of email who maintained 2 billion email accounts. So out of the planet's population of 6.6 billion, only 18% can be reached via email. Compare that with the 3.2 billion of all cellphone subscribers or 48% of the planet who are capable of receiving SMS text messages, and 2.5 billion or 38% of the whole population worldwide who are active users, and thus able to respond via SMS. No wonder all industries from automobile service garages to airlines to libraries to dentists are now rolling out SMS text messaging based customer communication systems. SMS is perhaps the least understood of the new services on cellphones. It is definitely the most counter-intuitive service of them all and were it not for irrefutable facts and incredible usage patterns, no amount of logic could possibly explain the business or the use cases for SMS text messaging. That is why I have a whole chapter on this phenomenon. In addition, no matter how much you may love your Blackberry, trust me, the "Crackberry" is a mild drug, compared with SMS text messaging. With annual revenues of 100 billion dollars and still growing at double digits annually, this is a monster of a service and must be understood to grasp how compelling the cellphone can be as a media channel. Multipurpose device clever at payments Each cellphone can handle payments. There are some early examples of these appearing in the USA and Canada, so some may find the concept plausible, if not obviously practical. Never- theless, keeping in mind that we carry our cellphone everywhere, if payment abilities are added to the device, it soon becomes the preferred means of payment. Why worry about having the correct change for the bus, the parking meter or to buy a can of Pepsi? You do not need to handle the small change: do the payment on the cellphone instead. Just click the button, and the payment appears on your next phone bill. What may have seemed like novelties, are now real industries. Payments by cellphone are very widely deployed already, ranging from paying for public transportation - trams, the subway and busses - as 53% already do via their cellphones in Helsinki Finland. In Estonia, all parking is now paid by cellphone. In Slovenia, all taxis accept payment by cellphone. In the Netherlands you can pay for your train tickets by cellphone. The governments are getting in on the action as well. In Finland, you can buy a fishing license by cellphone while in Abu Dhabi the police will allow you to pay for speeding tickets with your cellphone.
Excerpt from Report 7th Mass Media in 2008 By TomiAhonen Consulting December 1, 2008
This file may be freely forwarded www.7thMassMedia.com All information in this file may be quoted 38
EXCERPTS FROM THE COMPANION PIECE, AHONEN LATEST BOOK In countries from the Philippines to South Africa, many employers pay full salaries direct to cellphone accounts and in Kenya already a fifth of all bank accounts have migrated to cellphones. The Singapore government announced in 2006 that all egovernment initiatives would be made compatible with cellphones and SMS text messaging. Will it be the future? Today over half of Koreans use their cellphone for paying anything from public transportation to the grocery bill to paying for their petrol at the gasoline station. I will discuss the mobile payments and mobile banking later in this book, as well as the topic of how society is changing with wireless services on cellphones.
Birth of Gen-C
I've already written a lot about Generation-C in my fourth book, Communities Dominate Brands with Alan Moore. One might assume it means Generation "C for Cellphones", or maybe it is "C for Content"; but actually the C in Gen-C stands for "Communities". It is the Community Generation, the first generation that experiences life, its anxieties, decisions, emotions, successes and failures, with the best buddies always at hand. Almost telepathically connected, living collectively, with a "hive mentality". No longer reacting to a school bully alone, now Gen-C will fetch friends to rally to help - with the cellphone. While the gadget of choice for Gen-C is the cellphone, that generation is actually the first multidevice (or multiplatform) generation, using cellphones, text messaging, chat, instant messaging, blogging, multiplayer gaming, virtual reality worlds, social networks, search etc interchangeably and concurrently. Gen-C is the super-consumer of tomorrow. The preferred gadget of Gen-C is of course the cellphone. I will discuss Gen-C in its own chapter later in this book. A related concept is that of social networking, known also as user-generated content, digital communities and Web 2.0. Since our book in 2005, recently most social networking experts have joined in our conclusion that the inevitable direction for all social networking services will be to cellphones. What may surprise readers is that while mobile social networking is only five years old, less than half as old as that of internet based online social networking, the cellphone variant already earns more money worldwide. Mobile social networking was worth 5 billion dollars in 2007 and as the business was launched in 2003, it makes mobile social networking the fastest-growing billion-dollar industry in the economic history of mankind. I will devote a chapter to it. Before iPhone, After iPhone There is one more element that has been changing perceptions of cellphones particularly in America, and that was the launch of the Apple iPhone in June of 2007. I have been saying, writing and blogging that the wireless telecoms industry will come to look back at June 2007 as a threshold moment. We can actually count cellphone development time, like two eras. The era Before the iPhone (BI), and the era After the iPhone (AI). Therefore, I discuss the iPhone and its impact in the disruption chapter near the end. The cellphone started as a communication device, what I call the "first C". In a very short period of time that expanded to include consumption (the browser), then charging (payments), commercials (advertising) then creation (the camera). Now we are adding communities (social networking such as uploading pictures to Flickr), cool (fashion) and even control (remote control of our lives such as our locks, home heating, security systems etc). I will discuss this evolution pattern as the "8 C's" in its own chapter later in the book. American creativity will wake up The other benefit of the introduction of the iPhone is perhaps more subtle, but more far-reaching. The June 2007 launch of the Apple iPhone was certainly the most visible technology marketing campaign ever seen. In the past American audiences have been poorly served by the handset makers and the wireless carriers. Americans have never had first releases of new top-line phones in the world - many of the top models by the giant handset makers have not even been launched in America at all. In addition, the American wireless carriers are also seen by the industry pundits as nearer Third World carriers than their more advanced rivals in Europe, Asia and Australia. Cellphone features, carrier services, pricing and interconnectivity are all much more advanced in other major industrialized countries than in America. So American consumers and business executives have an outdated view of cellphones and wireless services. Imagine if you lived in an African country where the local airport only served propeller driven airplanes. You would have a hard time believing how comfortable travel could be in modern jetliners. Nevertheless, once that airport was expanded and modernized and modern jets started to serve your city, you would rapidly understand how relevant jet travel is to world commerce today. When Apple rolled out its iPhone launch marketing, suddenly every American executive noticed a large screen, color screen cameraphone with web browser and media player. Moreover, the prevalent thought was: "Wow. I want one of those." And the next thought was "Why can't my business be on it?" So after the launch of the iPhone, suddenly every IT industry executive, every TV industry boss, every Hollywood mogul, every print baron, every gaming developer etc, woke up to the potential of cellphones. To illustrate how the North American cellular telecoms industry compares to the rest of the world, and to help discover regions where the cutting edge and bleeding edge of the industry currently exists, I end the book with an analysis of what factors have caused North America to fall behind in this rapidly growing industry.
Excerpt from Report 7th Mass Media in 2008 By TomiAhonen Consulting December 1, 2008
This file may be freely forwarded www.7thMassMedia.com All information in this file may be quoted 39
EXCERPTS FROM THE COMPANION PIECE, AHONEN LATEST BOOK Seventh of the Mass Media This book looks at the cellphone emerging as the Seventh of the Mass Media. Print was the first, five hundred years ago. At the turn of the century around 1900, we had three "new" mass media in short succession, with recordings the second, cinema the third and radio the fourth mass media channel. Then around 1950 we had TV emerge as the fifth. Then after 1990, the internet appeared as the sixth. Now around 2000 mobile (the cellphone) appears as the latest, the seventh mass media channel. It is not the dumb little brother of the internet, nor the dumb tiny screen version of TV. Yes, the cellphone is small, but it has attributes that make it a superior medium in many ways and a dominating media channel in the three most important factors - reach, audience accuracy and money. I like to say that mobile as the 7th mass media channel, is as different from the internet, as TV is from radio. TV overtook radio almost totally as the predominant media channel, replicating all previously existing radio content, and then adding countless new content types and formats not possible on radio. Now we face a similar situation with mobile taking over from the internet - and very shortly will become the predominant interactive media, replicating most that exists on the internet, and creating already today numerous media formats that cannot be replicated on the internet. Early in the book, I go to considerable detail to explain exactly why the cellphone is as powerful as a media channel, can it truly be more potent than the internet? I devote one chapter just to understand the unique benefits of the cellphone as the seventh of the mass media. I then show how we can build magical new services for it. To sum up The cellphone is certainly the most widely spread technology. There are 20 times more cellphones than Playstations; 30 times more cellphones than iPods. It is the only universal gadget, and it has now become the newest media channel. The first media content to discover cellphones was music ten years ago and today over 31% of all music sold worldwide is consumed on cellphones. Videogames were the second category and over 20% of that industry has migrated to cellphones. TV, news, social networking, even internet services are all now headed to the cellphone, as the newest and most prevalent mass media channel. Advertising is also headed to a cellphone screen near you. It is not easy to build successful services for cellphones. You cannot just copy the internet or other media and be guaranteed a success on the 7th of the Mass Media. However, by understanding what makes the cellphone unique, and more powerful as a medium than any of the six legacy media; that is how future media empires will be built. That is why we all need to understand the cellphone. This is a book to help you on that journey. I will start by putting the big picture into context, with the next chapter focusing on the numbers of this emerging giant industry. At the end of each chapter I will also showcase some example from leading innovators in this industry such as Blyk, Flirtomatic, Cyworld and SeeMeTV. For those wondering is the cellphone viable as a media channel, consider these words from the former Director General of the BBC, Greg Dyke, "The time is coming where all the traditional broadcast shows will be available on your mobile phone." FIRST OPINIONS ON THE BOOK Mobile as 7th of the Mass Media by Tomi T Ahonen: Tomi demonstrates the fundamental shift from 'mobile communications' to 'personalized communications' and in the long run, to 'all personalized transctions and interactions' and that this will encompass all elements of the value chain from research and awareness building to sales, marketing, production, service and lifecycle. Welcome to the world of the segment and segments of one customer. Bravo, Tomi."
Garrett Johnston, Chief Marketing Officer, MTS Russia "Tomi's latest book continues his deep insights into the mobile industry and provides practical examples of advanced media concepts utilizing the unique benefits of mobile. I can warmly recommend this book for anyone who wants to deploy media concepts to mobile."
Jari Tammisto, CEO & President, Mobile Monday Global , Finland Tomi Ahonen has been especially ahead of the pack in his insights about digital mobile phones. This book provides a solid foundation for how we got here, why, and what’s next.”
Trip Hawkins, Chairman & CEO Digital Chocolate USA Founder of Electronic Arts USA
“Tomi's style of mixing real world practical examples with the latest customer insights and sound commercial data makes his books so valuable in understanding mobile in leading markets today.”
BJ Yang, CEO AirCross South Korea - - - - THIS EXCERPT PDF FILE MAY BE FREELY FORWARDED - - - -

Excerpt from Report 7th Mass Media in 2008 By TomiAhonen Consulting December 1, 2008
This file may be freely forwarded www.7thMassMedia.com All information in this file may be quoted 40
Opinions of Tomi T Ahonen's fifth book Digital Korea with Jim O'Reilly technology bestseller from 2007 ISBN (hardcover) “Having been involved with the planning and implementation of the Broadband and Telecoms revolution in Korea and internationally on Telecoms missions since, I am really impressed how Tomi and Jim have captured the essence and achievements of the Korea Digital journey from a range of cyber citizen, venture, corporate and Government perspectives. This book really helps the reader understand what makes a winning Digital ecosystem within a Global context”
JaeHong Yoon, Senior Vice President Korea Telecom South Korea “For those of us working with the digital youth and struggling to understand the trends that are shaping our digital futures this book is priceless. A lot of what we in the UK think of as futurology is actually already happening in Korea. Packed with case studies and behavioural analysis this is a hugely rewarding read for anyone needing to gain insights into how digital society may evolve over here.
Peter Miles, CEO, SubTV UK “I recommend this book as an insightful resource base for the near future concept creation, as the penetration rates of broadband Internet, 3G mobile and digital TV reach those in South Korea today.”
Karri Mikkonen, Director of Strategy, TeliaSonera Group Sweden “Homo Sapiens have had it, Homo Digitus is the future. It is often said that Korea is a digital nation and the most connected society in the world. The book Digital Korea says that this country is now a giant laboratory that is experimenting with the future of human life through the use of digital gadgets, big and small. The authors' thesis is that the digitalization of humabn interaction will change every aspect of our lives.”
Book Review, JoongAng Daily August 25, 2007 South Korea “Having worked with, admired and continually been amazed at the sophistication of the Korean telecoms sector, Digital Korea goes a long way to uncover and explain some of the secrets of this success and how it could influence digital futures internationally.”
Mark Newman, Chief Research Officer, Informa Telecoms and Media UK Opinions on Tomi T Ahonen's fourth book Communities Dominate Brands with Alan Moore the 2005 global bestselling hardcover book already into its third printing ISBN (hardcover) 0-9544327-3-8 "Although wary of another book claiming that the world has forever changed, I have been won over by this deeply impressive book. Packed full of statistics, examples and case studies, the arguments are well supported and persuasive. Thought-provoking and practical, you will be hard pressed to find a more challenging book."
From official book review by UK Chartered Insti tute of Marketing (CIM)
"While new media do offer companies new opportunities to communicate with their customers, their principal effect is to provide customers with more ways of communicating with each other."
Rory Sutherland, Vice Chairman and Global Creative Director, OgilvyOne UK "This is an eye-opener with a key message for all consumer centred enterprises. An excellent, reassuring book! In 5 years time it will be called a classic - the new bible for new marketeers."
Dr Axel Alber, Marketing Director, Masterfoods Europe "This book provides a comprehensive understanding as to why business and media will never be the same; interrupting audiences and one-way flows of marketing communications are things of the past."
Rishad Tobaccowala, Chief Innovation Officer, Publicis Groupe Media USA “The authors vividly illustrate the growing power of digital communities with examples of real cases where companies have achieved considerable business success by being creative and engaging customers.”
Harry Drnec, Managing Director Red Bull UK "All other books on marketing pale before this book on the 21st century world. This is the world of my children rather than my parents. A must read. I am assigning it to my classes as a required text."
Professor Richard Ross, University of California Santa Barbara , USA
- - - - THIS EXCERPT PDF FILE MAY BE FREELY FORWARDED - - - -