7/JS ~~ S,0 'J:;r. 1711-J - Digital Library/67531/metadc690539/m2/1/high... · 7/JS ~~ CJf\c.. S,0...
85
7/JS CJf\c.. S,0 'J:;r. 1711-J SANDIA REPORT SAND82-1315 • Unlimited Release • UC-70 Printed August 1983 ::J. ;. J 0 9 2'd--. Analysis of Rock Mechanics Properties of Volcanic Tuff Units from Yucca Mountain, Nevada Test Site Ronald H. Price Prepared by Sandia National Laboratories Albuquerque , New Mexico 87185 and Livermore, California 94550 for the United States Department of Energy under Contract DE-AC04-76DP00789 SF 2900-Q(6-82) SAND - -82 - 1315 DE83 01 7 056
-
Upload
trinhtuyen -
Category
Documents
-
view
215 -
download
0
Transcript of 7/JS ~~ S,0 'J:;r. 1711-J - Digital Library/67531/metadc690539/m2/1/high... · 7/JS ~~ CJf\c.. S,0...

7/JS ~~ CJf\c.. S,0 'J:;r. 1711-J SANDIA REPORT SAND82-1315 • Unlimited Release • UC-70 Printed August 1983
::J. ;. J 0 9 2'd--.
~ Analysis of Rock Mechanics Properties of Volcanic Tuff Units from Yucca Mountain, Nevada Test Site
Ronald H. Price
Prepared by Sandia National Laboratories Albuquerque , New Mexico 87185 and Livermore, California 94550 for the United States Department of Energy under Contract DE-AC04-76DP00789
SF 2900-Q(6-82)
SAND- -82 - 1315
DE83 01 7 056

DISCLAIMER
This report was prepared as an account of work sponsored by an agency of the United States Government. Neither the United States Government nor any agency Thereof, nor any of their employees, makes any warranty, express or implied, or assumes any legal liability or responsibility for the accuracy, completeness, or usefulness of any information, apparatus, product, or process disclosed, or represents that its use would not infringe privately owned rights. Reference herein to any specific commercial product, process, or service by trade name, trademark, manufacturer, or otherwise does not necessarily constitute or imply its endorsement, recommendation, or favoring by the United States Government or any agency thereof. The views and opinions of authors expressed herein do not necessarily state or reflect those of the United States Government or any agency thereof.

DISCLAIMER
Portions of this document may be illegible in electronic image products. Images are produced from the best available original document.
DO NOT rv11CROFILM 1
\t·.-. l.HlS PAGE ~:.\:,\ .':~~ -~',·~I" • .
I
~
l88ued by Sandia National Laboratories, operated for the United States Department of Energy by Sandia Corporation. NOTir.E• Thia rapnrt waa pr•r•ra.t:i •• an aN'n.nnt nf wnrlr IIJV'nenr,wi hy pn agency of the United States Government. Neither the United Statea Government nor any agency thereof. nor any of their employees, nor any of their contract<1rs, subcontract<lrs, or their employees, makes any warranty, expre88 or implied, or assumes any legal liability or responsibility for the accuracy, comple~neaa, or uaefulneaa of any ~ormation, apparat~, P!oduct, or process d18Cloeed, or repreaenta that 1ta use would not infrmge privately owned righta. Reference herein to any apecific commercial product, proce88, or aervice by trade name, trademark, manufacturer, or otherwise, does not nece88&rily constitute or imply ita endoraement, recommendation, or favoring by the United Statea Government, any agency thereof or any of their contract<lrs or subcontract<lrs. The vieWII and opinions expreaaed herein do not neceaaarily a tate or reflect thoee of the United Statea Government, any agency thereof or any of their contractor& or subcontract<lra.
Printed in the United States of America Available from Natio~al Technical lnforli11ltion Service l!!:; nApArt,ment. nf r.nmmerre 5285 Port Royal Road o .. ,. i..ugfi.,lJ, VA 22101
NTIS price codes Printed copy: A05 Microfiche copy: A01

...
SAND82-1315 Unlimited Release
Printed August 1983
Analysis of the
Distribution Category UC-70
Rock Mechanics Properties of
Volcanic Tuff Units from
Yucca Mountain, Nevada Test Site
tJOTICF. . R. H. Price PORTIONS Of nus R~PORT-ARE iLLEGIBLE. Geomechanics Division 1542 It h been reproduced from the·· best Sandia National Laboratories avai~:ble CO~JY to permit the broades\4.Jbuquerque, New Mexico 87185
possible availabilit!; ~ .. ,., ....... , ...... ~-..--.~~A ABSTRACT
Over two hundred fifty mechanical experiments have been run on samples of tuff from Yucca Mountain, Nevada Test Site. Cores from the Topopah Spring, Calico Hills, Bullfrog and Tram tuff units were deformed to collect data for an initial evaluation of mechanical (elastic and strength) properties of the potential horizons for emplacement of commercial nuclear wastes. The experimental conditions ranged in sample saturation from room dry to fully saturated, confining pressure from 0.1 to 20 MPa, pore pressure from 0.1 to 5 MPa, temperature from 23 to 200°C, and strain rate from 10-7 to 10-2 s- 1 . These test data have been analyzed for variations in elastic and strength properties with changes in test conditions, and to study the effects of bulk-rock characteri~tics on mechanical properties. In addition to the site-specific data on Yucca Mountain tuff, mechanical test results on silicic tuff from Rainier Mesa, Nevada Test Site, are also discussed. These data both overlap and augment the Yucca Mountain tuff data, allowing more definitive conclusions to be reached, as well as providing data at some test
conditions not covered by the site-specific tests. l~J~ fi -~''W"E'R hiJiuB ·
OISTlUBUTION Of THIS DOCUMENT IS U!lLIMtTEO
2
Contents
Introduction . . . . . . .
Test Procedure~ and Sa~nple Preparation.·
Elastic Properties .
Unconfineq Strength
Compressive Strength . , Tensile Strength .
Effects of Water .....................
Effect~ of Pressure
Confining Pressure. 'Pore Pressure . . .
Effects of Temperature .
·. . .
Effects of Rate . · ................. · ... .
Estimate of Average and Limjt Mechanical Properties
Summary.
References • • • • • • • • • • • 't •••••••••••••••••••
Tables .. . . . . . . . . . . ..... . . ~ . . ~ . . . . . . ' . Figures .. ... , ... •· ...
Appendix ........... .
Page
6
6
7
8
9 9
9
10
lU 11
11
11
12
12
14
l6
29
64
...

).
Tables
Page
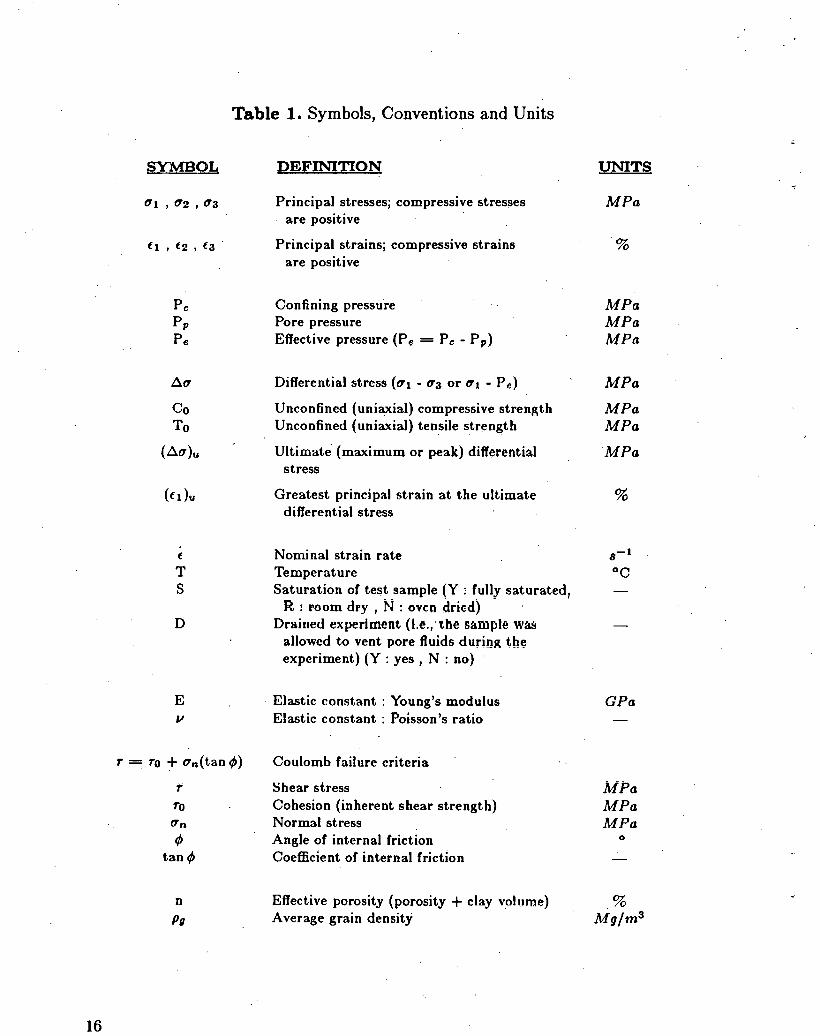
Table 1. Symbols, Conventions and Units 16
Table 2. Abbreviations . . . . . . . . . 17
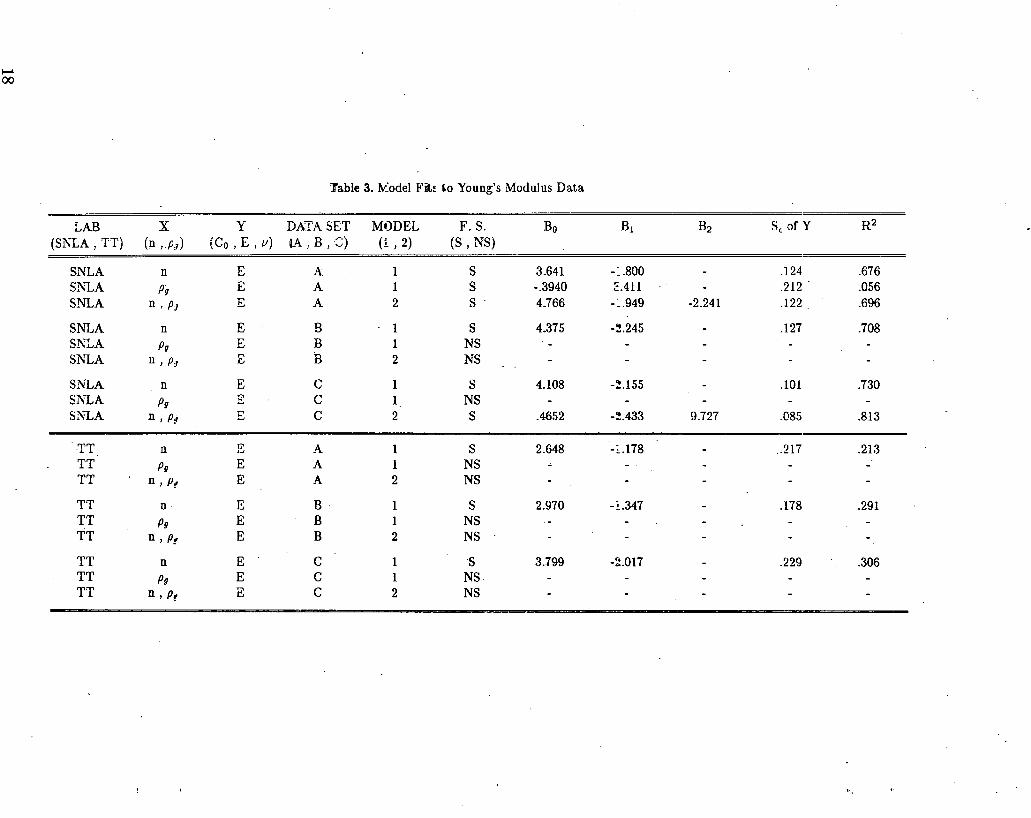
Table 3. Model Fits to Young's Modulus Data. 18
Table 4. Model Fits to Poisson's Ratio Data. . 19
Table 5. Comparative Statistics of SNLA-TT Elastic Moduli Data. 20
Table 6. Model Fits to Unconfined Compressive Strength Data . . 21
Table 7. Comparative Statistics of SNLA-TT Unconfined Compressive Strength Data . . . . . . . . . . . . . . . . . . . . . . . . . .. . . 22
Table 8. Test Results on the Effects of Changes in Water Content. 23
Table 9. Parameter Values for the Coulomb Failure Criteria. . . 24
Table 10. Test Results on the Effects of Changes in Temperature 25
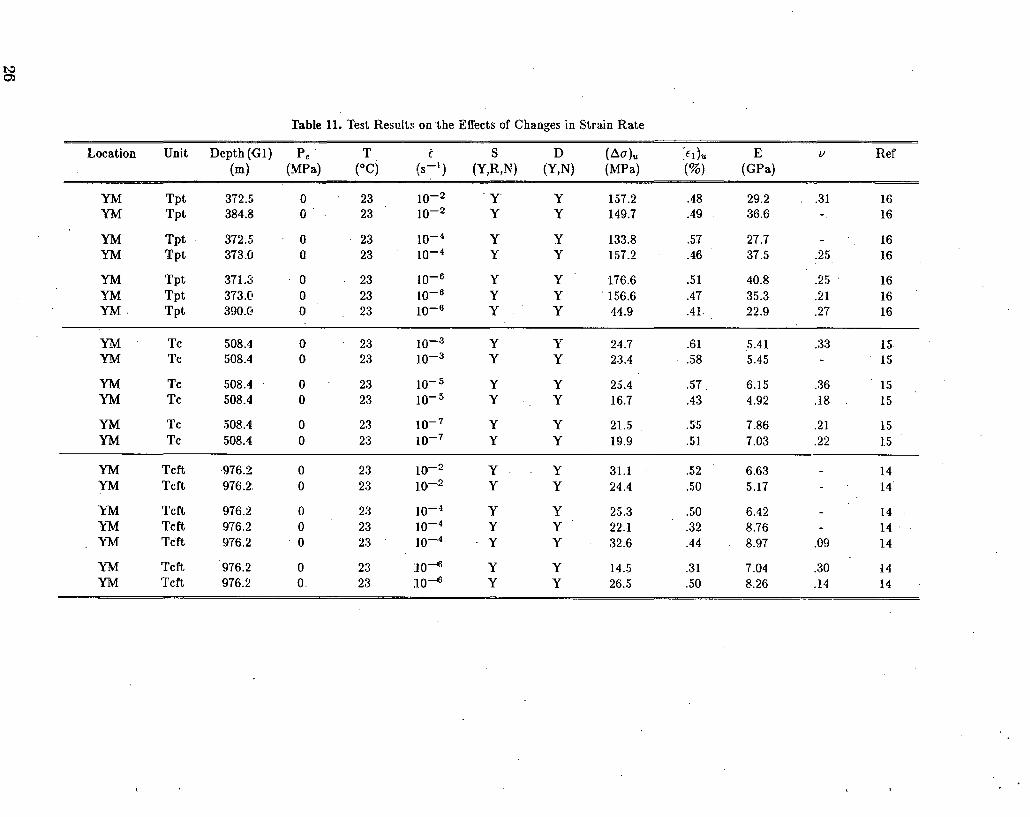
Table 11. Test Results on the Effects of Changes in Strain Rate . 26
Table 12. Average-Case Mechanical Properties for each of the Yucca Mountain Thermal/Mechanical Zones . . . . . . . . . . . . . . . . . . . . . . 27
Table 13. Limit-Case Mechanical Properties for each of the Yucca Mountain Thermal/Mechanical Zones . . . . . . . . . . . . . . . . . . . . . . 28
DISCLAIMER
~is report was ~repared as ~n account of work sponsored by an agency of the United States ov~rnment. Ne1ther the Umted States Governmcul nor any agency thereof nor any of th ·
:~-~ o~ees,hmakes any warranty, express or implied, or assumes any legal liability or respon::~ 11 Y or t e accuracy, completeness, or-usefulness of any information apparatus product process d~sclosed, or represents that its use would not infringe privateiy owned rlghts R ~or ence herem to any speci~c commercial product, process, or service by trade name, trademea:~manufacturer, or otherw1se does not necessaril . t't t · 1 · ' d . Y ~:ons I u e or 1mp y 1ts endorsement reco m~n at~o?, or favoring by the United States Government or any agency thereof The vie:~ an . opm10ns of authors expressed herein do not necessarily state or reflect those of the Umted States Government or any agency thereof.
3
4
Figures
Page
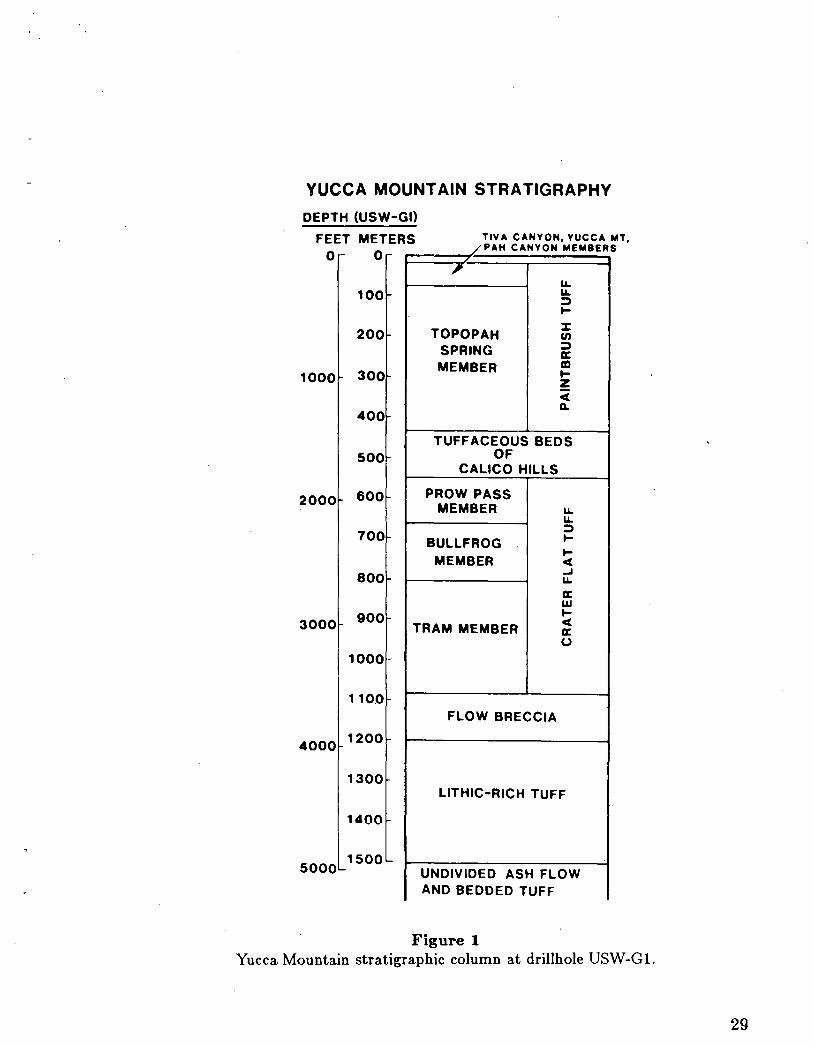
Figure 1. Yucca Mountain stratigraphic column at drillhole USW-(H. ; . . 29
Figure 2. A plot of Young's modulus as a function of grain density for SNLA data from the Calico Hills, Bullfrog and Tram ash flow tuffs. All tests were run on saturated samples under unconfined, room temperature and 10-5 s- 1 conditions. . . . . . . . . . . . . . . . . . . . . . . 30
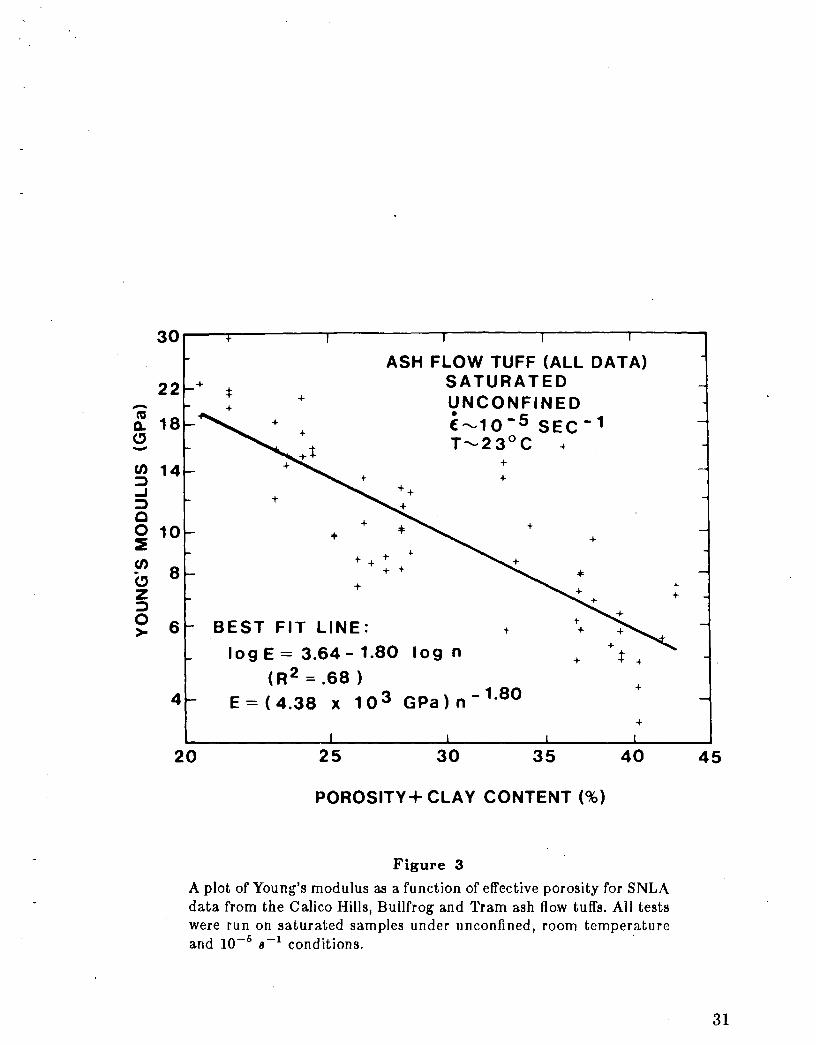
Figure 3. A plot of Young's modulus as a function of effective Porosity for SNLA data from the Calico Hills, Bullfrog and Tram ash flow tuffs. All tests were run on saturated samples under unconfined, room temperature and 10-11 s-• conditions.. . . . . . . . . . . . . . . . 31
Figure 4. Plots of Young's modulus as a function of effective porosity for A. zeolitized and B. nonzeolitized SNLA data from the Calico Hills, Bullfrog and Tram ash flow tuffs. All tests were run on saturated samples under unconfined, room temperature and 10_., 8-
1 coridi-tions. . . . . . . . . . . . . . . . . . . . . . . . . · . . . ! • , , ·•
Figure 5; A plot of Poisson's ratio as a function of effective porosity for SNLA data from the Calico Hills, Bullfrog and Tram ash flow tuffs. All tests were run on saturated samples under unconfined, room temperature and 10_., 8- 1 conditions. . ..................... .
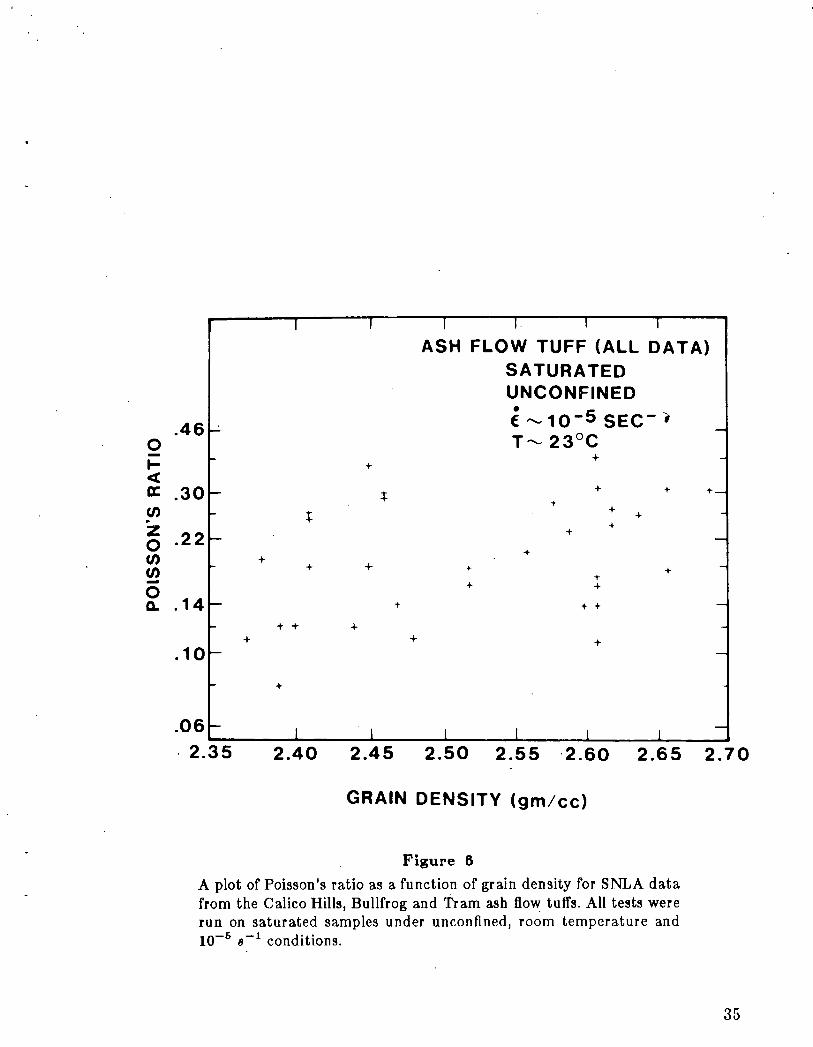
Figure 6. A plot of Poisson's ratio as a function of grain density for SNLA data from the Calico Hills, Bullfrog and Tram ash flow tuffs. All tests were run on saturated samples under unconfined, room temperature
d 10-5 -1 d' . an 8 con ItiOD:S· . . . . . . . . . . . . . . . . . . . . . .
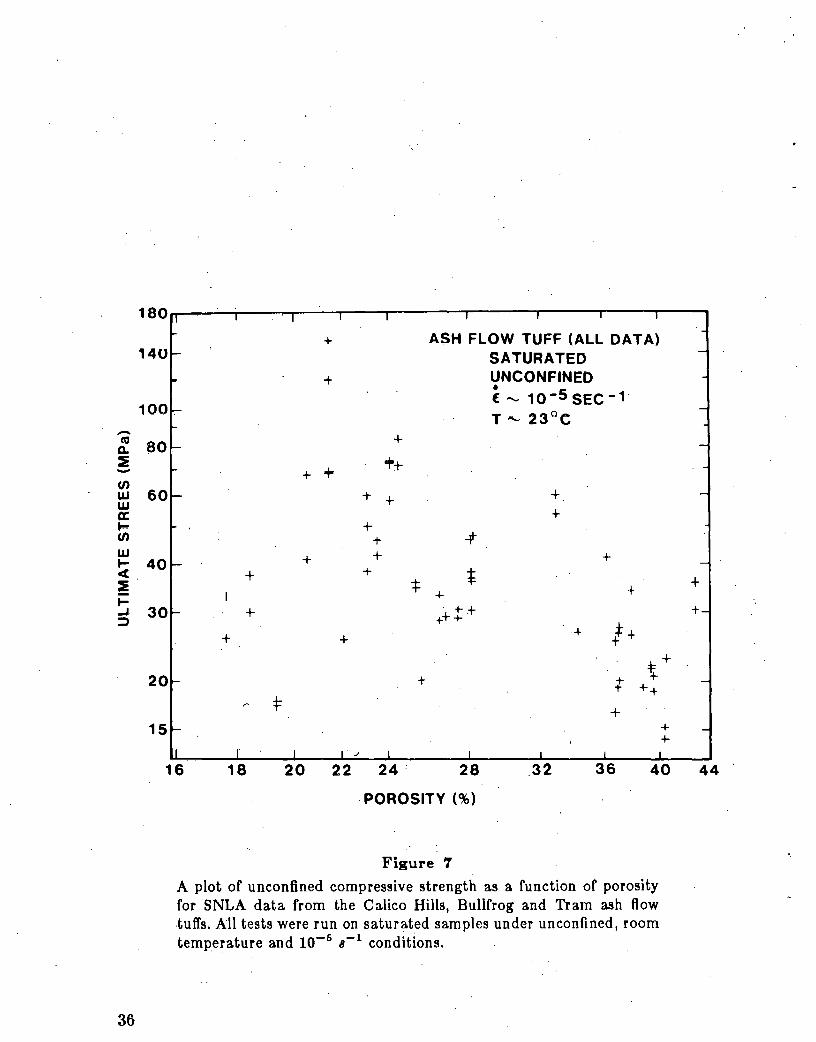
Figure 7. A plot of unconfined compressive strength as a function of porosity for SNLA data from the Calico Hills, B·ullfrog and Tram ash flow tuffs. All tests were run on saturated samples under unconfined, room temperature and 10:-5 8-
1 conditions.. . . . . . . . . . . . . . . .
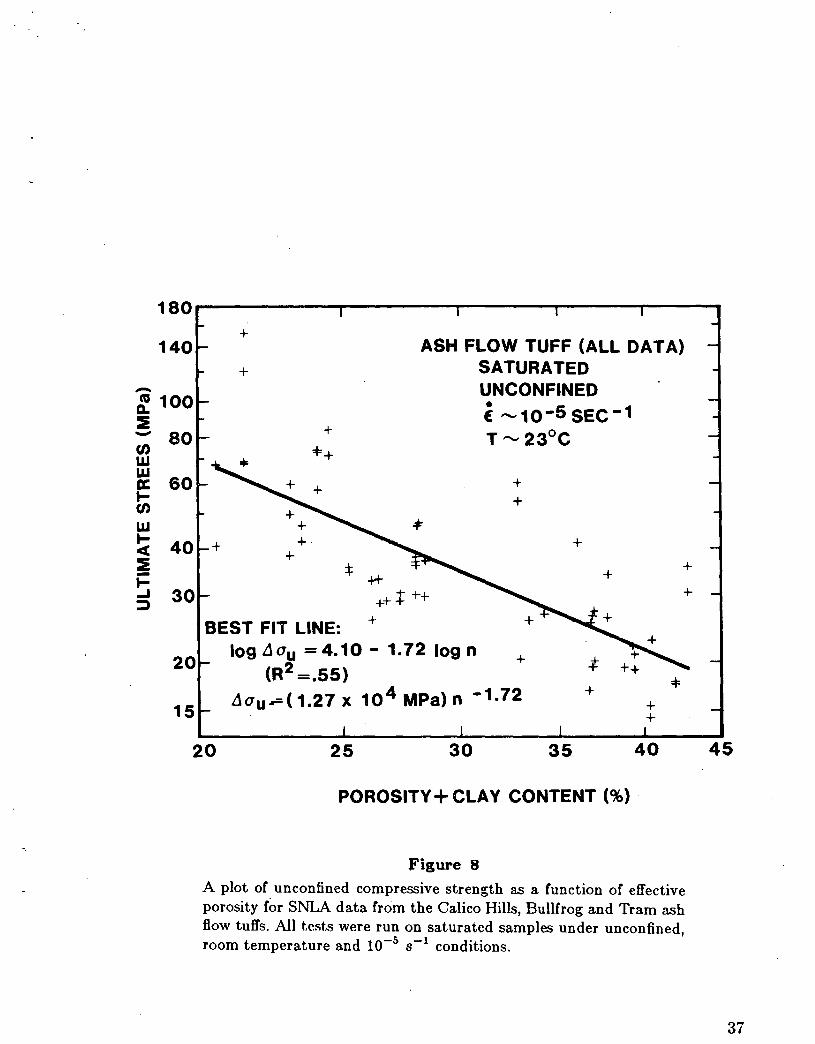
Figure 8. A plot of unconfined compressive strength as a function of effective porosity for SNLA data from the Calico Hills, Bullfrog and Tram ash Bow tuffs. All tests wer~ run on saturated saiilples under unconfined, room temperature and 10-5
8-1 conditions ............. .
Figure 9. Plots of unconfined compressive strength as a function of effective porosity for A. zeolit.ized and B. nonzeolitized SNLA data from the Calico Hills, Bullfrog and Tram ash flow tuffs. All tests were run on saturated samples under unconfined, room temperature and 10-5 8- 1
conditions.. . . . . . . . . . . . . . . . . . . . . . . . . . . . . .
34
35
36
37
38

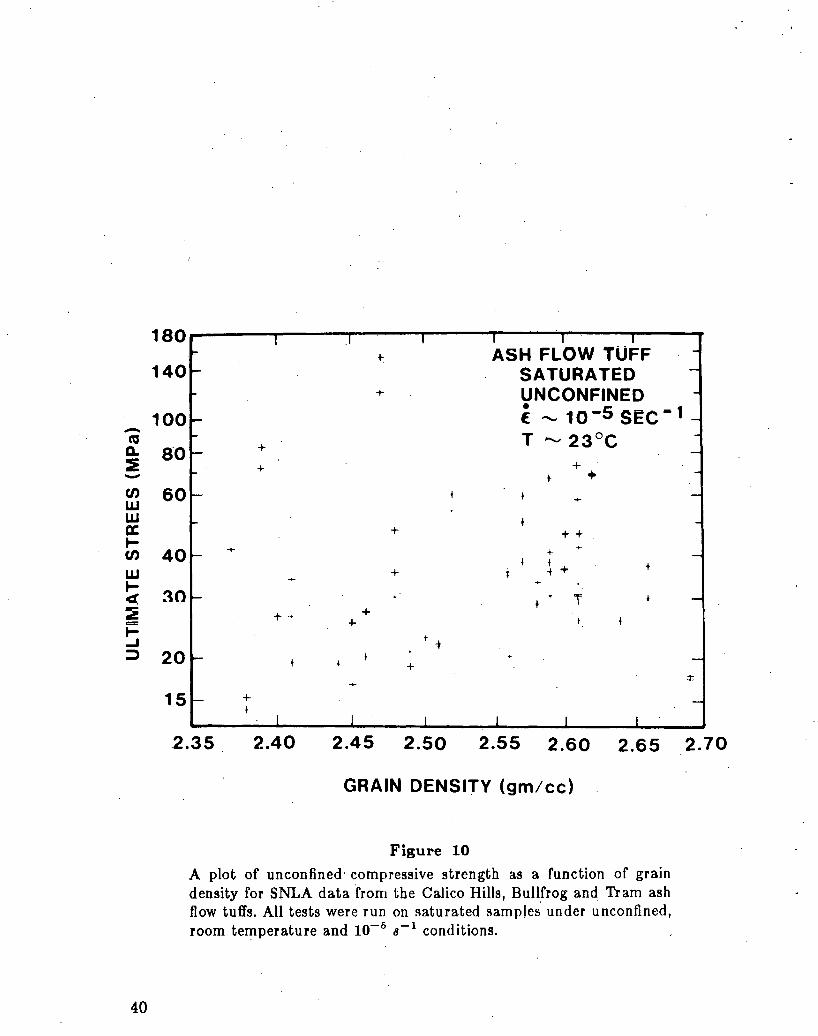
Figure 10. A plot of unconfined compressive strength as a function of grain density for SNLA data from the Calico Hills, BullCrog and Tram ash Bow tuffs. All tests were run on saturated samples under unconfined,
-d 10-5 ·-1 d't' room temperature an s con 1 tons. . . . . . . . . . . . . .
Figure 11. A plot of axial strain at failure as a function of effective porosity for SNLA data from the Calico Hills, BullCrog and Tram ash flow tuffs. All tests were run on saturated samples under unconfined, room temperature and 10-5 s- 1 conditions. . .............. .
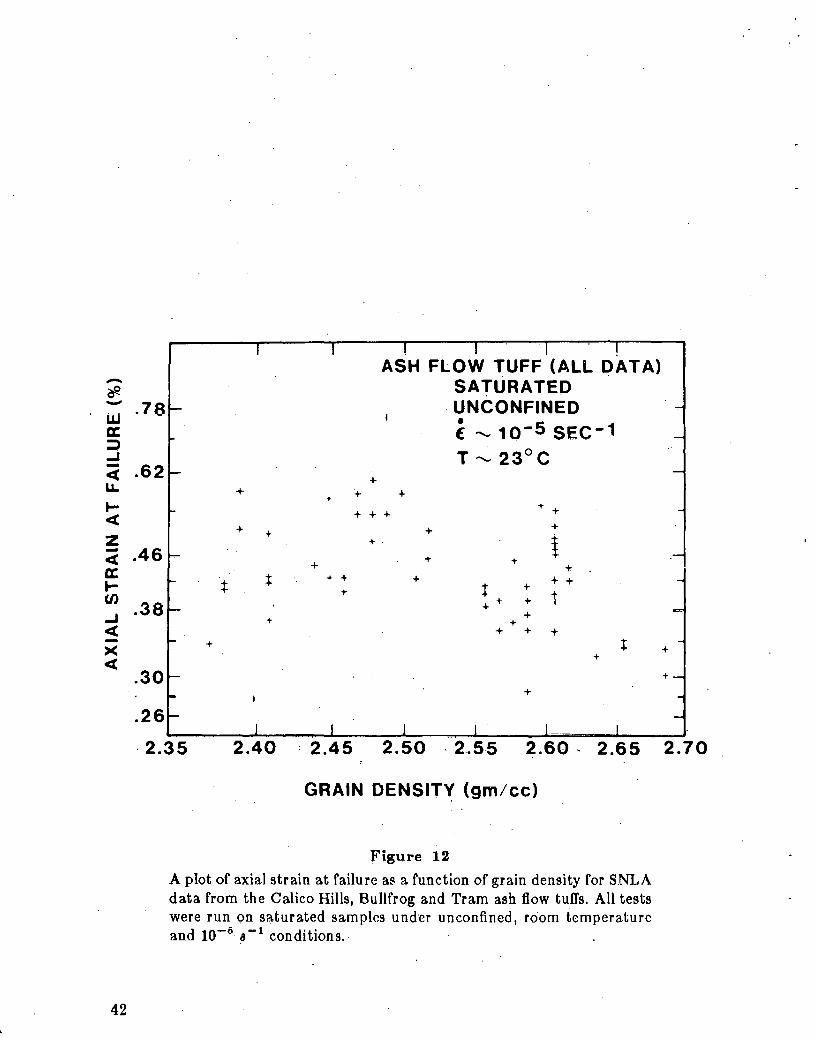
Figure 12. A plot of axial strain at failure as a function of grain density for SNLA data from the Calico Hills, Bullfrog and Tram ash flow tuffs. All tests were run on saturated samples under unconfined, room
d 10-5 -1 d't' temperature an s con 1 Ions. . . . . . . . . . . . . . . . .
Figure 13. A plot of unconfined tensile strength as a function of porosity. All data were obtained from Brazilian (indirect-tensile) tests. . . . . .
Figure 14. A plot of maximum (ultimate) stress (strength) as a function of negative log strain rate for Grouse Canyon tuff data. The tests were run on dry (oven dried) and wet (saturated) samples under unconfined and room temperatur~ conditions. . . . . . . . . . . . . . . . . . .
Figure 15. Mohr-Coulomb plots of shear stress as a function of normal stress for all pressure-effects test series on Yucca Mountain tuff samples. The experimental conditions and the Coulomb failure criteria fits are noted 011 each figure. . . . . . . . . . . . . . . . . . . . . . . . . . . . .
Figure 16. A plot of cohesion as a function of effective porosity for all pressure-effects test series on Yucca Mountain tuff samples. The experimental conditions for each data point are noted on the figure. . .
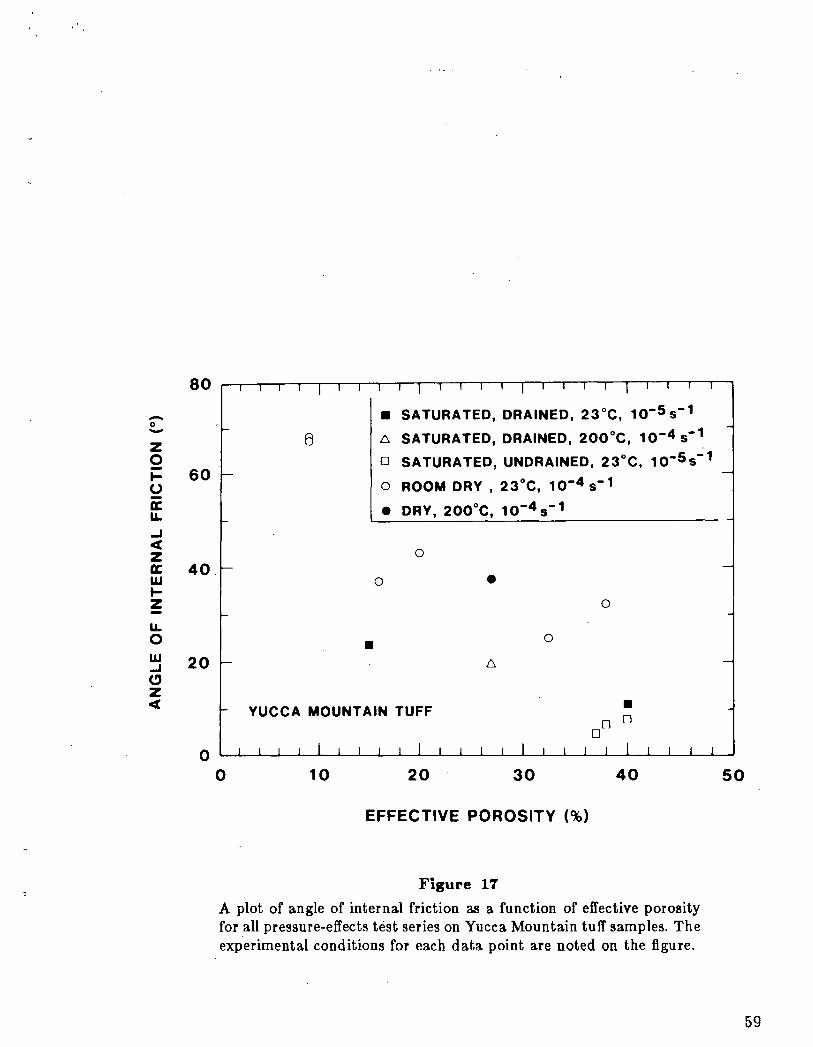
Figure 17. A plot of angle of internal friction as a function of effective porosity for all pressure-effects test series on Yucca Mountain tuff samples. The experimental conditions for each data point are noted on the figure. . . . . . . . . . . . . . . . . . . . . . . . . . . . . .
Figure 18. Plots of ultimate strength as a function of negative log strain rate for A. Tram, B. Calico Hills, and C. Topopah Spring tuff test series. All tests were run on saturated samples under unconfined and room temperature conditions.. . . . . . . . . . . . . . . . . . . . . . . .
Figure 19. Yucca Mountain thermal/mechanical zonation correlated with drillhole USW -G 1 stratigraphy. . . . . . . . . . . . . . . . . . . . .
40
41
42
43
44
45
58
59
60
63
5
Introduction
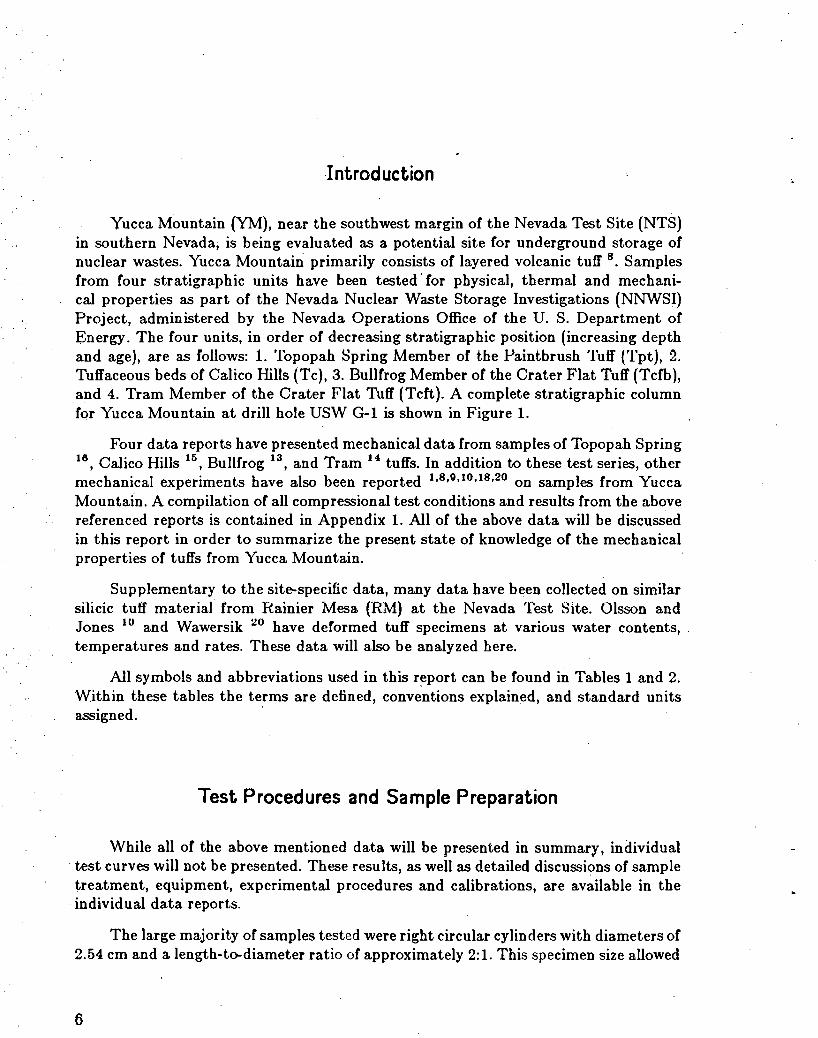
Yucca Mountain (YM), near the southwest margin of the Nevada Test Site (NTS) in southern Nevada; is being evaluated as a potential site for underground storage of nuclear wastes. Yucca Mountain primarily consists of layered volcanic tuff 8
• Samples from four stratigraphic units have been tested· for physical, thermal and mechanical properties as part of the Nevada Nuclear Waste Storage Investigations (NNWSI) Project, administered by the Nevada Operations Office of the U. S. Department of Energy. The four units, in order of decreasing stratigraphic position (increasing depth and age), are as follows: 1. Topopah Spring Member of the Paintbrush Tuff (Tpt), 2. Tuffaceous beds of Calico Hills (Tc), 3. Bullfrog Member of the Crater Flat Tuff (Tcfb), and 4. Tram Member of the Crater Flat Tuff (Tcft). A complete stratigraphic column for Yucca Mountain at drill hole USW G-1 is shown in Figure 1.
Four data reports have presented mechanical data from samples of Topopah Spring 16
, Calico Hills 15, Bullfrog 13
, and Tram 14 tuffs. In addition to these test series, other mechanical experiments have also been reported 1
•8
•9
•10
•18
•20 on samples from Yucca
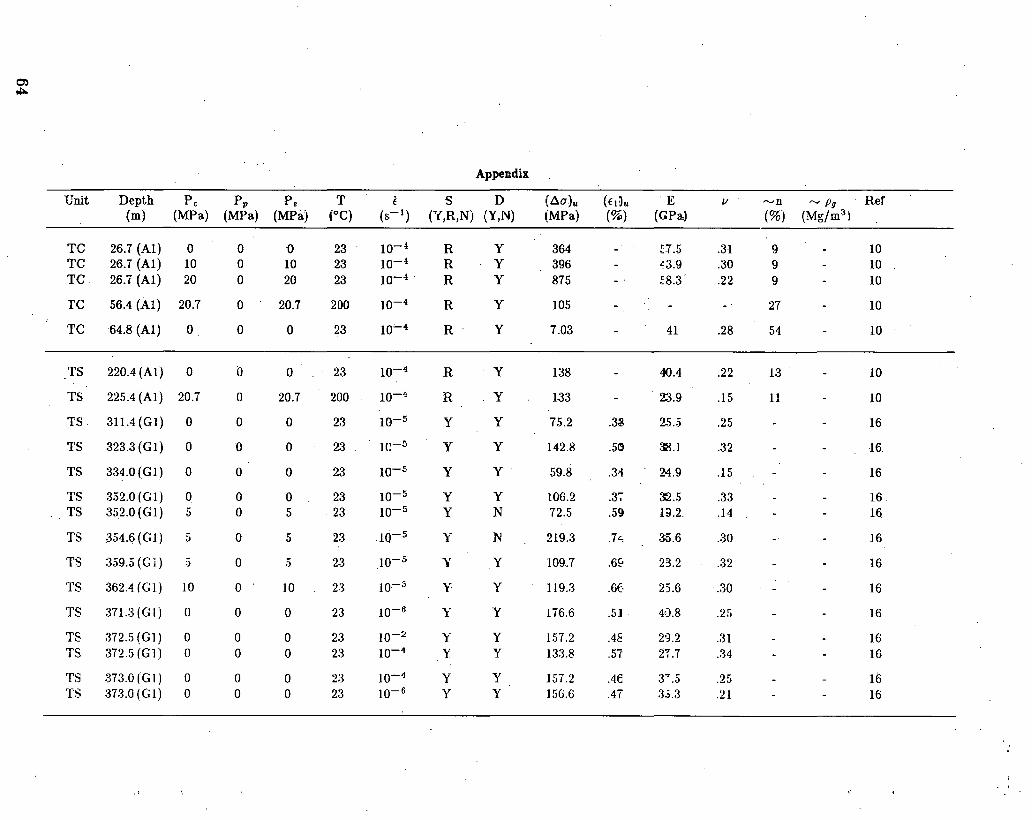
Mountain. A compilation of all compressional test conditions and results from the above referenced reports is contained in Appendix 1. All of the above data will be discussed in this report in order to summarize the present state of knowledge of the mechanical properties of tuffs from Yucca Mountain.
Supplementary to the site-specific data, many data have been collected on similar silicic tuff material from Rainier Mesa (RM) at the Nevada Test Site. Olsson and Jones 10 and Wawersik :w have deformed tuff specimens at various water contents, . temperatures and rates. These data will also be analyzed here.
All symbols and abbreviations used in this r~port can be found in Tables 1 and 2. Within these tables the terms are defined, conventions explained, and standard units assigned.
Test Procedures and Sample Preparation
While all of the above mentioned data will be presented in summary, individual test curves will not be presented. These results, as well as detailed discussions of sample treatment, equipment, experimental procedures and calibrations, are available in the individual data reports.
The large majority of samples tested were right circular cylinders with diameters of 2.54 em and a length-to-diameter ratio of approximately 2:1. This specimen size allowed
6
the number of test samples to be maximized, since the amount of raw core material was limited in amount and size (approximately 6 em in diameter). For the large majority of samples, the grain and flaw (pore) sizes were less than one-tenth of the sample diameter; thus, individual grain and pore effects on the bulk mechanical properties were minimized. The 2:1 length-to-diameter ratio reduces end effects (i.e., sample-
. .loading piston interaction), which are much more of a problem at lower ratios, and misalignment (i.e., the production of bending moments), which occurs more frequently when higher ratios are used. Calibrations of force and displacement gages prior to each experimental series have shown that errors in these measurements are in all cases less than three percent. ~y major differences in mechanical properties for adjacent tuff samples are, therefore, a result of sample variability (mineralogy, porosity, grain density, etc) or testing procedures. Since the experimental techniques were designed to minimize alignment and other problems, the data scatter is predominantly a result of sample variability.
Elastic Properties
Young's modulus and Poisson's ratio data have been collected in several experimental studies 8
•0
•10
•13
•14
•15
•16
•18
•20 on tuffs from Yucca Mountain. A statistical analysis 17
of these elastic constants as a function of effective porosity, grain density and zeolitization has been done on unconfined test data using samples of Calico Hills, Bullfrog and Tram tuffs 8
•13
•14
•15
•18
. All of the mechanical experiments were run on fully saturated samples at atmospheric pressure (i.e., unconfined), room temperature (23°C) and a 10-5 s- 1 nominal strain rate. The data were fit by the following models:
MODEL 1 : Log Y = Bo + B 1 Log X
MODEL 2 : LogY = Bo + B1 Log X1 + B2 Log X2,
where Log is a common logarithm to the base 10; X is effective porosity or grain density; X 1 is effective porosity; X 2 is grain density; Y is Young's modulus or Poisson's ratio; and Bo, B1, B2 are fitting parameters.
The results of the analysis are summarized in Tables 3 and 4. Six sets of fitting parameters are given by combining the results obtained from tests performed at Sandia National Laboratories- Albuquerque (SNLA) 8
•13
•14
•15 and Terra Tek Inc. (TT) 18 to
gether with three data sets: A. all tuff data, B. zeolitized tuff (i.e., p9 < 2.52 Mg/m3)
data and C. non-zeolitized tuff (i.e., pg > 2.52 Mg/m3) data. Only the statistically
significant fits (i.e., an a < .05) of the model to the data have been listed.
7

Using grain density as the basis for dividing the tuffs into zeolitized and nonzeolitized is not a rigorous, unique criteria. This material property was chosen since zeolites (hydrous silicates) tend to lower the average grain density of a silicic tuff. Furthermore, all of the test samples (considered in this statistical analysis) with a zeolite content of greater than 5 percent (by weight) were found to have grain densities of less than 2.52 Mg/m3
.
The fits were calculated using an effective porosity equal to the volume of clay (montmorillonite) material in addition to the actual porosity. This action was taken after careful analysis of the data in an effort to increase confidence in the predictive capability of the models. Since clay is a relatively weak; compliant material, considering its volume in an effective porosity is deemed appropriate.
A statistical comparison 17 of the SNLA data and the TT data has been performed due to major differences in the calculated fitting pa.ra.meters from the two da.ta. sets. These results are summarized in Table 5. The average differences for paired data (i.e., data from samples at the same depth) are given, with a positive difference indicating higher SNLA data values. The two labs are beginning discussions of possible explanations for the differences; however, since the reasons are not clear at this time, the results from analyses of each of the data sets are presented, but only the SNLA results will be discussed here.
Statistically, Young's modulus is significantly fit by using both effective porosity and grain density (Model 2) with all of the data. This result does not appear to have any real significance, however, since the fitting constant for grain density (82 ) is negative. Intuitively, this is not realistic because grain density should be directly related to Young's modulus. This is shown by the Modell fit of Young's modulus to grain density, and also graphically in Figure 2, with a general trend of increasing Young's modulus with grain density. As a result, the fits of all data to effective porosity (Figure 3) or of a split of the data, on the basis of zeolitization, fit to effective porosity (Figures 4A and 4B) appear to be the best predictive tools available.
Poisson's ratio appears graphically to be neither related to effective porosity (Figure 5}, nor to grain density (Figure 6). A statistically significant fit was made, however, to Model 2 with both bulk-rock properties.
Unconfined Strength
Ultimate stress values have been determined for tuff samples from Yucca Mountain under a wide range of experimental conditions 1 •8 •9 •10•13•14•15 •16 •18 •20 • There is a broad data base of unconfined compressive test results which has allowed a statistical analysis to be run on the fit of strength to bulk-rock properties with a power-law model. The only tensile data available are from Brazilian (indirect-tensile) tests, which have been linearly fit to porosity. These analyses will be discussed in the following subsections.
8

Compressive Strength
The same sets of unconfined, room temperature, constant strain rate experiments 8
•13
•14
•15
•18 analyzed in the elastic properties section were also studied 17 for the effects
of effective porosity, grain density and zeolitization on unconfined compressive strength (i.e., C0 ). Both the models (1 and 2) and the data sets (A, B and C) are identical to those described in the previous topic. The resultant model parameters are given m Table 6.
As mentioned in the Elastic Properties section, an effective porosity, equal to the matrix porosity plus the volume of clay, is being used. Figures 7 and 8 are loglog plots of ultimate stress (strength) versus porosity and versus effective porosity, respectively. These graphs illustrate the more distinct trend when effective porosity, instead of porosity alone, is used. As a result, effective porosity appears to be a good indicator of strength, especially when the data is divided on the basis of zeolitization (Figures 9A and 9B). The addition of grain density in Model 2 results in unrealistic fits (i.e., a negative B2 parameter for data set A), in statistically insignificant fits to the model (data set B), or in very minor increases in the indices of determination (data set C). Figure 10 is a log-log plot of strength versus grain density, showing the large data scatter, with an indistinct trend of strength directly proportional to grain density, as would be expected.
Figures 11 and 12 are graphs of axial strain at failure versus effective porosity and versus grain density, respectively. Graphically, ultimate strain appears to be insensitive to these bulk-rock properties.
A statistical comparison 17 of the SNLA and TT data has been performed for the ultimate strength and failure strain values. These results are presented in Table 1. As in Table 5, positive average differenc~ indicate higher SNLA data values. ·
Tensile Strength
Indirect, Brazilian test, measurements of the tensile strengths of samples from all four Yucca Mountain tuff units have been made at Los Alamos National Laboratory 1 .
The relationship between unconfined tensile strength (To) and porosity is approximately linear (see Figure 13). This linear relationship can be used for the firs~order approximations of tensile strength of any Yucca Mountain tuff sample with determined porosity.
Effects of Water
The effects of water saturation on silicic tuff were initially studied on samples of Grouse Canyon tuff (Tbrg) from Rainier Mesa 10
• A total of eighteen water-saturated
9

and oven-dried samples of Grouse Canyon welded tuff were deformed at atmospheric pressure; room temperature; and nominal strain rates of 10-6 , 10-4 and 10-2 s- 1
•
Results are tabulated in Table 8 and graphically presented in Figure 14. The data revealed, at each strain rate, saturated specimen strengths were an average of 30% lower than the corresponding dry sample strengths. As explained by Olsson and Jones 10
: "The fact that the trend lines drawn through the data are parallel suggests that the water effect is primarily chemical", and not mechanical.
Four experiments were run on samples of Calico Hills Tuff 15 at essentially the same test conditions (unconfined, 23°C, 10-s s-1
). These results are also presented in Table 8. In this study, two test specimens were fully saturated and two were roomdry. Similar to the Grouse Canyon study, the average strength for the water-saturated samples was approximately 23% less than for the room-dry samples.
Effects of Pressure
Confining Pressure
Thirteen sets of tests on intact samples from drill holes USW G-1 and UE-25a#u 1 have been run to examine the effects of confining pressure on failure strength u,tu,to,u. The experimental data were fit by linear re~ession of ultimate stress on to confining pressure and then transformed to the Coulomb equation in the same manner as described by Olsson and Jones 10
• The Coulomb failure criteria is as follows :
T = To + O'n(tan ¢),
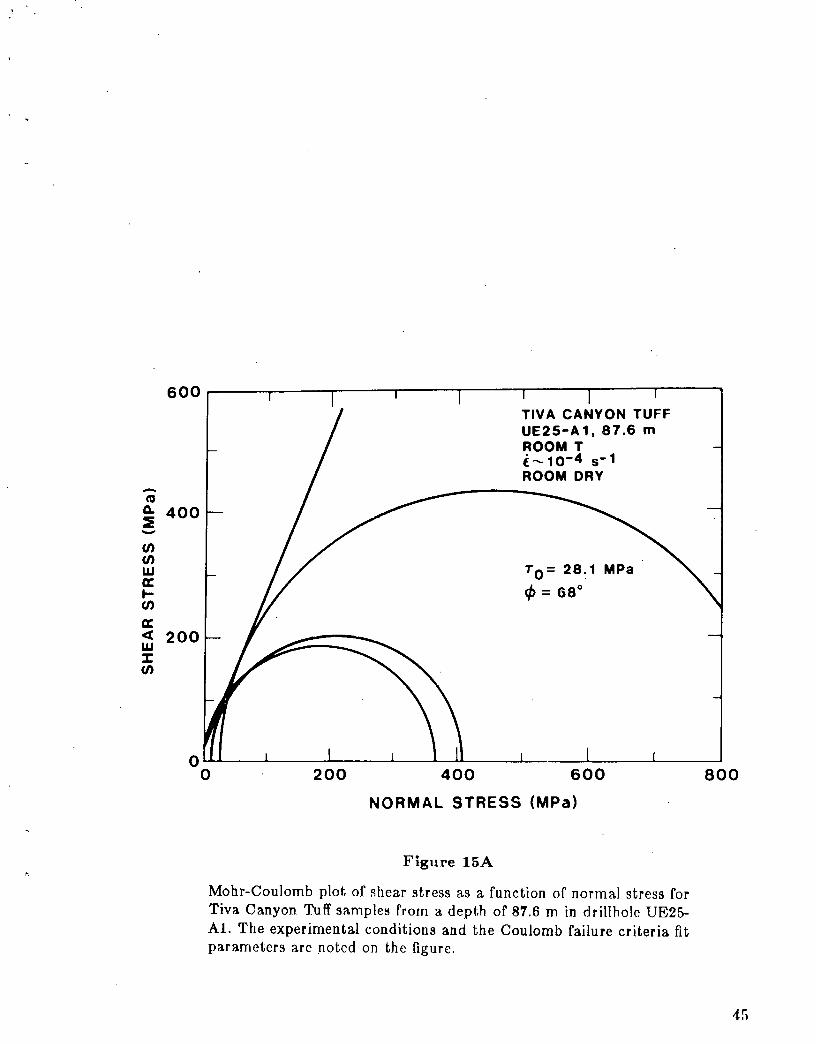
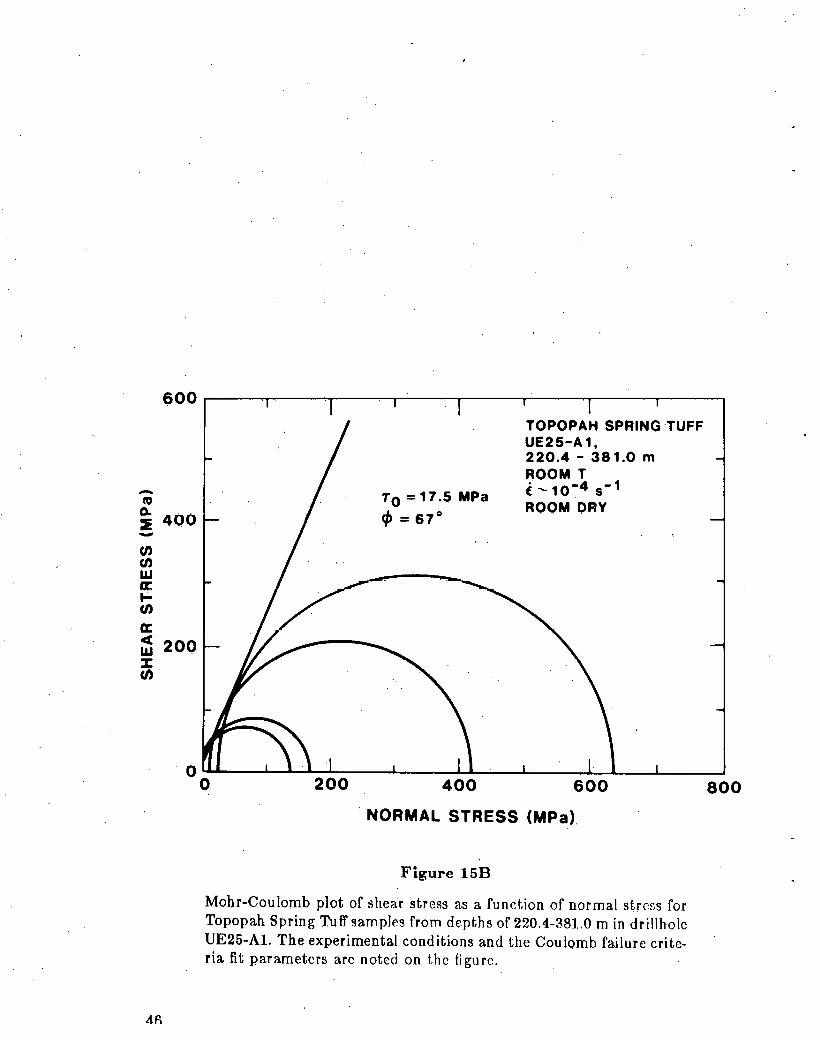
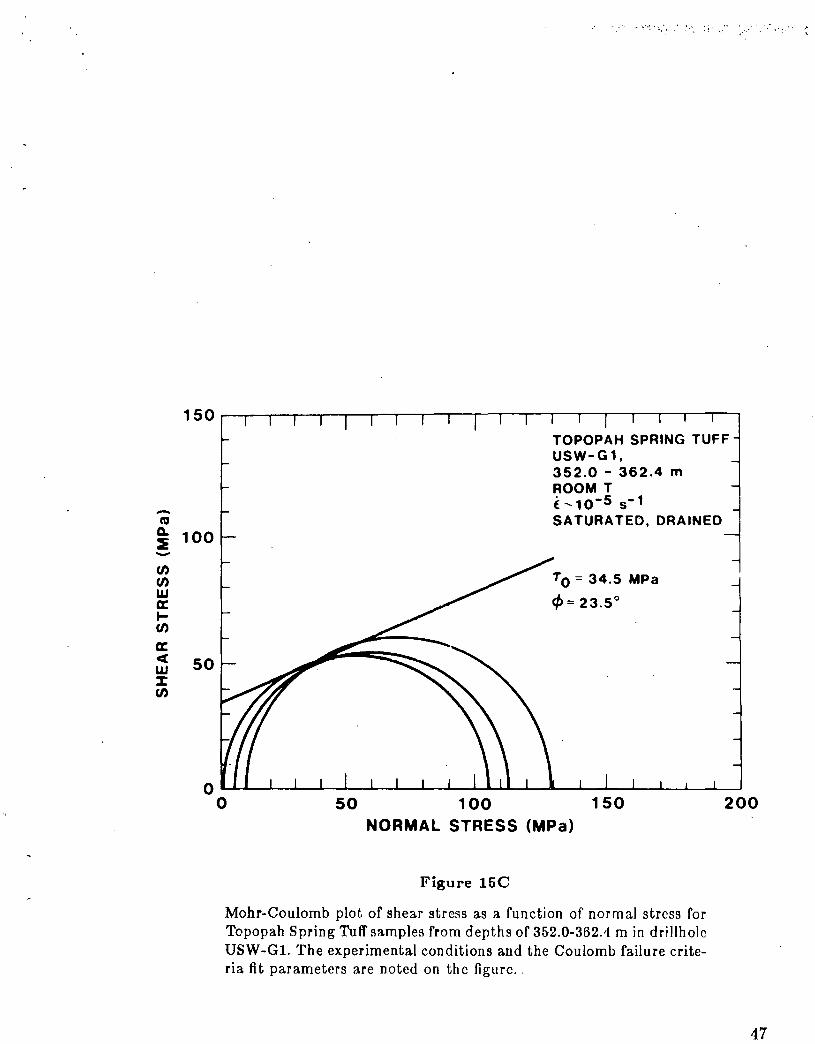
where T is shear stress, To is cohesion, O'n is normal stress, arid ¢is the angle of internal friction. These results are summarized in Table 9 and plotted in Figures 15A-15M.
Five of the test sets were run with room-dry samples .. These data illustrate a relatively small range of cohesion values {10.2-17.5 MPa) and a large range of friction angles (25.0-67.0°). Three sets of Calico Hills samples were deformed fully saturated, but with no exit for pore fluid during the course of the tests (i.e. "undrained"). The resulting ranges, and magnitudes, of Coulomb parameters are quite small, with cohesion and friction angle ranging from 9.7 to 13.2 MPa and 4.8 to 7.8°, respectively. The three remaining test series were performed saturated and drained, with two sets at room temperature and one set at 200°C. As a result, no trends can be observed due to the wide variations in test conditions.
1.0
t

Figures 16 and 17 are plots of cohesion and angle of internal friction, respectively, against effective porosity. Even with the wide variations in experimental conditions, the general inverse relationship between each of the Coulomb parameters and effective porosity is quite evident.
Pore Pressure
To date, only one series of tests has investigated the effects of pore fluid pressure on Yucca Mountain tuffs. Olsson 9 reported two test sets on Bullfrog samples deformed in compr~sion at effective pressures of 5, 12.5 and 20.7 MPa; a temperature of 200°C; and a nominal strain rate of 10-4 s-1
. Four experiments were run on dry samples and three on saturated specimens with pore pressures of 5, 5 and 3.4 MPa. Considering the expected strength decrease in the saturated sample test data (i.e., water-weakening), the curve trends and ultimate strengths from tests run at the same effective pressure were very similar to each other. As a result, it is assumed that the concept of effective stress (i.e., Pe = Pc- Pp) holds for tuff, as it has been shown by Handin and others 2
to hold for many other porous rock types (e.g. sandstone, porous limestone, etc.).
Effects of Temperature
Three studies 9•10
•20 refer to experimental data on tuff at elevated temperatures.
The mechanical test results are summarized in Table 10.
In general, ultimate strength is inversely related to temperature, as would be expected. More specifically, the higher porosity (> 25%) ash fall tuffs decrease in strength 30 to 40% when the experimental temperature is increased from 23 to 200°C. One experimental series 20
, however, found no difference in strength between two welded tuff samples (approximately 10% porosity) from Rainier Mesa deformed at 23 and 200°C.
Effects of Rate
Tests have been run at a range of laboratory strain rates (lo-7 to 10-2 s- 1 ) to study the effects of changes in rate on mechanical properties. The data from three series of experiments on site-specific tuffs 14
•15
•16 are listed in Table 11 and presented
in Figures 18A-18C, while the results from two series on tuffs from Rainier Mesa 10 are listed in Table 8 and presented in Figure 14.
11
The Tram (Figure 18A) and two Grouse Canyon (Figure 14) test series resulted in average strength decreases of approximately seven percent per decade decrease in strain rate. The decrease was somewhat less (about four percent per decade) for the Calico Hills (Figure 18B) tests. The Topopah Spring (Figure 18C) sequence of experiments . resulted in no definitive rate effect on strength. It is believed that this result was due to physical property and mineralogical variability of the samples tested. The test specimens were taken from USW G-1 core over the depth range 371.3-390.0 m, and therefore probably had a wide range or physical and mineralogical characteristics, resulting in the large data scatter.
Estimate of Average and Limit Mechanical PrnpertiP.~
In order to aid in the numerical modeling of the Yucca Mountain tuff response to thermal and mechanical loading, the tuff sequence has been divided into nine thermalmechanical zones 3 (see Figure 19). The zone boundaries were defined to reflect changes in mineralogical and bulk-rock properties (hence, significant changes in the mechanical properties) and are not always the same as the formal (geologic) stratigraphic divisions.
Lists of the input mechanical properties for each zone, and for the average and limit cases, are given in Tables 12 and 13. The elastic moduli and strength values were calculated using the parameters from previously discussed fits to the existing data, combined with the known average and limit bulk-rock properties 11 •12• The limit physical properties were defined as "worst-case" values, at two standard deviations below the mean. The angle of internal friction values were determined by using an estimated linear relationship with effective porosity, then these results, together with the unconfined compressive strength values, were used to back calculate the appropriate cohesion parameters. As a double check, the calculated cohesions were compared with the experimentally determined values and found to be reasonable.
Summary
Over two hundred and fifty mechanical experiments on tuff from Yucca Mountain have been performed. Other deformational tests have also been run on similar silicic tuff from Rainier Mesa. These data have been presented and analyzed for variations in elastic and strength properties with changes in porosity, effective porosity, grain density, zeolitization, water saturation, confining pressure, pore pressure, temperature, and strain rate.
A power-law model has beeri used to fit the elastic and strength data from unconfined compressive tests to bulk-rock prop~rties. The results show that effective
12

porosity is the best predictor or unconfined compressive strength and Young's modulus, especially when the data is divided on the basis or zeolitization. For Poisson's ratio, a combination or effective porosity and grain density fits the data best. In addition, the unconfined tensile strength data (from Brazilian tests) has been linearly fit to porosity as a first-order predictive tool.
Water saturated samples were found to be 23 and 30% weaker than room-dry and oven-dry samples, respectively. This water-weakening effect is an expected result for all silicate rocks, and in this case appears to be chemical, and not mechanical, in nature.
The pressure test series run to date were fit by the Coulomb failure criteria. These results, although obtained under a wide variety of experimental conditions, have shown that both the angle of internal friction and coh~~sion are inversely related to effective porosity. One sequence of experiments has indicated that the law of effective stress holds for the porous tuffs.
The strengths of the higher porosity tuffs are 30 to 40% lower at 200°C than at room temperature (about 23°C). The strengths of the lower porosity tuffs, however, may be affected very little by the same temperature variation.
Under normal laboratory axial strain rates (10-7 to 10-2 s- 1 ), an average de~;ease in ultimate strength of four to seven percent per decade decrease in strain rate has been observed.
.. ..
13

References
1. Blaele, J., Carter, J., Halleck, P., Johnson, P., Shankland, T., Anderson, R., Spieoehi, K., and Heller, A. Effects of Long-Term Exposure of Tuffs to High-Level Nuclear Waste-Repository Conditions LA-9174-PR, Los Alamos National Laboratory, Los Alamos, NM, Feb 1982·
2. Handin, J ., Hager, R., F'riedman, M., and Feather, J. Experimental Deformation of Sedimentary Rocks under Confining Pressure : Pore Pressure Tests A.A.P.G. Bullet., V.47, n.5, 717-755, May 1963
3. Lo.ngkopr, B. s. Discussion of Thermomechanical Cross-Section CC 1 as Given to RE/SPEC for Far-Field Unit Selection Calculations Unclassified memorandum to Distribution, Sandia National Laboratories, Albuquerque, NM, Jul 23, 1982
4. Lappin, A. R. Bulk and Thermal Properties of the Function:.tl Tuffaceous Beds, Here Defined to Include the Basal Topopah Spring, All of the Tuffaceous Beds of Calico Hills, and the Upper Portion of the Prow Pass Unclassified memorandum to Distribution, Sandia National Laboratories, Albuquerque, NM, Mar 26, 1982
6. J ... appin, A. R. Bulk and Thermal Properties for the Welded, Devitrificd Portions of the Bullfrog and Tram Members, Crater Flat Tuff Unclassified memorandum to Distribution, Sandia National Laboratories, Albuquerque, NM, Apr 19, 1982
6. Lappin, A. R. Bulk and Thermal Properties of the Potential Emplacement Horizon Within the Densely Welded, Devitrified Portion of the Topopah Spring Member of the Paintbrush Tuff Unclassified memorandum to Distribution, Sandia National Laboratories, Albuquerque, NM, May 25, 1982
7. Lappin, A. R., VanBuskirk, R. G., Enniss, D. 0., Butters, S. 1N., Prater, F. M., Muller, C. B., and Bergosh, J. L. Thermal Conductivity, Bulk Properties, and Thermal Stratigraphy of Silicic Tuffs From the Upper Portion of Hole USW G-1, Yucca Mountain, Nye County, Nevada SAND81-1873, Sandia National Laboratories, Albuquerque, NM, Mar 1982
8. Olsson, W. A. Comparative Test Sequence Documentation Unclassified memorandum to A. R. Lappin, Sandia National Laboratories, Albuquerque, NM, Jul 1, 1981
9. Olsson, W. A.
14
Effects of Elevated Temperature and Pore Pressure on the Mechanical Behavior of BullCrog Tuff SAND81-1664, Sandia National Laboratories, Albuquerque, NM, Feb 1982
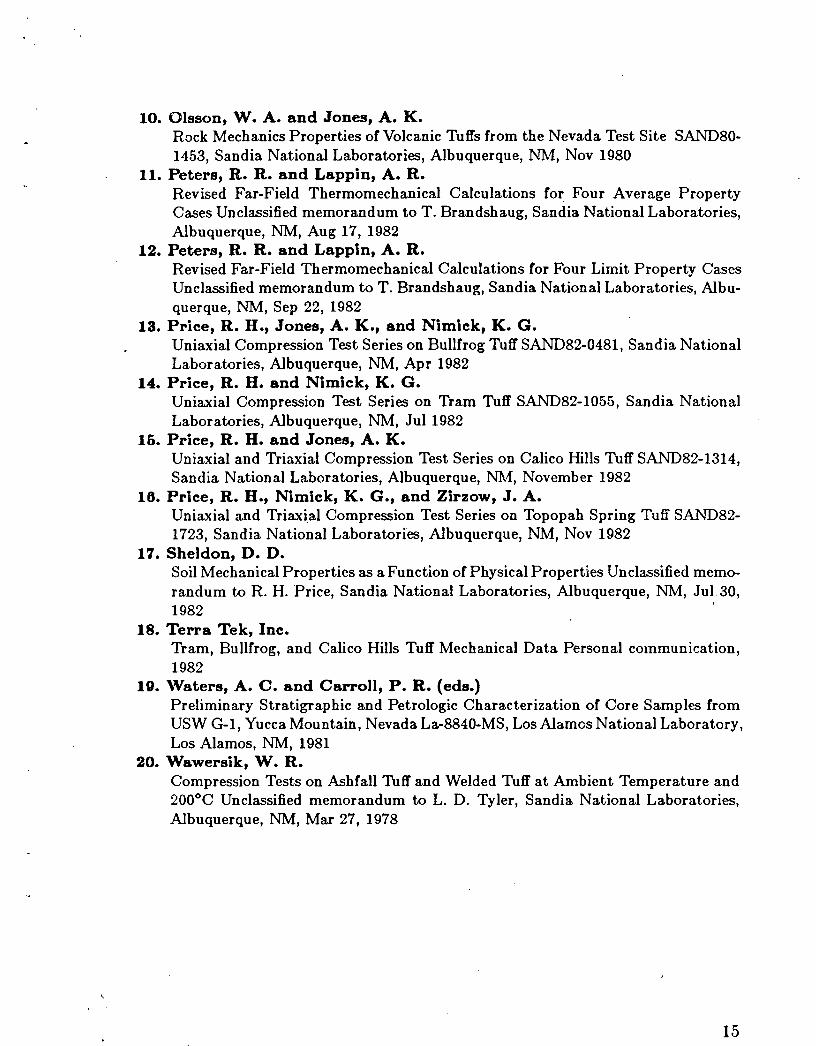
10. Olsson, W. A. and Jones, A. K. Rock Mechanics Properties of Volcanic Tuffs from the Nevada Test Site SAND80-1453, Sandia National Laboratories, Albuquerque, NM, Nov 1980
11. Peters, R. R. and Lappin, A. R. Revised Far-Field Thermomechanical Calculations for Four Average Property Cases Unclassified memorandum toT. Brandshaug, Sandia National Laboratories, Albuquerque, NM, Aug 17, 1982
12. Peters, R. R. and Lappin, A. R. Revised Far-Field Thermomechanical Calculations for Four Limit Property Cases Unclassified memorandum toT. Brandshaug, Sandia National Laboratories, Albuquerque, NM, Sep 22, 1982
13. Price, R. H., Jones, A. K., and Nimick, K. G. Uniaxial Compression Test Series on Bullfrog Tuff SAND82-0481, Sandia National Laboratories, Albuquerque, NM, Apr 1982
14. Price, R. H. and Nimick, K. G. Uniaxial Compression Test Series on Tram Tuff SAND82-1055, Sandia National Laboratories, Albuquerque, NM, Jul 1982
16. Price, R. H. and Jones, A. K. Uniaxial and Triaxial Compression Test Series on Calico Hills Tuff SAND82-i314, Sandia National Laboratories, Albuquerque, Nl\1, November 1982
16. Price, R. H., Nimick, K. G., and Zirzow, J. A. Uniaxial and Triaxial Compression Test Series on Topopah Spring Tuff SAND82-1723, Sandia National Laboratories, Albuquerque, NM, Nov 1982
17. Sheldon, D. D. Soil Mechanical Properties as a Function of Physical Properties Unclassified memorandum to R. H. Price, Sandia National Laboratories, Albuquerque, NM, Jul.30, 1982 .
18. Terra Tek, Inc. Tram, Bullfrog, and Calico Hills Tuff Mechanical Data Personal communication, 1982
10. Waters, A. C. and Carroll, P. R. (eds.) Preliminary Stratigraphic and Petrologic Characterization of Core Samples from USW G-1, Yucca Mountain, Nevada La-8840-MS, Los Alamos National Laboratory, Los Alamos, NM, 1981
20. Wawersik, W. R. Compression Tests on Ashfall Tuff and Welded Tuff at Ambient Temperature and 200°C Unclassified memorandum to L. D. Tyler, Sandia National Laboratories, Albuquerque, NM, Mar 27, 1978
15
16
Table 1. Symbols, Conventions and Units
SYMBOL
flu
Co To
(tlu)u
( t 1 )u
t
T s
D
E v
T = To + Un(tan </>)
t
To
Un
4> tan 4>
n
Pg
DEFINITION
Principal stresses; compressive stresses are positive
Principal strains; compressive strains are positive
Confining pressure Pore pressure Effective pressure (P e = P e - P p)
Differential stress (u1 - ua or Ut - P e)
Unconfined (uniaxial) compressive strength Unconfined (uniaxial) tensile strength
Ultimate (maximum or peak) diff~rential stress
Greatest principal strain at the ultimate differential stress
Nominal strain rate Temperature Saturation of test sample (Y : fully saturated,
R ! room dry, N :oven dried) -Drained experiment (I.e., 'the sample was
allowed to vent pore fluids durinJt th«: experiment) (Y : yes , N : no)
· Elastic constant : Young's modulus Elastic constant : Poisson's ratio
Coulomb failure criteria
~hear stress Cohesion (inherent shear strength) Normal stress Angle of internal friction Coefficient of internal friction
Effective porosity (porosity + clay volume) Average grain density
UNITS
MPa
%
MPa MPa MPa
MPa
MPa MPa
MPa
%
GPa
MPa MPa MPa
0

ABBREVIATION
SNLA 'l"f
NNWSI
NTS
RM Tbrg
YM Tpc Tpt Tc
Tcfp Tcfb Tcft
Gl Al
Modell Model 2
Data set A Data set B Data set C
"i1 F.S.
Table 2. Abbreviations
DEFINITION
Sandia National Laboratories- Albuquerque Terra Tek, Inc.
Nevada Nuclear Waste Storage Investigations
Nevada Test Site
Rainier Mesa, Nevada Test Site Grouse Canyon Member of the Belted Range Tuff
Yucca Mountain, Nevada Test Site Tiva Canyon Member of the Paintbrush Tuff Topopah Spring Member of the Paintbrush Tuff Tuffaceous beds of Calico Hills Prow Pass Member of the Crater Flat Tuff Bullfrog Member of the Crater Flat Tuff Tram Member of the Crater Flat Tuff
Drill hole USW G-1 at Yucca Mountain Drill hole UE-25a#l at Yucca Mountain
Log Y = Bo + Bt Log X LogY= Bo + Bt Log Xt + B2 Log X2
Effective porosity Q! Grain density Effective porosity Grain density Young's modulus QI: Poisson's ratio Fitting parameters
All tuff samples Zeolit.ized tuff samples only (p9 < 2.52 M!J/m3 )
Non~zcolitizcd tuff samples only (p9 > 2.52 M gfm3 )
Average difference between comparative values Fit significance (S : significant ==* a < .05
NS : not significant ==* a > .05) Standard Error Index of determination
17
-00
LAB (SKLA, TT)
SNLA Sl\"LA SNLA
SNLA Sl\"LA Sl'o""LA
SNLA Sl\"LA Sl\"'LA
.,., ;._ J.
TT TT
TT TT TT
TT TT TT
X y (n ,.p.,) (Co, E, v)
n E
P9 E
n' PJ E
n E Pg E
n' P-J E
n E Pv E
n' P-! -:::' ._,
n E
Pv E
n' P!! E
n E
Pv E
n' P'! E
n E Pg E
n 1 P! E
·Jable 3. N~odel Fit~ 1.o Young's Modulus Data
DATA SET MODEL F. S. Bo B1 B2 st .::>f Y R2
iA ·' B, ~) (!. ' 2) (SINS)
A 1 s 3.641 -~.800 .124 .676 A 1 s -.3940 ::All .212 .056 A 2 s . 4.766 -~.949 -2.241 .122 .696
B 1 s 4.375 -~.245 .127 .708 B 1 NS B 2 NS
c 1 s 4.108 -~.155 .101 .730 c 1 NS c 2 s .4652 -~.433 9.727 .085 .813
A 1 s 2.648 -U78 .. 217 .213 A 1 NS A 2 NS
B· 1 s 2.970 -1..347 .178 .291 B 1 NS B 2 NS
c 1 s 3.799 -2.017 .229 .306 c 1 NS c 2 NS

Table 4. Model Fits to Poisson's Ratio Data
LAB X y DATASET MODEL F. S. Bo B1 B2 S€ ofY R2 (SNLA, TT) (n ' Pg) (Co , E , L') (A, B, C) (1 ' 2) (S , l\oS)
SNLA n v A 1 NS SNLA Pg v A 1 s -2.364 4.138 .176 .135 SNLA n ' (Jg v A 2 s -3.932 .6760 5.560 .169 .229
SNLA n v B 1 s -2.385 1.067 .156 .291 SNLA Pg v B 1 NS SNLA n' ,Og v B 2 NS
SNLA n v c 1 NS SNLA Pg v c 1 NS SNLA n ·' Pg v c 2 NS
TT n v A 1 s .1514 -.7310 .175 .139 TT Pg v A 1 s -2.916 4.928 .172 .165 TT n' Pg v A 2 s -1.698 -.4724 3.641 .168 .212
TT n v B 1 s .1249 -.7330 .182 .104 TT Pg v B 1 NS TT n' Pg v B 2 NS
TT n v· (' ._, 1 NS TT Pg v c 1 s -5.919 12.16 .149 .192 TT n' Pg v c 2 s -6.125 -.6321 14.84 .144 .265

Table 5.. Comparative Statistics of SNLA-TT Elastic Mcduli Data
Ca6co Hills Bullfrc·g Tra.m All Data
Variable (units) ii(F.S.) d (F.S.) d (F..S.) d (F.S.)
E (GPaj -L8l (S) 3.66 (S) 1.60 (S) 1.19 (S)
v . L3 (S) .Ol (NS) .08 (S) .07 (S)
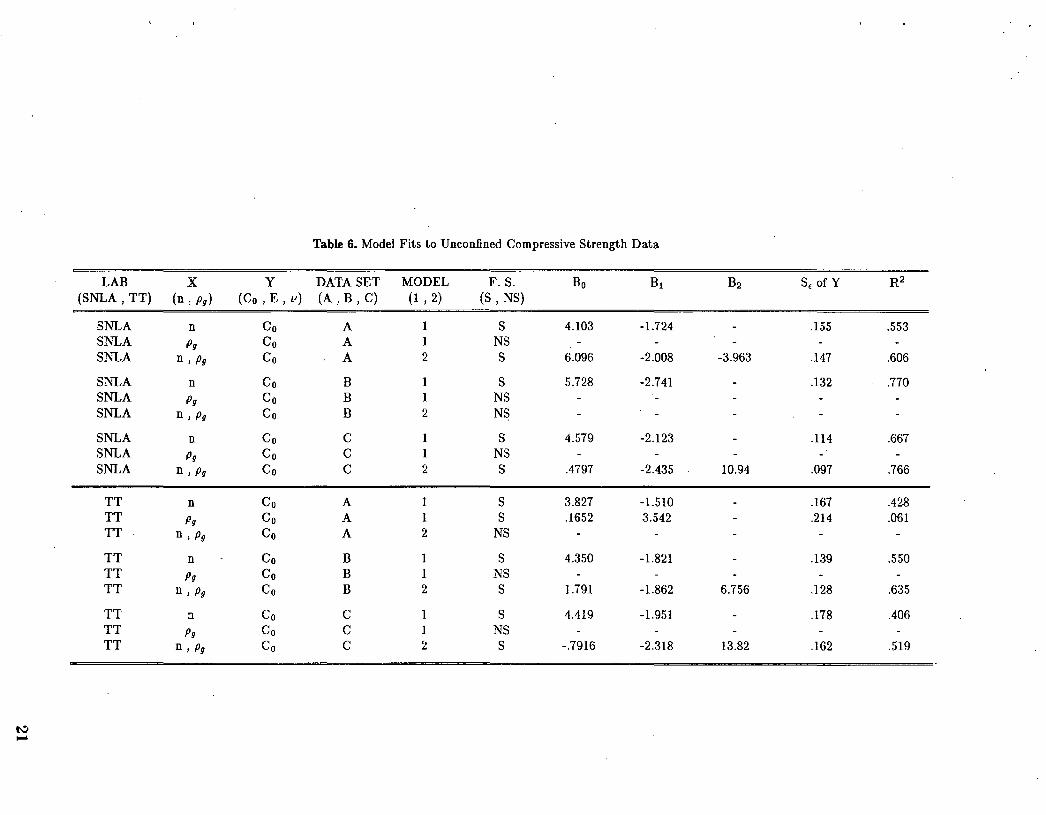
Table 6. Model Fits to Unconfined Compressive Strength Data
LAB X y DATASET MODEL F. S. Bo B1 B2 Sf ofY R2 (SNLA, TT) (n, p9 ) (Co , E , L') (A .. B, C) (1 ' 2) (S, ~S)
SNLA n Co A 1 s 4.103 -1.724 .155 .553 SNLA Pg Co A 1 NS SNLA n' Pg Co A 2 s 6.096 -2.008 -3.963 .147 .606
SNLA n Co B 1 s 5.728 -2.741 .132 .770 SNLA Pg Co B 1 NS SNLA n' Pg Co B
,., NS "'
SNLA n Co c s 4.579 -2.123 .114 .667 SNLA Pg Co c 1 NS SNLA n' Pg Co c .,
"' s .4797 -2.435 10.94 .097 .766
TT n Co A 1 s 3.827 -1.510 .167 .428 TT Pg Co A 1 s .1652 3.542 .214 .061 TT n' Pg Co A 2 NS
TT n Co B 1 s 4.350 -1.821 .139 .550 TT Pg Co B 1 NS TT n' Pg Co B ., s 1.791 -1.862 6.756 .1 28 .635 "'
TT 0 Co c 1 s 4.419 -1.951 .178 .406 TT Pg Co c 1 NS TT n' Pg Co c 2 s -.7916 -2.318 13.82 .162 .519
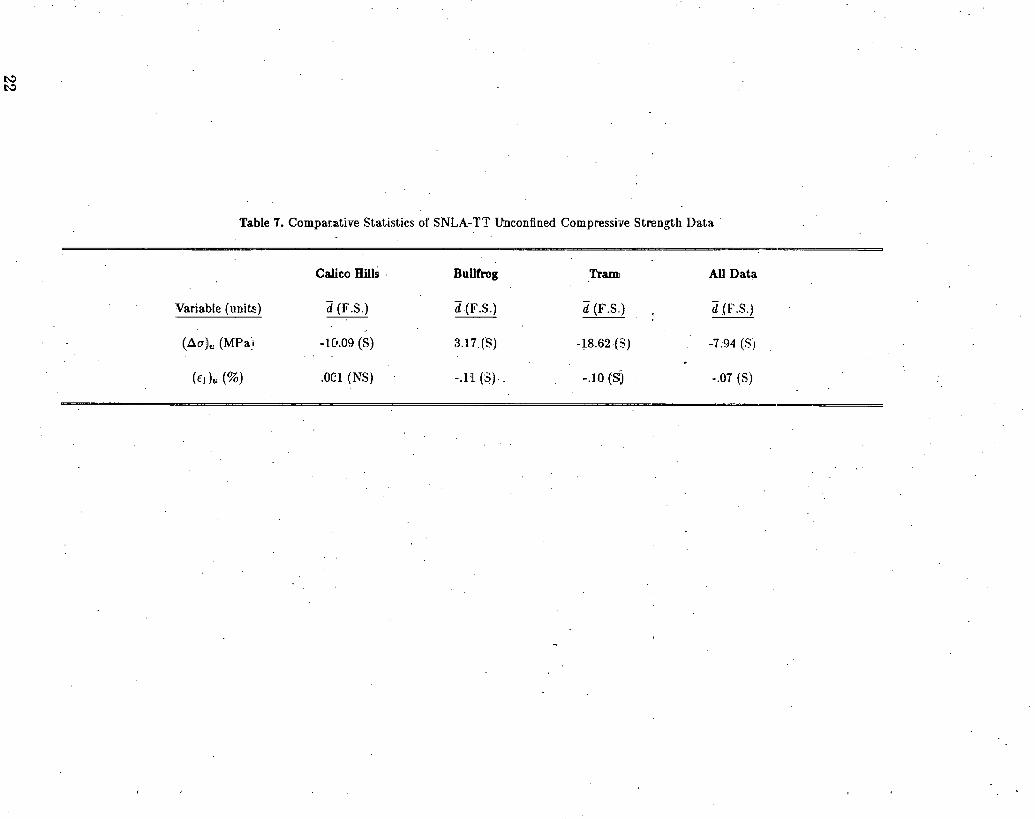
Table 7. Comparative Statistics of SNLA-TT Unconfined Compresshre Strength Data
Calico Hills . Bullfrog Tram All Dat~
Variable (unit..o::) d(F.S.) d (F.S.) d (F.S.) d .(F.S.)
(acr) ... (MPa) -1(•.09 (S) 3.17.(S) -18.62-(3) -7;94 (S)
(fi)u (%) .OCI (NS) li ('"') -. ' ~ '. -.10 (SJ -.07 (S)

Table 8. Test Results on the Effects of Changes in Water Content
Location Unit Depth Pe T i: s D (~a)u (<I)u E v Ref (m) (MPa) (OC) (s-1) (Y,R,N) (Y,N) (MPa) (%) (GPa)
YM Tc 5•J7.6 (G1) 0 23 w-5 R y 41.0 .58 8.12 .29 15 YM Tc 5•J7.6 (G1) 0 23 w-5 R y 32.7 .54 6.50 .31 15
YM Tc 5•)7.6 (G1) 0 23 w-5 y y 26.2 .50 6.86 .18 15 YM Tc 5•)7.6 (G1) 0 23 w-5 y y 34.1 .42 9.52 15
RM Tbrg 0 23 w-2 N y 175 25.9 10 RM Tbrg 0 23 w-2 N y 189 28.7 10 RM Tbrg 0 23 w-2 N y 177 28.4 10
RM Tbrg 0 23 w-4 N y 160 26.2 10 RM Tbrg 0 23 w-4 N y 155 28.5 10 RM· Tbrg 0 23 w-4 N y 160 27.4 10
RM Tbrg 0 23 w-6 N y 135 27.4 10 RM Tbrg 0 23 w-6 N y 141 28.3 10 RM Tbrg 0 23 w-6 N y 134 29.5 10
RM Tbrg 0 23 w-2 y y 142 26.1 10 RM Tbrg 0 23 w-2 y y 114 22.8 10 RM Tbrg 0 23 w-2 y y 118 23.8 10
RM Tbrg 0 23 w-4 y y 112 24.8 10 RM Tbrg 0 23 w-4 y y 122 25.3 10 RM Tbrg 0 23 w-4 y y 102 24.D 10
RM Tbrg 0 23 w-6 y y 81.1 25.9 10 RM Tbrg 0 23 w-6 y y llO 25.4 10 RM Tbrg 0 23 w-6 y y 91.8 26.8 10

Table 9.- Parameter Values :or the Coulomb F'ailure Criteria
Unit Depth (G1) Depth (A1) Pe T f_ s D 1i) if> Ref (m) (m) (MPa) -(OC) (s-1) (Y,R,N) . (Y,N) (:MPa) ( 0)
Tpc 26.7 0,10,20 23 w-4 R N 28.1 68 10
Tpt 220-381 0,10,20 23 w-4 R N 17.;5 67. 10
Tpt 352-362 0,5,10 23 w-s y y 34.5 2:3.5 16
Tc 453.4 0,10,20 23 w-s y y 10.2 11.1 15 Tc 453.4 0,10,20 23 w-s y N 10.6 7.81 15.
Tc 454-516 0,20 23 10-4 R N 12.9 25 . 10
Tc 507.6 0,10 23 w-s R N 10.2 32.2 15 Tc 507.6 0,10,20 23 w-s y N 13.2 . 6.81 15
- Tc 508.4 0,10 23 w-s y N 9.67 4.78 15
Tcfp 600-6L4 0,20 .23 w-4 R N· 32.2 37 10
Tcfb 738-759 0,20 23 w-4 R N 12.1 4:3 10
Terti 759 5,12.5,20.7 200 w-4 ·y y 23.6 19.6 9 Tcfb 759 5,10,20.7 200 w-4 N y 16.5 37.4 9
' .
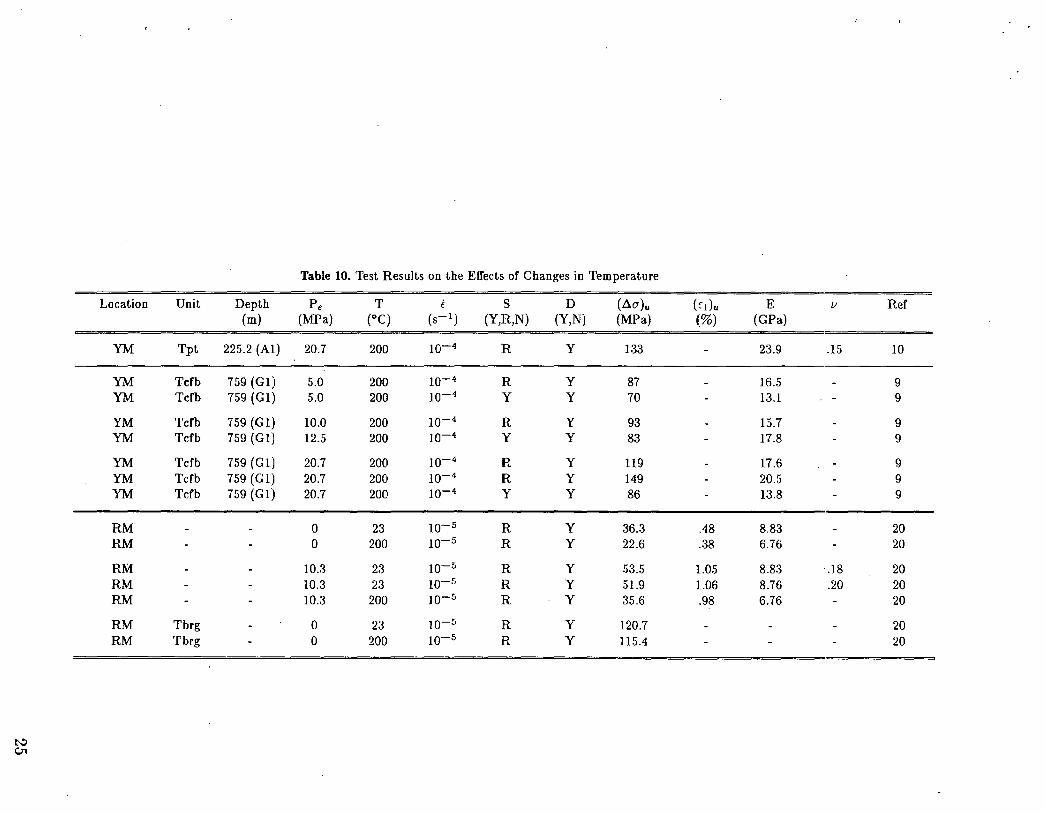
Table 10. Test Results on the Effects of Changes in Temperature
Location Unit Depth Pe T f. s D (~0' ) .. h) .. E l! Ref (m) (MPa) (OC) (s-1) (Y,R,N) (Y,N) (MPa) 1%) (GPa)
YM Tpt 225.2 (AI) 20.7 200 10-4 R y 133 23.9 .15 10
YM Tcfb 759 (G1) 5.0 200 w-4 R y 87 16.5 9 YM Tcfb 759 (G1) 5.0 200 10-4 y y 70 13.1 9
YM Tcfb 759 (Gl} 10.0 200 10-4 R y 93 15.7 9 YM Tcfb 759 (G1) 12.5 200 10-4 y y 83 17.8 9
YM Tcfb 759 (G1) 20.7 200 10-4 R y 119 17.6 9 YM Tcfb 759(Gl) 20.7 200 10-4 R y 149 20.5 9 YM Tcfb 759 (G1) 20.7 200 10-4 y y 86 13.8 9
RM 0 23 10-5 R y 36.3 .48 8.83 20 RM 0 200 10-5 R y 22.6 .38 6.76 20
RM 10.3 23 10-5 R y 53.5 1.05 8.83 .18 20 RM 10.3 23 10-5 R y 51.9 1.06 8.76 .20 20 RM 10.3 200 10-5 R y 35.6 .98 6.76 20
RM Tbrg 0 23 10-5 R y 120.7 20 RM Tbrg () 200 10-5 R y 11.5.4 20
~ 0)
Table 11. Test Result1; on the Effects of Changes in Strain Rate
Location Unit Depth (G1) Pe T (. s D (da)u :EI)u E v Ref (m) (:MPa) (oC) {s-1) (Y,R,N) (Y,N) (MPa) (%) (GPa)
YM Tpt 372.5 0 23 w-2 ·y y 157.2 .48 29.2 .31 16 YM Tpt 384.8 o· 23 w-2 y y 149.7 .49 36.6 16
YM Tpt 372.5 0 23 w-4 y y 133.8 . .57 27.7 16 YM Tpt 373.0 0 23 w-4 y y 157.2 .46 37.5 .25 16
YM Tpt 371.3 0 23 w-6 y y 176.6 .51 40.8 .25 16 YM Tpt 373.0 0 23 10-6 y y . 156.6 .47 35.3 .21 16 YM. Tpt 390.(• 0 23 li)-6 y y 44.9 .41 22.9 .27 16
YM Tc 508.4 0 23 w-3 y y 24.7 .61 5.41 .33 15 YM Tc 508.4 0 23 w-3 y y 2:3.4 .58 5.45 15
YM Tc 508.4 0 23 w-5 y y 25.4 .57 6.15 .36 15 YM Tc 508.41 0 23 w-5 y y 16.7 .43 4.92 .18 15
\'M Tc 508.4! 0 23 10-7 y y 21.5 .55 7.86 .21 15 \'M Tc 508.4 0 23 w-1 y y 19 . .9 .51 7.03 .22 15
YM Tcft 976.2 0 23 10-2 y y 31.1 .52 6.63 14 ):M Tcft 976.2: 0 23 10-:2 y y 24.4 .50 5.17 14"
IM Tcft 976.2 0 23 w-4 y y 25.3 .50 6.42 14 IM Tcft 976.2 0 23 w-4 y y 22.1 .32 8.76 14 . 1:M Tcft 976.2 0 23 10-4 y y 32.6 .44 8.97 .09 14
YM Tcft 976.2 0 23 JO~ y y 14.5 .31 7.04 .30 14 YM Tcft 976.2 0. 23 10~ y y 26.5 .50 8.26 .14 14

Table 12. Average-Case Mechanical Properties for each the of the Yucca Mountain Thermal/Mechanical Zones
Zone n• P/ E v Co To <P To
(#) (%) (Mg/m3 ) (GPa) (MPa) (MPa) ( 0) (MPa)
I 25 2.40 13.3 .13 49.3 6.0 20.8 16.1
ITA 27(12/15) 2.55 11.6 .20 43.2 4.3 19.5 14.4
liB 17(12/5) 2.55 26.7 .14 95.9 12.8 26.0 28.5
III 25 2.39 i3.3 .13 49.3 6.0 20.8 16.1
NA 33 2.39 8.1 .16 30.6 0.1 15.6 10.9
IVB 25 2.50 13.3 .17 49.3 6.0 20.8 16.1
NC 30 2.39 9.6 .15 36.0 1.8 17.5 12.4
VA 22 2.58 16.8 .18 61.5 8.6 22.7 19.3
VB 24 2.44 14.3 .14 52.9 6.9 21.4 17.0
V1 23 2.59 15.5 .19 56.9 7.7 22.1 18.1
VllA 24 2.46 14.3 .] 5 52.9 6.9 21.4 17.0
VllB 24 2.54 14.3 .18 52.9 6~9 21.4 17.0
vnc 24 2 . .50 14.3 .16 52.9 6.9 21.4 17.0
VIII 19 2.64 21.8 .19 79.2 11.1 2-1.7 24.0
IX 17 2.62 26.7 .17 9.5.9 12.8 26.0 28.5
• f'rom reference 11.
t-.:l ~
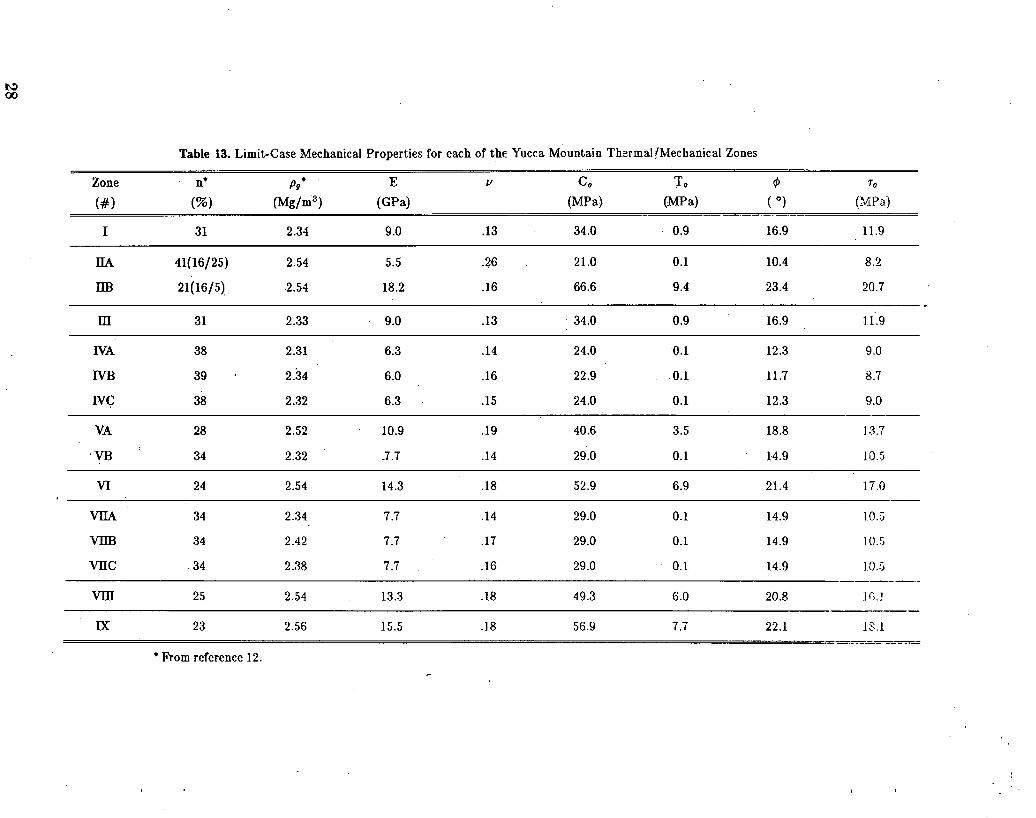
Table 13. Limit-Case Mechanical Properties for each of the Yucca Mountain ThermalfMechanical Zones
Zone n• P/ E v Co To rP To
(#) (%) (Mg/m3 ) (GPa) (MPa) (MPa) ( 0) (MPa)
I 31 2.34 9.0 .13 34.0 0.9 16.9 11.9
llA. 41(16/25) 2.54 5.5 .26 21.0 0.1 10.4 8.2
llB 21(16/5)_. .2.54 18.2 .16 66.6 9.4 23.4 20.7
m 31 2.33 9.0 .13 . 34.0 0.9 16.9 1.1.9
IVA 38 2.31 6.3 .14 24.0 0.1 12.3 9.0
IVB 39 2.34 6.0 .16 22.9 0.1 11.7 8.7
IV<;: 38 2.32 6.3 .15 24.0 0.1 12.3 9.0
VA 28 2.52 10.9 .19 40.6 3.5 18.8 J;U
·VB 34 2.32 3.7 .14 29.0 0.1 14.9 10.5
VI 24 2.54 14.3 .18 52.9 6.9 21.4 17.0
VllA. 34 2.34 7.7 .14 29.0 0.1 14.9 10.5
VllB 34 2.42 7.7 .17 29.0 0.1 14.9 10.5
vnc 0 34 2.38 7.7 .16 29.0 0.1 14.9 10.:)
vm 25 2.54 13.3 .18 49.3 6.0 20.8 Hi.J
IX 23 2.56 15.5 .18 56.9 7.7 22.1 18.1
• From reference 12.
YUCCA MOUNTAIN STRATIGRAPHY
DEPTH (USW-GI)
FEET METERS 0 0
100
200
1000 300
400
500
2000 600
700
800
900
TIVA CANYON, YUCCA MT, /PAH CANYON MEMBERS
TOPOPAH SPRING MEMBER
TUFFACEOUS BEDS OF
CALICO HILLS
PROW PASS MEMBER
BULLFROG MEMBER
~ ~ ::) .... .... ct _,
3000 TRAM MEMBER
~
a: w .... ct a: 0
1000-
1100
4000 1200
1300
1400
500J1soo
FLOW BRECCIA
LITHIC-RICH TUFF
UNDIVIDED ASH FLOW AND BEDDED TUFF
Figure 1 Yucca Mountain stratigraphic column at drillhole USW-Gl.
29

-tV
~ -en :::l -1 :::l c 0 :s en
" z ;::)
0 >
30
30 ASH FLOW TUFF (ALL DATA) + SATURATED • UNCONFINED • 1o-5 sec-1, T"'-'23°C f,._
22 + + ++
+ + +
18 ·+ +
'* + +
14 T + + +
+ + + + + + :t 10 + +
t I + 8 + + +
-+ + t + + +
+ + + +
+ ++ +
+ . ~vJ-..,...~-""f"'ll"'•'" .. '"-'1'~1 ...... ,1-; ... ,, .. -.... _. •...!..L
2.35 2.40 2.45 2.50 . 2.55 2.60 2.65
GRAIN DENSITY (gm/cc)
Figure 2
A plot of Young's modulus as a function of grain density for SNLA data from the Calico Hills, Bullfrog and Tram ash flow tuffs. All tests were run on saturated samples under unconfined, room temperature and 10-5 s- 1 conditions.
2.70
-tV 0..
" -C/)
:J ...J :) 0 0 ~ C/)
" z :J 0 >
30
ASH FLOW TUFF (ALL DATA)
22 + t SATURATED
+ UNCONFINED + 18 f"-'10-5 SEc-1 +
+ T"-'23°C +
+
+
+
+ 10 +
+ + .. + + +
8 + + .. +
6 BEST FIT LINE: +
logE= 3.64- 1.80 log n + + t +
(R 2 =.68) +
E = ( 4.38 X 10³ GPa)n- 1·80
+
20 25 30 35 40
POROSITY+ CLAY CONTENT (%)
Figure 3
A plot of Young's modulus as a function of effective porosity for SNLA data from the Calico Hills, Bullfrog and Tram ash flow tuffs. All tests were run on saturated samples under unconfined, room temperature and 10-6 s-1 conditions. .
... +
45
31

-en ~ ...J ~ 0 0 ~
en .. <!)
z ::::J 0 >
32
30~~~--~-.------~-r------~------r-----,
ASH FLOW TUFF (p<2.52 gm/cc SATURATED, UNCONFINED • £--10-5 sEc-1, T-- 23°C
t
BEST FIT LINE:
+
+
+
log E = 4.38 -2.25 log n
(R 2ca .71)
+
E = ( 2.37. x 10 4 GPa) n- 2·25
+
+ +
.j
+
* + + +
+
+
+ +
- ------ .... - . -
20 25 30 35 40 45
POROSITY+ CLAY CONTENT(%)
Figure 4A
Plot of Young's modulus as a function of effective porosity for zeolitized SNLA data from the Calico Hill!'!, Bullfrog and Tram ash flow tuffs. All tests were run on saturated samples under unconfined, room temp·erature and 10-5 8-1 condition~;,

-al Q. (!) -en ~ ..J ~
30
22
18
14
0 10 0 :::! en
" z ~ 0 >
8
6
+ ' -+
+ +
-+ +
+
+
ASH FLOW TUFF ( p > 2.52 gm/cc) SATURATED UNCONFINED • £ "- 1 o-5 sEc-1 T -... 23°C
+ +-+
+ + + + + +
+
BEST FIT LINE: log E = 4.11 - 2.16 I og n ~
(R 2 =.73) * E = ( 1.28 x 10 4 GPa) n- 2.16
20 25 30 35 40
POROSITY+ CLA V CONTENT (%)
Figure 4B
Plot of Young's modulus as a function of effective porosity for nonzeolitized SNLA data from the Calico Hills, Bullfrog and Tram ash flow tuffs. All tests were run on saturated samples under unconfined, room temperature and :w- 5 s-1 conditions.
45
33

0 .t-< a;: (/)
z 0 en (/) -0 Q.
34
I . I I I
ASH FLOW TUFr (ALL OAT A) SATURATED UNCONFINED • 10-5 sEc- 1 ( -...,
.46 - T"-' 23°C - +
t
.30 + + + - * + + + * + +
.22 -+
+ + + + +
+ +
. 14 - + + +
t + + + + +
.1 0 -... +
.06 f- I 1 '_l 1
20 25 30 35 40
POROSITY+ CLAY CONTENT (%)
Figure 6
A .plot of Poisson's ratio as a function of effective porosity for SNLA data from the Calico Hills, Bullfrog and Tram ash flow tuffs. All tests were run on saturated samples under unconfined, room temperature and 10-5 B- 1 conditions.
--
-
-
--
-45
0 .... < a: (/)
z 0 (/) (/) -0 Q.
I I T 1 1 I
ASH FLOW TUFF (ALL OAT A) SATURATED UNCONFINED
.46 ~ f --1o-5 SEC- I
T-- 23°C +
+
.30 - :;: + + ~ - + +
+ .22 1-
+
+ + + + + + ~
+ +
.14 1- -+ + +
~ -t + + + + +
.1 0 -~ +
.06 ~ I I I I I I
. 2.35 2.40 2.45 2.50 2.55 ·2.60 2.65
GRAIN DENSITY (gm/cc)
Figure 6
A plot of Poisson's ratio as a function of grain density for SNLA data from the Calico Hills, Bullfrog and Tram ash flow tuffs. All tests were run on saturated samples under unconfined, room temperature and 10-5 s- 1 conditions.
-
~-
--
-
-
-
-2.70
35
-nJ D. ~ -(/) w w Ct .... (/)
w .... <(
~ .... .J ;::)
36
180" I .. I I T I I I I
+ ASH FLOW TUFF (ALL DATA) 14U f- SATURATED
+ UNCONFINED •
100 f-. 1o-5 SEC -1
f:- T-. 23°C + ao ._
+ + '+'+
60 f- + + + +
~ ' + + -t
+ + + 40 f-
+ + * + + + 30 f- + . ++
+++· J+ + + +
:f.+ 20 ~ + :t +
++ t +
15 ..... + +
ll r I , ..... I I I I 1
16 18 20 22 24: 28 .32 36 40
POROSITY(%)
Figure 7
A plot of unconfined compressive strength as a function of porosity for SNLA data from the Calico Hills, Bullfrog and Tram ash flow .tuffs. All tests were run on saturated samples under unconfined, room temperature and 10-5 s-1 conditions.
-
-
-
-
-
+ +-
-
-
44
-
180----------~--------~------~----~----~
+
+
+· +
ASH FLOW TUFF {ALL DATA) SATURATED UNCONFINED ( --1 0 -5 SEC -1 T """w 23°C
+ +
+
+ +
+
BEST FIT LINE: +
20
log L1au = 4.10- 1.72 log n {R2 =.55)
+
L1au..={ 1.27 x 10⁴ MPa) n - 1·72
25 30
t +
35
POROSITY+ CLAY CONTENT {%)
Figure 8
+ +
40
A plot of unconfined compressive strength as a function of effective porosity for SNLA data from the Calico Hills, Bullfrog and Tram ash flow tuffs. All tests were run on saturated samples under unconfined, room temperature and 10-5 s-1 conditions.
45
37

180~--~-----------------,--------.-------.------,
140
100 -ca Q.
== -(/) 60 (/) w a: .... (J)
w ....
+
+
ASH FLOW TUFF (p~ 2.52 gm/cc)
+
SA TUnA TED UNCONFINED (-- 1o-5 SEc-1
T"" 23°C
+
+
+
+
~ 30 s ..:::; BE T FIT LINE: -.... ..J ::l
'H2.
20
log .10'u =·5.73- 2.74 log n·
(R2 =.77) L1au=(5.3S X 105 MPa)n -2.74
25 30
+
+
35
POROSITY+ CLAY CONTENT (%)
Figure 9A
+ +
40
Plots of unconfined compressive strength as a function of effective porosity for zeolitized SNLA data from the Calico Hills, Bullfrog and Trarn ash flow tuiTs. All tests· were run on saturated samples under unconfined, room temperature and 10-5 8-.t conditions.
+
+
45

-
180
140
• +
ASH F L 0 W TUFF (p > 2. 5 2 g m Icc) SATURATED UNCONFINED
f--1o-5 SEC -1
T'"""' 23°C
• +
+
+
log L1ou= 4.58 - 2.12 log n ~
(R 2 = .67) L1ou = ( 3.79 x 10 4 MPa)n- 2 · 12
20 25 30 35 40
POROSITY+ CLAY CONTENT (%)
Figure 9B
Plots of unconfined compressive strength as a function of effective porosity for nonzeolitir.ed SNLA data from the Calico Hills, Bullfrog and Tram ash flow tuffs. All tests were run on s~o~.turated samples under unconfined, room temperature and 10-5 s- 1 condit;ions.
45
39
-ca 0. :e -CJ) w w a: .... CJ)
w .... <(
~ .... .... ...J =»
40
180 I .. 1 I I T I
+: ASH FLOW TUFF -
140 ~ SATURATED -T UNCONFINED
100 ~ E:-- 1o-s sEc-1-T ~ 23°C a·o r- +
+ + + ...
60 -- + ++
T + 40 - +
+ t t + +
30 ~ t + .. +
+-t t
20 ~ +
15 t- + ~
I I I I I I
2.35 2.40 2.45 2.50 2.55 2.60 2.65
GRAIN DENSITY (gm/cc)
Figure 10
A plot of unconfined· compressive strength as a function of grain density for SNLA data from the Calico Hills, Bullfrog and Tram ash flow tuffs. All tests were run on saturated samples under unconfined, room temperature and 10-5
B-1 conditions.
--
-
-
-
-
-:f;
-
2.70

-rfi. -UJ a: ::J ...J -< LL
t-< z -< a: t-(/)
...J < )(
<
I I I I
ASH FLOW TUFF (ALL OAT A) SATURATED
. 78 -:- UNCONFINED i ...... 1o-5 sec-1
+ f-
T-- 23°C .62 ~ +
+ + + + + +
1- + + + + + +
+ + +
t-t +
.46 ...... + + + + + ++ + + + -t t + + ... 1- +
.38 + - + + + + + +
+ + + +
.30 - + +
+ .26 -
I I l I . 20 25 30 35 40
POROSI"fY+ CLAY CONTENT (%)
Figure 11
A plot of axial strain at failure as a function of effective porosity for SNLA data from the Calico Hills, Bullfrog and Tram ash flow tuffs. All tests were run on saturated samples under unconfined, room temperature and 10-5
B- 1 conditiom:1.
-
-
-
--
-
-
-
-
45
41. ~
-?fl. -iLl 0: :::> ..J -~ ~
.... ~
z -~ 0: .... (/)
..J ~ )(
~
42
I I ! I . I , ! ASH FLOW TUFF (ALL OAT A)
SATURATED . 78 r- UNCONFINED
i -- 10-5 sec-1 T ,...:_ 23°C
.62 t- + + + + ~
~ + + + T +
+ + + + +· i .46 ...... + T + +
.... i -+ + + + + t + + t .38 + + +
~ + T + + + + .... + t T
.30 -.. +
. 26 -J J l J l J
. 2.35 2.40 2.45 2.50 '2.55 2.60. 2.65
GRAIN DENSIT~ (gm/cc)
Figure 12
A plot of axial strain at failure as a function of grain density for SNLA data from the Calico Hills, Bullfrog and Tram ash flow tuffs. All tests were run 9n saturated samples und·er unconfined, room temperature and 10-6
· B-1 conditions.·
-
-
-
.-
-
=-
+
.,._ --
2.70

-CQ 0. ::E -::J: to z w a: tC/)
w ..J -C/) z w t-o w z u.. z 0 0 z ::::)
25
20
15
10
5
0 YUCCA MOUNTAIN TUFFS
0
Figure 13
A plot of unconfined ten5ile strength as a function of effective porosity. All data were obtained from Brazilian (indirect-tensile) tests. (Data from Reference 1).
43

44
\/"1 Vl u..J e::: ...... Vl
200 ~~,------,---r-,-----.,----,
• ..........
I
150 -
••
• • 100 -
~·~.
:~· •
-
-
. ."' SO r- GROUSE CANYON WELDf.D TUFF
UNCONFINED COMPRESS I ON·
• DRY • WET·
0 l I
2 4
- log STRAIN RATE, s -1
Figure 14 ·
-
I
6
A plot of maximum (ultimate) stress (strength} as a function of negative log strain rate for Grouse Canyon tuff data: The tests were run on dry (oven dried) and wet (saturated) samples under unconfined and room temperature conditions. (Figure from Reference 10.)
-IV
~ 400 -en en w a: ~ en a: ct 200 w :I: en
TIVA CANYON TUFF UE25-A1, 87.6 m ROOM T f'"'-10-4 s-1 ROOM DRY
To= 28~1 MPa
fjJ = 68°
NORMAL STRESS (MPa)
Figure 15A
Mohr-Coulomb plot of shear stress as a function of normal stress for Tiva Canyon Tuff samples from a depth of 87.6 m in drillholc UE25-Al. The experimental conditions and the Coulomb failure criteria fit parameters arc .noted on the figure.
4!)
-cv
i 400 -U) U) w a: .,_;. U)
a: . ~ 200
% cJ)
To= 17.5 MPa
cl> = 67g
TOPOPAH SPRING TUFF UE25-A 1, 220.4- 381.0 m ROOM T t ..... 1 0 ~4 s "" 1
ROQM ORY
0~--~~~~----~----~~--~--~~~~----~ 0 200 400 800
. NORMAL STRESS (MPa)
Figure 15B
Mohr-Coulomb plot of shear stress as a funct.ion of normal strcr.s for Topopah Spring Tuff samples from depths of 220.4.-381.0 min drillholc UE25-Al. The experimental conditions and the Coulomb failure criteria fit parameters arc noted on the figure.
-cv ~ ::t -(/) (/) w a: 1-(/)
a: < w ::z::: (/)
... ·,· ·' ... ·~:~. . . . . ' : ~
150 TOPOPAH SPRING TUFF USW-G1, 352.0 - 362.4 m ROOM T (-1o-5s-1 SATURATED, DRAINED
100
TO= 34.5 MPa
cp = 23.5°
50
QLL~~~~--~~~~--~~~~~A-~~--~~~--~~
0 50 100 150 NORMAL STRESS (MPa)
Figure 16C
Mohr-Coulomb plot. of shear stress as a function of normal stress for Topopah Spring Tuff samples from depths of 352.0-362.1 m in drillholc USW -G 1. The experimental conditions and the Coulomb failure criteria fit parameters are noted on the flgurc ..
200
4.7
-ftl Q. :E -U) en w a: .... en a: <c w ~ en
48
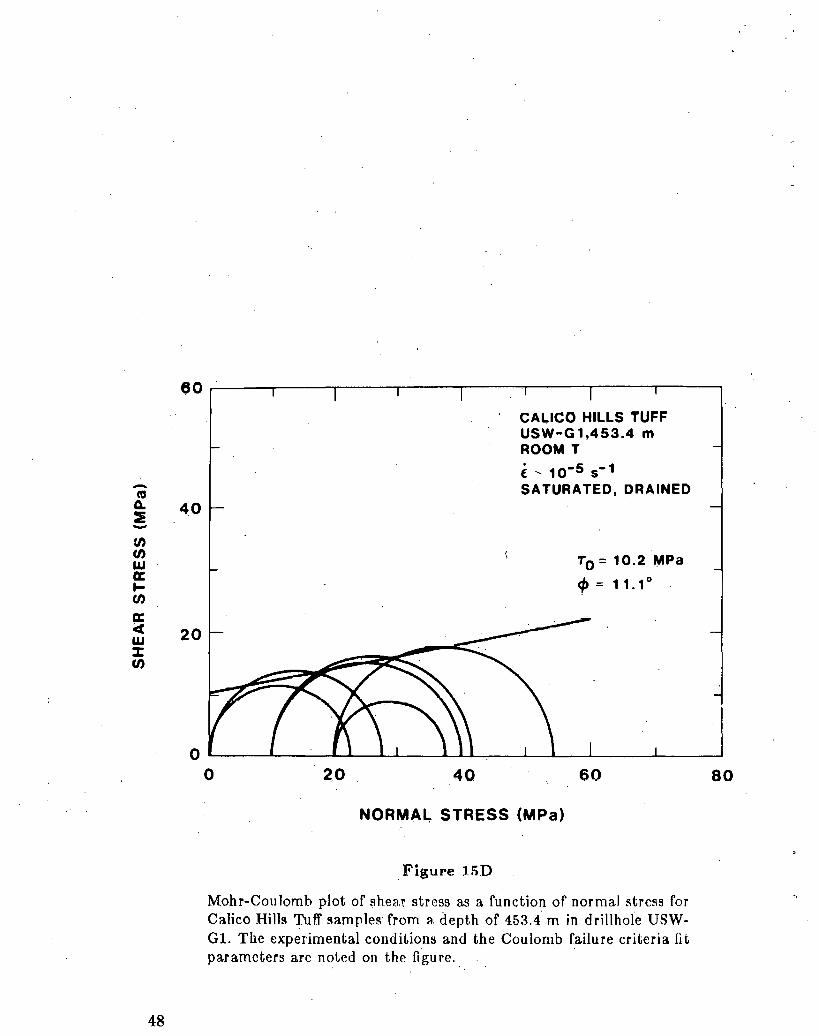
60
CALICO HILLS TUFF USW-G1,453.4 m ROOM T
i ~ 10-s s-1 SATURATED, DRAINED
40
T0 = 10.2 ~Pa
cp:11.1°
20
0 ~----._-----L~--~----~~~--~~~~------~----~ 0 . 2.0 40 60
NORMA~ STRESS (MPa)
_Figure 15D
Mohr-Coulomb plot of shear. stress as a function of normal stress for Calico Hills Tuff sample!'r from ::~.depth of 453.4. m in drillhoie USWGl. The experimental condiLionM and the Coulomb failure criteria Ht parameters arc noted on the figure.
80

,.
-cu ~ ~ -en en w a: .... en a: cl: w ::z: en
60
CALICO HILLS TUFF USW-G 1,453.4 m ROOM T
i---1o-5s-1 SATURATED, UNDRAINED
40
To= 10.6 MPa
~ = 7.8°
20
OL---~~--~~~~~~~~~L-~-L--~----~----~
0 20· 40 60
NORMAL STRESS (MPa)
Figure 15E
Mohr-Coul~mb plot of shear stress as a function of normal stress for Calico Hills Tuff samples from a depth of 1:53.1 m in drillholc USWGl. The .experimental conditions and the Coulomb failure ·criteria fit parameters arc not~d on the figure.
80
49
1$0
-"' c.. :IE 100 -U) U) w a: f-U)
a: ~ w l:
50 U)
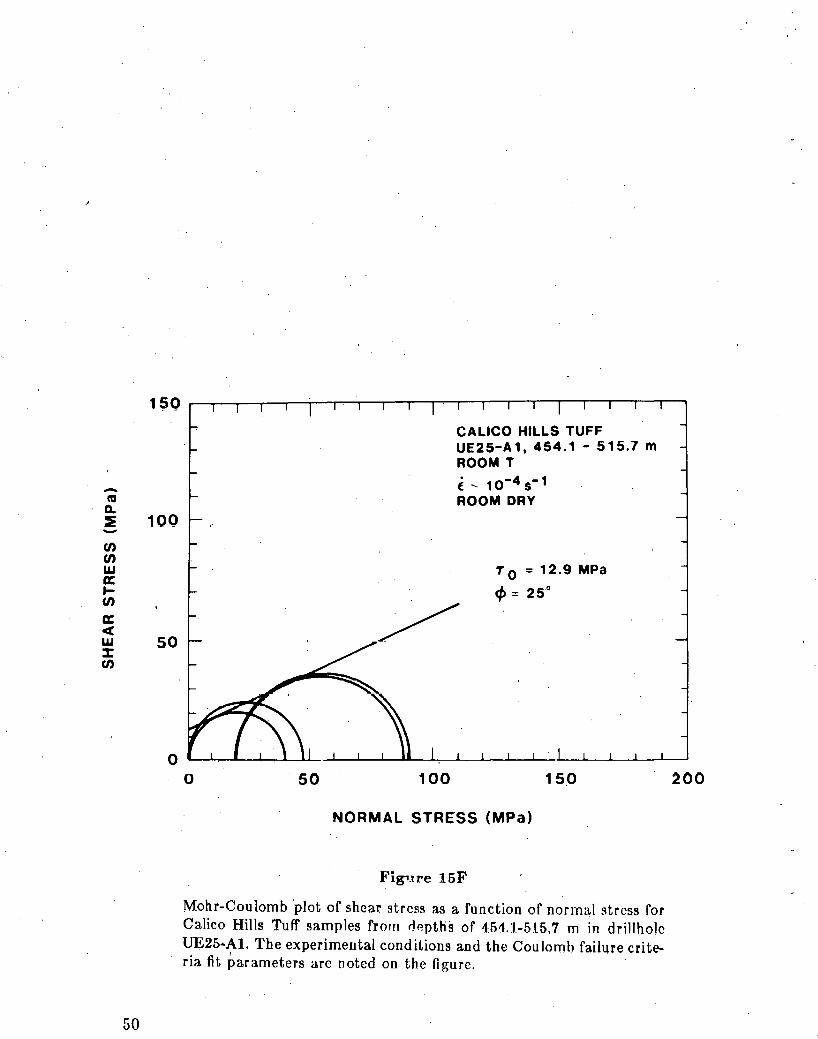
50
CALICO HILLS TUFF UE25-A1, 454.1- 515.7 m ROOM T
i ~ 10-4 s- 1 ROOM DRY
To=12.9MPa
4> = 25°
0 50 100 15.0
NORMAL STRESS (MPa)
Fig1.1re 15F
Mohr-Coulomb 'plot of shear. stress as a function of normal stress for Calico Hills Tuff samples from depths of 451:.:1.-515,7 m in drillholc UE25·Al. The experimental conditions and the Coulomb failure criteria fit parameters are noted on the figure.
200
-ftS. ~ :E -en en w £E: .... en ~ ct w % en
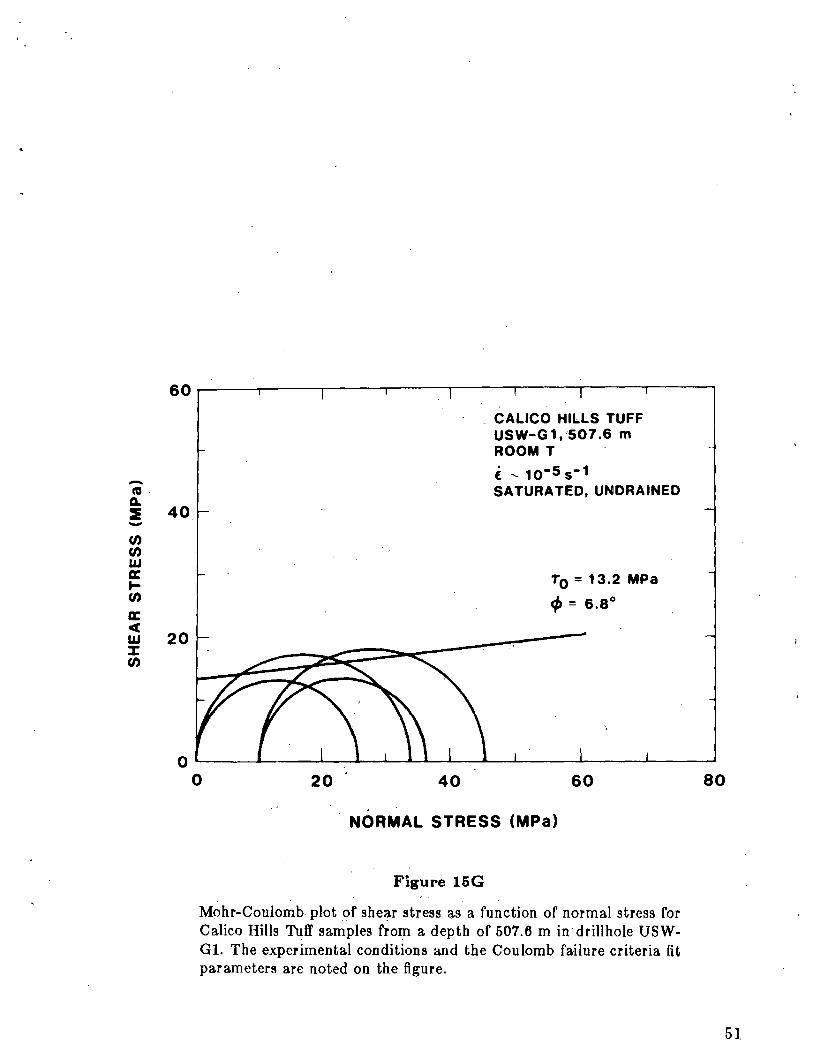
60
_ CALICO HilLS TUFF USW-G 1, ·507 .6 m ROOM T
i --- 10-5 s-1 SATURATED, UNDRAINED
40·
To= 13.2 MPa
cp = 6.8°
20
OL-----L------~~--~~L-L-~--~----~----~----~
0 20 40 60
NORMAL STRESS (MPa)
Figure 16G
Mohr-Coulomb. plot of she~r stress as a function of normal stress for Calico Hills Tuff samples from a depth of 507.6 m in drillhole USWGl. The experimental conditions and the Coulomb failure criteria fit parameters are noted on the figure.
80
51

-"'
CALICO HILLS TUFF USW-G1,507.6 m ROOM T
i.--1o-Ss-1 ROOM DRY
~ 40 To= 10.2 MPa
cp = 32.2° -
0
52
~----L-__ __1_. ----~~---ll----~------L---~~----~ 0 20 40 60
NORMAL STRESS (MPa)
Figure.16H
· Mohr-Coulomb plot of shear stress as a function of normal stress for Calico Hills Tuff samples from a depth of 507.6 m in drillholc USWGl.,T~e experimental conditions and the ·coulomb failure criteria fit parameters are noted on the figure.
80
30
-ca Q. ~ - 20 en en w a: 1-en a: ~ w % 10 en
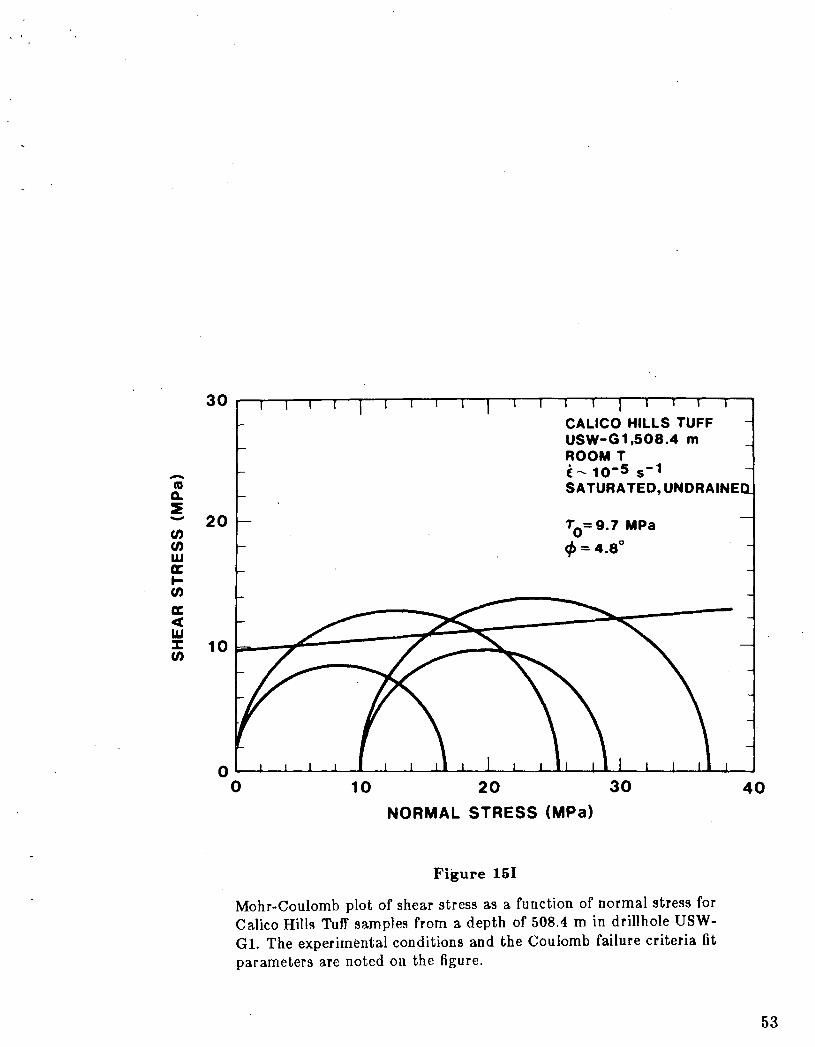
CALICO HILLS TUFF usw-G 1,508.4 m ROOM T t---10-s s-1 SATURATED, UNDRAINE
T0 =9.7 MPa
cfJ = 4.8°
10 20 30
NORMAL STRESS (MPa)
Figure 161
Mohr-Coulomb plot of shear stress as a function of normal stress for Calico Hills Tuff samples from a depth of 508.4 m in drillhole USWGl. The experimental conditions and the Coulomb failure criteria fit parameters arc noted on the figure.
40
53
300
-ftl ~
:E 200 -U) U) w a: ~ U)
a: < w 100 :::1: U)
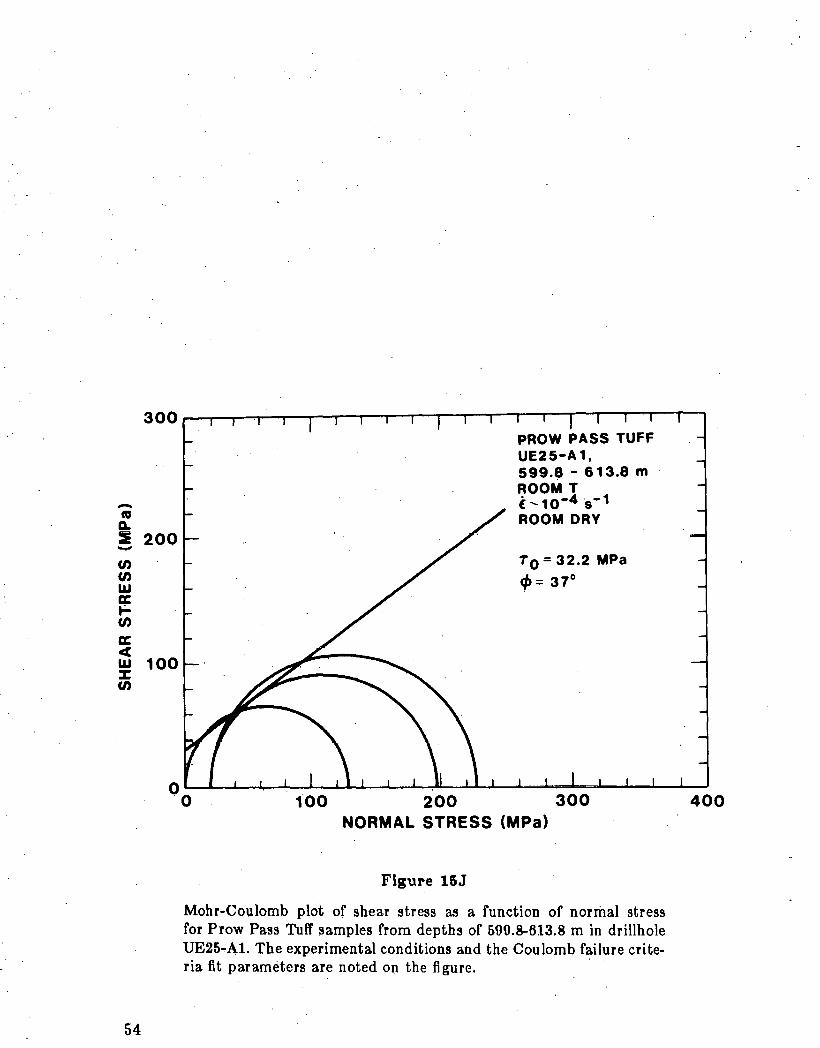
54
PROW PASS TUFF UE25-A1, 599.8- 613.8 m ROOM T t--1o-4 s ... 1 ROOM DRY
To= 32.2 MPa
4> = 37°
too 200 300 NORMAL STRESS (MPa)
Figure 15J
Mohr-Coulomb plot of shear stress as a function of normal stress for Prow Pass Tuff samples from depths of 599.8-613.8 m in drillhole UE25 .. .A.l. The experimental conditions and the Coulomb failure crite-ria fit parameters are noted on the figure. ·
400

150
-ftl CL 100 ~ -(/) (/) w a: 1-(/)
a: 50 c(
w % (/)
BULLFROG TUFF UE25-A 1, 737.9 - 759.2 m ROOM T i ----10-4 s-1 ROOM DRY
T0 =12.1 MPa
cf> = 43°
50 100 150
NORMAL STRESS (MPa)
Figure 16K
Mohr-Coulomb plot of shear stress as a function of normal stress for Bullfrog Tuff samples from depths of 737.9-759.2 m in drillhole UE25-Al. The experimental conditions and the Coulomb failure criteria fit parameters are noted on the figure.
200
55
-ca 100 Q. 21 -en en w a: .... en a: 50 4 w ~ en
56
50 100
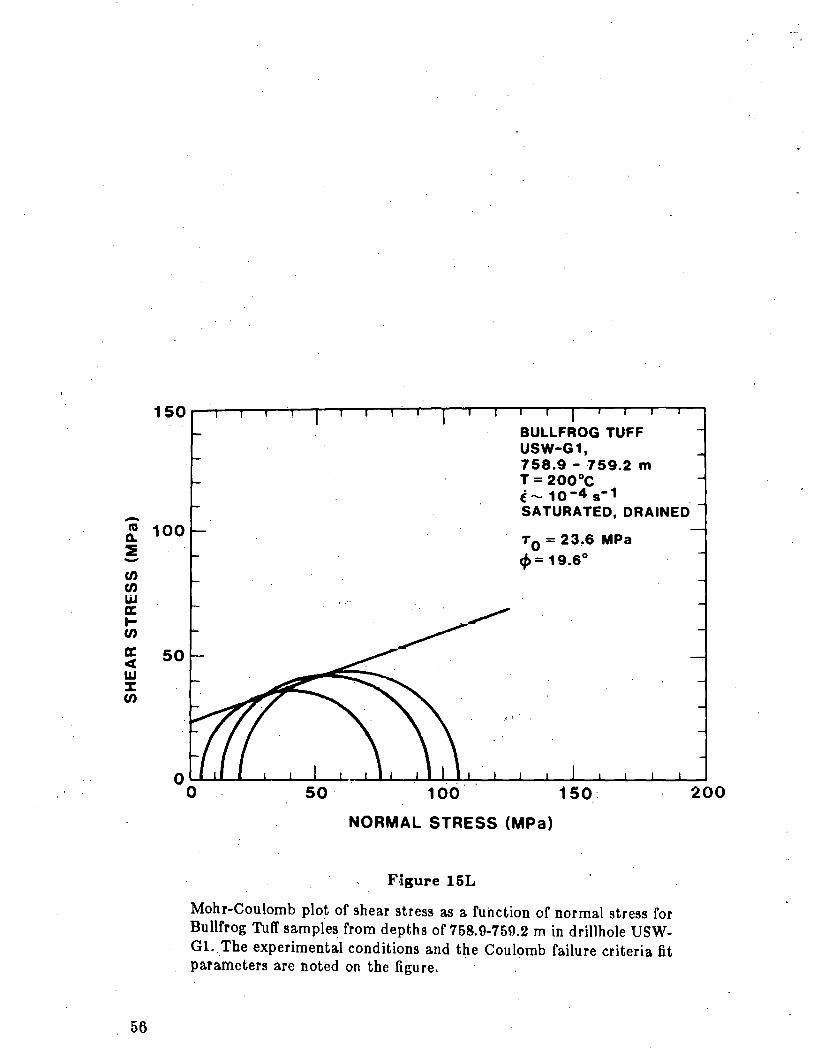
BULLFROG TUFF USW-G1, 758.9 - ·759.2 m T = 200°C i- 10-4 s-1 . SATURATED, DRAINED
TO= 23.6 MPa cl> = 19.6°
150·
NORMAL STRESS (MPa)
Figure 16L
Mohr-Coulomb plot of shear stress as a function of normal stress for Bullfrog Tuff samples from depths of 758.9-759.2 m in drillhole USWGLThe experimental conditions and the Coulomb failure criteria fit parameters are noted on the figure ..
200
150
-ca D. 100 ::E -en en w Ct: ... en ~ c( 50 w % en
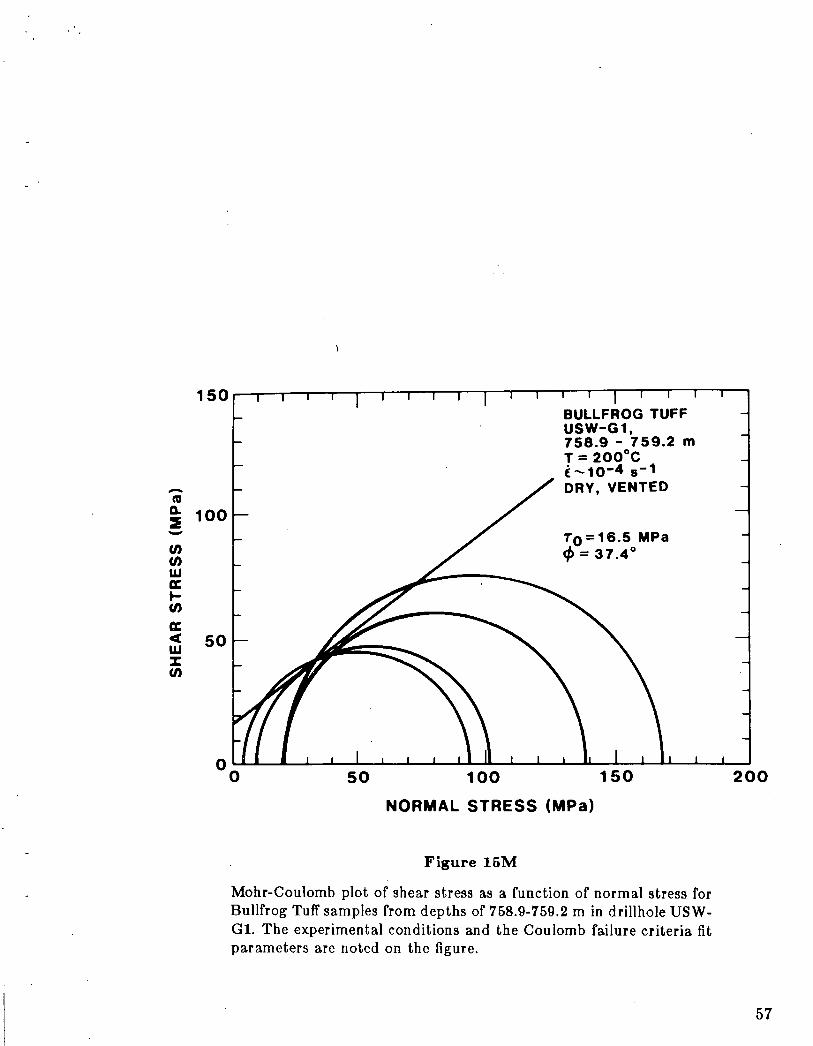
BULLFROG TUFF USW-G1, 758.9 - 759.2 m T = 200°C i-1o-4 s-1 DRY, VENTED
To=16.5 MPa cp = 37.4°
50 100
NORMAL STRESS (MPa)
Figure lGM
Mohr-Coulomb plot of shear stress as a function of normal stress for Bullfrog Tuff samples from depths of 758.9-759.2 m in drillhole USWGl. The experimental conditions and the Coulomb failure criteria fit parameters arc noted on the figure.
200
57

-ca Q. ~ -z 0 -U) w = 0 0
58
• 0
30 0
20 0
0
10
YUCCA MOU~TAIN TUFF
• $A Tl,JRA TE~, PRAIN~D, 23°C, 10-5 s-1
1\ SATURATED, DRAINED, 200°C 1 o-4 s-1 ' .
D SATURATED, UNDRAINED, . 23°C, 10-s s-1
6 o ROOM DRY, 23°C,1o-4 s-1
• DRY, 2oo··c, 1 o-4 s-1
• 0 0
o~~~~~~~~~~~~~~~~-L-~~~~~~~~~
0 10 20 30 40
EFFECTIVE POROSITY (%)
Figure 18
A plot of cohesion as a function of effective porosity for all p'ressureefl'ects test ~eries on Yucca Mountain tuff samples. The experimental conditions for each data point are noted on the figure.
50
. '
-0 -z 0
80
~ 60 0 a: u. ..J c( z a: 40. w ~ z u. 0 w ..J (!) z c(
20
0
•
• SATURATED, DRAINED, 23°C, 10-5 s-1
6 SATURATED, DRAINED, 200°C, 1o-4 s-1
0 SATURATED, UNDRAINED, 23°C, 10-ss-1
0 ROOM DRY, 23°C, 10-4s-1
e DRY, 200°C, 10-4s-1
0
0 • 0
0
YUCCA MOUNTAIN TUFF • n n
0
0 10 20 30 40
EFFECTIVE POROSITY (%)
Figure 17
A plot of angle of internal friction as a function of effective porosity for all pressure-effects test series on Yucca Mountain tuff samples. The experimental conditions for each data point are noted on the figure.
50
59

-n:s ~
~ -:I: t-(.!) z w a: t-C/)
UJ 1-~ ~ 1-...J ::l
60
200
0
0 0 0 150 0
0
100
TOPOPAH SPRING TUFF USW-G1,371.3- 390.0 m ROOM P AND f ·
50 SATURATED
0
0 ~-L~-L~~-L~~-L~~~~-L~~-L~~-L~~-L~~ , 2 3 4 5 6 7
,. log STRAIN RATE (s-1)
Figure.18A
Plot of ultimate strength as a function of negative log strain rate for Topopah Spring Tuff test series. All tests were run on saturated samples under unconfined and room temperature conditions.
8

-nJ 0. 30 :::i: -~ .....
" z w a: 20 ..... (/)
w ..... <(
:::i: ..... 10 ..J ::;)
0 0
..... . . . . ····· .... .... 0
0 ···o ... .... ······ ....
0 .... ....
TRAM TUFF usw-G 1,976.2 m 0
ROOM P AND T SATURATED
.~~~~~~~J_~~~J_~I~I-L~~~_LJ_~~-LJ-~
3 4 5 6 7
J4'igure 18B
Plot of ultimate strength as a function of negative log strain rate for Calico Hills Tuff test series. All tests were run on saturated samples under unconfined and room temperature conditions.
8
61
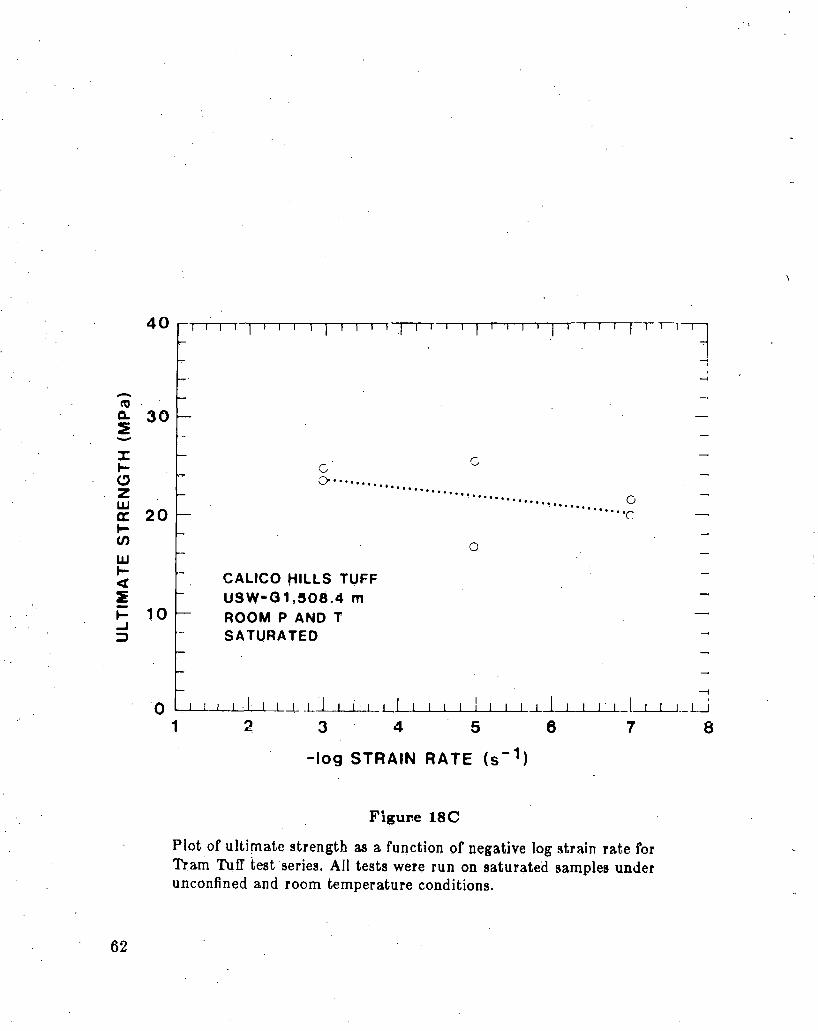
-:I: ..... (!) z w 0: 20 .... (/)
w ..... <! ~ ..... 10 ..J ::>
r v
.::::::-·················
CALICO ~ILLS TUFF usw-o 1 ,sos.4 m ROOM P AND T SATURATED
G
······~······· 0 ...... ~ ....... . ·····c 0
0 L.-L..---L,;.._I..-...J.......:....I.,.--L.__L_ _LL I 1· Ll 4
I I I I _j__,l'----"-___.__,1_. __._
62
1 ~ 3 5 6
-log STRAIN RATE (s -1)
Figure 18C
Plot of ultimate strength as a function of negative log strain rate for Tram Tufl' test series. All tests were run on satur~ted samples under unconfined and room temperature conditions.

YUCCA MOUNTAIN ZONATION AND STRATIGRAPHY
DEPTH (USW-G 1)
FEET METERS 0 0
100
200
1000 300
400
500
2000 600
700
800
3000 900
1000
1100
4000 1200
1300
1400
5000 1500
I
A
B
Ill
A
B IC
A
B
VI _A
8 c I
VIII
A
B
c
II
IV
v
VII
IX
"""TIVA CANYON, YUCCA MT. '~ PAH CANYON MEMBERS
t-~ LL LL ::) ....
TOPOPAH ~ f/)
SPRING ::) a:
MEMBER m .... ~ < ~
TUFFACEOUS BEDS OF
CALICO HILLS
PROW PASS MEMBER LL
LL ::)
BULLFROG .... MEMBER ....
< ..J LL
a: w
TRAM .... <
MEMBER a: (.)
FLOW BRECCIA
LITHIC-RICH TUFF
UNDIVIDED ASH FLOW AND BEDDED TUFF
Figure 19
Yucca Mountain thermal/mechanical zonation correlated with drillhole USW-Gl stratigraphy.
63
Unit Depth (m)
Pc Pp Pe (MPa) (MPa) (MPa)
TC 26.7 (Al) 0 TC 26.7 (A1) 10 TC 26.7 (A1) 20
TC 56.4 (A1) 20.7
TC 64.8 {A1) 0
TS 220.4 (A1) 0
TS 225.4 (A1) 20.7
TS 311.4(Gl) 0
TS 323.3 (G1) 0
TS 334.0(Gl) 0
TS 352.0(G1) 0 TS 352.0{G1) 5
TS 354.6 (GI) 5
TS :359.5(G1) :)
TS :362.4 (G1) 10
TS 371.3 ( G I) 0
TS 372.5 (Gl) 0 TS 372.5 (Gl) 0
TS :373.0 (G I) 0 TS 373.0 (GI) 0
0 0 0
0
0
0
0
0
0
0
0 0
0
0
0
0
0 0
0 0
0 10 20
20.7
0
0
20.7
0
0
0
0 5
5
5
10
0
0 0
0 0
23 23 23
200
23
23
200
23
23
23
23 23
23
23
2.'3
w-4 w-4 10-4
w-" 10'-4
w-4 w-4 10-5
w-s
w-5 w-s
.lo-s
w-s w-:>
w-6 w-2 w-4 w-4 w-6
Appendix
S D (Y,R,N) (Y,N)
R R R
R
R
R
R
y
y
y
y .Y
y
y
y
y
y y
y y
y y y
y
y
y
y
y
y
y
y N
N
y
y
y
y y
y y
( .£1a )u (MPa)
364 396 875
105
7.03
138
133
75.2
142.8
59.8
106.2 72.5
219.3
109.7
119.3
176.6
157.2 133.8
157.2 156.6
(Et~u (%)
.3~
.5G
.34
.37
.59
.7 <:
.6~
.66
.51
.4E
.57
.46
.47
.E
(GPa)
~1.5
~3.9
~8.3
41
40.4
23.9
2.5.5
~.1
24.9
32.5 19.2.
3.5.6
23.2
25.6
4•).8
29.2 2i.7
3"".5 3.5.3
v
.31
.30
.22
.28
.22
.15
.25
.32
.15
.33
.14
.30
.32
.30
.25
.31
.34
.25
.21
"-'D ,.,_. p9 Ref (%) (Mg/m3 l
9 9
9
27
54
13 .
11
10 10 10
10
10
10
10
16
16.
16
16. 16
16
16
16
16
16 16
16 16

Appendix - Continued
Unit Depth Pc Pp Pe T E s D (aa), ( Ei)u E v '"'-'ll ,....._ Pg Ref (m) (MPa: (MPa) (:MPa) (OC) (s-1) (Y,R,N) (Y,N) (MPa) (%) (GPa) (%) (Mg/m3 )
TS 381.0 (A1) 0 0 0 23 10-4 R y 16£ 61.8 .30 9 10 TS 381.0 (A1) 10 0 10 23 10-4 R y 412 73.0 .23 9 10 TS 381.0 (A1) 20 0 20 23 10-4 R y 618 59.9 .21 9 10
TS 384.8 (G1) 0 0 0 23 10-2 y y 149.7 .49 36.6 16
TS 390.0 (G1) 0 0 0 23 10-6 y y 44.9 .41 22.9 .27 16
CH 439.5 (G1) 0 0 0 23 10-5 y y 21.7 .43 6.40 39 2.51 15 CH 439.5 (G1) 0 0 0 23 10-:-5 y y 22.0 .43 5.79 39 2.51 15 CH 439.5 (G1) 0 0 0 23 10-5 y y 24.3 .43 6.03 .09 39 2.51 18 CH 439.5 (Gl) 0 0 0 23 10-5. y y 34.2 .56 8.84 .07 39 2.51 18
CH 453.4 (G1) 0 0 0 23 10-5 y y 22.9 .58 4.87 40 2.50 15 CH 453.4 (G1) 0 0 0 23 10-5 y y 45.3 .62 9.42 .09 40 2.50 18 CH 453.4 (G1) 0 0 0 23 10-5 y· y 23.2 .69 5.45 .09 40 2.50 18 CH 453.4 (G1) 10 0 10 23 10-5 y N 25.4 .45 6.85 .34 40 2.50 15 CH 453.4 (G1) 10 0 10 23 10-5 y N 26.0 .41 7.79 .34 40 2.50 15 CH 453.4 (G1) 10 0 10 23 10-5 y y 29.9 .68 5.57 40 2.50 15 CH 453.4 (G1) 10 0 10 23 10-5 y y 31.4 .66 6.16 .22 40 2.50 15 CH 453.4 (G1) 20 0 20 23 w-5 y N 26.7 .50 7.38 40 2.50 15 CH 453.4 (G1) 20 0 20 23 10-5 y N 36.1 .52 7.93 40 2.50 15 CH 453.4 (Gl) 20 0 20 23. w-5 y y 17.1 .71 3.92 .18 40 2.50 15 CH 453.4 (G1) 20 0 20 23 w-5 y y 34.4 .64 6.24 .17 40 2.50 15
CH 454.1 (A1) 0 0 0 23 w-4 R y 47.7 12.3 .14 28 10
CH 463.3 (G1) 0 0 0 23 w-5 y y 18.9 .76 4.93 39 2.49 15 CH 463.3 (G1) 0 0 0 23 w-5 y y 20.7 .54 5.14 39 2.49 15 CH 463.3 (G1) 0 0 0 23 w-5 y y 22.6 .60 5.61 .10 39 2.49 18 CH 463.3 ( G 1) 0 0 0 23 w-5 y y 29.6 .60 4.41 .17 39 2.49 18
0) <:11

Appendix · Continued
Unit Depth Pc Pp Pe T E s D (Lla),. (ct}u E .'.1 "-'ll "' Pg Ref (m) (MPa) (MPa) (MPaJ (OC) (s-··) (Y,R,N) tY,N) (MPa) (%) (GPa) (%) (Mg/m 3 )
CH 472.6(G1) o. 0 0 23 10-5 y y 35.9 .61 7.03 43 2.48 15 CH 472.6(Gl) 0 0 0 23 Jo-5 y y 30.5 .54 7.45 43 2.48 15 CH 472.6 (G1) 0 0 0 23 10-.5 y y 53.1 .10· .12.8 .07 43 2.48 18 CH 472.6 (G1) 0 0 0 23 10-5 y y 40.6 .64 9.12 .07 43 2.48 18
CH 486.1 (Gl) 0 0 0 23 10-5 y y 14.2 .41 3.51 40 2.38 15 CH 486.1 (G1) 0 0 0 23 w-5 y y 15.3 .42 4.23 .l9 40 2.:38 15 CH 486.1 (G1). 0 0 0 23 10-5 y y 22.3 .43 6.37 .10 40 2.38 18 CH 486.1 (G1) 0 0 0 23 w-5 y y 22.3 .42 6.60 .09 40 2.38 18
CH 489.2 (A1) 20 0 20 23 w-4 R y 26.1 7.99 .22 30 10 CH 492.9 (G1) 0 0 0 23 . 10-5 y y 26.5 . .43 7.86 .26 37 2.41 15 CH 492.9(G1) 0 0 0 23 10-5 y y 19..4 .37 7.17 .25 37 2.41 15 CH 492.9 (G1) 0 0 0 23 10-5 y y 42.7 .48 11.0 .LO 37 2.41 18 CH 492.9(G1) 0 0 0 23 10-5 y y 26.6 .36 9.41 .lO. 37 2.41 "18
CH 498.0(A1) 20.7 0 20.7 23 w-4 R y 67.5 8.50 .27 32 10
CH 506.6{A1) 20 0 20 23 10-4 R y 70.3 9.57 .25. 35 10
CH 507.6(Gl) 0 0 0 23 10.;_:s y y 26.2 .50 6.86 J8 38 2.41 15 CH 507.6(G1). 0 0 0 23 10-5 y y 34.1 .42 9.52 38 2.41 15 CH 507.6(Gl) 0 0 0 23 10-5 y y 23.7 .57 6.39 .l8 38 2.41 18 CH 507.6(Gl) 0 0 0 23 w-s y y 37.6 .47 9.85 .ll4 :38 2.41 18 CH 507.6 (G1) 0 0 0 23 10-5 R y 41.0 .. 58 8.12 .29 38 2.41 15 CH 507.6 (G1) 0 0 0 23 10-5 R y 32.7 .54 6.50 .31 38 2A1 15 CH 507.6 (G1) 10 0 10 23 10-5 y N 35.7 .50 8.90 .31 38 2.41 15 CH 507.6 (G1) 10 0 iO 23 10-5 y N 27.6 .59 8.48 .30 38 2.41 15 CH 507.6 (Gl) 10 0 lO 23 10-5 R N 61.3 1.1 7.20 2'7 • t 38 2.41 15 CH 507.6 (G1) 10 0 10 23 w-s R N 57.6 .99 7.34 .28 38 2.41 15 CH 507.6 (G1) 20 0 20 23 w-s y ~ 34.8 .54 9,3l 38 2.41 15 CH 507.6 (Gl) 20 0 20 2:3 w-s y N 36.2 .49 9.72 .25 38 2.41 15

Appendix - Continued
Unit Depth Pc Pp Pe T i; s D (~a)., ( El}u E v "-'ll ,..,_, Pg Ref (m) (MPa) (MPa) (MPa) (OC) (s-1) (Y,R,N) (Y,N) (MPa) (%) (GPa) (%) (Mg/ID 3 t
CH 508.4 (G1) 0 0 0 23 w-a y y 24.7 .61 5.41 .33 37 2.45 15 CH 508.4 (G1) 0 0 0 23 w-a y y 23.4 .58 5.45 .49 37 2.45 15 CH 508.4(Gl) 0 0 0 23 w-5 y y 25.4 .57 6.15 .36 37 :l.45 15 CH 508.4 (G1) 0 0 0 23 w-5 y y 16.7 .43 4.92 .18 37 2.4.5 15 CH 508.4(G1) 10 0 10 23 10-5 y N 18.9 .49 4.28 37 2.45 15 CH 5()8.4 (G1) 10 0 10 23 10-5 y N 26.8 .57 6.01 .36 37 ~.45 15 CH 5()8.4 (G1) 0 0 0 . 23 10-7 y y 21.5 .55 7.86 .21 37 2.45 15 CH 508.4(Gl) 0 0 0 23 10-7 y y 19.9 .51 7.03 .22 37 2.45 15
CH 515.7 (AI) 0 0 0 23 10-4 R y 40.8 14.0 .20 37 10
CH 524.2 (G1) 0 0 0 23' w-5 y y 20.1 .43 5.83 .29 37 2.46 15 CH 524.2 (G1) 0 0 0 23 w-5 y y 27.4 .41 7.93 .30 37 2.46 15 CH 524.2(G1) 0 0 0 23 w-5 y y 23.7 .50 6.81 .21 37 2.46 18 CH 524.2 (G1) 0 0 0 23 w-5 Y. y 34.6 .51 9.52 .10 37 2.46 18
CH 530.9 (Gl) 0 0 0 23 w-5 y y 39.1 .87 8.41 .27 36 2.61 15 CH 530.9(Gl) 0 0 0 23 w-5 y y 42.0 .71 8.14 .32 36 2.61 15 CH 530.9 (G1) 0 0 0 23 w-5 y y 55.5 .63 12.4 .14 36 2.Gl 18 CH 530.9 (G1) 0 0 0 23 w-5 y y 70.7 .71 12.7 .15 36 2.61 18
CH 544.0(G1) 0 0 0 23 w~5 y y 15.4 .79 2 . .55 .34 29 2.65 15 CH 544.0 (Gl) 0 0 0 23 w-5 y y 14.8 .75 2.52 .37 29 2.65 15 CH 544.0 (G1) 0 0 0 23 w-5 y y 20.8 .73 4.05 .21 29 2.65 18 CH 544.0 (G1) 0 0 0 23 w-5 y y 21.6 .64 4.61 .20 29 2 .6;; 18
pp 593.7 (A1) 100 0 100 23 w-4 R y 299 22.0 .20 19 10
pp 599.8 (A1) 20 0 20 23 w-4 R y 176 27.0 .20 18 10
~ ~

Unit Depth (m)
Pc Pp Pe (MPa) (MPa) (MPa)
PP . 604.9 {G1) 0 PP 604.9 ( G J) 0 PP 604.9 {Gl) 0 PP 604.9{Gl) 0
PP 604.9 {Al) 20.7
PP 613.8 (A1) 0
PP 621.5 (A1) 0
Bu 661.4 {GJ) 0 Bu 66L4{GI) 0. Bu 661.4 {Gl) 0
Bu 680.3(Gl) 0 Bu 680.3(GI) 0
Bu 689.1 {GI) 0
Bu 693.7(GJ) 0 Bu. 693.7(GI)_ 0 Bu 693.7{GI) 0 Bu 693.7(Gl) 0
Bu 704.7 {G1) 0 Bu 704.7 (G1) 0 Bu 704.7(Gl) 0
Bu 721.4 (Gl) 0 Bu 721.4 (Gl) 0
Bu 731.8(AI) 50
0 0 0 0
0
0
0
0. 0 0
0 0
0
0 0 0 0
0 0 0.
0 0
0
0 0 0 o·
20.7
0
0
0 ·o 0
0 0
0
0 0 0 0
0 0 0
0 .0
50
23 23 23 23
23
23
.23
23 23 23
23 23
23
23 23 23 23
23 23 23
23 23
Appendix - Continued
S D (~,R,N) (Y,N)
w-s w-s w-s 10-5
10--l
10--l
10-4
y y y y
R
R
R
w-s Y w-s. Y w-s Y
10-.) ·y lo-s .Y
w-s Y
10-.) y w-5 Y w-5 Y w-5 Y
w-5 Y 10-5 y 10-5 y
10-5 y 10-5 y
10-4 R
y y y y
y
y
y
y y y
y y
y
y y y y
y· y y
y y
y
(aa)u (MPa)
14.7 13.5 11.7 13.6
207
130
32.2
47.1 47.5 42.3
19.3 17.9
23.7
26.7 19.1 30.4 29.9
41.6 ~~2.7
24.1
29.2. 29.2
174
.36
.30
.35
.40
.45
.52
.4)
.23
.54
.5-3
.45
.34 -~ .34
.5D
.50
4.91 5.25 3.14 3.21
31.0
47.9
7.84
11.5 8.58 8.67
5.34 2.76
6.24
10.3-2.72 3.73-.5.7().
15.8: 9.56 8.17
8.38 8.38:
JiG
v
.43
.39
.09
.05
.25
.30
.18
.11
.11
.11
.12
.08
.06
.12
.03
.04
.07
.11
.09
.18
.14
.14
.19
"'n "" p9 Ref (%) (Mg/m3 )
32 32 32 32
15
17
31
2.54 2.54 2.54 2.54.
28 2.48 28 2.48 28 . 2.48
39 2.44 39 2.44
36 2.41
34 2.40 34 2.40 34 2.40 34 2.40
36 2.87 36 2.:37 36 2.37
27 2.61 27 2.61
22
18 18
10
10
10
13 18 18
13 18
18
13 .18 18 18
13 18 18
13 18
10
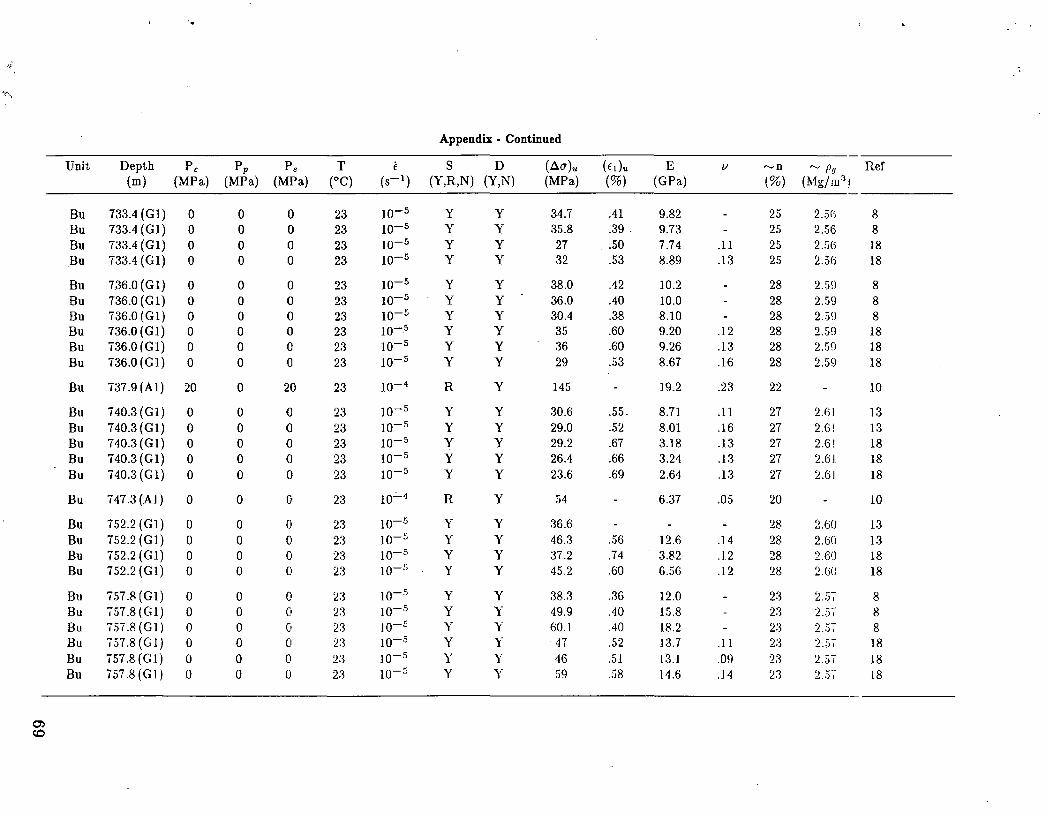
Unit Depth (m)
Pc Pp P, (MPa) (MPa) (MPa)
Bu 733.4(G1) 0 Bu 733.4 (G1) 0 Bu 733.4 (G1) 0 .Bu 733.4 (G1) 0
Bu 736.0(G1) 0 Bu 736.0 (G1) 0 Bu 736.0 (G1) 0 Bu 736.0 (G1) 0 Bu 736.0 (G1) 0 Bu 736.0(G1) 0
Bu 737.9(Al) 20
Bu 740.3 (G1) 0 Bu 740.3 (G1) 0 Bu 740.3(G1) 0 Bu 740.3 (G1) 0 Bu 740.3 (G1) 0
Bu 747.3 (Al) 0
Bu 752.2 (G1) 0 Bu 752.2(G1) 0 Bu 752.2 (Gl) 0 Bu 752.2 (G1) 0
Bu 757.8 (G1) 0 Bu 757.8 (Gl) 0 Bu 757.8(G1) 0 Bu 757.8 (Gl) 0 Bu 757.8 (Gl) 0 Bu 757.8(G1) 0
0 0 0 0
0 0 0 0 0 0
0
0 0 0 0 0
0
0 0 0 0
0 0 0 0 0 0
0 0 0 0
0 0 0 0 0 0
20
()
0 ()
()
0
()
0 0 0 0
0 0 (t
0 0 0
23 23 23 23
23 23 23 23 23 23
23
23 23 23 23 23
23
23 23 23 23
23 2:3 23 23 2:3 23
w-5 w-5 w-5 w-5
w-5 w-5 w-5 w-.-5 w-5 w-5
w-4 w-5 w-5 w-5 w-5 w-5 10.:.._4
w-5 w-5 w-s w-r. w-s Jo--5 Io-5 w-.s w-5 w-~
Appendix - Continued
S D (Y,R,N) (Y,N)
y y y y
y y y y y y
R
y y y y y
R
y y y y
y y y y )'
y
y y y y
y y y y y y
y
y y y y y
y
y y y y
y y )'
y y y
(~a)u (MPa)
34.7 35.8 27 32
38.0 36.0 30.4 35 36 29
145
30.6 29.0 29.2 26.4 23.6
54
36.6 46.3 37.2 45.2
38.3 49.9 60.1 47 46 59
(Ei)u (%)
.41
.39. .. 50
.53
.42
.40
.38
.60
.60
.53
.55.
.52
.67
.66
.69
.56
.74
.60
.36
.40
.40
.52
.51
.58
E (GPa)
9.82 9.73 7.74 8.89
10.2 10.0 8.10 9.20 9.26 8.67
19.2
8.71 8.01 3.18 3.24 2.64
6.37
] 2.6 3.82 6.56
12.0 15.8 18.2 1:3.7 13.1 11.6
v
.11
.13
.12
.13
.16
.23
.11
.16
.13
.13
.13
.05
.I 4
.12
.12
.11
.09
.14
"-'ll "' p11 Ref (%) (Mg/m 3 1
25 25 25 25
28 28 28 28 28 28
22
27 27 27 27 27
20
28 28 28 28
2.5G 2.56 2.56 2.5()
2.5!1 2.59 2.5q 2.59 2.5fl 2.59
2.(-jj
2.6l. 2.6! 2.61 2.61
2.60 2.60 2.6fJ 2.GO
2.5-;-2.5~·
2.;:;-:-2.57 2-f,{
2.5~·
8 8 18 18
8 8 8 18 18 18
10
13 13 18 18 18
10
13 13 18 18
8 8 8 18 18 18
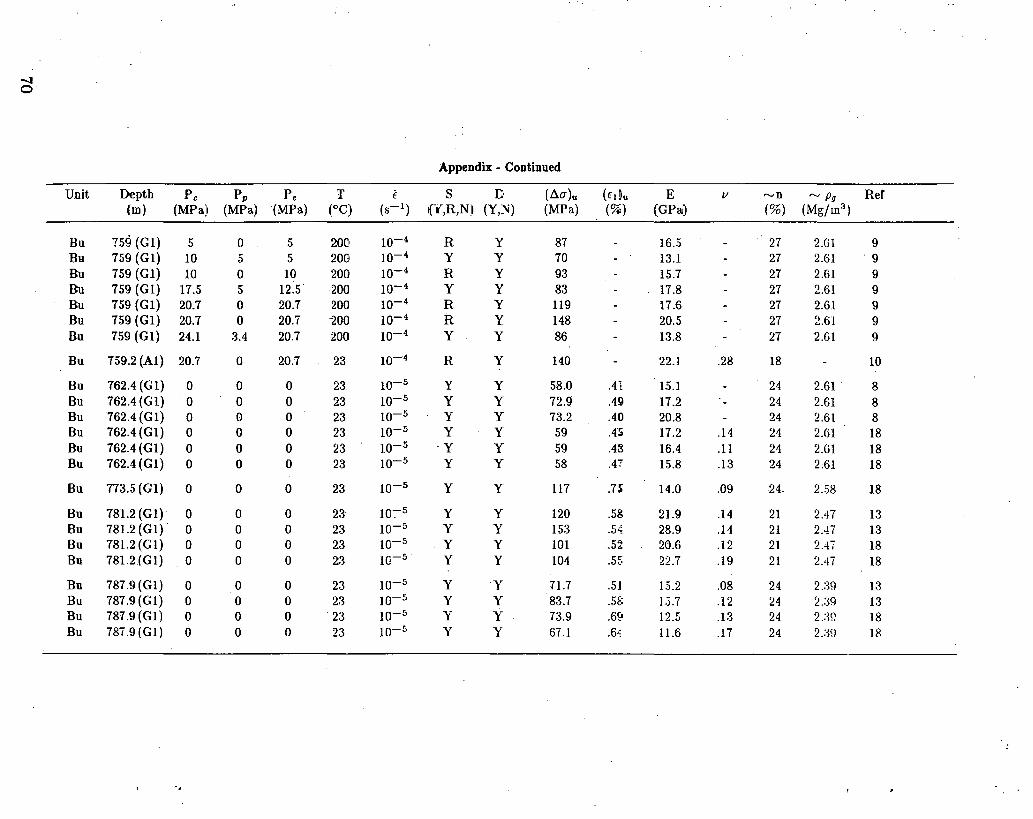
Appendix - Continued
Unit Depth Pc Pp Pe T f s D (.:la)u (Et ~u E v ......,n ......, Pg Ref (m) (MPa) (MPa) (MPa) t:oC) (s-1) fr,R,N:I (Y,~) (MPa) (%) (GPa) (%) (Mg/m3 )
Bu 759 (G1) 5 0 5 200 w-4 R y 87 16.5 27 2.61 9 Bu 759 (G1) 10 5 5 200 w-4 y y 70 13.1 27 2.61 .9
Bu 759 (G1) 10 0 10 200 w-4 R y 93 15.7 27 2.61 9 Bu 759 (G1) 17.5 5 12.5 200 w-4 y y 83 17.8 27 2.61 9 Bu 759 (G1) 20.7 0 20.7 200 w-4 R y 119 17.6 27 2.61 9 Bu 759 (Gl) 20.7 0 20.7 -200 w-4 R y 148 20.5 27 2.61 9 Bu 759 (G1) 24.1 3:4 20.7 200 w-4 y y 86 13.8 27 2.61 9
Bu 759_2 (A1) 20.7 0 20.7 23 w-4 R y 140 22.1 .28 18 10
Bu 762.4 (G1) 0 0 0 23. w-5 y y 58.0 .41 15.1 24 2.61. 8 Bu 762.4 (Gl) 0 0 0 23 w-5 y y 72.9 .49 17.2 24 2.61 8 Bu 762.4 (G1) 0 0 0 23 w-5 y y 73.2 .40 20.8 24 2.61 8 Bu 762.4 (G1) 0 0 0 23 w-5 y y 59 .4S 17.2 .14 24 2.61 18 Bu 762.4 (G1) 0 0 0 23 w-5 y y 59 .4g 16.4 .11 24 2.61 18 Bu 762.4 (G1) 0 0 0 23 w-5 y y 58 .4'7 15.8 .13 24 2:61 18
Bu 773.5 (Gl) 0 0 0 23 w-5 y y 117 .75 14.0 .09 24. 2.58 18
Bu 781.2 (G1) 0 0 0 23 w:-5 y y 120 .58 21.9 .14 21 2.47 13 Bu 781.2 (G1). 0 0 0 23 w-5 y y 153 .54 28.9 .14 21 2...!7 13 Bu 781.2 (G1) · 0 0 0 23 w-5 .Y y 101 .. 52 20.6 .12 21 2.47 18 Bu 781.2(GI) 0 0 0 23 w-5· y y 104 .55 22.7 .19 21 2.47 18
Bu 787.9(G1) 0 0 0 23 w-5 y y 71.7 .51 1.'>.2 .08 24 2.:39 13 Bu 787.9 (Gl) 0 0 0 23 w-5 y y 83.7 .5~: 1.).7 .12 24 2.:39 13 Bu 787.9 (Gl) 0 0 0 . 23 w-5 y y 73.9 .6~ 12.5 .13 24 2.:3\) 18 Bu 787.9 (G I) 0 0 0 23 w-5 y y 67.1 .6~ 11.6 .17 24 2.:m 18

Appendix - Continued
Unit Depth Pc Pp Pe T E s D ( t1a )u ( E t)u E v "-'ll ......, Py Ref (m) (MPa) (MPa) (MPa) (OC) (s-t) (Y,R,N) (Y,N) (MPa) (%) (GPa) (%) (Mg/m 3 1
Bu 794.9 (G1) 0 0 0 23 w-5 y y 71.9 .45 18.4 .14 24 2.47 13 Bu 794.9 (Gl) 0 0 0 23 w-5 y y 73.5 .47 19.4 .13 24 2.47 13 Bu 794.9 (G1) 0 0 0 23 w-5 y y 60.4 .51 11.7 .10 24 2.47 18 Bu 794.9 (G1) 0 0 0 23 w-5 y y 72.7 .49 17.2 .16 24 2.47 18
Bu 804.9 (G1) 0 0 0 23 w-5 y y 50.2 .57 10.4 .14 28 2.49 13 Bu 804.9 (G 1) 0 0 0 23 w-5 y y 45.2 .63 6.99 .12 28 2.49 18 Bu 804.9 (G1) 0 0 0 23 10,..-5 y y 47.0 .69 6.66 .11 28 2.49 18
Tr 822.7 (G1) 0 0 0 23 w-5 y y 60.1 .46 14.5 .16 33 2.!i:2 14 Tr 822.7 (Gl) 0 0 0 23 w-5 y y 53.6 .51 13.3 .18 33 2.5:l 14 Tr 822.7 (G1) 0 0 0 23 w-5 y y 45.3 .50 9.47 .11 33 2.52 18 Tr 822.7 (G1) 0 0 0 23 w-5 y y 63.9 .58 10.9. .11 33 2.:)2 1a
Tr 856.5 (G1) 0 0 0 23 w-5 y y 42.0 .36 15.2 .38 23 2.li l 14 Tr 856.5 (G1) 0 0 0 23 w-5 y y 46.0 .43 14.2 .31 23 2.(} I 14 Tr 856.5 (G1) 0 0 0 23 to-5 y y 76.2 .39 14.9 .17 23 2.(H 18 Tr 856.5 (Gl) 0 0 0 23 w-5 y y 66.4 .42 14.2 .21 23 2.(:i.l 18
Tr 883.0 (G1) 0 0 0 23 10-5 y y 68.1 .43 21.3 .27 21 2.(j~ 14 Tr 883.0 (G1) 0 0 0 23 w-5 y y 69.2 .45 19.9 .24 21 2.0:2 14 Tr 883.0 (Gl) 0 0 0 23 w-5 y y 95.8 .50 18.3 .27 21 2.G:2 18 Tr 883.0 (G1) 0 0 0 23 10-5 y y 115 .55 20.0 .22 21 2.u2 18
Tr 913.4 (G1) 0 0 0 23 w-5 y y 67.6 .36 22.5 .23 21 Vi~l 14 Tr 913.4 (G1) 0 0 0 23 w-5 y y 40.9 .29 18.9 2.1 2_;j~J 14 Tr 913.4 (G1) 0 0 0 23 Io-s y y 84.2 .63 10.1 .07 21 2 .;)!) 18 Tr 913.4 (Gl) 0 0 0 2:3 w-5 y y 90.7 .:39 21.8 .24 21 Vi9 18
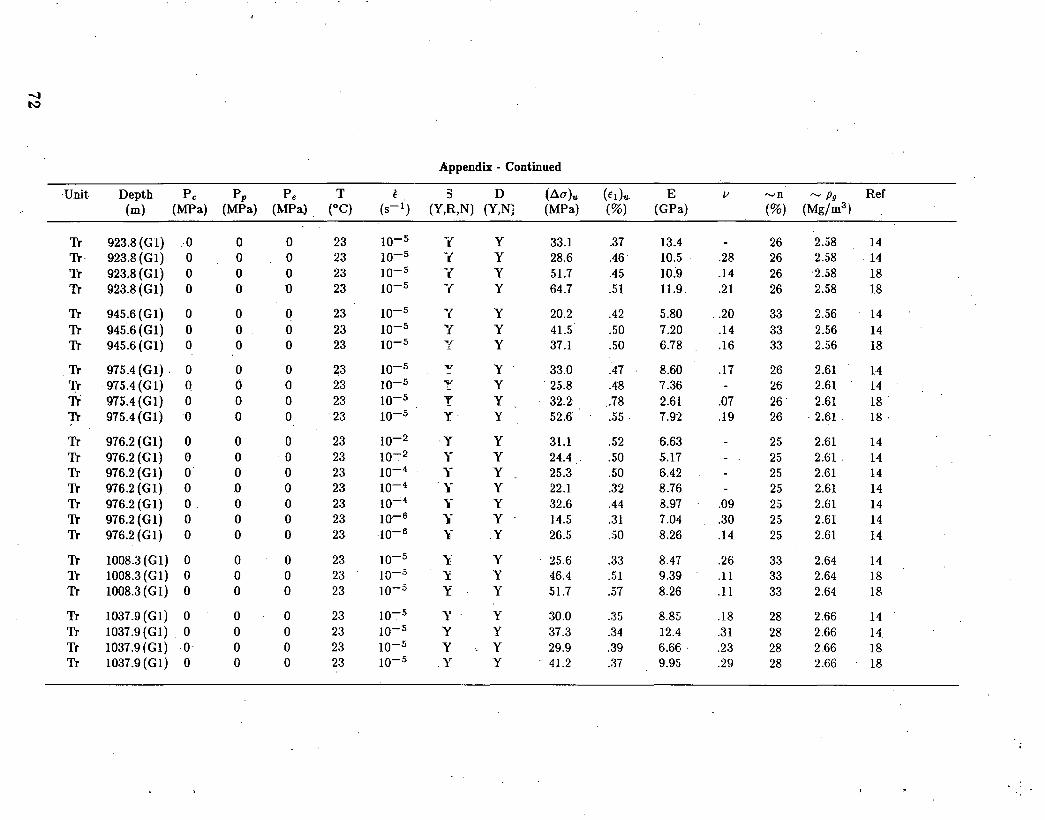
Appendix - Continued
·Unit Depth Pc Pp Pe T f 3 D (~a)u (<l)u. E v "-'ll '"'"'Pg Ref (m) (MPa) (MPa) (MPa) (oC) (s-1) (Y,R,N) (Y,NJ (MPa) (%) (GPa) (%) (Mg/m3)
Tr 923.8 (G1) ·0 0 0 23 w-5 y y 33.1 .37 13.4 26 2.58 14 Tr 923.8(G1) 0 0 0 23 w-5 -{ y 28.6 .46 10.5 .28 26 2.58 14 Tr 923.8 (G1) 0 0 0 23 w-5 y y 51.7 .45 w:9 .14 26 2.58 18 Tr 923.8 (G1) 0 0 0 23 w-5 y y 64.7 .51 11.9. .21 26 2.58 18
Tr 945.6 (G1) 0 0 0 23 w-5 y y 20.2 .42 5.80 .. 20 33 2.56 14 Tr 945.6 (G1) 0 0 0 23 w-5 y y 41.5 .50 7.20 .14 33 2.56 14 Tr 945.6 (Gl) 0 0 0 23 10-5 y y 37.1 .50 6.78 .16 33 2.56 18
Tr 975.4 (G1) . 0 0 0 23 w-5 ,. y 33.0 .47 8:60 .17 26 2.61 14 Tr 975.4 (G1) 0 0 0 23 w-5 ....,. y . 25.8 .48 7.36 26 2.61 14 -Tr 975.4 (G1) 0 0 0 23 w-5 y y 32.2 .. 78 2.61 .07 26 2.61 18.
Tr 975.4 (G1) 0 0 0 23 w-5 Y. y 52.6 . 55 7.92 .19 26 . 2.61 . 18.
Tr 976.2 (G1) 0 0 0 23 w-2 ·Y y 31.1 .52 6.63 25 2.61 14 Tr 976.2 (G1) 0 0 {) 23 w-2 y y 24.4 . .50 5.17 25 2.61 . 14 Tr 976.2 (Gl) 0 0 0 23 w-4 y y 25.3 .50 6.42 25 2.61 14 Tr 976.2 (G1) 0 0 0 23 w-4 y y 22.1 .32 8.76 25 2.61 14 Tr 976.2 (G1) 0 0 0 23 w-4 y y .32.6 .44 8.97 .09 25 2.61 14 Tr 976.2 (Gl) 0 0 0 23 w~a )j y 14.5 .31 7.04 .30 25 2.61 14 Tr 976.2 (G1) 0 0 0 23 10-6 )j .Y 26.5 .:)0 8.26 .14 25 2.61 14
Tr 1008.3(Gl) 0 0 0 23 10-5 y y . 25.6 .33 8.47 .26 33 2.64 14 Tr 1008.3 (G1) 0 0 0 23 lo-s y y 46.4 .51 9.39 .11 33 2.64 18 Tr 1008.3(G1) 0 0 0 23 w-s y y 51.7 .57 8.26 .11 33 2.64 18
Tr 1037.9(G1) 0 0 0 23 10-:-5 y y 30.0 .35 8.85 .18 28 2.66 14 Tr 1037.9 (G1) 0 0 0 23 w-5 y y 37.3 .34 12.4 .31 28 2.66 14. Tr 1037.9 (G1) 0· 0 0 23 w-s y y 29.9 .39 6.66. .23 28 2.66 18 Tr 1037.9 (Gl) 0 0 0 23 w-s .Y y 41.2 .37 9.95 .29 28 2.66 18

Appendix - Continued
Unit Depth Pc Pr Pe T f s D (~a) .. (Et)u E !I "-'ll "" Py Ref (m) (MPa) (MPa) (MPa) {oC) (c') (Y,R,N) (Y,N) (MPa) (%) (GPa) (%) (Mg/m3 )
Tr 1066.3.(G1) 0 0 0 23 10-5 y y 17.8 .34 5.56 .31 42 2.69 14 Tr 1066.3 (G1) 0 0 0 23 10-5 y y 17.4 .31. 5.47 42 2.69 14 Tr 1066.3 (G1) 0 0 0 23 10-5 y y 27.6 .41 6.30 .17 42 2.69 18 Tr 1066.3 (G1) 0 0 0 23 10-5 y y 26.1 .46 4.90 .15 42 2.69 18
74
Distribution:
J. W. Bennett, Director Geologic Repository Division U. S. Department of Energy S-10 Washington, D. C. 20545
M. W. Frei Geologic Repository Division U. S. Department of Energy S-10 Washington, D. C. 20545 ·
C. R. Cooley Geologic Repository Oivi$ion U. S. Department of Energy S-10 Washington, D. C. 20545
C. H. George Geologic Repository Division U.S. Department of Energy fi·10 Washington, D. C, 20545
J. J. Fiore Geologic Repository Division U.S. Department of Energy S-10 . . Washington, D. C, 20545
J. G. Vlahakis Geologic Repository Division U. S. Department of Energy. S-10 . Washington, D. C. 20545
T. P. Longo Geologic Repository Division U. S. Department of Energy S-10 Washington, D. C. 20545
C. Klingsberg Geologic Repository Division U. S. Department of Energy S-10 Washington, D. C. 20545
NTS Project Manager High-Level Waste Technical Development Branch Division of Waste Management U. S. Nuclear Regulatory Commission Washington, DC 20555
Chief, High-Level Waste Technical Development Branch Division of Waste Management U. S. Nuclear Regulatory Commission Washington, DC 20555
J. 0. Neff, Program Manager National Waste Terminal Storage Program Office U. S. Department of Energy 505 King Avenue Columbus, OH 43201
N. E. Carter Battelle Office of Nuclear Waste .Isolation 505 King Avenue Columbus, OH 43201
75
76
ONWI Library (5) Battelle Office of Nucle~r Waste Isolation 505 King Avenue Columbus, OH 43201
0. L. Olson, Project Manager Basalt Waste Isolation Project Office U. S. Department of Energy . Richland Operations Office P. 0. Box 550 Richland, WA 99352
R. Deju . Rockwell International Atomics Rockwell Hanford Operations Richland, WA 99352
G. Tomsic · Utah Department of Community Economic. Development. Room 6290. State Office Building · · Salt Lake City, UT 89114
Governor's Office Planning Coordinator Nevada State Planning Coordination State Capitol Cop1plex, Second Floor Carson City, NV 89710
. P. J. Iverson Department of Minerals State of Nevada. 400 West King Street Carson City, NV 89710
R. R. Loux, Jr. c/o Department of Minerals State of Nevada 400 West King Street Carson City, NV 89710
K. Street, Jr. Lawrence Livermore National Laboratory Mail Stop L-209 P. 0. Box 808 Livermore, CA 94550
L. D. Ramspott Technical Project Officer Lawrence Livermore National Laboratory: P. 0. Box 808 Mail Stop L-204 Livermore, CA 94550
D. C. Hoffman Los Alamos National Laboratory P. 0. Box 1663 Mail Stop &515 Los Alamos, NM 87545
D. T. Oakley Technical Project Officer Los Alamos National Laboratory P. 0. Box 1663 Mail Stop F-671 Los Alamos, NM 87545
A R. Hakl, Site Manager Westinghouse - AESD P. 0. Box 708 Mail Stop 703 Mercury, NV 89023
P. L. Aamodt Los Alamos National Laboratory P. 0. Box 14100 Las Vegas, NV 89114
77

78
D. L. Vieth, Director (6) Waste Management Project Office P. 0. Box 14100 Las Vegas, NV 89114
D. F. Miller, Director Office or Public Affairs . U.S. Department or Energy P. 0. Box 14100 Las Vegas, NV 89114
·D. A. Nowack (11) U. S. Department or Energr ·p. o. Box 14100 Las Vegas, NV 89114
B. W. Church, Director Health Physics Division U.S. Department· or Energy P. 0. Box 14100 Las Vegas, NV 89114 .
A. E. Gurrola Holmes & Narver, Inc. P. 0. Box 14340 Las Vegas, NV 89114
W. W. Dudley, Jr. Technical Proj~ct Officer U. S. Geological Sqrvey P. 0. Box 25046 Mail Stop 418 Federal Center Denver, CO 80225
M. E. Spaeth (3} Science Applications, Inc. 2769 South Highland Drive Las Vegas, NV 89109

..
•
•
W. S. Twenhofel 820 Estes Street Lakewood, CO 80215
H. D. Cunningham Reynolds Electrical & Engineering Company, Inc. P. 0. Box 14400 Mail Stop 555 Las Vegas, NV 89114
J. A. Cross Fenix & Scisson, Inc. P. 0. Box 15408 Las Vegas, NV 89114
R. H. Marks U. S. Department of Energy CP-1, MS 210 P. 0. Box 14100 Las Vegas, NV 89114
Center Cor Tectonophysics Texas A&M University College Station, TX 77843
RE/SPEC, Inc. (2) P. 0. Box 725 Rapid City, SD 57701 . Attn:
P. F. Gnirk D. K. Parrish
79
1500 W. Herrmann 1510 D. B. Hayes 1520 T. B. Lane 1521 . R. D. Krieg .. 1521 R. K. Thomas 1530 L. W. Davison 1534 J. R. ~ay 1540 W. C. Luth 1541 H. C. Hardee 1542 B. M. Butcher 1542 L. S. Costin 1542 D. J. Holcomb 1542 W. A.· Olsson 1542 R. H. Price (25) 1542 L. W. Teufel 1542 W. R. Wawersik 1542 D. H. Zeuch 1fi4~ T. M. Gerlach 3141 L. J. Erickson (5) 3151 W. L. Garner (3) 3154-3 C. Dalin (25) 7417 F. L. McFarling 8214 M.A. Pound 6310 6311 L. W. Scully 6312 L. D. Tyler 6312 J. K. Johnstone · 0312 B. .3. Lau~k.upf 6312 R. R. Pet.ers 6313 J. R. Tillerson (15) 6313 F. B. Nimick 6313 B. M. Schwartz 6313 R. M. Zimmerman 6314 6314 J. L. Jackson 6314 A. E. Stephenson 6331 A. R. Lappin
..
80

Org. Bldg. Name Rec'd by Org . Bldg. Name Rec 'd by
(tit) Sandia National Laboratories


![DM0I], ;LPV[RPALP8LPv _ ¼ XL8D[8, JS" V[g0 J[](https://static.fdocuments.in/doc/165x107/56813f63550346895daa34f7/dm0i-lpvrpalp8lpv-xl8d8-js-vg0-j-568f930ed973b.jpg)


![GJ N J#GS#=8 NS JS ];G J7 J=#8 WN JN - CPHP](https://static.fdocuments.in/doc/165x107/61841c6766cfa960ce6640d3/gj-n-jgs8-ns-js-g-j7-j8-wn-jn-cphp.jpg)