
79F64d01
22
Rio Tinto Alcan Financial community site visit 20 September 2009
-
Upload
mythos1976 -
Category
Documents
-
view
218 -
download
0
Transcript of 79F64d01

7/28/2019 79F64d01
http://slidepdf.com/reader/full/79f64d01 1/22
Rio Tinto AlcanFinancial community site visit
20 September 2009

7/28/2019 79F64d01
http://slidepdf.com/reader/full/79f64d01 2/22
20 September 2009 2009 North America Financial Community Site Tour 2
Phillip Strachan
Chief Financial Officer, Rio Tinto Alcan

7/28/2019 79F64d01
http://slidepdf.com/reader/full/79f64d01 3/22
7/28/2019 79F64d01
http://slidepdf.com/reader/full/79f64d01 4/22
20 September 2009 2009 North America Financial Community Site Tour 4
Cost init iatives
Modelling the business
Synergies and integration

7/28/2019 79F64d01
http://slidepdf.com/reader/full/79f64d01 5/22
20 September 2009 2009 North America Financial Community Site Tour 5
• Benefits tracking ahead of target, primarily due to procurement savings
• Continue to remain on track to deliver US$1.1 billion in 2010
• Total synergy program one-off capital and operating integration costs have been
significantly reduced at US$130 million and US$191 million compared to targets of US$541 million and US$245 million respectively
• Third-party audit recently completed covered 56% of in-period EBITDA and confirmeda robust process with no material adjustments
H1 2009 in-period net earnings from synergies of
US$483 million exceeded target by 28%
*Synergy Net Earnings include in-period one-time operational expenditures (like severance & relocation costs)
Target
Actual
170
251 252
334
378
483
418
500
600
H1 2008 H2 2008 H1 2009 H2 2009 H1 2010 H2 2010
$1.1 bil lion in 2010
7/28/2019 79F64d01
http://slidepdf.com/reader/full/79f64d01 6/22
20 September 2009 2009 North America Financial Community Site Tour 6
0
100
200
300
400
500
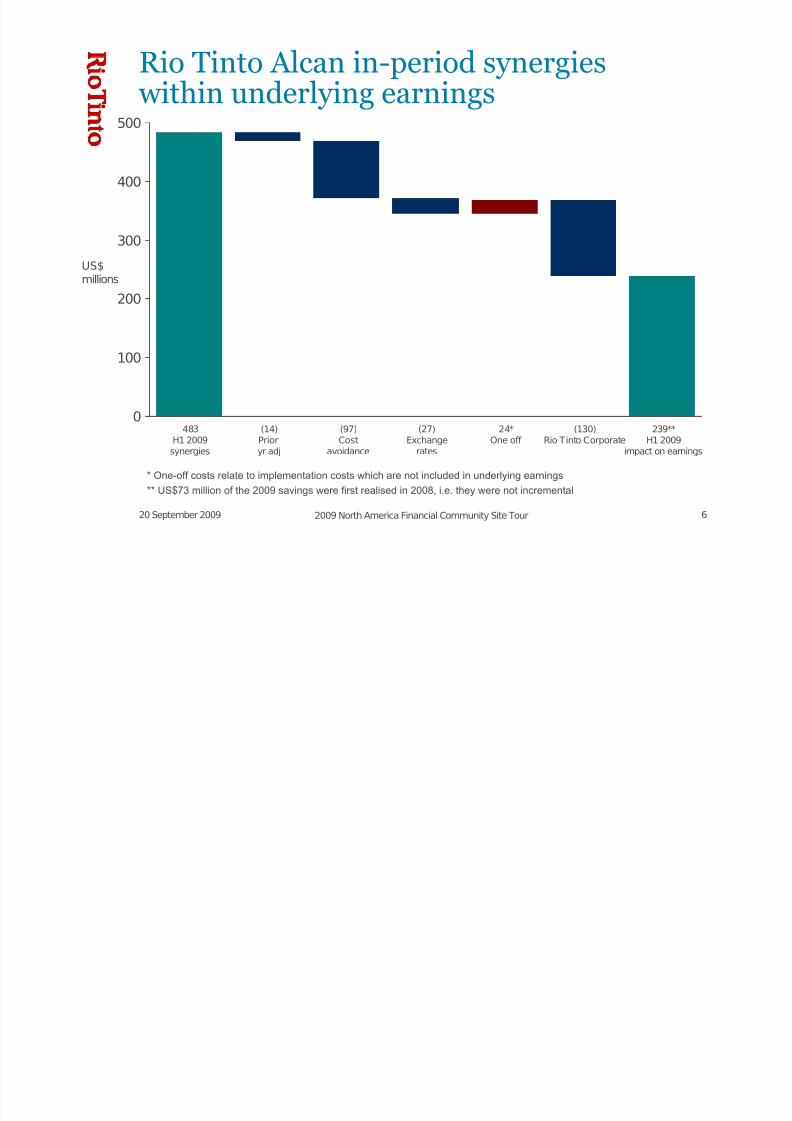
483
H1 2009
synergies
(14)
Prior
yr adj
(97)
Cost
avoidance
(27)
Exchange
rates
24*
One off
(130)
Rio Tinto Corporate
239**
H1 2009
impact on earnings
US$millions
Rio Tinto Alcan in-period synergies
within underlying earnings
* One-off costs relate to implementation costs which are not included in underlying earnings
** US$73 million of the 2009 savings were first realised in 2008, i.e. they were not incremental
7/28/2019 79F64d01
http://slidepdf.com/reader/full/79f64d01 7/22
20 September 2009 2009 North America Financial Community Site Tour 7
0 %
5%
10%
15%
2 0 %
2 5%
2008A
H1
2008A
H2
2009A
Q1
2009A
Q2
2009F
Q3
2009F
Q4
GoveWeipa
Gladstone
Mono- Bauxite
Export Bauxite
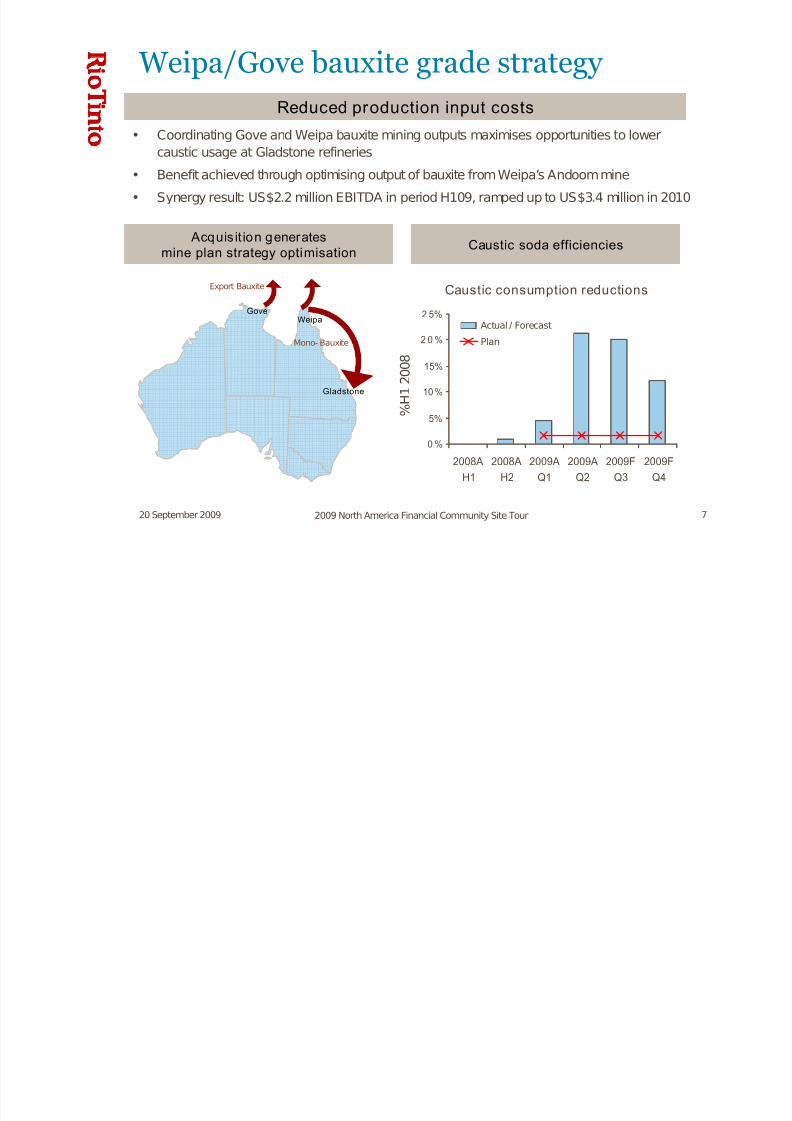
Weipa/Gove bauxite grade strategy
• Coordinating Gove and Weipa bauxite mining outputs maximises opportunities to lower
caustic usage at Gladstone refineries
• Benefit achieved through optimising output of bauxite from Weipa’s Andoommine
• Synergy result: US$2.2 million EBITDA in period H109, ramped up to US$3.4 million in 2010
Reduced production input costs
Acquisit ion generatesmine plan strategy optimisation
Caustic soda efficiencies
Caustic consumption reductions
% H 1
2 0 0 8
Actual / Forecast
Plan
7/28/2019 79F64d01
http://slidepdf.com/reader/full/79f64d01 8/22
20 September 2009 2009 North America Financial Community Site Tour 8
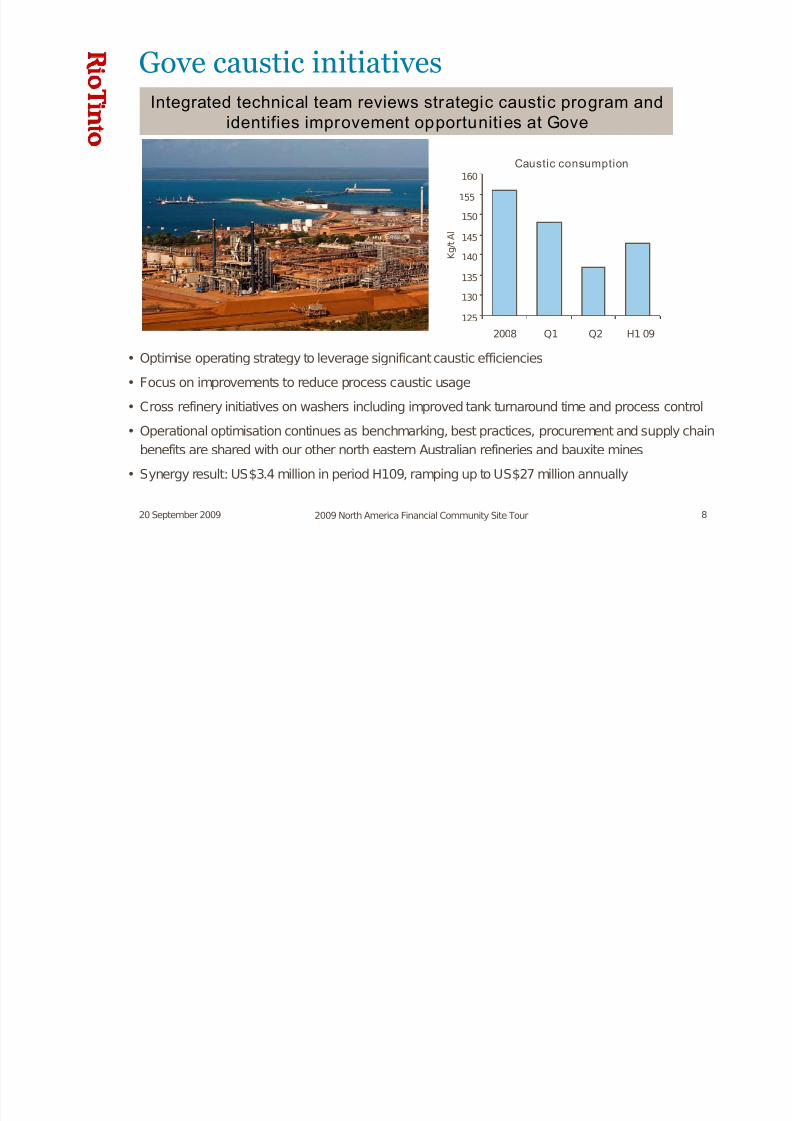
• Optimise operating strategy to leverage significant caustic efficiencies
• Focus on improvements to reduce process caustic usage
• Cross refinery initiatives on washers including improved tank turnaround time and process control
• Operational optimisation continues as benchmarking, best practices, procurement and supply chain
benefits are shared with our other north eastern Australian refineries and bauxite mines
• Synergy result: US$3.4 million in period H109, ramping up to US$27 million annually
Gove caustic initiatives
Integrated technical team reviews strategic caustic program andidentifies improvement opportunities at Gove
Caustic consumption
125
130
135
140
145
150
155
160
2008 Q1 Q2 H1 09
K g / t A l
7/28/2019 79F64d01
http://slidepdf.com/reader/full/79f64d01 9/22
20 September 2009 2009 North America Financial Community Site Tour 9
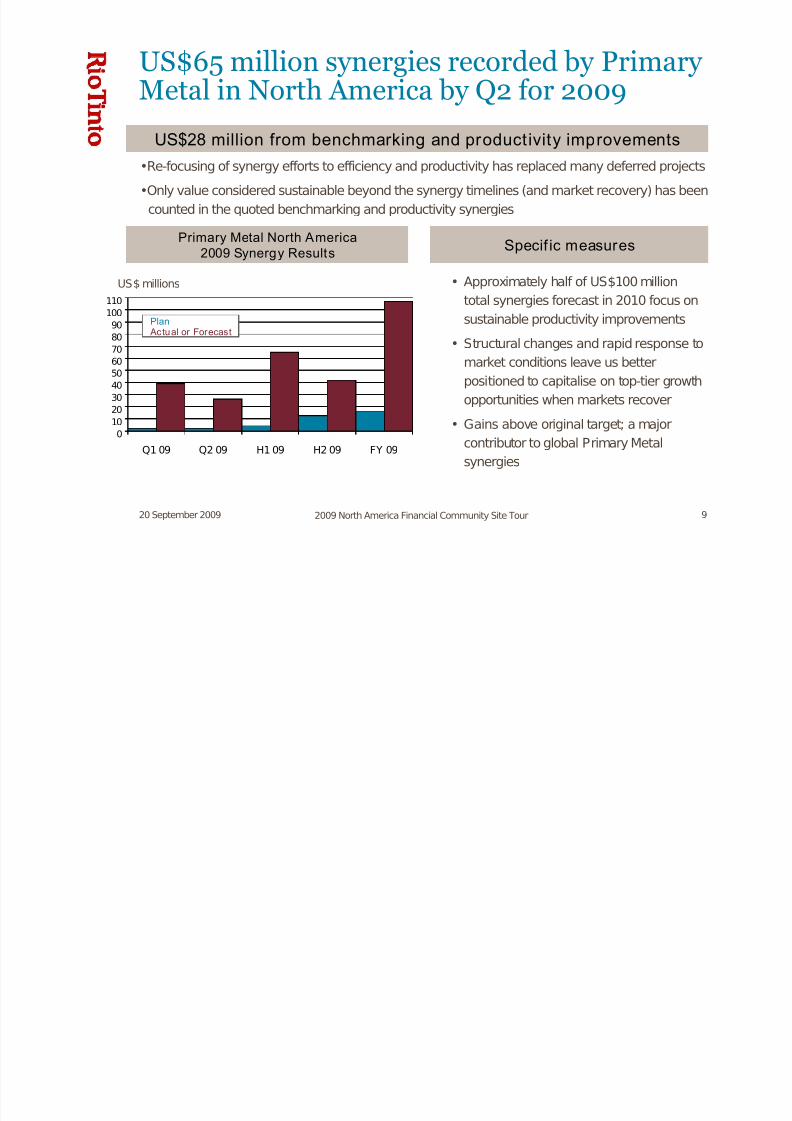
US$65 million synergies recorded by Primary
Metal in North America by Q2 for 2009
•Re-focusing of synergy efforts to efficiency and productivity has replaced many deferred projects
•Only value considered sustainable beyond the synergy timelines (and market recovery) has beencounted in the quoted benchmarking and productivity synergies
Specif ic measures
US$28 million from benchmarking and productivity improvements
Primary Metal North America2009 Synergy Results
US$ millions • Approximately half of US$100 million
total synergies forecast in 2010 focus on
sustainable productivity improvements
• Structural changes and rapid response to
market conditions leave us better
positioned to capitalise on top-tier growth
opportunities when markets recover
• Gains above original target; a major
contributor to global Primary Metal
synergies
0
10
20
30
40
50
60
70
80
90
100
110
Q1 09 Q2 09 H1 09 H2 09 FY 09
Plan Actual or Forecast

7/28/2019 79F64d01
http://slidepdf.com/reader/full/79f64d01 10/22
20 September 2009 2009 North America Financial Community Site Tour 10
Cost init iatives
Modelling the business
Synergies and integration

7/28/2019 79F64d01
http://slidepdf.com/reader/full/79f64d01 11/22
20 September 2009 2009 North America Financial Community Site Tour 11
Lower input costs are beginning to take
effect
• Further savings for pitch, coke
and caustic expected to come
through in second half
• Costs declines lag prices due
to nature of contracts
• Aggressive strategies
deployed across all raw
material
100%100%100%
85%
78%
61%
81%
39%45%
Coke Caustic Pitch
H208 Q209 ’09FEnd
H208 Q209 ’09FEnd
H208 Q209 ’09FEnd
Further procurement savings expected
7/28/2019 79F64d01
http://slidepdf.com/reader/full/79f64d01 12/22
20 September 2009 2009 North America Financial Community Site Tour 12
Leveraging the operational flexibility of the
business
Total cost equivalent reduction of US$85 per tonne, pre tax
• Energy sales from curtailment
• Sales from carbon products manufacturing
• Technology and infrastructure sales

7/28/2019 79F64d01
http://slidepdf.com/reader/full/79f64d01 13/22
20 September 2009 2009 North America Financial Community Site Tour 13
Capital initiatives generating significant
savings
2417
586 500
1108
2008 Actual 2009 Forecast 2010 Target
Significant reduct ion in CapitalExpenditures (US$ millions)
GrowthSustaining
• Driving down capex in 2009
• Evaluating growth capex for
2010
• Prioritising use of capital
• Keeping focus on the
reliability of our plants
This does not include 2010 growth capital which remains under evaluation
7/28/2019 79F64d01
http://slidepdf.com/reader/full/79f64d01 14/22
20 September 2009 2009 North America Financial Community Site Tour 14
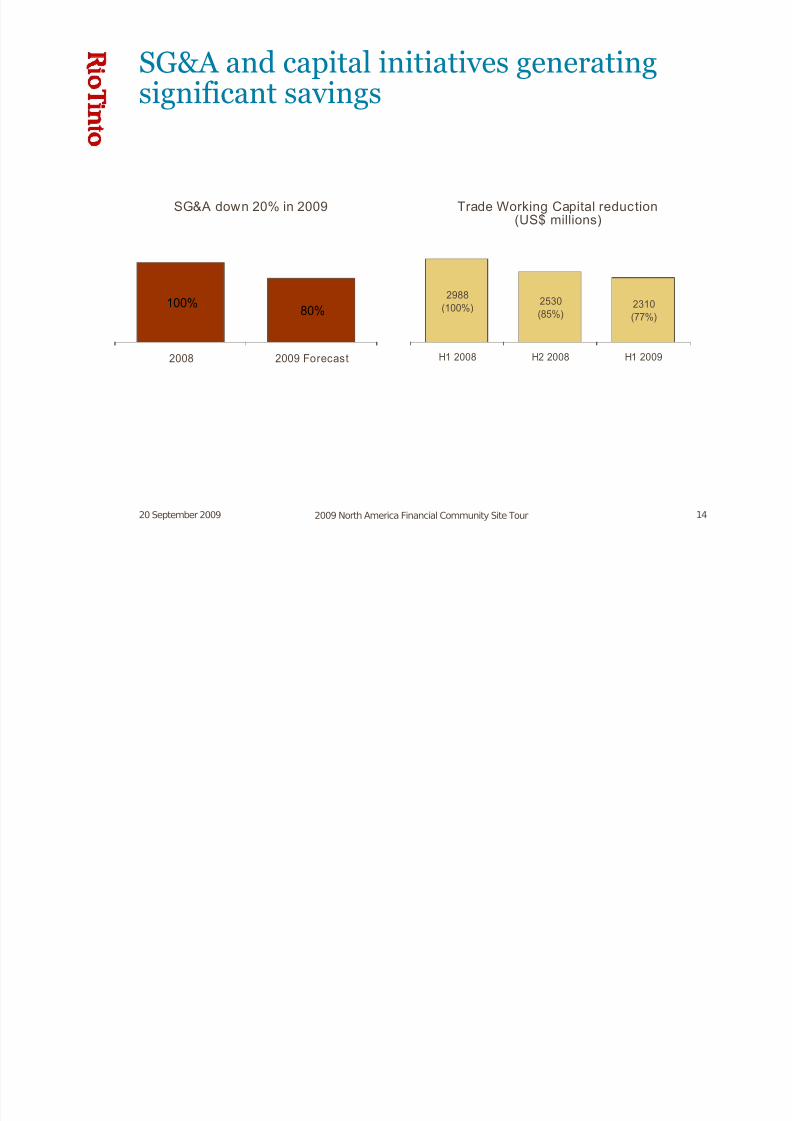
80%100%
2008 2009 Forecast
SG&A and capital initiatives generating
significant savings
SG&A down 20% in 2009
2310
(77%)
2530
(85%)
2988(100%)
H1 2008 H2 2008 H1 2009
Trade Working Capital reduction(US$ millions)
7/28/2019 79F64d01
http://slidepdf.com/reader/full/79f64d01 15/22
20 September 2009 2009 North America Financial Community Site Tour 15
Cost init iatives
Modelling the business
Synergies and integration

7/28/2019 79F64d01
http://slidepdf.com/reader/full/79f64d01 16/22
20 September 2009 2009 North America Financial Community Site Tour 16
Rio Tinto Alcan’s aluminium pricing
tracking closely to spot prices in 2009
0
500
1,000
1,500
2,000
2,500
3,000
3,500
Q1 08 Q2 08 Q3 08 Q4 08 Q1 09 Q2 09
US$/t (lines)
• 2009 first half average LMEprice was US$1,422 per
tonne, a decline of 50% on
H1 2008
• Pricing of aluminium has an
LME price mix on average of
• 55% spot
• 45% one month
Aluminium spot price

7/28/2019 79F64d01
http://slidepdf.com/reader/full/79f64d01 17/22
20 September 2009 2009 North America Financial Community Site Tour 17
27% 27%29%
43%
51%48%
0%
25%
50%
75%
Q1 08 Q2 08 Q3 08 Q4 08 Q1 09 Q2 09
% of Remelt volume vs. total sales volume (bars) • Percentage of remelt sales nearly
doubled in H1 2009 vs. H1 2008
with premia down almost 30%
• Continuing signs of steady value
added product recovery in North
America and Asia Pacific, withencouraging signs emerging in
Europe
• With market recovery will expect
value added volumes to return to
historical levels
Remelt sales nearly double in H1 2009
versus H1 2008 but volumes are returning

7/28/2019 79F64d01
http://slidepdf.com/reader/full/79f64d01 18/22
20 September 2009 2009 North America Financial Community Site Tour 18
Premiums are showing signs of recovery
North
America
42%
Europe
24%
Asia Pacific34%
• Includes two components: market premium and product premium
• Market premium varies by region
• Product premium varies by product but on average is about US$180 per tonne
• Overall, net value added premium is around 3.4% above average 2008 LME
$0
$20
$40
$60
$80
$100
$120
$140
$160
$180
2003 2004 2005 2006 2007 2008 2009
L o c a l M
a r k e t P r e m i u m s ( $
/ t o n n e )
Europe 3M DPPJapanMidwest
Source: Platts Metals Week
Cut in EU dutyto 3% from 6%
Local market premiumsH109 aluminium sales by region

7/28/2019 79F64d01
http://slidepdf.com/reader/full/79f64d01 19/22
20 September 2009 2009 North America Financial Community Site Tour 19
Key raw material prices have a lag effect
33%
21%
21%
24%14%
32% 32%
23%
0%
20%
40%
60%
80%
100%
Alumina Alumin ium
Other Other
Bauxite Alumina
Energy
Energy
Caustic
Carbon
Aluminium
• Coke and pitch generally have
three to five month lag due tothe pricing (mostly semi-
annual) and days of inventory
• Alumina (two to five month lag)
• 16% of energy LME linked tothree-month
Alumina
• Caustic lag is generally one totwo months
• Fuel oil one to two month lag
Source: CRU

7/28/2019 79F64d01
http://slidepdf.com/reader/full/79f64d01 20/22
20 September 2009 2009 North America Financial Community Site Tour 20
Sensitivities
71+/-8.3USc83UScCanadian dollar
29+/-1.3USc134UScEuro
107+/-7.1USc71USc Austral ian dollar
399+/- $142/t$1,422/t Aluminium
Effect on Rio Tinto Alcan ful l year
underlying earnings (US$ millions)
10% change
Averageprice/exchange
rate for 2009 firsthalf

7/28/2019 79F64d01
http://slidepdf.com/reader/full/79f64d01 21/22
20 September 2009 2009 North America Financial Community Site Tour 21
Conclusions
• On track to deliver US$1.1 billion in integration synergies
• Focus on margin improvement
– Hold cost improvements to date
– Further cost compression opportunities
– Market recovery flow through
• Will continue to manage cash into 2010
– Capital, working capital, operations
• Good financial discipline, control and governance
Benefits of actions wi ll continue to flow through in years to come
7/28/2019 79F64d01
http://slidepdf.com/reader/full/79f64d01 22/22
20 September 2009 2009 North America Financial Community Site Tour 22
Questions?


