![[d], [o] If one doctor doctors another doctor does the doctor who doctors the doctor doctor the doctor the way the doctor he is doctoring doctors? Or.](https://static.fdocuments.in/doc/165x107/56649e995503460f94b9c732/d-o-if-one-doctor-doctors-another-doctor-does-the-doctor-who-doctors-the.jpg)
7&8Network Doctor Reports (Day7 & Day8)
146
Babak Kardel Mehrdad Sedaghat April 2008 Network Doctor Reports Course
Transcript of 7&8Network Doctor Reports (Day7 & Day8)
Babak Kardel
Mehrdad Sedaghat
April 2008
Network Doctor Reports Course

Topics
4/8/20082
• Introduction : Network Doctor Operation
• Report-196: UL and DL Quality, UL Interference Per TRX
• Report-208: Link Balance Per TRX
• Report-153: Handover Failure Ratio on Adjacency
• Report-163: TCH Drop Call Ratio
• Report-166: SDCCH Drop Ratio
• Report-204: NETWORK BENCHMARK STATISTICS
• Report-073: Undefined Adjacent Cells
• Reports Number 154, 156, 139, 187 and so on

Introduction:
Network Doctor
Operation

Introduction- ND Operation (1)�Network Doctor for BSS
� Network Doctor for BSS offers a menu-based user interface
in which you can move up and down the menu hierarchy.
� All reports are listed in the submenus.
� Self-documented reports, front-page descriptions, and
column headers guarantee that the basic information is
always available in a context-sensitive presentation. The
descriptions of the counter formulas can be displayed on
request.
� The Network Doctor reports produce an output file which
opens in the dtpad editor window. You can modify the
report, if necessary, and save it.

Introduction- ND Operation (2)
�When running the BSS Network Doctor reports, a common
query is made for the time period selected and the scope of
the measurement. You can usually define the following
parameters:
� Period of time
Today, Absolute date, Relative date ending on the current
hour, Relative date ending the previous midnight.
� Scope of report
Maintenance Region, BSC, LAC, one BTS, all BTSs or all
IUO BTSs, single Segment, single BCF, BSC SW version,
Frequency band of dual band, BCF type for Base Station
generation, manual Working Set with BTSs or with BCFs,
MSC, and BTS having GPRS traffic.

Introduction- ND Operation (3)
�Network performance can be evaluated using KPIs such as
TCH drop call ratio. These indicators are either directly
mapped to a counter or a formula of counters. Drop call
ratio, for example, is currently a formula of several counters.
KPIs need to be:
� monitored on network and area level for seeing the trends.
� monitored at cell level across the area to spot the BTSs
potentially having problems. Often they are referred to as
BTS Hit Lists or Top n Lists.
� analysed for a specific BTS when the BTS has been found on
the Hit List. At this point, for example, you may be interested
in the behaviour of the cell against a time profile.

Network Doctor for BSS : Main Menu*******************************************
* BSS NETWORK DOCTOR *
* v.3.1.9 *
* for NetAct OSS3.1ED3, BSC S11 *
*******************************************
1) Fault Management ...
2) Configuration Management ...
3) Performance Management BSS ...
4) Benchmark and analysis ...
5) NetAct Database Administration ...
6) Run a report by identification number
7) Display a model report by identification number
8) Generate auto script by identification number
9) User log
10) Connect as another user
s) Search reports containing given formula or counter.
f) Find description of given formula.
c) Change history.
q) Exit

Network Doctor for BSS : Sub Menu�� Benchmark and analysisBenchmark and analysis
�� BenchmarkBenchmark
1 ) Performance statistics (heavy benchmark, use small area, 200)
2 ) Network benchmark statistics (heavy, use small area, 204)
3 ) Performance profiles for area, 10 days/24 h (heavy, use small area, 207)
4 ) Quality Survey (800)
5 ) BTS GSM KPI/PI table, dynamic object and time aggregation (205)
6 ) TRX level GSM KPI/PI table, dynamic time aggregation (206)
�� AnalysisAnalysis
7 ) BSC doctor (212)
8 ) BTS analyser (216)
9 ) Base station site check (221)
10) Cell doctor (211)
11) BTS doctor (213)
12) Availability per BSC unit (215)
13) SDCCH, TCH and BSC out HO observation statistics (217)
14) Drop call trace (225)
15) BSC internal HO observation cause statistics (223)
m ) Display a model report by ID number
r ) Run any other report by ID number
q ) Quit

Network Doctor for BSS : Sample
-------------------------------------------------------------------------------------------------
Report Generation Data
-------------------------------------------------------------------------------------------------
Date : Wed Sep 26 16:21:56 BST 2007
Menu Command Path : 6 / 132
User / Host : kardel / nscs2
Version / Report : ND BSS v.3.1.9 / 132
========================================================
= CELLS HAVING SMS ESTABLISHMENT FAILURES
= Network: PLMN
= Area: BSC - 711883
= Period: from 20070926 to 20070926
= Aggregation: Segment
= Threshold : nbr of failures >0
= Sorting : SMS fail
========================================================

Network Doctor for BSS : Sample
====================================================
This report shows cells having SMS establishment failures over a given period.
This report can be run on BTS or segment level.
Nbr of SMS est.attempts
/sms_4 Number of SMS establishment attempts.
SMS flr % on TCH
/sms_2 SMS establishment failure ratio on TCH.
SMS flr % on SDCCH
/sms_3 SMS establishment failure ratio on SDCCH.
Tot SMS flr %
/sms_1 Total SMS establishment failure ratio.
====================================================
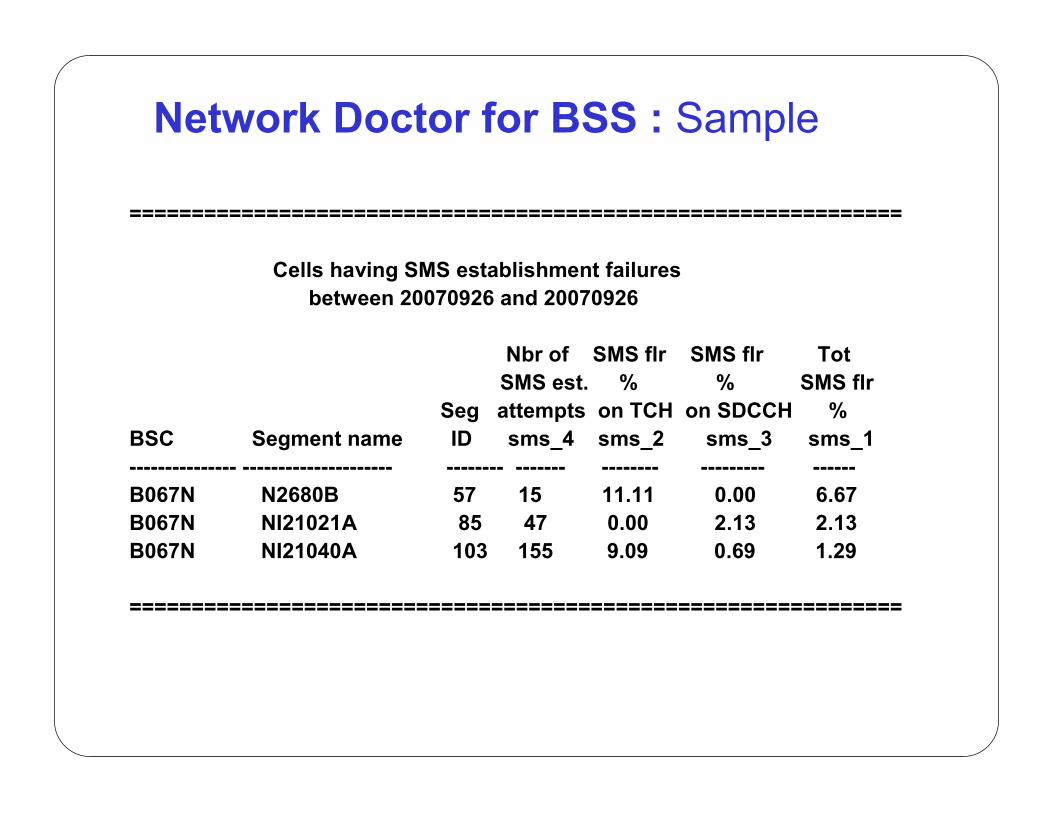
Network Doctor for BSS : Sample
==============================================================
Cells having SMS establishment failures
between 20070926 and 20070926
Nbr of SMS flr SMS flr Tot
SMS est. % % SMS flr
Seg attempts on TCH on SDCCH %
BSC Segment name ID sms_4 sms_2 sms_3 sms_1
--------------- --------------------- -------- ------- -------- --------- ------
B067N N2680B 57 15 11.11 0.00 6.67
B067N NI21021A 85 47 0.00 2.13 2.13
B067N NI21040A 103 155 9.09 0.69 1.29
==============================================================

Web-Based Browser �Network Doctor Browser in the Regional Cluster
� Network Doctor Browser (ND Browser) is an optional web-based
application that allows you to access the ready-made BSS reports provided
by the HP-UX-based Network Doctor application.
ND Report-196:UL and DL quality, UL
interference per TRX

Contents
1. SAMPLE OF REPORT
2. DESCRIPTION
3. ADVANTAGE
4. ANALYS
5. EXPERIENCES
6. INFORMATION

Sample of Report 196 (Part 1)

Sample of Report 196 (Part 2)

Sample of Report 196 (Part 3)

� This report have three parts:
� Part 1: UL, DL Quality and UL Interference per TRX
� Part 2: Interference profile
� Part 3: Frequency profile
Description of Report 196

Advantage of Report 196
� This report can be used to find hardware problems such as
TRX faulty, VSWR, feeder and sector swap. Also this report
can be used to detect interference and overshooting.

Analyze of Report 196
� PART 1: TRX HIT LIST
� For each TRX reported:
� q0..7 (%) UL /ulq_2 Cumulative % of uplink call samples.
Target value example: q5 over 98 %.
� q0..7 (%) DL /dlq_2 Cumulative % of downlink call samples.
Target value example: q5 over 98 %.
� Call min /trf_32a Call time in minutes counted from samples.
The max call time for a TRX in a 6 hours period in a day=1 day* 6 hours*60 mins*8 RTSLs*2 (HR)= 5760 min
� Call dif /trf_21a The ratio of call samples of the most loaded TRX
to that of the least loaded TRX in the same BTS.
Sorting the report by using this value may help to
detect abnormal traffic distribution in a cell.
� Intrf /itf_4 Average interference band (1-5, 5 being the worst)
� Freq Frequency of TRX. 'chgd' = frequency has been
changed during the period. Blank means
that there has been no calls.

Quality classes:The quality classes are as defined in GSM recommendation GSM 05.08 (8.2).
The calls are sampled every 480 ms for the quality class. Quality class info is
used on Abis but BSC converts the quality classes into BER % figures
using the default values. (Power control measurement shows BER figures).
Class BER (GSM 05.08)
***** ******************
qua 0 (BER < 0.2%)
qua 1 (BER 0.2 - 0.4%)
qua 2 (BER 0.4 - 0.8%)
qua 3 (BER 0.8 - 1.6%)
qua 4 (BER 1.6 - 3.2%)
qua 5 (BER 3.2 - 6.4%)
qua 6 (BER 6.4 - 12.8%)
qua 7 (BER >12.8%)
The rule of thumb is that in quality classes 0-5 the MS user does not yet feel
that the quality is bad.
Analyze of Report 196

UL Interference:
Band indicates the average interference band of TCH (idle).
If there is no interference (uplink), average band should be 1.
The band limits are defined in cell parameters by setting the boundaries in
the interference averaging parameter set.
------------------ boundary 0 (value fixed: -110dBm)
band 1
------------------ boundary 1 (value eg.: -105dBm)
band 2
------------------ boundary 2 (value e.g.: -100dBm)
band 3
------------------ boundary 3 (value e.g.: -95dBm)
band 4
------------------ boundary 4 (value e.g.: -90dBm)
band 5
------------------ boundary 5 (value fixed: -47dBm)
Analyze of Report 196

PART 2: INTERFERENCE PROFILEFor each TRX exceeding the thresholds and having interference
a 10day/24h breakdown is shown.
- Check the 10-day/24-hour breakdown charts to find out what the pattern is.
- If you suspect that the interference is from the BS itself (constant
band 5 interference e.g. in all sectors) you may set
the power to minimum for a while (this means that calls cannot be made!)
and check from the BSC MML with ZERO command if the interference level has
gone down in idle time slots. Then put the power back to the initial level.
- After you have found the cells with obvious external UL interference
you may
a) mark the cells having a similar interference pattern on the map with
the same colour and see if the antenna directions point to a certain place
- It is also a good idea to check whether the cell is not reported by report 062,
which could mean interference from an own adjacent cell.
b) use Undefined Adjacent Cell measurement (possibly with the idle state BA
list to define what are the strongest frequencies in the band that are not
adjacent cells.
c) You may also run the report 216 to get more details about the cell.
Analyze of Report 196

PART 3: FREQUENCY PROFILE
For all TRXs exceeding the thresholds and having frequency changed during the given
time period a 10day/24h breakdown is shown. The value of zero means that there are no
calls. Frequency changes
must be considered when analysing interference behaviour.
Analyze of Report 196

Part 1 more analysis:
� If 1 TRX in a cell has low quality :
a- TRX faulty ; There is “ 7607 TRX operation degraded ” or “ 7530 TX output power level decreased “ alarm
b-TX or RX jumper is out of work ; if TRX has no alarms and DL qual is low then TX jumper is out of work and when UL qual is low then RX jumper is out of work.
� If 1 TRX has no traffic or low traffic and call diff in cell is high and all RTSLs of this TRX is idle (ERO command), or TRX is block TRX then TRX is faulty.
� When BCCH TRX is faulty, the frequency of TRXs in this cell will change because BTS replace BCCH to a normal TRX.
� In these problems we can replace fault TRX with another TRX and check wiring before changing fault TRX. This way sometimes solves problems.
Analyze of Report 196

� VSWR problem; 2 TRXs of a feeder in a BTS have low qual
� Feeder swap; 2 TRXs of a feeder in a BTS and 2 TRXs of a feeder in another BTS in same BCF have low qual
� Sector swap; all TRXs of 2 BTSs in same BCF have low qual without overshoot or interference
� Data base swap; it is like feeder or sector swap or cell has no traffic
� Overshoot ; all TRXs of a BTS have low qual. We have to check report 232 and site situation.
� Interference:
a- interference in all TRXs; cells with same Frequency or same HSN, interference is from the BS itself (Talk family sites or 6+6+6 sites), external UL interference, overshoot
b- interference only in BCCH TRX; check cells with same frequency around this cell and overshooting cells, replace BCCH to another TRX
c- interference only in TCH TRXs; check cells with same frequency around this cell if cell use BB hopping, check HSN in cells with RF hopping, overshoot.
Analyze of Report 196

Sample 1 - N255A Call drop
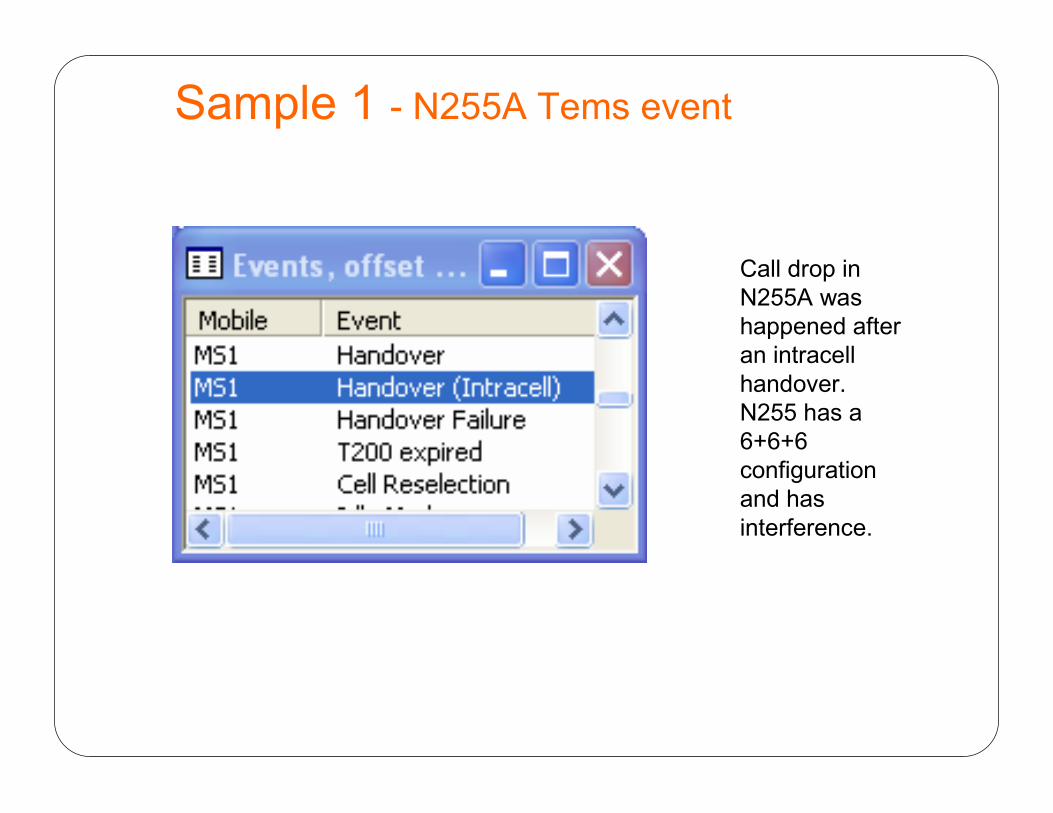
Sample 1 - N255A Tems event
Call drop in
N255A was
happened after
an intracell
handover.
N255 has a
6+6+6
configuration
and has
interference.

Sample 1 - N255A TCH ass fail
Sample 1 - N255A TA

Sample 1 - N255A report 196
Faulty in TRX 3 of N255A or in RX jumper
Sample 1 - N255A report 208
High DL path loss in TRX 3 of N255A

Sample 1 - N255A Alarm
TRX 3 of N255A is faulty

Sample 2 – N2707C VSWR

Sample 3 – N702B,C feeder swap

Sample 4 – N010 data base swap
Sample 5 – N032B interference and overshoot
ND Report-208:
Link Balance Per TRX

Contents
� Sample of Report ND 208
� Description of ND 208
� Advantage of ND 208
� Analyze (Examples) of ND 208
� Information

Sample of Report 208

Description of Report 208

Loss from MS to BTS (UL & DL)
� DL Path
Jumper loss between TRX and combiner
Combiner loss
Jumper loss between combiner and feeder
Feeder loss
Jumper loss between feeder and antenna
� UL Path
Jumper loss between antenna and feeder
Feeder loss
Jumper between feeder and duplexer
duplexer loss
Jumper between duplexer and TRX (main and diversity)
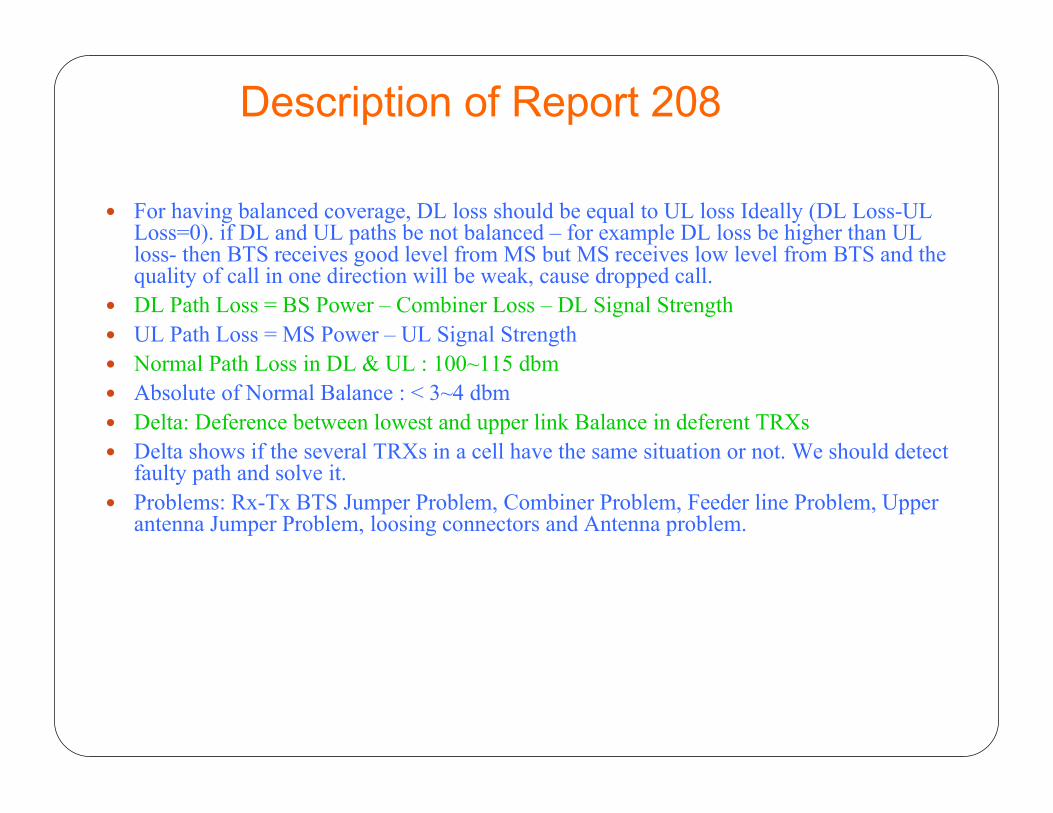
Description of Report 208
� For having balanced coverage, DL loss should be equal to UL loss Ideally (DL Loss-UL Loss=0). if DL and UL paths be not balanced – for example DL loss be higher than UL loss- then BTS receives good level from MS but MS receives low level from BTS and the quality of call in one direction will be weak, cause dropped call.
� DL Path Loss = BS Power – Combiner Loss – DL Signal Strength
� UL Path Loss = MS Power – UL Signal Strength
� Normal Path Loss in DL & UL : 100~115 dbm
� Absolute of Normal Balance : < 3~4 dbm
� Delta: Deference between lowest and upper link Balance in deferent TRXs
� Delta shows if the several TRXs in a cell have the same situation or not. We should detect faulty path and solve it.
� Problems: Rx-Tx BTS Jumper Problem, Combiner Problem, Feeder line Problem, Upper antenna Jumper Problem, loosing connectors and Antenna problem.

Advantage of Report 208
� ND Report 208 is a good report for Nokia BTS
troubleshooting. BTS engineers can use this report for
detecting faulty objects and replace them and check
again if the problem resolved.
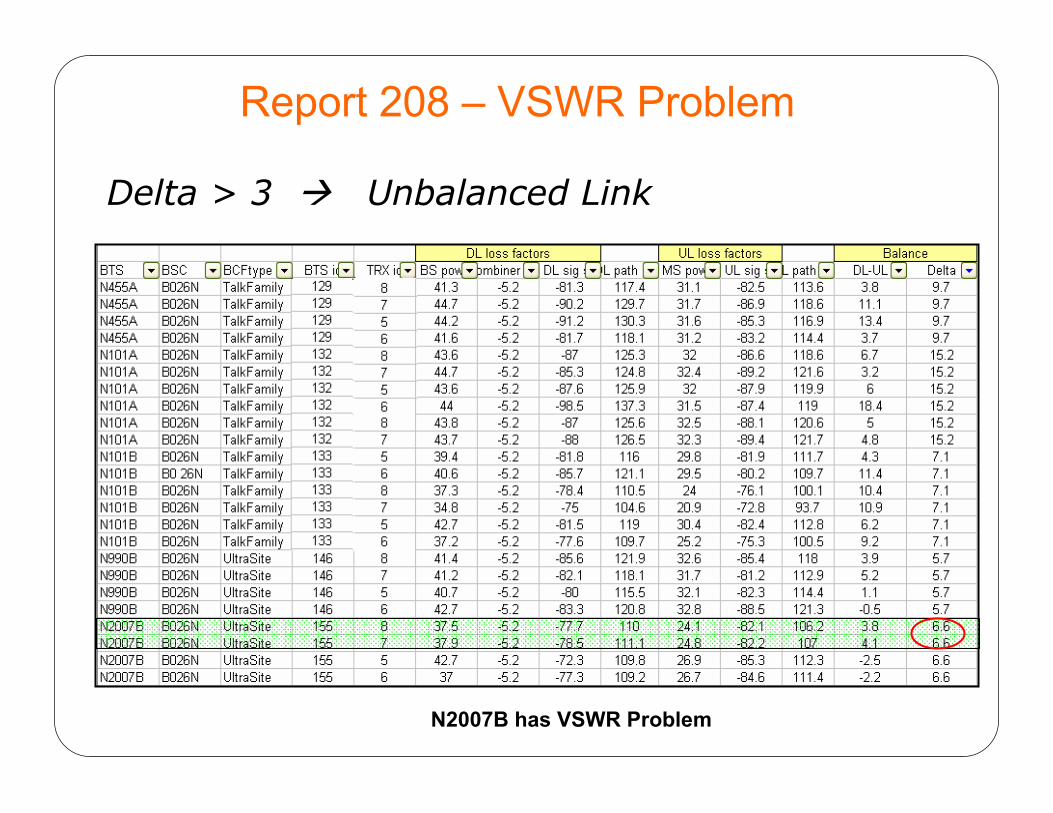
Report 208 – VSWR Problem
Delta > 3 � Unbalanced Link
N2007B has VSWR Problem

VSWR Solution–Connector Loosing
VSWR Problem was solved in N2007B.

Report 208 – Feeder Problem
� Feeder Problem in N990B (VSWR in middle of Feeder)
Before Changing Feeder After Changing Feeder

Report 208 – Jumper Problem
Case1: Jumper from TRX 4 to combiner loose (check connectors at both ends)

Report 208 – Jumper Problem
Case2: Jumper from Duplexer to TRX 4 (check connectors at both ends)

Report 208 – Feeder Problem
Case3: Check common feeder line from
Top of cabinet to Antenna port ( loose
connector’s at either end or High VSWR problem, TRX 2&4 in
this case use the same feeder)
In this case, the Path imbalance (DL-UL) varies
between +1.6 to -4dB which doesn’t tell much
BUT DL pathloss variations between TRX’s is from
112.8 to 136dB
& UL pathloss variations between TRX’s is from
111.2 to 140dB
DEFINITELY A PROBLEM!

How to identify the worst cells in network?
� Import DL & UL pathlosses for all TRX’s of all cells into separate columns
� Use a pivot table to get Min and Max values of dL and Ul pathlosses in a cell
� Identify all cells with DL TRX pathlossvariatons >10dB (for a NW with huge TI quality issues , start with 15dB)
� The same can be done for UL also
� A combined analyses for DL& UL with >10dB diff gave a list of 58 cells for UP (West) attached below.
� Go back to 208 report for detailed analysis208_HW issues

ND Report-153:
Handover Failure Ratio on
Adjacency

REPORT 153 (HANDOVER FAILURE RATIO ON ADJACENCY )
� 1. SAMPLE OF REPORT
� 2. DESCRIPTIONS
� 3. ADVANTAGE
� 4. ANALYS
� 5. INFORMATION

REPORT 153 (HANDOVER FAILURE RATIO ON ADJACENCY )
� Source Target
� ****** ******
� SEGMENT NAME (ID) SEGMENT NAME (ID)
� BCF NAME HO=> HO=> HO=> <=HO <=HO <=HO Target BCF NAME
� BSC NAME **** **** **** **** **** **** ****** BSC NAME
� BAND Att Blck Fail Fail Blck Att LAC BAND
� BCF TYPE (%) (%) (%) (%) CI BCF TYPE
� ------------------ ------ ---- ---- ---- ---- ------ ------ ------------------
�
� N2219C (63) 29 0 7 4 0 23 6210 N603A (7)
� N215 12786 N2215
� B026N B026N
� GSM1800 GSM900
� UltraSite UltraSite
�
� N230A (28) 58 0 7 0 0 0 2214 N456C (72)
� N217 32268 N456C
� B026N B017N
� GSM900 GSM900
� UltraSite UltraSite
�

REPORT 153 (HANDOVER FAILURE RATIO ON ADJACENCY )
� DESCRIPTIONS:
� THE ADJACENCIS HAVING HIGH HO FAILURE RATIO , REPORT 153 IS
BASED ON THE OPTIONAL BSC MEASUREMENT HO ADJACENT CELL.
YOU CAN USE THE THRESHOLDS TO FOCUS ON PROBLEMATIC
ADJACENCIES ONLY.
� THIS FAMOUS REPORT SPEAKS ABOUT HANDOVER ATTEMPTS
,HANDOVER BLOCKS, HANDOVER FAILS FROM ONE CELL TO THE
NEIGHBORS AS TARGET CELLS AND VICE VERSA .

REPORT 153 (HANDOVER FAILURE RATIO ON ADJACENCY )
� ADVANTAGE:
� 1. THIS REPORT IS VERY USEFULL TO CHECK HANDOVER
PERFORMANCE FOR A CERTAIN CELL IN BSC
� 2. WE CAN FIND OUT HANDOVER PROBLEMS (FAILURES) EITHER
INCOMING OR ONCOMING HANDOVER
� 3.WE CAN FIND OUT WHICH RELATIONS ARE UNNECESSARY AND
WITH CONSIDERING DISTANCE AND DIRECTION OF RELATION WE CAN
DELETE IT SIMPLY.
REPORT 153 (HANDOVER FAILURE RATIO ON ADJACENCY )
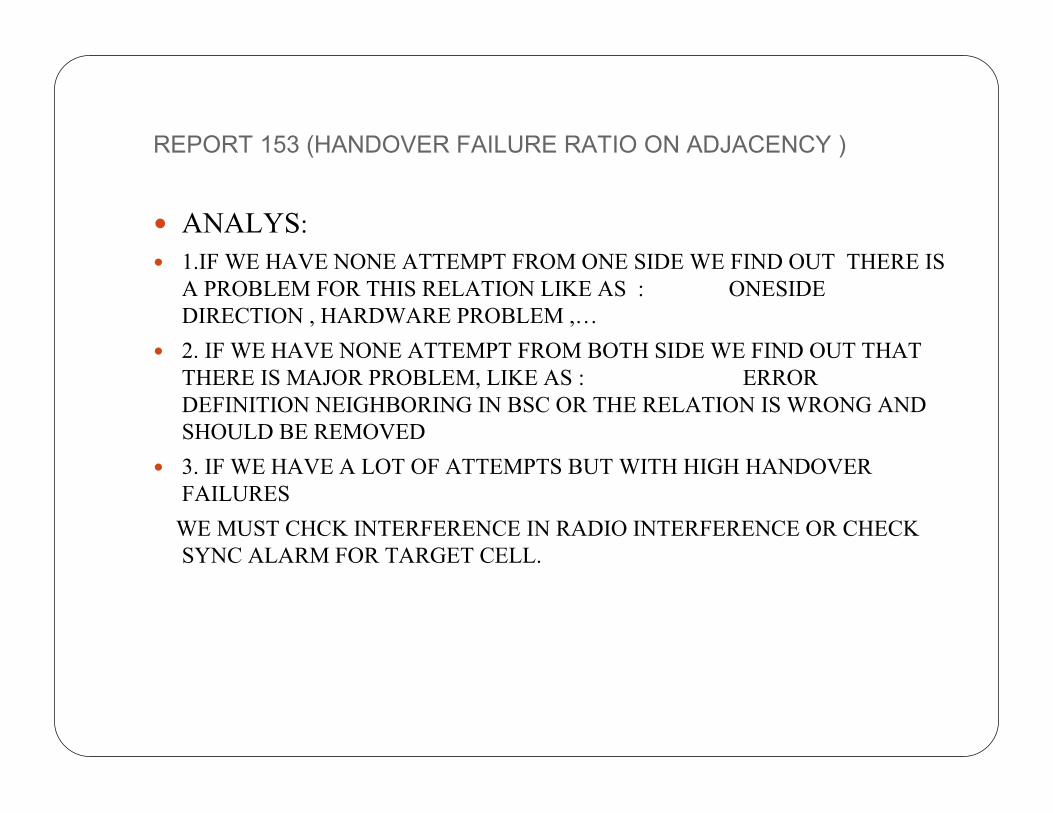
� ANALYS:
� 1.IF WE HAVE NONE ATTEMPT FROM ONE SIDE WE FIND OUT THERE IS
A PROBLEM FOR THIS RELATION LIKE AS : ONESIDE
DIRECTION , HARDWARE PROBLEM ,…
� 2. IF WE HAVE NONE ATTEMPT FROM BOTH SIDE WE FIND OUT THAT
THERE IS MAJOR PROBLEM, LIKE AS : ERROR
DEFINITION NEIGHBORING IN BSC OR THE RELATION IS WRONG AND
SHOULD BE REMOVED
� 3. IF WE HAVE A LOT OF ATTEMPTS BUT WITH HIGH HANDOVER
FAILURES
WE MUST CHCK INTERFERENCE IN RADIO INTERFERENCE OR CHECK
SYNC ALARM FOR TARGET CELL.

REPORT 153 (HANDOVER FAILURE RATIO ON ADJACENCY )
4. IF WE HAVE HIGH ATTEMPTS WITH 100% FAILURE WE MUST COMPARE
CELL DEFINITION IN BSC AND MSC.
5. IF WE HAVE ATTEMPTS WITH HIGH NUMBER BLOCKS WE MUST
CHECK TCH CONGESTION IN TARGET CELL.
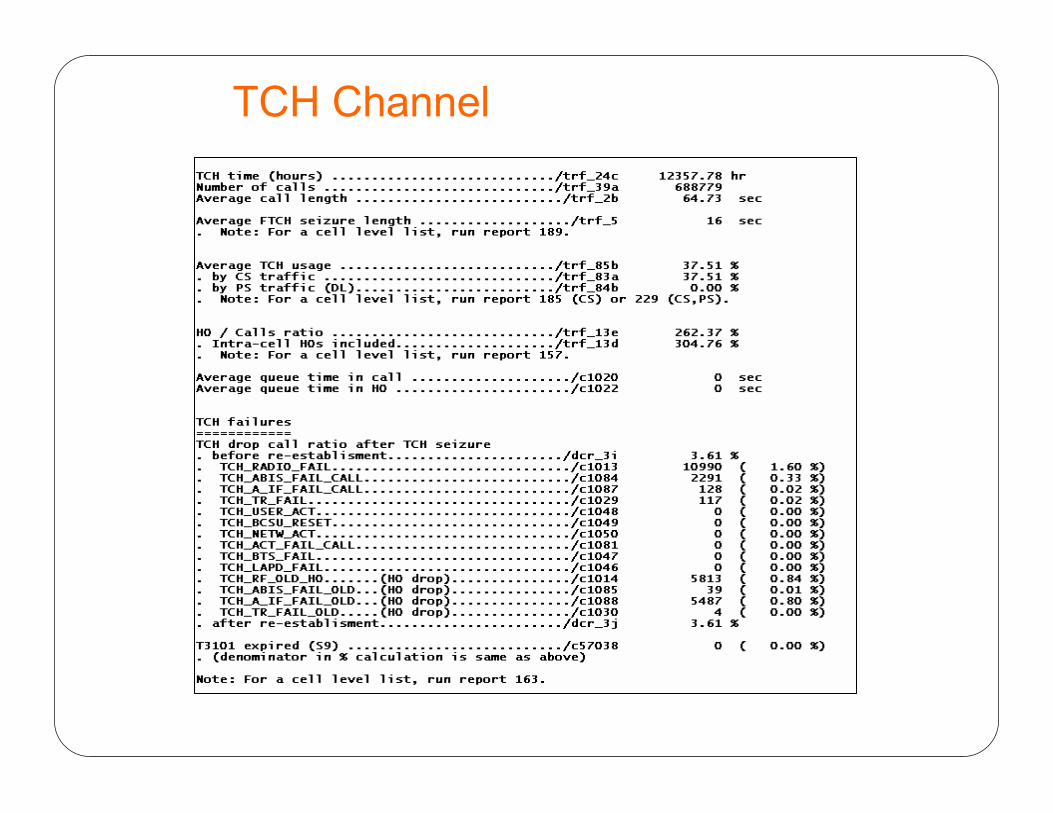
ND Report-163:TCH Drop Call Ratio

Contents
� Sample of Report
� Explanation Notes
� Definitions in Report
� CDR Formulas
� Example: TR Problem and Solution

Report 163 – TCH Drop - Sample

Explanation Notes
� ND-Report 163 gives the TCH drop call ratio and the reasons per cell.
� With this report we can find the most reasons of drop call in TCH
channel such as RF , ABIS, Transcoder parts.
� There is several ways for occupying TCH in a cell: Normal Call Setup,
Directed Retry, FAACH Call Setup and incoming Handover.
� Bids means the sum of total TCH occupation in a cell. It depends on the
formula that is using for dcr.

Explanation Notes
� There is two type of dropped call (call and old):
Dropped call on RF call means that the call on existing TCH will be
dropped because of bad radio condition for example bad Rx-Qual or
Low Rx-Level. This is considered as RF dropped call.
Dropped call on RF old means that the MS wants to take handover
from existing TCH channel to a new TCH channel but it can not take
handover because of bad condition on radio condition. This is
considered as RF old dropped call.
and is same for TR, ABIS and Aif parts.

Report 163 - Definitions

Report 163 – DCR Formulas
_3 100( & & )
Number of TCH Call Droppeddcr i
Total Number of TCH Channel Setup becauseof NormalCall Setup DRCall Setup FAACH Call Setup= ×
Example: N2990c:
Bids= 1008 +130 + 0 = 1138
Dcr_3i= (Total Dropped Call in Bids)/1138= 75.9%
There is 4 formulas for dcr in Report 163. The dcr_3i shows dropped call only
on call setup TCH and my experience shows that dcr_3i should not greater
than 2-3. dcr_4e includes the handover dropped calls too.

Transcoder Fail Problem – Before AMRBTS Name
Call
T-T HO
RE-ES SDCCH
RF CALL
TR CALL
DROP RATIO
N603A 15317 19715 0 1.2 0 2
N2101B 991 18296 0 1.1 0 2
N2229A 1030 12386 0 1.4 0 2
N2230C 292 6967 0 0.8 0 2
N230C 5937 9358 0 1.3 0 2
N2223C 541 9858 0 0.9 0 2
N229B 2794 4068 0 1.2 0 2
N717C 9121 10003 0 1.4 0 2
N603B 12817 21361 0 1.5 0 2
N2603A 985 20005 0 0.6 0 2
N230B 1015 503 0 0.7 0 2
N2007B 1156 19658 0 0.7 0 2
N3047A 933 11067 0 1.4 0 2
N455C 7767 8195 0 1.4 0 2
N2101C 842 13801 0 0.6 0 2
N2990A 1729 24778 0 0.5 0 2
N216C 9234 10335 0 1.2 0 2
N2676B 548 0 0 0.2 0 2
N2455A 1401 12920 0 1 0 2
N990B 6483 10675 0 0.9 0 2
N3047B 699 8484 0 0.7 0 2
We haven’t
Transcoder
dropped call
before the AMR
activation.
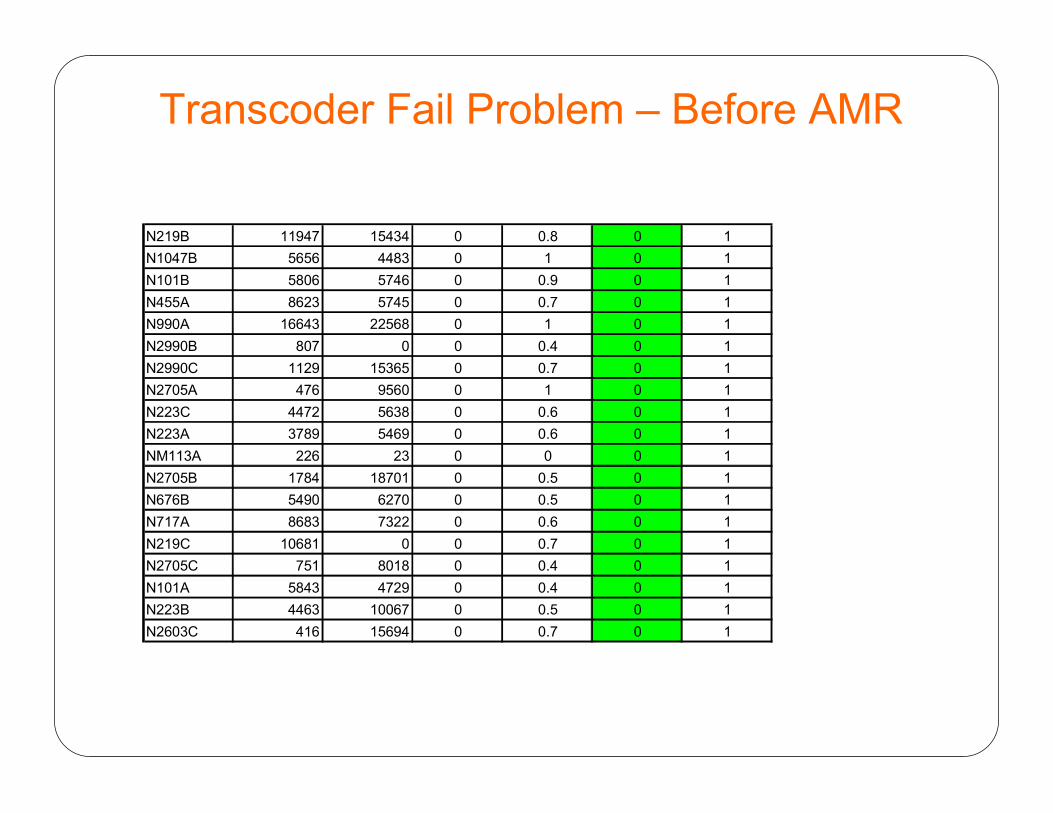
Transcoder Fail Problem – Before AMR
N219B 11947 15434 0 0.8 0 1
N1047B 5656 4483 0 1 0 1
N101B 5806 5746 0 0.9 0 1
N455A 8623 5745 0 0.7 0 1
N990A 16643 22568 0 1 0 1
N2990B 807 0 0 0.4 0 1
N2990C 1129 15365 0 0.7 0 1
N2705A 476 9560 0 1 0 1
N223C 4472 5638 0 0.6 0 1
N223A 3789 5469 0 0.6 0 1
NM113A 226 23 0 0 0 1
N2705B 1784 18701 0 0.5 0 1
N676B 5490 6270 0 0.5 0 1
N717A 8683 7322 0 0.6 0 1
N219C 10681 0 0 0.7 0 1
N2705C 751 8018 0 0.4 0 1
N101A 5843 4729 0 0.4 0 1
N223B 4463 10067 0 0.5 0 1
N2603C 416 15694 0 0.7 0 1

Transcoder Fail Problem- After AMR
BTS N
am
e
Call
T-T
HO
RE-E
S S
DC
CH
RE-E
S T
CH
RF C
ALL
RF O
LD
TR
CALL
DR
OP R
ATIO
N 2216B 1375 23951 0 0 5 .8 2 .4 22 .6 31
N2455A 1764 14135 0 0 0 .4 0 .7 21 .6 23
N2603C 2245 19857 0 0 0 .2 0 .5 13 .3 14
N2219C 880 13798 0 0 1 1 .4 11 .4 14
N717B 14898 17235 0 0 2 .1 0 .9 11 .3 15
N2603B 1521 23705 0 0 0 .4 0 .2 10 .7 11
N2990A 1747 20819 0 0 0 .4 1 .4 10 .5 12
N2216C 744 13451 0 0 1 .1 1 10 .1 12
N2705B 1099 15566 0 0 0 .8 1 .2 7 .6 9
N2717A 991 12306 0 0 1 1 7 .2 10
N2990B 570 17485 0 0 0 .9 1 .4 6 .4 8
N2717B 1375 15281 0 0 3 .1 1 .3 6 .3 11
N229A 12611 19020 0 0 1 .8 0 .5 4 .9 7
N2219A 838 19179 0 0 1 2 .4 4 .6 9
TCSM 112 was SE-NH but it's ET was working. We
change the state of ET to SE-NH.
The most
dropped call is
because of
Transcoder
problem after
the AMR
activation.
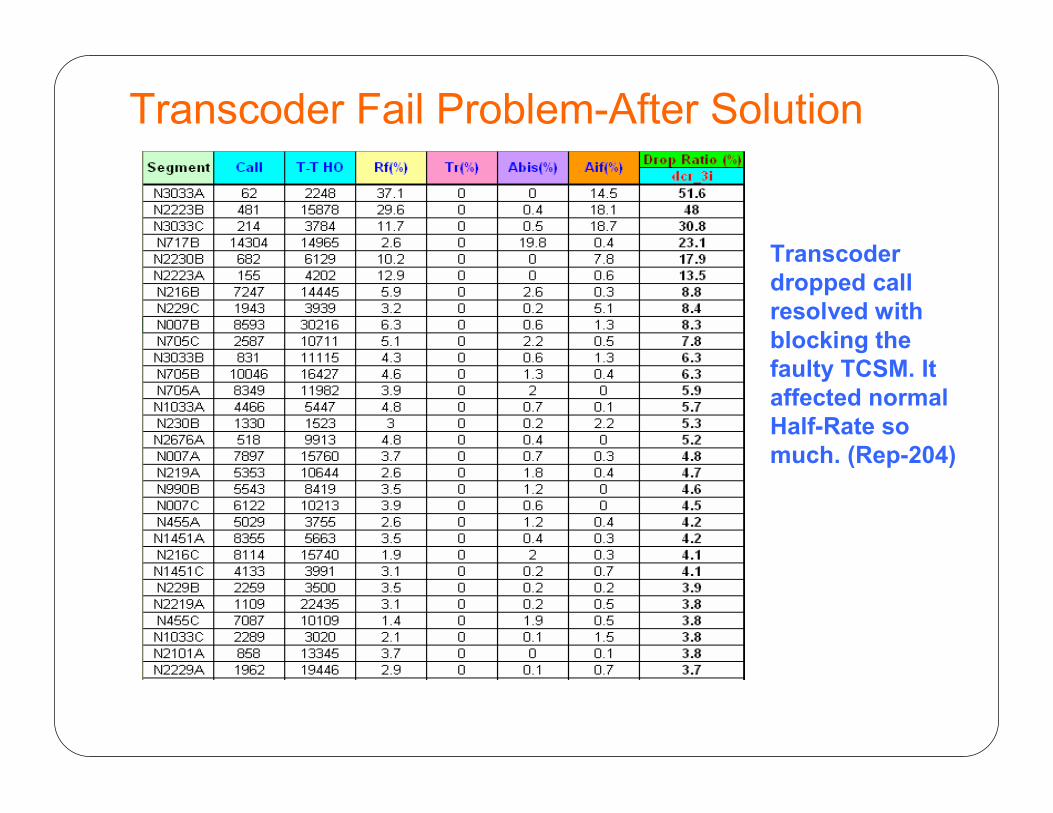
Transcoder Fail Problem-After Solution
Transcoder
dropped call
resolved with
blocking the
faulty TCSM. It
affected normal
Half-Rate so
much. (Rep-204)

Transcoder Fail Problem-After Solution

ND Report-166:SDCCH Drop Ratio
Contents
� Sample of Report ND 166
� Description of ND 166
� Advantage of ND 166
� Analyze (Examples) of ND 166
� Information

Sample of Report 166

Description of Report 166
Advantage of Report 166
� With this report we can analyze the sdcch drop ratio in
details and understand which part has the most effect
in drop of sdcch channels in network.
� Abis and RF are the most common reason for sdcch
dropped call.
� In a optimised network, sdcch dropped call must be
below 10% in nokia system.

� Reasons for sdcch dropped call:
TRX problem: whole TRX or Time Slot that SD channel is placed on it may be has faulty. We can check with MML command ZEOL to check the TRXs. We can change the location of sdcch channel and change the faulty TRX.
Abis link problem: We can check with MML command ZYMO. O&M team should solve the link problem.
Interference: We should check frequency plan of network and check Report-196 for interference.
A-Link Problem: sometimes bad connectors on BSC or MSC side or some mismatches maybe cause A-Interface fail on SDCCH. O&M and MSC teams should solve the problem.
Advantage of Report 166

Report 166 – High SD Drop and Solution
• N990B had high Sdcch drop ratio
• 1 Sdcch/8 was on TRX-8 and TRX-8 had alarm
We changed the position of Sdcch/8 from TRX-8 to TRX-2

ND Report-204:
NETWORK BENCHMARK
STATISTICS

Contents
� Sample of Report ND 204
� Description of ND 204
� Advantage of ND 204
� Analyze (Examples) of ND 204
� Information

Description
� This Report shows BSC wise KPI’s and PI’s.
� SDCCH Failure, TCH Failure, SDCCH Drop, TCH Drop, TCH
Traffic, TCH Codecs, HO Causes, HO Success and Failure, RX-
Quality , …
� We can find in a look that which part has problem: for Example
if A-interface or ABIS interface has problem, we can see
immediately in this report.

SDCCH Channel
TCH Channel

TCH Codec Versions

Handovers

Handover Causes

UL, DL QUALITY/LEVEL DISTRIBUTION

UL, DL QUALITY DISTRIBUTION PER CODEC

Expeirence: Transcoder Fail in B026N

UL, DL QUALITY DISTRIBUTION PER CODEC

Expeirence: CSSR Problem in B067N
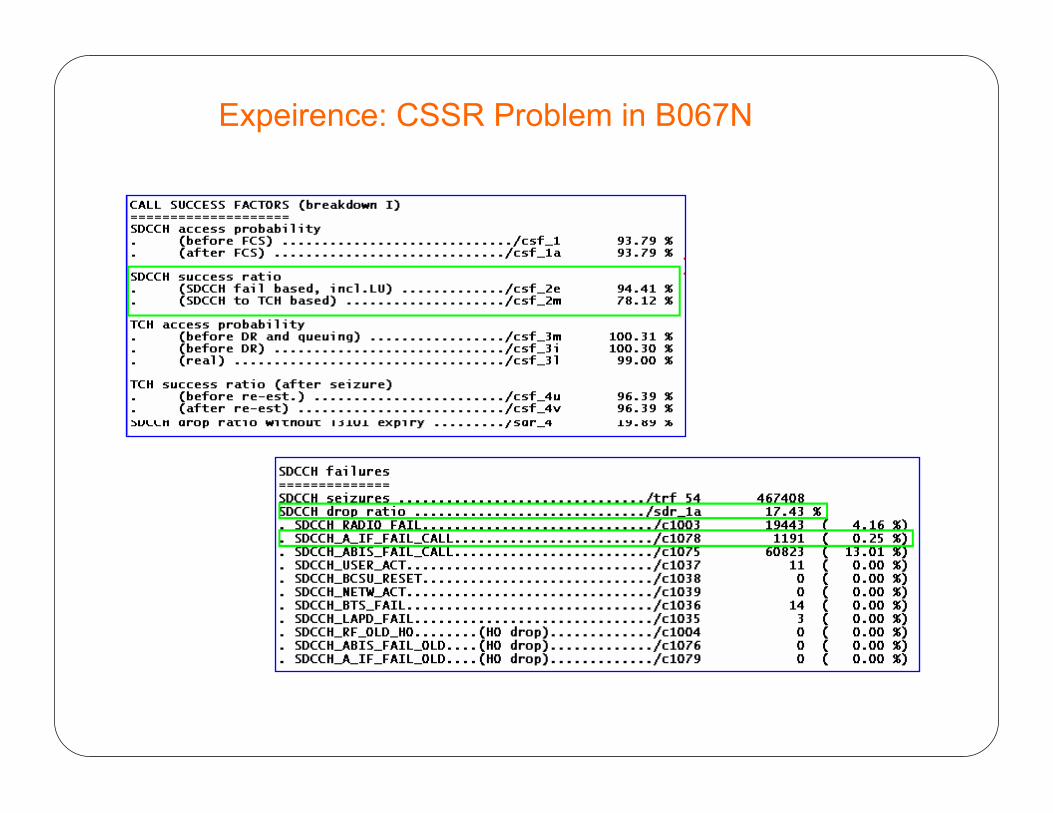
Expeirence: CSSR Problem in B067N
ND Report-073:
Undefined Adjacent
Cells

Contents
1. SAMPLE OF REPORT
2. DESCRIPTION
3. ADVANTAGE
4. ANALYS
5. EXPERIENCES
6. INFORMATION

Sample of Report 073

Description of Report 073
� NCC Nework Colour Code of UAC.
� BCC Base Sation Colour Code of UAC.
� BCCH BCCH carrier number (ARFN) of UAC.
� Per dura Average period duration.
� Nbr of per Number of periods.
� Nbr of samples Nbr of samples for calculating the average
DL signal strength (*100).
� Avg DL sig str Average DL signal strength received from UAC.
� Sort factor Sorting factor (average level)/1000

Advantage of Report 073
� This report can be used to check the network plan for
adjacencies,complete analyzation rep 153 and check
interference.

Analyze of Report 073
� This report gives all undefined adjacent cells UAC (cells measured by MS but not defined as neighbour of the serving cell) for all BTSs in the selected area.
� If "Active BA list = adjacent cell definitions) or If "Active BA list = idle BA list = 0" (active BA list = adj. cell definitions), BSC uses adj. cell definitions when it matches the BA indexes and the BCCH. If "Active BA list = idle BA list = list 1", BSC uses "list 1" when it matches the BA indexes and the BCCH.
� Undefined cells measurement is an optional feature in the BSC.
� UACs with good signal strength and large number of samples are important.
� Other reports that can be used to check the network plan for adjacencies are 070,071,072,074,075.

Analyze of Report 073
BCCH=BCCH of DAC
BSIC<>aa
Undefined adj cells (UAC)
Serving cellBA List=A
BCCH<>one freq of A
Rep 073 can give this UAC
Defined adj cell (DAC)BCCH=one freq of A
BSIC=aa
BCCH=BCCH of DAC
BSIC=aa
Rep 073 can not give this UAC but Rep 153 can show HO fail in this BCCH
MS can not measure this cellRep 073 can not give this UAC

Experiences
� 1)N2254C - sample that indicates problem in neighbour definition and
interference in BCCH frequency
� 2)NM861B - sample that indicates sector swap
� 3)N2255A - sample that is not important
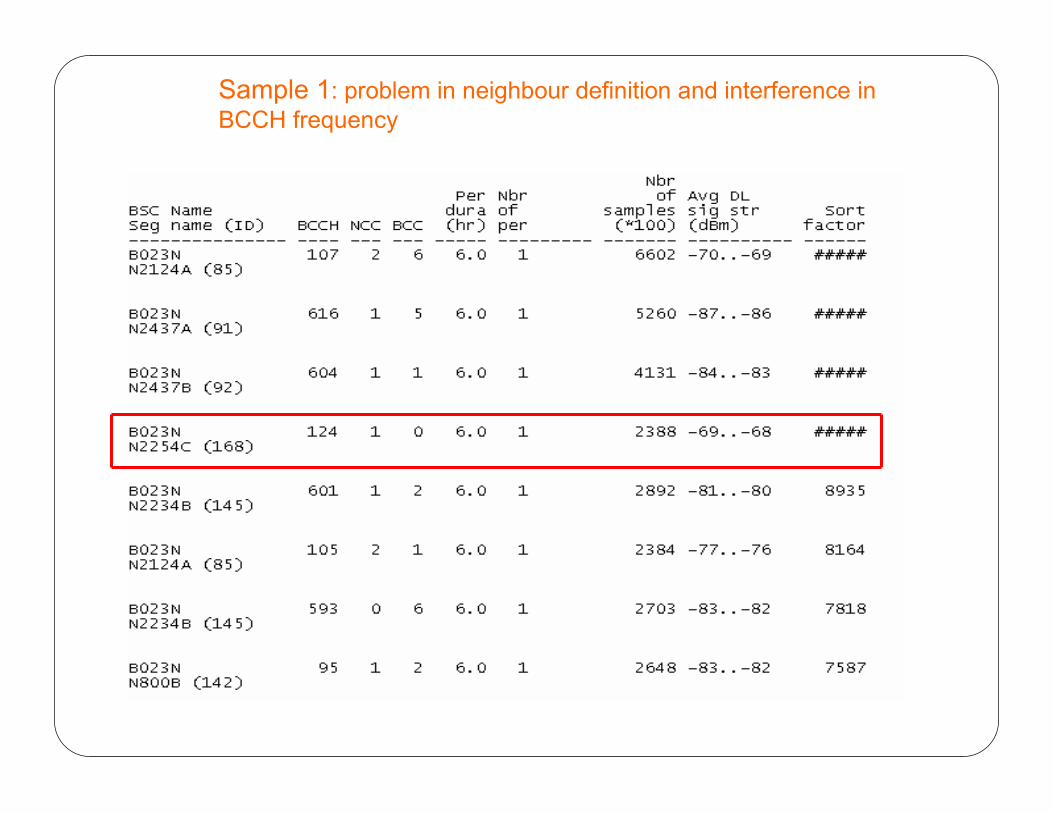
Sample 1: problem in neighbour definition and interference in
BCCH frequency

Sample 1: problem in neighbour definition and interference in
BCCH frequency
UAC: N254A
BCCH=124,BSIC=10
Serving cell:
N2254C
DAC: N097C
BCCH=124,BSIC=16

Sample 1: Neighbours of N2254C (EAO)
41107N694BBTS-168 N2254CB023N
01119N694ABTS-168 N2254CB023N
41123N261CBTS-168 N2254CB023N
72113N254CBTS-168 N2254CB023N
62117N254BBTS-168 N2254CB023N
61607N2460BBTS-168 N2254CB023N
31608N2261CBTS-168 N2254CB023N
61599N2254BBTS-168 N2254CB023N
11603N2254ABTS-168 N2254CB023N
21590N2124BBTS-168 N2254CB023N
21605N2124ABTS-168 N2254CB023N
41587N2097CBTS-168 N2254CB023N
77606N2048CBTS-168 N2254CB023N
11613N2048BBTS-168 N2254CB023N
32116N124BBTS-168 N2254CB023N
62108N124ABTS-168 N2254CB023N
72110N1161CBTS-168 N2254CB023N
61124N097CBTS-168 N2254CB023N
BCCNCCFREQNeighbourSource BTSBSC

Sample 1: Find BCCH=124,BSIC=10 from parameter general cell
10124BTS-030 N435BB021N
10124BTS-024 N254AB023N
BSICBCCHBTSBSC

Sample 1: problem in neighbour definition and interference in
BCCH frequency
N097C Defined adj cell
BCCH=124 BSIC=16
N254A Undefined adj cell
BCCH=124 BSIC=10
Serving cell
N2254C

Sample 2 : problem in hardware (sector swap) but not in neighbour
definition

Sample 2 : problem in hardware (sector swap) but not in neighbour
definition
GC site
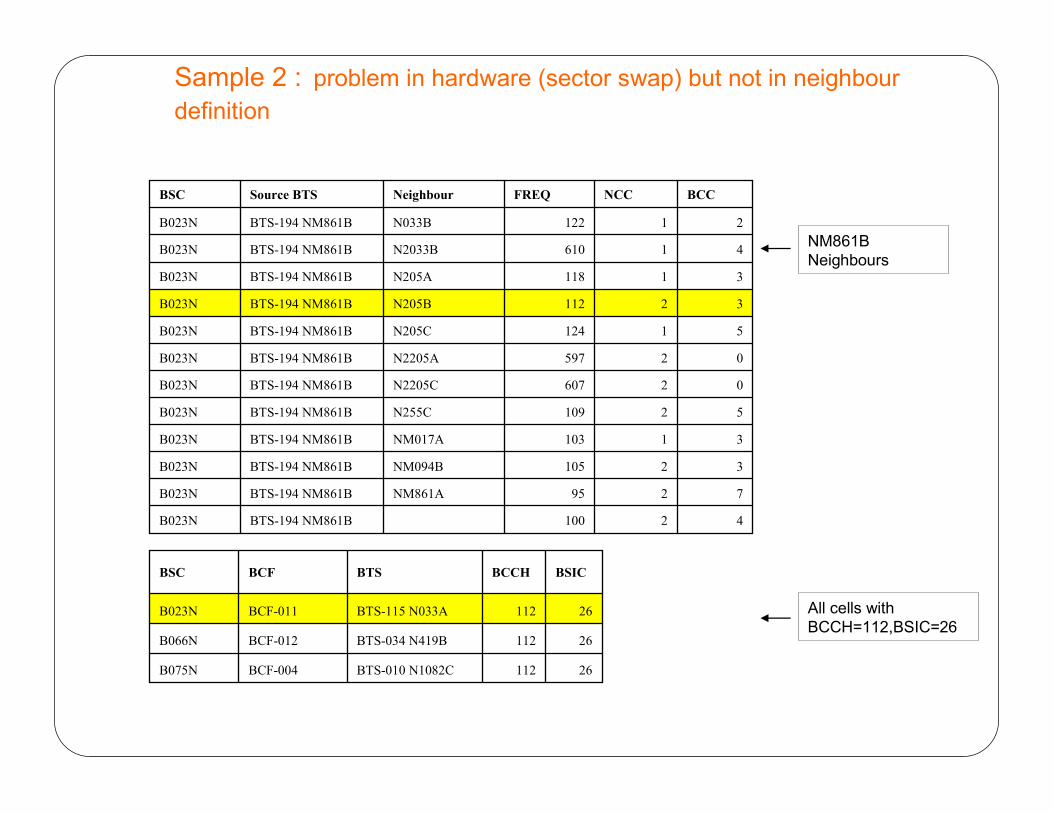
Sample 2 : problem in hardware (sector swap) but not in neighbour
definition
26112BTS-010 N1082CBCF-004B075N
26112BTS-034 N419BBCF-012B066N
26112BTS-115 N033ABCF-011B023N
BSICBCCHBTSBCFBSC
42100BTS-194 NM861BB023N
7295NM861ABTS-194 NM861BB023N
32105NM094BBTS-194 NM861BB023N
31103NM017ABTS-194 NM861BB023N
52109N255CBTS-194 NM861BB023N
02607N2205CBTS-194 NM861BB023N
02597N2205ABTS-194 NM861BB023N
51124N205CBTS-194 NM861BB023N
32112N205BBTS-194 NM861BB023N
31118N205ABTS-194 NM861BB023N
41610N2033BBTS-194 NM861BB023N
21122N033BBTS-194 NM861BB023N
BCCNCCFREQNeighbourSource BTSBSC
NM861B
Neighbours
All cells with
BCCH=112,BSIC=26

Sample 2 : problem in hardware (sector swap) but not in neighbour definition
() 00000000NM861B B023N
BSC (####140705213000000NM861B B023N
B023NM094B227275215000000NM861B B023N
B023N205B 230975215000000NM861B B023N
B023N2205A4309752152500000NM861B B023N
B023N205A 13097521530335002NM861B B023N
B023N2205C63097521562152320141NM861B B023N
B023N205C 3309752157752390143NM861B B023N
B023NM017A166735215219724339360NM861B B023N
B023N033B 2215352151139192101826NM861B B023N
B023N2033B5215352157358341102692NM861B B023N
B023NM861A16092521519321471716536NM861B B023N
Target BSCTarget CellCILACATTBLKFAILFAILBLKATTSource CellBSC ID

Sample 2 : problem in hardware (sector swap) but not in neighbour
definition
Sector swap in NM861A,B

Sample 3 : There is no problem in neighbour definition

Sample 3 : There is no problem in neighbour definition

N2255A
Neighbours
Sample 3 : There is no problem in neighbour definition

B023N234C 32147521500010001N2255A B023N
B023N694A 1280952150002005N2255A B023N
B023N254C 35207521524171511018N2255A B023N
B023N2694A42809521500011358N2255A B023N
B023N254A 1520752155390460109N2255A B023N
B021N560B 22726521000050254N2255A B023N
B021N2560B527265210000224479N2255A B023N
B023N1161B230335215132721310751N2255A B023N
B023N255B 252105215298115430883N2255A B023N
B023N255C 3521052152293165901082N2255A B023N
B023N1161A1303352152892203101303N2255A B023N
B023N124C 3215952152325152301847N2255A B023N
B023N124B 2215952153772173102612N2255A B023N
B021N2422B5522752100003553026N2255A B023N
B023N2255C65210521565157411683583N2255A B023N
B023N2255B552105215143818613787434N2255A B023N
B023N2124B52159521559707621758882N2255A B023N
B023N255A 1521052152254422213013884N2255A B023N
Target BSCTarget CellCILACATTBLKFAILFAILBLKATTSource CellBSC ID
Sample 3 : There is no problem in neighbour definition

Call Setup Scenario:
ND Reports & Formulas
Contents
1. Call Setup Scenario in MOC
2. ND formulas for Call Success
3. ND Reports for Call Success
4. MCI Formulas in KPI
5. Information

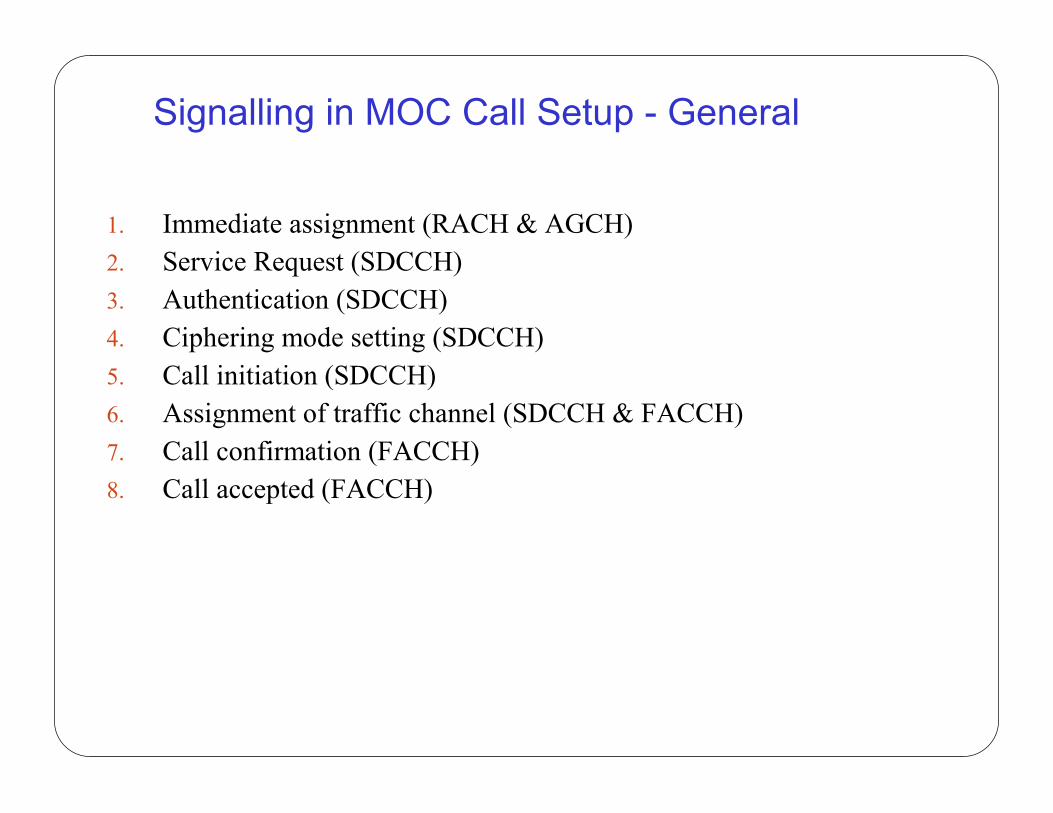
Signalling in MOC Call Setup - General
1. Immediate assignment (RACH & AGCH)
2. Service Request (SDCCH)
3. Authentication (SDCCH)
4. Ciphering mode setting (SDCCH)
5. Call initiation (SDCCH)
6. Assignment of traffic channel (SDCCH & FACCH)
7. Call confirmation (FACCH)
8. Call accepted (FACCH)

Signalling in MOC Call Setup - 1

Signalling in MOC Call Setup - 2

Signalling in MOC Call Setup - 3

Signalling in MOC Call Setup - 4

Signalling in MOC Call Setup - 5
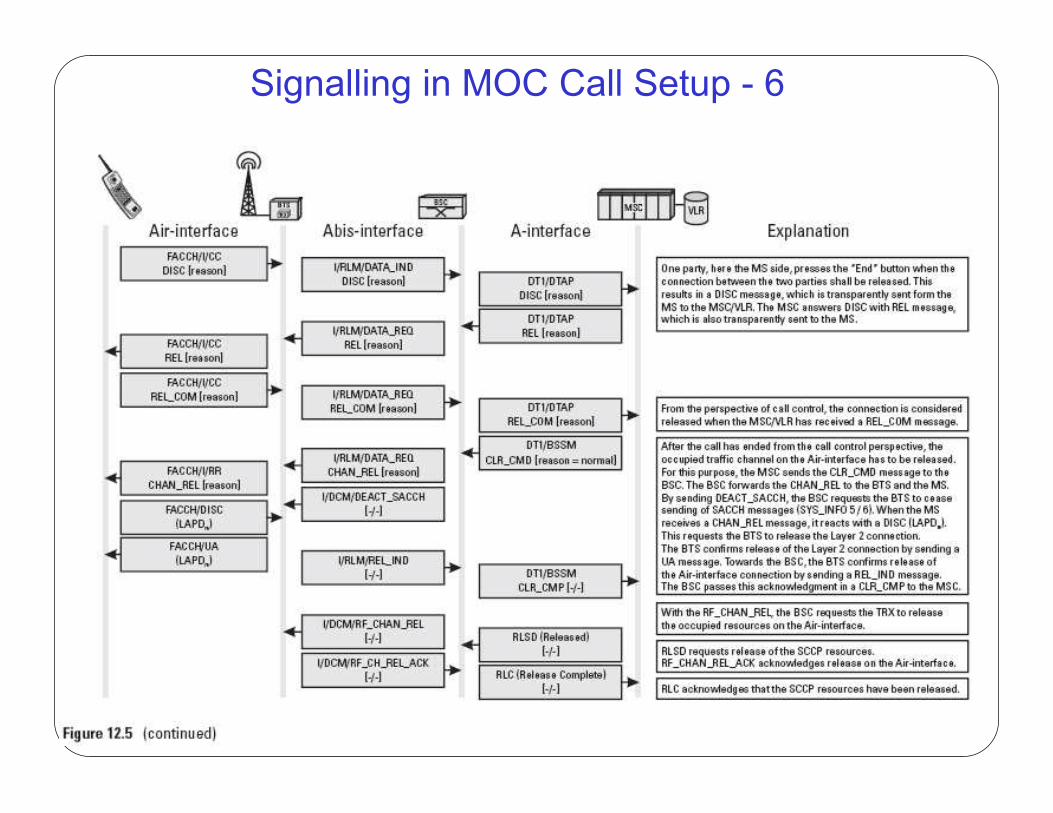
Signalling in MOC Call Setup - 6

Signalling in MOC Call Setup - 7

Signalling in MOC Call Setup - 8

Signalling in MOC Call Setup - 9
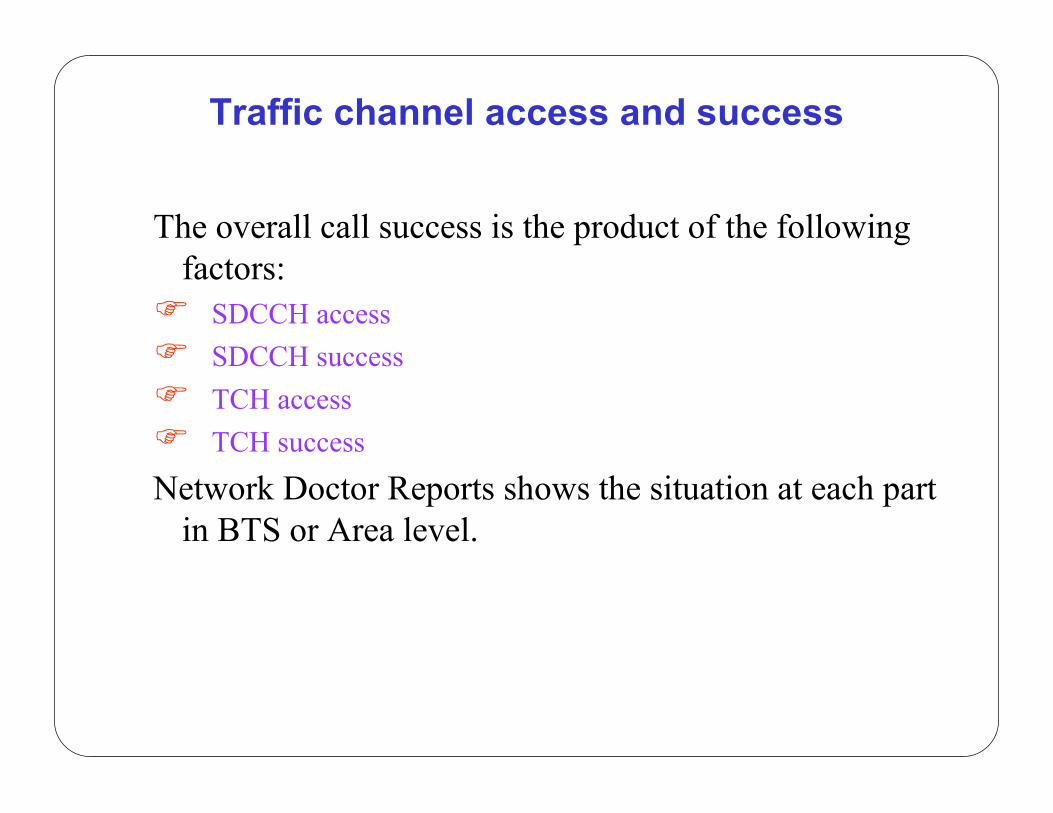
Traffic channel access and success
The overall call success is the product of the following
factors:
� SDCCH access
� SDCCH success
� TCH access
� TCH success
Network Doctor Reports shows the situation at each part
in BTS or Area level.

ND Formulas for Call Success
� csf_1 (SDCCH access probability, before FCS)
� csf_1a (SDCCH access probability, after FCS)
� csf_2a (SDCCH success ratio)
� csf_2e (SDCCH success ratio)
� csf_2j (SDCCH success ratio)
� csf_2m (SDCCH success ratio)
� csf_2n (SDCCH success ratio)
� csf_3i (TCH access probability without DR)
� csf_3l (TCH access probability, real)
� csf_3m (TCH access probability without DR and Q)
� csf_4u (TCH success ratio, area, before call re-establishment)
� csf_4x (TCH success ratio, BTS, after call re-establishment)
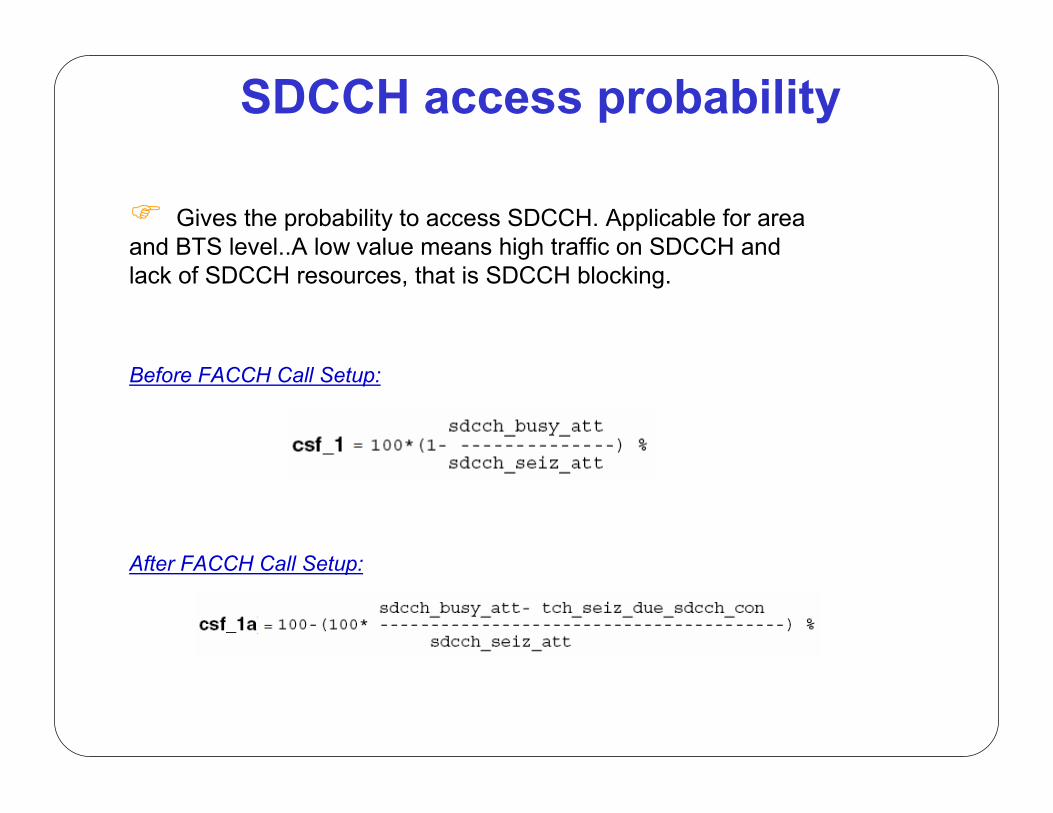
SDCCH access probability
� Gives the probability to access SDCCH. Applicable for area
and BTS level..A low value means high traffic on SDCCH and
lack of SDCCH resources, that is SDCCH blocking.
Before FACCH Call Setup:
After FACCH Call Setup:

SDCCH success ratio
� The formula does not separate the SDCCH call seizures from other
seizures (such as LU). The failure rate in the case of a call or LU can greatly
differ from one another, wherefore you cannot use this formula for SDCCH
call success ratio calculation.
� It is not exactly known how large a share of sum (sdcch_abis_fail_call +
sdcch_abis_fail_old) really are setup failures. Most of them are because of
Ghosts.
� The best values seen are around 98%.

SDCCH success ratio
� Includes A interface blocking.
� Suitable for BTS level.

TCH access probability
� This PI indicates what would be the TCH blocking if DR was not used.
� Does not contain the congestion of the A interface circuit pool.

TCH success ratio
Before Re-Establishment:
After Re-Establishment:

ND Reports for Call Setup
� ND Report 250

ND Reports for Call Setup
� ND Report 251
� We can use different formulas for Reports 250 &
251(csf_1, csf_1a and so on)

ND Reports for Call Setup
� ND Report 207This report provides 10-day profiles of the indicators listed below.
- SDCCH availability
- SDCCH usage
- TCH availability
- TCH usage
- TCH traffic
- SDCCH access probability
- SDCCH success ratio
- TCH access probability
- TCH success ratio

ND Reports for Call Setup
� ND Report 207

ND Reports for Call Setup
� ND Report 204

ND Report 130 – SDCCH Congestion

ND Report 135 – TCH Congestion
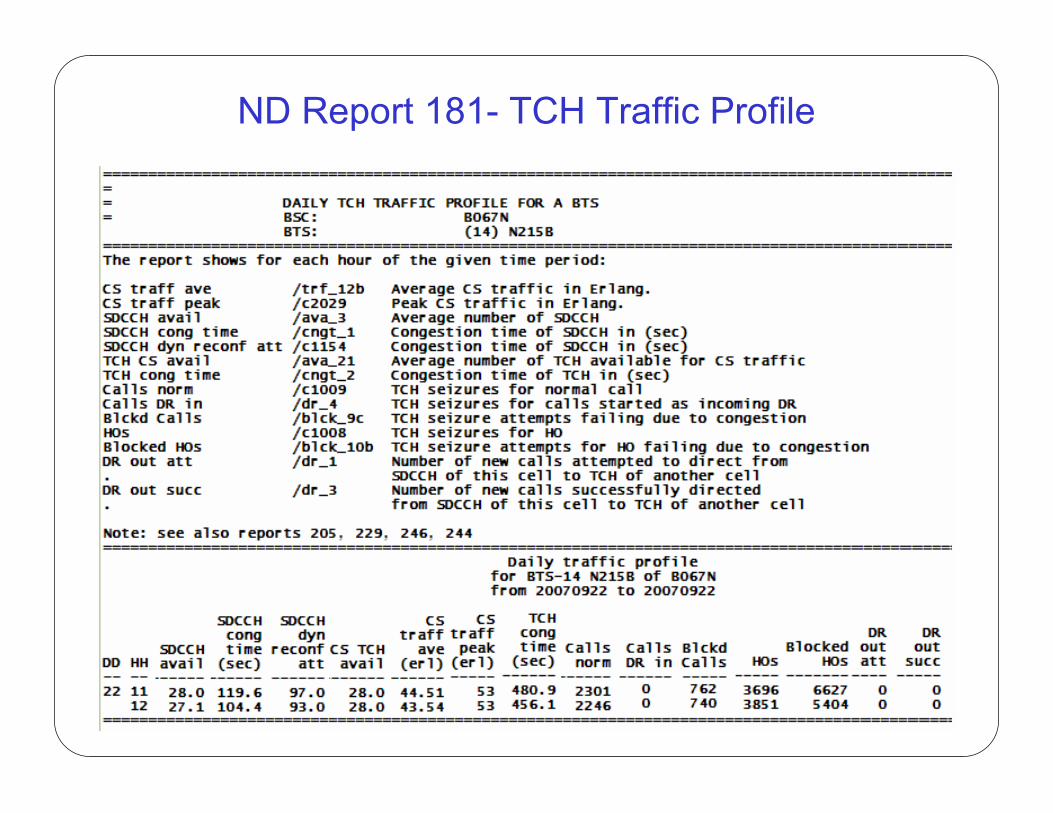
ND Report 181- TCH Traffic Profile

Formula

Formula

SDCCH Congestion formula in MCI KPI
100*(SDCCH_BUSY_ATT - TCH_SEIZ_DUE_SDCCH_CONG) / SDCCH_SEIZ_ATTSDCCH cong
SDCCH Congestion = (1 – SDCCH access probability)*100 =100- csf_1a

CSSR formula in MCI KPI
(100-SDCCH Cong) *(TCH_NEW_CALL_ASSIGN+TCH_RE_EST_ASSIGN-BSC_I_SDCCH_TCH-
MSC_I_SDCCH_TCH+MSC_O_SDCCH_TCH+BSC_O_SDCCH_TCH) /
(SDCCH_RE_EST_ASSIGN+SDCCH_NEW_CALL_ASSIGN-SDCCH_SMS_ASSIGN)
CSSR
CSSR= (SDCCH Access Probability) * (SDCCH Success Probability) *
(TCH Access Probability) = csf_1a * csf_2a * csf_3

ND formulas for performance evaluation
� Nokia defined several formulas for Call Success
factors (SDCCH & TCH). So Optimisation engineers
can investigate performance of several network
elements and features. For example, we can see the
effect of Directed Retry or Queuing features on Call
Setup Success Rate.


![Caltech CS184b Winter2001 -- DeHon 1 CS184b: Computer Architecture [Single Threaded Architecture: abstractions, quantification, and optimizations] Day7:](https://static.fdocuments.in/doc/165x107/5a4d1b897f8b9ab0599bde20/caltech-cs184b-winter2001-dehon-1-cs184b-computer-architecture-single-threaded.jpg)
