76120498 7579509 TN 182 Design Process Using Adapt Builder Platform
22
Technical Note Structural Concrete Software System E-Mail [email protected] 1733 Woodside Road, Suite 220, Redwood City, California, 94061, USA, Tel: (650) 306-2400 Fax (650) 364-4678 TN 182 Builder_design_process_12 111404 DESIGN PROCESS USING ADAPT-BUILDER PLATFORM Update November 13, 2004 This Technical Note walks you through the steps you would follow in design of a post-tensioned floor system, using ADAP-Builder platform. The example given utilizes the capability of ADAPT-PT (Equivalent Frame Method) to obtain an optimized design, followed by the additional capability of ADAPT-Floor Pro, for an overall analysis and creation of structural drawings. It concludes with an excerpt of the report you would be generating for submittal to building officials. The steps are as follows: • Modeling • Starting with a DWG file from the architect, import the architect’s drawing into ADAPT- Builder; • Using the transformation capabilities of the program, convert the entities of the imported DWG into Structural Components, such as columns and walls; • Apply loads. The program automatically generates the load combinations. • Using the automatic/manual design strip generation capabilities of the program, create Support Lines, and subdivide the structure into Design Strips. in orthogonal directions. • Determination of Optimum Post-Tensioning – ADAPT-PT This is an optional step, if you want to obtain an economical design for the post-tensioning. ADAPT-PT enables you to determine the least amount of post-tensioning that meets the code and your specific requirements. • Select the design strips one by one, view and export them to ADAPT-PT; • Using the optimization of ADAPT-PT determine the amount of post-tensioning force (number of strands) and their profile; • Obtain reports for tendon profile and the associated reinforcement. The design could be concluded at this stage. The reports obtained from ADAPT-PT are adequate to generate a complete set of structural drawings. However, for an overall design of the entire floor system and automatic generation of structural drawings you continue with ADAPT-Floor Pro. • Obtain a Finite Element design using Floor-Pro • Mesh the floor system; • Obtain a finite element solution; • Perform an automatic code check and rebar calculation; • Modify the post-tensioning layout, if the automatic code check reveals deficiency in design. The building project (Fig. 1) used to outline the design process is a nine story post-tensioned residential building on two levels of post-tensioned underground parking. It is located in San Francisco Bay Area within the zone of highest seismic risk zone of California. The floor system of the project was designed using a flat slab construction reinforced with unbonded post-tensioning system . The lateral
-
Upload
mahmoud-hamdy-badawy -
Category
Documents
-
view
42 -
download
1
Transcript of 76120498 7579509 TN 182 Design Process Using Adapt Builder Platform

Technical Note Structural Concrete Software System
E-Mail [email protected] 1733 Woodside Road, Suite 220, Redwood City, California, 94061, USA, Tel: (650) 306-2400 Fax (650) 364-4678
TN 182 Builder_design_process_12 111404
DESIGN PROCESS USING ADAPT-BUILDER PLATFORM
Update November 13, 2004 This Technical Note walks you through the steps you would follow in design of a post-tensioned floor system, using ADAP-Builder platform. The example given utilizes the capability of ADAPT-PT (Equivalent Frame Method) to obtain an optimized design, followed by the additional capability of ADAPT-Floor Pro, for an overall analysis and creation of structural drawings. It concludes with an excerpt of the report you would be generating for submittal to building officials. The steps are as follows:
• Modeling • Starting with a DWG file from the architect, import the architect’s drawing into ADAPT-
Builder; • Using the transformation capabilities of the program, convert the entities of the imported
DWG into Structural Components, such as columns and walls; • Apply loads. The program automatically generates the load combinations. • Using the automatic/manual design strip generation capabilities of the program, create
Support Lines, and subdivide the structure into Design Strips. in orthogonal directions.
• Determination of Optimum Post-Tensioning – ADAPT-PT This is an optional step, if you want to obtain an economical design for the post-tensioning. ADAPT-PT enables you to determine the least amount of post-tensioning that meets the code and your specific requirements.
• Select the design strips one by one, view and export them to ADAPT-PT; • Using the optimization of ADAPT-PT determine the amount of post-tensioning force (number
of strands) and their profile; • Obtain reports for tendon profile and the associated reinforcement.
The design could be concluded at this stage. The reports obtained from ADAPT-PT are adequate to generate a complete set of structural drawings. However, for an overall design of the entire floor system and automatic generation of structural drawings you continue with ADAPT-Floor Pro.
• Obtain a Finite Element design using Floor-Pro
• Mesh the floor system; • Obtain a finite element solution; • Perform an automatic code check and rebar calculation; • Modify the post-tensioning layout, if the automatic code check reveals deficiency in design.
The building project (Fig. 1) used to outline the design process is a nine story post-tensioned residential building on two levels of post-tensioned underground parking. It is located in San Francisco Bay Area within the zone of highest seismic risk zone of California. The floor system of the project was designed using a flat slab construction reinforced with unbonded post-tensioning system . The lateral

Technical Note
Copyright © 2004 ADAPT Corporation
2
force resisting system of the building was provided by a suitable arrangement of shear walls. The building is one of several towers of similar construction at the same location.
FIGURE 1 ELEVATION OF TAYLOR TOWER UNDER CONSTRUCTION
FIGURE 2 TENDON LAYOUT OF ONE OF THE FLOORS

Technical Note
Copyright © 2004 ADAPT Corporation
3
Start with the AutoCAD drawing (Fig. 3) of one of the floor plans and import it into ADAPT. Use the MODELER features of the program to transform the entities of the architect’s drawings into structural components (Figs. 4, 5). Apply loads (Fig. 6). Select areas of different load application, such as balconies and corridors with click of the mouse and specify the load applicable to each. Depending on the design code you select, such as ACI-99, ACI-2002, BS, EC2, the program automatically generated the appropriate load combinations (Fig. 7). In addition to the automatically generated load combinations, you can request solutions for load cases or combinations of your choice.
FIGURE 3 VIEW OF THE AUTOCAD DRAWING OF A TYPICAL FLOOR

Technical Note
Copyright © 2004 ADAPT Corporation
4
FIGURE 4 THE FLOOR SYSTEM IS IMPORTED INTO ADAPT MODELER USING THE PROGRAM’S TRANSFORMATION TOOLS
FIGURE 5 THREE DIMENSIONAL VIEW OF FLOOR SLAB AND SUPPORTS IN ADAPT-MODELER

Technical Note
Copyright © 2004 ADAPT Corporation
5
FIGURE 6 VIEW OF APPLIED LOADING
FIGURE 7 LOAD COMBINATIONS DIALOG WINDOW

Technical Note
Copyright © 2004 ADAPT Corporation
6
Next, either through the program’s Support Line wizard, or manually you generate the Support Lines in each of the two principal direction (Figs. 8 and 9). Once the Support Lines are selected, the program automatically calculates the tributary associated with each support line and breaks the structure into Design Strips. Figures 10 and 11 display the automatically generated Design Strips.
FIGURE 8 SELECT SUPPORT LINES IN X-DIRECTION
FIGURE 9 SELECT SUPPORT LINES IN Y-DIRECTION

Technical Note
Copyright © 2004 ADAPT Corporation
7
FIGURE 10 AUTOMATICALLY GENERATES DESIGN STRIPS IN Y-Y DIRECTION
FIGURE 11 AUTOMATICALLY GENERATES DESIGN
STRIPS IN X-X DIRECTION

Technical Note
Copyright © 2004 ADAPT Corporation
8
At this stage, two design options are available, namely the Equivalent Frame Method (ADAPT-PT), or the Finite Element Method (FLOOR-Pro). The Equivalent Frame Method is the natural choice for design optimization, and will be described next, followed by the Finite Element Method. EQUIVALENT FRAME METHOD DESIGN – ADAPT-PT Select the design strips one after the other, and proceed with the design. In the following the design strip in Y-Y direction at center of the slab will be selected (Fig. 12). When you select a Design Strip for Equivalent Frame Analysis by ADAPT-PT, the program displays the idealization of that support line in a three dimensional view. Figure 13 is the display of the Design Strip for the selected Support Line in the Y-direction. Note that the idealized Design Strip recognizes the specific geometry features of the structure, such as a cut out due to presence of an opening , or the extension of the slab between two openings. The display of the idealized Design Strip is accompanied by a group of reporting/editing tools on the right hand side of screen (Fig. 14). Each of these tools opens up a text report on one of the aspects of the idealized design strip – such a report on slab dimensions, support dimensions, or loading. If reduction of live loading is requested by you, the tools also display the reduction value calculated for each span.
FIGURE 12 SUPPPORT LINE AT SLAB CENTER IS SELECTED FOR
EQUIVALENT FRAME DESIGN

Technical Note
Copyright © 2004 ADAPT Corporation
9
FIGURE 13 IDEALIZED DESIGN STRIP FOR ANALYSIS AND DESIGN USING THE EQUIVALENT FRAME METHOD
FIGURE 14 IDEALIZED DESIGN STRIP ALONG WITH TOOLS ON THE RIGHT OF THE SCREEN FOR VIEW/EDITING OF THE DESIGN STRIP PROPERTIES

Technical Note
Copyright © 2004 ADAPT Corporation
10
Click on the tool for export to ADAPT-PT, and the program automatically calls ADAPT-PT with the entire information of the Design Strip already loaded in the program. As an example, Fig. 15 shows the span geometry of ADAPT-PT program. The span lengths, tributaries and the remainder of the information displayed is automatically generated by the program. There is no need for you to enter span length or the width of any span. Apart from a significant saving in time, the automatic detection and entry of the input values eliminates potential user errors.
FIGURE 15 ADAPT-PT SCREEN FOR INPUT OF SPAN GEOMETRY
A great advantages of creating the input data for ADAPT-PT through the Modeler features of Builder Platform described in the preceding is the automatic generation of applied loads for the design strip (Fig. 16). Regardless of the complexity of the original slab, or its loading – be it concentrated, line or patch load, the program automatically determines the portion of the applicable load for the equivalent frame design and lists it in the load table of ADAPT-PT (Fig. 16). Obviously, apart from viewing, you can edit each of the load entries, delete or add new load to the table. Tendon shapes will be automatically exported to ADAPT-PT, but you have the option to view and edit them (Fig. 17).

Technical Note
Copyright © 2004 ADAPT Corporation
11
FIGURE 16 AUTOMATICALLY GENERATED LOAD TABLE OF ADAPT-PT
FIGURE 17 INPLUT SCREEN FOR SELECTION OF TENDON SHAPES

Technical Note
Copyright © 2004 ADAPT Corporation
12
Using the requirements of the building code selected by you, and other restrictions that as part of input data, you impose – such as the minimum and maximum amount of dead load you wish the program to balance, the program obtains a solution and displays its critical information on the screen (Fig. 18). The display is both in form of an interactive tabular and graphical forms (Figs. 18 and 19). Apart from tendon profile and force determined by the program, other critical information such as stress levels, required post-tensioning and percentage of dead load balanced, enable you to adjust the force and profile to optimum values. Each adjustment by you is followed by an automatic background calculation by the program and display of new design values on the screen. The total weight of prestressing needed for the parameters selected by program or you is continuously updated by the program and displayed at the top of the screen.
FIGURE 18 DISPLAY OF PROPOSED SOLUTION BY ADAPT-PT
FIGURE 19 VIEW OF TENDON PROFILE, CALCULATED AND ALLOWABLE STRESSES AND CALCULATED/EQUIRED PRESTRESSING IN ADAPT-PT

Technical Note
Copyright © 2004 ADAPT Corporation
13
At conclusion of the design, the program generates a summary report (Fig. 20) showing the tendon profile within the outline of concrete slab/beam, force, drape and any reinforcement that must be added to supplement the post-tensioning provided. Detailed additional information is available in graphical form (Fig. 21), or in tabular form (Fig. 22).
FIGURE 20 SUMMARY REPORT OF REQUIRED POST-TENSIONING AND REBAR
FIGURE 21 GRAPHICAL DISPLAY OF ANALYSIS AND DESIGN VALUES

Technical Note
Copyright © 2004 ADAPT Corporation
14
FIGURE 22 EXCERPT FROM TABULAR (TEXT) REPORT GENERATED BY
THE PROGRAM (ADAPT-PT). FINITE ELEMENT ANALUSIS AND DESIGN – FLOOR-PRO Enter the post-tensioning tendons in the floor system, using either the outcome of ADAPT-PT design as a guide, or other considerations (Fig. 23). Wizards for automatic tendon generation of the program help you to streamline the input of post-tensioning. Convenient editing tools display the tendons within the outline of concrete in elevation and allow you to modify the profile to your liking.

Technical Note
Copyright © 2004 ADAPT Corporation
15
Use the automatic mesh generation of the program (Fig. 24) to create a set of well balanced quadrilateral finite elements over the entire floor system. Unlike most other finite element programs, FLOOR-PRO uses an adaptive mesher that patterns itself according to the details of the floor system and concludes with almost entirely with well-proportioned quadrilateral cells. If need be, you can use the user-friendly mesh editing capability of the program to create a finite element mesh, or edit the mesh generated by the program. To reduce the computation time, the program has the option of generating a sparse subdivision at locations away from the details (discontinuities) of the slab (Fig. 25)
FIGURE 23 THREE DIMENSIONAL VIEW OF TENDONS
FIGURE 24 ADAPTIVE QUADRILATERAL MESH GENERATED BY FLOOR-PRO

Technical Note
Copyright © 2004 ADAPT Corporation
16
FIGURE 25 ADAPTIVE MESH USING THE SPARSE MESHING OPTION
OF THE PROGRAM
Next, you click on the “Analyze Structure” tool and let the program perform a detailed finite element analysis for you, including solution for all load cases and automatic load combination. If there are prestressing tendons, the program has the unique feature that it breaks each tendon into multiple segments. Each segment is associated with the finite element cell through which it passes. This enable you to obtain an authentic solution for the post-tensioning in the slab, since the friction and seating loss in a tendon is faithfully modeled along its length.
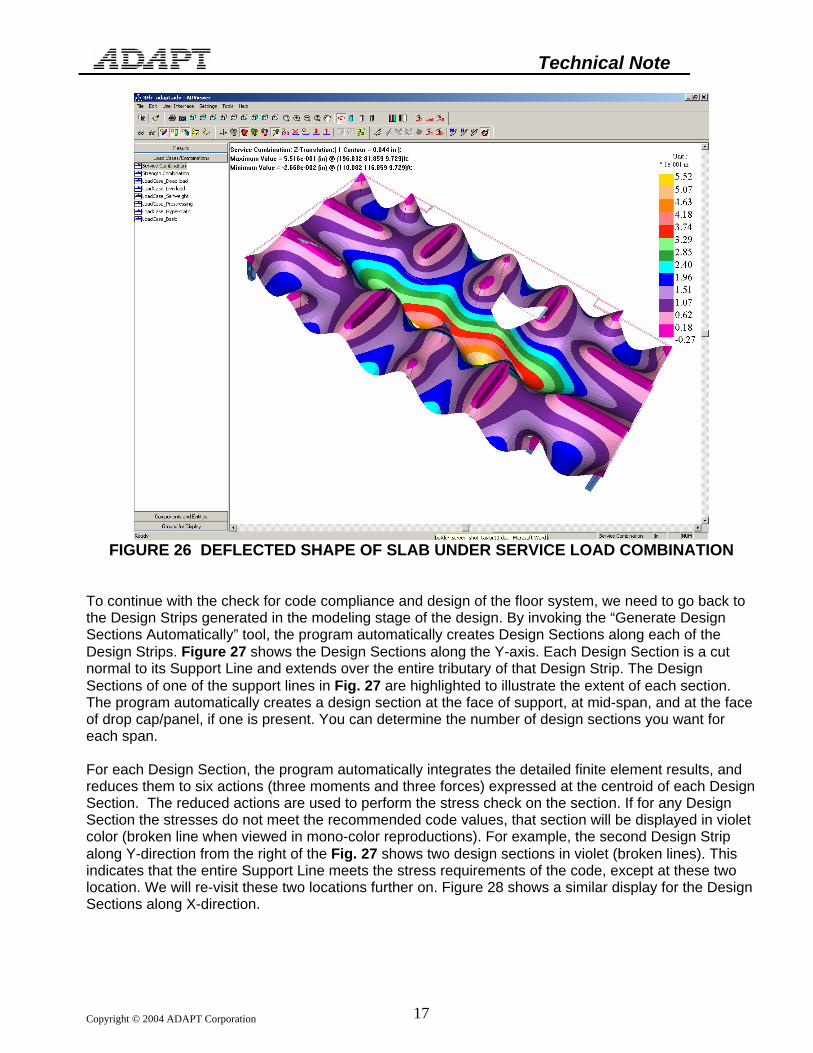
Hyperstatic (secondary) moments are automatically calculated and included in the design values. This is true for hyperstatic shear and axial forces too. The finite element solution generates all the contour and graphical images that general purpose finite element programs do. For your interest, and for developing a sense of satisfactory response of the slab to the loading, you may view contours of deflection, stresses at top and bottom fibers, moment contours, and many more colorful contours of the solution values. Figure 26 shows the contour of the deflected shape of the slab under service load combination.
Technical Note
Copyright © 2004 ADAPT Corporation
17
FIGURE 26 DEFLECTED SHAPE OF SLAB UNDER SERVICE LOAD COMBINATION
To continue with the check for code compliance and design of the floor system, we need to go back to the Design Strips generated in the modeling stage of the design. By invoking the “Generate Design Sections Automatically” tool, the program automatically creates Design Sections along each of the Design Strips. Figure 27 shows the Design Sections along the Y-axis. Each Design Section is a cut normal to its Support Line and extends over the entire tributary of that Design Strip. The Design Sections of one of the support lines in Fig. 27 are highlighted to illustrate the extent of each section. The program automatically creates a design section at the face of support, at mid-span, and at the face of drop cap/panel, if one is present. You can determine the number of design sections you want for each span. For each Design Section, the program automatically integrates the detailed finite element results, and reduces them to six actions (three moments and three forces) expressed at the centroid of each Design Section. The reduced actions are used to perform the stress check on the section. If for any Design Section the stresses do not meet the recommended code values, that section will be displayed in violet color (broken line when viewed in mono-color reproductions). For example, the second Design Strip along Y-direction from the right of the Fig. 27 shows two design sections in violet (broken lines). This indicates that the entire Support Line meets the stress requirements of the code, except at these two location. We will re-visit these two locations further on. Figure 28 shows a similar display for the Design Sections along X-direction.

Technical Note
Copyright © 2004 ADAPT Corporation
18
FIGURE 27 AUTOMATICALLY GENERATED DESIGN SECTIONS IN Y-DIRECTION
FIGURE 28 AUTOMATICALLY GENERATED DESIGN SECTIONS IN X-DIRECTION
You can request a graphical display of any of the six actions obtained for each Design Section along the length of the associated Design Strip. For example, Fig. 29 displays the design moments of the Design Sections for the Support Lines in Y-direction. Each ordinate of the moment diagram represents the total moment (integral) of the Design Section at the location of the ordinate. The moment diagram highlighted in red color is for the Support Line discussed previously, in which two of the sections at the face of the two walls failed the stress check.
You can ask the program to display the details of stress check for each of the Support Lines. The stress distribution for the Support Line highlighted in Fig. 29 is shown in Fig. 30. In this figure, the

Technical Note
Copyright © 2004 ADAPT Corporation
19
FIGUURE 29 DISTRIBUTION OF DESIGN MOMENTS ALONG THE SUPPORT LINES IN Y-
DIRECTION
distribution of top fiber stresses are shown ageist the background of allowable stress values. Tensile stresses are shown positive at the top and compressive stresses below the datum line with negative sign. Observe that in span 3, the stresses at the face of the wall exceed the allowable values (gray background) by a small value. Addition of one strand at along this Support Line, or reduction of tendon drapes on the adjacent spans is likely to remedy the reported deficiency.
FIGURE 30 DISTRIBUTION OF TOP FIBER STRESSES OF A SUPPORT LINE
AGAINST THE BACKGROUND OF ALLOWABLE STRESS VALUES
Technical Note
Copyright © 2004 ADAPT Corporation
20
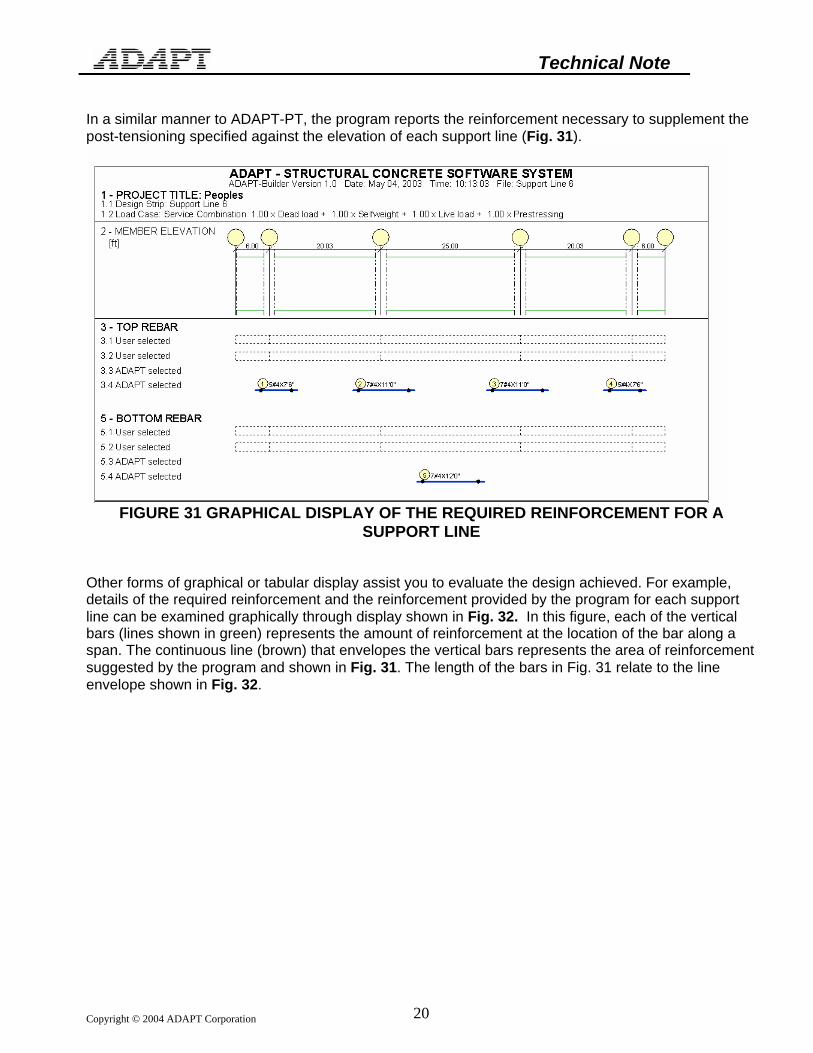
In a similar manner to ADAPT-PT, the program reports the reinforcement necessary to supplement the post-tensioning specified against the elevation of each support line (Fig. 31).
FIGURE 31 GRAPHICAL DISPLAY OF THE REQUIRED REINFORCEMENT FOR A
SUPPORT LINE Other forms of graphical or tabular display assist you to evaluate the design achieved. For example, details of the required reinforcement and the reinforcement provided by the program for each support line can be examined graphically through display shown in Fig. 32. In this figure, each of the vertical bars (lines shown in green) represents the amount of reinforcement at the location of the bar along a span. The continuous line (brown) that envelopes the vertical bars represents the area of reinforcement suggested by the program and shown in Fig. 31. The length of the bars in Fig. 31 relate to the line envelope shown in Fig. 32.

Technical Note
Copyright © 2004 ADAPT Corporation
21
-1
0
1
2
3
4
Span 1 Span 2 Span 3 Span 4 Span 5
Rebar DiagramsProject: Peoples / Support Line 6 / Load Case: Envelope
Reb
ar [i
n²]
Rebar Required Top Rebar Required Bottom
Rebar Provided Top Rebar Provided Bottom
FIGURE 32 BAR CHART SHOWING THE REQURIED AND PROVIDED REINFORCEMENT
OF A SUPPORT LINE
Another example of many graphical display options available to you is the distribution of the design moment for each support line (Fig. 33).
FIGURE 33 DISTRIBUTION OF DEISGN MOMENTS ALONG A SUPPORT LINE

Technical Note
Copyright © 2004 ADAPT Corporation
22
The following page shows a sample of a text report of the program. Details of the options for report generation of the program are given in a separate compilation. 160.20 LOWER COLUMNS
Strength Combination ID Label Fz Fr Fs Mrr Mss Mzz k k k k-ft k-ft k-ft
1 Column 1 -31.892 -0.000 0.000 31.259 45.294 -0.021 2 Column 2 -65.325 -0.000 0.000 -14.696 11.309 -0.032 3 Column 3 -86.260 0.000 0.000 11.753 -0.892 -0.043 4 Column 4 -65.314 0.000 -0.000 -15.093 -11.158 -0.090 5 Column 5 -31.932 -0.000 -0.000 31.572 -42.289 -0.070 6 Column 6 -127.216 0.000 0.000 63.861 -1.056 -0.040 7 Column 7 -130.095 0.000 0.000 -49.200 3.642 -0.045 8 Column 8 -31.914 -0.000 -0.000 -31.531 41.851 -0.066 9 Column 9 -65.346 0.000 -0.000 14.430 11.181 -0.115
10 Column 10 -87.305 0.000 0.000 -13.979 -0.249 -0.051 11 Column 11 -65.316 0.000 0.000 15.203 -10.273 -0.026 12 Column 12 -31.874 0.000 0.000 -31.860 -41.026 -0.023