.:7:2C,9/ :9=04:9 Soundings 14 2 32... · Bothma (1989) – i.e. N ... Road signs indicating...
6
Peter Cunningham Environment & Wildlife Consulting Namibia, P. O. Box 90717, Windhoek, Namibia. Email: [email protected] Common warthog (Phacochoerus africanus) occur throughout Namibia except the far south, southeast, arid west (i.e., Namib Desert), and the densely populated northcentral communal areas. Their Namibian conservation and legal status lists warthog as “secure and huntable game” (Griffin & Coetzee, 2005). Although seemingly ubiquitous, often alongside major roads where they are viewed as a nuisance to drivers, little has been published regarding their local ecology and/or numbers. During 2013, Namibia experienced a widespread drought with warthog lured to road verges with better grazing. Their numbers seemed astounding at times – e.g. 391 individuals on a 146 km stretch of the B1 highway between Okahandja and Otjiwarongo in central Namibia on 7 October 2013 between 17h00 and 19h00 (this study). Mean average annual rainfall for this area varies from 300 mm in the south (Okahandja area) to 450 mm in the north (Otjiwarongo area) mainly between January and April. Coefficient of variation in rainfall of 3040% (Mendelsohn et al., 2002) mainly between January and April. During the 2012/2013 rainy season these areas received between 100200 mm. Whilst travelling this route for other purposes, I kept note of warthog numbers along this section of the B1 Highway, including anthropomorphic activities potentially affecting warthog distribution. This note highlights some of these findings and although not attempted as a formal scientific study it does raise interesting questions. The Okahandja and Otjiwarongo route is termed the B1 Highway and is a tarmac road linking the north of Namibia to the capital – Windhoek – and the rest of the country. Warthog were counted, group size documented, and groups classified as adults, subadults and juveniles (although not sexed). This section of the B1 highway is freehold (commercial) cattle farming and fenced accordingly. A number of game farms with game proof fencing – jumping game – are also located along this route. The fences were classified as cattle fencing (either side); game fencing (game proof fencing either side), and mixed fencing (cattle and/or game proof fencing). As grass is often cut and baled by some farmers alongside the road the habitat was classified as cut, uncut, and road verge. Road verge was the ca. 2 m strip alongside the tarmac road. This was usually with short grass and maintained by local authorities to increase visibility to prevent wildlife related accidents. Data were collected on 8, 14 and 16 July; 8 and 9 September; 7 and 10 October, and 9 and 11 December 2013. The data were grouped as winter (July), spring (September and October), and summer (December). Observations were conducted either during early morning (07:0009:00 h) or late afternoon (17:0019:00 h). The road strip count formula of Bothma (1989) was used to determine warthog numbers – i.e. N = Nh/h, where N = number of warthog estimated in area, n = number of warthog on the strip, H =
Transcript of .:7:2C,9/ :9=04:9 Soundings 14 2 32... · Bothma (1989) – i.e. N ... Road signs indicating...

Suiform Soundings 1 4(2) 32
Ecology and
Conservation
Encounters with common warthogs along the B1 highway in north-central Namibia
Peter Cunningham
Environment & Wildlife Consulting Namibia, P. O. Box 90717, Windhoek, Namibia. Email: [email protected]
Introduction
Common warthog (Phacochoerus africanus) occur throughout Namibia except the far south,southeast, arid west (i.e., Namib Desert), and the densely populated northcentral communalareas. Their Namibian conservation and legal status lists warthog as “secure and huntablegame” (Griffin & Coetzee, 2005). Although seemingly ubiquitous, often alongside major roadswhere they are viewed as a nuisance to drivers, little has been published regarding their localecology and/or numbers.During 2013, Namibia experienced a widespread drought with warthog lured to road verges withbetter grazing. Their numbers seemed astounding at times – e.g. 391 individuals on a 146 kmstretch of the B1 highway between Okahandja and Otjiwarongo in central Namibia on 7 October2013 between 17h00 and 19h00 (this study). Mean average annual rainfall for this area variesfrom 300 mm in the south (Okahandja area) to 450 mm in the north (Otjiwarongo area) mainlybetween January and April. Coefficient of variation in rainfall of 3040% (Mendelsohn et al., 2002)mainly between January and April. During the 2012/2013 rainy season these areas receivedbetween 100200 mm.Whilst travelling this route for other purposes, I kept note of warthog numbers along this section ofthe B1 Highway, including anthropomorphic activities potentially affecting warthog distribution.This note highlights some of these findings and although not attempted as a formal scientificstudy it does raise interesting questions.
Methods
The Okahandja and Otjiwarongo route is termed the B1 Highway and is a tarmac road linking thenorth of Namibia to the capital – Windhoek – and the rest of the country.Warthog were counted, group size documented, and groups classified as adults, subadults andjuveniles (although not sexed).This section of the B1 highway is freehold (commercial) cattle farming and fenced accordingly. Anumber of game farms with game proof fencing – jumping game – are also located along thisroute. The fences were classified as cattle fencing (either side); game fencing (game prooffencing either side), and mixed fencing (cattle and/or game proof fencing).As grass is often cut and baled by some farmers alongside the road the habitat was classified ascut, uncut, and road verge. Road verge was the ca. 2 m strip alongside the tarmac road. Thiswas usually with short grass and maintained by local authorities to increase visibility to preventwildlife related accidents.Data were collected on 8, 14 and 16 July; 8 and 9 September; 7 and 10 October, and 9 and 11December 2013. The data were grouped as winter (July), spring (September and October), andsummer (December). Observations were conducted either during early morning (07:0009:00 h)or late afternoon (17:0019:00 h).The road strip count formula of Bothma (1989) was used to determine warthog numbers – i.e. N =Nh/h, where N = number of warthog estimated in area, n = number of warthog on the strip, H =
Suiform Soundings 1 4(2) 33
Ecology and
Conservation
surface area, and h = surface area of the counted strip.Strip length was 146 km and the strip width was 100 m. Strip width includes tarmac, road verge,boundary between road, and fence and visible area into veld. As the area is bush thickened(encroached), the strip width is small. The speed travelled was 120 km/h.Mean daily foraging distance for the common warthog in the Eastern Cape, South Africa, is 1,690± 347.5 m (Somers et al., 1994) while Clough & Hassam (1970) indicate 7 km as the distancetravelled per day in the Queen Elizabeth National Park, Uganda. These are however not straightlines. To determine warthog numbers, I used the surface area (H) (which is usually the size of afarm/ranch) as an arbitrarily 2.5 km strip along the length of the tarmac as the distance warthogpotentially travel to the roadside foraging area during a drought (i.e. 36,500 ha) and within therange of the above mentioned authors. The surface area of the strip (h) was 1,460 ha (i.e. 146km x 100 m).
Results
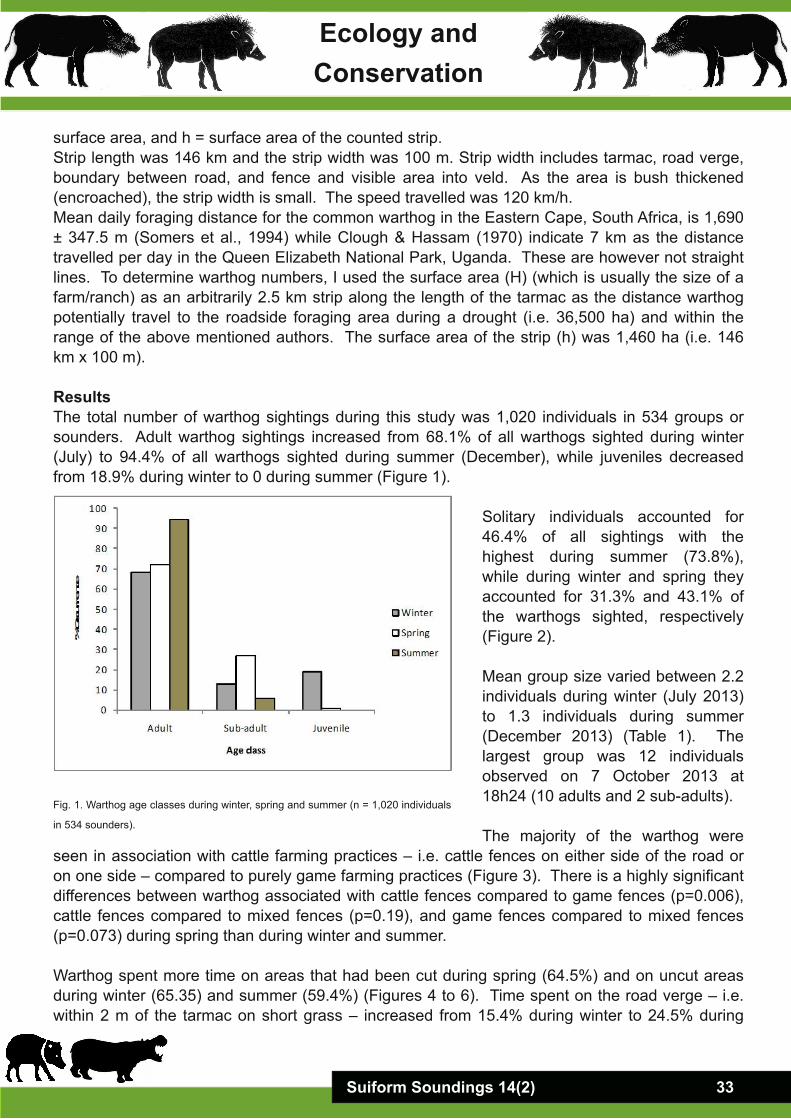
The total number of warthog sightings during this study was 1,020 individuals in 534 groups orsounders. Adult warthog sightings increased from 68.1% of all warthogs sighted during winter(July) to 94.4% of all warthogs sighted during summer (December), while juveniles decreasedfrom 18.9% during winter to 0 during summer (Figure 1).
Solitary individuals accounted for46.4% of all sightings with thehighest during summer (73.8%),while during winter and spring theyaccounted for 31.3% and 43.1% ofthe warthogs sighted, respectively(Figure 2).
Mean group size varied between 2.2individuals during winter (July 2013)to 1.3 individuals during summer(December 2013) (Table 1). Thelargest group was 12 individualsobserved on 7 October 2013 at18h24 (10 adults and 2 subadults).
The majority of the warthog wereseen in association with cattle farming practices – i.e. cattle fences on either side of the road oron one side – compared to purely game farming practices (Figure 3). There is a highly significantdifferences between warthog associated with cattle fences compared to game fences (p=0.006),cattle fences compared to mixed fences (p=0.19), and game fences compared to mixed fences(p=0.073) during spring than during winter and summer.
Warthog spent more time on areas that had been cut during spring (64.5%) and on uncut areasduring winter (65.35) and summer (59.4%) (Figures 4 to 6). Time spent on the road verge – i.e.within 2 m of the tarmac on short grass – increased from 15.4% during winter to 24.5% during
Fig. 1. Warthog age classes during winter, spring and summer (n = 1,020 individuals
in 534 sounders).

Suiform Soundings 1 4(2) 34
Ecology and
Conservation
spring and 34.3% during summer.There is a highly significantdifference between warthogassociated with cut areas comparedto uncut areas (p=0.003) duringspring (September/October), and nosignificant differences during winterand summer.
Density estimates were highestduring spring (September/October)with 4.05 warthog/km followed by1.95 warthog/km during July andlowest during December with 0.97warthog/km.
Table 2 indicateswarthog numbersusing the roadstrip countformula byBothma (1989) –
i.e. N = Nh/h (See methods). Themaximum number of warthog in the2.5 km strip along the route is14,800 during spring(September/October) and 1,075during summer (December).
Discussion
The major decrease in juvenilesightings from 54 individuals duringwinter (July) to 6 individuals duringspring (September/October) – i.e.
23 months later – and none duringsummer (December) are probably due tothe majority having succumbed as a resultof the drought and associated decline infemale body condition during this period
Fig. 2. Distribution of group size during winter (n = 128 sounders), spring (n = 299
sounders) and summer (n = 107 sounders).
Fig. 3. Warthog association with land use – i.e. fencing – in central
Namibia.
Fig. 4. Warthog association with
habitat in central Namibia.
Suiform Soundings 1 4(2) 35
Ecology and
Conservation
(pers. obs.) rather than them moving into thenext age class. Mason (1990) found droughtassociated mortality to be between 8090% inKwaZuluNatal in South Africa. Bradley (1968)reports a mortality rate of 50% during the first 6months of life in Kenya. Having probably beenborn during early 2013, the overall dryconditions experienced in central Namibiaduring the rainy season probably led toconsiderable mortality among juvenile warthogwith limited recruitment.
Group include up to 16 warthogs, but typicallynumber 5 or less (Estes, 1995). This is similar
to the findings of this study. Sightingsof solitary warthog during this studyaccounted for 46.4% of all sightings(n = 534 sounders). This is similar tothe Eastern Cape (Somers et al.1995) with 45% although differs fromZimbabwe with 27% (Cumming,1975). Groups of 1 or 2 individualsaccounted for 77.2% of all sightingswith only one group having more than6 individuals. Mean group size of2.22 during winter (July) is similar tothat by Somers et al. (1995) in theEastern Cape (2.2), but less than the3.3 given by Mason (1982) inKwaZuluNatal in South Africa. Meangroup sizes of 1.33 and 1.98 duringsummer (December) and spring (September/October) is less, but probably as a result of thedrought conditions experienced during this study.The strong association of warthog with cattle farming rather than purely game farming isinteresting. This is probably a result of trophy hunting on game farms, especially during winter, oractively being targeted as “problem animals” due to their burrowing under game proof fencesallowing access to potential predators (e.g. cheetah, leopard) that in turn target high value trophyspecies (e.g. roan, sable, etc.). This would, however, have to be investigated as cattle farmersalso shootwarthog, albeitthroughout theyear, for staffrations. Warthogcould also be
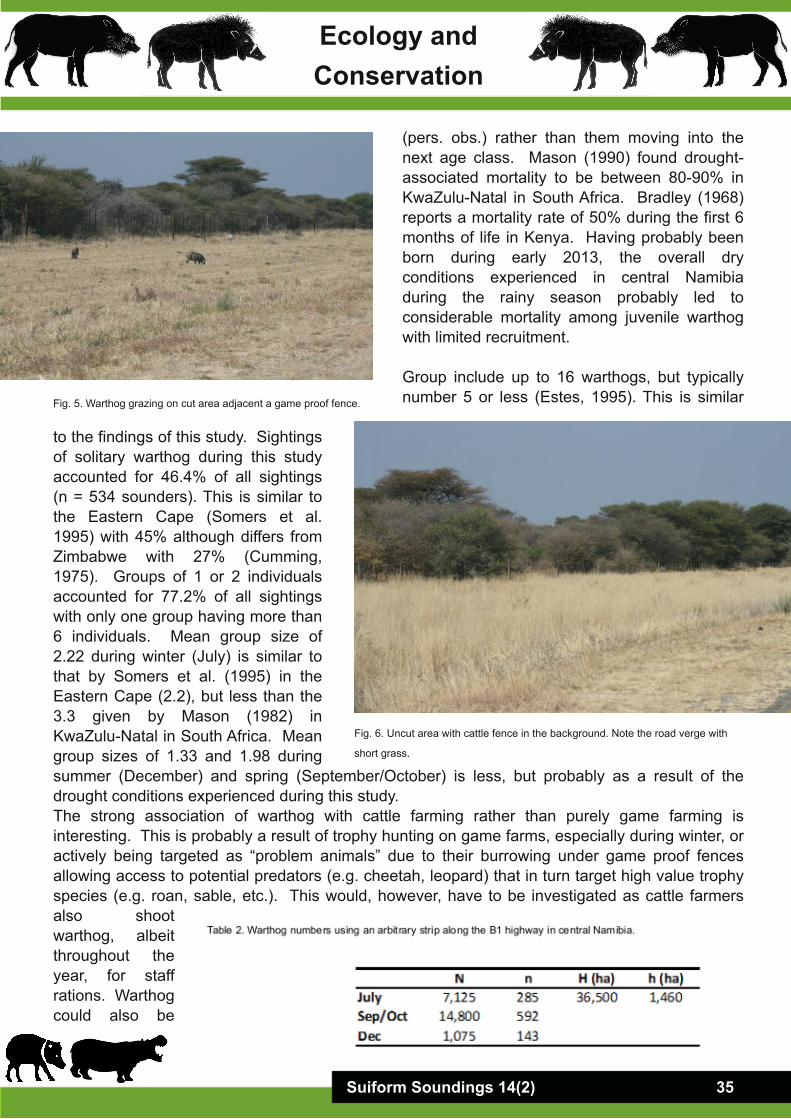
Fig. 5. Warthog grazing on cut area adjacent a game proof fence.
Fig. 6. Uncut area with cattle fence in the background. Note the road verge with
short grass.

Suiform Soundings 1 4(2) 36
Ecology and
Conservation
favouring cattle farms because of the mineral licks (and supplementary feed) farmers supply theircattle during the dry season – i.e. winter months. Warthog scavenge around troughs during thisperiod (pers. obs.). Another reason could be the difference in veld condition of game farmsversus cattle farms with the first mentioned often visibly more overgrazed than the latter (pers.obs.). This is probably due to poor management practices.
The reason warthog favour cut areas to uncut areas, especially during spring(September/October), can probably be ascribed to the drought conditions with “better” forageassociated with the cut areas as this typically stimulates regrowth. As warthog favour short freshgreen grass (Mason, 1982; Skinner & Chimimba, 2005) the cut areas also serve as an attractionduring adverse conditions. This can be problematic as wildlife associated vehicle accidents – e.g.warthog and kudu – are rife in Namibia. The costbenefit of short grass attracting warthog butincreasing visibility along a highway is weighed. Grass cutting is viewed as diversification and anaddition source of income to many farmers in this area. Denying them this opportunity would alsoseem unreasonable. Road signs indicating warthog as a potential threat (See Figure 7) do notseem to be effective in reducing accidents, but then neither do the speed limit signs. As warthogdensities along this section of the B1 highway increase during spring, especially on cut grassalong cattle fences, increased awareness and vigilance should be encouraged to avoid warthogrelated accidents.
The maximum population estimates of 14,800 individuals (or 1/2.47 ha) during spring(September/October), 7,125 individuals (or 1/5.12 ha) during winter (July), and 1,075 individuals
Fig. 7. Warthog warning sign used along roads in Namibia. Note the short road verge and cut area towards the fence which
is obscured by dense Acacia bush.

Suiform Soundings 1 4(2) 37
(or 1/34 ha) during summer (December) are probably overestimates due to the high number ofanimals lured to the roadside during this dry period. Stein et al. (2013) estimated warthog densityas 2/km² on farmland in the Otjiwarongo area. Using this estimate, a total of 1,460 individuals (or1/25 ha) occur in the area. Although home range was not determined during this study, thisvaries between 23.8±7.8 ha in the Eastern Cape (Somers et al., 1994) and 176.1±91.5 ha inZimbabwe and KwaZulu Natal (Cumming, 1975; Mason, 1982). Home ranges overlap widely.Cumming (1975) found that home ranges tend to be larger and population densities lower duringdroughts. Using the maximum density of 4.05 warthog/km to estimate maximum numbers resultin 591.3 warthog over the 146 km (the actual highest count was 391 individuals). Determiningwildlife numbers is complex and tricky, with trend typically a rather more costeffective and timeeffective tool for management than actual numbers.Using the B1 highway, and other similar routes, to determine trends in warthog densities duringdifferent seasons and/or annually would be an easy way to assist farmers, managers, andauthorities on determining the effect of rainfall as well harvesting quotas for hunting purposeswithout negatively affecting the population dynamics of the species.
Acknowledgements
My appreciation to Tom Butyunski for commenting on a draft of this note and for my wife Jankeand son Peter, for assisting with some of the data collection.
References
Bothma J Du P. 1989. Game Ranch Management. Van Schaik Publishers, Pretoria, South Arfrica.Bradley RM. 1968. Some aspects of the ecology of the warthog. M.Sc. thesis, University of East
Africa.Clough G and Hassam AG. 1970. A quantitative study of the daily activity of the warthog in the
Queeen Elizabeth National Park, Uganda. East African Wildlife Journal. 8: 1924.Cumming DM. 1975. A field study of the ecology and behaviour of warthog. Museum Memoirs
Natural Museum Monuments Rhodesia. 7: 1179.Estes RD. 1995. The behaviour guide to African mammals: including hoofed mammals,
carnivores, primates. Russel Friedman Books CC, Halfway House, South Africa.Griffin M and Coetzee CG. 2005. Annotated checklist and provisional national conservation status
of Namibian mammals. Unpublished report, Directorate Scientific Services, Ministry ofEnvironment and Tourism, Windhoek.
Mason DR. 1982. Studies on the biology and ecology of the warthog Phacochoerus aethiopicussundevalli, Lönnberg, 1908 in Zululand. D.Sc. thesis, University of Pretoria.
Mendelsohn J, Jarvis A, Roberts A and Robertson T. 2002. Atlas of Namibia. A portrait of the landand its people. David Philip Publishers, Cape Town, RSA.
Skinner JD and Chimimba CT. 2005. The mammals of the southern African subregion.Cambridge University Press, Cape Town.Somers MJ, Penzhorn BL and Rasa OAE. 1994. Home range size, range use and dispersal of
warthogs in the Eastern Cape, South Africa. Journal of African Zoology. 108: 361373.Somers MJ, Rasa OAE and Penzhorn BL. 1995. Group structure and social behaviour of
warthogs Phacochoerus aethiopicus. Acta theriologica 40: 257281.Stein AB, Fuller TK and Marker LL. 2013. Brown hyena feeding ecology on Namibian farmlands.
South African Journal of Wildlife Research. 43(1): 2732.
Ecology and
Conservation


![[Walk Around n°17] - A-10 Warthog](https://static.fdocuments.in/doc/165x107/5571f21a49795947648c290b/walk-around-n17-a-10-warthog.jpg)