
722_1711 (1)
13
107 Change and Leadership No. 17 ~ 2013 Determinants of Dividend Policy: A study of selected listed Firms in Nigeria ~ Ph.D. uwuigbe olubukunola Ranti (Department of Accounting, School of Busi- ness, College of Development Studies, Covenant University, Ogun State, Nigeria) E-mail: [email protected] Abstract: This study investigated the determinants of dividends policy in the Nigerian stock ex- change market. To achieve the objectives of this study, a total of 50 listed firms in the Nigerian stock ex- change market were selected and analyzed for the study using the judgmental sampling technique. Also, the corporate annual reports for the period 2006-2011 were used for the study. The paper was basically modeled to examine the effects of financial performance of firms, firm size, financial leverage and board independence on the dividend payout decisions of listed firms operating in the Nigerian stock exchange market using the regression analysis method. The study in its findings observed that there is a significant positive relation- ship between firms’ financial performance, size of firms and board independence on the dividend payouts decisions of listed firms in Nigeria. Key words: Nigeria; Dividend Payout; Financial Leverage; Financial Performance; Board In- dependence Annual Report 1.introduction Firms’ decisions relating to dividend policy have been a subject of debate in the financial literatures. Series of theoretical models and explanations describing the fac- tors that managers of organisations should consider when making dividend policy deci- sions have been developed by academics and researchers. Dividend policy, in the context of this study, relates to firm’s dividend pay- out policy that managers follow in deciding the pattern and size of cash distribution to shareholders over time. Following the work
-
Upload
milanpatel -
Category
Documents
-
view
213 -
download
0
Transcript of 722_1711 (1)

107Change and Leadership
No. 17 ~ 2013
Determinants of Dividend Policy: A study of selected listed Firms in Nigeria
~ Ph.D. uwuigbe olubukunola Ranti (Department of Accounting, School of Busi-ness, College of Development Studies, Covenant University, Ogun State, Nigeria)
E-mail: [email protected]
Abstract: This study investigated the determinants of dividends policy in the Nigerian stock ex-change market. To achieve the objectives of this study, a total of 50 listed firms in the Nigerian stock ex-change market were selected and analyzed for the study using the judgmental sampling technique. Also, the corporate annual reports for the period 2006-2011 were used for the study. The paper was basically modeled to examine the effects of financial performance of firms, firm size, financial leverage and board independence on the dividend payout decisions of listed firms operating in the Nigerian stock exchange market using the regression analysis method. The study in its findings observed that there is a significant positive relation-ship between firms’ financial performance, size of firms and board independence on the dividend payouts decisions of listed firms in Nigeria.
Key words: Nigeria; Dividend Payout; Financial Leverage; Financial Performance; Board In-
dependence Annual Report
1. introduction
Firms’ decisions relating to dividend policy have been a subject of debate in the financial literatures. Series of theoretical
models and explanations describing the fac-
tors that managers of organisations should
consider when making dividend policy deci-
sions have been developed by academics and
researchers. Dividend policy, in the context
of this study, relates to firm’s dividend pay-
out policy that managers follow in deciding
the pattern and size of cash distribution to
shareholders over time. Following the work

108 Change and Leadership
No. 17 ~ 2013
of Lintner (1956) and Miller and Modigliani (1961), dividend policy has remained one of the most controversial issues in corporate
finance. Over the years, series of academic
research has been carried out on firms’ divi-dend policy. This has led to a number of com-
peting theoretical explanations for dividend
policy. However, according to Black (1976:5) the concept has remained a puzzle in that
“the harder we look at the concept of divi-dend policy the more it seems like an ending
puzzle, with pieces that just do not fit togeth-
er”. Some of the questions that remain unan-
swered include: Does dividend policy affect
value? What are the factors that determine dividend policy? Is dividend policy deter-
mined dependently or independently?
Prior academic literatures have attempt-
ed to provide answers to these questions and
many more but mystery still shrouds the
dividend policy decision of firms. Lintner
(1956) opined that firms in the developed markets target their dividend payout ratio
with the help of current earnings and past
dividends. Therefore, in order to reach such
target, various modifications are made in
the dividend policy of a firm and thus firms
should have stable dividend policies. Miller
and Modigliani (1961) on the other hand are of the opinion that dividend policy is ir-
relevant in measuring the current worth of
shares considering the irrational postulations
of market perfections, zero transaction costs,
perfect certainty and indifferent behaviour of
investors.
However, despite the emergence of sev-
eral decades of academic research mostly
from developed markets, no agreement or
consensus has emerged about the rival theo-
retical approaches to dividend policy. Series
of market and firm characteristics have been
suggested as potentially significant in de-
termining firm’s dividend payout decisions. Nevertheless, attempt to examine these con-
tending features and process them has in turn
spawned a vast empirical literature major-
ity of which are from developed economies.
Interestingly, as a central motivation for this
study, additional insight into the dividend
policy debate can be gained by an exami-
nation of an emerging market or economy,
which is currently to the best knowledge of
the researcher, is limited. To this end there-
fore, this study will attempt to fill the gap
in literature by examing the determinants of
firms’ dividend payouts in Nigeria. To gain more insight into this paper,
the paper has been structured as follows.
Following the introductory section is the re-
view of relevant literature and hypotheses
development. The next section then presents
the variables definitions, econometric mod-
el and the preliminary empirical evidence.
Finally, the last section summarizes the main
findings and conclusion of the study.
scope of study
This study basically attempts to exam-
ine some of the features that determine the
behaviour of firms’ dividend payouts ratio in Nigeria. To accomplish this objective, the an-
nual reports for the period 2006 -2011 were analyzed. In addition, the study considered
a total of 50 listed firms in the Nigerian stock exchange market. The choice of the firms’ arises based on the frequency in which divi-
dends are paid to shareholders and the avail-
ability of ownership structure data for the
period under consideration.

109Change and Leadership
No. 17 ~ 2013
2. literature review and hypothesis
Development
The term dividend policy can be de-
scribed as the policy a company uses to de-
cide how much it will pay to shareholders in
dividends. The dividend policy a firm adopts
has implications for different stakeholders
such as managers, lenders, and investors. It
is one of the most debated topics and a core
theory of corporate finance which still keeps
its prominent place. Debate about what drive
companies to pay dividends has continued
over the years. The earliest research was un-
dertaken by Lintner (1956:97) on American companies in the mid of 1950s. Findings from the study show that dividend decisions
made by companies are based on the current
profitability and in part on the dividends of
the previous year. However, since then, there
have been a plethora of on-going debate on
dividend policy and the results are mixed.
Fama and Babiak (1968) analysing the Lintner model on the dividend policy main-
tained that firms will try to increase the
dividend only when the dividends can be
sustained in future. Black (1976) finds no convincing explanation of why companies
pay dividends to their shareholders.
However, in a related study, Booth
and Cleary (2001) in their study concluded that a firm’s dividend policy is affected by profitability, size, debt, risk, tangibility and
growth.
Pruitt and Gitman (1991) in their study observed that risk is also a strong determin-
ing factor of firm’s dividend policy. They opined that a firm that has relatively stable
earnings is often able to predict approximate-
ly what its future earning will be. According
to them, such a firm is more likely to pay a
higher percentage of its earnings than firm
with fluctuating earnings. In other stud-
ies, Rozeff (1982), Lloyd et. al., (1985) and Colins et. al., (1996), a statistically significant negative relationship was observed to exist
between beta and dividend payout. These
findings further suggest that firms having
higher level of market risk will payout divi-
dends at lower rate.
Olantundun (2000) examined the de-
terminants of dividends in Nigeria using the
Lintner-Brittain model for the full sample of
observations from 1984-1994. Findings from the study indicate that there are no signifi-
cant interactions between the conventional
Lintner / Brittain model and dividend deci-
sions of Nigerian firms. They concluded that
the dividend behaviour of Nigerian firms de-
pends on the firm’s size, growth prospects and the level of gearing.
In a comparative study of Australia and
Japanese firms, Ho (2003) opined that out of all the regressed variables of profitability,
size, liquidity, leverage, risk, asset mix and
growth, the dividend policies are affected
positively by size in Australia and liquidity
in Japan and negatively by risk in Japan only.
The study also observed that industry effect
was also significant in both Australia and
Japan which indicates the importance of the
industry in which a firm competes. Similarly,
Kumar (2003) in a study of the possible asso-
ciation between ownership structure, corpo-
rate governance and firm’s dividend payout policy; Kumar observed that a positive asso-
ciation exists between dividends and earn-
ings trend. While debt-to-equity was found to be negatively associated, past investment
opportunities where positively associated
with dividend payout policy in India.
Kania and Bacon (2005) examined the impact of profitability, growth, risk, liquidity

110 Change and Leadership
No. 17 ~ 2013
and expansion on the dividend decision/poli-
cy of a corporation by analyzing the financial
data of over 10,000 publicly traded firms. The study concluded that the dividend payout
ratio is significantly affected by the profit-
ability, growth, risk and liquidity.
In Iran, Etemadi and Chalalki (2005) ex-
amined the association between management
performance and the cash dividend of listed
firms in Tehran stock exchange. The results
show that there is a significant positive rela-
tionship between management performances
and cash dividends. Similarly, Jahankhahi
and Ghorbani (2005) attempted to find out the determining factors of dividend policy
in Tehran stock exchange market. Findings
from their study show that firm’s dividend policy follows the random talk model.
Amidu and Abor (2006) examined the determinants of dividend pay ratio on the
platform of financial statements of accept-
ed companies in African exchange within
a 6-year period. The results of this research
indicate a significant positive association be-
tween dividend pay ratio and earning, cash
flow and tax and also a significant negative
association between dividend pay ratio and
risk, institutional ownership, development
and market value to the book value.
Malkawi (2007) studied the determi-nants of corporate dividend policy in Jordan
for the period 1989-2000. The study found out that size, age and profitability of the firms
where major determing factors of corporate dividend Policy in Jordan. The study further
provided a strong support for the agency
costs hypothesis and is broadly consistent
with the pecking order assumptions. Also,
Al-Twaijry (2007) confirmed that current dividends are affected by the past and future
earnings. Also, dividends were associated
with net earnings but less strongly. Neither
the age of the paying dividend company nor
its home sector had an impact on the amount
paid on each share (DPS). However, size was found to have a significant effect on the DPS
as compared to either the current, past or fu-
ture net earnings.
Anil and Kapoor (2008) in their pa-
per examined the determinants of divi-
dend payout ratio of the Indian Information
Technology sector. For the pooled data for
seven years, they observed that cash flows,
corporate tax, sales growth and market-to-
book value ratio do not explain the dividend
payment pattern that existed in the informa-
tion technology industry. However, liquidity
and beta (year-to-year variability in earnings) were found to be noteworthy determinants.
Similarly, Abdelsalam et. al., (2008) investi-gated the dividend policy of 50 listed firms in Egypt for the period 2003-2005. Findings from the study show that a significant posi-
tive association existed between institutional
ownership and firms’ efficiency.Nevertheless, despite the series of prior
empirical researches that have been under-
taken, it is observed that most of these stud-
ies have emerged majorly from developed economies. However, in order to shed more
light on the determinants of firms’ dividend policy, this study will attempt to re-examine
some of the determinants of dividend payout
of listed firms in Nigeria.
Development of hypotheses
In order determine some of the factors
that influence the dividend behaviour of
firms in Nigeria, the following hypotheses
stated in the null form were tested in this
study:

111Change and Leadership
No. 17 ~ 2013
H1: There is no association be-
tween the financial performance of firms and
dividend payout of listed firms in Nigeria.
H2: There is no significant asso-
ciation between firm size and the dividend
payout of listed firms in Nigeria.
H3: There is no significant asso-
ciation between debt ratio and the dividend
payout of listed firms in Nigeria.
H4: There is no significant asso-
ciation between board independence and the
dividend payout of listed firms in Nigeria
3. research Methodology
To achieve the objectives of this study, the annual reports for the period 2006-2011 were examined. This is due to the fact that an-
nual reports are readily accessible. However,
using the judgmental sampling technique; a total of 50 listed firms operating in the Nigerian stock exchange were selected. This
represents 21.5% of the total population. This is consistent with the propositions of Krejcie & Morgan (1970) where a minimum of 5% of a defined population is considered as an
appropriate sample size in making general-
ization. The choice of the sampled firms was
based on the availability of annual reports,
size and most importantly their ability to pay
dividend during the period under consider-
ation. Nevertheless, in order to re-examine
the research hypotheses stated in this study,
the ordinary least square (OLS) data estima-
tion method was used.
Model Specification:
In line with the postulations as stated in
the hypotheses, the following model is used
to re-examine the association between inde-
pendent and the dependent variables of the
listed firms in Nigeria.
DPOit = f (ROEit, FSIZEit, FL it, BIit, eit (1)This can be written in explicit form as:
DPO it = β0 + β1ROEit + β3FSIZEit + β4FLit, + BIit + eit(2) Where:
DPO it = Dividend Payout ratio is
measured as the dividend per equity share
divided by earnings per share
ROE it = Return on Equity for firm i at
time t (in years). Used as a proxy for perfor-
mance and is measured as net profit after tax
divided by shareholders equity.
FSIZE it = Firms size is measured by the natural logarithm of the book value of the
firms Total Assets.
FLit = Financial leverage is proxied as
the debt to equity ratio. It measures the per-
centage of debt over equity.
BI it = Board independence relates to
the total non-executive directors over total
number of directors
e = Stochastic or disturbance term.
t = Time dimension of the Variables
β0 = Constant or Intercept.β1-4 = Coefficients to be estimated or
the Coefficients of slope parameters.
The expected signs of the coefficients (a prio-ri expectations) are such that β1, β2, β4 > 0 while on the other hand β3 < 0.

112 Change and Leadership
No. 17 ~ 2013
variables observations mean std. Dev min. maxDPo 50 . 4570417 . 2922138 .1111 994987roe 50 . 3357537 . 2746883 -.378712 .954602fsizE 50 4.404154 6.275886 .11 19.5245Fl 50 . 9212481 . 694288 .0013 6.6802Bi 50 .59326 .1891958 .14 .973
4. Discussion of Findings
Table 1:Descriptive Statistics of Variables
Source: field survey (2012)
DPo roe fsizE Fl Bi
DPo 1.0000roe 0.3776 1.0000
0.0069fsizE 0.7709 0.1822 1.0000
0.0000 0.2053Fl -0.3121 -0.2666 -1589 1.0000
0.0273 0.0612 0.2703Bi 0.4752 -0.2139 0.4611 0.0025 1.0000
0.0005 0.1358 0.0008 0.9862
Table 2: Pearson Correlations Coefficients for Sampled firms
Source: field survey (2012)
DPo Coefficients std. err. t P > |t| [95% Cof. interval
roe .3143026 .0924754 3.40 0.001 .1280475 .5005577fsizE .0263581 .0043589 6.05 0.000 .0175788 .0351374Fl -.0248522 .0408065 -1.76 0.084 -.0532238 .0035195Bi .4289556 .1447921 2.96 0.005 .1373294 .7205818_Cons .0038412 .0966071 0.04 0.968 -.1907354 .1984178
Table 4: Regression Result
Source SS df MS
Model 3.03318145 4 .758295362Residual 1.15087438 45 0.25574986Total 4.18405583 49 .085388894
Table 3: Anova
Source: field survey (2012)
113Change and Leadership
No. 17 ~ 2013
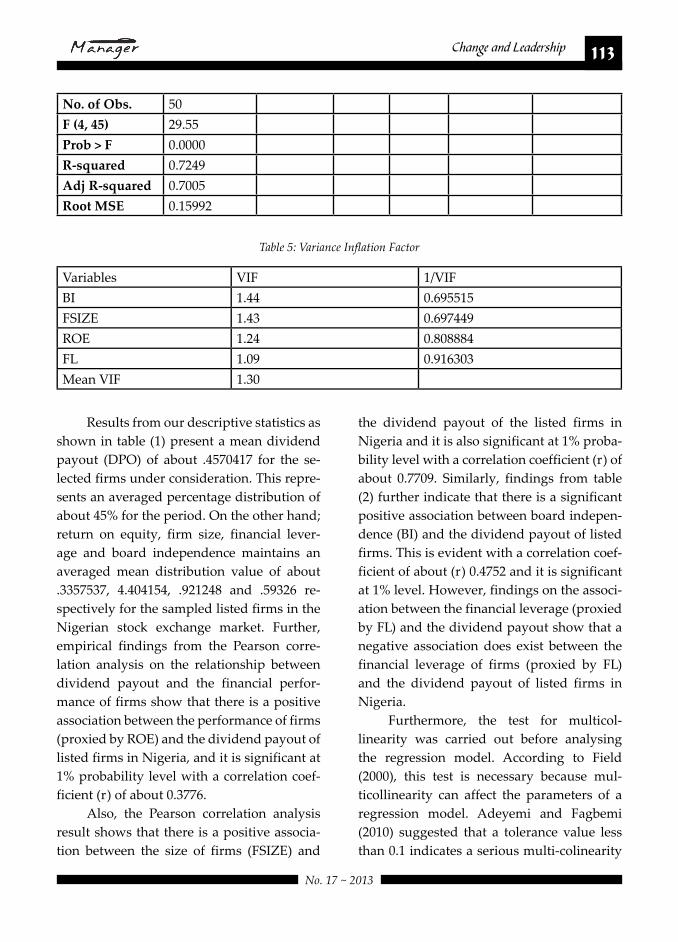
No. of obs. 50f (4, 45) 29.55Prob > F 0.0000r-squared 0.7249Adj r-squared 0.7005root Mse 0.15992
Variables VIF 1/VIF
BI 1.44 0.695515FSIZE 1.43 0.697449ROE 1.24 0.808884FL 1.09 0.916303Mean VIF 1.30
Table 5: Variance Inflation Factor
Results from our descriptive statistics as
shown in table (1) present a mean dividend payout (DPO) of about .4570417 for the se-
lected firms under consideration. This repre-
sents an averaged percentage distribution of
about 45% for the period. On the other hand; return on equity, firm size, financial lever-
age and board independence maintains an
averaged mean distribution value of about
.3357537, 4.404154, .921248 and .59326 re-
spectively for the sampled listed firms in the
Nigerian stock exchange market. Further,
empirical findings from the Pearson corre-
lation analysis on the relationship between
dividend payout and the financial perfor-
mance of firms show that there is a positive
association between the performance of firms
(proxied by ROE) and the dividend payout of listed firms in Nigeria, and it is significant at
1% probability level with a correlation coef-ficient (r) of about 0.3776.
Also, the Pearson correlation analysis
result shows that there is a positive associa-
tion between the size of firms (FSIZE) and
the dividend payout of the listed firms in
Nigeria and it is also significant at 1% proba-
bility level with a correlation coefficient (r) of about 0.7709. Similarly, findings from table (2) further indicate that there is a significant positive association between board indepen-
dence (BI) and the dividend payout of listed firms. This is evident with a correlation coef-
ficient of about (r) 0.4752 and it is significant at 1% level. However, findings on the associ-ation between the financial leverage (proxied
by FL) and the dividend payout show that a negative association does exist between the
financial leverage of firms (proxied by FL) and the dividend payout of listed firms in
Nigeria.
Furthermore, the test for multicol-
linearity was carried out before analysing
the regression model. According to Field
(2000), this test is necessary because mul-ticollinearity can affect the parameters of a
regression model. Adeyemi and Fagbemi
(2010) suggested that a tolerance value less than 0.1 indicates a serious multi-colinearity

114 Change and Leadership
No. 17 ~ 2013
problem between the independent variables.
Nevertheless, since all values are more than
0.10, there is no issue of multi-colinearity between the independent variables. Also,
Myers (1990) suggested that a variance infla-
tion factor (VIF) value greater than 10 calls for concern, however, for this study, the VIF
values are less than 10.Consequently, findings from the regres-
sion analysis result for the selected firms as
depicted in table (4) indicates that from the model, the R2 which is often referred to as the
coefficient of determination of the variables
is 0.7249. The R-Squared which is also a mea-
sure of the overall fitness of the model indi-
cates that the model is capable of explaining
about 72% of the variability the share prices of firms. This means that the model explains
about 72% of the systematic variation in the dependent variable. That is, about 18% of the variations in dividend payout policies of the
sampled firms are accounted for by other fac-
tors not captured by the model. This result is
complimented by the adjusted R2 (adjusted R-squared) of about 0.7005%, which in es-
sence is the proportion of total variance that
is explained by the model.
Similarly, findings from the Fishers ra-
tio (i.e. the F-Statistics which is a proof of the
validity of the estimated model) as reflected in table (3), presents a p-value that is less than 0.05 (p-value < 0.05); this invariably suggests clearly that simultaneously the explanatory
variable (i.e. firms performance, firms size,
financial leverage and board independence) are significantly associated with the depen-
dent variable (dividend payout). That is, they strongly determine the behaviour of firms’ dividend payout policies.
However, further empirical findings
as provided in table (4) show that there is a
significant positive relationship between the
financial performance of firms and dividend
payout of firms listed in Nigeria. This is evi-
dent with the t-statistics value of 3.40 and a P>|t| (0.001). This outcome basically implies that with all other variable held constant, an
increase or a change in the financial perfor-
mance of firms, say by one percent will on
the average bring about a .3143026 percent increase in the dividend payout policies of
listed firms operating in Nigeria. That is an
increase in the financial performance of firms
will also lead to a positive improvement in
firms dividend payout ratio. In essences, we
can deduce from this result that the finan-
cial performance of firms have a significant
positive impact on the dividend policy deci-
sions of listed firms in Nigeria. Interestingly,
this is in line with the propositions of Baker
and Powell (2000), Al-Najjar and Hussainey (2009), and Kowalewski (2007). The firm with high profits has the potential to pay
dividends more than less profitable firms.
However, this result does not agree with
the findings of Kania and Bacon (2005) and Amidu and Abor (2006) where they main-
tained the fact that profitability is significant
and negatively associated with dividend
payout. That is firms will prefer investing in
their assets rather than rather than paying
dividends to shareholders.
Similarly, empirical findings provided
in table (4) show that there is a significant positive relationship between the firms’ size of firms and the dividend payout decisions
of listed firms. This is also evident in the t-
statistics value of (6.05 and the P>|t| = 0.000). This outcome basically implies that in line
with previous studies, larger size firms’ pays out more dividends as compared to smaller
size firms since larger firms typically have

115Change and Leadership
No. 17 ~ 2013
easier and better access to the capital mar-
ket to raise funds with lower cost and fewer
constraints compared to a small firm. This
in a nutshell suggests that the dependence
on internal funding decreases as firm size
increases. Therefore, all things being equal,
large firms are more likely to afford paying
higher dividends to shareholders. This out-
come nevertheless corroborates the opin-
ions of Al-Najjar and Hussainey (2009), Ho (2003), Aivazian et al. (2003), Kumar (2003) and Malkawi (2007) where they opined that firm size was a strong determining factor in
firms’ dividend payout decisions since larger firms has more and diversified resources to
pay dividends.
Furthermore, empirical findings from
the regression analysis on the relationship
between financial leverage (expressed in
terms of debt-equity ratio) and the dividend payout of listed firms in Nigeria indicate that
there is a significant inverse relationship be-
tween firms’ financial leverage and the divi-dend payouts decisions of listed firms. This
is however evident in the t-statistics value of
(-1.76 and P>|t| = 0.084). This implies that with the influence of other variable held con-
stant, as firms financial leverage position
changes; say by one percent, on average, the
dividend payout ratio of listed firms’ also changes by -.0248522 percent in the opposite direction. This outcome means that there is
a significant inverse relationship between
firms’ financial leverage position (prox-
ied by debt-equity ratio) and the dividend policy decisions of listed firms in Nigeria.
Accordingly, as the debt content in the capi-
tal structure of a firm decreases, its dividend
payout ratio rises and vice versa. Therefore,
riskier and more financially indebted firms
will always prefer to pay lower dividends.
This result nevertheless, is in line with the
views of Rozeff (1982), Kowalewski (2007), Al-Malkawi (2007) and Al-Kuwari (2009) where they opined that a significant negative
association does exist between firms’ finan-
cial leverage and the dividend payout deci-
sions of firms; since firms with high financial
leverage tend to have low payout ratios in
order to reduce the transaction costs associ-
ated with the external financing. However,
this result does not agree with the findings
provided in Kania and Bacon (2005).Finally, in addition to the aforemen-
tioned findings, table (4) also provides the result on the relationship between board in-
dependence and the dividend payouts de-
cisions of listed firms. Regression analysis
result shows that there is a significant posi-
tive relationship between the board inde-
pendence (proxied by total non-executive
directors over total number of directors) and the dividend policy decisions of listed firms
in Nigeria. This is nonetheless evident in the
t-statistics value of (2.96 and P>|t| = 0.005). This regression result basically implies that
the greater the number of independent di-
rectors present in the board, the higher they
will be willing to pay more dividend since
independent directors are monitoring inves-
tor interest by participating in the board’s de-
cisions. This outcome is consistent with the
findings of Belden (2005), Kowalewski et al. (2007) and Jiraporn et al. (2008) where they maintained the fact that outside directors on
the company board tend to reduce the agen-
cy cost in the firm and also they basically
tend to represent the shareholders effectively
and ensure their rights in the company. As a
result, the more outside members that are on
the board, the more dividends the company
was willing to pay.

116 Change and Leadership
No. 17 ~ 2013
Conclusion
This study basically examined the de-
terminants of dividend policy in Nigeria.
To achieve the objectives of this study, the Nigerian stock exchange fact book and the
corporate annual reports for the period 2006-2010 were analyzed. The study nevertheless came up with the following findings that are
of salient value to investors and scholars.
Based on the hypotheses tested, the
study observed that there was a significant
positive association between the financial
performance of firms and dividend payout
of firms listed in Nigeria. This outcome nev-
ertheless was in line with the propositions
of Baker and Powell (2000), Al-Najjar and Hussainey (2009), and Kowalewski (2007). Also, in line with the views of Al-Najjar and Hussainey (2009), Ho (2003), Aivazian et al. (2003), Kumar (2003) and Malkawi (2007), the study observed that firm size was also a
strong determinant of firms’ dividend pay-
out decisions; since larger firms typically
have easier and better access to the capital
market to raise funds with lower cost and
fewer constraints compared to a small firm.
Similarly, the study also revealed that
that there is a significant positive relation-
ship between the board independence (prox-
ied by total non-executive directors over total
number of directors) and the dividend policy decisions of listed firms in Nigeria. However,
contrary to the findings provided in hypoth-
eses one, two and four; findings from the
third hypothesis revealed that there is a sig-
nificant negative relationship between firms’ financial leverage and the dividend payouts
decisions of listed firms operating in Nigeria.
Therefore, as the debt content in the capital
structure of a firm decreases, its dividend
payout ratio rises and vice versa. To this end,
riskier and more financially indebted firms
will always prefer to pay lower dividends.
More so, firms with high financial leverage
tend to have low dividend payout ratios in
order to reduce the transaction costs associ-
ated with the external financing.
APPENDIX: List of Sampled Firms with Averaged Values for 2006-2011
S/N FIRMS DPO ROE FSIZE FL BI
1 7up Bottling Company Plc .499398 .309971 1.893000 .062900 .67002 Flourmill of Nigeria Plc .165005 .143451 .127600 .013400 .69003 Horneywell Flour Mills Plc .112000 .141421 .110000 5.037700 .7100
4National Salt Company (Nigeria)
Plc .994987 .590388 9.421000 .021200 .6700
5 Nestle Nigeria Plc .864548 .275300 18.52300 .016100 .75006 Nigerian Breweries Plc .149856 .097483 .212000 .551000 .73007 Cadbury Nigeria Plc .366950 .026222 1.222000 .410400 .52008 Premier Breweries Plc .158892 .229242 .121000 .001900 .55009 Nigeria Bottling Company Plc .233006 .341408 1.133000 .080200 .5800
10 International Breweries Plc .370835 .831726 .220000 .054600 .540011 Guinness Nigeria Plc .712523 .646619 4.545600 .112100 .6200

117Change and Leadership
No. 17 ~ 2013
12 Presco Plc .120000 -.113417 .210000 5.714500 .570013 Okomu Oil Palm Plc .112000 -.378712 .231000 4.112300 .680014 Okitipupa Oil Palm Plc .757440 .954602 2.340000 .001400 .690015 Livestock Feeds Plc .111100 -.006157 .123100 .001300 .690016 FTN Cocoa Processors Plc .317429 .435806 .941000 .058500 .610017 Ellah Lakes Plc .213000 -.036778 .986000 6.680600 .600018 Nigerian Wire Industries Plc .198063 .233465 .810000 .012100 .610019 Nigerian Ropes Plc .812242 .053232 14.20000 .002500 .830020 Lafarge Cement Wapco Nigeria Plc .372134 .010917 .610000 .002000 .7100
21Cement Company of Northern
Nigeria Plc .210000 -.088579 .153400 4.187200 .6900
22 Dangote Cement Plc .289763 .121646 1.134000 1.176700 .600023 Ashaka Cement Plc .877219 .563508 9.498000 .032300 .600024 Premier Paints Plc .764286 .498577 9.530000 .002300 .450025 African Paints (Nigeria) Plc .966585 .282288 3.455000 .039500 .660026 Berger Paints Plc .573653 .266971 .130000 .638400 .730027 Cap Plc .278165 .229905 1.300000 .181600 .630028 DN Meryer Plc .158892 .572925 .124000 .232400 .530029 IPWA Plc .330059 .234140 .220000 .156600 .570030 Nigerian German Chemicals Plc .198063 .039465 .213000 .062300 .5100
31 Paints & Coatings Manufacturers Nigeria Plc
.812242 .455323 19.52450 .023000 .8300
32 PS Mandrides & Company Plc .317429 .436345 .342000 .320000 .330033 Beverages (West Africa) Plc .945875 .534565 5.370000 .012300 .950034 Costain (West Africa) Plc .856484 .212306 9.420000 .012300 .770035 Arbico Plc .167857 .345558 .240000 .240000 .140036 Unilever Nigeria Plc .333306 .234544 .160000 .160000 .370037 Grommac Industries plc .145269 .256722 .450000 .450000 .150038 Access Bank Plc .264859 .456777 .230000 .230000 .250039 Afribank Nigeria Plc .358235 .567559 .210000 .210000 .260040 Bank PHB Plc .770227 .299766 6.534500 .023000 .750041 Diamond Bank Plc .333423 .451662 .110000 .110000 .390042 Ecobank Nigeria Plc .778212 .563508 19.33000 .101300 .790043 Fidelity Bank Plc .864566 .456767 18.45000 3.450000 .670044 First Bank of Nigeria Plc .887655 .565488 14.55000 2.550000 .973045 First City Monument Bank Plc .267853 .569715 .120000 2.120000 .680046 W.A Glass Industries .274568 .945899 .130000 3.130000 .2800
118 Change and Leadership
No. 17 ~ 2013
reFereNCes:
1. adeyemi, s.B. and fagbemi, t.o. (2010). Audit Quality, Corporate Governance and Firm Characteristics in Nigeria, International Journal of Business and Management, vol. 5, no. 5, pp. 169-179
2. Aivazian, Varouj, laurence Booth, and sean Cleary (2003), Do Emerging Market Firms Follow Different Dividend Policies From U.S. Firms?”, The Journal of Financial Research, vol. 26, pp. 371-387.
3. Al-kuwari, D. (2009). Determinants of the Dividend Policy in Emerging Stock Exchanges: The Case of GCC Countries, Global Economy & Finance Journal, Vol. 2 No. 2 September 2009. pp. 38-63.
4. al-malkawi, h. (2007). Determinants of Corporate Dividend Policy in Jordan: An Application of the Tobit Model, Journal of Economic & Administrative Sciences, vol. 23, no. 2, pp. 44-70.
5. Al-Najjar, B. and hussainey, k. (2009). The Association between Dividend Payout and Outside Directorships, Journal of Applied Accounting Research, vol. 10, no. 1, pp. 4-19.
6. al-twaijry, a.a (2007). Dividend policy and payout ratio: Evidence from the Kuala Lumpur Stock Exchange,
The Journal of Risk Finance, vol. 8 No. 4, pp. 349-363.
7. Amidu, M and Abor, J. (2006). Determinants of dividend payout ratios in Ghana, The Journal of Risk Fi-
nance, vol. 7(2), pp 135-145
8. Anil k, and kapoor s. (2008). Determinants of dividend payout ratios - A study of Indian information technol-ogy sector, International Resource Journal of Finance and Economics, vol. 15, pp1-9.
9. Baker, h.K, Powell, g.E. (2000). Determinants of corporate dividend policy: a survey of NYSE firms, Finance
and Practical Education, vol. 9, pp. 29-40.
10. Black, f. (1976) The Dividend Puzzle, Journal of Portfolio Management, vol. 2, pp. 5-8.
11. Bleden, s., fister, t. and Knapp, B. (2005), Dividends and Directors: Do Outsiders Reduce Agency Costs? Business and Society Review, vol. 110, no. 2, pp. 171-180.
12. Collins m.C; saxena, a.K and wansley, j.w (1996). The role of insiders and dividend policy: a comparison of regulated and unregulated firms. Journal of Finance and Strategic Decision, vol. 9, pp. 1-9.
13. fama, E. f. and Babiak, h., (1968). Dividend Policy: An Empirical Analysis, Journal of the American Statis-
tical Association, pp. 1132-1161.
14. Field, A. (2000). Discovering statistics: Using SPSS for Windows. London: Sage Publications
15. ho, h. (2003). Dividend Policies in Australia and Japan, International Advances in Economic Research, vol. 9, no. 2, pp. 91-100.
16. Jiraporn, P., kim J. and kim, y. (2008). Dividend Policy and Corporate Governance Quality, Working Paper, Pennsylvania State University
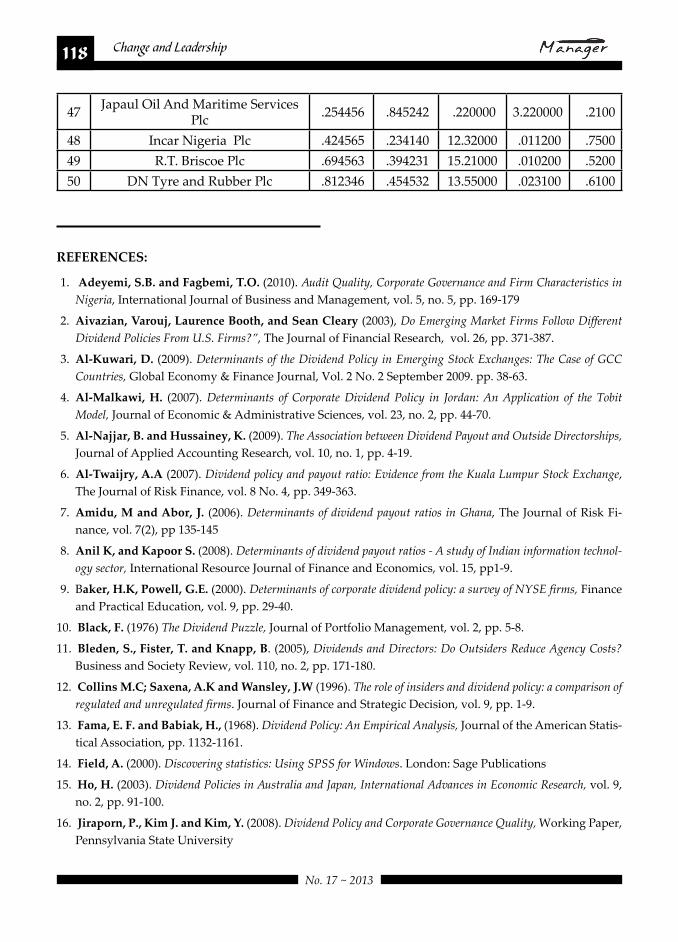
47Japaul Oil And Maritime Services
Plc .254456 .845242 .220000 3.220000 .2100
48 Incar Nigeria Plc .424565 .234140 12.32000 .011200 .750049 R.T. Briscoe Plc .694563 .394231 15.21000 .010200 .520050 DN Tyre and Rubber Plc .812346 .454532 13.55000 .023100 .6100

119Change and Leadership
No. 17 ~ 2013
17. Kania, s .l and Bacon, f. w. (2005). What Factors Motivate the Corporate Dividend Decision? ASBBS E –
Journal, 1(1): 97 – 107.
18. Kowalewski o. (2007). Financial system in M. Weresa (ed.), Competitiveness Report 2007. The role of for-
eign direct investment, World Economy Research Institute, Warsaw School of Economics.
19. Kowalewski, o., stetsyuk, i. and talavera. (2007), Corporate Governance and Dividend Policy in Poland,
Working Paper. German Institute for Economic Research.
20. Krejcie, R. v., and morgan, D. w. (1970). Determining Sample Size for Research Activities, Educational and
Psychological Measurement, vol. 30, pp. 607-610.
21. kumar, J. (2003). Corporate Governance and Dividend Payout in India, Journal of Emerging Market Finance,
5(1): 15 – 58.
22. lintner, J. (1956). Distribution of Incomes of Corporations among Dividends, Retained Earnings and Taxes. The
American Economic Review, May, vol. 46(2): pp. 97 – 113.
23. lloyd, w.P jahera, s.j and Page D.E (1985). Agency cost and dividend payout ratios, Quarterly Journal of
Business and Economics, vol. 24, pp. 19-29
24. Miller, M. and Modigliani, F. (1961). Dividend policy, growth, and the valuation of shares. Journal of Busi-
ness, vol. 34, pp. 411-433.
25. Myers, r. (1990). Classical and modern regression with applications (2nd ed.). Boston, MA: Duxbury
26. Pruitt, s.w. and gitman, l.w (1991). The interactions between the investment, financing, and dividend deci-sions of major US firms, Financial Review, vol. 26, no.33, pp.409-30
27. rozeff, M. s. (1982). Growth, Beta and Agency Costs as Determinants of Dividend Payout Ratios. The Journal
of Financial Research, fall, vol. 5(3): pp. 249 – 259.


![[XLS] · Web view1 1 1 2 3 1 1 2 2 1 1 1 1 1 1 2 1 1 1 1 1 1 2 1 1 1 1 2 2 3 5 1 1 1 1 34 1 1 1 1 1 1 1 1 1 1 240 2 1 1 1 1 1 2 1 3 1 1 2 1 2 5 1 1 1 1 8 1 1 2 1 1 1 1 2 2 1 1 1 1](https://static.fdocuments.in/doc/165x107/5ad1d2817f8b9a05208bfb6d/xls-view1-1-1-2-3-1-1-2-2-1-1-1-1-1-1-2-1-1-1-1-1-1-2-1-1-1-1-2-2-3-5-1-1-1-1.jpg)


![$1RYHO2SWLRQ &KDSWHU $ORN6KDUPD +HPDQJL6DQH … · 1 1 1 1 1 1 1 ¢1 1 1 1 1 ¢ 1 1 1 1 1 1 1w1¼1wv]1 1 1 1 1 1 1 1 1 1 1 1 1 ï1 ð1 1 1 1 1 3](https://static.fdocuments.in/doc/165x107/5f3ff1245bf7aa711f5af641/1ryho2swlrq-kdswhu-orn6kdupd-hpdqjl6dqh-1-1-1-1-1-1-1-1-1-1-1-1-1-1.jpg)


![1 1 1 1 1 1 1 ¢ 1 1 1 - pdfs.semanticscholar.org€¦ · 1 1 1 [ v . ] v 1 1 ¢ 1 1 1 1 ý y þ ï 1 1 1 ð 1 1 1 1 1 x ...](https://static.fdocuments.in/doc/165x107/5f7bc722cb31ab243d422a20/1-1-1-1-1-1-1-1-1-1-pdfs-1-1-1-v-v-1-1-1-1-1-1-y-1-1-1-.jpg)
![1 1 1 1 1 1 1 ¢ 1 , ¢ 1 1 1 , 1 1 1 1 ¡ 1 1 1 1 · 1 1 1 1 1 ] ð 1 1 w ï 1 x v w ^ 1 1 x w [ ^ \ w _ [ 1. 1 1 1 1 1 1 1 1 1 1 1 1 1 1 1 1 1 1 1 1 1 1 1 1 1 1 1 ð 1 ] û w ü](https://static.fdocuments.in/doc/165x107/5f40ff1754b8c6159c151d05/1-1-1-1-1-1-1-1-1-1-1-1-1-1-1-1-1-1-1-1-1-1-1-1-1-1-w-1-x-v.jpg)