70 Corridor Opportunities Considered STUDY US-23€¦ · 70 Corridor Opportunities Considered STUDY...
28
US-23 FEASIBILITY STUDY 70 Corridor Opportunities Considered Section Seven Corridor Opportunities Considered PROCESS USED TO IDENTIFY IMPROVEMENT OPPORTUNITIES The US-23 Corridor Coalition identified existing and potential issues specific to the US-23 Corridor and developed strategies to meet the overall goals documented in Section 2 Study Purpose and Goal s. Opportunities were evaluated and were all eliminated based on their feasibility and/or inability to resolve the key objectives identified. The following Study identified and reviewed the following corridor opportunities: Transportation System Management Local System Operational Improvements Intelligent Transportation System/Incident Management Mobility Options Transit Service Options except commuter rail Bus Bypass Shoulders Capacity and Infrastructure Improvements Additional General Purpose lanes Additional High Occupancy Vehicle (HOV) lanes Additional High-Occupancy Toll (HOT) Lane Land Use Opportunities Transit-Oriented Development PLANNED IMPROVEMENTS FOR THE US-23 CORRIDOR AND SURROUNDING AREA 2009 Roadside Facility Improvement at Northfield Church Rest Area 2009 US-23/Geddes Road Roundabouts 2009 US-23 from CSX Railroad to south of M-59 - single course milling and fill 2011 Overlay on northbound and southbound US-23 over Silver Lake Road 2011 Overlay on northbound and southbound US-23 over Huron River Road 2011 Resurface northbound and southbound US-23 from Silver Lake to CSX Railroad Bridge 2011 Overlay northbound and southbound US-23 Over Hyne Road 2011 Superstructure Repair at Lee Road Bridge 2011 US-23 Northbound and Southbound Bridge under the Grand River - Deck patch, joint repair and full paint. 2011 US-23 under Spencer Road - Deck patch, joint repair and full paint 2011 Overlay on US-23 Northbound over Silver Lake Road 2011 Painting on US-23 Bridge under CSX Railroad 2011 Median cable barrier system on US-23 from M-36 to Genesee County Line 2012 Resurface carpool lot at Silver Lake Road 2013 Overlay on US-23 under Bemis Road 2013 Overlay on US-23 under Willis Road 2013 Bridge deck replacements, resurfacing, minor widening, and ramp extensions I-96/US-23 interchange DESCRIBE THE TRANSPORTATION SYSTEM MANAGEMENT OPPORTUNITIES. Local System Operational Improvements The evaluation of traffic operation issues along the adjacent local road network could help address the lack of north-south connectivity within Washtenaw and Livingston County . There is little opportunity for the local road network to accommodate traffic, as there is no existing continuous north-south road in the study area. Intelligent Transportation Systems and Incident Management The US-23 and M-14 routes located within the study are not equipped with monitoring instrumentation known as Intelligent Transportation Systems (ITS). ITS technologies, including camera monitoring, vehicle detection systems, and electronic message signs, are currently located throughout much of the Metropolitan Detroit freeway system in the Wayne, Oakland and Macomb counties. These systems connect to the nerve center, the Michigan Intelligent Transportation Systems Center (MITSC), in Downtown Detroit where operators monitor traffic conditions, alert motorists of non-recurring congestion, construction activities and special events, and dispatch Freeway Courtesy Patrols or emergency responders as necessary to traffic incidents. ITS and coordinated incident management along the US-23 corridor could help mitigate the impact of incident- related congestion, reduce secondary incidents, and help motorists make travel decisions. Furthermore, potential future transit service in the corridor could benefit from ITS, as it could help mitigate incident-related congestion for buses or provide necessary information for buses to make a determination of whether to use an alternate route. MDOT’s University Region office, which has jurisdiction within the study area, has no ITS deployments, although design is underway for systems along I-94. However, through partnership with the MDOT Metro Region, extension of freeway monitoring and courtesy patrol functions into the Ann Arbor area may be practical given the relatively contiguous nature of the Metro Detroit and Ann Arbor areas and the potential cost savings achieved by coordinating these systems. SECTION SEVEN
Transcript of 70 Corridor Opportunities Considered STUDY US-23€¦ · 70 Corridor Opportunities Considered STUDY...

U S - 2 3F E A S I B I L I T YS T U D Y70 Corridor Opportunities Considered
Section SevenCorridor Opportunities ConsideredP R O C E S S U S E D TO I D E N T I F Y I M P R O V E M E N T O P P O RT U N I T I E S
The US-23 Corridor Coalition identifi ed existing and potential issues specifi c to the US-23 Corridor anddeveloped strategies to meet the overall goals documentedin Section 2 Study Purpose and Goals. Opportunitieswere evaluated and were all eliminated based on their feasibility and/or inability to resolve the key objectivesidentifi ed. The following Study identifi ed and reviewedthe following corridor opportunities:
Transportation System ManagementLocal System Operational ImprovementsIntelligent Transportation System/Incident Management
Mobility OptionsTransit Service Options except commuter rail Bus Bypass Shoulders
Capacity and Infrastructure ImprovementsAdditional General Purpose lanesAdditional High Occupancy Vehicle (HOV) lanesAdditional High-Occupancy Toll (HOT) Lane
Land Use OpportunitiesTransit-Oriented Development
P L A N N E D I M P R O V E M E N T S F O R T H E U S - 2 3 C O R R I D O R A N D S U R R O U N D I N G A R E A
2009 Roadside Facility Improvement at Northfi eld Church Rest Area
2009 US-23/Geddes Road Roundabouts
2009 US-23 from CSX Railroad to south of M-59 - single course milling and fi ll
2011 Overlay on northbound and southbound US-23 over Silver Lake Road
2011 Overlay on northbound and southbound US-23 over Huron River Road
2011 Resurface northbound and southbound US-23 from Silver Lake to CSX Railroad Bridge
2011 Overlay northbound and southbound US-23 Over Hyne Road
2011 Superstructure Repair at Lee Road Bridge
2011 US-23 Northbound and Southbound Bridge under the Grand River - Deck patch, joint repair and full paint.
2011 US-23 under Spencer Road - Deck patch, joint repair and full paint
2011 Overlay on US-23 Northbound over Silver Lake Road
2011 Painting on US-23 Bridge under CSX Railroad
2011 Median cable barrier system on US-23 from M-36 to Genesee County Line
2012 Resurface carpool lot at Silver Lake Road
2013 Overlay on US-23 under Bemis Road
2013 Overlay on US-23 under Willis Road
2013 Bridge deck replacements, resurfacing, minor widening, and ramp extensionsI-96/US-23 interchange
D E S C R I B E T H E T R A N S P O RTAT I O N S Y S T E M M A N A G E M E N T O P P O RT U N I T I E S .
Local System Operational ImprovementsThe evaluation of traffi c operation issues along the adjacent local road network could help address the lack of north-south connectivity within Washtenaw and LivingstonCounty. There is little opportunity for the local road network to accommodate traffi c, as there is no existing continuous north-south road in the study area.
Intelligent Transportation Systems and Incident ManagementThe US-23 and M-14 routes located within the study are not equipped with monitoring instrumentation known as Intelligent Transportation Systems (ITS). ITS technologies,including camera monitoring, vehicle detection systems,and electronic message signs, are currently locatedthroughout much of the Metropolitan Detroit freewaysystem in the Wayne, Oakland and Macomb counties. These systems connect to the nerve center, the Michigan Intelligent Transportation Systems Center (MITSC),in Downtown Detroit where operators monitor traffi cconditions, alert motorists of non-recurring congestion, construction activities and special events, and dispatch Freeway Courtesy Patrols or emergency responders as necessary to traffi c incidents.
ITS and coordinated incident management along theUS-23 corridor could help mitigate the impact of incident-related congestion, reduce secondary incidents, and help motorists make travel decisions. Furthermore, potentialfuture transit service in the corridor could benefi t from ITS, as it could help mitigate incident-related congestion for buses or provide necessary information for buses to make a determination of whether to use an alternate route.
MDOT’s University Region offi ce, which has jurisdictionwithin the study area, has no ITS deployments, althoughdesign is underway for systems along I-94. However, through partnership with the MDOT Metro Region,extension of freeway monitoring and courtesy patrol functions into the Ann Arbor area may be practical giventhe relatively contiguous nature of the Metro Detroit and Ann Arbor areas and the potential cost savings achieved by coordinating these systems.
S E C T I O N S E V E N

71U S - 2 3 F E A S I B I L I T Y S T U D YS E C T I O N
S E V E NCorridor Opportunities ConsideredM O B I L I T Y O P P O RT U N I T I E S
because the WALLY Coalition is pursuing passenger rail service separate from this study on the Great LakesCentral rail line. (Figure 7-1).
Transit Service OptionsGiven the lack of mobility options currently providedalong the US-23 corridor, a transit market evaluationdetermined the viability of transit service within the study area as an alternative to single-occupant vehicle use of the corridor. This analysis included evaluation of market areademographics, population and employment densities andtravel patterns in the area. The full results of the analysisare summarized in the US-23 Corridor Feasibility Study -Multi-Modal Analysis Technical Report located on CD in the back of this report.
While the US-23 transit market area (Figure 7-1: US-23 Transit Market Shed) did not have suffi cient residential density to support local bus service, the corridor issuitable for commuter-oriented transit service. To servethe identifi ed market effectively, it is recommended that any service be centered on a model of ridership capturedat Park-And-Ride lots, with rapid, high frequency, limitedstop service to major employment centers in Ann Arbor,including the downtown, central campus and medical areas. Additional service could be considered to the PlymouthRoad corridor, with potential connections to St. JosephMercy Hospital, the U of M East Medical Center, U of M North Campus, and potential redevelopment plans at theformer Pfi zer site along Plymouth Road at Huron Parkway.
Express bus service from a potential 8 Mile Road Park-And-Ride lot/mixed-use development, or alternatively from the existing 9 Mile Road Park-And-Ride lot, was found to be the most favorable service concept for startingcommuter service in the US-23 corridor, based on thefollowing attributes:
● Suffi cient distance from Ann Arbor needed to make service attractive
● Competitive travel times to auto travel into Ann Arbor
● Favorable demographics and travel attributes within catchment area
● Opportunity for public-private partnership for park-and-ride facilities and transit-oriented development
● Simplicity of service entirely within Washtenaw Countyfor transit operator jurisdiction
While this service was found to be most favorable, the analysis is based on generally available demographic information and not on specifi c traveler patterns andpreferences. Before any signifi cant capital expenditureis committed to start service in this corridor, a survey is needed to better pinpoint travel behaviors within thecatchment area, verify the demand and design a transitservice responsive to traveler needs. Additionally, theAATA express service from Chelsea to Ann Arbor couldprovide a comparable basis for similar service on US-23.
Bus Bypass ShouldersAn evaluation of bus operation on the shoulder of thefreeway, known as Bus Bypass Shoulders (BBS), as a potential opportunity for improving the potential for bus operation and transit reliability in the corridor was infeasible due to the following:
● Current average travel speeds along US-23 in the peak hour/peak direction of travel were greater than 35 mph, which is the typical maximum threshold for warrantingBBS.
● Should future average mainline speeds warrant BBSuse, the short running segments that are physically feasible due to bridge and roadside obstructions,(combined with the maximum 15 mph speed differential between buses and mainline speed) provide little benefi trelative to the associated cost.
● BBS is not an option along M-14 southwest of US-23,where some of the most signifi cant congestion impactstraffi c entering and leaving downtown Ann Arbor viaMain Street. Raised guardrail sections, along with the interchange at Barton Road and the bridge over the Huron River, make BBS infeasible in this area.
● Most congestion observed in the corridor is non recurring, resulting from incidents or construction. Each of these conditions could occupy the shoulder, thereby rendering BBS ineffective.

72 U S - 2 3 F E A S I B I L I T Y S T U D YS E C T I O NS E V E N Corridor Opportunities Considered
FIGURE 7-1

73S E C T I O NN U M B E R
U S - 2 3 F E A S I B I L I T Y S T U D Y
Corridor Opportunities ConsideredA D D I T I O N A L G E N E R A L P U R P O S E L A N E S S C E N A R I O
Engineering RequirementsThis concept would include the full reconstruction of US-23 between I-96 and M-14 to a six-lane cross-section, with full-width shoulders, drainage improvements, interchange ramp reconfi guration, replacement of bridges as required, and other improvements necessary to bring the corridor upto current design standards. Figure 7-2: Cross-section of US-23 General Purpose Build illustrates the cross-section of US-23 with the addition of a general purposelane in each direction.
CROSS-SECTION OF US-23 GENERAL PURPOSE BUILD
FIGURE 7-2
Operational CharacteristicsUnder this scenario, the corridor would operate much as itdoes today, but with the additional capacity associated witha third lane in each direction. All highway users, including single- and multi-occupant cars and trucks, would be ableto use all lanes of the reconstructed freeway.
For the purpose of traffi c analysis, the following operational changes have been included in corridor improvements for the 2030 analyses:
● An additional lane to each direction of US-23 betweenthe I-96 southern most ramps and the west junction of M-14 and US-23
● Elimination of the Barker Road interchange, due toinsuffi cient spacing between the existing interchangeand 8 Mile Road
● Reconstruction of the I-96/US-23 interchange to the general confi guration (shown in Figure 7-6: Typical Approach for US-23 and I-96: General Purpose Build)recommended as part of the Value Planning of I-96/US-23 Interchange Improvements report (Alfred Benesch & Company, 2001)
Traffi c AnalysisThe SEMCOG planning model provided future year (2030)peak-hour traffi c projections for US-23 with an additional general purpose lane in each direction. Based on the traffi cprojections, travel demand for the corridor will increasewith the addition of a third general purpose lane in eachdirection, relative to the future No-Build scenario. Thelargest impact occurred between North Territorial and the western US-23/M-14 junction. In the morning peak hour, approximately 1,325 additional southbound vehicles areexpected, while in the evening peak hour an additional1,025 northbound vehicles are forecasted through thisarea. Approximately 20 percent of these new trips originatefrom US-23 north of I-96, while only two percent came fromI-96. The projected largest number of additional trips isfrom the US-23 interchanges south of I-96, with the largestcontributors being to/from M-36 (15 percent) and 9 MileRoad (11 percent). Half of these new trips are continuingsouth along M-14 towards Ann Arbor, while the other half are continuing along to M-14 or further south along US-23. Most of induced US-23 demand under this scenario isdue to local area trips that were previously using the localroad system, but are now using US-23 due to the increasein capacity. Figures 7-3, 7-4 and 7-5 (Projected 3 Lane 2030 AM/PM Peak LOS) provide a graphical representation(by project segment) of the LOS along the US-23 corridor and its ramps under the 3 General Purpose Lane Scenario.

74 U S - 2 3 F E A S I B I L I T Y S T U D Y
Corridor Opportunities ConsideredS E C T I O NS E V E N
FORECASTED (2030) AM AND PM PEAK HOUR LEVEL OF SERVICEBASIC FREEWAY SEGMENTS (3 GENERAL PURPOSE LANES SCENARIO)
2030 Southbound US-23 AM Peak 2030 Southbound US-23 PM Peak
Volume,V
Flow Rate,Pc/hr
Density*,Pc/mi/ln LOS Volume,
VFlow Rate,
Pc/hrDensity*,Pc/mi/ln LOS
N of I-96 to I-96 Interchange* 3,950 2,326 41.5 E 2,675 1,575 22.6 C
I-96 Interchange to Lee Road 5,100 2,002 30.9 D 4,100 1,610 23.2 C
Lee Road to Silver Lake 5,175 2,032 31.6 D 4,025 1,580 22.7 C
Silver Lake to M-36 ( 9 Mile) 5,450 2,140 34.7 D 3,700 1,453 20.8 C
M-36 ( 9Mile) to 8 Mile 5,825 2,287 39.8 E 3,950 1,551 22.3 C
8 Mile to 6 Mile 6,525 2,562 >45 F 3,925 1,541 22.1 C
6 Mile to North Territorial 6,675 2,621 >45 F 3,950 1,551 22.3 C
N Territorial to M-14/US-23BR 6,500 2,552 >45 F 3,825 1,502 21.5 C
US-23BR/M-14 To US-23/M-14* 4,750 1,865 27.8 D 3,550 1,394 19.9 C
US-23/M-14 To Plymouth* 5,100 3,003 >45 F 2,700 1,590 22.9 C
2030 Northbound US-23 AM Peak 2030 Northbound US-23 PM Peak
Freeway Segment To/From Volume,V
Flow Rate,Pc/hr
Density*,Pc/mi/ln LOS Volume,
VFlow Rate,
Pc/hrDensity*,Pc/mi/ln LOS
Plymouth To US-23/M-14* 3,225 1,266 18.1 C 5,075 1,992 30.6 D
US-23/M-14 To US-23BR/M-14* 2,175 854 12.2 B 5,475 2,149 34.9 E
M-14/US-23BR to N Territorial 2,600 1,021 14.6 B 5,700 2,238 37.9 E
North Territorial to 6 Mile 2,725 1,070 15.3 B 6,100 2,395 44.7 E
6 Mile to 8 Mile 2,625 1,031 14.7 B 6,000 2.356 42.8 E
8 Mile to M-36 (9 Mile) 2,675 1,050 15.0 B 5,600 2,199 36.6 E
M-36 (9 Mile) to Silver Lake 2,525 991 14.2 B 5,225 2,051 32.1 D
Silver Lake to Lee Road 2,975 1,168 16.7 B 5,000 1,963 30.0 D
Lee Road to I-96 Interchange 3,150 1,237 17.7 B 4,600 1.806 26.6 D
I-96 Interchange to N of I-96* 2,450 1,443 20.6 C 3,400 2,002 30.9 D
*Outside of Project Area
TABLE 7-1
")14
NORTH TERRITORIAL
71000
2600
4750
6500
2175
")14
tu23
Projected 3 Lane2030 AM Peak Hour LOS
")14
NORTH TERRITORIAL
71000
5700
3550
5475
3825
Projected 3 Lane2030 PM Peak Hour LOS
")14
tu23
")14
tu23
East JunctionUS-23 / M-14
")14
tu23
50752700
32255100
East JunctionUS-23 / M-14
LOS
A-DEF
LOS
A-DEF
. .8/3/09 S.F.8/3/09 S.F.
West JunctionUS-23 / M-14
West JunctionUS-23 / M-14
FIGURE 7-32030 Forecasted Freeway Segments Analyses (3 General Purpose Lanes) Table 7-1 shows US-23 AM and PM Peak Hour data on basic freeway segments for the Forecasted Year 2030. Although there is improvement in the lane density of the corridor, the southbound traffi c from south of M-36 to the connection with the west junction of M-14 operates at an unacceptable LOS during the 2030 AM Peak Hour and in the returning movement inthe PM Peak Hour.

75U S - 2 3 F E A S I B I L I T Y S T U D YS E C T I O N
S E V E NCorridor Opportunities Considered
")36
2525
2675
NORTH TERRITORIAL
6 MILE
8 MILE
6525
2725
Livingston County
Washtenaw County
SILVER LAKE
5450
2625
6675
5825
tu23
Projected 3 Lane2030 AM Peak Hour LOS
")36
5225
5600
NORTH TERRITORIAL
6 MILE
8 MILE
3925
6100
Livingston County
Washtenaw County
SILVER LAKE
tu23
3700
6000
3950
3950
Projected 3 Lane2030 PM Peak Hour LOS
LOS
A-DEF
LOS
A-DEF
10/12/09 S.F.
.10/12/09 S.F.
.
§̈¦96
tu23
2450
5100
315 0
2975
SILVER LAKE
3950
5175
Projected 3 Lane2030 AM Peak Hour LOS
§̈¦96
tu23
3400
4100
4600
5000
SILVER LAKE
2675
4025
Projected 3 lane2030 PM Peak Hour LOS
1/21/09 S.F.
.1/21/09 S.F.
.
Weave B
Wea
veC
Wea
veA
Weave D
Weave B
Wea
veC
Wea
veA
Weave D
LOSA-D
EF
LOSA-D
EF
FIGURE 7-4 FIGURE 7-5
U S - 2 3 F E A S I B I L I T Y S T U D Y
Corridor Opportunities Considered76 S E C T I O NS E V E N
2030 Forecasted Ramp/Merge/Weave Analyses (3 General Purpose Lanes) Tables 7-2 thru 7-4 provide forecasted 2030 merge/weave traffi c analyses along mainline US-23 Corridor in the AM and PM Peak Hour. The analyses assume the reconstruction of the I-96/US-23 interchange by the 2030 planning horizon under all Build scenarios. The proposed confi guration of this interchange is from the recommendations of the Value Planning of I-96/US-23 Interchange Improvements (Alfred Benesch & Company, 2001). There were several assumptions pertaining tolaneage, speed limits, and distribution of traffi c in order to conduct a proper HCS analysis. Figure 7-6: Typical Approach for US-23 and I-96: General Purpose Build shows the assumptions for confi guration, laneage, and posted speeds for alldirections of travel through the interchange.
Table 7-2 shows undesirable Level of Service (LOS) at the eastbound I-96 off to southbound US-23 ramp juncture and at the southbound US-23 Collector/Distributor (C/D) to southbound US-23 on ramp juncture in the morning peak hour. Inthe evening peak hour, the table shows undesirable Level of Service (LOS) at the northbound US-23 off ramp C/D and at the westbound I-96 C/D to westbound I-96 ramp juncture. The weave movement for the northbound US-23 C/D and westbound I-96 C/D both operate at Level of Service F in the evening peak hour. Figure 7-7: I-96 and US-23 Ramp Freeway Junctions Labels provides the numerical/letter ramp labels that correspond to column 1 in Tables 7-2 and Table 7-3.
TYPICAL APPROACH FOR US-23 AND I-96: GENERAL PURPOSE BUILD
FIGURE 7-6
TABLE 7-2
FUTURE (2030) AM AND PM PEAK HOUR LEVEL OF SERVICEI-96 AND US-23 RAMP FREEWAY JUNCTIONS (3 GENERAL PURPOSE LANES SCENARIO)
AM Peak Hour PM Peak Hour
Fwy.Volume(vph)
RampVolume(vph)
DensityMerge/Diverge
LOS
Fwy.Volume(vph)
RampVolume(vph)
DensityMerge/Diverge
LOS# Mainline Ramp
1 NB US-23 To NB US-23 CD** 3150 2050 26.6 C 4600 3250 41.0 F
2 NB US-23 CD To EB I-96 2050 850 17.0 B 3250 900 28.9 D
3 NB US-23 CD From WB I-96 650 725 13.7 B 550 1500 19.4 B
4 NB US-23 From NB US-23 CD 1100 1375 20.8 C 1350 2050 28.8 D
5 WB I-96 To WB I-96 CD 2725 1375 16.7 B 4225 2650 30.3 D
6 WB I-96 CD To NB US-23 1375 725 14.2 B 2650 1500 26.9 C
7 WB I-96 CD From SB US-23 1200 650 18.0 B 2350 650 28.4 D
8 WB I-96 From WB I-96 CD 1350 1850 24.6 C 1575 3000 35.6 E
9 SB US-23 To SB US-23 CD 3950 1900 25.5 C 2675 1425 12.8 B
10 SB US-23 CD To WB I-96 1900 650 14.0 B 1425 650 9.4 A
11 SB US-23 CD From EB I-96 650 2400 27.9 C 1150 1700 26.5 C
12 SB US-23 From SB US-23 CD 2050 3050 43.5 F 1250 2850 34.6 D
13 EB I-96 To EB I-96 CD 6050 3050 30.0 D 4350 2250 18.0 B
14 EB I-96 CD To SB US-23 3050 2400 31.9 F 2250 1700 23.9 C
15 EB I-96 CD From NB US-23 1250 850 20.2 C 775 900 16.3 B
16 EB I-96 From EB I-96 CD 3000 2100 33.4 D 2100 1675 24.9 C
*vph – volume per hour **Collector-Distributor
TABLE 7-3FUTURE (2030) GENERAL PURPOSE BUILD AM AND PM
PEAK HOUR LEVEL OF SERVICEI-96 AND US-23 WEAVE ANALYSIS
AM Peak Hour PM Peak Hour
Fwy.Volume(vph)
RampVolume(vph)
DensityMerge/Diverge
LOS
Fwy.Volume(vph)
RampVolume(vph)
DensityMerge/Diverge
LOS# Mainline
A NB US-23 CD 1,200 650 32.4 D 2,350 550 56.3 F
B WB I-96 CD 650 1,200 31.7 C 1,150 2,350 69.4 F
C SB US-23 CD 1250 650 32.5 D 1,150 775 33.0 D
D EB I-96 CD 650 1,250 32.6 D 550 775 21.0 B

77U S - 2 3 F E A S I B I L I T Y S T U D YS E C T I O N
S E V E NCorridor Opportunities Considered
FIGURE 7-7
FUTURE (2030) AM AND PM PEAK HOUR LEVEL OF SERVICERAMP FREEWAY JUNCTIONS (3 GENERAL PURPOSE LANES ALTERNATIVE)
2030 Southbound US-23 AM Peak 2030 Southbound US-23 PM PeakFwy.
Volume(vph)
RampVolume(vph)
DensityMerge/Diverge
LOS
Fwy.Volume(vph)
RampVolume(vph)
DensityMerge/Diverge
LOS
Lee Road Off Ramp 5,100 500 33.8 D 4,100 950 29.9 D
Lee Road On Ramp 4,600 575 30.2 D 3,150 875 24.9 C
Silver Lake Off Ramp 5,175 400 34.4 D 4,025 650 29.3 D
Silver Lake On Ramp 4,775 675 35.1 E 3,375 325 24.7 C
M-36 (9 Mile) Off Ramp 5,450 450 35.9 E 3,700 375 27.3 C
M-36 (9 Mile) On ramp 5,000 800 31.9 E 3,325 625 23.4 C
8 Mile Off Ramp 5,825 225 37.4 E 3,950 450 28.9 D
8 Mile On Ramp 5,600 925 38.1 F 3,500 425 24.7 C
6 Mile Off Ramp 6,525 325 40.1 F 3,925 250 28.3 D
6 Mile On Ramp 6,200 475 33.2 F 3,675 275 21.4 C
N. Territorial Off Ramp 6,675 750 41.0 F 3,950 500 28.7 D
N. Territorial On Ramp 5,925 575 36.8 F 3,450 375 37.5 E
2030 Northbound US-23 AM Peak 2030 Northbound US-23 PM PeakFwy.
Volume(vph)
RampVolume(vph)
DensityMerge/Diverge
LOS
Fwy.Volume(vph)
RampVolume(vph)
DensityMerge/Diverge
LOS
N. Territorial Off Ramp 2,600 250 19.8 B 5,700 500 36.2 E
N. Territorial On Ramp 2,350 375 19.2 B 5,200 900 39.1 F
6 Mile Off Ramp 2,725 250 21.5 C 6,100 525 38.7 E
6 Mile On Ramp 2,475 150 18.6 B 5,575 425 37.5 E
8 Mile Off Ramp 2,625 250 19.3 B 6,000 750 37.1 E
8 Mile On Ramp 2,375 300 177 B 5,250 350 33.7 D
M-36 (9 Mile) EB Off ramp 2,675 125 21.3 C 5,600 350 36.8 E
M-36 (9 Mile) WB Off ramp 2,550 275 21.1 C 5,250 550 35.8 E
M-36 (9 Mile) On ramp 2,275 250 17.6 B 4,700 525 33.0 D
Silver Road Off Ramp 2,525 150 19.3 B 5,225 725 28.9 D
Silver Road On Ramp 2,375 600 21.0 C 4,500 500 31.5 D
Lee Road Off Ramp 2,975 425 21.8 C 5,000 1,375 34.3 D
Lee Road On Ramp 2,550 600 20.5 C 3,625 975 29.4 D
TABLE 7-4
Table 7-4 shows undesirable Level of Service (LOS) and increased density for all southbound ramps except the Silver Lake off ramp in the morning peak hours. The table shows undesirable LOS and increased density for all northbound ramps except the Eight Mile off ramp in the evening peak hours.
78 U S - 2 3 F E A S I B I L I T Y S T U D YS E C T I O NS E V E N Corridor Opportunities Considered
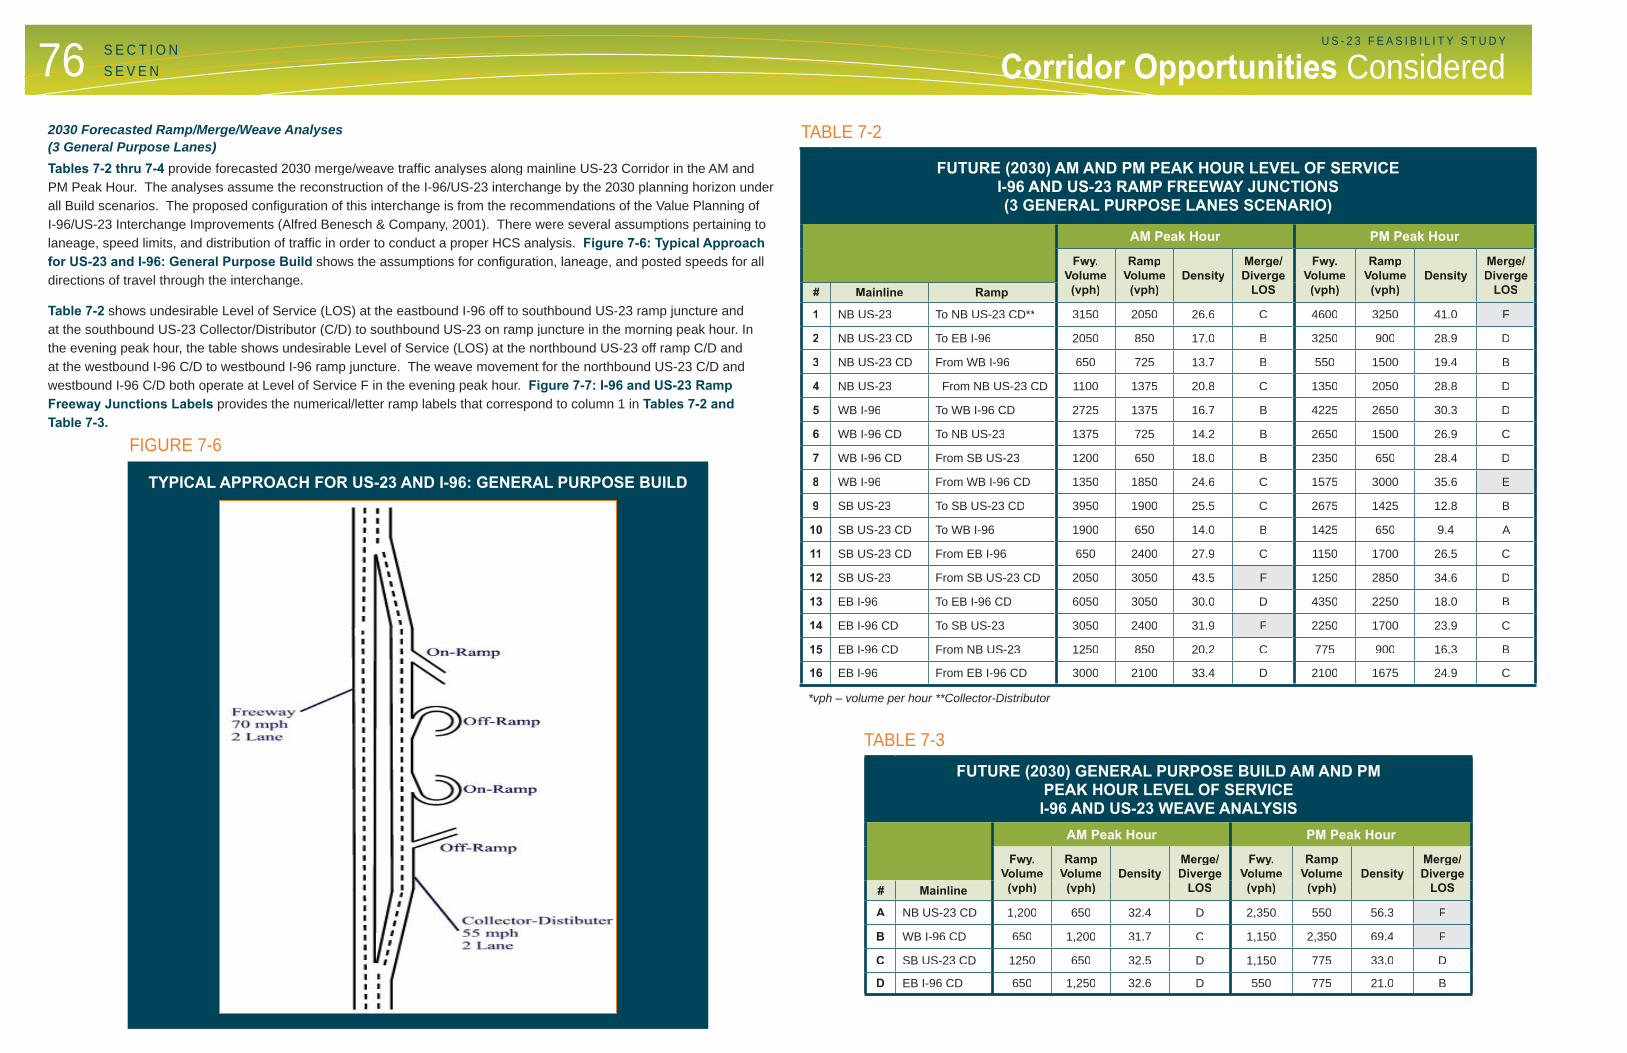
Table 7-5general purpose lane along US-23 north of the M-14 junctions. The only physical modifi cations to this interchange under this scenario would occur on the north leg of the west junction, where an additional general purpose lane in each direction of US-23 is assumed. The analysis assumed no other physical modifi cations. However, the additional general purpose lanesalong US-23 north of this interchange are expected to result in some changes to traffi c volumes through the interchange.
Under this scenario, interchange ramps will perform similarly to the No-Build condition, as physical changes are assumedonly for the north approach to the west junction. Figure 7-8: US-23 and M-14 Ramp Freeway Junctions Labels providesthe numerical/letter ramp labels that correspond to column 1 in Table 7-5.
FIGURE 7-8
TABLE 7-5FUTURE (2030) AM AND PM PEAK HOUR LEVEL OF SERVICEUS-23/M-14 RAMP FREEWAY JUNCTIONS (WEST AND EAST)
(3 GENERAL PURPOSE LANES ALTERNATIVE)
West JunctionAM Peak Hour PM Peak Hour
Volume(vph)
RampVolume(vph)
DensityMerge/Diverge
LOS
Fwy.Volume(vph)
RampVolume(vph)
DensityMerge/Diverge
LOSMainline Ramp
A SB US-23 To WB M-14 6,500 4,150 59.3 F 3,825 2,250 35.5 E
B WB M-14 From SB US-23 2,350 625 19.7 B 1,575 2,200 26.1 F
C EB M-14 To NB US-23 1,650 1,050 4.8 A 3,725 2,425 25.8 C
D EB M-14 From SB US-23 4,150 600 39.4 F 2,250 1,300 28.0 C
E NB US-23 To WB M-14 2,175 625 12.5 B 5,475 2,200 45.4 F
F NB US-23 From EB M-14 1,550 1,050 23.5 C 3,275 2,425 45.3 F
East JunctionsAM Peak Hour PM Peak Hour
Fwy.Volume(vph)
RampVolume(vph)
DensityMerge/Diverge
LOS
Fwy.Volume(vph)
RampVolume(vph)
DensityMerge/Diverge
LOSMainline Ramp
G SB US-23 To EB M-14 4,750 925 27.6 F 3,550 1125 15.6 B
H SB US-23 From WB M-14 3,825 1,275 46.2 F 1,250 625 24.3 C
I NB US-23 To EB M-14 3,225 1,900 23.4 F 5,075 350 42.2 F
J EB M-14 From NB US-23 925 1,900 27.2 C 2,300 600 33.5 D
K WB M-14 To SB US-23 2,125 1,275 16.8 B 3,025 1200 25.9 C
L NB US-23 From WB M-14 1,325 850 10.0 A 3,900 1500 39.9 F
79U S - 2 3 F E A S I B I L I T Y S T U D YS E C T I O N
S E V E N
H I G H O C C U PA N C Y V E H I C L E ( H O V ) S C E N A R I O
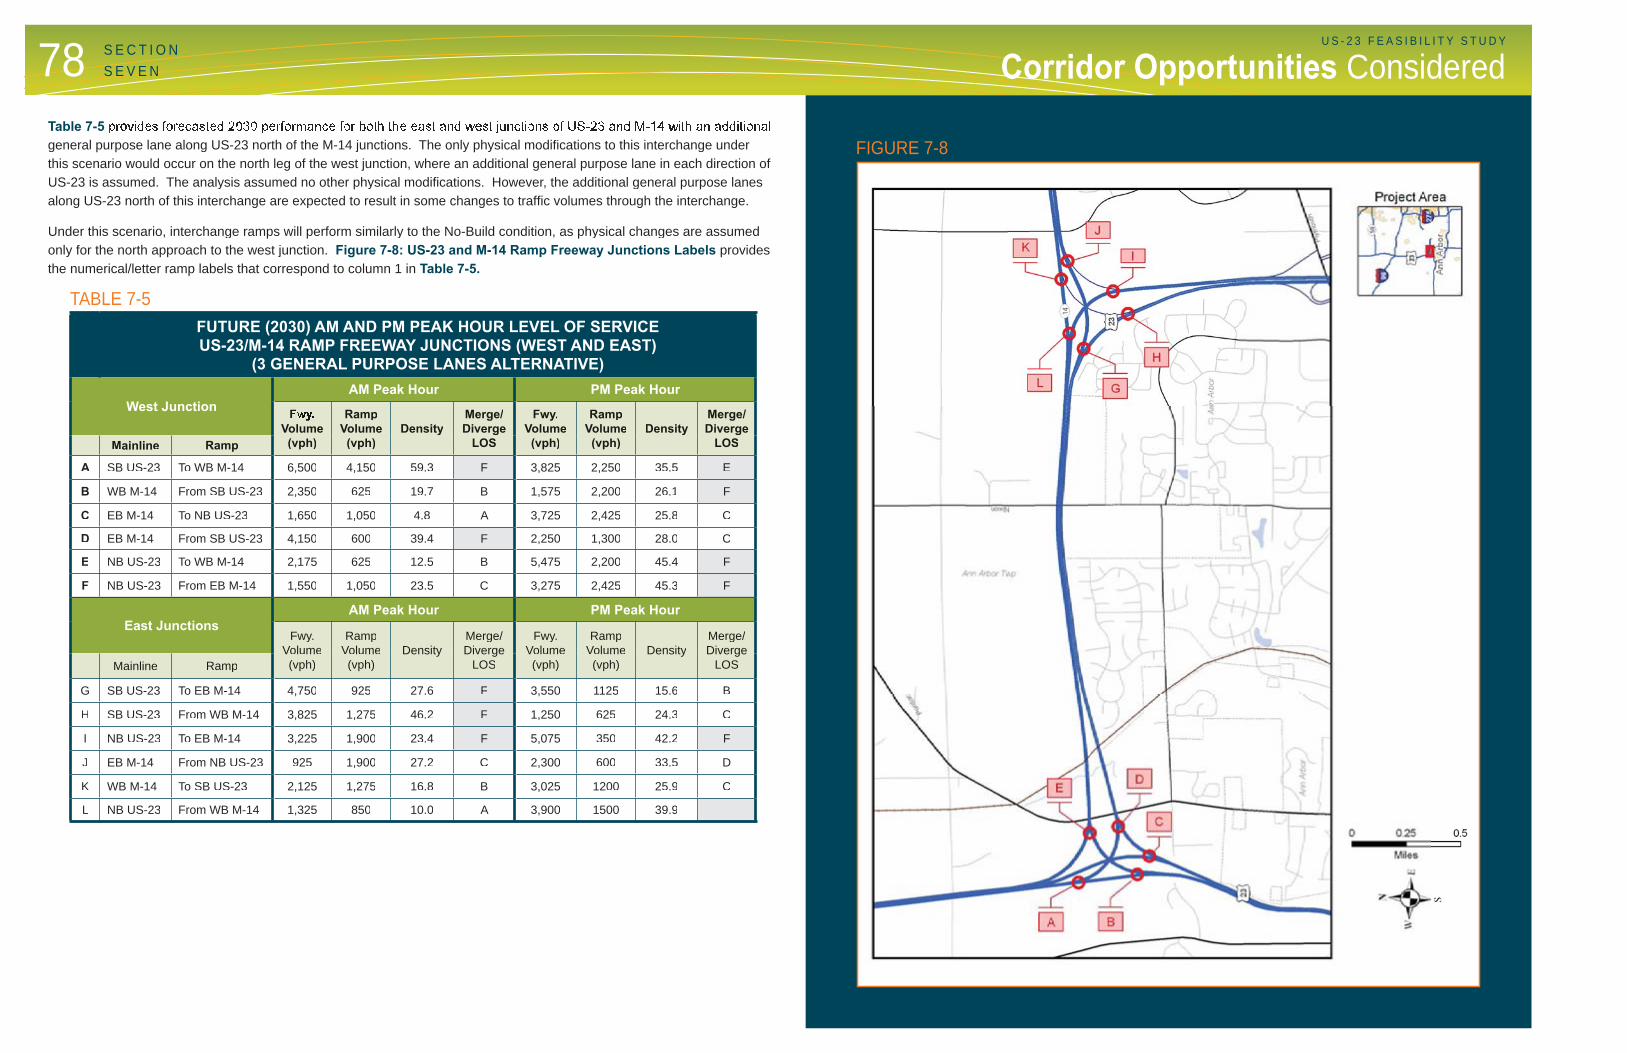
Engineering RequirementsFigure 7-9: Cross-section for US-23 with an HOV Lane
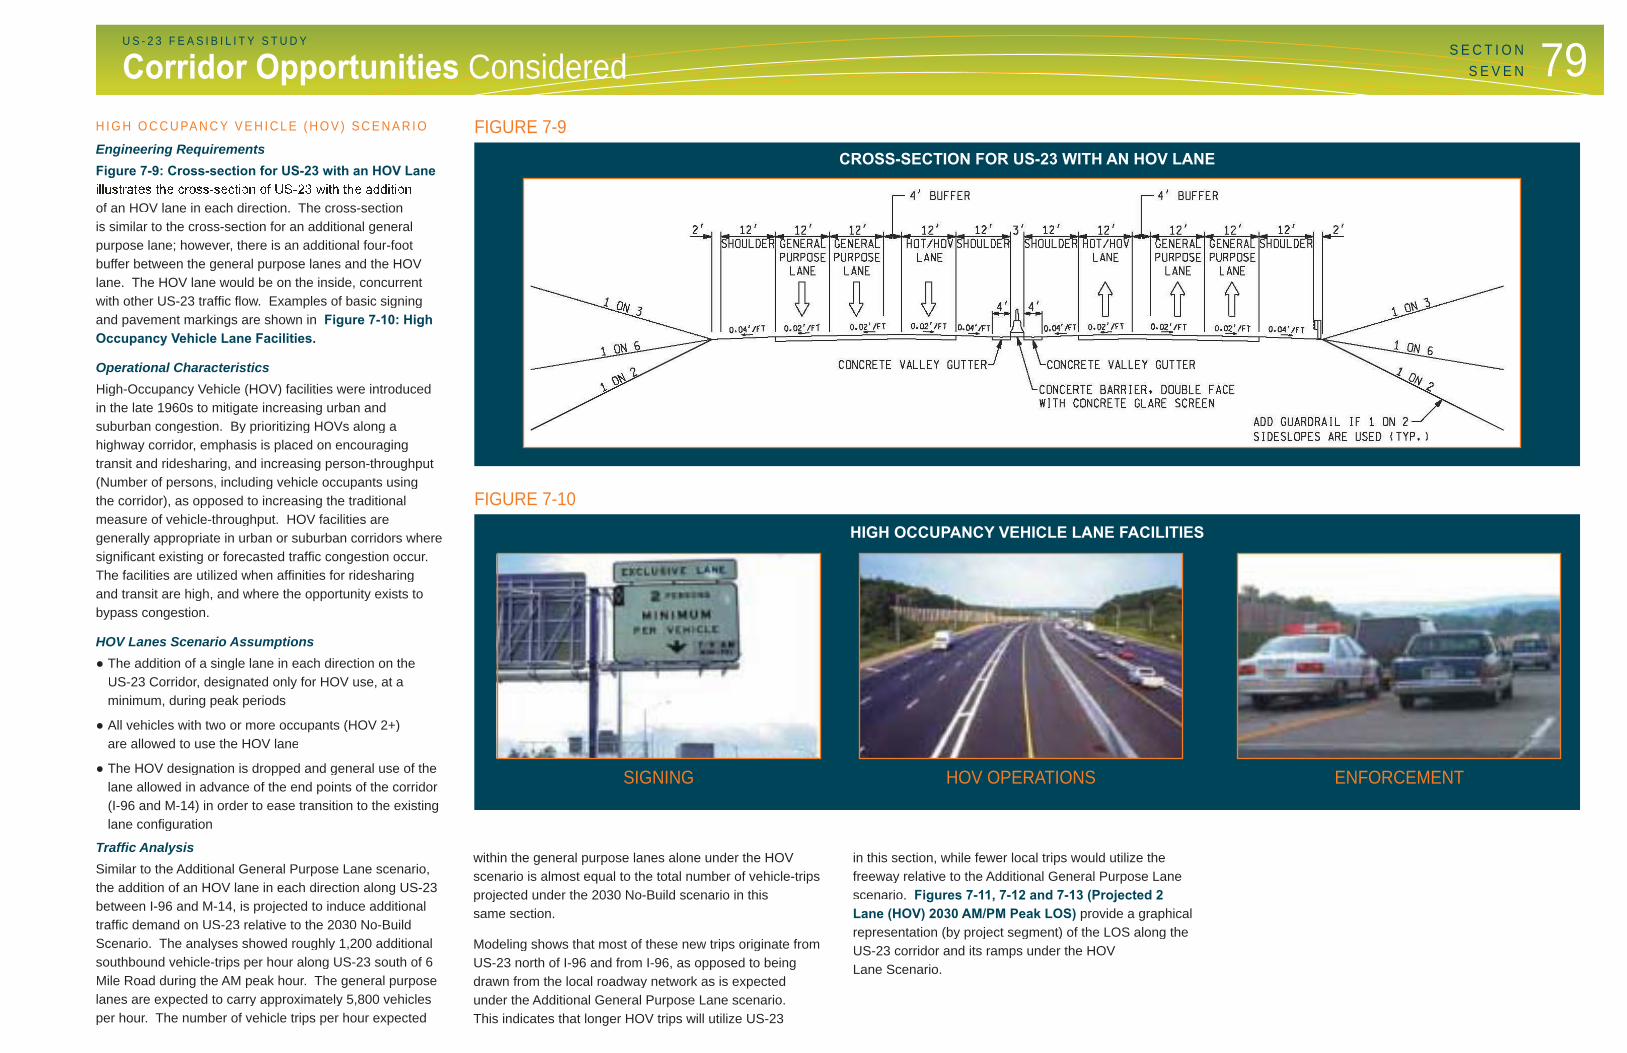
of an HOV lane in each direction. The cross-section is similar to the cross-section for an additional generalpurpose lane; however, there is an additional four-footbuffer between the general purpose lanes and the HOVlane. The HOV lane would be on the inside, concurrent with other US-23 traffi c fl ow. Examples of basic signing and pavement markings are shown in Figure 7-10: High Occupancy Vehicle Lane Facilities.
Operational CharacteristicsHigh-Occupancy Vehicle (HOV) facilities were introduced in the late 1960s to mitigate increasing urban and suburban congestion. By prioritizing HOVs along ahighway corridor, emphasis is placed on encouragingtransit and ridesharing, and increasing person-throughput (Number of persons, including vehicle occupants using the corridor), as opposed to increasing the traditional measure of vehicle-throughput. HOV facilities aregenerally appropriate in urban or suburban corridors wheresignifi cant existing or forecasted traffi c congestion occur. The facilities are utilized when affi nities for ridesharing and transit are high, and where the opportunity exists to bypass congestion.
HOV Lanes Scenario Assumptions● The addition of a single lane in each direction on the
US-23 Corridor, designated only for HOV use, at a minimum, during peak periods
● All vehicles with two or more occupants (HOV 2+) are allowed to use the HOV lane
● The HOV designation is dropped and general use of the lane allowed in advance of the end points of the corridor (I-96 and M-14) in order to ease transition to the existing lane confi guration
Traffi c AnalysisSimilar to the Additional General Purpose Lane scenario, the addition of an HOV lane in each direction along US-23between I-96 and M-14, is projected to induce additionaltraffi c demand on US-23 relative to the 2030 No-Build Scenario. The analyses showed roughly 1,200 additionalsouthbound vehicle-trips per hour along US-23 south of 6Mile Road during the AM peak hour. The general purpose lanes are expected to carry approximately 5,800 vehiclesper hour. The number of vehicle trips per hour expected
HIGH OCCUPANCY VEHICLE LANE FACILITIES
CROSS-SECTION FOR US-23 WITH AN HOV LANE
FIGURE 7-9
FIGURE 7-10
SIGNING HOV OPERATIONS ENFORCEMENT
p
within the general purpose lanes alone under the HOV scenario is almost equal to the total number of vehicle-tripsprojected under the 2030 No-Build scenario in this same section.
Modeling shows that most of these new trips originate from US-23 north of I-96 and from I-96, as opposed to being drawn from the local roadway network as is expectedunder the Additional General Purpose Lane scenario. This indicates that longer HOV trips will utilize US-23
in this section, while fewer local trips would utilize thefreeway relative to the Additional General Purpose Lanescenario. Figures 7-11, 7-12 and 7-13 (Projected 2 Lane (HOV) 2030 AM/PM Peak LOS) provide a graphicalrepresentation (by project segment) of the LOS along theUS-23 corridor and its ramps under the HOV Lane Scenario.
Corridor Opportunities Considered

80 U S - 2 3 F E A S I B I L I T Y S T U D Y
Corridor Opportunities ConsideredS E C T I O NS E V E N
")14
NORTH TERRITORIAL
71000
2350(250)
4950
5275(1225)
2175
")14
tu23
Projected 3 Lane (HOV)2030 AM Peak Hour LOS
")14
NORTH TERRITORIAL
71000
4600(1150)
3550
5575
3000(825)
Projected 3 Lane (HOV)2030 PM Peak Hour LOS
")14
tu23
")14
tu23
East JunctionUS-23 / M-14
")14
tu23
3225
East JunctionUS-23 / M-14
48504950
2700
. .10/12/09 S.F.10/12/09 S.F.
West JunctionUS-23 / M-14
West JunctionUS-23 / M-14
LOS
A-DEF
3 Lane HOV(A-D)
LOS
A-DEF
3 Lane HOV(A-D)
")36
2250(275)
2375(300)
NORTH TERRITORIAL
6 MILE
8 MILE
5475(1200)
Livingston County
Washtenaw County
SILVER LAKE
4750(900)
2425(300)
4865(1085)
5300(1225)
tu23
2350(275)
Projected 3 Lane (HOV)2030 AM Peak Hour LOS
")36
4600(1125)
4750(1225)
3000(925)
NORTH TERRITORIAL
6 MILE
8 MILE
5050(1325)
Livingston County
Washtenaw County
SILVER LAKE
tu23
2975(725)
3175(775)
3075(875)
4875(1275)
Projected 3 Lane (HOV)2030 PM Peak Hour LOS
LOS
A-DEF
3 Lane HOV(A-D)
LOS
A-DEF
3 Lane HOV(A-D)
10/12/09 S.F.
.10/12/09 S.F.
.
FIGURE 7-11 FIGURE 7-12
81U S - 2 3 F E A S I B I L I T Y S T U D YS E C T I O N
S E V E NCorridor Opportunities Considered
§̈¦96
tu23
2475
5475
315 0
2550(425)
SILVER LAKE
4200
4670(830)
LEE
LEE
Projected 3 Lane (HOV)2030 AM Peak Hour LOS
§̈¦96
tu23
3700
4100
5200
4425(1150)
SILVER LAKE
2675
3275(750)
Projected 3 lane (HOV)2030 PM Peak Hour LOS
Weave B
Wea
veC
Wea
veA
Weave D
Weave B
Wea
veC
Wea
veA
Weave D
LOS
A-DEF
3 Lane HOV(A-D)
LOS
A-DEF
3 Lane HOV(A-D)
10/12/09 S.F.
.10/12/09 S.F.
.
LEE
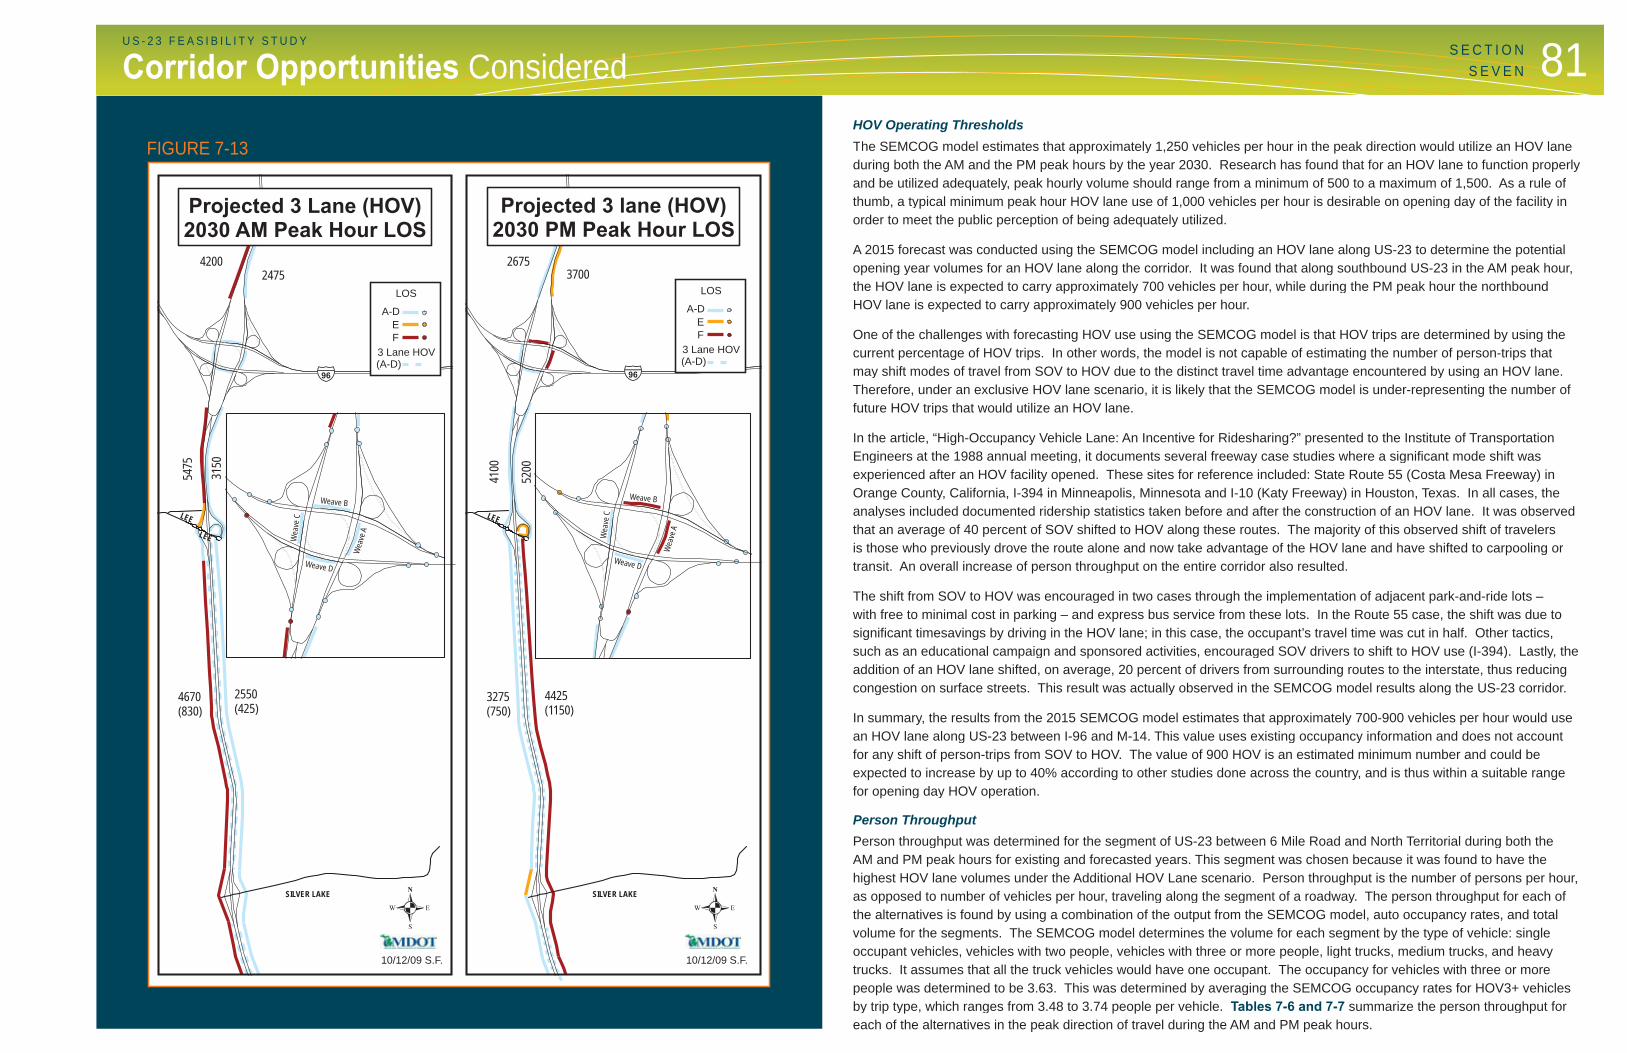
FIGURE 7-13HOV Operating Thresholds The SEMCOG model estimates that approximately 1,250 vehicles per hour in the peak direction would utilize an HOV lane during both the AM and the PM peak hours by the year 2030. Research has found that for an HOV lane to function properlyand be utilized adequately, peak hourly volume should range from a minimum of 500 to a maximum of 1,500. As a rule of thumb, a typical minimum peak hour HOV lane use of 1,000 vehicles per hour is desirable on opening day of the facility inorder to meet the public perception of being adequately utilized.
A 2015 forecast was conducted using the SEMCOG model including an HOV lane along US-23 to determine the potential opening year volumes for an HOV lane along the corridor. It was found that along southbound US-23 in the AM peak hour, the HOV lane is expected to carry approximately 700 vehicles per hour, while during the PM peak hour the northboundHOV lane is expected to carry approximately 900 vehicles per hour.
One of the challenges with forecasting HOV use using the SEMCOG model is that HOV trips are determined by using thecurrent percentage of HOV trips. In other words, the model is not capable of estimating the number of person-trips that may shift modes of travel from SOV to HOV due to the distinct travel time advantage encountered by using an HOV lane. Therefore, under an exclusive HOV lane scenario, it is likely that the SEMCOG model is under-representing the number of future HOV trips that would utilize an HOV lane.
In the article, “High-Occupancy Vehicle Lane: An Incentive for Ridesharing?” presented to the Institute of TransportationEngineers at the 1988 annual meeting, it documents several freeway case studies where a signifi cant mode shift wasexperienced after an HOV facility opened. These sites for reference included: State Route 55 (Costa Mesa Freeway) in Orange County, California, I-394 in Minneapolis, Minnesota and I-10 (Katy Freeway) in Houston, Texas. In all cases, theanalyses included documented ridership statistics taken before and after the construction of an HOV lane. It was observedthat an average of 40 percent of SOV shifted to HOV along these routes. The majority of this observed shift of travelersis those who previously drove the route alone and now take advantage of the HOV lane and have shifted to carpooling or transit. An overall increase of person throughput on the entire corridor also resulted.
The shift from SOV to HOV was encouraged in two cases through the implementation of adjacent park-and-ride lots – with free to minimal cost in parking – and express bus service from these lots. In the Route 55 case, the shift was due tosignifi cant timesavings by driving in the HOV lane; in this case, the occupant’s travel time was cut in half. Other tactics,such as an educational campaign and sponsored activities, encouraged SOV drivers to shift to HOV use (I-394). Lastly, theaddition of an HOV lane shifted, on average, 20 percent of drivers from surrounding routes to the interstate, thus reducing congestion on surface streets. This result was actually observed in the SEMCOG model results along the US-23 corridor.
In summary, the results from the 2015 SEMCOG model estimates that approximately 700-900 vehicles per hour would use an HOV lane along US-23 between I-96 and M-14. This value uses existing occupancy information and does not accountfor any shift of person-trips from SOV to HOV. The value of 900 HOV is an estimated minimum number and could be expected to increase by up to 40% according to other studies done across the country, and is thus within a suitable rangefor opening day HOV operation.
Person ThroughputPerson throughput was determined for the segment of US-23 between 6 Mile Road and North Territorial during both theAM and PM peak hours for existing and forecasted years. This segment was chosen because it was found to have thehighest HOV lane volumes under the Additional HOV Lane scenario. Person throughput is the number of persons per hour, as opposed to number of vehicles per hour, traveling along the segment of a roadway. The person throughput for each of the alternatives is found by using a combination of the output from the SEMCOG model, auto occupancy rates, and total volume for the segments. The SEMCOG model determines the volume for each segment by the type of vehicle: single occupant vehicles, vehicles with two people, vehicles with three or more people, light trucks, medium trucks, and heavy trucks. It assumes that all the truck vehicles would have one occupant. The occupancy for vehicles with three or more people was determined to be 3.63. This was determined by averaging the SEMCOG occupancy rates for HOV3+ vehicles by trip type, which ranges from 3.48 to 3.74 people per vehicle. Tables 7-6 and 7-7 summarize the person throughput for each of the alternatives in the peak direction of travel during the AM and PM peak hours.

82 U S - 2 3 F E A S I B I L I T Y S T U D Y
TABLE 7-6
TABLE 7-7
EXISTING AND FORECASTED PERSON-THROUGHPUTSOUTHBOUND US-23 - AM PEAK HOUR
Existing Future No-Build
Future Add General
Purpose LaneFuture HOV
Lane
Single Occupant Vehicles 3,357 4,330 5,319 5,032
Vehicles with 2 Occupants 391 547 671 867
Vehicles with 3+ Occupants 123 197 244 333
Trucks 329 375 441 443
Total Vehicles 4,200 5,449 6,675 6,675
Total HOV 514 744 915 1,200
Total Person Throughput 4,914 6,514 7,988 8,418
EXISTING AND FORECASTED PERSON-THROUGHPUTSOUTHBOUND US-23 - PM PEAK HOUR
Existing Future No-Build
Future Add General
Purpose LaneFuture HOV
Lane
Single Occupant Vehicles 3,096 3,927 4,716 4,684
Vehicles with 2 Occupants 506 628 747 966
Vehicles with 3+ Occupants 191 240 286 359
Trucks 257 305 351 366
Total Vehicles 4,050 5,100 6,100 6,375
Total HOV 697 868 1,033 1,325
Total Person Throughput 5,058 6,359 7,599 8,285
As shown in the tables above, the Additional HOV Lane scenario estimates a person-throughput increase in thepeak hour/peak direction between fi ve to ten percent over the Additional General Purpose Lane scenario, withroughly the same number of vehicles per hour traveling the roadway.
2030 Forecasted Freeway Segments Analyses (AdditionAL HOV Lanes) The SEMCOG Planning Model provided future year (2030) peak-hour traffi c projections for the corridor and showed induced traffi c occurring with the addition of a third High Occupancy Vehicle (HOV) Lane in each direction. Tables 7-8 and 7-9 shows US-23 AM and PM Peak Hour data on basic freeway segments in the 2030 Forecasted Year for the two-lane general purpose and HOV lane respectively. The southbound traffi c south of Lee Road to south of project limits operates at an unacceptable LOS during the 2030 AM Peak Hour for the two-lane segment of the roadway. The northbound traffi c throughout the entire project area operates at an unacceptable LOS during the 2030 PM Peak Hour for the two-lane segment of the roadway. The HOV lanes operate at acceptable LOS during the AM and PM Peak Hours.
TABLE 7-8
FORECASTED (2030) AM AND PM PEAK HOUR LEVEL OF SERVICEBASIC FREEWAY SEGMENTS (HOV LANES ALTERNATIVE) TWO-LANE GENERAL PURPOSE
2030 Southbound US-23 AM Peak 2030 Southbound US-23 PM Peak
Freeway Segment To/From Volume,V
Flow Rate,Pc/hr
Density*,Pc/mi/ln LOS Volume,
VFlow Rate,
Pc/hrDensity*,Pc/mi/ln LOS
N of I-96 to I-96 Interchange* 4,200 2,473 41.9 F 2,675 1,575 22.6 C
I-96 Interchange to Lee Road 5,475 2,149 34.9 D 4,100 1,610 23.2 C
Lee Road to Silver Lake 4,670 2,750 >45 F 3,275 1,929 29.2 D
Silver Lake to M-36 ( 9 Mile) 4,750 2,797 >45 F 2,975 1.752 25.6 C
M-36 ( 9Mile) to 8 Mile 4,865 2,865 >45 F 3,175 1,870 27.9 D
8 Mile to 6 Mile 5,300 3,121 >45 F 3,000 1,767 25.9 C
6 Mile to North Territorial 5,475 3,224 >45 F 3,075 1,811 26.7 DN Territorial to M-14/US-
23BR3 5,275 3,106 >45 F 3,000 1,767 25.9 C
US-23BR/M-14 To US-23/M-14* 4,950 1,943 29.5 D 3,550 1,394 19.9 C
US-23/M-14 To Plymouth* 4,850 2,856 >45 F 2,700 1,590 22.9 C
2030 Northbound US-23 AM Peak 2030 Northbound US-23 PM Peak
Freeway Segment To/From Volume,V
Flow Rate,Pc/hr
Density*,Pc/mi/ln LOS Volume,
VFlow Rate,
Pc/hrDensity*,Pc/mi/ln LOS
Plymouth To US-23/M-14* 3,225 1,266 18.1 C 4,950 1,943 29.5 D
US-23/M-14 To US-23BR/M-14* 2,175 854 12.2 B 5,575 2,189 36.2 E
M-14/US-23BR to N Territorial 2,350 1,384 19.8 C 4,600 2,709 >45 F
North Territorial to 6 Mile 2,425 1.428 20.4 C 5,050 2,974 >45 F
6 Mile to 8 Mile 2,350 1,384 19.8 C 4,875 2.871 >45 F
8 Mile to M-36 (9 Mile) 2,375 1,399 20.0 C 4,750 2,797 >45 F
M-36 (9 Mile) to Silver Lake 2,250 1,325 18.9 C 4,600 2,709 >45 F
Silver Lake to Lee Road 2,550 1,502 21.5 C 4,425 2,606 >45 F
Lee Road to I-96 Interchange 3,150 1,237 17.7 B 5,200 2,041 31.9 D
I-96 Interchange to N of I-96* 2,475 1,458 20.9 C 3,700 2,179 35.9 E
*Outside of Project Area
S E C T I O NS E V E N Corridor Opportunities Considered

83U S - 2 3 F E A S I B I L I T Y S T U D YS E C T I O N
S E V E NCorridor Opportunities ConsideredTABLE 7-9
FORECASTED (2030) AM AND PM PEAK HOUR LEVEL OF SERVICEBASIC FREEWAY SEGMENTS (HOV LANES ALTERNATIVE)
HOV LANE SEGMENT
2030 Southbound US-23 AM Peak 2030 Southbound US-23 PM Peak
Freeway SegmentTo/From
Volume,V
Flow Rate,Pc/hr
Density*,Pc/mi/ln LOS Volume,
V
FlowRate,Pc/hr
Density*,Pc/mi/ln LOS
Lee Road to Silver Lake 830 978 14.0 B 750 883 12.6 B
Silver Lake to M-36 ( 9 Mile) 900 1,060 15.1 B 725 854 12.2 B
M-36 ( 9Mile) to 8 Mile 1,085 1,278 18.3 C 775 913 13.0 B
8 Mile to 6 Mile 1,225 1,443 20.6 C 925 1,089 15.6 B
6 Mile to North Territorial 1,200 1,413 20.2 C 875 1,031 14.7 B
N Territorial to M-14/US-23BR 1,225 1,443 20.6 C 825 972 13.9 B
2030 Northbound US-23 AM Peak 2030 Northbound US-23 PM Peak
Freeway SegmentTo/From
Volume,V
Flow Rate,Pc/hr
Density*,Pc/mi/ln LOS Volume,
V
FlowRate,Pc/hr
Density*,Pc/mi/ln LOS
M-14/US-23BR to N Territorial 250 294 4.2 A 1,250 1,472 21.1 C
North Territorial to 6 Mile 300 353 5.0 A 1,325 1,561 22.4 C
6 Mile to 8 Mile 275 324 4.6 A 1,275 1,502 21.5 C
8 Mile to M-36 (9 Mile) 300 353 5.0 A 1,225 1,443 20.6 C
M-36 (9 Mile) to Silver Lake 275 324 4.6 A 1,125 1,325 18.9 C
Silver Lake to Lee Road 425 501 7.2 A 1,150 1,354 19.3 C
2030 Forecasted Ramp/Merge/Weave Analyses (Additional HOV Lanes)The confi guration of the interchange of US-23 and I-96 for the HOV lane scenario is similar to the Additional GeneralPurpose Lane scenario. Tables 7-10 and 7-11 summarize the anticipated performance of the US-23/I-96 interchangeduring the AM and PM peak hours.
As shown in Tables 7-10 and 7-11, similar to the Additional General Purpose Lane scenario, the majority of the ramps and weaving maneuvers operate at a LOS D or better under the assumed confi guration of this interchange. However, somemovements are anticipated to operate at LOS E or F, and would be subject to further refi nement during any future design activities in order to maintain acceptable levels of service through the planning horizon.
TABLE 7-10
FUTURE (2030) HOV LANE AM AND PM PEAK HOUR LEVEL OF SERVICEI-96 AND US-23 RAMP FREEWAY JUNCTIONS
AM Peak Hour PM Peak Hour
Fwy.Volume(vph)
RampVolume(vph)
DensityMerge/Diverge
LOS
Fwy.Volume(vph)
RampVolume(vph)
DensityMerge/Diverge
LOS# Mainline Ramp
1 NB US-23 To NB US-23 CD** 3,150 2,050 26.6 C 5,200 3,550 46.9 F
2 NB US-23 CD To EB I-96 2,050 850 17.0 B 3,550 925 31.9 D
3 NB US-23 CD From WB I-96 650 725 13.7 B 550 1,500 19.4 B
4 NB US-23 From NB US-23 CD 1,100 1,375 20.8 C 1,650 2,050 31.5 D
5 WB I-96 To WB I-96 CD 2,800 1,450 17.4 B 4,225 2,650 30.3 D
6 WB I-96 CD To NB US-23 1,450 725 15.0 B 2,650 1,500 26.9 C
7 WB I-96 CD From SB US-23 1,200 675 18.3 B 2,625 650 30.9 D
8 WB I-96 From WB I-96 CD 1,350 1,875 24.8 C 1,575 3,275 37.9 E
9 SB US-23 To SB US-23 CD 4,200 1,975 28.0 F 2,675 1,425 12.8 B
10 SB US-23 CD To WB I-96 1,975 675 17.8 B 1,425 650 9.4 A
11 SB US-23 CD From EB I-96 725 2,525 29.7 D 1,150 1,700 26.5 C
12 SB US-23 From SB US-23 CD 2,225 3,250 46.8 F 1,250 2,850 34.6 D
13 EB I-96 To EB I-96 CD 6,250 3,175 31.6 F 4,350 2,250 18.0 B
14 EB I-96 CD To SB US-23 3,175 252 33.1 F 2,250 1,700 23.9 C
15 EB I-96 CD From NB US-23 1,300 850 20.6 C 775 925 16.5 B
16 EB I-96 From EB I-96 CD 3,075 2,150 34.2 D 2,100 1,700 25.1 C
*vph – volume per hour **Collector-Distributor
TABLE 7-11
FUTURE (2030) HOV LANE AM AND PM PEAK HOUR LEVEL OF SERVICEI-96 AND US-23 WEAVE ANALYSIS
AM Peak Hour PM Peak Hour
Fwy.Volume(vph)
RampVolume(vph)
DensityMerge/Diverge
LOS
Fwy.Volume(vph)
RampVolume(vph)
DensityMerge/Diverge
LOS# Mainline
A NB US-23 CD 1200 650 32.4 D 2,625 550 63.0 F
B WB I-96 CD 725 1,200 33.2 D 1,150 2,625 76.2 F
C SB US-23 CD 1,300 725 35.1 D 1,150 775 33.0 D
D EB I-96 CD 650 1,300 33.7 D 550 775 21.0 B

84 U S - 2 3 F E A S I B I L I T Y S T U D Y
Table 7-12 provides forecasted 2030 merge/weave traffi c analyses along mainline US-23 Corridor in the AM and PM PeakHour under the HOV Lane Alternative. The analyses shows undesirable LOS and increased density for the northbound Silver Lake off ramp and all southbound ramps except the Lee Road on ramp in the morning peak hours and an undesirable LOSand increased density for all northbound ramps during evening peak hour conditions except for the Lee Road on-ramp.
FUTURE (2030) AM AND PM PEAK HOUR LEVEL OF SERVICERAMP FREEWAY JUNCTIONS (HOV LANE ALTERNATIVE)
2030 Southbound US-23 AM Peak 2030 Southbound US-23 PM PeakFwy.
Volume(vph)
RampVolume(vph)
DensityMerge/Diverge
LOS
Fwy.Volume(vph)
RampVolume(vph)
DensityMerge/Diverge
LOS
Lee Road Off Ramp 5,475 600 35.6 E 4,100 950 29.9 D
Lee Road On Ramp 4,875 625 32.1 D 3,150 875 24.9 C
Silver Lake Off Ramp 4,670 425 65.9 F 3,275 650 35.2 E
Silver Lake On Ramp 4,245 575 47.7 F 2,625 325 30.7 D
M-36 (9 Mile) Off Ramp 4,750 550 50.4 F 2,975 375 32.4 D
M-36 (9 Mile) On ramp 4,200 850 48.0 F 2,600 625 30.5 D
8 Mile Off Ramp 4,865 200 68.4 F 3,175 450 34.4 D
8 Mile On Ramp 4,625 775 51.6 F 2,725 425 30.9 D
6 Mile Off Ramp 5,300 300 56.0 F 3,000 250 32.7 D
6 Mile On Ramp 5,000 450 50.4 F 2,750 275 28.3 D
N. Territorial Off Ramp 5,475 875 57.5 F 3,075 500 33.2 D
N. Territorial On Ramp 4,600 700 52.3 F 2,575 375 31.0 D
2030 Northbound US-23 AM Peak 2030 Northbound US-23 PM PeakFwy.
Volume(vph)
RampVolume(vph)
DensityMerge/Diverge
LOS
Fwy.Volume(vph)
RampVolume(vph)
DensityMerge/Diverge
LOS
N. Territorial Off Ramp 2,350 250 24.5 C 4,600 450 48.0 F
N. Territorial On Ramp 2,100 375 25.9 B 4,150 975 49.7 F
6 Mile Off Ramp 2,425 250 26.8 C 5,050 600 53.4 F
6 Mile On Ramp 2,175 150 25.3 C 4,450 375 48.1 F
8 Mile Off Ramp 2,350 250 25.2 C 4,875 650 50.0 F
8 Mile On Ramp 2,100 300 24.1 C 4,225 475 45.1 F
M-36 (9 Mile) EB Off ramp 2,375 125 26.7 C 4,750 300 50.7 F
M-36 (9 Mile) WB Off ramp 2,250 275 25.7 C 4,450 500 48.0 F
M-36 (9 Mile) On ramp 1,975 250 23.5 C 3,950 550 44.2 F
Silver Road Off Ramp 2,250 150 24.3 C 4,600 725 48.1 F
Silver Road On Ramp 2,100 600 27.8 C 3,875 575 43.9 F
Lee Road Off Ramp 2,975 425 21.8 C 5,575 1,375 36.7 E
Lee Road On Ramp 2,550 600 20.5 C 4,200 1,000 32.7 D
*vph – volume per hour
TABLE 7-12
Table 7-13 summarizes the anticipated levels of service for the west and east junctions of the US-23/M-14 interchanges. Because this scenario would not differ physically or operationally from the Additional General Purpose Lane scenario, theexpected future ramp performance will not be appreciably different between the two scenarios.
TABLE 7-13FUTURE (2030) HOV LANE AM AND PM PEAK HOUR LEVEL OF SERVICE
US-23 AND M-14 RAMP FREEWAY JUNCTIONS (WEST AND EAST)
West JunctionAM Peak Hour PM Peak Hour
Fwy.Volume(vph)
RampVolume(vph)
DensityMerge/Diverge
LOS
Fwy.Volume(vph)
RampVolume(vph)
DensityMerge/Diverge
LOSMainline Ramp
A SB US-23 To WB M-14 6,500 4,350 60.5 F 3,825 2,250 35.5 E
B WB M-14 From SB US-23 2,350 625 17.8 B 1,575 2,200 26.1 C
C EB M-14 To NB US-23 1,650 1,050 4.8 A 3,775 2,475 26.3 C
D EB M-14 From SB US-23 4,350 600 41.2 F 2,250 1,300 28.0 C
E NB US-23 To WB M-14 2,175 625 12.5 B 5,575 2,200 46.4 F
F NB US-23 From EB M-14 1,550 1,050 23.5 C 3,375 2,475 46.3 E
East JunctionsAM Peak Hour PM Peak Hour
Fwy.Volume(vph)
RampVolume(vph)
DensityMerge/Diverge
LOS
Fwy.Volume(vph)
RampVolume(vph)
DensityMerge/Diverge
LOSMainline Ramp
G SB US-23 To EB M-14 4,750 925 27.6 F 3,550 1125 15.6 B
H SB US-23 From WB M-14 3,825 1,275 46.2 F 1,250 625 24.3 C
I NB US-23 To EB M-14 3,225 1,900 23.4 F 5,075 350 42.2 F
J EB M-14 From NB US-23 925 1,900 27.2 C 2,300 600 33.5 D
K WB M-14 To SB US-23 2,125 1,275 16.8 B 3,025 1200 25.9 C
L NB US-23 From WB M-14 1,325 850 10.0 A 3,775 1,800 40.7 F
*vph – volume per hour
S E C T I O NS E V E N Corridor Opportunities Considered

85U S - 2 3 F E A S I B I L I T Y S T U D Y
M14
US 23/M14Lee Rd. Silver Lake Rd. M36 8 Mile Rd. 6 Mile Rd.Territorial
Rd.
Tolling Zone
Access/Egress Points
Proposed Managed Lanes
LEGEND
Tolling Zone
Access/Egress Points
Proposed Managed Lanes
LEGEND
N
H I G H O C C U PA N C Y TO L L ( H O T L A N E S C E N A R I O )
Operational CharacteristicsA High-Occupancy Toll (HOT) lane is a managed lane thatallows a mix of free and for-fee travel, dynamically adjusted to maintain free-fl ow operating conditions, thus maintainingthe advantage for users relative to utilization of the generalpurpose lanes. Typically, all HOVs (or at a minimum HOVswith three or more occupants) are able to utilize the laneat no cost, while SOVs are charged a fee for use. These user fees vary depending on the level of congestion in the general purpose lanes, and the density of traffi c in the HOT lane, in order to maintain optimum utilization of the HOT lane. HOT lanes represent a tool to enable road operatorsto achieve optimum use of the overall facility in terms of person-throughput by “selling” underutilized capacity of a traditional HOV lane while dynamically maintaining the operating conditions and travel time advantage of using the HOT lane.
Because of the requirements for tolling of the lanes, accessto HOT lanes is typically more controlled than a traditionalHOV lane. In the case of US-23, access points to the HOT lanes, depicted in Figure 7-14: Conceptual HOT Lanes and Tolling Points were designed based on travelcharacteristics of the corridor, along with typical thresholds for minimum operating length.
Four scenarios were considered for HOT lane operationto determine the usage of the lane and potential revenuegeneration: More information regarding methodology and conclusions are located in the “Managed Lanes and Toll Finance Assessment” report located on a compact disc inthe back of this report.
● Scenario 1: All SOVs tolled, all HOVs free● Scenario 2: All SOVs and HOV2s tolled, HOV3+ free● Scenario 3: All vehicles tolled
● Scenario 4: All vehicles tolled on all lanes
Under each of these scenarios, no commercial truckswould be allowed to utilize the HOT lane, and transit and emergency vehicles would be allowed to use the lane for no charge.
The HOT lane scenario would function similar to the HOVLane scenario, but would transfer a small portion of SOVtraffi c from the general purpose lanes to the HOT lane. In doing so, the shift of SOV traffi c could help to alleviatesome general purpose lane congestion, while maintainingfree-fl ow conditions in the HOT lane using dynamic pricing. Therefore, traffi c operational performance is expected to
S E C T I O NS E V E NCorridor Opportunities Considered
be a slight improvement over the Additional HOV Lanescenario. Traffi c fl ow over all lanes would be more uniformand the HOT lane utilized to its maximum potential.
Engineering RequirementsThe overall roadway infrastructure of the Additional HOT Lane scenario would be similar to the HOV Lane scenario. However, while the HOV lane would have relatively frequent access points, the HOT lanes would have morelimited locations for traffi c to enter and exit the facility due to tolling requirements. In addition, electronic tolling equipment is required at one location along the corridor,including overhead gantries for tag-reader or plate-reader technology. The additional cost of implementing a HOT lane scenario is anticipated to be approximately $4 million.
L A N D U S E O P P O RT U N I T I E S
Transit-Oriented DevelopmentTransit-Oriented Development (TOD) is a strategy tocreate compact, walkable, vibrant, livable developments and communities around a high quality transit investment. Many communities, developers and transit agenciesaround the country are participating in TOD programsthat focus growth and development near transit corridors
and station areas. Ultimately, TOD leverages the privatereal estate market to build at a greater density than thecommunity average, with a mix of uses and a transit-oriented design.
An effective TOD contains residential and commercial usesconcentrated within close proximity (generally .25 mile) of a transit stop or station. Walking distances to transit at the home and work ends of the trip have the greatest infl uenceover transit usage. In general, transit mode share declinesas the distance to a transit station increases. Research on TOD projects has shown that residents living near stations are fi ve- to six-times more likely to ride transit. As a result, TOD implementation should focus on station-area planningand often involves a joint development agreement betweentransit agencies, local government and one or moredevelopers.
On May 20, 2008, the US-23 Corridor Coalition and project stakeholders met for a TOD workshop in order to discuss the opportunities and challenges for implementingtransit in the corridor. In general, many of the local governments in the study area are updating master plans and zoning ordinances to promote mixed use and higher density development along the US-23 corridor. In
addition, the Northfi eld Township Board recently approved a developer’s mixed-use development in the southwest corner of the Eight Mile and US-23 interchange, and the Village of Hamburg is studying a town center developmentusing TOD principals. Both of these areas are potentialstation stops for the proposed WALLY rail line. Utilizingthe existing Park-And-Ride lots as possible commuter bus station along the US-23 corridor could also provide opportunities for TOD investment.
A wide variety of TOD projects have been built or planned around the country. There is no singular defi nition or formula for TOD to reach a desired outcome. Research on TOD case studies recognizes the following important observations and factors that communities and planningagencies should consider for further evaluation:
● TODs are a catalyst for achieving broader planning objectives such as quality of life and increased transit mode share.
● Successful TODs start with shared visions; political leadership, on-going public input, and diverse public-private partnerships are essential for TOD success.
● Designing for pedestrian usage at the outset of plan development is critical for the success of projects.
● Communities should initiate TOD planning considerations early as TODs are cumulative products of many individual development decisions.
● Adjust the parking requirements by appropriately limiting it within the TOD considering the context of the use and location – too much parking is a huge barrier to TOD, and is what sets TOD apart from traditional development.
● Plan for a mix of uses early in the process.
● TOD requires experienced leadership.
● Density does matter in TOD performance.
● Demonstration projects can accelerate TOD implementation.
● Institutional coordination and government streamliningare crucial to TOD implementation.
CONCEPTUAL HOT LANES AND TOLLING POINTS
FIGURE 7-14

0.1 0.1 0.2
2 8.7
5.5 5 .9 5.9
50.8
-
10
20
30
40
50
60
SCENARIO 1 SCENARIO 2 SCENARIO 3 SCENARIO 4AN
NUA
L R
EVEN
UE
IN M
ILLI
ONS
OF
DO
LLA
RS
2 01 5
2 03 0
ANNUAL NET REVENUE IN MILLIONS OF DOLLARS (SCENARIO 4)
FIGURE 8-2
U S - 2 3F E A S I B I L I T YS T U D YToll Finance Analyses86
Section EightToll Finance AnalysesI S S U E S A N D F U N D I N G O P P O RT U N I T I E S F O R H I G H WAY I M P R O V E M E N T S
Given the current economic climate and declining revenues for transportation, funding major highway improvementshas become a signifi cant challenge. As such, the Michigan legislature established the Transportation FundingTask Force (TF2) charged with evaluating alternative mechanisms for funding transportation improvements. Tolling is an option to consider for funding projects and supporting overall transportation revenues.
A preliminary traffi c and revenue assessment was conducted in order to determine the degree to which tolling could help offset the capital costs of proposedimprovements along US-23. There were several scenarios considered, including:
● Scenario 1: One additional lane in each direction designated as a managed lane.Only single occupant vehicles (SOV) tolled in the managed lanes. High occupancy vehicles with twooccupants (HOV2) and with three or more occupants(HOV3+) would be free. Trucks not allowed in themanaged lanes.
● Scenario 2: SOV and HOV2 tolled in the managed lanes, HOV3+ free. Trucks not allowed in the managed lanes.
● Scenario 3: SOV, HOV2 and HOV3+ tolled in managed lanes.Trucks not allowed in the managed lanes.
● Scenario 4: All vehicles tolled on all lanes, trucks pay higher tolls.No managed lanes, three lanes in each direction.
MethodologyThe analytical approach involved the development of a travel forecasting tool that could model the abovementioned toll scenarios. A selected sub-area of the SEMCOG regional model calibrated traffi c counts alongUS-23 using the 2005 traffi c counts. After achievingan acceptable basic calibration, a tolling algorithm wasintroduced within the model. The tolling model then analyzed the scenarios mentioned above. As the initial step, a toll sensitivity analysis was performed using a range of toll rates. The suitable toll rates thus determinedthe revenue estimate for years 2015 and 2030. Next, these revenue estimates aided in developing a revenueforecast for the 40-year period from 2015 to 2055. Further analysis used the revenue forecast to determine thefi nancial viability of the proposed tolling scenarios.
Revenue EstimatesFigure 8-1 represents the estimated annual net toll revenue for each scenario using the above methodology and shows negligible revenue potential for all managed-lanes scenarios. The only scenario projected to have a signifi cant revenue potential is Scenario 4, which involves tolling all traffi c in the corridor, without any managed lanes.
Using the toll revenue estimates for 2015 and 2030, arevenue forecast was developed for each scenario for a 40-year period from 2015 to 2055. Figure 8-2 showsthe annual net revenue for Scenario 4 after adjusting for infl ation and the effects of the “ramp-up” period or initialacceptance phase for the new facility.
$0
$20
$40
$60
$80
$100
$120
$140
2015
2020
2025
2030
2035
2040
2045
2050
2055
NET TOLL REVENUE (BY SCENARIO)
FIGURE 8-1
S E C T I O N E I G H T

87U S - 2 3 F E A S I B I L I T Y S T U D Y
Toll Traffic AnalysesS E C T I O N
E I G H T
for the period from 2015 to 2055, a preliminary analysis of bonding capacity was conducted for each scenario. This analysis used two scenarios relating to roadway operations and maintenance (O&M) cost. In the fi rst case, the toll revenue is credited to the roadway O&M costs. In thesecond case, MDOT will continue to maintain the roadwayunder present arrangements. The results of this analysisare summarized in Table 8-1.
ConclusionsThe following are the major conclusions from this preliminary analysis of revenue potential under the four tolling scenarios:
•The managed lanes scenarios provide relatively lowrevenue potential, not suffi cient for project fi nancing.
•The differences between various tolling methodologieswithin the managed lanes scenarios 1, 2 and 3, are not signifi cant in terms of revenue.
TABLE 8-1
BONDING CAPACITY BY SCENARIO
Bonding Capacity (Millions of Dollars)
Roadway O&M fromToll Revenue Roadway O&M by MDOT
Scenerio 1 $18 $24
Scenerio 2 $19 $25
Scenerio 3 $20 $26
Scenerio 4 $273 $279
NOTES:1. Based on 2015-2055 revenue projection2. Construction period 2012-20153. Assumed roadway maintenance cost of 1.0 million per year4. Assumed interest rate of 6.0 percent5. Cost of construction assumed to be 413 million (current dollars)
• Any effort to generate higher revenue from managedlanes approach will be at the cost of excessive congestion in the general purpose lanes.
• The only scenario expected to generate signifi cantrevenue is Scenario 4, which assumes tolling all traffi c on the facility.
• The expected revenue from Scenario 4 will not besuffi cient to cover all the cost of construction, but could offset a signifi cant portion of the cost.
• The traffi c model developed for this study was basedon the SEMCOG regional travel forecasting modelavailable at the time this study began. The socio-economic forecasts used in the SEMCOG model may need revisions in view of recent economic changes in the state of Michigan, particularly related to the auto industry.The data sets available for the current study may nothave adequate refl ection of the more recent economicdownturn. The results of this study, therefore, need interpretation in the proper context of the changes in the regional and national economies.

U S - 2 3F E A S I B I L I T YS T U D Y88 Corridor Recommendations
Chapter NineCorridor RecommendationsG E N E R A L R E C O M M E N D AT I O N S F O R F U T U R E A C T I O N O R F U RT H E R S T U D Y
The following are opportunities recommended for implementation or further consideration in future phasesof study. Funding opportunities under the Department’s traditional programs should be pursued in addition to the following areas:
● Transit Service: It was determined that a commuter-oriented transit service was a viable option for improvingmobility along the US-23 corridor, and should be considered for further study and implementation bylocal transit operators. It is recommended that service be considered either between the existing 9 Mile Road(M-36) carpool lot, or from a potential Park-And-Ride lot opportunity at 8 Mile Road, working in partnership with a local developer. These locations provide the optimum distance from employer concentrations in Ann Arbor.
● Tolling: Given the current economic climate and declining tax revenues for transportation, tolling should continue to be an option for helping to fund future capitalimprovements to the corridor, or at least providing someoperating revenue into the future. The toll fi nanceanalysis found that while tolling is not the single answer to funding improvements in the corridor, signifi cant revenue is possible from a full-tolling scenario given thelack of viable alternatives to the corridor.
● Transit-Oriented Development: Communities along the corridor should consider adopting land use policies that encourage Transit-Oriented Development (TOD) as a means to improving the viability of transit as amobility option in the corridor. TOD is an effective tool to encourage transit use and reduce vehicle trips by providing a mix of uses in close proximity to oneanother, and at a pedestrian scale. Without a TOD-typeapproach, land use densities in communities along thecorridor will inhibit further development of transit as an alternative to single-occupant vehicle use of US-23.
C O R R I D O R S P E C I F I C R E C O M M E N D AT I O N S F O R A L L S E G M E N T S
● Near-Term Opportunities
Deploy ITS TechnologiesIt is recommended that ITS be deployed along US-23in the south segment as a means to better monitor congestion and respond to incidents in the area. Non-recurring congestion was found to be a key factor in traffi c issues in the corridor, and ITS could help to mitigate this factor by providing improved informationto motorists and enabling faster incident clearance.
Expand Freeway Courtesy PatrolExpansion of the Freeway Courtesy Patrol Program currently utilized in MDOT’s Metro Region could alsohelp mitigate non-recurring congestion by enabling faster clearance of disabled vehicles from the roadside.
● Long-Term Opportunities
Mainline US-23 Reconstruction and WideningBoth the assessment of current infrastructure conditions and traffi c capacity analysis illustrate the long-termneed for replacement and widening of mainline US-23. The north segment is the least critical in terms of traffi c congestion. The mainline will experience congestion by the 2030 planning horizon without improvements and selected segments of the US-23 Corridor will continueto operate at unacceptable LOS during peak hours,even with an additional lane.. It is recommended that all three scenarios for capacity enhancement (3 Lane General Purpose, HOV, HOT) be carried forward for further evaluation in the environmental process, as each was found to present a viable option for improving traffi coperations and throughput of the corridor.
C O R R I D O R S P E C I F I C R E C O M M E N D AT I O N S F O R T H E S O U T H S E G M E N T
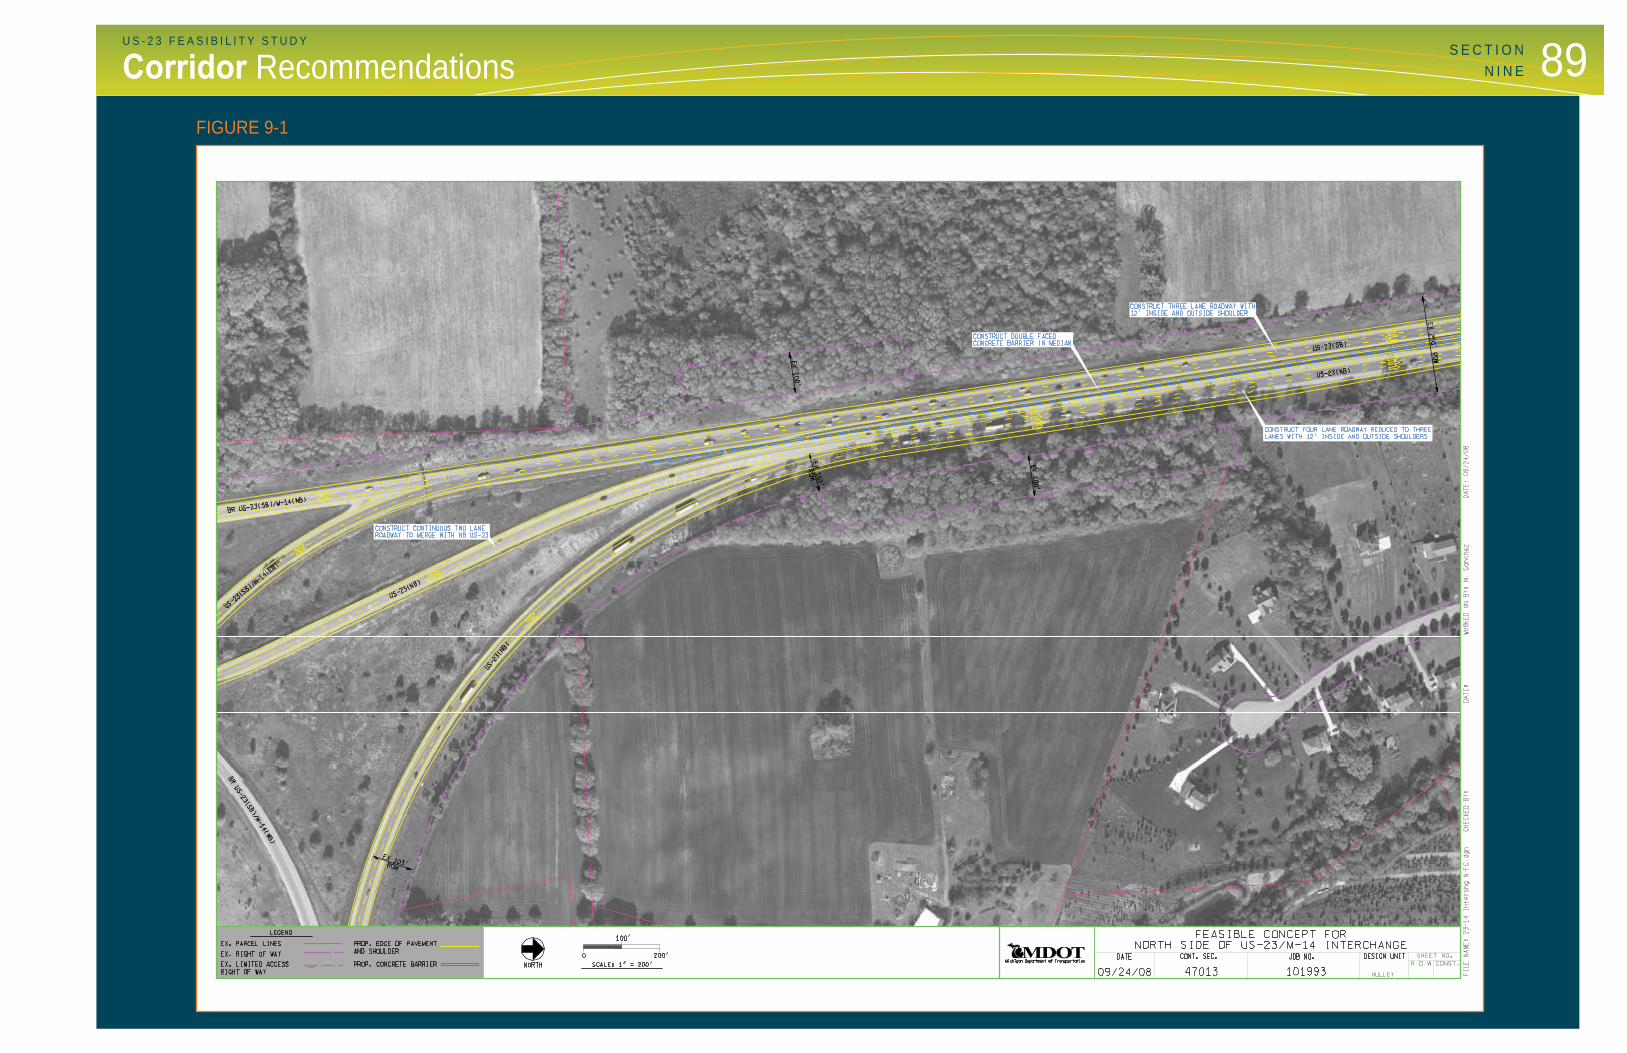
Figures 9-1 and 9-2 located in the back of this section provide feasibility concepts for the interchanges and freeway sections in the south segment.
● Mid-Term Opportunities
Replace Bridges over US-23The bridges at Warren Road, Joy Road, and N. TerritorialRoad have a horizontal clearance that will limit the ability to widen US-23 in the future. All three bridges have inadequate underclearance that present issues for moving oversized freight. While the condition of thesestructures is currently rated “Fair”, replacing each duringthe mid-term timeframe as individual projects will allowfor future widening when conditions require and funding becomes available for lane replacement.
Operational ImprovementsImprovements to the North Territorial Road interchange include lengthening all ramp acceleration anddeceleration lanes and evaluating ramp terminaloperations. This would include adjusting terminalturn lanes, signal optimization and investigating theopportunity for roundabouts. Modifi cations to the US-23/M-14 west tri-level would improve safety and weaving defi ciencies.
C O R R I D O R S P E C I F I C R E C O M M E N D AT I O N S F O R T H E C E N T E R S E G M E N T
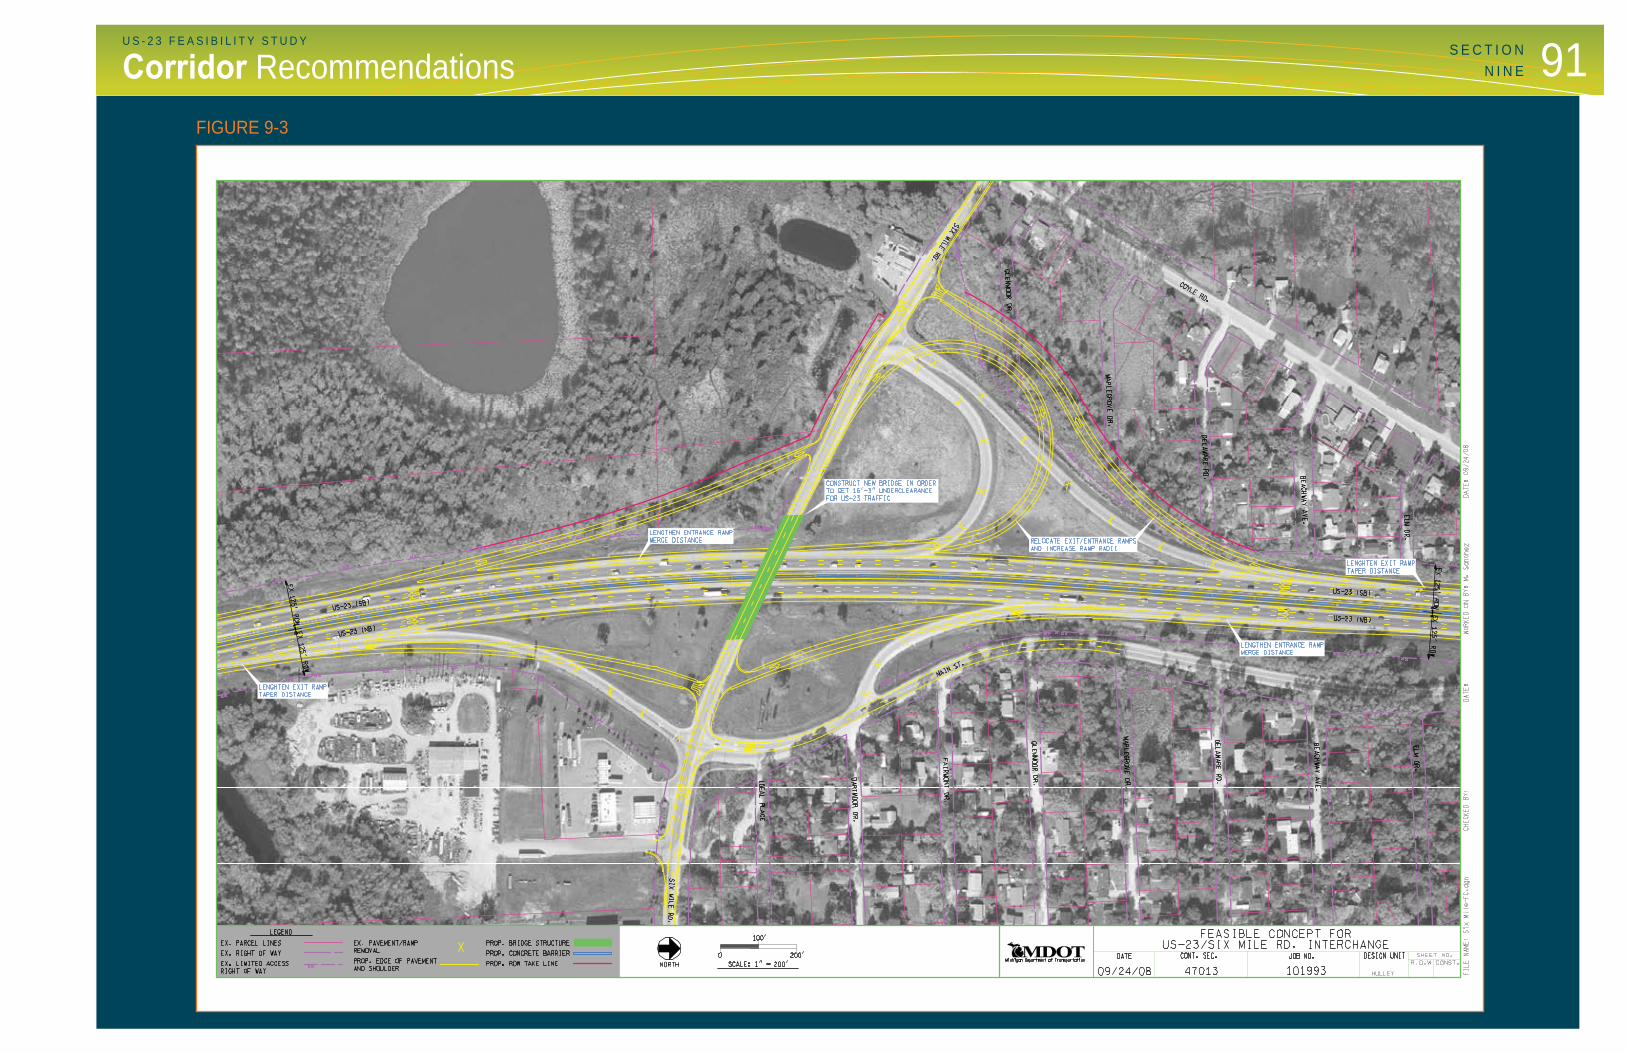
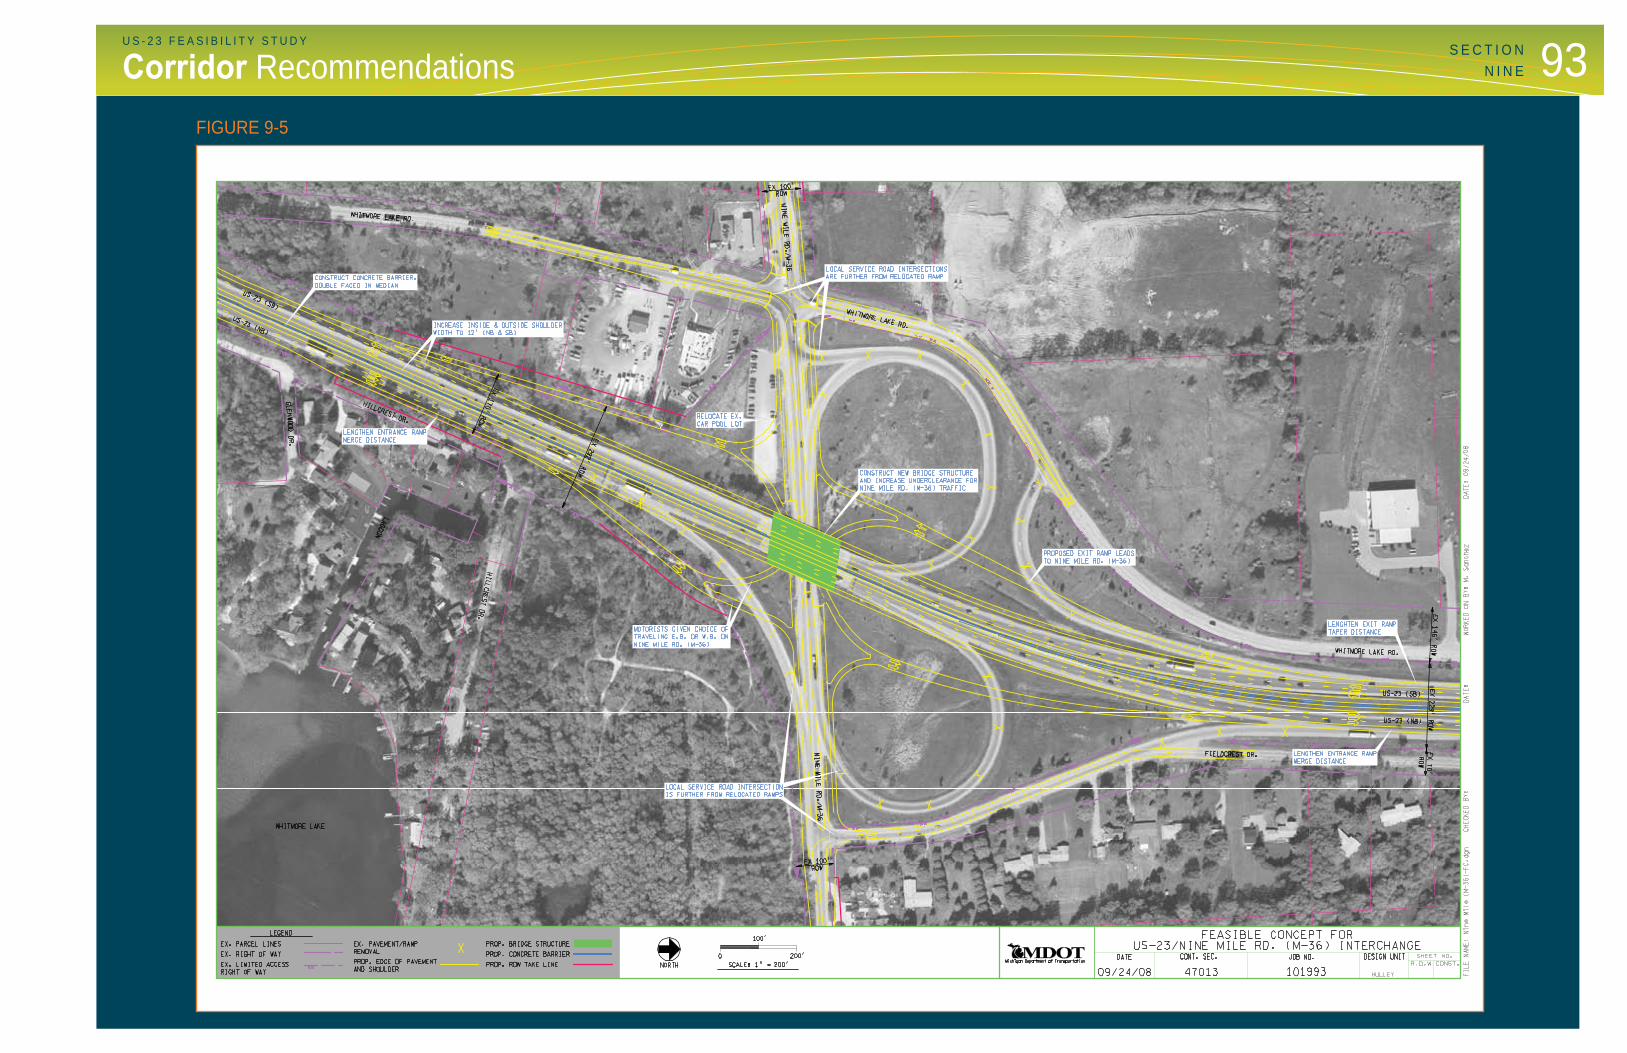
Figures 9-3 through 9-5 located in the back of this section provide feasibility concepts for the interchanges and freeway sections in the center segment.
● Mid-Term Opportunities
Replace Critical BridgesThe 6 Mile Road and 8 Mile Road bridges over US-23rated in “Poor” condition and are in need of replacement. These replacements could also provide the horizontal clearance required for future widening of US-23 when conditions warrant and funding is available.
Replace/Widen US-23 Mainline BridgesThe bridges carrying US-23 over Barker Road, the CSX railroad and 9 Mile Road (M-36) are designed to carry two lanes of traffi c in each direction only and will requirewidening to accommodate future widening of US-23. These structures currently rate in “Fair” condition.
Operational ImprovementsImprovements to all interchanges in the center segment include lengthening every ramp accelerationand deceleration lanes. Evaluating ramp terminal operations at the Eight Mile and M-36 (Nine Mile) interchanges would include adjusting terminal turn lanes,signal optimization and investigating the opportunity for roundabouts. MDOT will continue to monitor the interchange needs at the 6 Mile Road and Barker Road interchanges due to potential land developmentchanges.
C O R R I D O R S P E C I F I C R E C O M M E N D AT I O N S F O R T H E N O RT H S E G M E N T
Figures 9-6 and 9-7 located in the back of this sectionprovide feasibility concepts for the interchanges andfreeway sections in the north segment.
● Mid-Term Opportunities
Operational ImprovementsImprovements to the Silver Lake Road and Lee Road interchanges include lengthening all ramp acceleration and deceleration lanes and evaluating ramp terminaloperations. MDOT will continue to monitor the interchange needs at the Silver Lake Road interchange due to potential land development changes.
● Long-Term Opportunities
Replace Constraining BridgesAll bridges in the north segment constrain the ability to widen US-23 in the future and require either widening or replacement. MDOT should evaluate each on a case-by-case basis given current structure conditions and available funds.
S E C T I O N N I N E
89U S - 2 3 F E A S I B I L I T Y S T U D Y
Corridor RecommendationsS E C T I O N
N I N E
FIGURE 9-1

90 U S - 2 3 F E A S I B I L I T Y S T U D YS E C T I O NN I N E Corridor Recommendations
FIGURE 9-2
91U S - 2 3 F E A S I B I L I T Y S T U D Y
Corridor RecommendationsS E C T I O N
N I N E
FIGURE 9-3

92 U S - 2 3 F E A S I B I L I T Y S T U D YS E C T I O NN I N E Corridor Recommendations
FIGURE 9-4
93U S - 2 3 F E A S I B I L I T Y S T U D Y
Corridor RecommendationsS E C T I O N
N I N E
FIGURE 9-5

94 U S - 2 3 F E A S I B I L I T Y S T U D YS E C T I O NN I N E Corridor Recommendations
FIGURE 9-6

95U S - 2 3 F E A S I B I L I T Y S T U D Y
Corridor RecommendationsS E C T I O N
N I N E
FIGURE 9-7

96 U S - 2 3F E A S I B I L I T YS T U D YSegments/Logical Termini
Section Ten Priority Segments/Logical TerminiK E Y I S S U E S / S T R AT E G I E S TO C O N S I D E R W H E N D E V E L O P I N G A P R I O R I T I Z AT I O N S C H E D U L E
The analysis has shown the need for full reconstructionand widening of mainline US-23 and replacement of most corridor bridges within the planning horizon. However, funding has not been identifi ed for any of theserecommended improvements at this time. As such, improvements along the corridor must be prioritized and undertaken as funding becomes available. The following summarize some of the key considerations used to develop a prioritization of corridor improvements.
Critical Infrastructure NeedsSeveral bridges within the corridor have been identifi edin “poor” condition and in need of major rehabilitation or replacement in the near future. Replacement of thesestructures was identifi ed as a top priority, not only to address structural defi ciencies but to improve vertical clearance to meet today’s standard and to improvehorizontal clearance over US-23 that would enable futurehighway widening.
Bridge ConstraintsMost bridges within the corridor over US-23 do not have the adequate horizontal clearance to allow widening of the mainline highway. Additionally, the existing bridges carrying mainline US-23 over roadways, railroads and waterways are designed to accommodate only two lanes of traffi c in each direction. As a result, widening or replacement of these constraining bridges was identifi edas a priority as it is required in order to facilitate future widening of US-23.
Existing FHWA regulations and policy must also be considered when developing a prioritization schedule. NEPA regulations which require the development of projects with logical termini, air quality conformity analysis, and 4R versus 3R type fi xes must also be consideredwhen evaluating the feasibility of future projects.
Congestion MitigationCongestion is an existing issue primarily in the southern portion of the corridor, and is projected to increase inmagnitude and extent, eventually affecting the majority of the corridor by 2030. Given this condition and anticipatedpattern, widening of US-23 beginning at the southern section was determined to be the priority in order to mitigate observed and forecasted congestion.
Minimum Operating SegmentsSome options recommended for further considerationfor congestion mitigation, including HOV and HOT lane approaches, require a minimum length, or minimum operating segment, in order to be viable. The generally accepted minimum operating segment for an HOV lane ona freeway is fi ve miles. In order to keep these options in consideration, any initial widening project should meet thisminimum length criterion.
SafetyA safety analysis was conducted for the southern, center and northern segments of the US-23 corridor. In all segments, there is a trend of rear-end crashes along several sections of US-23 and near the interchangeareas. This is due to insuffi cient ramp deceleration andacceleration lanes and recurring congestion on US-23 during the peak traffi c hours. Improved capacity for both mainline US-23 and the interchanges is a priority in regards to safety.
In the southern section, there is a pattern of fi xed object crashes on the western M-14/US-23 interchange ramps,mostly guardrail crashes, which primarily occur during wetor icy conditions. Mitigation measures to increase frictionare recommended to prevent these types of crashes.
Several overturn crashes were identifi ed on the northern segment at the US-23 and I-96 interchange. Currently, the ramps at this interchange do not meet the current standards. In order to improve the overturn crashes at thelocation it is recommended that the ramps be upgraded to current standards. It should be noted that becauseof the complexity of the interchange, any reconfi guringor upgrading these ramps to design standards maynecessitate full reconstruction of the interchange.
A L L P U R P O S E L A N E A LT E R N AT I V EP R I O R I T Y S E G M E N T S
Based on the considerations described above, key projectelements were prioritized and ordered into the following phases: Cost estimates are considered provisional.
Phase 1: Critical Structures and Mainline Operations Improvements in Washtenaw CountyIn this phase, critical structures (currently rated in “poor” condition) are replaced with structures with suffi cientvertical clearance to meet today’s standards and horizontal clearance to allow future widening of US-23. Replacement of Six Mile Road and Eight Mile Road bridges wouldinclude reconstruction/reconfi guration of interchanges.In addition, identifi ed operational improvements within this segment would be undertaken. Specifi c projects include:
● Replace Six Mile Road Bridge over US-23including operational improvements
● Replace Eight Mile Road Bridge over US-23 including operational improvements
● Widen southbound US-23 to three lanes from M-14 to Warren Road
● Extend ramp tapers at North Territorial Road, Barker Road, and M-36
Estimated Cost – Phase 1: $40 Million
Phase 2: Replace/Widen Non-Critical Structures in Washtenaw County In this phase, the remaining structures that constrain thefuture widening of US-23 are rated in “fair” condition andwould be replaced or widened as necessary. Replacement of N. Territorial Road and Barker Road bridges wouldinclude reconstruction/reconfi guration of serviceinterchanges. Specifi c projects include:
● Replace and widen US-23 over Barker Roadand CSX Railroad bridges
● Replace North Territorial Road over US-23 Bridge● Replace Joy Road over US-23 bridge● Replace Warren Road over US-23 bridge
Estimated Cost – Phase 2: $40 Million
Phase 3A/B: Washtenaw County Mainline US-23 Widening/Livingston County Bridge ReplacementsDepending on available funding, current bridge conditions, and other priorities, Phase 3 would begin with either widening of US-23 in Washtenaw County, or replacement of bridges in Livingston County. Replacement of M-36,Silver Lake Road and Lee Road bridges would include reconstruction/reconfi guration of service interchanges.
Estimated Cost – Washtenaw County MainlineWidening: $95 Million
Estimated Cost – Livingston County BridgeReplacements: $55 Million
Phase 4: Livingston County Mainline WideningThe fi nal phase of improvements would include wideningof mainline US-23 between Eight Mile Road and I-96 in Livingston County.
Estimated Cost – Phase 4: $90 Million
Independent Phase: Reconstruct US-23/I-96 InterchangeThe US-23/I-96 interchange was identifi ed as a segment of independent utility within the corridor. This means thatfuture reconstruction of this interchange, identifi ed asa recommended future improvement, could happen at any time, independent of other proposed improvements. Reconstruction of this interchange would not precludeother recommended projects and would not require other improvements to be in place as a prerequisite to reconstruction. Discussions are currently underway between MDOT and FHWA to move forward with interimimprovements to address critical bridge conditions within the interchange.
Estimated Cost – US-23/I-96 Interchange Reconstruction: $93 Million
Total Long-Term Improvement Costs – US-23 Corridor from M-14 to I-96: $413 million.
S E C T I O N T E N

US-23 FEASIBILITY STUDYMDOT: Providing the highest quality integrated
transportation services for economic benefit and improved quality of life.
Prepared by: MDOT Graphics\Planning\Project Planning\US-23 Feasibility Report (11/09 rld)