7 WESTLAND 201 DISTRICT 6 COUNCIL 201 REPORT -...
163
Page | 1 ANNUAL REPORT 2016 / 2017 WESTLAND DISTRICT COUNCIL
Transcript of 7 WESTLAND 201 DISTRICT 6 COUNCIL 201 REPORT -...
Page | 1
A
NN
UA
L R
EP
OR
T 2
01
6 /
20
17
WESTLAND DISTRICT COUNCIL
Page | 2
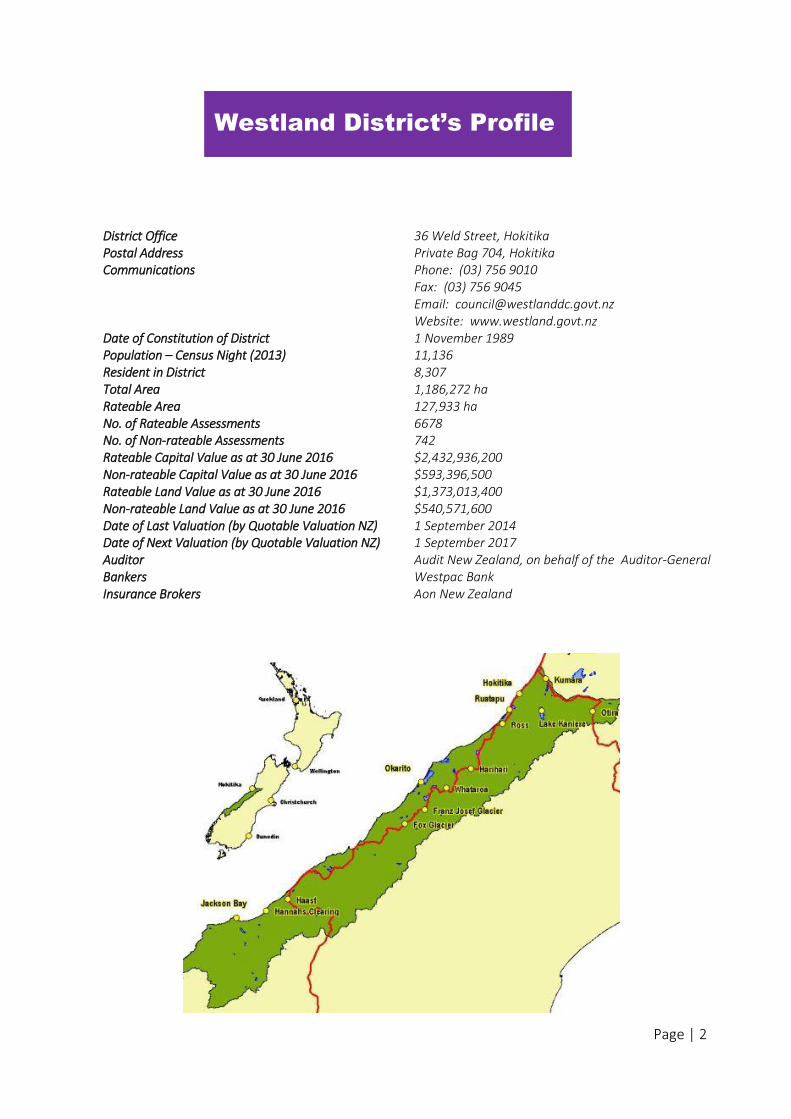
District Office 36 Weld Street, Hokitika Postal Address Private Bag 704, Hokitika Communications Phone: (03) 756 9010
Fax: (03) 756 9045 Email: [email protected] Website: www.westland.govt.nz
Date of Constitution of District 1 November 1989 Population – Census Night (2013) 11,136 Resident in District 8,307 Total Area 1,186,272 ha Rateable Area 127,933 ha No. of Rateable Assessments 6678 No. of Non-rateable Assessments 742 Rateable Capital Value as at 30 June 2016 $2,432,936,200 Non-rateable Capital Value as at 30 June 2016 $593,396,500 Rateable Land Value as at 30 June 2016 $1,373,013,400 Non-rateable Land Value as at 30 June 2016 $540,571,600 Date of Last Valuation (by Quotable Valuation NZ) 1 September 2014 Date of Next Valuation (by Quotable Valuation NZ) 1 September 2017 Auditor Audit New Zealand, on behalf of the Auditor-General Bankers Westpac Bank Insurance Brokers Aon New Zealand
Westland District’s Profile
Page | 3
CONTENTS
INTRODUCTION
Reporting Guidelines and Council Vision 6 Statement of Compliance 7 Elected Members and Council Committees 8-9 Executive Team 10-11 Māori Contribution to Decision-making 12 Mayor and Chief Executive’s Report 13-14 Financial Statistics 15 Financial Performance Summary 16 Annual Report Disclosure Statement 17
FINANCIAL STATEMENTS
Statement of Comprehensive Revenue & Expense 25 Statement of Changes in Equity 26 Statement of Financial Position 27-28 Statement of Cash Flows 29 Whole of Council Funding Impact Statement 31 Notes to the Financial Statements 32-77 Reserve Funds 78-82
STATEMENTS OF SERVICE PROVISION
Council’s performance in each activity 85
ACTIVITY GROUP STATEMENTS
Leadership Effects of this activity on the community Group funding impact statement
Performance measures: Democracy Corporate services Council Controlled Organisations - Westland Holdings Ltd - Westland District Property Ltd - Westroads - Hokitika Airport Ltd
87-88 89 90 91 93-94 95-96 97 98
Planning and Regulatory Effects of this activity on the community Group funding impact statement
Performance measures: Inspections and Compliance Resource Management Emergency Management, including Rural Fire Animal Control
99-102 103 104-105 106 107-108
109 Community Services Effects of this activity on the community
Group funding impact statement Performance measures: Community Halls
110-112 113
114
Page | 4
Leisure Services and Facilities Effects of this activity on the community Group funding impact statement
Performance measures: Cemeteries Elderly Housing Hokitika Museum Hokitika Wildfoods Festival i-SITE Parks and Reserves Public Toilets Swimming Pool West Coast Wilderness Trail Westland District Library
115-122 123 124 125 126 127 128 129 129 130 131 131
Transportation Effects of this activity on the community Group funding impact statement
Performance measures
132 133 134-135
Water Supply Effects of this activity on the community Group funding impact statement
Performance measures
136-137 138 139-143
Wastewater Effects of this activity on the community Group funding impact statement
Performance measures
144 145 146-148
Stormwater Effects of this activity on the community Group funding impact statement
Performance measures
149 150 151-152
Solid waste management Effects of this activity on the community Group funding impact statement
Performance measures
153-154 155 156-157
INDEPENDENT AUDITORS REPORT
158
Page | 5
INTRODUCTION
This section contains the following information:
Reporting Guidelines
Council Vision
Statement of Compliance
Elected Members and Council Committees
Executive Team
Māori Contribution to Decision-making
Mayor and Chief Executive’s Report
Financial Statistics
Financial Performance Summary
Financial Prudence
Page | 6
The Local Government Act 2002 (the LGA) requires all local authorities to develop a Long Term Plan (LTP) for their districts. These plans identify the direction and services chosen by the community and the role of Council in delivering these services. The Plan also details the cost of Council’s activities over the next 10 years.
Council adopted a new Long Term Plan on 30 June 2015, so this Annual Report is based on the provisions and planning framework of the Long Term Plan 2015-2025.
We prepare an Annual Report to communicate to the community how we performed financially and whether we delivered the services we had agreed with the community in the Long Term Plan. Comparing our actual performance with that planned in the Long Term Plan 2015-2025 is how we show this. For service delivery this remains a legitimate comparison and any departures are explained in the statements of service performance.
This report is prepared in observance of new Local Government (Financial Reporting and Prudence) Regulations 2014 along with the Local Government Act 2002 Amendment Act provisions, which bring additional disclosure requirements.
In certain circumstances, particularly with financial prudence benchmarks and funding impact statements for groups of activities, the regulations require comparisons against LTP.
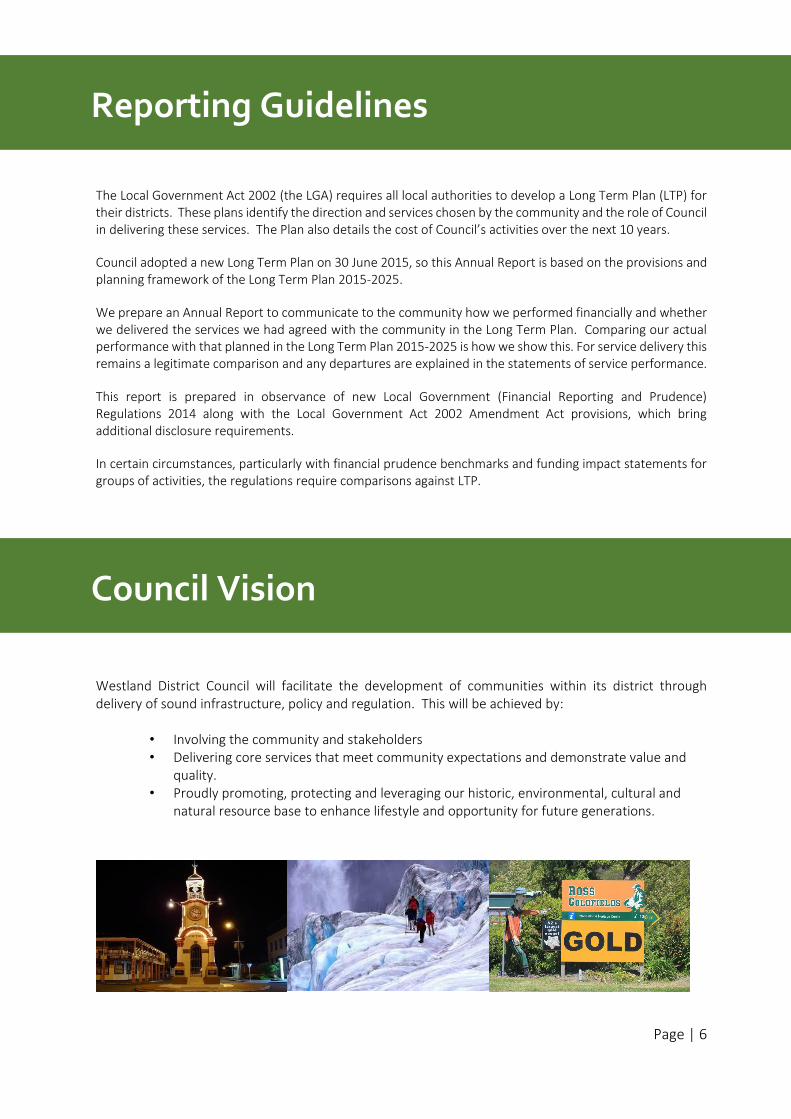
Westland District Council will facilitate the development of communities within its district through delivery of sound infrastructure, policy and regulation. This will be achieved by:
• Involving the community and stakeholders • Delivering core services that meet community expectations and demonstrate value and
quality. • Proudly promoting, protecting and leveraging our historic, environmental, cultural and
natural resource base to enhance lifestyle and opportunity for future generations.
Reporting Guidelines
Council Vision
Page | 7
Westland District Council hereby confirms that all statutory requirements contained in the Local
Government Act 2002, in relation to the Annual Report 2016/17 have been complied with.
Council adopted this Annual Report on 31 October 2017, and therefore met the statutory deadline for
adoption.
Bruce Smith Robin Reeves MAYOR 2016/17 CHIEF EXECUTIVE
Statement of Compliance
Page | 8
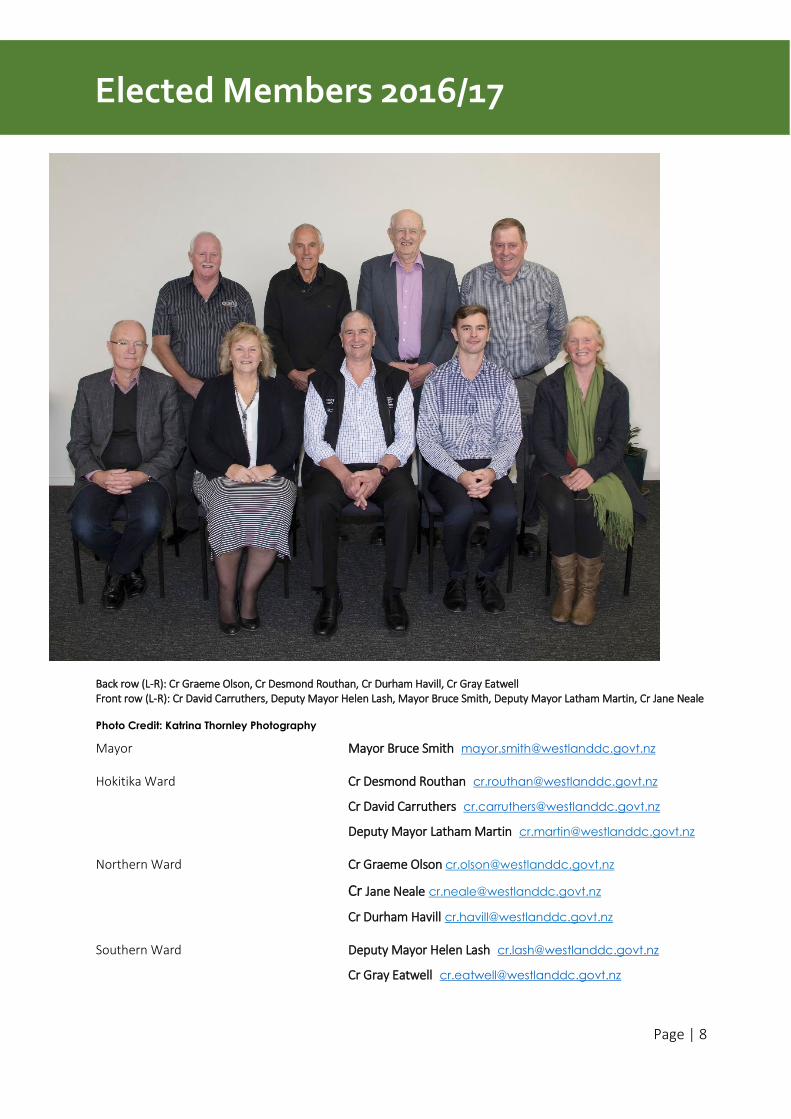
Back row (L-R): Cr Graeme Olson, Cr Desmond Routhan, Cr Durham Havill, Cr Gray Eatwell Front row (L-R): Cr David Carruthers, Deputy Mayor Helen Lash, Mayor Bruce Smith, Deputy Mayor Latham Martin, Cr Jane Neale
Photo Credit: Katrina Thornley Photography
Mayor Mayor Bruce Smith [email protected]
Hokitika Ward
Cr Desmond Routhan [email protected]
Cr David Carruthers [email protected]
Deputy Mayor Latham Martin [email protected]
Northern Ward Cr Graeme Olson [email protected]
Cr Jane Neale [email protected]
Cr Durham Havill [email protected]
Southern Ward
Deputy Mayor Helen Lash [email protected]
Cr Gray Eatwell [email protected]
Elected Members 2016/17
Page | 9
Council Committees
Executive Committee
Finance, Audit and Risk Committee
The Executive Committee ceased to exist following the local body elections on the 8 October 2016.
Deputy Mayor Latham Martin (Chair)
Westland Wilderness Trust Francois Tumahai, Te Rūnanga O Ngāti Waewae (Chairman), Deputy Mayor Helen Lash, Cr Jane Neale, Chris Auchinvole, Mark Davies (Department of Conservation), Cr Anton Becker (Grey District Council)
Creative Communities Local Assessment Committee
Deputy Mayor Latham Martin, Reilly Burden, Ian Boswell, Nick Meissel, Derek Blight
District Licensing Committee Bryce Thomson (Chairperson), Cr Graeme Olson (Deputy Chairperson), Timothy Teen, Richard Gardiner
Hokitika Seawall Joint Committee Cr David Carruthers, Cr Desmond Routhan, Cr Jane Neale, Cr Eatwell
West Coast Civil Defence Emergency Management Joint Standing Committee
Mayor Bruce Smith (Westland’s representative)
West Coast Regional Transport Committee Cr Durham Havill
Sport NZ Rural Travel Fund – Allocation Committee
Cr Jane Neale, Mark Dawson, Pavel Bares, Derek Blight
Hokitika Reserves and Environs Committee
Rob Daniel (Chair), Russell Gugich, Bruce and Barbara Erickson, Barry Pearson, Helen Love, Ian Gilbertson, Sue Asplin, Hilke Bruns, Derek Blight
Safe Community Coalition
Cr Jane Neale, Kees van Beek (Chair), Mark Boere, Penny Kirk, Prevention Sergeant Paul Watson, Cathy Blincoe, Claire Robertson, Corrina Gestro-Best, Ivan Wilson, Carl Hutchby, Derek Blight
Page | 10
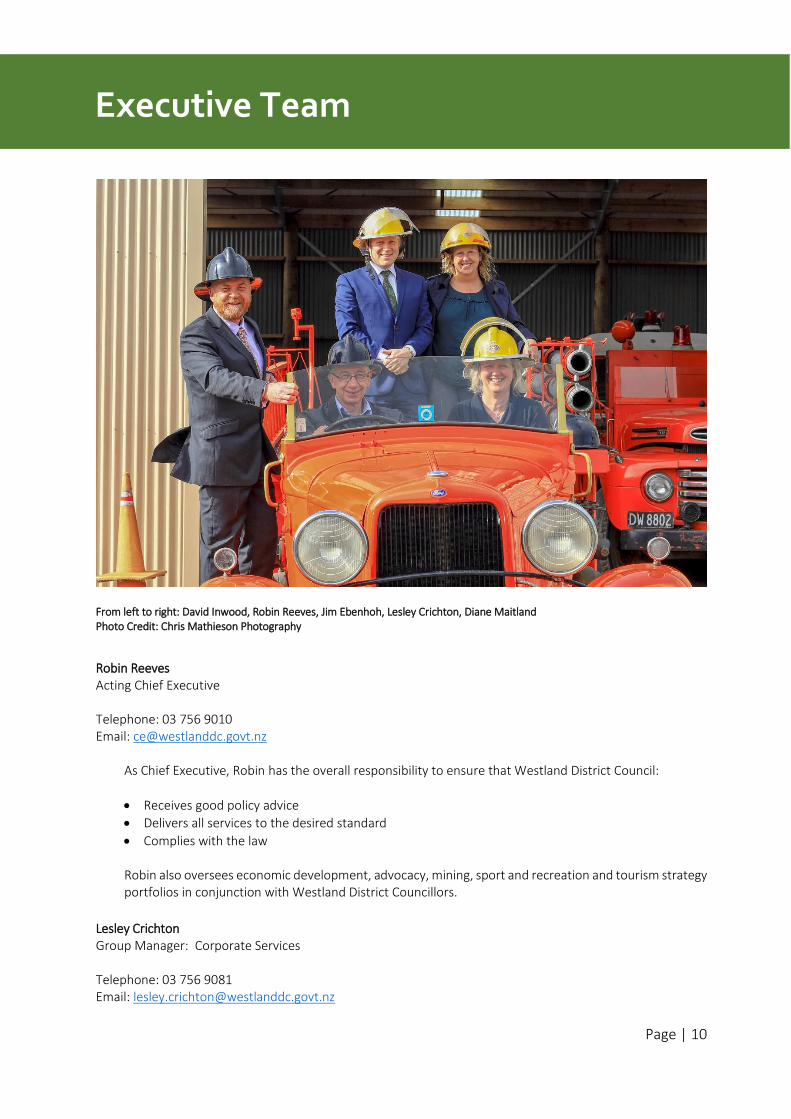
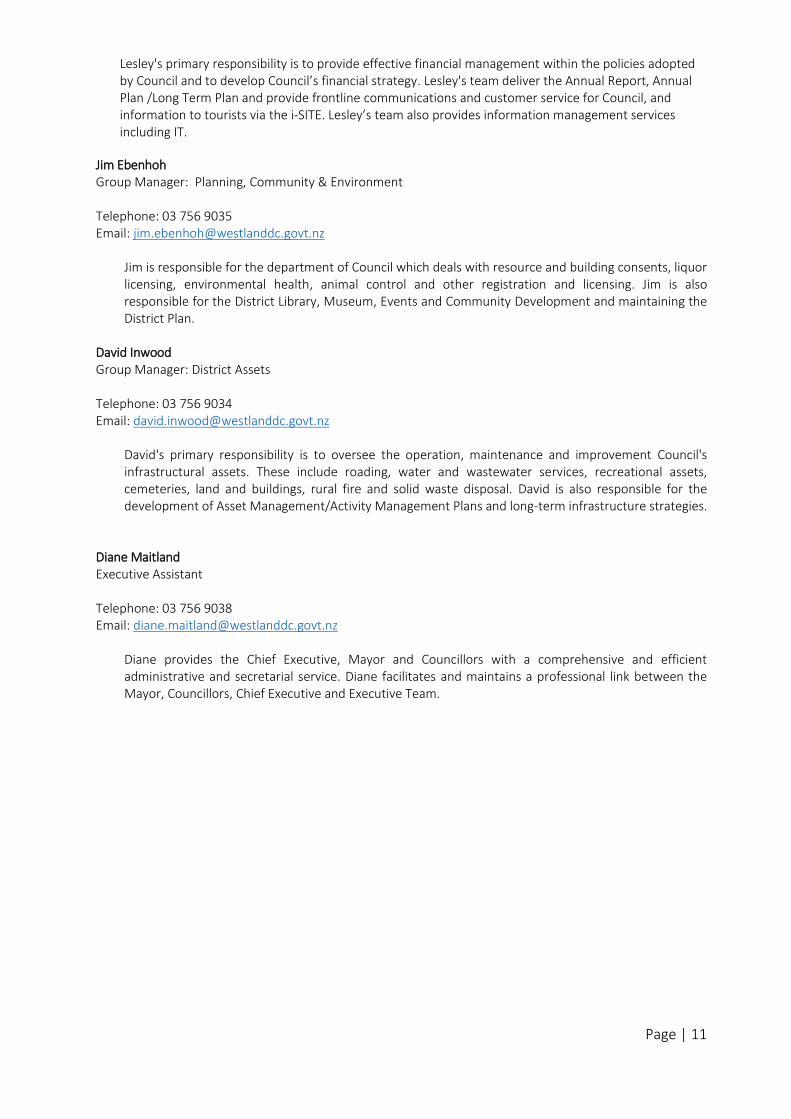
From left to right: David Inwood, Robin Reeves, Jim Ebenhoh, Lesley Crichton, Diane Maitland Photo Credit: Chris Mathieson Photography
Robin Reeves Acting Chief Executive Telephone: 03 756 9010 Email: [email protected]
As Chief Executive, Robin has the overall responsibility to ensure that Westland District Council:
Receives good policy advice
Delivers all services to the desired standard
Complies with the law Robin also oversees economic development, advocacy, mining, sport and recreation and tourism strategy portfolios in conjunction with Westland District Councillors.
Lesley Crichton Group Manager: Corporate Services Telephone: 03 756 9081 Email: [email protected]
Executive Team
Page | 11
Lesley's primary responsibility is to provide effective financial management within the policies adopted by Council and to develop Council’s financial strategy. Lesley's team deliver the Annual Report, Annual Plan /Long Term Plan and provide frontline communications and customer service for Council, and information to tourists via the i-SITE. Lesley’s team also provides information management services including IT.
Jim Ebenhoh Group Manager: Planning, Community & Environment Telephone: 03 756 9035 Email: [email protected]
Jim is responsible for the department of Council which deals with resource and building consents, liquor licensing, environmental health, animal control and other registration and licensing. Jim is also responsible for the District Library, Museum, Events and Community Development and maintaining the District Plan.
David Inwood Group Manager: District Assets Telephone: 03 756 9034 Email: [email protected]
David's primary responsibility is to oversee the operation, maintenance and improvement Council's infrastructural assets. These include roading, water and wastewater services, recreational assets, cemeteries, land and buildings, rural fire and solid waste disposal. David is also responsible for the development of Asset Management/Activity Management Plans and long-term infrastructure strategies.
Diane Maitland Executive Assistant Telephone: 03 756 9038 Email: [email protected]
Diane provides the Chief Executive, Mayor and Councillors with a comprehensive and efficient administrative and secretarial service. Diane facilitates and maintains a professional link between the Mayor, Councillors, Chief Executive and Executive Team.
Page | 12
Section 81 of the Local Government Act 2002 sets out the obligations for Council to both consult Māori and encourage Māori involvement in the Council’s decision making processes. Section 35 of the Act requires Council to report on the activities that have been undertaken in the year to establish and maintain processes to enable Māori to contribute.
The Long Term Plan 2015-2025 includes a statement of commitment to consultation and engagement with Maori, particularly mana whenua.
The statement expresses the desire of Council and Poutini Ngāi Tahu (Te Rūnanga o Ngai Tahu, Te Rūnanga o Makaawhio and Te Rūnanga o Ngāti Waewae) to maintain good communication and working relationships. In particular all parties wish to evolve our relationships to ensure that contribution to decision making continues to occur.
As an example of a current method of providing an opportunity for Poutini Ngāi Tahu to contribute to the decision-making processes of Council, a quarterly meeting is held with representatives of Te Rūnanga o Makaawhio to discuss strategic matters largely in relation to the Resource Management Act 1991. This arrangement has proven to be a successful way of engaging on other topics such as the Annual Plan, and planning for major infrastructure projects.
Council also has other committees and working parties in place which either include a Makaawhio and/or Ngāti Waewae representative, or the minutes from the meetings are forwarded to the Runanga. This includes the Safer Community Council (which has changed into the ‘Safer Community Coalition’), the Westland Wilderness Trust and the Franz Josef/Waiau working group.
Māori Contribution to Decision-making
Page | 13
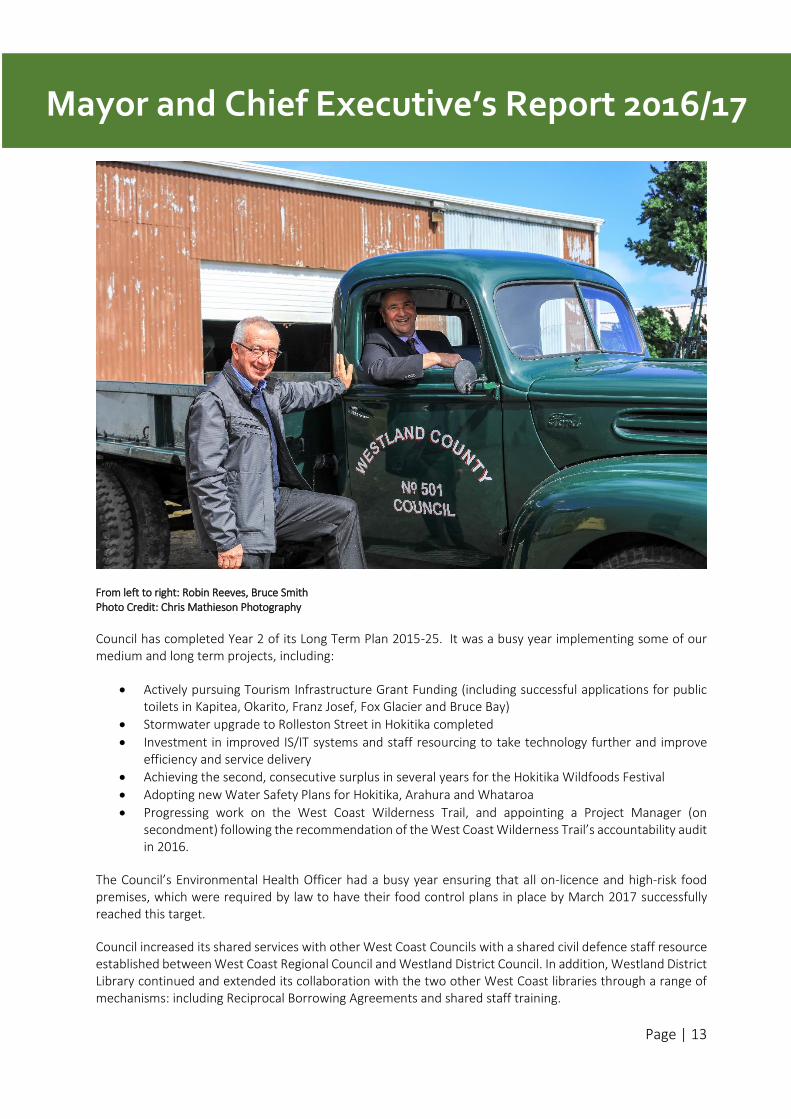
From left to right: Robin Reeves, Bruce Smith Photo Credit: Chris Mathieson Photography
Council has completed Year 2 of its Long Term Plan 2015-25. It was a busy year implementing some of our medium and long term projects, including:
Actively pursuing Tourism Infrastructure Grant Funding (including successful applications for public toilets in Kapitea, Okarito, Franz Josef, Fox Glacier and Bruce Bay)
Stormwater upgrade to Rolleston Street in Hokitika completed
Investment in improved IS/IT systems and staff resourcing to take technology further and improve efficiency and service delivery
Achieving the second, consecutive surplus in several years for the Hokitika Wildfoods Festival
Adopting new Water Safety Plans for Hokitika, Arahura and Whataroa
Progressing work on the West Coast Wilderness Trail, and appointing a Project Manager (on secondment) following the recommendation of the West Coast Wilderness Trail’s accountability audit in 2016.
The Council’s Environmental Health Officer had a busy year ensuring that all on-licence and high-risk food premises, which were required by law to have their food control plans in place by March 2017 successfully reached this target.
Council increased its shared services with other West Coast Councils with a shared civil defence staff resource established between West Coast Regional Council and Westland District Council. In addition, Westland District Library continued and extended its collaboration with the two other West Coast libraries through a range of mechanisms: including Reciprocal Borrowing Agreements and shared staff training.
Mayor and Chief Executive’s Report 2016/17
Page | 14
Council’s new Elected Representatives were appointed in November, following Council elections in October. This has brought a change in focus for Council with new emphasis being given to building a stronger relationship with Central Government to lobby for financial resources for tourism infrastructure and improvements to our District Assets.
Council worked with the West Coast Regional Council and the other two West Coast Territorial Authorities to help create the West Coast Economic Development Action Plan 2017. This sets out a strategy for how West Coast Councils, iwi and industries can work together to grow more business, attract investment, create new jobs and increase the incomes of all West Coasters.
Three community projects which received Major District Initiative Funding were completed in this financial period. These were the upgrade to Ross Centennial Hall, and the new Hokitika Westland RSA and Fox Glacier Community Centre buildings.
Some unbudgeted spending occurred during the year in relation to remedial works at Sunset Point to arrest erosion from the sea, including patching the slump in the rock wall north of the Tambo replica by compact filling the area using a large volume of mine rejects.
The Carnegie Building, which had been used to house Hokitika Museum was closed in September 2016 because of earthquake safety risks. This was to protect public safety while a process and plan could be put in place for future Museum development plans that would encompass the structural strengthening work. During this time, discussions were held around developing a longer term plan for the Hokitika Museum.
Our District experienced a number of localised natural hazard events, involving high rainfall and wind from weather bombs and cyclonic activity - although none of these required a formal civil defence response. In support of the Kaikoura Earthquake on 14 November 2016, Westland District Council deployed several staff to Kaikoura to assist with Kaikoura’s Civil Defence response.
Council continued its improvements to communications, customer service and financial reporting and these are outlined in the Corporate Services section.
In March 2016, the Waiho River flooded the Franz Josef Wastewater Treatment Plant resulting in significant damage to the oxidation ponds. Council undertook some immediate remedial work to mitigate the effect on the environment. Council has since resolved to protect the pond site with construction of a 700 metre long stop bank, at a cost of $1.3 million before the upgrade of the Wastewater Treatment Plant takes place. A government grant has been applied for to assist in covering the treatment upgrade costs.
Finally, Council concluded this financial period by ensuring the Annual Plan for 2017-18 was in place by the legislative deadline of 30 June 2017.
Bruce Smith Robin Reeves MAYOR 2016/17 CHIEF EXECUTIVE
Page | 15
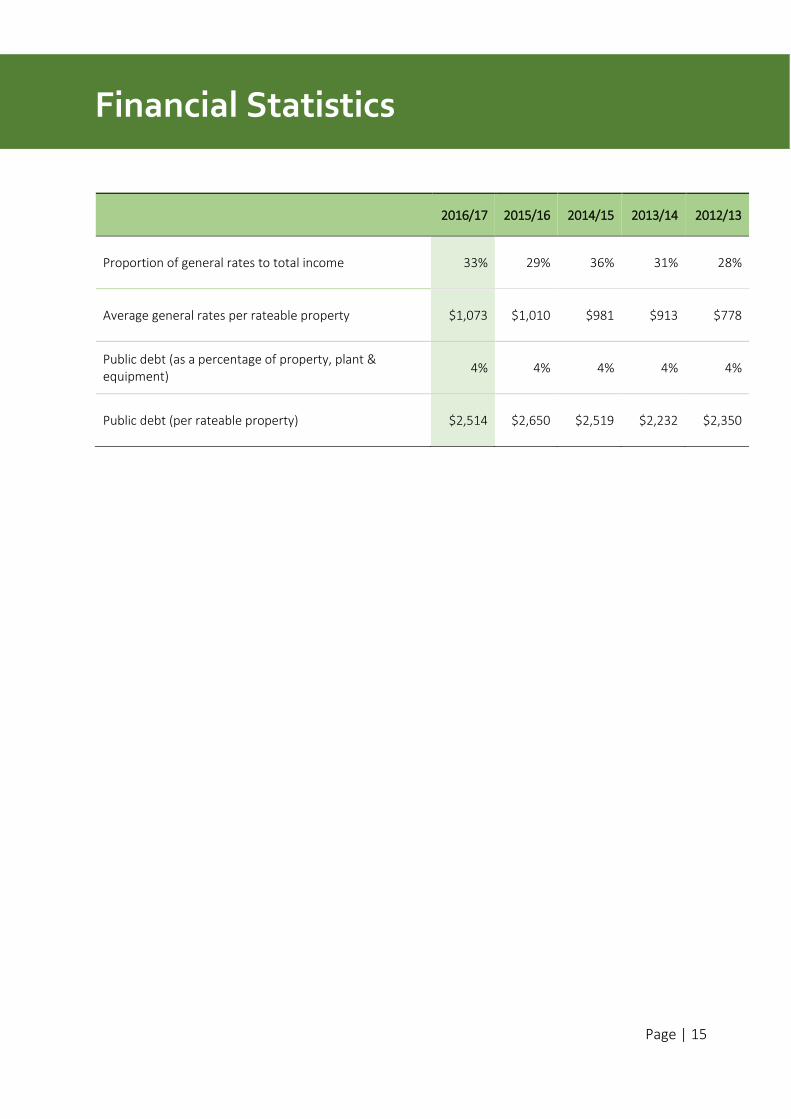
2016/17 2015/16 2014/15 2013/14 2012/13
Proportion of general rates to total income 33% 29% 36% 31% 28%
Average general rates per rateable property $1,073 $1,010 $981 $913 $778
Public debt (as a percentage of property, plant & equipment)
4% 4% 4% 4% 4%
Public debt (per rateable property) $2,514 $2,650 $2,519 $2,232 $2,350
Financial Statistics
Page | 16
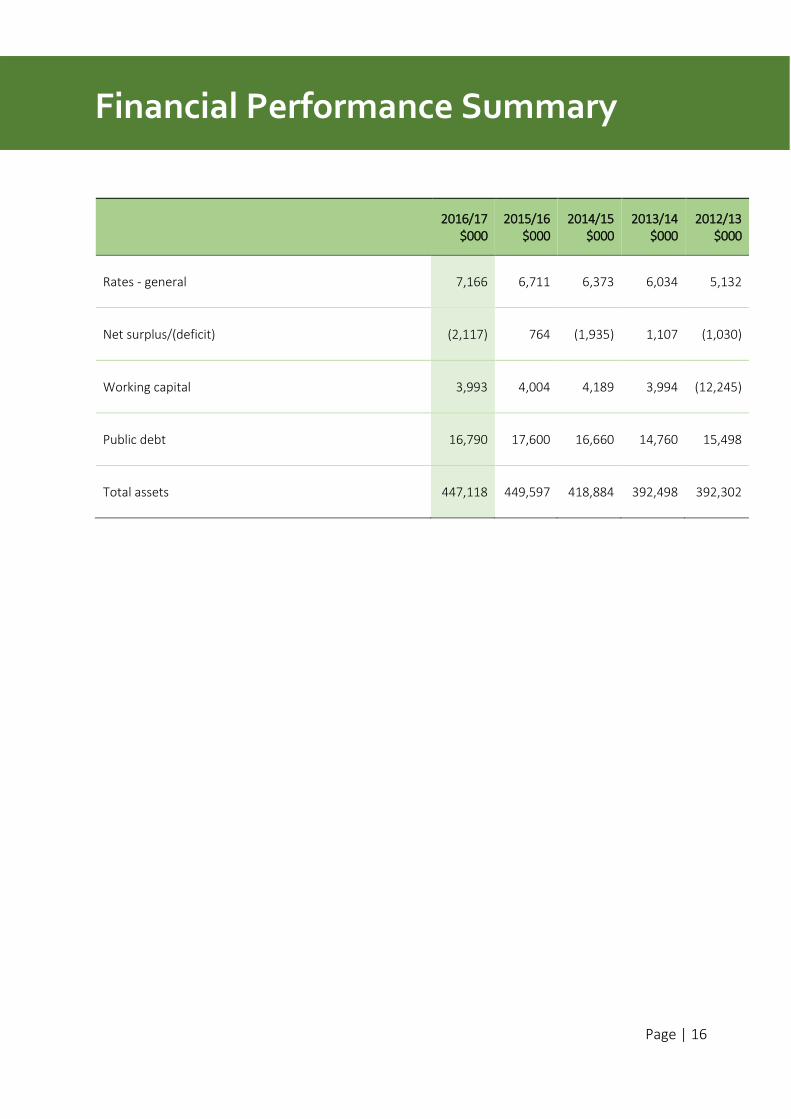
2016/17
$000 2015/16
$000 2014/15
$000 2013/14
$000 2012/13
$000
Rates - general 7,166 6,711 6,373 6,034 5,132
Net surplus/(deficit) (2,117) 764 (1,935) 1,107 (1,030)
Working capital 3,993 4,004 4,189 3,994 (12,245)
Public debt 16,790 17,600 16,660 14,760 15,498
Total assets 447,118 449,597 418,884 392,498 392,302
Financial Performance Summary
Page | 17
The following information is the annual report disclosure statement for year ending 30 June 2017.
The purpose of this statement is to disclose the Council's financial performance in relation to various benchmarks, to enable the assessment of whether we are prudently managing our revenues, expenses, assets, liabilities, and general financial activity.
We are required to include this statement in this annual report in accordance with the Local Government (Financial Reporting and Prudence) Regulations 2014 (the regulations). You can refer to these regulations on the Council website.
Annual Report Disclosure Statement
Page | 18
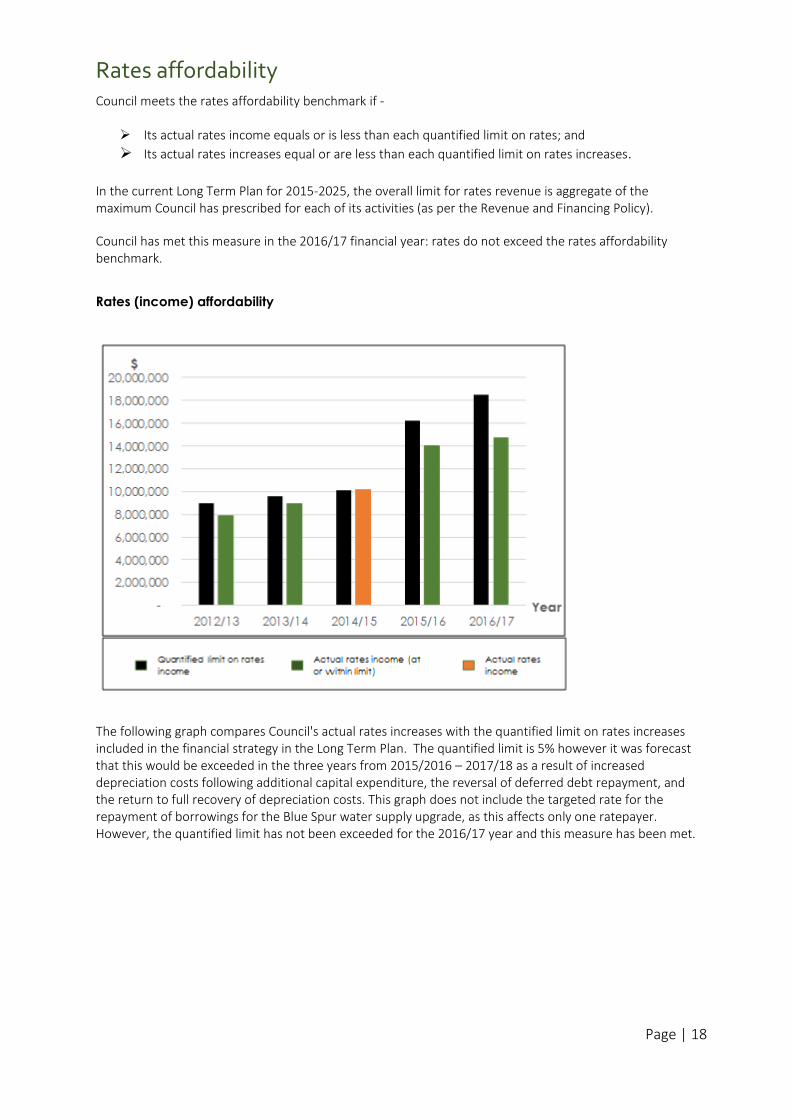
Rates affordability Council meets the rates affordability benchmark if -
Its actual rates income equals or is less than each quantified limit on rates; and
Its actual rates increases equal or are less than each quantified limit on rates increases.
In the current Long Term Plan for 2015-2025, the overall limit for rates revenue is aggregate of the maximum Council has prescribed for each of its activities (as per the Revenue and Financing Policy).
Council has met this measure in the 2016/17 financial year: rates do not exceed the rates affordability benchmark.
Rates (income) affordability
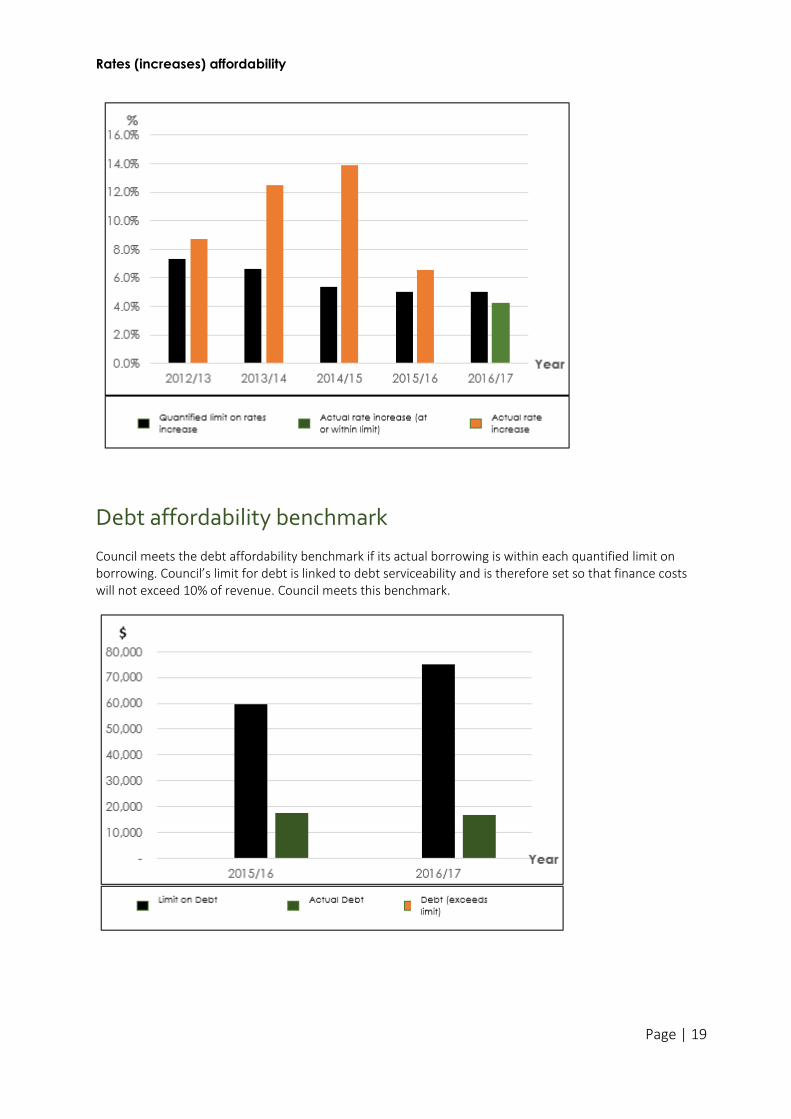
The following graph compares Council's actual rates increases with the quantified limit on rates increases included in the financial strategy in the Long Term Plan. The quantified limit is 5% however it was forecast that this would be exceeded in the three years from 2015/2016 – 2017/18 as a result of increased depreciation costs following additional capital expenditure, the reversal of deferred debt repayment, and the return to full recovery of depreciation costs. This graph does not include the targeted rate for the repayment of borrowings for the Blue Spur water supply upgrade, as this affects only one ratepayer. However, the quantified limit has not been exceeded for the 2016/17 year and this measure has been met.
Page | 19
Rates (increases) affordability
Debt affordability benchmark
Council meets the debt affordability benchmark if its actual borrowing is within each quantified limit on borrowing. Council’s limit for debt is linked to debt serviceability and is therefore set so that finance costs will not exceed 10% of revenue. Council meets this benchmark.
Page | 20
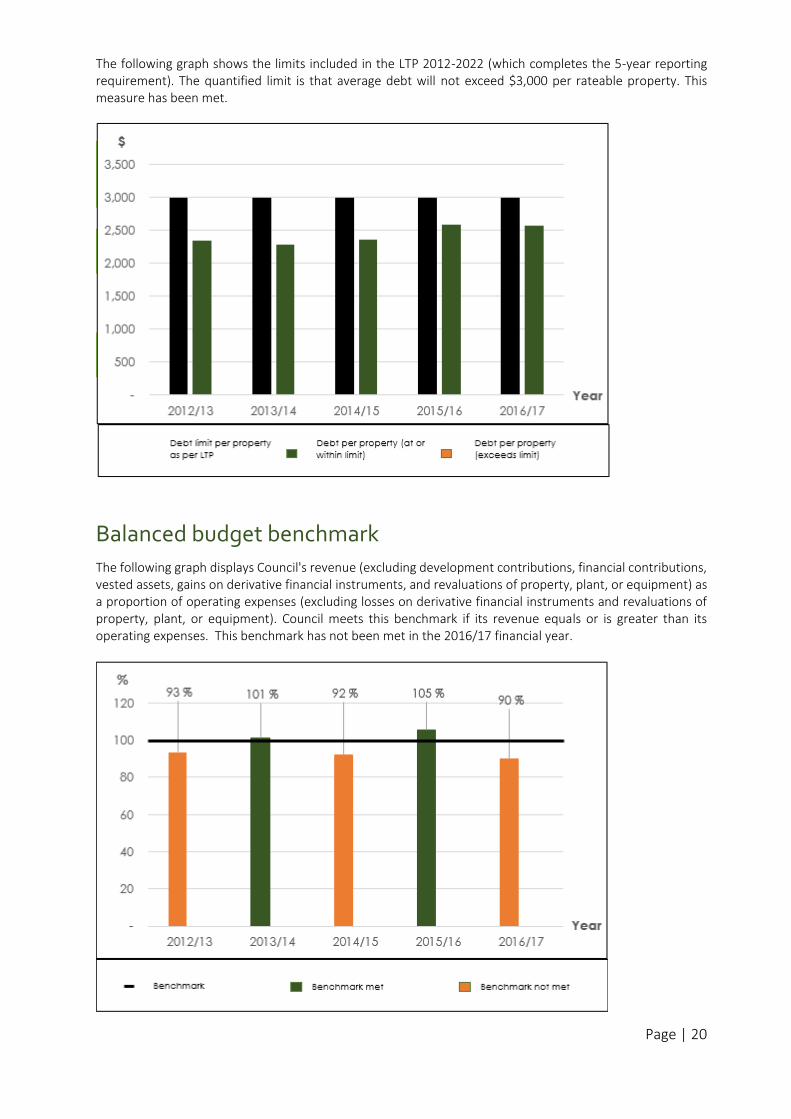
The following graph shows the limits included in the LTP 2012-2022 (which completes the 5-year reporting requirement). The quantified limit is that average debt will not exceed $3,000 per rateable property. This measure has been met.
Balanced budget benchmark
The following graph displays Council's revenue (excluding development contributions, financial contributions, vested assets, gains on derivative financial instruments, and revaluations of property, plant, or equipment) as a proportion of operating expenses (excluding losses on derivative financial instruments and revaluations of property, plant, or equipment). Council meets this benchmark if its revenue equals or is greater than its operating expenses. This benchmark has not been met in the 2016/17 financial year.
Page | 21
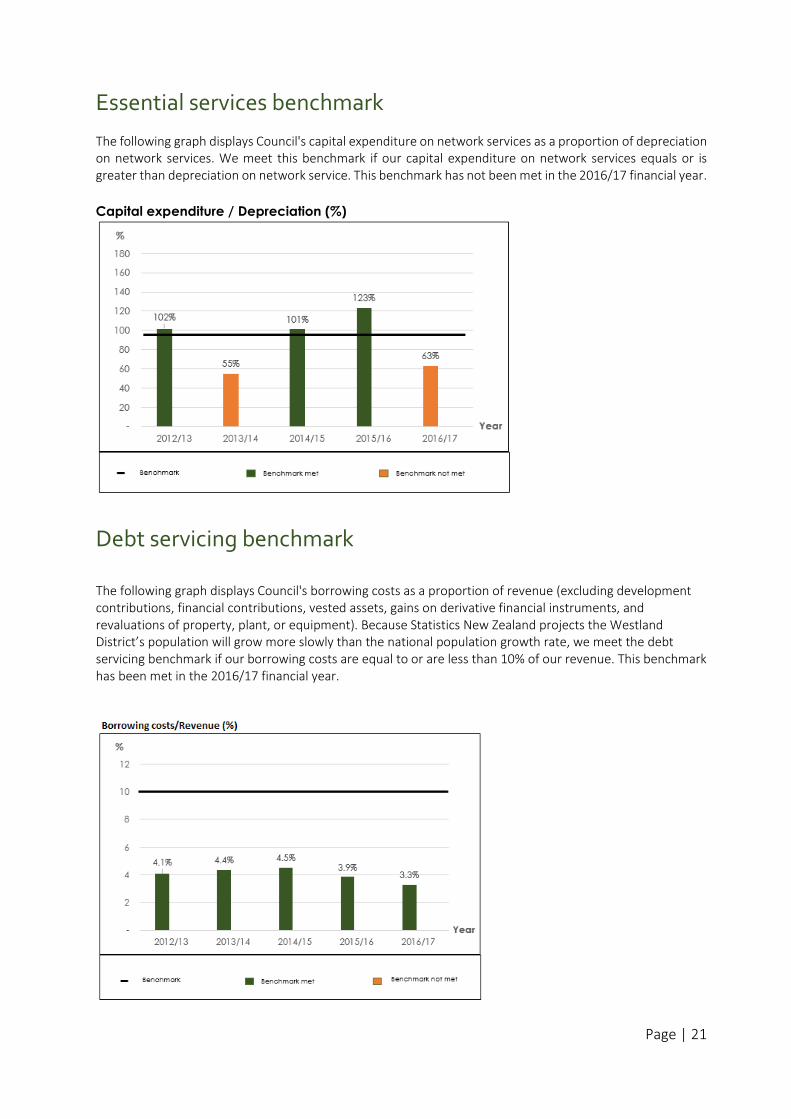
Essential services benchmark
The following graph displays Council's capital expenditure on network services as a proportion of depreciation on network services. We meet this benchmark if our capital expenditure on network services equals or is greater than depreciation on network service. This benchmark has not been met in the 2016/17 financial year.
Capital expenditure / Depreciation (%)
Debt servicing benchmark The following graph displays Council's borrowing costs as a proportion of revenue (excluding development contributions, financial contributions, vested assets, gains on derivative financial instruments, and revaluations of property, plant, or equipment). Because Statistics New Zealand projects the Westland District’s population will grow more slowly than the national population growth rate, we meet the debt servicing benchmark if our borrowing costs are equal to or are less than 10% of our revenue. This benchmark has been met in the 2016/17 financial year.
Page | 22
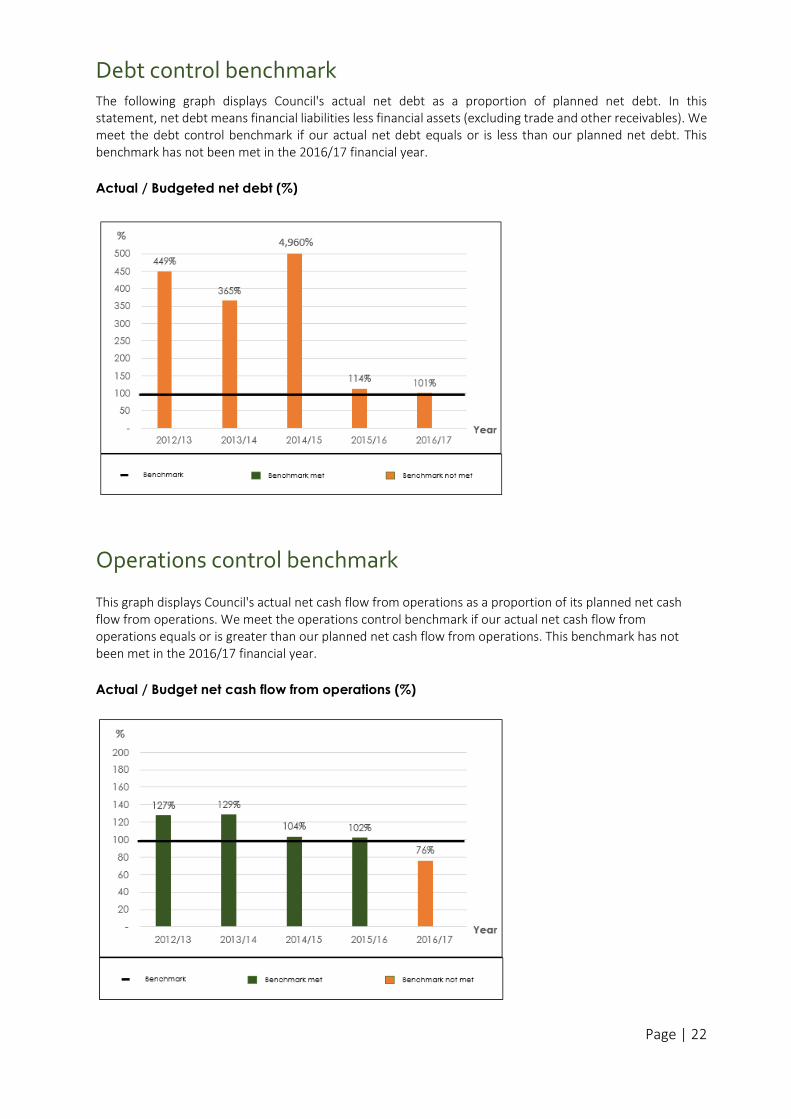
Debt control benchmark The following graph displays Council's actual net debt as a proportion of planned net debt. In this statement, net debt means financial liabilities less financial assets (excluding trade and other receivables). We meet the debt control benchmark if our actual net debt equals or is less than our planned net debt. This benchmark has not been met in the 2016/17 financial year.
Actual / Budgeted net debt (%)
Operations control benchmark
This graph displays Council's actual net cash flow from operations as a proportion of its planned net cash flow from operations. We meet the operations control benchmark if our actual net cash flow from operations equals or is greater than our planned net cash flow from operations. This benchmark has not been met in the 2016/17 financial year.
Actual / Budget net cash flow from operations (%)
Page | 23
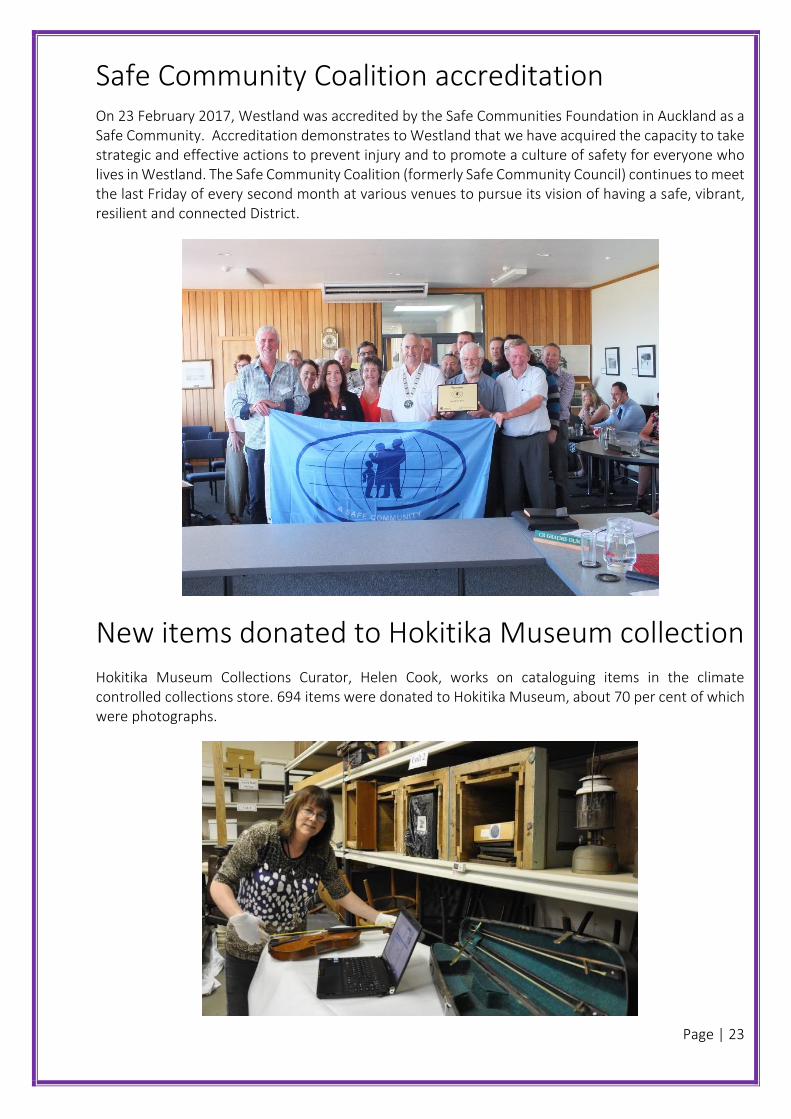
Safe Community Coalition accreditation On 23 February 2017, Westland was accredited by the Safe Communities Foundation in Auckland as a Safe Community. Accreditation demonstrates to Westland that we have acquired the capacity to take strategic and effective actions to prevent injury and to promote a culture of safety for everyone who lives in Westland. The Safe Community Coalition (formerly Safe Community Council) continues to meet the last Friday of every second month at various venues to pursue its vision of having a safe, vibrant, resilient and connected District.
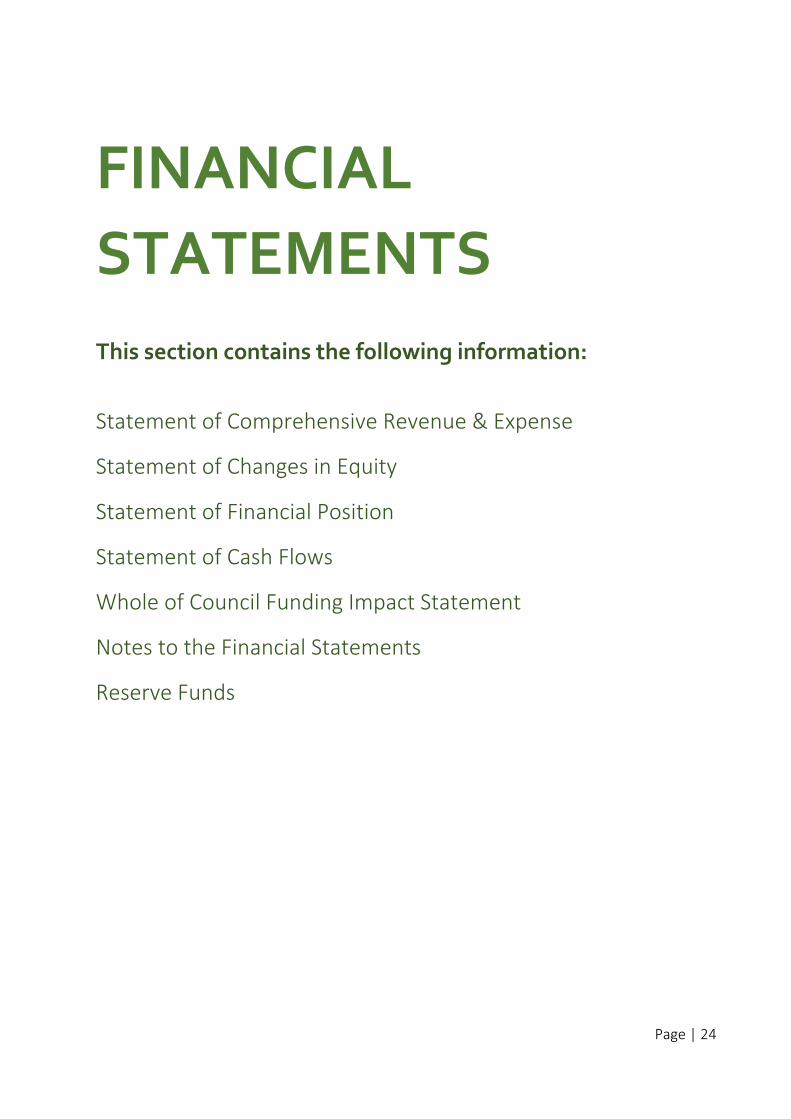
New items donated to Hokitika Museum collection Hokitika Museum Collections Curator, Helen Cook, works on cataloguing items in the climate controlled collections store. 694 items were donated to Hokitika Museum, about 70 per cent of which were photographs.
Page | 24
FINANCIAL
STATEMENTS
This section contains the following information:
Statement of Comprehensive Revenue & Expense
Statement of Changes in Equity
Statement of Financial Position
Statement of Cash Flows
Whole of Council Funding Impact Statement
Notes to the Financial Statements
Reserve Funds
Page | 25
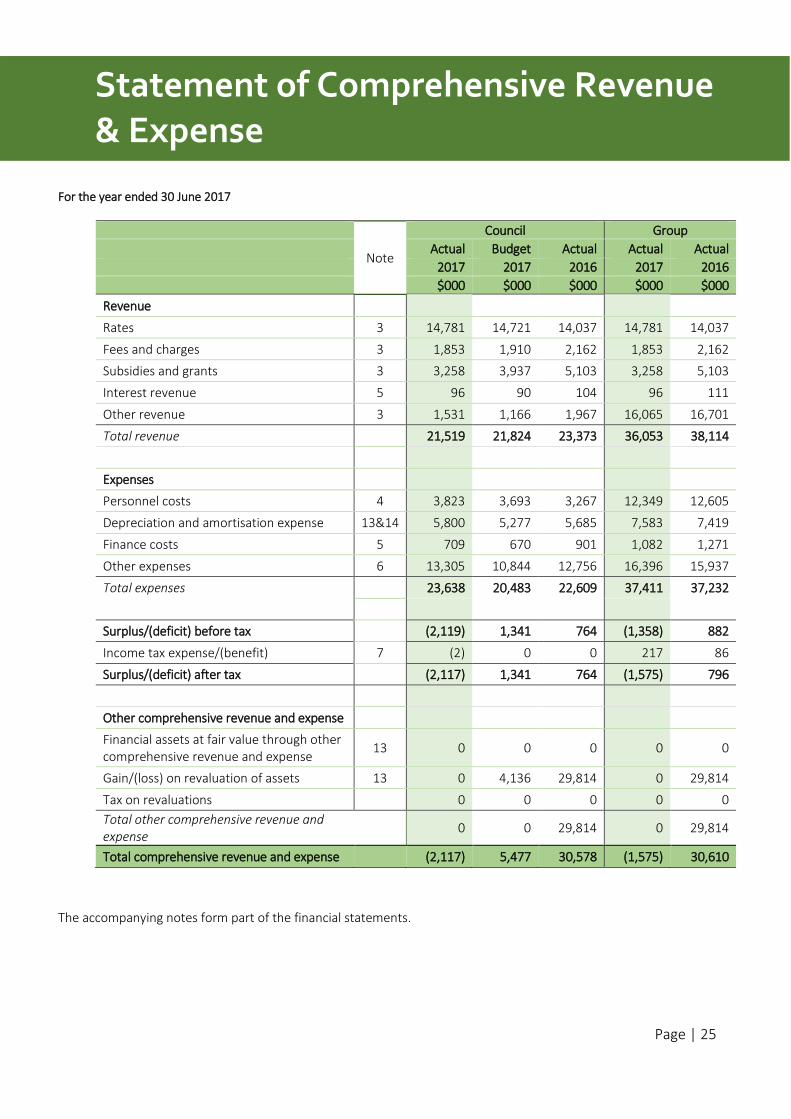
For the year ended 30 June 2017
Note
Council Group
Actual Budget Actual Actual Actual
2017 2017 2016 2017 2016
$000 $000 $000 $000 $000
Revenue
Rates 3 14,781 14,721 14,037 14,781 14,037
Fees and charges 3 1,853 1,910 2,162 1,853 2,162
Subsidies and grants 3 3,258 3,937 5,103 3,258 5,103
Interest revenue 5 96 90 104 96 111
Other revenue 3 1,531 1,166 1,967 16,065 16,701
Total revenue 21,519 21,824 23,373 36,053 38,114
Expenses
Personnel costs 4 3,823 3,693 3,267 12,349 12,605
Depreciation and amortisation expense 13&14 5,800 5,277 5,685 7,583 7,419
Finance costs 5 709 670 901 1,082 1,271
Other expenses 6 13,305 10,844 12,756 16,396 15,937
Total expenses 23,638 20,483 22,609 37,411 37,232
Surplus/(deficit) before tax (2,119) 1,341 764 (1,358) 882
Income tax expense/(benefit) 7 (2) 0 0 217 86
Surplus/(deficit) after tax (2,117) 1,341 764 (1,575) 796
Other comprehensive revenue and expense
Financial assets at fair value through other comprehensive revenue and expense
13 0 0 0 0 0
Gain/(loss) on revaluation of assets 13 0 4,136 29,814 0 29,814
Tax on revaluations 0 0 0 0 0
Total other comprehensive revenue and expense
0 0 29,814 0 29,814
Total comprehensive revenue and expense (2,117) 5,477 30,578 (1,575) 30,610
The accompanying notes form part of the financial statements.
Statement of Comprehensive Revenue & Expense
Page | 26
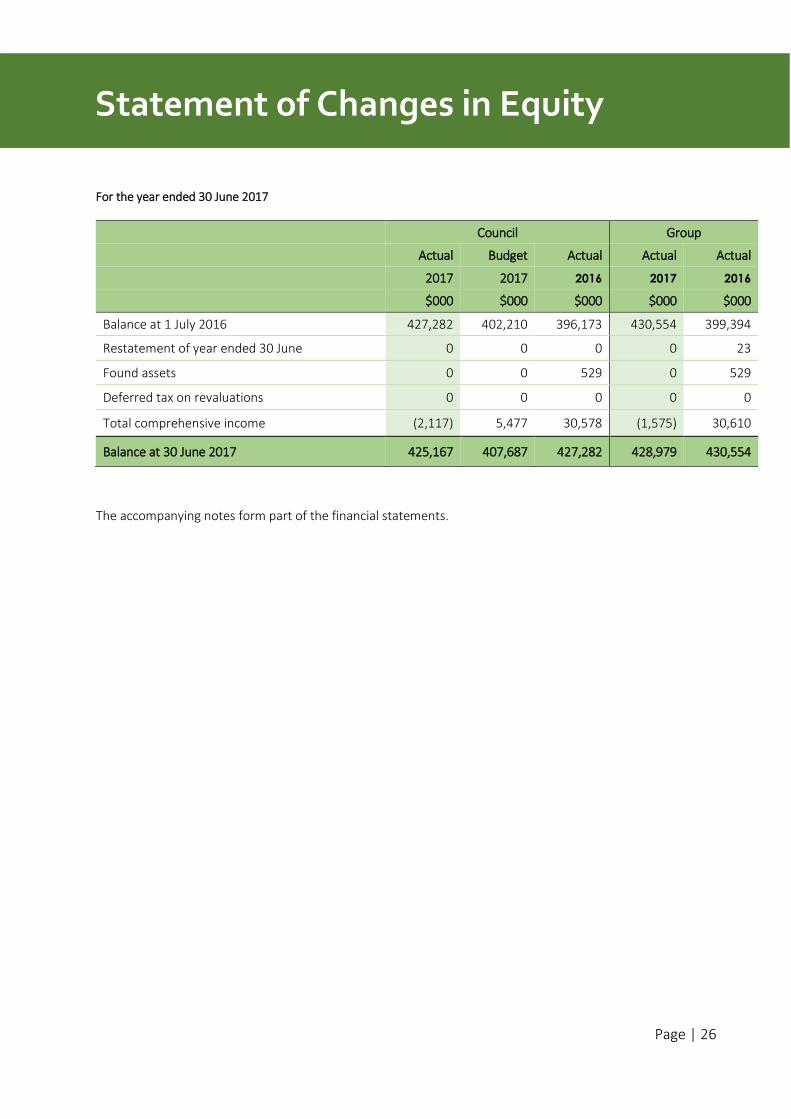
For the year ended 30 June 2017
Council Group
Actual Budget Actual Actual Actual
2017 2017 2016 2017 2016
$000 $000 $000 $000 $000
Balance at 1 July 2016 427,282 402,210 396,173 430,554 399,394
Restatement of year ended 30 June 0 0 0 0 23
Found assets 0 0 529 0 529
Deferred tax on revaluations 0 0 0 0 0
Total comprehensive income (2,117) 5,477 30,578 (1,575) 30,610
Balance at 30 June 2017 425,167 407,687 427,282 428,979 430,554
The accompanying notes form part of the financial statements.
Statement of Changes in Equity
Page | 27
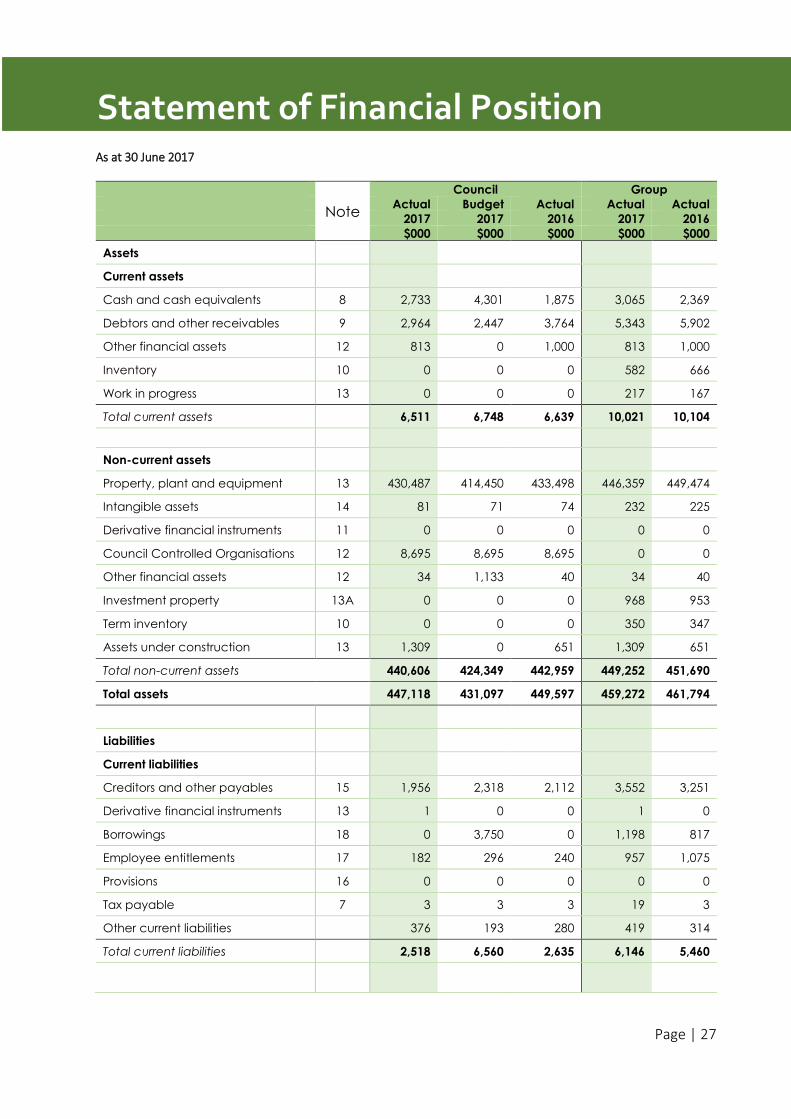
As at 30 June 2017
Note
Council Group
Actual Budget Actual Actual Actual
2017 2017 2016 2017 2016
$000 $000 $000 $000 $000
Assets
Current assets
Cash and cash equivalents 8 2,733 4,301 1,875 3,065 2,369
Debtors and other receivables 9 2,964 2,447 3,764 5,343 5,902
Other financial assets 12 813 0 1,000 813 1,000
Inventory 10 0 0 0 582 666
Work in progress 13 0 0 0 217 167
Total current assets 6,511 6,748 6,639 10,021 10,104
Non-current assets
Property, plant and equipment 13 430,487 414,450 433,498 446,359 449,474
Intangible assets 14 81 71 74 232 225
Derivative financial instruments 11 0 0 0 0 0
Council Controlled Organisations 12 8,695 8,695 8,695 0 0
Other financial assets 12 34 1,133 40 34 40
Investment property 13A 0 0 0 968 953
Term inventory 10 0 0 0 350 347
Assets under construction 13 1,309 0 651 1,309 651
Total non-current assets 440,606 424,349 442,959 449,252 451,690
Total assets 447,118 431,097 449,597 459,272 461,794
Liabilities
Current liabilities
Creditors and other payables 15 1,956 2,318 2,112 3,552 3,251
Derivative financial instruments 13 1 0 0 1 0
Borrowings 18 0 3,750 0 1,198 817
Employee entitlements 17 182 296 240 957 1,075
Provisions 16 0 0 0 0 0
Tax payable 7 3 3 3 19 3
Other current liabilities 376 193 280 419 314
Total current liabilities 2,518 6,560 2,635 6,146 5,460
Statement of Financial Position
Page | 28
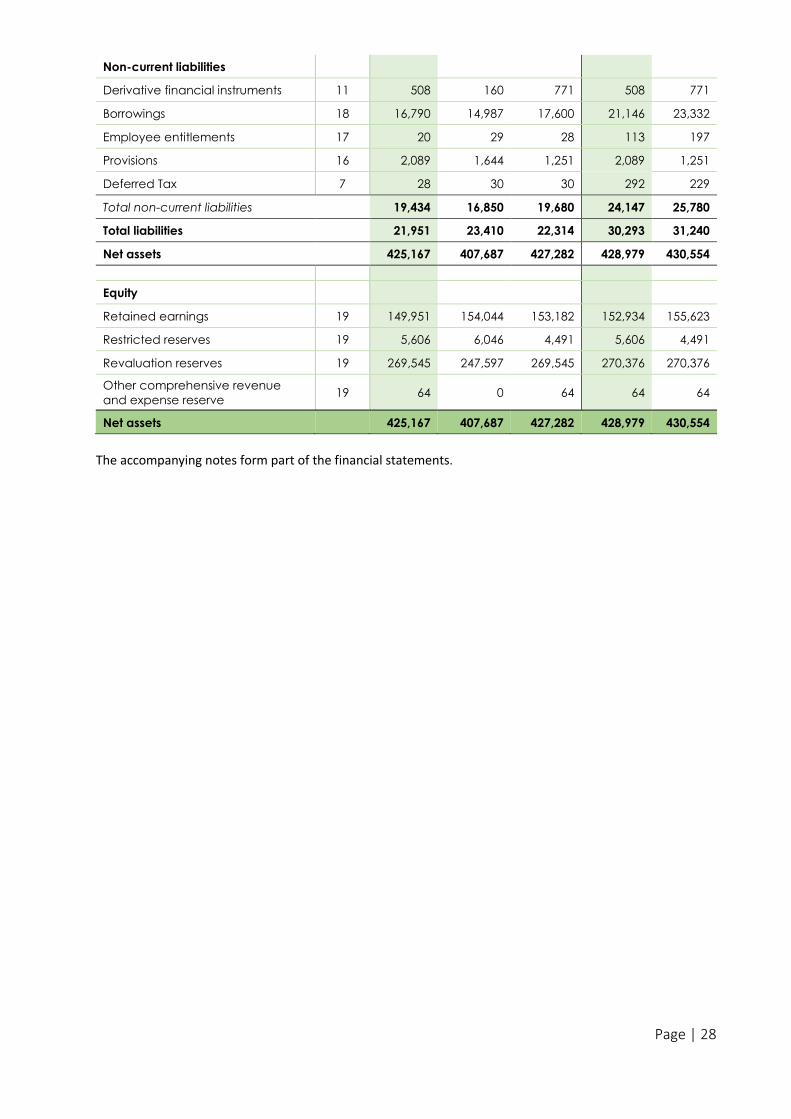
Non-current liabilities
Derivative financial instruments 11 508 160 771 508 771
Borrowings 18 16,790 14,987 17,600 21,146 23,332
Employee entitlements 17 20 29 28 113 197
Provisions 16 2,089 1,644 1,251 2,089 1,251
Deferred Tax 7 28 30 30 292 229
Total non-current liabilities 19,434 16,850 19,680 24,147 25,780
Total liabilities 21,951 23,410 22,314 30,293 31,240
Net assets 425,167 407,687 427,282 428,979 430,554
Equity
Retained earnings 19 149,951 154,044 153,182 152,934 155,623
Restricted reserves 19 5,606 6,046 4,491 5,606 4,491
Revaluation reserves 19 269,545 247,597 269,545 270,376 270,376
Other comprehensive revenue
and expense reserve 19 64 0 64 64 64
Net assets 425,167 407,687 427,282 428,979 430,554
The accompanying notes form part of the financial statements.
Page | 29
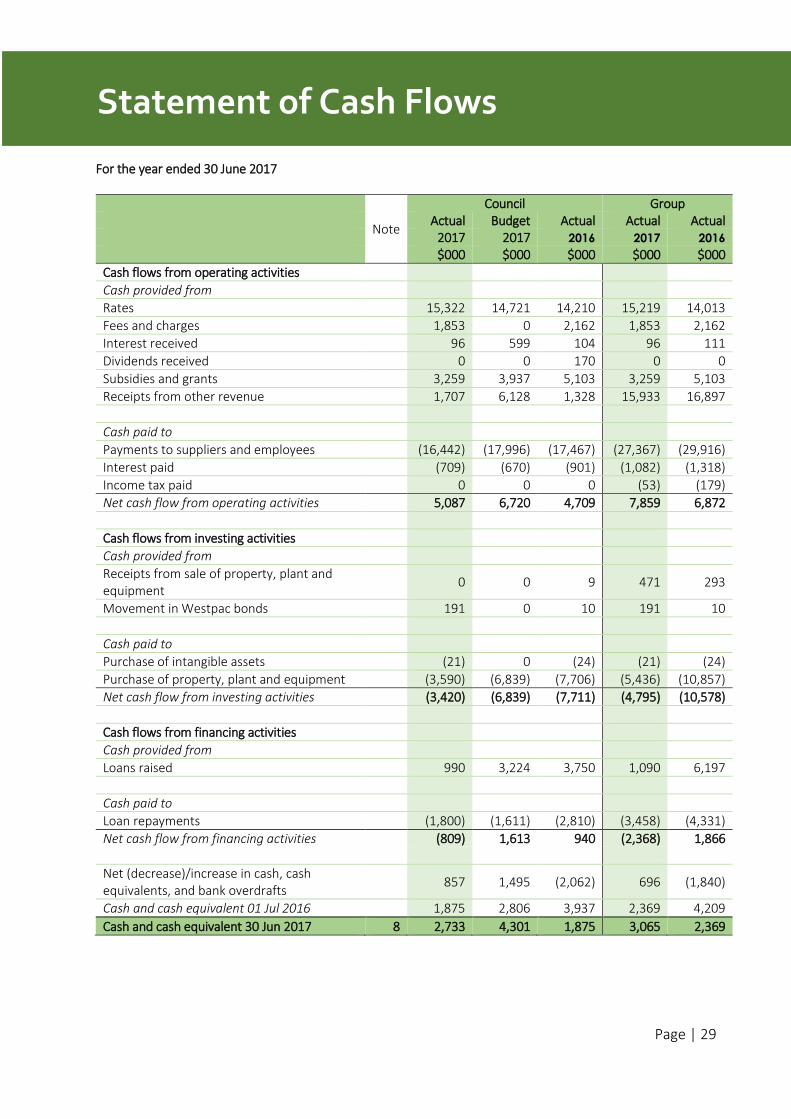
For the year ended 30 June 2017
Note
Council Group Actual Budget Actual Actual Actual 2017 2017 2016 2017 2016
$000 $000 $000 $000 $000
Cash flows from operating activities
Cash provided from
Rates 15,322 14,721 14,210 15,219 14,013
Fees and charges 1,853 0 2,162 1,853 2,162
Interest received 96 599 104 96 111
Dividends received 0 0 170 0 0
Subsidies and grants 3,259 3,937 5,103 3,259 5,103
Receipts from other revenue 1,707 6,128 1,328 15,933 16,897
Cash paid to
Payments to suppliers and employees (16,442) (17,996) (17,467) (27,367) (29,916)
Interest paid (709) (670) (901) (1,082) (1,318)
Income tax paid 0 0 0 (53) (179)
Net cash flow from operating activities 5,087 6,720 4,709 7,859 6,872
Cash flows from investing activities
Cash provided from
Receipts from sale of property, plant and equipment
0 0 9 471 293
Movement in Westpac bonds 191 0 10 191 10
Cash paid to
Purchase of intangible assets (21) 0 (24) (21) (24)
Purchase of property, plant and equipment (3,590) (6,839) (7,706) (5,436) (10,857)
Net cash flow from investing activities (3,420) (6,839) (7,711) (4,795) (10,578)
Cash flows from financing activities
Cash provided from
Loans raised 990 3,224 3,750 1,090 6,197
Cash paid to
Loan repayments (1,800) (1,611) (2,810) (3,458) (4,331)
Net cash flow from financing activities (809) 1,613 940 (2,368) 1,866
Net (decrease)/increase in cash, cash equivalents, and bank overdrafts
857 1,495 (2,062) 696 (1,840)
Cash and cash equivalent 01 Jul 2016 1,875 2,806 3,937 2,369 4,209
Cash and cash equivalent 30 Jun 2017 8 2,733 4,301 1,875 3,065 2,369
Statement of Cash Flows
Page | 30
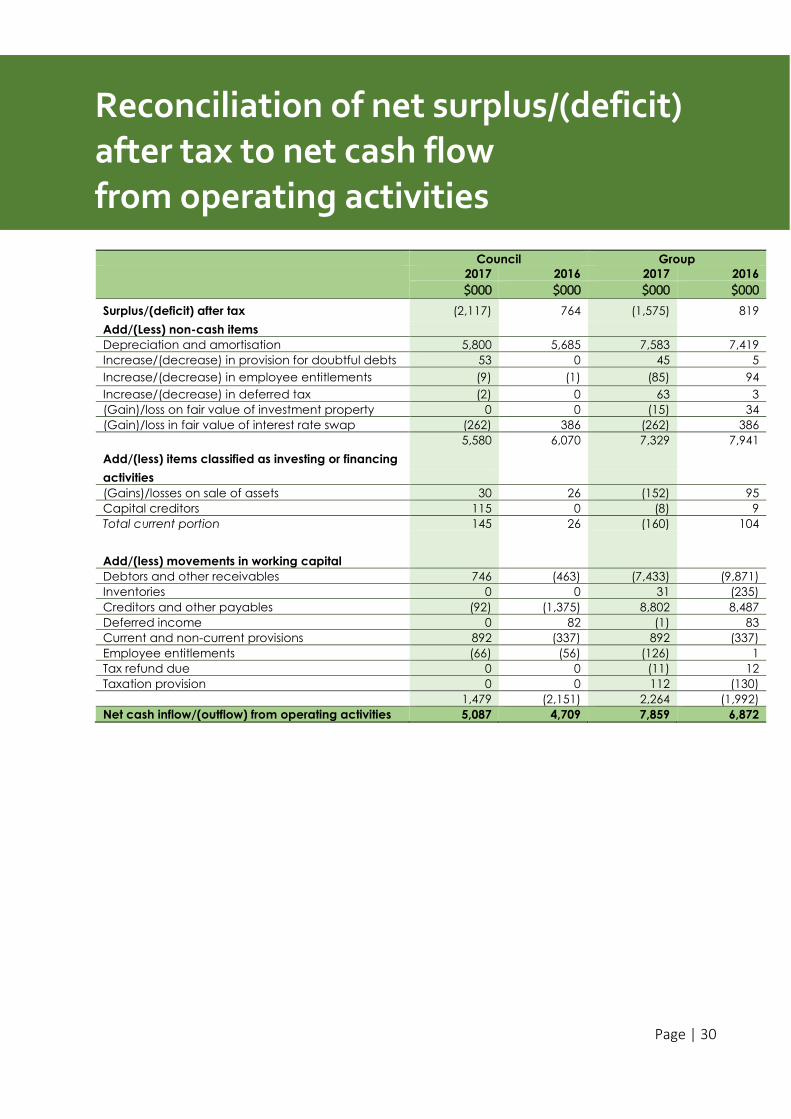
Council Group
2017 2016 2017 2016
$000 $000 $000 $000
Surplus/(deficit) after tax (2,117) 764 (1,575) 819
Add/(Less) non-cash items
Depreciation and amortisation 5,800 5,685 7,583 7,419
Increase/(decrease) in provision for doubtful debts 53 0 45 5
Increase/(decrease) in employee entitlements (9) (1) (85) 94
Increase/(decrease) in deferred tax (2) 0 63 3
(Gain)/loss on fair value of investment property 0 0 (15) 34
(Gain)/loss in fair value of interest rate swap (262) 386 (262) 386
5,580 6,070 7,329 7,941
Add/(less) items classified as investing or financing
activities
(Gains)/losses on sale of assets 30 26 (152) 95
Capital creditors 115 0 (8) 9
Total current portion 145 26 (160) 104
Add/(less) movements in working capital
Debtors and other receivables 746 (463) (7,433) (9,871)
Inventories 0 0 31 (235)
Creditors and other payables (92) (1,375) 8,802 8,487
Deferred income 0 82 (1) 83
Current and non-current provisions 892 (337) 892 (337)
Employee entitlements (66) (56) (126) 1
Tax refund due 0 0 (11) 12
Taxation provision 0 0 112 (130)
1,479 (2,151) 2,264 (1,992)
Net cash inflow/(outflow) from operating activities 5,087 4,709 7,859 6,872
Reconciliation of net surplus/(deficit) after tax to net cash flow from operating activities
Page | 31
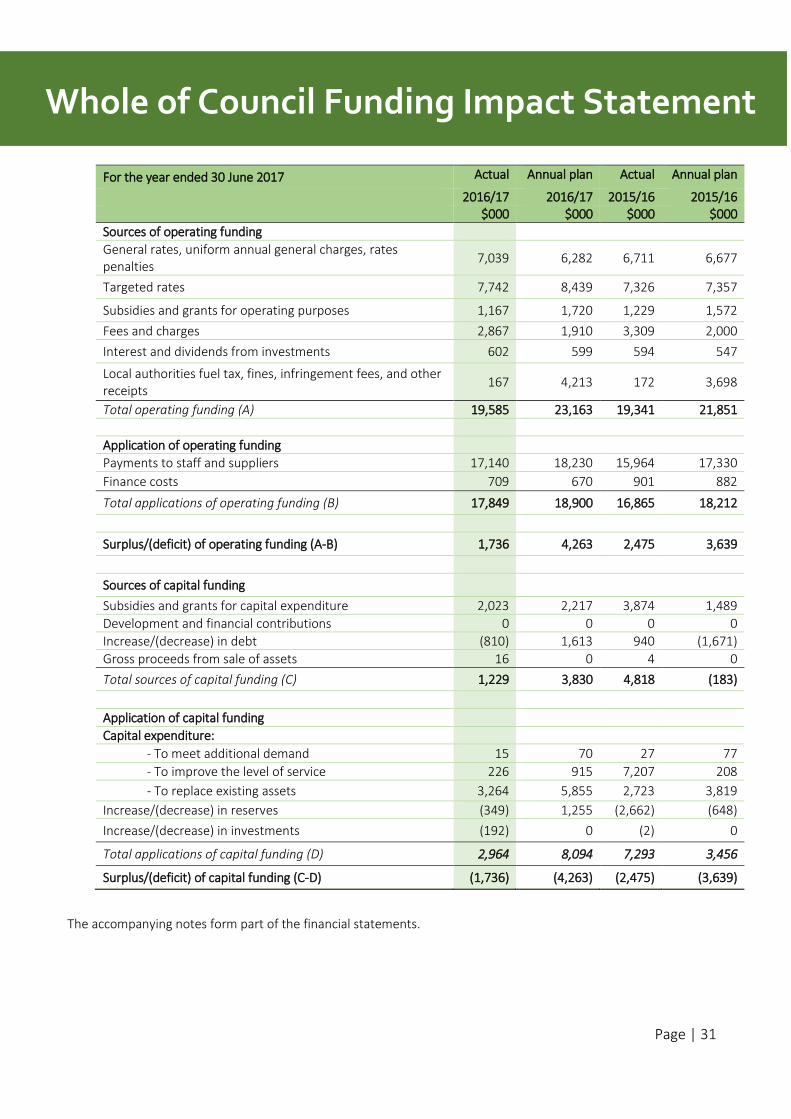
For the year ended 30 June 2017 Actual Annual plan Actual Annual plan
2016/17 2016/17 2015/16 2015/16 $000 $000 $000 $000
Sources of operating funding
General rates, uniform annual general charges, rates penalties
7,039 6,282 6,711 6,677
Targeted rates 7,742 8,439 7,326 7,357
Subsidies and grants for operating purposes 1,167 1,720 1,229 1,572
Fees and charges 2,867 1,910 3,309 2,000
Interest and dividends from investments 602 599 594 547
Local authorities fuel tax, fines, infringement fees, and other receipts
167 4,213 172 3,698
Total operating funding (A) 19,585 23,163 19,341 21,851
Application of operating funding
Payments to staff and suppliers 17,140 18,230 15,964 17,330
Finance costs 709 670 901 882
Total applications of operating funding (B) 17,849 18,900 16,865 18,212
Surplus/(deficit) of operating funding (A-B) 1,736 4,263 2,475 3,639
Sources of capital funding
Subsidies and grants for capital expenditure 2,023 2,217 3,874 1,489
Development and financial contributions 0 0 0 0
Increase/(decrease) in debt (810) 1,613 940 (1,671)
Gross proceeds from sale of assets 16 0 4 0
Total sources of capital funding (C) 1,229 3,830 4,818 (183)
Application of capital funding
Capital expenditure:
- To meet additional demand 15 70 27 77
- To improve the level of service 226 915 7,207 208
- To replace existing assets 3,264 5,855 2,723 3,819
Increase/(decrease) in reserves (349) 1,255 (2,662) (648)
Increase/(decrease) in investments (192) 0 (2) 0
Total applications of capital funding (D) 2,964 8,094 7,293 3,456
Surplus/(deficit) of capital funding (C-D) (1,736) (4,263) (2,475) (3,639)
The accompanying notes form part of the financial statements.
Whole of Council Funding Impact Statement
Page | 32
NOTES TO THE
FINANCIAL
STATEMENTS
Page | 33
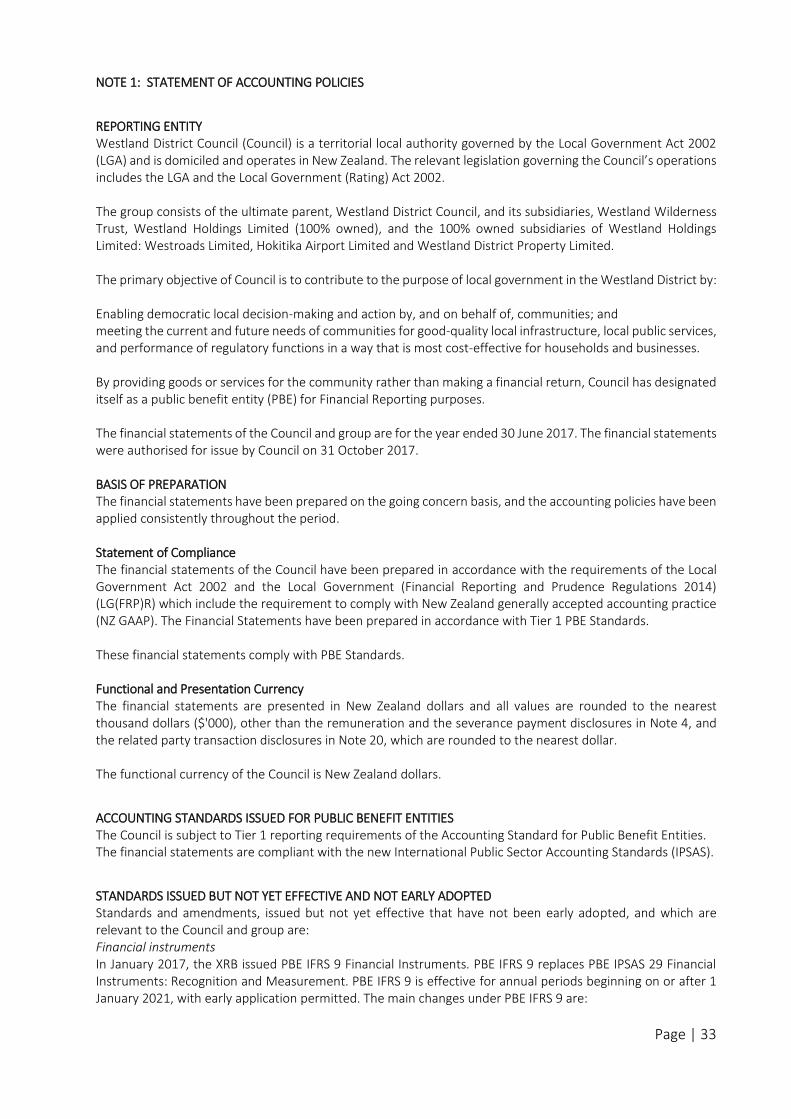
NOTE 1: STATEMENT OF ACCOUNTING POLICIES
REPORTING ENTITY Westland District Council (Council) is a territorial local authority governed by the Local Government Act 2002 (LGA) and is domiciled and operates in New Zealand. The relevant legislation governing the Council’s operations includes the LGA and the Local Government (Rating) Act 2002. The group consists of the ultimate parent, Westland District Council, and its subsidiaries, Westland Wilderness Trust, Westland Holdings Limited (100% owned), and the 100% owned subsidiaries of Westland Holdings Limited: Westroads Limited, Hokitika Airport Limited and Westland District Property Limited. The primary objective of Council is to contribute to the purpose of local government in the Westland District by: Enabling democratic local decision-making and action by, and on behalf of, communities; and meeting the current and future needs of communities for good-quality local infrastructure, local public services, and performance of regulatory functions in a way that is most cost-effective for households and businesses. By providing goods or services for the community rather than making a financial return, Council has designated itself as a public benefit entity (PBE) for Financial Reporting purposes. The financial statements of the Council and group are for the year ended 30 June 2017. The financial statements were authorised for issue by Council on 31 October 2017. BASIS OF PREPARATION The financial statements have been prepared on the going concern basis, and the accounting policies have been applied consistently throughout the period. Statement of Compliance The financial statements of the Council have been prepared in accordance with the requirements of the Local Government Act 2002 and the Local Government (Financial Reporting and Prudence Regulations 2014) (LG(FRP)R) which include the requirement to comply with New Zealand generally accepted accounting practice (NZ GAAP). The Financial Statements have been prepared in accordance with Tier 1 PBE Standards. These financial statements comply with PBE Standards. Functional and Presentation Currency The financial statements are presented in New Zealand dollars and all values are rounded to the nearest thousand dollars ($'000), other than the remuneration and the severance payment disclosures in Note 4, and the related party transaction disclosures in Note 20, which are rounded to the nearest dollar. The functional currency of the Council is New Zealand dollars.
ACCOUNTING STANDARDS ISSUED FOR PUBLIC BENEFIT ENTITIES The Council is subject to Tier 1 reporting requirements of the Accounting Standard for Public Benefit Entities. The financial statements are compliant with the new International Public Sector Accounting Standards (IPSAS).
STANDARDS ISSUED BUT NOT YET EFFECTIVE AND NOT EARLY ADOPTED Standards and amendments, issued but not yet effective that have not been early adopted, and which are relevant to the Council and group are: Financial instruments In January 2017, the XRB issued PBE IFRS 9 Financial Instruments. PBE IFRS 9 replaces PBE IPSAS 29 Financial Instruments: Recognition and Measurement. PBE IFRS 9 is effective for annual periods beginning on or after 1 January 2021, with early application permitted. The main changes under PBE IFRS 9 are:
Page | 34
New financial asset classification requirements for determining whether an asset is measured at fair value or amortised cost.
A new impairment model for financial assets based on expected losses, which may result in the earlier recognition of impairment losses.
Revised hedge accounting requirements to better reflect the management of risks. The Council plans to apply this standard in preparing its 30 June 2022 financial statements. The Council and group has not yet assessed the effects of the new standard. SIGNIFICANT ACCOUNTING POLICIES –
Are included in the notes to which they relate.
Significant accounting policies that do not relate to a specific note are outlined below.
Basis of consolidation: The Group (Westland District Council and Westland Holdings Ltd) consolidated accounts are prepared by combining like items of assets, liabilities, equity, revenue and expenses on a line-by-line basis. All significant intra-group balances, transactions, revenue and expenses are eliminated on consolidation. SUBSIDIARIES Subsidiaries are those entities in which Council has control. Westland Holdings Ltd is Council’s direct reporting subsidiary. This company controls three Council Controlled Organisations which are reporting entities under the Financial Reporting Act 1993. The Group consists of Westland District Properties Ltd, Hokitika Airport Ltd and Westroads Ltd. Investments in subsidiaries are recorded at cost. Transactions with subsidiaries are at arm’s length and under normal trading terms. Recharges are invoiced at cost. GOODS AND SERVICES TAX (GST) All items in the financial statements are stated exclusive of GST, except for receivables and payables, which are stated on a GST inclusive basis. Where GST is not recoverable as input tax then it is recognised as part of the related asset or expense. The net amount of GST recoverable from, or payable to, the Inland Revenue Department is included as part of receivables or payables in the Statement of Financial Position. The net GST paid to, or received from, the IRD, including the GST relating to investing and financing activities, is classified as an operating cash flow in the statement of cash flows. Commitments and contingencies are disclosed exclusive of GST. Budget figures The budget figures are those approved by Council in year one of its 2016/17 Annual Plan. The budget figures have been prepared in accordance with NZ GAAP, using accounting policies that are consistent with those adopted by Council for the preparation of the financial statements. CRITICAL ACCOUNTING ESTIMATES AND ASSUMPTIONS In preparing the financial forecasts and statements the Council has made estimates and assumptions concerning the future. These estimates and assumptions may differ from the subsequent actual results. Estimates and judgments are continually evaluated and are based on historical experience and other factors, including expectations or future events that are believed to be reasonable under the circumstances. The estimates and assumptions that have a significant risk of causing a material adjustment to the carrying amounts of assets and liabilities within the next financial year:
Estimating the landfill aftercare provision – see Note 16.
Estimating the fair value of land, buildings, and infrastructural assets – see Note 13.
Estimating the retirement and long service leave obligation – see Note 17.
Page | 35
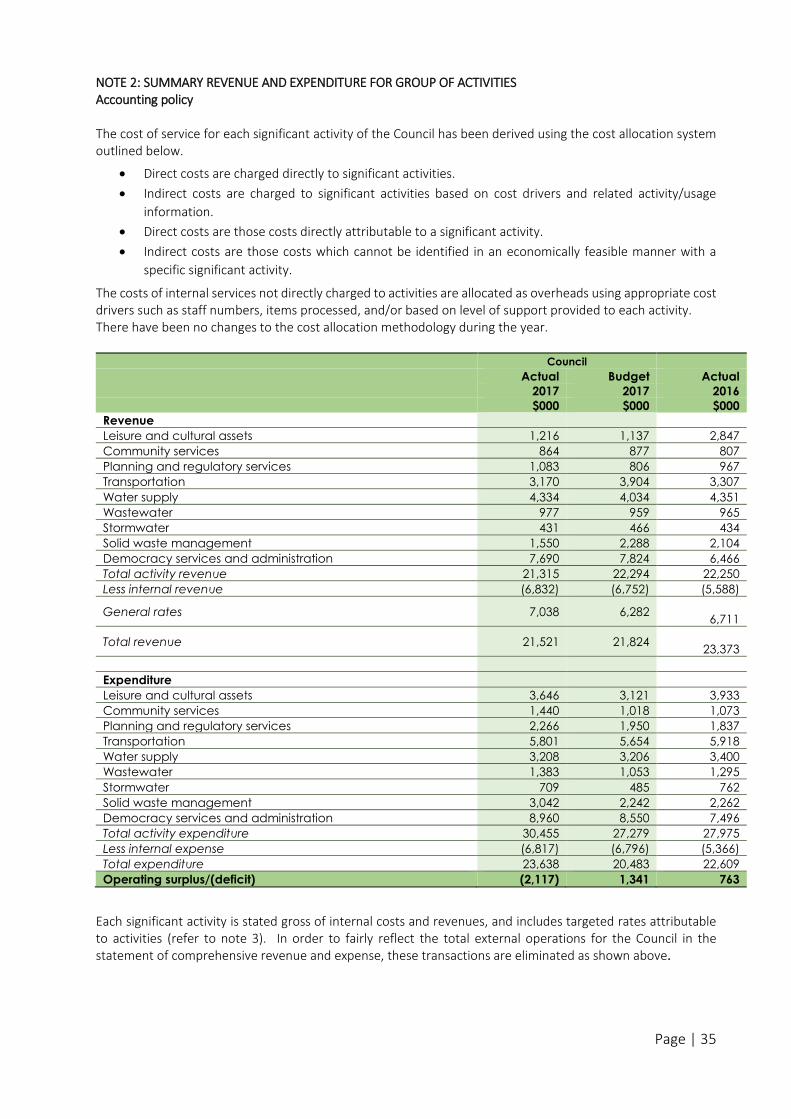
NOTE 2: SUMMARY REVENUE AND EXPENDITURE FOR GROUP OF ACTIVITIES Accounting policy The cost of service for each significant activity of the Council has been derived using the cost allocation system outlined below.
Direct costs are charged directly to significant activities.
Indirect costs are charged to significant activities based on cost drivers and related activity/usage
information.
Direct costs are those costs directly attributable to a significant activity.
Indirect costs are those costs which cannot be identified in an economically feasible manner with a
specific significant activity.
The costs of internal services not directly charged to activities are allocated as overheads using appropriate cost drivers such as staff numbers, items processed, and/or based on level of support provided to each activity. There have been no changes to the cost allocation methodology during the year.
Council
Actual Budget Actual
2017 2017 2016
$000 $000 $000
Revenue
Leisure and cultural assets 1,216 1,137 2,847
Community services 864 877 807
Planning and regulatory services 1,083 806 967
Transportation 3,170 3,904 3,307
Water supply 4,334 4,034 4,351
Wastewater 977 959 965
Stormwater 431 466 434
Solid waste management 1,550 2,288 2,104
Democracy services and administration 7,690 7,824 6,466
Total activity revenue 21,315 22,294 22,250
Less internal revenue (6,832) (6,752) (5,588)
General rates 7,038 6,282
6,711
Total revenue 21,521 21,824
23,373
Expenditure
Leisure and cultural assets 3,646 3,121 3,933
Community services 1,440 1,018 1,073
Planning and regulatory services 2,266 1,950 1,837
Transportation 5,801 5,654 5,918
Water supply 3,208 3,206 3,400
Wastewater 1,383 1,053 1,295
Stormwater 709 485 762
Solid waste management 3,042 2,242 2,262
Democracy services and administration 8,960 8,550 7,496
Total activity expenditure 30,455 27,279 27,975
Less internal expense (6,817) (6,796) (5,366)
Total expenditure 23,638 20,483 22,609
Operating surplus/(deficit) (2,117) 1,341 763
Each significant activity is stated gross of internal costs and revenues, and includes targeted rates attributable to activities (refer to note 3). In order to fairly reflect the total external operations for the Council in the statement of comprehensive revenue and expense, these transactions are eliminated as shown above.
Page | 36
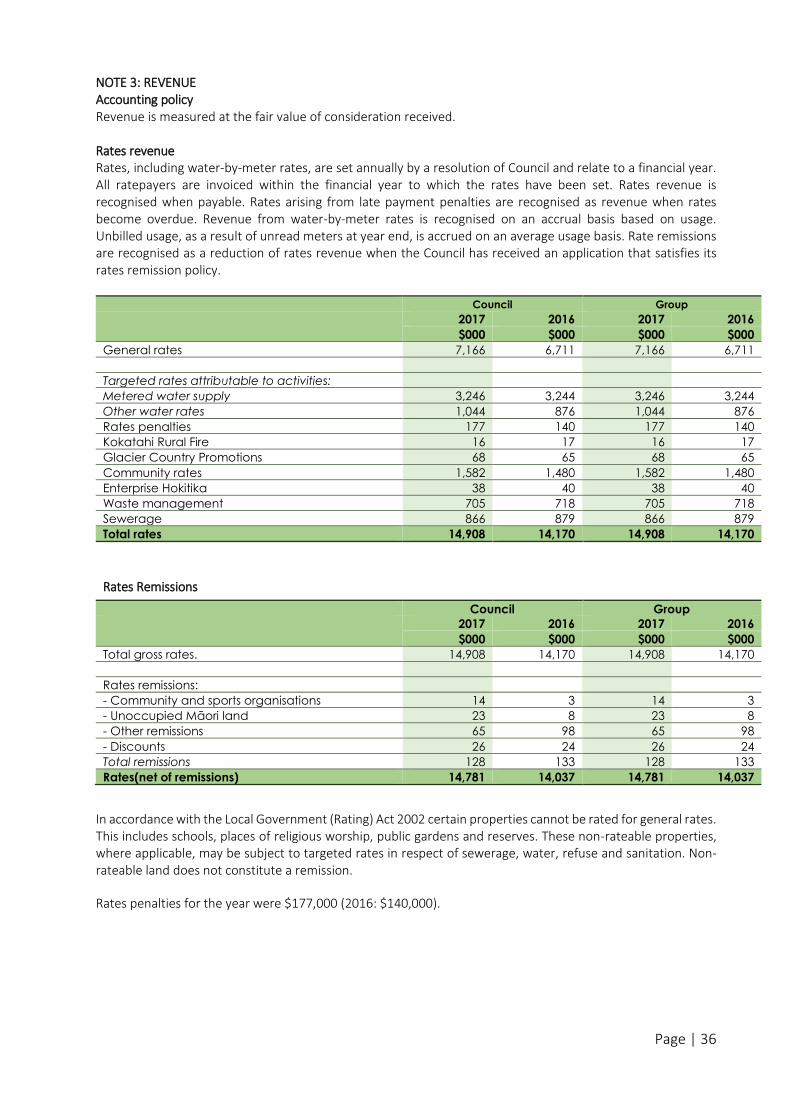
NOTE 3: REVENUE Accounting policy Revenue is measured at the fair value of consideration received. Rates revenue Rates, including water-by-meter rates, are set annually by a resolution of Council and relate to a financial year. All ratepayers are invoiced within the financial year to which the rates have been set. Rates revenue is recognised when payable. Rates arising from late payment penalties are recognised as revenue when rates become overdue. Revenue from water-by-meter rates is recognised on an accrual basis based on usage. Unbilled usage, as a result of unread meters at year end, is accrued on an average usage basis. Rate remissions are recognised as a reduction of rates revenue when the Council has received an application that satisfies its rates remission policy.
Council Group
2017 2016 2017 2016
$000 $000 $000 $000
General rates 7,166 6,711 7,166 6,711
Targeted rates attributable to activities:
Metered water supply 3,246 3,244 3,246 3,244
Other water rates 1,044 876 1,044 876
Rates penalties 177 140 177 140
Kokatahi Rural Fire 16 17 16 17
Glacier Country Promotions 68 65 68 65
Community rates 1,582 1,480 1,582 1,480
Enterprise Hokitika 38 40 38 40
Waste management 705 718 705 718
Sewerage 866 879 866 879
Total rates 14,908 14,170 14,908 14,170
Rates Remissions
Council Group
2017 2016 2017 2016
$000 $000 $000 $000
Total gross rates. 14,908 14,170 14,908 14,170
Rates remissions:
- Community and sports organisations 14 3 14 3
- Unoccupied Māori land 23 8 23 8
- Other remissions 65 98 65 98
- Discounts 26 24 26 24
Total remissions 128 133 128 133
Rates(net of remissions) 14,781 14,037 14,781 14,037
In accordance with the Local Government (Rating) Act 2002 certain properties cannot be rated for general rates. This includes schools, places of religious worship, public gardens and reserves. These non-rateable properties, where applicable, may be subject to targeted rates in respect of sewerage, water, refuse and sanitation. Non-rateable land does not constitute a remission.
Rates penalties for the year were $177,000 (2016: $140,000).
Page | 37
Other revenue Council Group
2017 2016 2017 2016
$000 $000 $000 $000
Traffic and parking infringements 28 13 28 13
Regulatory revenue 147 156 147 156
Petrol tax 116 119 116 119
Donations 10 21 10 21
Dividend income 0 170 0 0
Subvention receipts 240 320 0 0
Net gain on held for trading interest rate swaps 262 0 266 0
Property, plant & equipment: gains on disposal 0 5 238 35
Other 726 1,163 15,258 16,357
Total other revenue 1,531 1,967 16,065 16,701
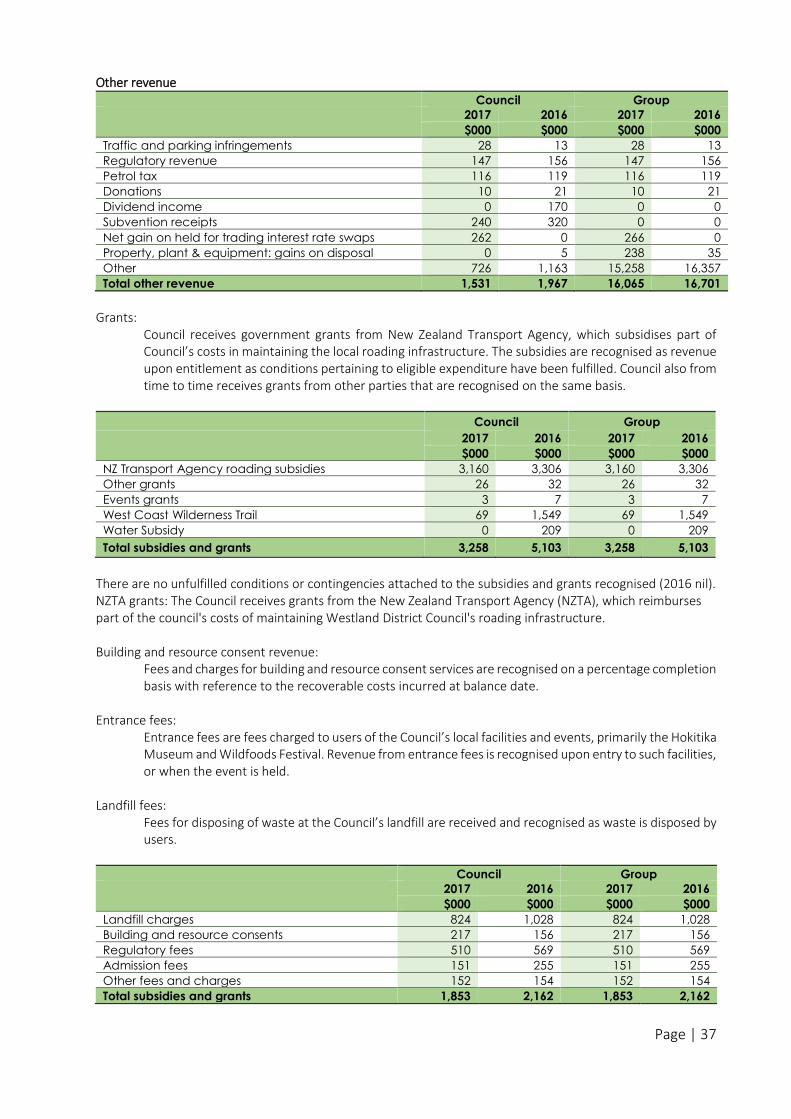
Grants:
Council receives government grants from New Zealand Transport Agency, which subsidises part of Council’s costs in maintaining the local roading infrastructure. The subsidies are recognised as revenue upon entitlement as conditions pertaining to eligible expenditure have been fulfilled. Council also from time to time receives grants from other parties that are recognised on the same basis.
Council Group
2017 2016 2017 2016
$000 $000 $000 $000
NZ Transport Agency roading subsidies 3,160 3,306 3,160 3,306
Other grants 26 32 26 32
Events grants 3 7 3 7
West Coast Wilderness Trail 69 1,549 69 1,549
Water Subsidy 0 209 0 209
Total subsidies and grants 3,258 5,103 3,258 5,103
There are no unfulfilled conditions or contingencies attached to the subsidies and grants recognised (2016 nil). NZTA grants: The Council receives grants from the New Zealand Transport Agency (NZTA), which reimburses part of the council's costs of maintaining Westland District Council's roading infrastructure. Building and resource consent revenue:
Fees and charges for building and resource consent services are recognised on a percentage completion basis with reference to the recoverable costs incurred at balance date.
Entrance fees: Entrance fees are fees charged to users of the Council’s local facilities and events, primarily the Hokitika Museum and Wildfoods Festival. Revenue from entrance fees is recognised upon entry to such facilities, or when the event is held.
Landfill fees: Fees for disposing of waste at the Council’s landfill are received and recognised as waste is disposed by users.
Council Group
2017 2016 2017 2016
$000 $000 $000 $000
Landfill charges 824 1,028 824 1,028
Building and resource consents 217 156 217 156
Regulatory fees 510 569 510 569
Admission fees 151 255 151 255
Other fees and charges 152 154 152 154
Total subsidies and grants 1,853 2,162 1,853 2,162
Page | 38
Provision of commercially based services
Revenue from the rendering of services is recognised by reference to the stage of completion of the transaction at balance date, based on the actual service provided as a percentage of the total services to be provided. The stage of completion is assessed by reference to surveys of work performed.
Sales of goods Revenue from the sale of goods is measured at fair value of the consideration received or receivable, net of returns or allowances, trade discounts and volume rebates. Revenue is recognised when the significant risks and rewards of ownership have been transferred to the buyer, recovery of the consideration is probable, the associated costs and possible return of goods can be estimated reliably, and there is no continuing management involvement with the goods. Where revenue is derived by acting as an agent for another party, the revenue that is recognised is the commission or fee on the transaction.
Infringement fees and fines Infringement fees and fines mostly relate to traffic and parking infringements and are recognised when the infringement notice is issued. The revenue recognised is determined based on the probability of collecting fines.
Vested or donated physical assets For assets received for no or nominal consideration, the asset is recognised at its fair value when the Council obtains control of the asset. The fair value of the asset is recognised as revenue, unless there is a use or return condition attached to the asset. For long-lived assets that must be used for a specific use (e.g. land must be used as a recreation reserve), the Council immediately recognises the fair value of the asset as revenue. A liability is recognised only if the Council expects it will need to return or pass the asset to another party.
Donated and bequeathed financial assets Donated and bequeathed financial assets are recognised as revenue unless there are substantive use or return conditions. A liability is recorded if there are substantive use or return conditions and the liability released to revenue as the conditions are met e.g. as the funds are spent for the nominated purpose.
Revenue from investments Interest revenue is recognised using the effective interest method. Interest revenue on an impaired financial asset is recognised using the original effective interest rate. Dividends are recognised when the right to receive payment has been established. When dividends are declared from pre-acquisition surpluses, the dividend is deducted from the cost of the investment.
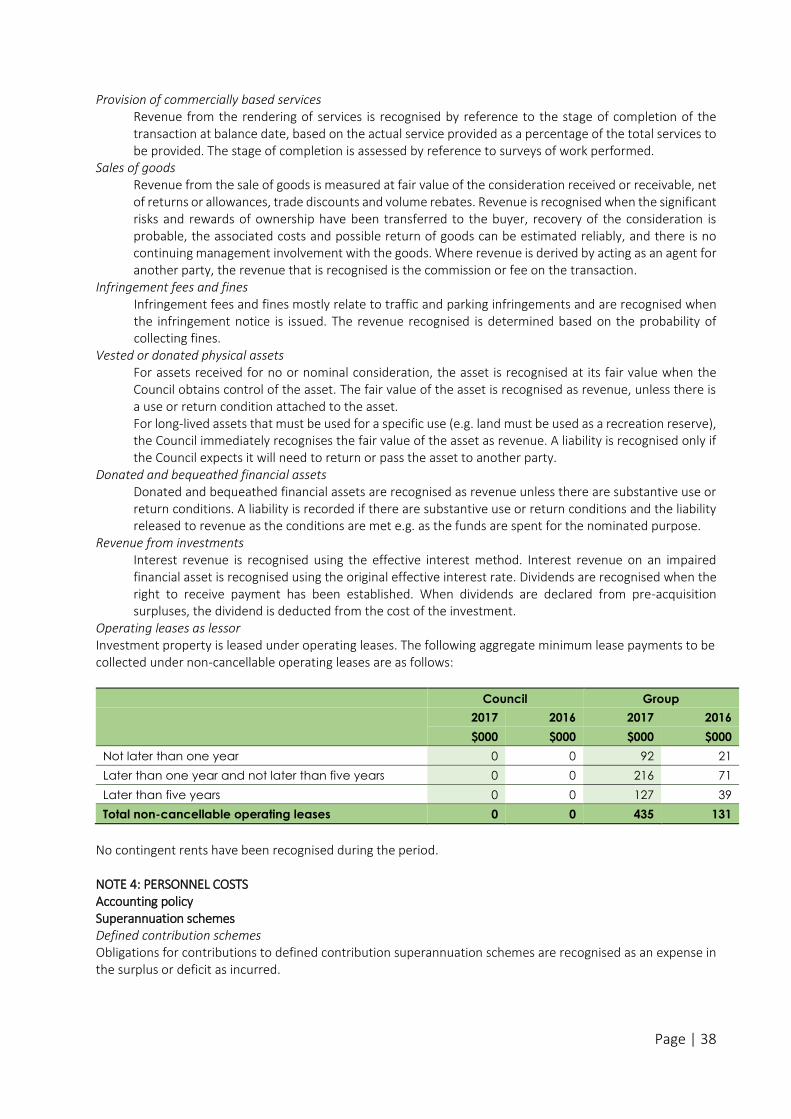
Operating leases as lessor Investment property is leased under operating leases. The following aggregate minimum lease payments to be collected under non-cancellable operating leases are as follows:
Council Group
2017 2016 2017 2016
$000 $000 $000 $000
Not later than one year 0 0 92 21
Later than one year and not later than five years 0 0 216 71
Later than five years 0 0 127 39
Total non-cancellable operating leases 0 0 435 131
No contingent rents have been recognised during the period. NOTE 4: PERSONNEL COSTS Accounting policy Superannuation schemes Defined contribution schemes Obligations for contributions to defined contribution superannuation schemes are recognised as an expense in the surplus or deficit as incurred.
Page | 39
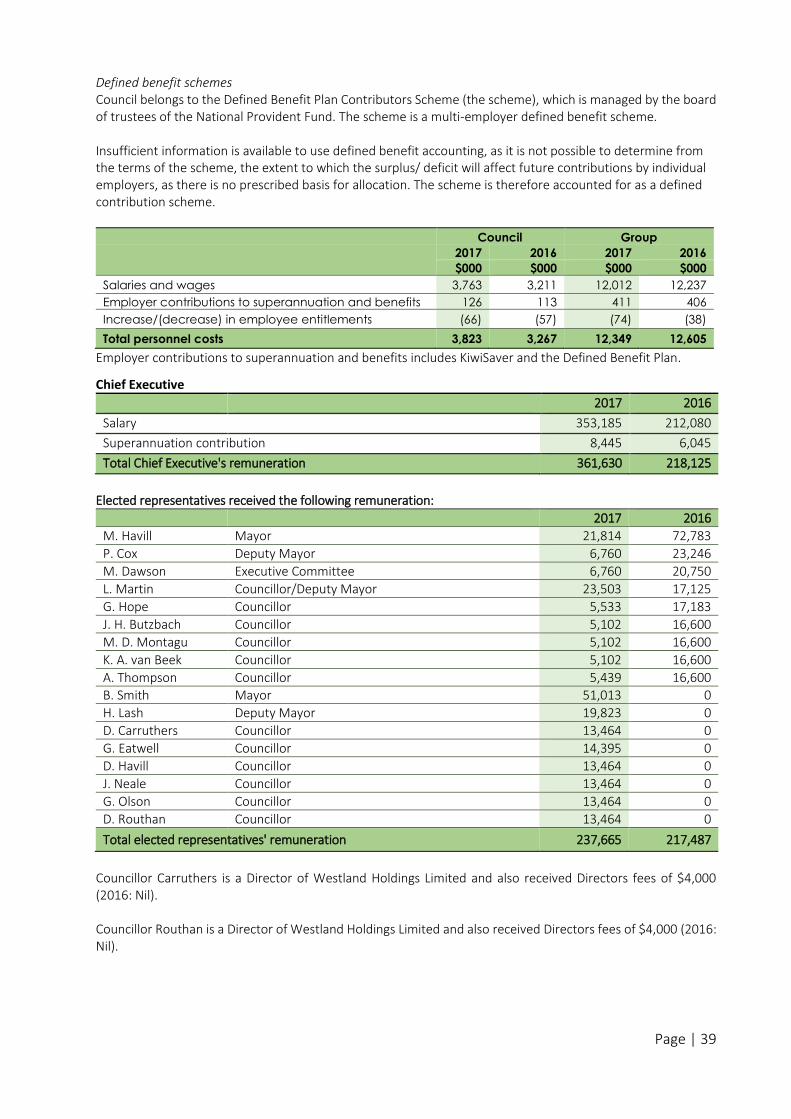
Defined benefit schemes Council belongs to the Defined Benefit Plan Contributors Scheme (the scheme), which is managed by the board of trustees of the National Provident Fund. The scheme is a multi-employer defined benefit scheme.
Insufficient information is available to use defined benefit accounting, as it is not possible to determine from the terms of the scheme, the extent to which the surplus/ deficit will affect future contributions by individual employers, as there is no prescribed basis for allocation. The scheme is therefore accounted for as a defined contribution scheme.
Council Group
2017 2016 2017 2016
$000 $000 $000 $000
Salaries and wages 3,763 3,211 12,012 12,237
Employer contributions to superannuation and benefits 126 113 411 406
Increase/(decrease) in employee entitlements (66) (57) (74) (38)
Total personnel costs 3,823 3,267 12,349 12,605
Employer contributions to superannuation and benefits includes KiwiSaver and the Defined Benefit Plan.
Chief Executive
2017 2016
Salary 353,185 212,080
Superannuation contribution 8,445 6,045
Total Chief Executive's remuneration 361,630 218,125
Elected representatives received the following remuneration:
2017 2016
M. Havill Mayor 21,814 72,783
P. Cox Deputy Mayor 6,760 23,246
M. Dawson Executive Committee 6,760 20,750
L. Martin Councillor/Deputy Mayor 23,503 17,125
G. Hope Councillor 5,533 17,183
J. H. Butzbach Councillor 5,102 16,600
M. D. Montagu Councillor 5,102 16,600
K. A. van Beek Councillor 5,102 16,600
A. Thompson Councillor 5,439 16,600
B. Smith Mayor 51,013 0
H. Lash Deputy Mayor 19,823 0
D. Carruthers Councillor 13,464 0
G. Eatwell Councillor 14,395 0
D. Havill Councillor 13,464 0
J. Neale Councillor 13,464 0
G. Olson Councillor 13,464 0
D. Routhan Councillor 13,464 0
Total elected representatives' remuneration 237,665 217,487
Councillor Carruthers is a Director of Westland Holdings Limited and also received Directors fees of $4,000 (2016: Nil). Councillor Routhan is a Director of Westland Holdings Limited and also received Directors fees of $4,000 (2016: Nil).
Page | 40
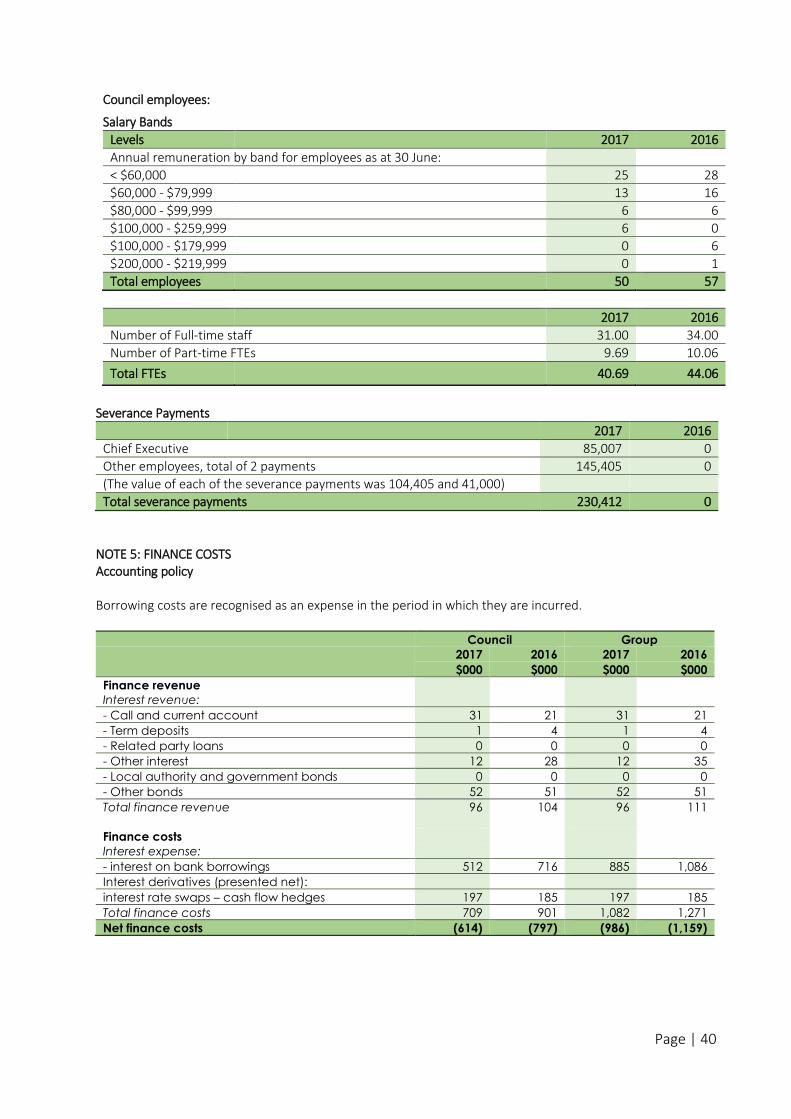
Council employees:
Salary Bands
Levels 2017 2016
Annual remuneration by band for employees as at 30 June:
< $60,000 25 28
$60,000 - $79,999 13 16
$80,000 - $99,999 6 6
$100,000 - $259,999 6 0
$100,000 - $179,999 0 6
$200,000 - $219,999 0 1
Total employees 50 57
2017 2016
Number of Full-time staff 31.00 34.00
Number of Part-time FTEs 9.69 10.06
Total FTEs 40.69 44.06
Severance Payments
2017 2016
Chief Executive 85,007 0
Other employees, total of 2 payments 145,405 0
(The value of each of the severance payments was 104,405 and 41,000)
Total severance payments 230,412 0
NOTE 5: FINANCE COSTS Accounting policy Borrowing costs are recognised as an expense in the period in which they are incurred.
Council Group
2017 2016 2017 2016
$000 $000 $000 $000
Finance revenue
Interest revenue:
- Call and current account 31 21 31 21
- Term deposits 1 4 1 4
- Related party loans 0 0 0 0
- Other interest 12 28 12 35
- Local authority and government bonds 0 0 0 0
- Other bonds 52 51 52 51
Total finance revenue 96 104 96 111
Finance costs
Interest expense:
- interest on bank borrowings 512 716 885 1,086
Interest derivatives (presented net):
interest rate swaps – cash flow hedges 197 185 197 185
Total finance costs 709 901 1,082 1,271
Net finance costs (614) (797) (986) (1,159)
Page | 41
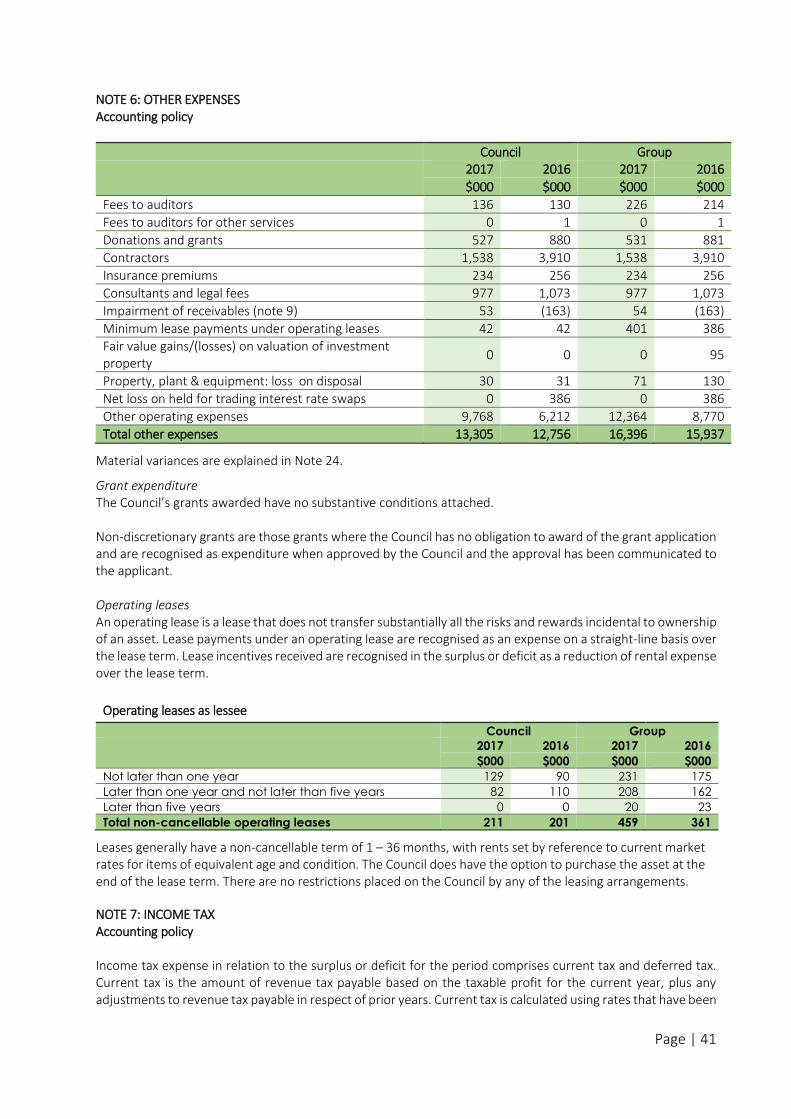
NOTE 6: OTHER EXPENSES Accounting policy
Council Group
2017 2016 2017 2016
$000 $000 $000 $000
Fees to auditors 136 130 226 214
Fees to auditors for other services 0 1 0 1
Donations and grants 527 880 531 881
Contractors 1,538 3,910 1,538 3,910
Insurance premiums 234 256 234 256
Consultants and legal fees 977 1,073 977 1,073
Impairment of receivables (note 9) 53 (163) 54 (163)
Minimum lease payments under operating leases 42 42 401 386
Fair value gains/(losses) on valuation of investment property
0 0 0 95
Property, plant & equipment: loss on disposal 30 31 71 130
Net loss on held for trading interest rate swaps 0 386 0 386
Other operating expenses 9,768 6,212 12,364 8,770
Total other expenses 13,305 12,756 16,396 15,937
Material variances are explained in Note 24.
Grant expenditure The Council’s grants awarded have no substantive conditions attached. Non-discretionary grants are those grants where the Council has no obligation to award of the grant application and are recognised as expenditure when approved by the Council and the approval has been communicated to the applicant. Operating leases An operating lease is a lease that does not transfer substantially all the risks and rewards incidental to ownership of an asset. Lease payments under an operating lease are recognised as an expense on a straight-line basis over the lease term. Lease incentives received are recognised in the surplus or deficit as a reduction of rental expense over the lease term.
Operating leases as lessee
Council Group
2017 2016 2017 2016
$000 $000 $000 $000
Not later than one year 129 90 231 175
Later than one year and not later than five years 82 110 208 162
Later than five years 0 0 20 23
Total non-cancellable operating leases 211 201 459 361
Leases generally have a non-cancellable term of 1 – 36 months, with rents set by reference to current market rates for items of equivalent age and condition. The Council does have the option to purchase the asset at the end of the lease term. There are no restrictions placed on the Council by any of the leasing arrangements.
NOTE 7: INCOME TAX Accounting policy Income tax expense in relation to the surplus or deficit for the period comprises current tax and deferred tax. Current tax is the amount of revenue tax payable based on the taxable profit for the current year, plus any adjustments to revenue tax payable in respect of prior years. Current tax is calculated using rates that have been

Page | 42
enacted or substantively enacted by balance date. Deferred tax is the amount of income tax payable or recoverable in future periods in respect of temporary differences and unused tax losses. Temporary differences are differences between the carrying amount of assets and liabilities in the financial statements and the corresponding tax bases used in the computation of taxable profit. Deferred tax liabilities are generally recognised for all taxable temporary differences. Deferred tax assets are recognised to the extent that it is probable that taxable profits will be available against which the deductible temporary differences or tax losses can be utilised.
Deferred tax is not recognised if the temporary difference arises from the initial recognition of goodwill or from the initial recognition of an asset and liability in a transaction that is not a business combination, and at the time of the transaction, affects neither accounting profit nor taxable profit. Deferred tax is measured at the tax rates that are expected to apply in the period when the liability is settled or the asset is realised, using tax rates that have been enacted or substantively enacted by balance date. The measurement of deferred tax reflects the tax consequences that would follow from the manner in which the entity expects to recover or settle the carrying amount of its assets and liabilities. Current tax and deferred tax is recognised against the surplus or deficit, except when it relates to a business combination, or to transactions recognised in other comprehensive revenue and expense or directly in equity.
Council Group
2017 2016 2017 2016
$000 $000 $000 $000 Component of tax expense
Current tax 0 0 (125) 83
Adjustments to current tax in prior years 0 0 0 0
Deferred tax (2) 0 63 3
Tax expense/(income) (2) 0 (63) 86
Relationship between tax expense and
accounting profit
Surplus/(deficit) before tax (2,119) 539 (1,650) 882
Tax at 28% (593) 151 (462) 246
Permanent differences 524 (240) 400 (160)
Plus/(less) tax effect of:
Group loss offset 67 90 0 0
Tax expense/(income) (2) 0 (63) 86
Property, Other Tax
Plant and Provisions Losses Total
Equipment
$000 $000 $000 $000
Deferred tax assets/(liabilities)
Council
Balance as at 1 July 2015 (34) 0 4 (30)
Charged to surplus or deficit (3) 0 3 0
Balance as at 30 June 2016 (37) 0 7 (30)
Charged to surplus or deficit (3) 0 5 2
Balance as at 30 June 2017 (40) 0 12 (28)
Group
Balance as at 1 July 2015 (491) 163 13 (315)
Charged to surplus or deficit 16 50 20 86
Balance as at 30 June 2016 (475) 213 33 (229)
Charged to surplus or deficit 11 (58) (16) (63)
Balance as at 30 June 2017 (464) 155 17 (292)
Page | 43
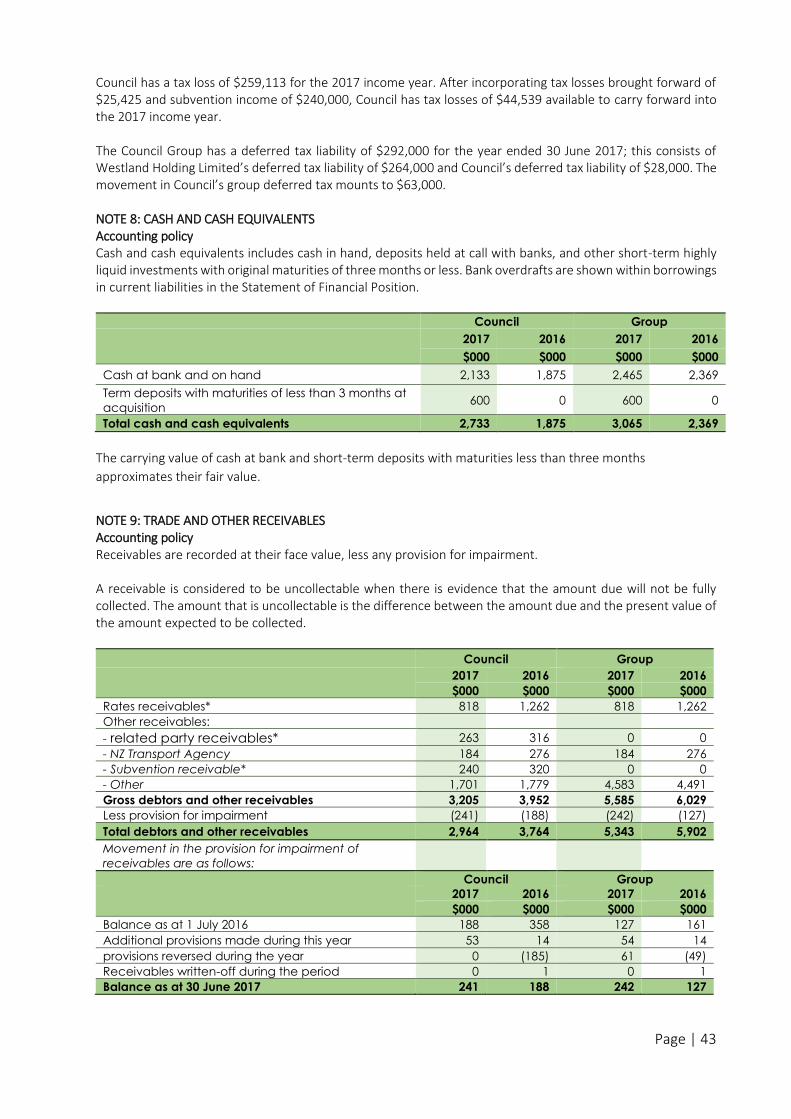
Council has a tax loss of $259,113 for the 2017 income year. After incorporating tax losses brought forward of $25,425 and subvention income of $240,000, Council has tax losses of $44,539 available to carry forward into the 2017 income year. The Council Group has a deferred tax liability of $292,000 for the year ended 30 June 2017; this consists of Westland Holding Limited’s deferred tax liability of $264,000 and Council’s deferred tax liability of $28,000. The movement in Council’s group deferred tax mounts to $63,000. NOTE 8: CASH AND CASH EQUIVALENTS Accounting policy Cash and cash equivalents includes cash in hand, deposits held at call with banks, and other short-term highly liquid investments with original maturities of three months or less. Bank overdrafts are shown within borrowings in current liabilities in the Statement of Financial Position.
Council Group
2017 2016 2017 2016
$000 $000 $000 $000
Cash at bank and on hand 2,133 1,875 2,465 2,369
Term deposits with maturities of less than 3 months at
acquisition 600 0 600 0
Total cash and cash equivalents 2,733 1,875 3,065 2,369
The carrying value of cash at bank and short-term deposits with maturities less than three months
approximates their fair value.
NOTE 9: TRADE AND OTHER RECEIVABLES Accounting policy Receivables are recorded at their face value, less any provision for impairment. A receivable is considered to be uncollectable when there is evidence that the amount due will not be fully collected. The amount that is uncollectable is the difference between the amount due and the present value of the amount expected to be collected.
Council Group
2017 2016 2017 2016
$000 $000 $000 $000
Rates receivables* 818 1,262 818 1,262
Other receivables:
- related party receivables* 263 316 0 0
- NZ Transport Agency 184 276 184 276
- Subvention receivable* 240 320 0 0
- Other 1,701 1,779 4,583 4,491
Gross debtors and other receivables 3,205 3,952 5,585 6,029
Less provision for impairment (241) (188) (242) (127)
Total debtors and other receivables 2,964 3,764 5,343 5,902
Movement in the provision for impairment of
receivables are as follows:
Council Group
2017 2016 2017 2016
$000 $000 $000 $000
Balance as at 1 July 2016 188 358 127 161
Additional provisions made during this year 53 14 54 14
provisions reversed during the year 0 (185) 61 (49)
Receivables written-off during the period 0 1 0 1
Balance as at 30 June 2017 241 188 242 127
Page | 44
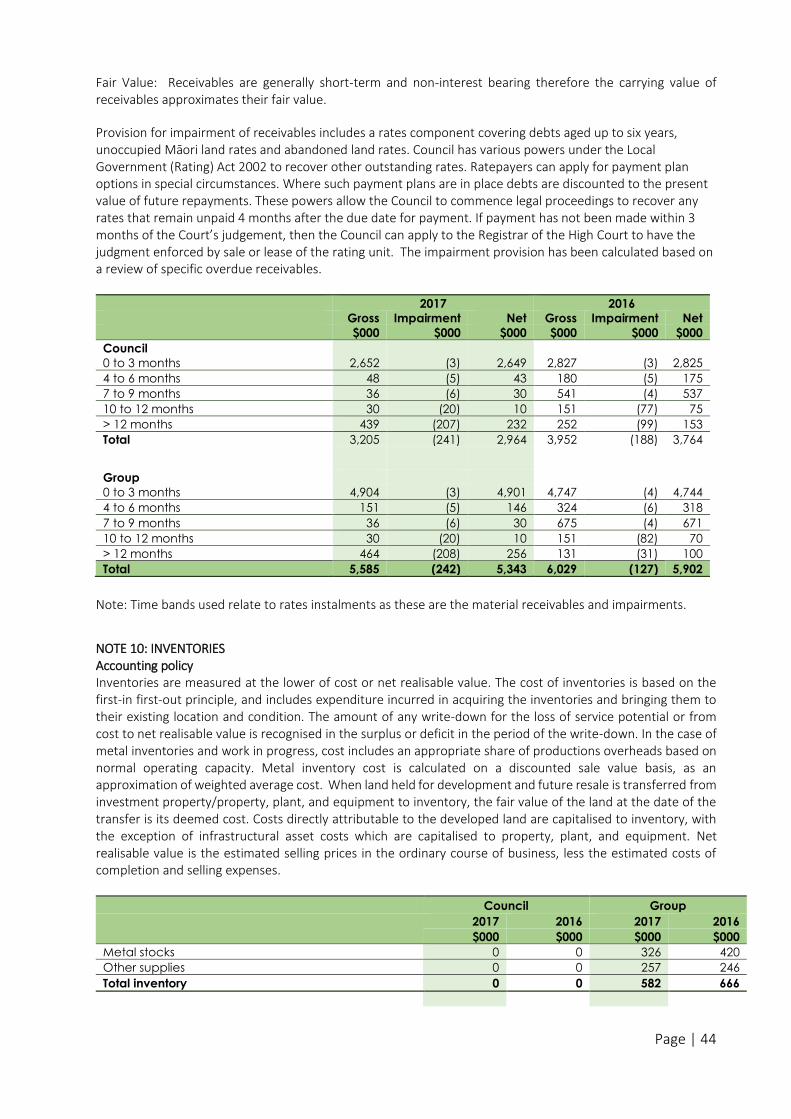
Fair Value: Receivables are generally short-term and non-interest bearing therefore the carrying value of receivables approximates their fair value.
Provision for impairment of receivables includes a rates component covering debts aged up to six years, unoccupied Māori land rates and abandoned land rates. Council has various powers under the Local Government (Rating) Act 2002 to recover other outstanding rates. Ratepayers can apply for payment plan options in special circumstances. Where such payment plans are in place debts are discounted to the present value of future repayments. These powers allow the Council to commence legal proceedings to recover any rates that remain unpaid 4 months after the due date for payment. If payment has not been made within 3 months of the Court’s judgement, then the Council can apply to the Registrar of the High Court to have the judgment enforced by sale or lease of the rating unit. The impairment provision has been calculated based on a review of specific overdue receivables.
2017 2016
Gross Impairment Net Gross Impairment Net
$000 $000 $000 $000 $000 $000
Council
0 to 3 months 2,652 (3) 2,649 2,827 (3) 2,825
4 to 6 months 48 (5) 43 180 (5) 175
7 to 9 months 36 (6) 30 541 (4) 537
10 to 12 months 30 (20) 10 151 (77) 75
> 12 months 439 (207) 232 252 (99) 153
Total 3,205 (241) 2,964 3,952 (188) 3,764
Group
0 to 3 months 4,904 (3) 4,901 4,747 (4) 4,744
4 to 6 months 151 (5) 146 324 (6) 318
7 to 9 months 36 (6) 30 675 (4) 671
10 to 12 months 30 (20) 10 151 (82) 70
> 12 months 464 (208) 256 131 (31) 100
Total 5,585 (242) 5,343 6,029 (127) 5,902
Note: Time bands used relate to rates instalments as these are the material receivables and impairments.
NOTE 10: INVENTORIES Accounting policy Inventories are measured at the lower of cost or net realisable value. The cost of inventories is based on the first-in first-out principle, and includes expenditure incurred in acquiring the inventories and bringing them to their existing location and condition. The amount of any write-down for the loss of service potential or from cost to net realisable value is recognised in the surplus or deficit in the period of the write-down. In the case of metal inventories and work in progress, cost includes an appropriate share of productions overheads based on normal operating capacity. Metal inventory cost is calculated on a discounted sale value basis, as an approximation of weighted average cost. When land held for development and future resale is transferred from investment property/property, plant, and equipment to inventory, the fair value of the land at the date of the transfer is its deemed cost. Costs directly attributable to the developed land are capitalised to inventory, with the exception of infrastructural asset costs which are capitalised to property, plant, and equipment. Net realisable value is the estimated selling prices in the ordinary course of business, less the estimated costs of completion and selling expenses.
Council Group
2017 2016 2017 2016
$000 $000 $000 $000
Metal stocks 0 0 326 420
Other supplies 0 0 257 246
Total inventory 0 0 582 666
Page | 45
Development land 0 0 350 347
Total term inventory 0 0 350 347
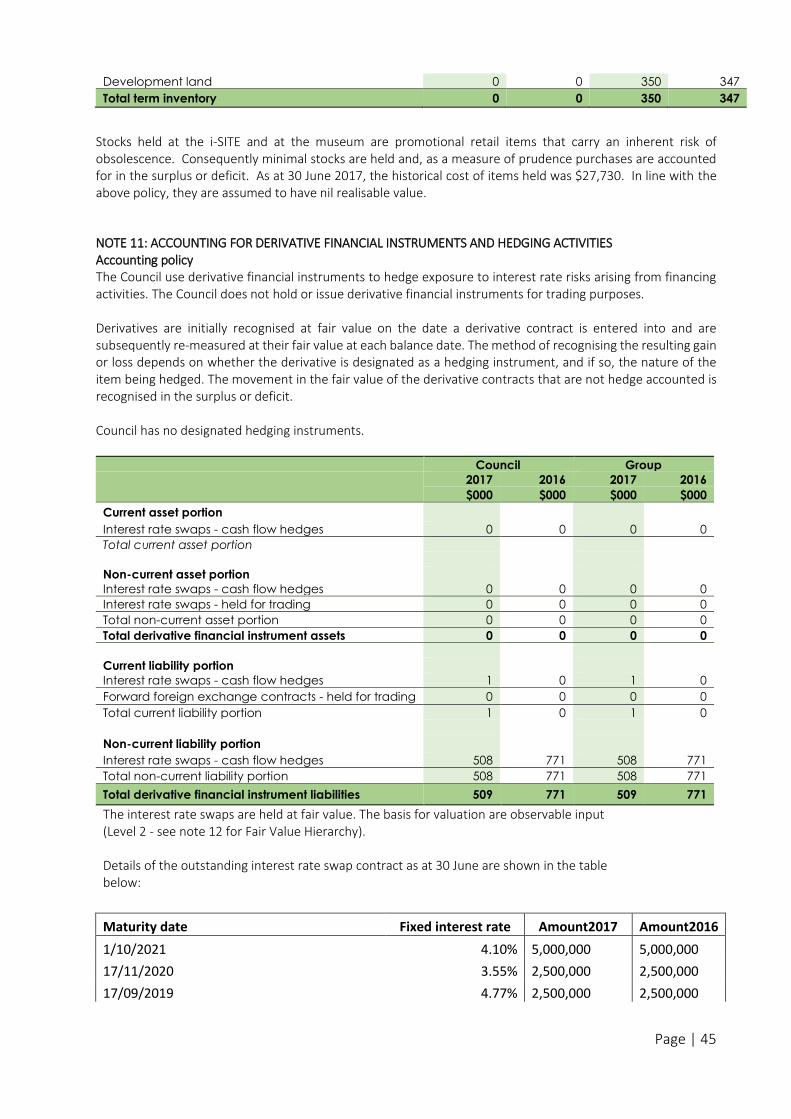
Stocks held at the i-SITE and at the museum are promotional retail items that carry an inherent risk of obsolescence. Consequently minimal stocks are held and, as a measure of prudence purchases are accounted for in the surplus or deficit. As at 30 June 2017, the historical cost of items held was $27,730. In line with the above policy, they are assumed to have nil realisable value.
NOTE 11: ACCOUNTING FOR DERIVATIVE FINANCIAL INSTRUMENTS AND HEDGING ACTIVITIES Accounting policy The Council use derivative financial instruments to hedge exposure to interest rate risks arising from financing activities. The Council does not hold or issue derivative financial instruments for trading purposes. Derivatives are initially recognised at fair value on the date a derivative contract is entered into and are subsequently re-measured at their fair value at each balance date. The method of recognising the resulting gain or loss depends on whether the derivative is designated as a hedging instrument, and if so, the nature of the item being hedged. The movement in the fair value of the derivative contracts that are not hedge accounted is recognised in the surplus or deficit. Council has no designated hedging instruments.
Council Group
2017 2016 2017 2016
$000 $000 $000 $000
Current asset portion
Interest rate swaps - cash flow hedges 0 0 0 0
Total current asset portion
Non-current asset portion
Interest rate swaps - cash flow hedges 0 0 0 0
Interest rate swaps - held for trading 0 0 0 0
Total non-current asset portion 0 0 0 0
Total derivative financial instrument assets 0 0 0 0
Current liability portion
Interest rate swaps - cash flow hedges 1 0 1 0
Forward foreign exchange contracts - held for trading 0 0 0 0
Total current liability portion 1 0 1 0
Non-current liability portion
Interest rate swaps - cash flow hedges 508 771 508 771
Total non-current liability portion 508 771 508 771
Total derivative financial instrument liabilities 509 771 509 771
The interest rate swaps are held at fair value. The basis for valuation are observable input (Level 2 - see note 12 for Fair Value Hierarchy).
Details of the outstanding interest rate swap contract as at 30 June are shown in the table below:
Maturity date Fixed interest rate Amount2017 Amount2016
1/10/2021 4.10% 5,000,000 5,000,000
17/11/2020 3.55% 2,500,000 2,500,000
17/09/2019 4.77% 2,500,000 2,500,000
Page | 46
17/09/2018 2.35% 1,500,000 1,500,000
18/09/2017 2.28% 1,000,000 1,000,000
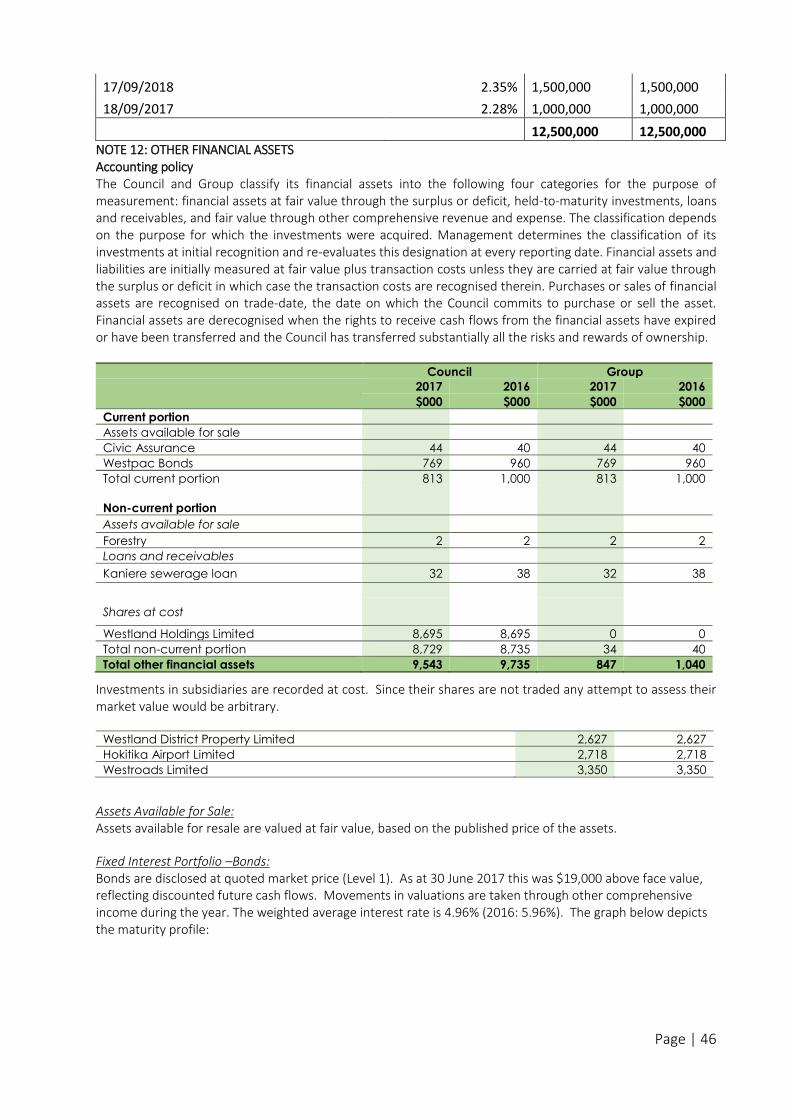
12,500,000 12,500,000 NOTE 12: OTHER FINANCIAL ASSETS Accounting policy The Council and Group classify its financial assets into the following four categories for the purpose of measurement: financial assets at fair value through the surplus or deficit, held-to-maturity investments, loans and receivables, and fair value through other comprehensive revenue and expense. The classification depends on the purpose for which the investments were acquired. Management determines the classification of its investments at initial recognition and re-evaluates this designation at every reporting date. Financial assets and liabilities are initially measured at fair value plus transaction costs unless they are carried at fair value through the surplus or deficit in which case the transaction costs are recognised therein. Purchases or sales of financial assets are recognised on trade-date, the date on which the Council commits to purchase or sell the asset. Financial assets are derecognised when the rights to receive cash flows from the financial assets have expired or have been transferred and the Council has transferred substantially all the risks and rewards of ownership.
Council Group
2017 2016 2017 2016
$000 $000 $000 $000
Current portion
Assets available for sale
Civic Assurance 44 40 44 40
Westpac Bonds 769 960 769 960
Total current portion 813 1,000 813 1,000
Non-current portion
Assets available for sale
Forestry 2 2 2 2
Loans and receivables
Kaniere sewerage loan 32 38 32 38
Shares at cost
Westland Holdings Limited 8,695 8,695 0 0
Total non-current portion 8,729 8,735 34 40
Total other financial assets 9,543 9,735 847 1,040
Investments in subsidiaries are recorded at cost. Since their shares are not traded any attempt to assess their market value would be arbitrary.
Westland District Property Limited 2,627 2,627
Hokitika Airport Limited 2,718 2,718
Westroads Limited 3,350 3,350
Assets Available for Sale: Assets available for resale are valued at fair value, based on the published price of the assets.
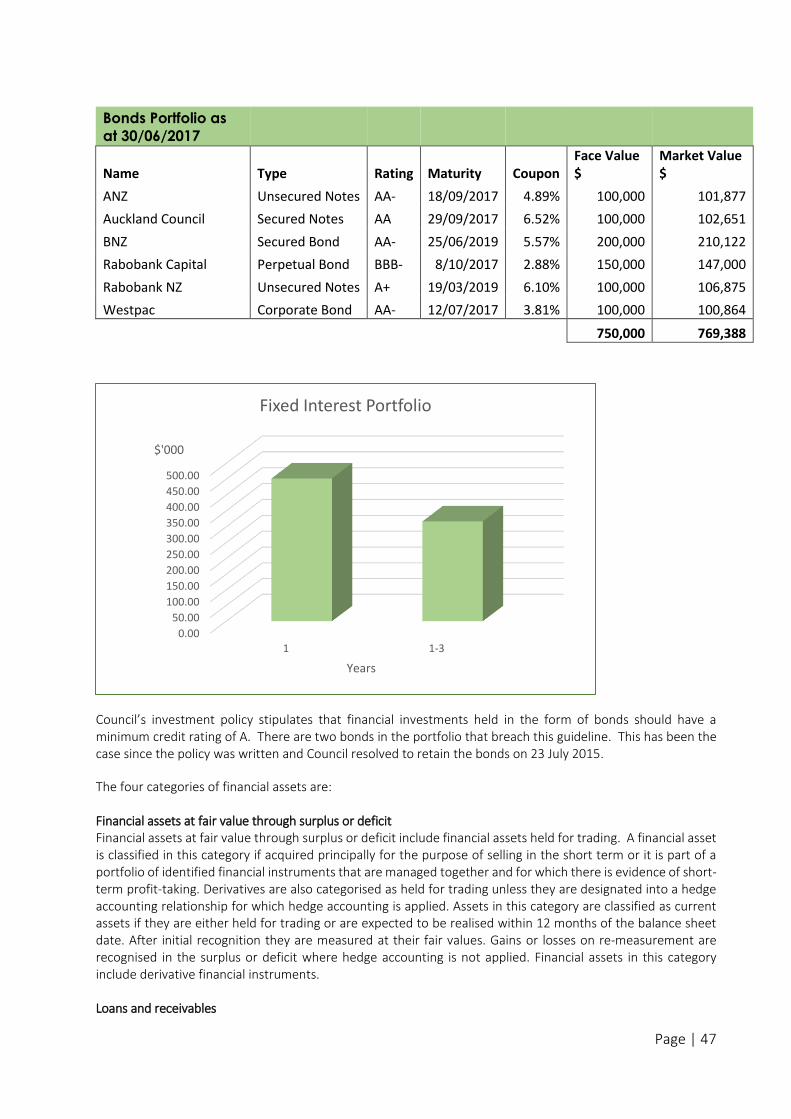
Fixed Interest Portfolio –Bonds: Bonds are disclosed at quoted market price (Level 1). As at 30 June 2017 this was $19,000 above face value, reflecting discounted future cash flows. Movements in valuations are taken through other comprehensive income during the year. The weighted average interest rate is 4.96% (2016: 5.96%). The graph below depicts the maturity profile:
Page | 47
Bonds Portfolio as
at 30/06/2017
Name Type Rating Maturity Coupon Face Value $
Market Value $
ANZ Unsecured Notes AA- 18/09/2017 4.89% 100,000 101,877
Auckland Council Secured Notes AA 29/09/2017 6.52% 100,000 102,651
BNZ Secured Bond AA- 25/06/2019 5.57% 200,000 210,122
Rabobank Capital Perpetual Bond BBB- 8/10/2017 2.88% 150,000 147,000
Rabobank NZ Unsecured Notes A+ 19/03/2019 6.10% 100,000 106,875
Westpac Corporate Bond AA- 12/07/2017 3.81% 100,000 100,864
750,000 769,388
Council’s investment policy stipulates that financial investments held in the form of bonds should have a minimum credit rating of A. There are two bonds in the portfolio that breach this guideline. This has been the case since the policy was written and Council resolved to retain the bonds on 23 July 2015.
The four categories of financial assets are: Financial assets at fair value through surplus or deficit Financial assets at fair value through surplus or deficit include financial assets held for trading. A financial asset is classified in this category if acquired principally for the purpose of selling in the short term or it is part of a portfolio of identified financial instruments that are managed together and for which there is evidence of short-term profit-taking. Derivatives are also categorised as held for trading unless they are designated into a hedge accounting relationship for which hedge accounting is applied. Assets in this category are classified as current assets if they are either held for trading or are expected to be realised within 12 months of the balance sheet date. After initial recognition they are measured at their fair values. Gains or losses on re-measurement are recognised in the surplus or deficit where hedge accounting is not applied. Financial assets in this category include derivative financial instruments.
Loans and receivables
0.00
50.00
100.00
150.00
200.00
250.00
300.00
350.00
400.00
450.00
500.00
1 1-3
$'000
Years
Fixed Interest Portfolio
Page | 48
These are non-derivative financial assets with fixed or determinable payments that are not quoted in an active market. They are included in current assets, except for maturities greater than 12 months after the balance date, which are included in non-current assets. After initial recognition they are measured at amortised cost using the effective interest method. Gains and losses when the asset is impaired or de-recognised are recognised in the surplus or deficit. Loans and receivables are classified as “trade and other receivables” in the Statement of Financial Position.
Held to maturity investments Held to maturity investments are non-derivative financial assets with fixed or determinable payments and fixed maturities that the Council has the positive intention and ability to hold to maturity. They are included in current assets, except for maturities greater than 12 months after balance date, which are included in non-current assets. After initial recognition they are measured at amortised cost using the effective interest method, less impairment. Gains and losses when the asset is impaired or de-recognised are recognised in the surplus or deficit. The Council currently holds a portfolio of bonds that have been classified as held to maturity investments.
Fair value through comprehensive revenue and expense Financial assets at fair value through other comprehensive revenue and expense are those that are designated into the category at initial recognition or are not classified in any of the other categories above. They are included in non-current assets unless management intends to dispose of, or realise, the investment within 12 months of balance date. The Council and group includes in this category:
Investments held for the long-term but which may be realised before maturity;
Shareholdings held for strategic purposes.
These investments are measured at their fair value, with gains and losses recognised in other comprehensive revenue and expense, except for impairment losses, which are recognised in the surplus or deficit. On recognition, the cumulative gain or loss previously recognised in other comprehensive revenue and expense is reclassified from equity to the surplus or deficit. Council’s investments in its subsidiaries are not included in this category as they are held at cost as allowed by PBE IPSAS 6 Consolidated and Separate Financial Statements. Forestry Assets Standing forestry assets are independently revalued annually at fair value less estimated costs to sell for one growth cycle. Fair value is determined based on the present value of expected net cash flows discounted at a current market determined rate. This calculation is based on existing sustainable felling plans and assessments regarding growth, timber prices, felling costs, and silvicultural costs and takes into consideration environmental, operational, and market restrictions. Gains or losses arising on initial recognition of forestry assets at fair value less costs to sell and from a change in fair value less costs to sell are recognised in the surplus or deficit. Forestry maintenance costs are recognised in the surplus or deficit when incurred. Impairment of financial assets At each balance sheet date, the Council assesses whether there is any objective evidence that a financial asset or group of financial assets is impaired. Any impairment losses are recognised in the surplus or deficit.
Loans and receivables, and held-to-maturity investments Impairment is established when there is evidence that the Council and group will not be able to collect amounts due according to the original terms of the receivable. Significant financial difficulties of the debtor, probability that the debtor will enter into bankruptcy, receivership, or liquidation and default in payments are considered indicators that the asset is impaired. The amount of the impairment is the difference between the asset’s carrying amount and the present value of estimated future cash flows, discounted using the original effective interest rate. For debtors and other receivables, the carrying amount of the asset is reduced through the use of an allowance account, and the amount of the loss is recognised in the surplus or deficit. When the receivable is uncollectible, it is written-off against the allowance account. Overdue receivables that have been renegotiated
Page | 49
are reclassified as current (that is, not past due). Impairment in term deposits, local authority stock, government bonds, and community loans, are recognised directly against the instrument’s carrying amount.
Financial assets at fair value through other comprehensive revenue and expense For equity investments, a significant or prolonged decline in the fair value of the investment below its cost is considered objective evidence of impairment. For debt investments, significant financial difficulties of the debtor, probability that the debtor will enter into bankruptcy, and default in payments are considered objective indicators that the asset is impaired. If impairment evidence exists for investments at fair value through other comprehensive revenue and expense, the cumulative loss (measured as the difference between the acquisition cost and the current fair value, less any impairment loss on that financial asset previously recognised in the surplus or deficit) recognised in other comprehensive revenue and expense is reclassified from equity to the surplus or deficit. Equity instrument impairment losses recognised in the surplus or deficit are not reversed through the surplus or deficit. If in a subsequent period the fair value of a debt instrument increases and the increase can be objectively related to an event occurring after the impairment loss was recognised, the impairment loss is reversed in the surplus or deficit. NOTE 13: PROPERTY, PLANT AND EQUIPMENT Property, plant and equipment consist of: Operational assets These include land, buildings, improvements, museum artefacts, Jackson Bay Wharf, library books, plant and equipment, and motor vehicles.
Restricted assets Restricted assets are parks and reserves owned by the Council which provide a benefit or service to the community and cannot be disposed of because of legal or other restrictions. These include land vested under the Reserves Act 1977 and endowments or other property held in trust for specific purposes.
Infrastructure assets Infrastructural assets are the fixed utility systems owned by the Council. Property, plant and equipment is shown at cost or valuation, less accumulated depreciation and impairment losses. Each asset class includes all items that are required for the network to function. Land (operational and restricted) is measured at fair value, and buildings (operational and restricted), library books, and infrastructural assets (except land under roads) are measured at fair value less accumulated depreciation. All other asset classes are measured at cost less accumulated depreciation and impairment losses.
Additions The cost of an item of property, plant and equipment is recognised as an asset if, and only if, it is probable that future economic benefits or service potential associated with the item will flow to the Council and Group and the cost of the item can be measured reliably. Work in progress is recognised at cost less impairment and is not depreciated. In most instances, an item of property, plant and equipment is recognised at its cost. Where an asset is acquired at no cost, or for a nominal cost, it is recognised at fair value as at the date of acquisition.
Disposals Gains and losses on disposals are determined by comparing the proceeds with the carrying amount of the assets. Gains and losses on disposals are included in the surplus or deficit. When revalued assets are sold, the amounts included in asset revaluation reserves in respect of those assets are transferred to accumulated funds.
Subsequent costs Costs incurred subsequent to initial acquisition are capitalised only when it is probable that future economic benefits or service potential associated with the item will flow to the Council and the cost of the item can be measured reliably. The costs of day-to-day servicing of property, plant, and equipment are recognised as an operating expense in the surplus or deficit as they are incurred. Depreciation
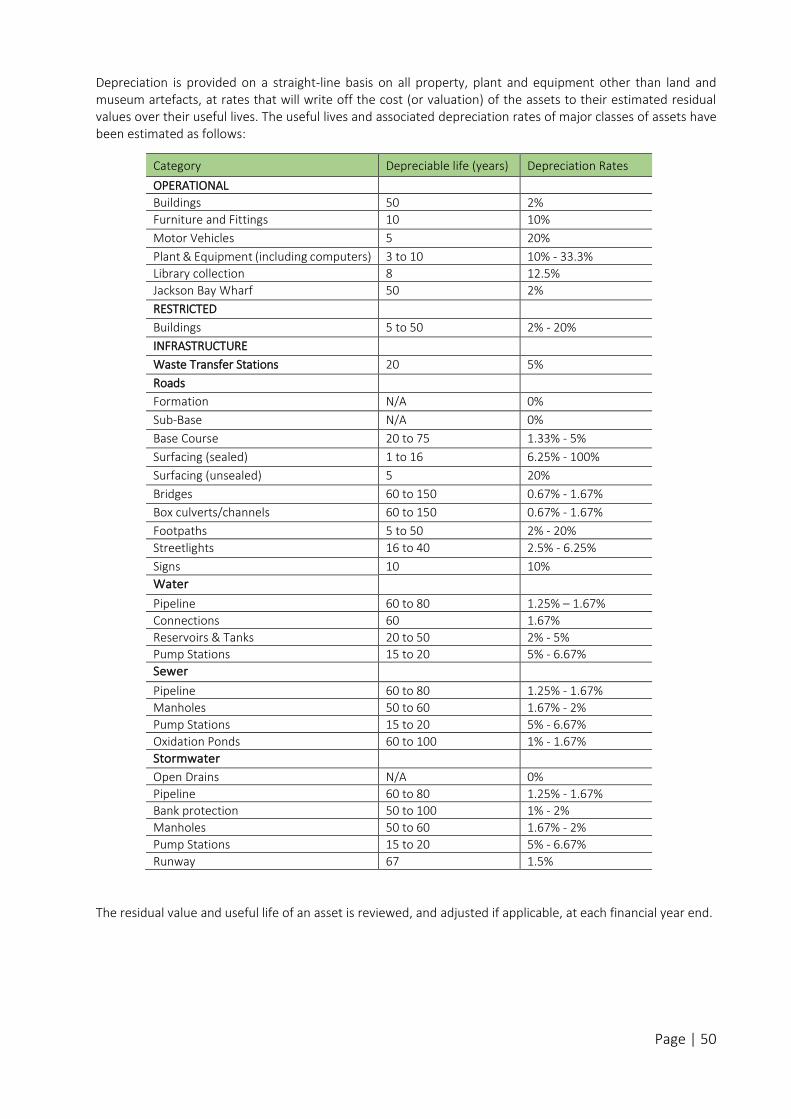
Page | 50
Depreciation is provided on a straight-line basis on all property, plant and equipment other than land and museum artefacts, at rates that will write off the cost (or valuation) of the assets to their estimated residual values over their useful lives. The useful lives and associated depreciation rates of major classes of assets have been estimated as follows:
Category Depreciable life (years) Depreciation Rates
OPERATIONAL
Buildings 50 2%
Furniture and Fittings 10 10%
Motor Vehicles 5 20%
Plant & Equipment (including computers) 3 to 10 10% - 33.3%
Library collection 8 12.5%
Jackson Bay Wharf 50 2%
RESTRICTED
Buildings 5 to 50 2% - 20%
INFRASTRUCTURE
Waste Transfer Stations 20 5%
Roads
Formation N/A 0%
Sub-Base N/A 0%
Base Course 20 to 75 1.33% - 5%
Surfacing (sealed) 1 to 16 6.25% - 100%
Surfacing (unsealed) 5 20%
Bridges 60 to 150 0.67% - 1.67%
Box culverts/channels 60 to 150 0.67% - 1.67%
Footpaths 5 to 50 2% - 20%
Streetlights 16 to 40 2.5% - 6.25%
Signs 10 10%
Water
Pipeline 60 to 80 1.25% – 1.67%
Connections 60 1.67%
Reservoirs & Tanks 20 to 50 2% - 5%
Pump Stations 15 to 20 5% - 6.67%
Sewer
Pipeline 60 to 80 1.25% - 1.67%
Manholes 50 to 60 1.67% - 2%
Pump Stations 15 to 20 5% - 6.67%
Oxidation Ponds 60 to 100 1% - 1.67%
Stormwater
Open Drains N/A 0%
Pipeline 60 to 80 1.25% - 1.67%
Bank protection 50 to 100 1% - 2%
Manholes 50 to 60 1.67% - 2%
Pump Stations 15 to 20 5% - 6.67%
Runway 67 1.5%
The residual value and useful life of an asset is reviewed, and adjusted if applicable, at each financial year end.
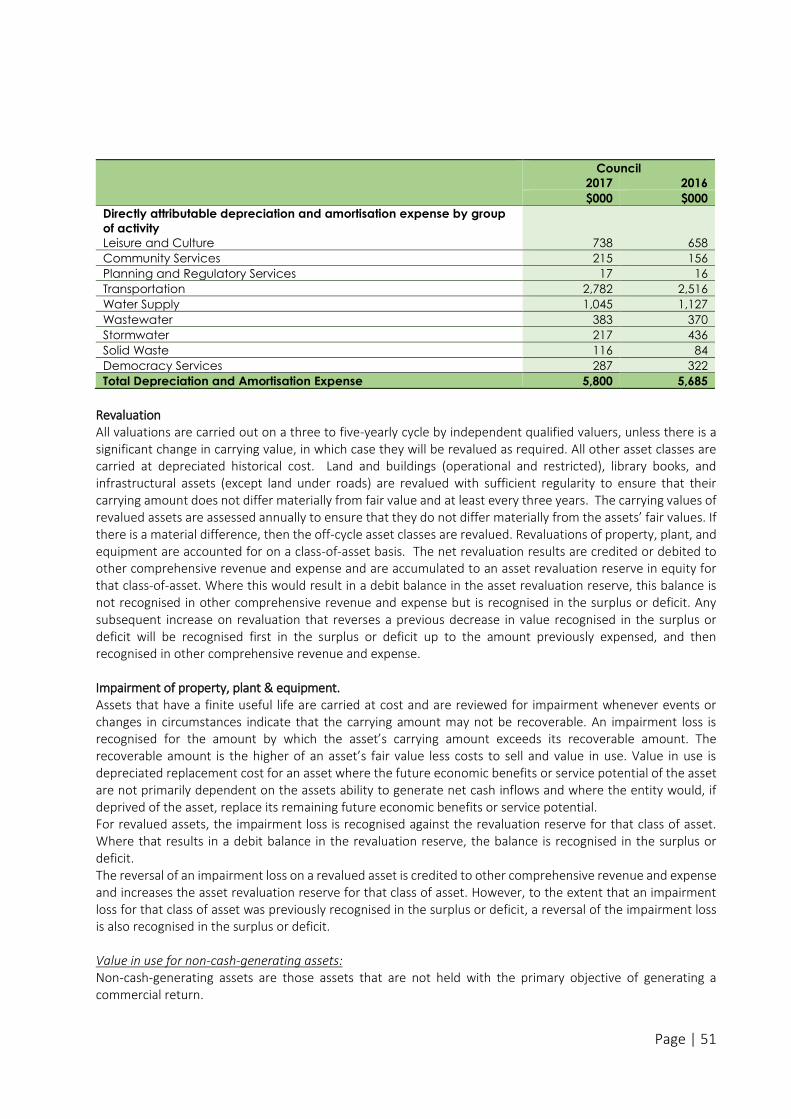
Page | 51
Council
2017 2016
$000 $000
Directly attributable depreciation and amortisation expense by group
of activity
Leisure and Culture 738 658
Community Services 215 156
Planning and Regulatory Services 17 16
Transportation 2,782 2,516
Water Supply 1,045 1,127
Wastewater 383 370
Stormwater 217 436
Solid Waste 116 84
Democracy Services 287 322
Total Depreciation and Amortisation Expense 5,800 5,685
Revaluation All valuations are carried out on a three to five-yearly cycle by independent qualified valuers, unless there is a significant change in carrying value, in which case they will be revalued as required. All other asset classes are carried at depreciated historical cost. Land and buildings (operational and restricted), library books, and infrastructural assets (except land under roads) are revalued with sufficient regularity to ensure that their carrying amount does not differ materially from fair value and at least every three years. The carrying values of revalued assets are assessed annually to ensure that they do not differ materially from the assets’ fair values. If there is a material difference, then the off-cycle asset classes are revalued. Revaluations of property, plant, and equipment are accounted for on a class-of-asset basis. The net revaluation results are credited or debited to other comprehensive revenue and expense and are accumulated to an asset revaluation reserve in equity for that class-of-asset. Where this would result in a debit balance in the asset revaluation reserve, this balance is not recognised in other comprehensive revenue and expense but is recognised in the surplus or deficit. Any subsequent increase on revaluation that reverses a previous decrease in value recognised in the surplus or deficit will be recognised first in the surplus or deficit up to the amount previously expensed, and then recognised in other comprehensive revenue and expense. Impairment of property, plant & equipment. Assets that have a finite useful life are carried at cost and are reviewed for impairment whenever events or changes in circumstances indicate that the carrying amount may not be recoverable. An impairment loss is recognised for the amount by which the asset’s carrying amount exceeds its recoverable amount. The recoverable amount is the higher of an asset’s fair value less costs to sell and value in use. Value in use is depreciated replacement cost for an asset where the future economic benefits or service potential of the asset are not primarily dependent on the assets ability to generate net cash inflows and where the entity would, if deprived of the asset, replace its remaining future economic benefits or service potential. For revalued assets, the impairment loss is recognised against the revaluation reserve for that class of asset. Where that results in a debit balance in the revaluation reserve, the balance is recognised in the surplus or deficit. The reversal of an impairment loss on a revalued asset is credited to other comprehensive revenue and expense and increases the asset revaluation reserve for that class of asset. However, to the extent that an impairment loss for that class of asset was previously recognised in the surplus or deficit, a reversal of the impairment loss is also recognised in the surplus or deficit. Value in use for non-cash-generating assets: Non-cash-generating assets are those assets that are not held with the primary objective of generating a commercial return.
Page | 52
For non-cash generating assets, value in use is determined using an approach based on either a depreciated replacement cost approach, restoration cost approach, or a service units approach. The most appropriate approach used to measure value in use depends on the nature of the impairment and availability of information. Value in use for cash-generating assets: Cash-generating assets are those assets that are held with the primary objective of generating a commercial return. The value in use for cash-generating assets is the present value of expected future cash flows. If an asset’s carrying amount exceeds its recoverable amount the asset is impaired and the carrying amount is written down to the recoverable amount. The total impairment loss is recognised in the surplus or deficit. The reversal of an impairment loss is recognised in the surplus or deficit. For assets not carried at a revalued amount (other than goodwill) the reversal of an impairment loss is recognised in the surplus or deficit. Critical accounting estimates and assumptions Infrastructural assets There are a number of assumptions and estimates used when performing DRC valuations over infrastructural assets. These include:
The physical deterioration and condition of an asset, for example Council could be carrying an asset at an
amount that does not reflect its actual condition. This is particularly so for those assets which are not
visible, for example stormwater, wastewater and water supply pipes which are underground. This risk is
minimised by Council performing a combination of physical inspections and condition modelling
assessments of underground assets;
Estimating any obsolescence or surplus capacity of an asset; and
Estimates are made when determining the remaining useful lives over which the asset will be depreciated.
These estimates can be affected by the local conditions, for example weather patterns and traffic growth.
If useful lives do not reflect the actual consumption of the benefits of the asset, then Council could be over
or under estimating the annual depreciation charge recognised as an expense in the surplus or deficit.
To minimise this risk, Council’s infrastructural asset useful lives have been determined with reference to the NZ Infrastructural Asset Valuation and Depreciation Guidelines published by the National Asset Management Steering Group, and have been adjusted for local conditions based on past experience. Asset inspections, deterioration and condition modelling are also carried out regularly as part of Council’s asset management planning activities, which gives Council further assurance over its useful life estimates. Experienced independent valuers perform Council’s infrastructural asset revaluations.
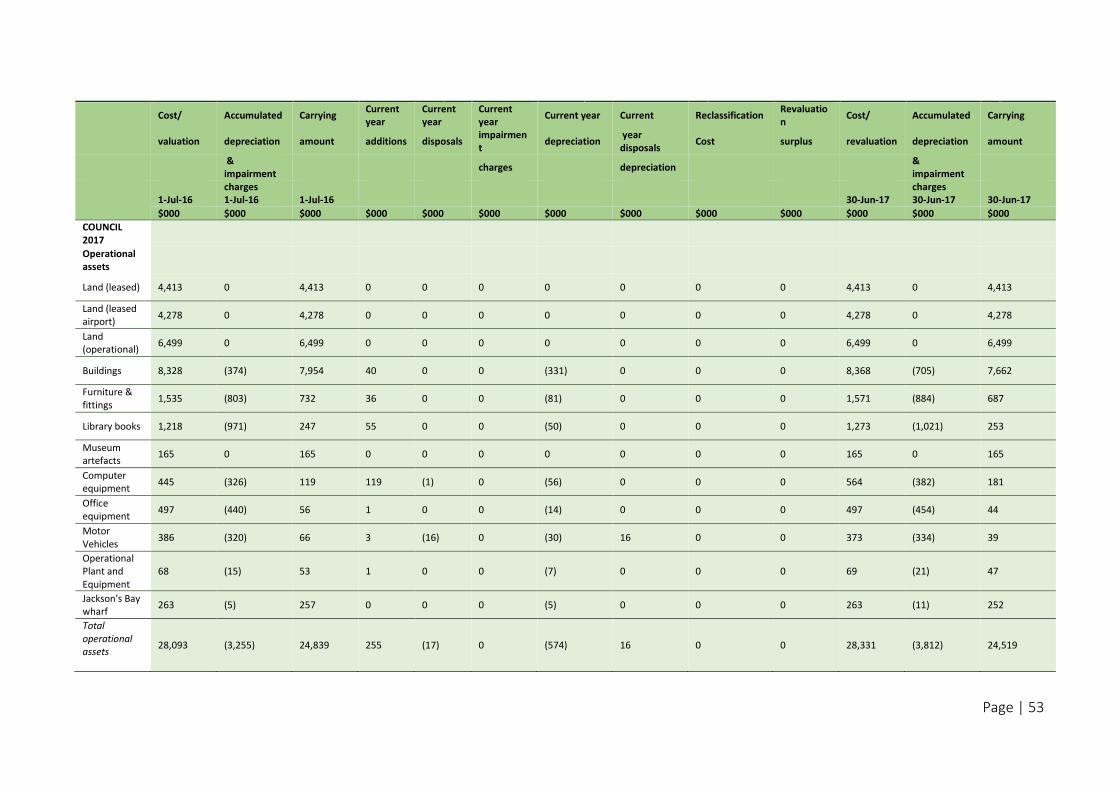
Page | 53
Cost/ Accumulated Carrying Current year
Current year
Current year
Current year Current Reclassification Revaluation
Cost/ Accumulated Carrying
valuation depreciation amount additions disposals impairment
depreciation year disposals
Cost surplus revaluation depreciation amount
& impairment
charges depreciation & impairment
charges charges
1-Jul-16 1-Jul-16 1-Jul-16 30-Jun-17 30-Jun-17 30-Jun-17
$000 $000 $000 $000 $000 $000 $000 $000 $000 $000 $000 $000 $000
COUNCIL 2017
Operational assets
Land (leased) 4,413 0 4,413 0 0 0 0 0 0 0 4,413 0 4,413
Land (leased airport)
4,278 0 4,278 0 0 0 0 0 0 0 4,278 0 4,278
Land (operational)
6,499 0 6,499 0 0 0 0 0 0 0 6,499 0 6,499
Buildings 8,328 (374) 7,954 40 0 0 (331) 0 0 0 8,368 (705) 7,662
Furniture & fittings
1,535 (803) 732 36 0 0 (81) 0 0 0 1,571 (884) 687
Library books 1,218 (971) 247 55 0 0 (50) 0 0 0 1,273 (1,021) 253
Museum artefacts
165 0 165 0 0 0 0 0 0 0 165 0 165
Computer equipment
445 (326) 119 119 (1) 0 (56) 0 0 0 564 (382) 181
Office equipment
497 (440) 56 1 0 0 (14) 0 0 0 497 (454) 44
Motor Vehicles
386 (320) 66 3 (16) 0 (30) 16 0 0 373 (334) 39
Operational Plant and Equipment
68 (15) 53 1 0 0 (7) 0 0 0 69 (21) 47
Jackson's Bay wharf
263 (5) 257 0 0 0 (5) 0 0 0 263 (11) 252
Total operational assets
28,093 (3,255) 24,839 255 (17) 0 (574) 16 0 0 28,331 (3,812) 24,519
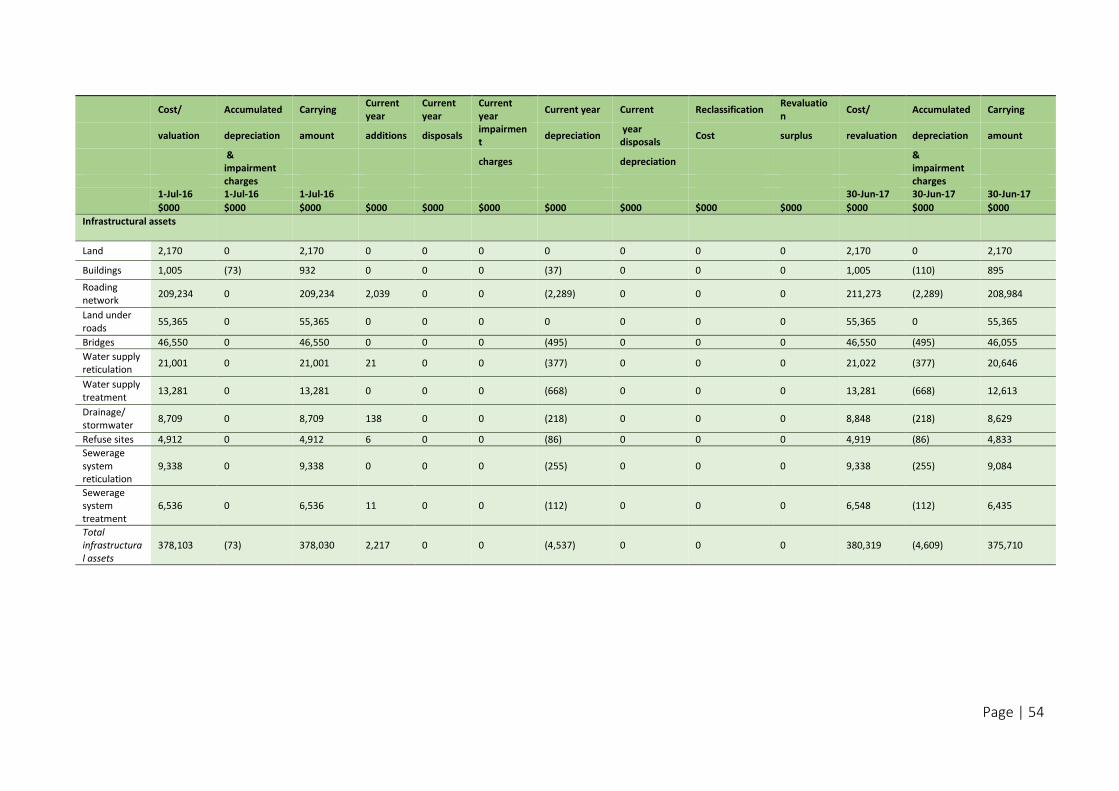
Page | 54
Cost/ Accumulated Carrying Current year
Current year
Current year
Current year Current Reclassification Revaluation
Cost/ Accumulated Carrying
valuation depreciation amount additions disposals impairment
depreciation year disposals
Cost surplus revaluation depreciation amount
& impairment
charges depreciation & impairment
charges charges
1-Jul-16 1-Jul-16 1-Jul-16 30-Jun-17 30-Jun-17 30-Jun-17
$000 $000 $000 $000 $000 $000 $000 $000 $000 $000 $000 $000 $000
Infrastructural assets
Land 2,170 0 2,170 0 0 0 0 0 0 0 2,170 0 2,170
Buildings 1,005 (73) 932 0 0 0 (37) 0 0 0 1,005 (110) 895
Roading network
209,234 0 209,234 2,039 0 0 (2,289) 0 0 0 211,273 (2,289) 208,984
Land under roads
55,365 0 55,365 0 0 0 0 0 0 0 55,365 0 55,365
Bridges 46,550 0 46,550 0 0 0 (495) 0 0 0 46,550 (495) 46,055
Water supply reticulation
21,001 0 21,001 21 0 0 (377) 0 0 0 21,022 (377) 20,646
Water supply treatment
13,281 0 13,281 0 0 0 (668) 0 0 0 13,281 (668) 12,613
Drainage/ stormwater
8,709 0 8,709 138 0 0 (218) 0 0 0 8,848 (218) 8,629
Refuse sites 4,912 0 4,912 6 0 0 (86) 0 0 0 4,919 (86) 4,833
Sewerage system reticulation
9,338 0 9,338 0 0 0 (255) 0 0 0 9,338 (255) 9,084
Sewerage system treatment
6,536 0 6,536 11 0 0 (112) 0 0 0 6,548 (112) 6,435
Total infrastructural assets
378,103 (73) 378,030 2,217 0 0 (4,537) 0 0 0 380,319 (4,609) 375,710
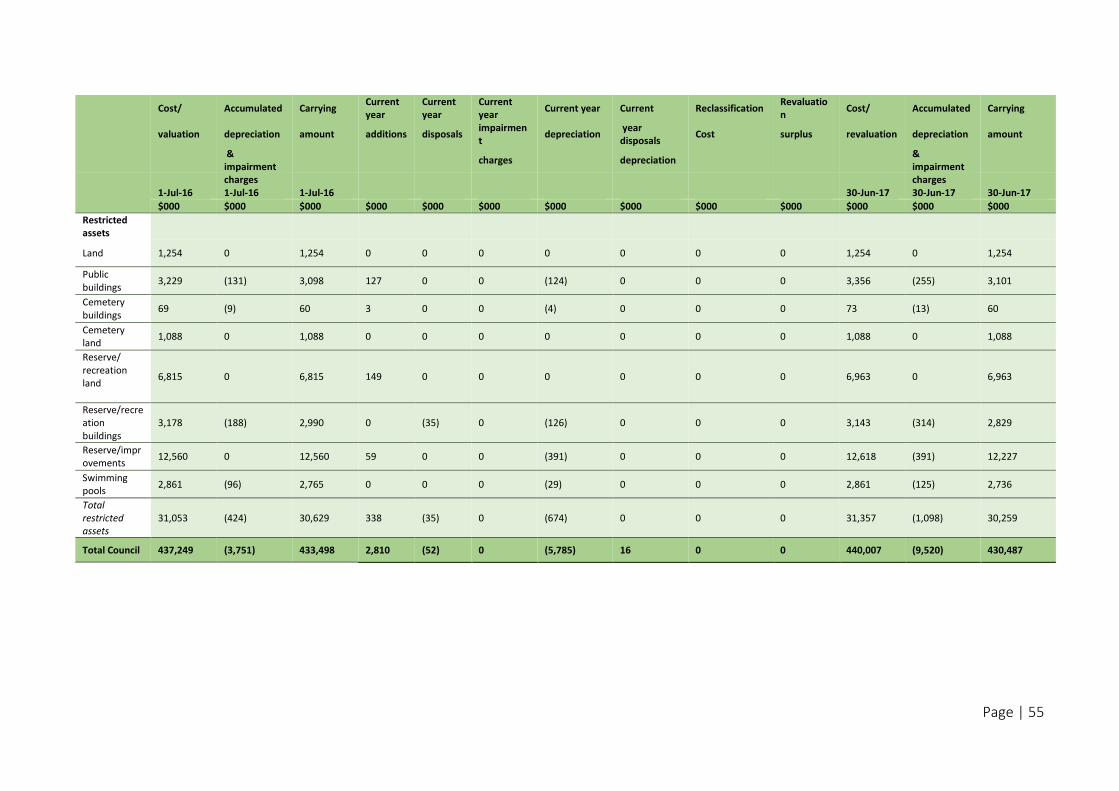
Page | 55
Cost/ Accumulated Carrying Current year
Current year
Current year
Current year Current Reclassification Revaluation
Cost/ Accumulated Carrying
valuation depreciation amount additions disposals impairment
depreciation year disposals
Cost surplus revaluation depreciation amount
& impairment
charges depreciation & impairment
charges charges
1-Jul-16 1-Jul-16 1-Jul-16 30-Jun-17 30-Jun-17 30-Jun-17
$000 $000 $000 $000 $000 $000 $000 $000 $000 $000 $000 $000 $000
Restricted assets
Land 1,254 0 1,254 0 0 0 0 0 0 0 1,254 0 1,254
Public buildings
3,229 (131) 3,098 127 0 0 (124) 0 0 0 3,356 (255) 3,101
Cemetery buildings
69 (9) 60 3 0 0 (4) 0 0 0 73 (13) 60
Cemetery land
1,088 0 1,088 0 0 0 0 0 0 0 1,088 0 1,088
Reserve/ recreation land
6,815 0 6,815 149 0 0 0 0 0 0 6,963 0 6,963
Reserve/recreation buildings
3,178 (188) 2,990 0 (35) 0 (126) 0 0 0 3,143 (314) 2,829
Reserve/improvements
12,560 0 12,560 59 0 0 (391) 0 0 0 12,618 (391) 12,227
Swimming pools
2,861 (96) 2,765 0 0 0 (29) 0 0 0 2,861 (125) 2,736
Total restricted assets
31,053 (424) 30,629 338 (35) 0 (674) 0 0 0 31,357 (1,098) 30,259
Total Council 437,249 (3,751) 433,498 2,810 (52) 0 (5,785) 16 0 0 440,007 (9,520) 430,487
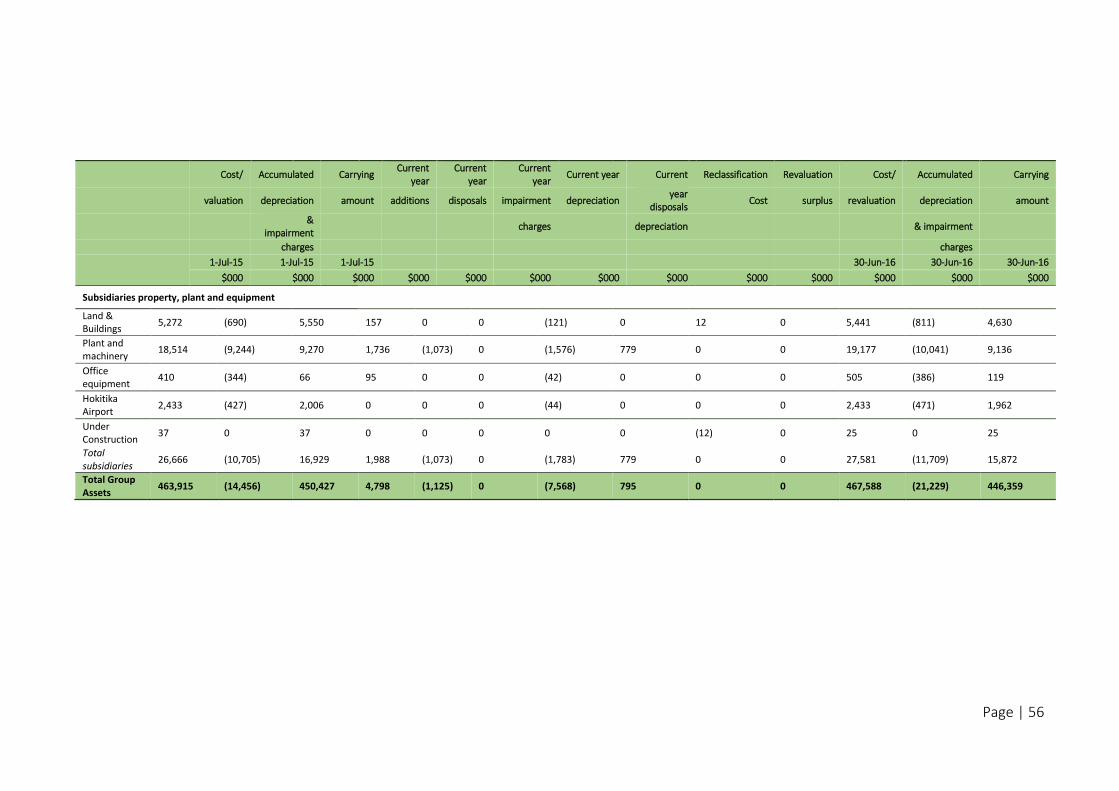
Page | 56
Cost/ Accumulated Carrying Current
year Current
year Current
year Current year Current Reclassification Revaluation Cost/ Accumulated Carrying
valuation depreciation amount additions disposals impairment depreciation year
disposals Cost surplus revaluation depreciation amount
&
impairment charges depreciation & impairment
charges charges
1-Jul-15 1-Jul-15 1-Jul-15 30-Jun-16 30-Jun-16 30-Jun-16
$000 $000 $000 $000 $000 $000 $000 $000 $000 $000 $000 $000 $000
Subsidiaries property, plant and equipment
Land & Buildings
5,272 (690) 5,550 157 0 0 (121) 0 12 0 5,441 (811) 4,630
Plant and machinery
18,514 (9,244) 9,270 1,736 (1,073) 0 (1,576) 779 0 0 19,177 (10,041) 9,136
Office equipment
410 (344) 66 95 0 0 (42) 0 0 0 505 (386) 119
Hokitika Airport
2,433 (427) 2,006 0 0 0 (44) 0 0 0 2,433 (471) 1,962
Under Construction
37 0 37 0 0 0 0 0 (12) 0 25 0 25
Total subsidiaries
26,666 (10,705) 16,929 1,988 (1,073) 0 (1,783) 779 0 0 27,581 (11,709) 15,872
Total Group Assets
463,915 (14,456) 450,427 4,798 (1,125) 0 (7,568) 795 0 0 467,588 (21,229) 446,359
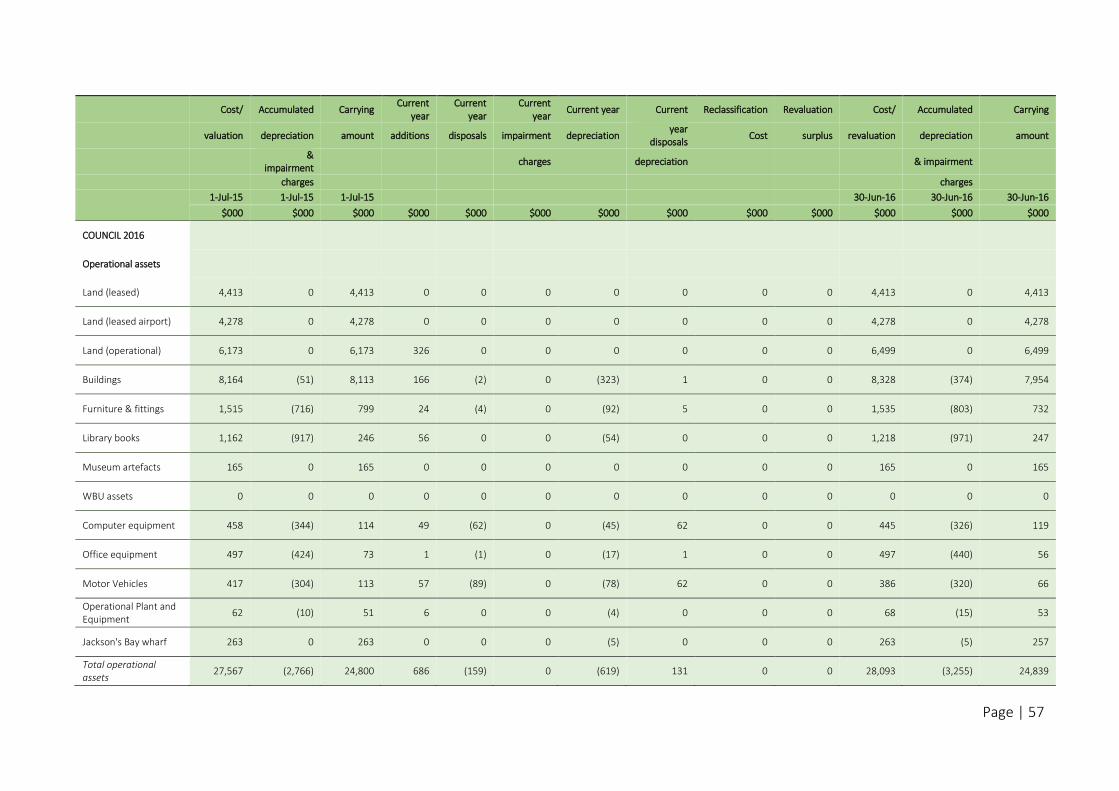
Page | 57
Cost/ Accumulated Carrying Current
year Current
year Current
year Current year Current Reclassification Revaluation Cost/ Accumulated Carrying
valuation depreciation amount additions disposals impairment depreciation year
disposals Cost surplus revaluation depreciation amount
&
impairment charges depreciation & impairment
charges charges
1-Jul-15 1-Jul-15 1-Jul-15 30-Jun-16 30-Jun-16 30-Jun-16
$000 $000 $000 $000 $000 $000 $000 $000 $000 $000 $000 $000 $000
COUNCIL 2016
Operational assets
Land (leased) 4,413 0 4,413 0 0 0 0 0 0 0 4,413 0 4,413
Land (leased airport) 4,278 0 4,278 0 0 0 0 0 0 0 4,278 0 4,278
Land (operational) 6,173 0 6,173 326 0 0 0 0 0 0 6,499 0 6,499
Buildings 8,164 (51) 8,113 166 (2) 0 (323) 1 0 0 8,328 (374) 7,954
Furniture & fittings 1,515 (716) 799 24 (4) 0 (92) 5 0 0 1,535 (803) 732
Library books 1,162 (917) 246 56 0 0 (54) 0 0 0 1,218 (971) 247
Museum artefacts 165 0 165 0 0 0 0 0 0 0 165 0 165
WBU assets 0 0 0 0 0 0 0 0 0 0 0 0 0
Computer equipment 458 (344) 114 49 (62) 0 (45) 62 0 0 445 (326) 119
Office equipment 497 (424) 73 1 (1) 0 (17) 1 0 0 497 (440) 56
Motor Vehicles 417 (304) 113 57 (89) 0 (78) 62 0 0 386 (320) 66
Operational Plant and Equipment
62 (10) 51 6 0 0 (4) 0 0 0 68 (15) 53
Jackson's Bay wharf 263 0 263 0 0 0 (5) 0 0 0 263 (5) 257
Total operational assets
27,567 (2,766) 24,800 686 (159) 0 (619) 131 0 0 28,093 (3,255) 24,839
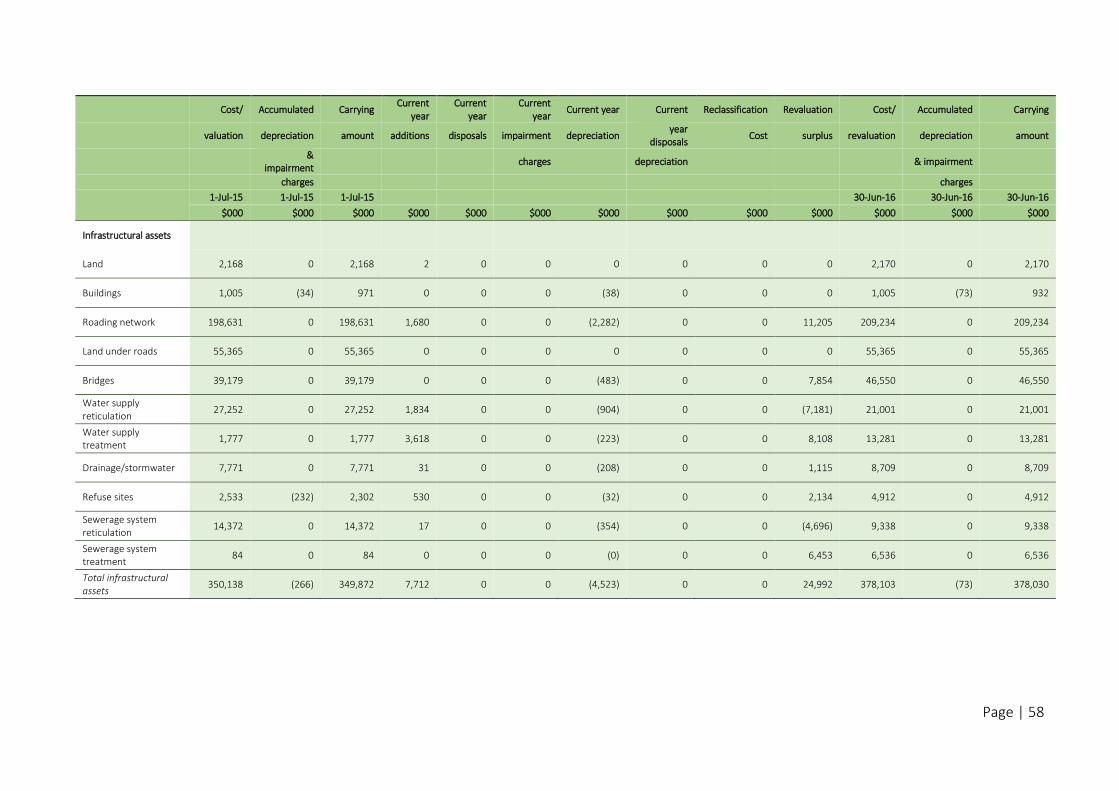
Page | 58
Cost/ Accumulated Carrying Current
year Current
year Current
year Current year Current Reclassification Revaluation Cost/ Accumulated Carrying
valuation depreciation amount additions disposals impairment depreciation year
disposals Cost surplus revaluation depreciation amount
&
impairment charges depreciation & impairment
charges charges
1-Jul-15 1-Jul-15 1-Jul-15 30-Jun-16 30-Jun-16 30-Jun-16
$000 $000 $000 $000 $000 $000 $000 $000 $000 $000 $000 $000 $000
Infrastructural assets
Land 2,168 0 2,168 2 0 0 0 0 0 0 2,170 0 2,170
Buildings 1,005 (34) 971 0 0 0 (38) 0 0 0 1,005 (73) 932
Roading network 198,631 0 198,631 1,680 0 0 (2,282) 0 0 11,205 209,234 0 209,234
Land under roads 55,365 0 55,365 0 0 0 0 0 0 0 55,365 0 55,365
Bridges 39,179 0 39,179 0 0 0 (483) 0 0 7,854 46,550 0 46,550
Water supply reticulation
27,252 0 27,252 1,834 0 0 (904) 0 0 (7,181) 21,001 0 21,001
Water supply treatment
1,777 0 1,777 3,618 0 0 (223) 0 0 8,108 13,281 0 13,281
Drainage/stormwater 7,771 0 7,771 31 0 0 (208) 0 0 1,115 8,709 0 8,709
Refuse sites 2,533 (232) 2,302 530 0 0 (32) 0 0 2,134 4,912 0 4,912
Sewerage system reticulation
14,372 0 14,372 17 0 0 (354) 0 0 (4,696) 9,338 0 9,338
Sewerage system treatment
84 0 84 0 0 0 (0) 0 0 6,453 6,536 0 6,536
Total infrastructural assets
350,138 (266) 349,872 7,712 0 0 (4,523) 0 0 24,992 378,103 (73) 378,030
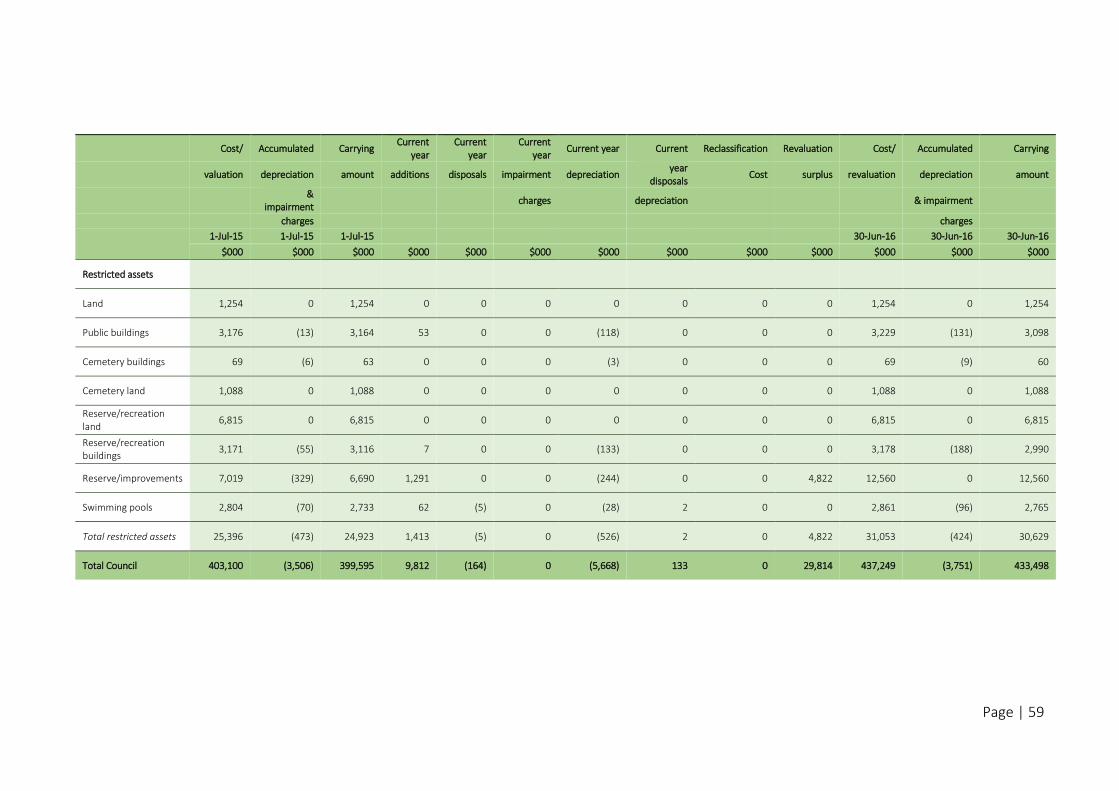
Page | 59
Cost/ Accumulated Carrying Current
year Current
year Current
year Current year Current Reclassification Revaluation Cost/ Accumulated Carrying
valuation depreciation amount additions disposals impairment depreciation year
disposals Cost surplus revaluation depreciation amount
&
impairment charges depreciation & impairment
charges charges
1-Jul-15 1-Jul-15 1-Jul-15 30-Jun-16 30-Jun-16 30-Jun-16
$000 $000 $000 $000 $000 $000 $000 $000 $000 $000 $000 $000 $000
Restricted assets
Land 1,254 0 1,254 0 0 0 0 0 0 0 1,254 0 1,254
Public buildings 3,176 (13) 3,164 53 0 0 (118) 0 0 0 3,229 (131) 3,098
Cemetery buildings 69 (6) 63 0 0 0 (3) 0 0 0 69 (9) 60
Cemetery land 1,088 0 1,088 0 0 0 0 0 0 0 1,088 0 1,088
Reserve/recreation land
6,815 0 6,815 0 0 0 0 0 0 0 6,815 0 6,815
Reserve/recreation buildings
3,171 (55) 3,116 7 0 0 (133) 0 0 0 3,178 (188) 2,990
Reserve/improvements 7,019 (329) 6,690 1,291 0 0 (244) 0 0 4,822 12,560 0 12,560
Swimming pools 2,804 (70) 2,733 62 (5) 0 (28) 2 0 0 2,861 (96) 2,765
Total restricted assets 25,396 (473) 24,923 1,413 (5) 0 (526) 2 0 4,822 31,053 (424) 30,629
Total Council 403,100 (3,506) 399,595 9,812 (164) 0 (5,668) 133 0 29,814 437,249 (3,751) 433,498
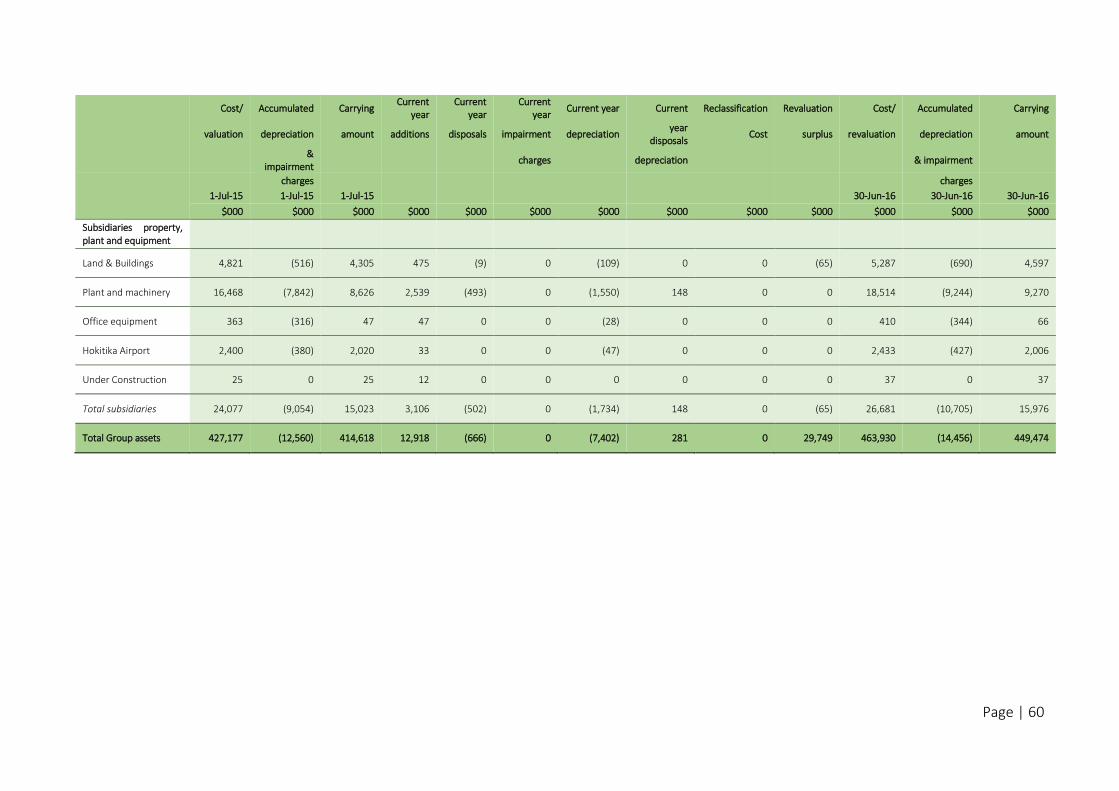
Page | 60
Cost/ Accumulated Carrying Current
year Current
year Current
year Current year Current Reclassification Revaluation Cost/ Accumulated Carrying
valuation depreciation amount additions disposals impairment depreciation year
disposals Cost surplus revaluation depreciation amount
&
impairment charges depreciation & impairment
charges charges
1-Jul-15 1-Jul-15 1-Jul-15 30-Jun-16 30-Jun-16 30-Jun-16
$000 $000 $000 $000 $000 $000 $000 $000 $000 $000 $000 $000 $000
Subsidiaries property, plant and equipment
Land & Buildings 4,821 (516) 4,305 475 (9) 0 (109) 0 0 (65) 5,287 (690) 4,597
Plant and machinery 16,468 (7,842) 8,626 2,539 (493) 0 (1,550) 148 0 0 18,514 (9,244) 9,270
Office equipment 363 (316) 47 47 0 0 (28) 0 0 0 410 (344) 66
Hokitika Airport 2,400 (380) 2,020 33 0 0 (47) 0 0 0 2,433 (427) 2,006
Under Construction 25 0 25 12 0 0 0 0 0 0 37 0 37
Total subsidiaries 24,077 (9,054) 15,023 3,106 (502) 0 (1,734) 148 0 (65) 26,681 (10,705) 15,976
Total Group assets 427,177 (12,560) 414,618 12,918 (666) 0 (7,402) 281 0 29,749 463,930 (14,456) 449,474
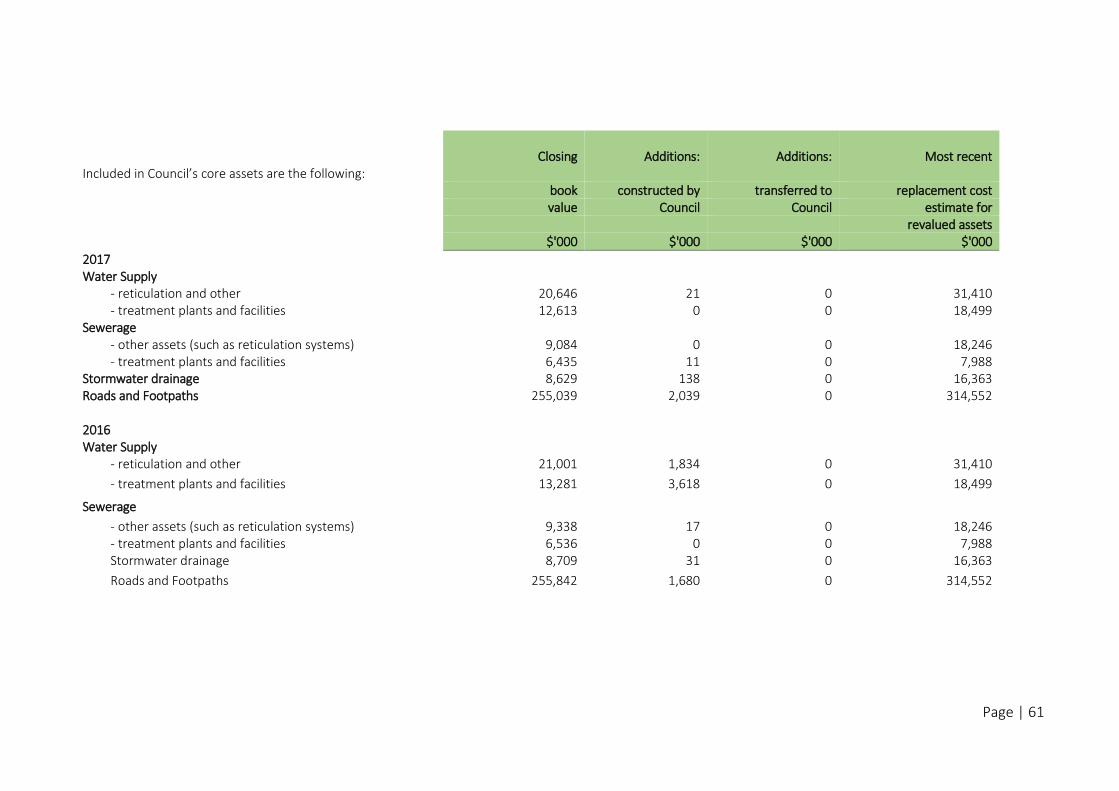
Page | 61
Included in Council’s core assets are the following:
Closing Additions: Additions: Most recent
book constructed by transferred to replacement cost value Council Council estimate for revalued assets $'000 $'000 $'000 $'000
2017
Water Supply
- reticulation and other 20,646 21 0 31,410 - treatment plants and facilities 12,613 0 0 18,499
Sewerage - other assets (such as reticulation systems) 9,084 0 0 18,246 - treatment plants and facilities 6,435 11 0 7,988
Stormwater drainage 8,629 138 0 16,363 Roads and Footpaths 255,039 2,039 0 314,552
2016 Water Supply
- reticulation and other 21,001 1,834 0 31,410
- treatment plants and facilities 13,281 3,618 0 18,499
Sewerage
- other assets (such as reticulation systems) 9,338 17 0 18,246 - treatment plants and facilities 6,536 0 0 7,988 Stormwater drainage 8,709 31 0 16,363
Roads and Footpaths 255,842 1,680 0 314,552
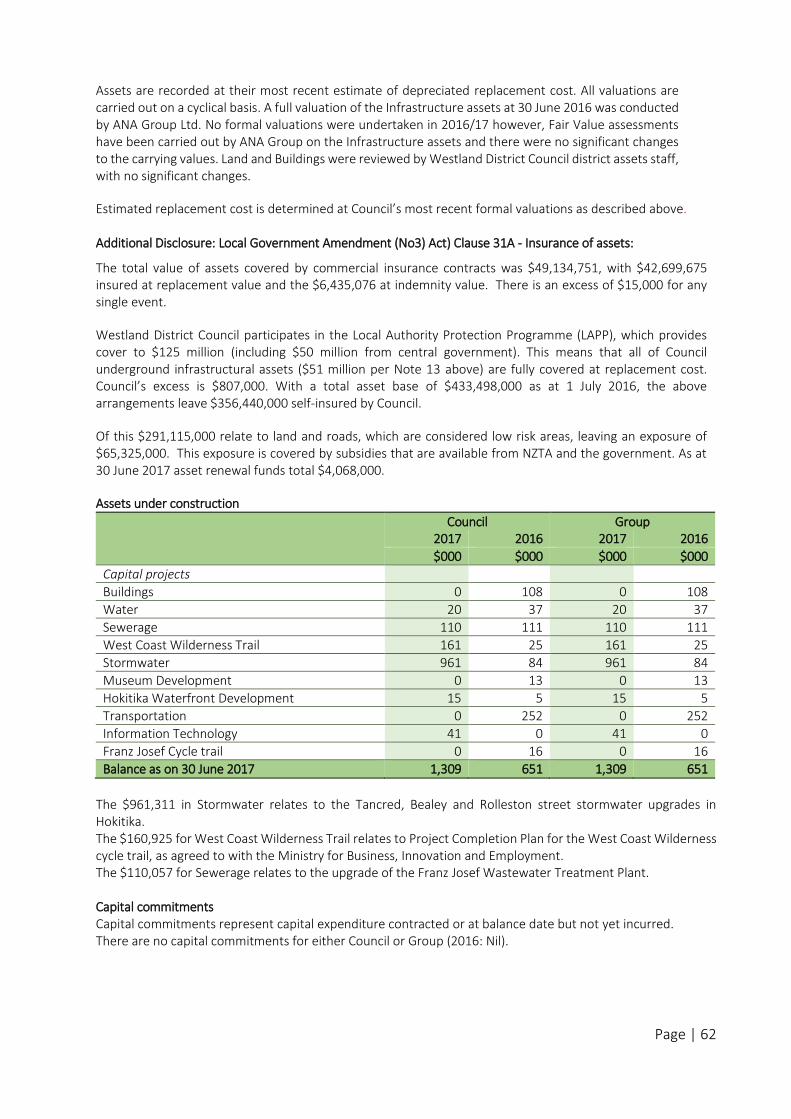
Page | 62
Assets are recorded at their most recent estimate of depreciated replacement cost. All valuations are carried out on a cyclical basis. A full valuation of the Infrastructure assets at 30 June 2016 was conducted by ANA Group Ltd. No formal valuations were undertaken in 2016/17 however, Fair Value assessments have been carried out by ANA Group on the Infrastructure assets and there were no significant changes to the carrying values. Land and Buildings were reviewed by Westland District Council district assets staff, with no significant changes.
Estimated replacement cost is determined at Council’s most recent formal valuations as described above. Additional Disclosure: Local Government Amendment (No3) Act) Clause 31A - Insurance of assets:
The total value of assets covered by commercial insurance contracts was $49,134,751, with $42,699,675 insured at replacement value and the $6,435,076 at indemnity value. There is an excess of $15,000 for any single event.
Westland District Council participates in the Local Authority Protection Programme (LAPP), which provides cover to $125 million (including $50 million from central government). This means that all of Council underground infrastructural assets ($51 million per Note 13 above) are fully covered at replacement cost. Council’s excess is $807,000. With a total asset base of $433,498,000 as at 1 July 2016, the above arrangements leave $356,440,000 self-insured by Council.
Of this $291,115,000 relate to land and roads, which are considered low risk areas, leaving an exposure of $65,325,000. This exposure is covered by subsidies that are available from NZTA and the government. As at 30 June 2017 asset renewal funds total $4,068,000.
Assets under construction
Council Group
2017 2016 2017 2016
$000 $000 $000 $000
Capital projects
Buildings 0 108 0 108
Water 20 37 20 37
Sewerage 110 111 110 111
West Coast Wilderness Trail 161 25 161 25
Stormwater 961 84 961 84
Museum Development 0 13 0 13
Hokitika Waterfront Development 15 5 15 5
Transportation 0 252 0 252
Information Technology 41 0 41 0
Franz Josef Cycle trail 0 16 0 16
Balance as on 30 June 2017 1,309 651 1,309 651
The $961,311 in Stormwater relates to the Tancred, Bealey and Rolleston street stormwater upgrades in Hokitika. The $160,925 for West Coast Wilderness Trail relates to Project Completion Plan for the West Coast Wilderness cycle trail, as agreed to with the Ministry for Business, Innovation and Employment. The $110,057 for Sewerage relates to the upgrade of the Franz Josef Wastewater Treatment Plant. Capital commitments Capital commitments represent capital expenditure contracted or at balance date but not yet incurred. There are no capital commitments for either Council or Group (2016: Nil).
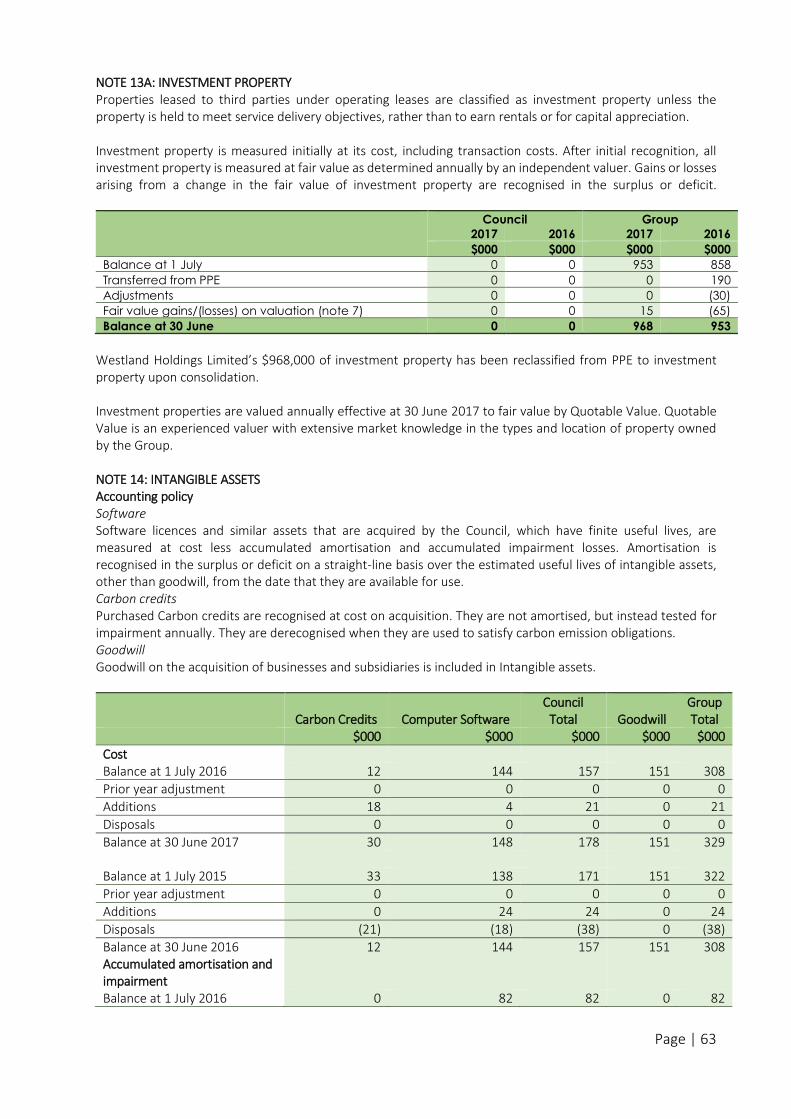
Page | 63
NOTE 13A: INVESTMENT PROPERTY Properties leased to third parties under operating leases are classified as investment property unless the property is held to meet service delivery objectives, rather than to earn rentals or for capital appreciation. Investment property is measured initially at its cost, including transaction costs. After initial recognition, all investment property is measured at fair value as determined annually by an independent valuer. Gains or losses arising from a change in the fair value of investment property are recognised in the surplus or deficit.
Council Group
2017 2016 2017 2016
$000 $000 $000 $000
Balance at 1 July 0 0 953 858
Transferred from PPE 0 0 0 190
Adjustments 0 0 0 (30)
Fair value gains/(losses) on valuation (note 7) 0 0 15 (65)
Balance at 30 June 0 0 968 953
Westland Holdings Limited’s $968,000 of investment property has been reclassified from PPE to investment property upon consolidation. Investment properties are valued annually effective at 30 June 2017 to fair value by Quotable Value. Quotable Value is an experienced valuer with extensive market knowledge in the types and location of property owned by the Group. NOTE 14: INTANGIBLE ASSETS Accounting policy Software Software licences and similar assets that are acquired by the Council, which have finite useful lives, are measured at cost less accumulated amortisation and accumulated impairment losses. Amortisation is recognised in the surplus or deficit on a straight-line basis over the estimated useful lives of intangible assets, other than goodwill, from the date that they are available for use. Carbon credits Purchased Carbon credits are recognised at cost on acquisition. They are not amortised, but instead tested for impairment annually. They are derecognised when they are used to satisfy carbon emission obligations. Goodwill Goodwill on the acquisition of businesses and subsidiaries is included in Intangible assets.
Carbon Credits Computer Software
Council Total
Goodwill
Group Total
$000 $000 $000 $000 $000
Cost Balance at 1 July 2016 12 144 157 151 308
Prior year adjustment 0 0 0 0 0
Additions 18 4 21 0 21
Disposals 0 0 0 0 0
Balance at 30 June 2017 30 148 178 151 329
Balance at 1 July 2015 33 138 171 151 322
Prior year adjustment 0 0 0 0 0
Additions 0 24 24 0 24
Disposals (21) (18) (38) 0 (38)
Balance at 30 June 2016 12 144 157 151 308 Accumulated amortisation and impairment
Balance at 1 July 2016 0 82 82 0 82
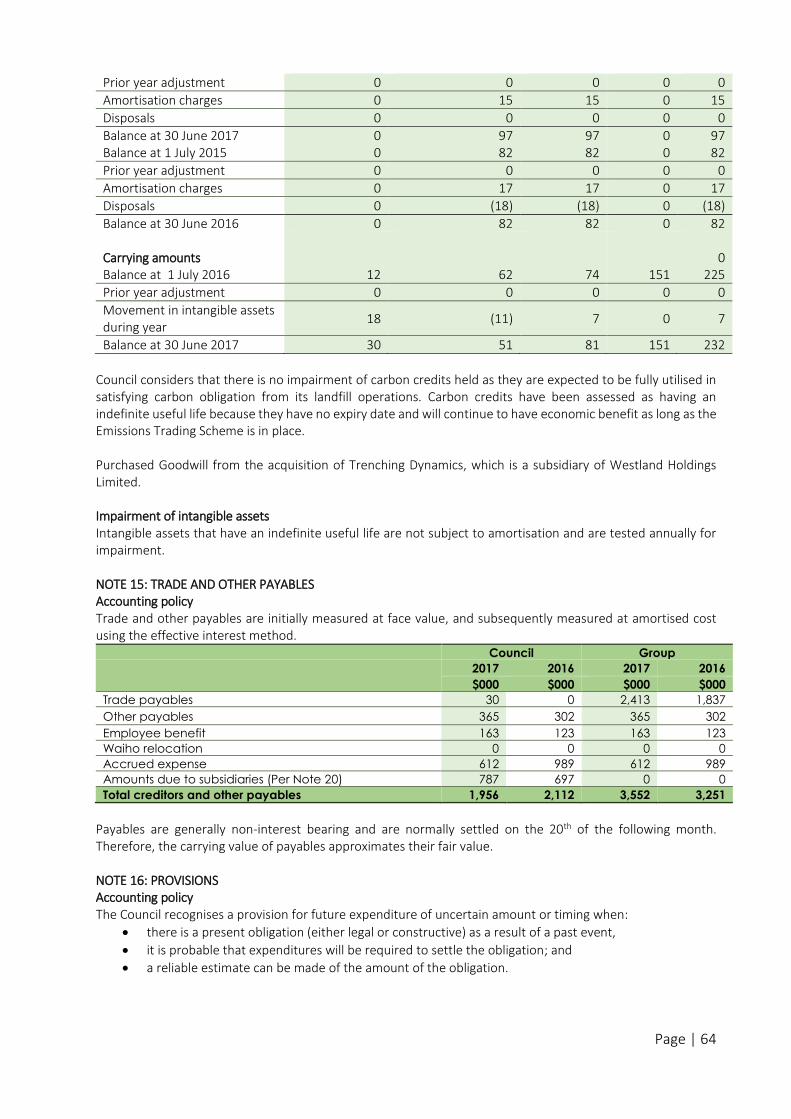
Page | 64
Prior year adjustment 0 0 0 0 0
Amortisation charges 0 15 15 0 15
Disposals 0 0 0 0 0
Balance at 30 June 2017 0 97 97 0 97 Balance at 1 July 2015 0 82 82 0 82
Prior year adjustment 0 0 0 0 0
Amortisation charges 0 17 17 0 17
Disposals 0 (18) (18) 0 (18)
Balance at 30 June 2016 0 82 82 0 82
Carrying amounts 0 Balance at 1 July 2016 12 62 74 151 225
Prior year adjustment 0 0 0 0 0
Movement in intangible assets during year
18 (11) 7 0 7
Balance at 30 June 2017 30 51 81 151 232
Council considers that there is no impairment of carbon credits held as they are expected to be fully utilised in satisfying carbon obligation from its landfill operations. Carbon credits have been assessed as having an indefinite useful life because they have no expiry date and will continue to have economic benefit as long as the Emissions Trading Scheme is in place. Purchased Goodwill from the acquisition of Trenching Dynamics, which is a subsidiary of Westland Holdings Limited. Impairment of intangible assets Intangible assets that have an indefinite useful life are not subject to amortisation and are tested annually for impairment. NOTE 15: TRADE AND OTHER PAYABLES Accounting policy Trade and other payables are initially measured at face value, and subsequently measured at amortised cost using the effective interest method.
Council Group
2017 2016 2017 2016
$000 $000 $000 $000
Trade payables 30 0 2,413 1,837
Other payables 365 302 365 302
Employee benefit 163 123 163 123
Waiho relocation 0 0 0 0
Accrued expense 612 989 612 989
Amounts due to subsidiaries (Per Note 20) 787 697 0 0
Total creditors and other payables 1,956 2,112 3,552 3,251
Payables are generally non-interest bearing and are normally settled on the 20th of the following month. Therefore, the carrying value of payables approximates their fair value. NOTE 16: PROVISIONS Accounting policy The Council recognises a provision for future expenditure of uncertain amount or timing when:
there is a present obligation (either legal or constructive) as a result of a past event,
it is probable that expenditures will be required to settle the obligation; and
a reliable estimate can be made of the amount of the obligation.
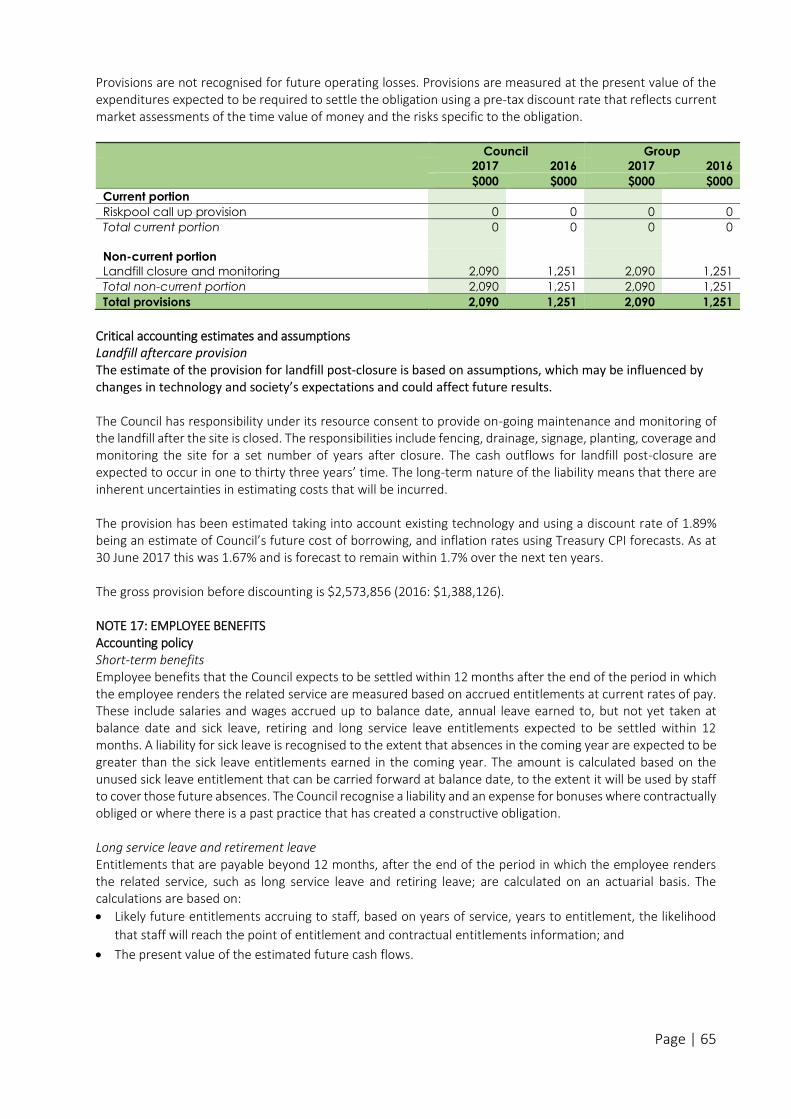
Page | 65
Provisions are not recognised for future operating losses. Provisions are measured at the present value of the expenditures expected to be required to settle the obligation using a pre-tax discount rate that reflects current market assessments of the time value of money and the risks specific to the obligation.
Council Group
2017 2016 2017 2016
$000 $000 $000 $000
Current portion
Riskpool call up provision 0 0 0 0
Total current portion 0 0 0 0
Non-current portion
Landfill closure and monitoring 2,090 1,251 2,090 1,251
Total non-current portion 2,090 1,251 2,090 1,251
Total provisions 2,090 1,251 2,090 1,251
Critical accounting estimates and assumptions Landfill aftercare provision The estimate of the provision for landfill post-closure is based on assumptions, which may be influenced by changes in technology and society’s expectations and could affect future results. The Council has responsibility under its resource consent to provide on-going maintenance and monitoring of the landfill after the site is closed. The responsibilities include fencing, drainage, signage, planting, coverage and monitoring the site for a set number of years after closure. The cash outflows for landfill post-closure are expected to occur in one to thirty three years’ time. The long-term nature of the liability means that there are inherent uncertainties in estimating costs that will be incurred. The provision has been estimated taking into account existing technology and using a discount rate of 1.89% being an estimate of Council’s future cost of borrowing, and inflation rates using Treasury CPI forecasts. As at 30 June 2017 this was 1.67% and is forecast to remain within 1.7% over the next ten years. The gross provision before discounting is $2,573,856 (2016: $1,388,126). NOTE 17: EMPLOYEE BENEFITS Accounting policy Short-term benefits Employee benefits that the Council expects to be settled within 12 months after the end of the period in which the employee renders the related service are measured based on accrued entitlements at current rates of pay. These include salaries and wages accrued up to balance date, annual leave earned to, but not yet taken at balance date and sick leave, retiring and long service leave entitlements expected to be settled within 12 months. A liability for sick leave is recognised to the extent that absences in the coming year are expected to be greater than the sick leave entitlements earned in the coming year. The amount is calculated based on the unused sick leave entitlement that can be carried forward at balance date, to the extent it will be used by staff to cover those future absences. The Council recognise a liability and an expense for bonuses where contractually obliged or where there is a past practice that has created a constructive obligation. Long service leave and retirement leave Entitlements that are payable beyond 12 months, after the end of the period in which the employee renders the related service, such as long service leave and retiring leave; are calculated on an actuarial basis. The calculations are based on:
Likely future entitlements accruing to staff, based on years of service, years to entitlement, the likelihood
that staff will reach the point of entitlement and contractual entitlements information; and
The present value of the estimated future cash flows.
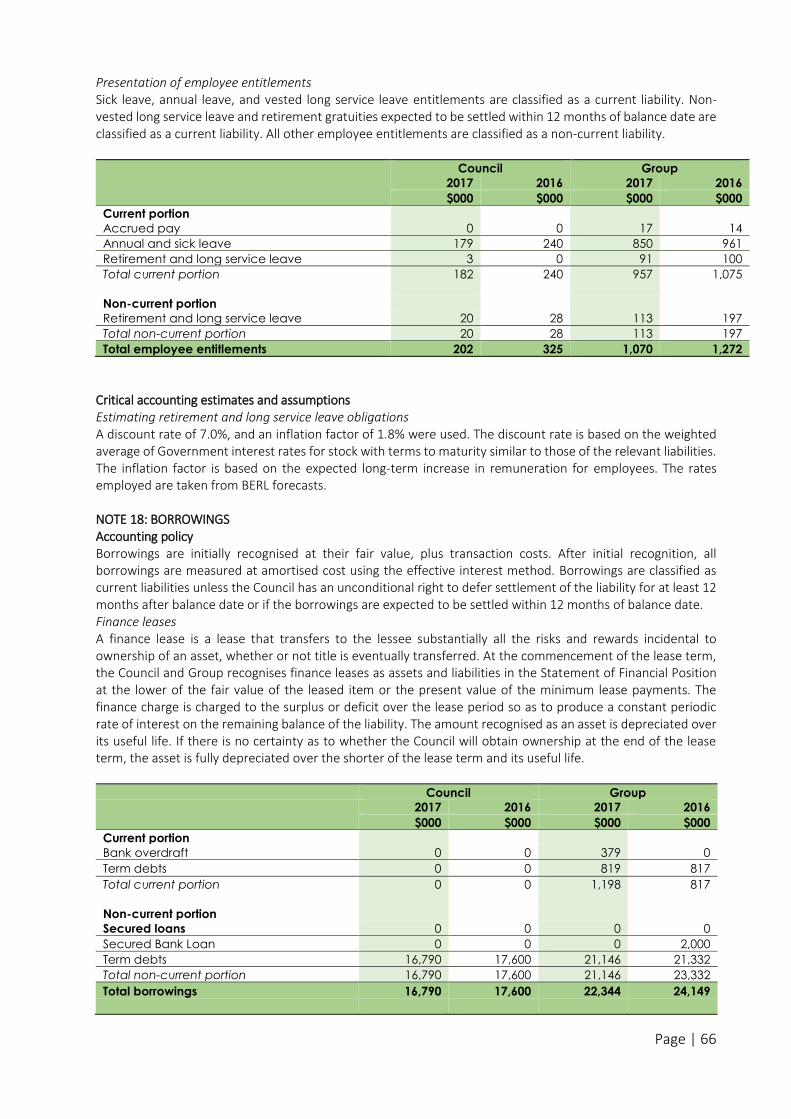
Page | 66
Presentation of employee entitlements Sick leave, annual leave, and vested long service leave entitlements are classified as a current liability. Non-vested long service leave and retirement gratuities expected to be settled within 12 months of balance date are classified as a current liability. All other employee entitlements are classified as a non-current liability.
Council Group
2017 2016 2017 2016
$000 $000 $000 $000
Current portion
Accrued pay 0 0 17 14
Annual and sick leave 179 240 850 961
Retirement and long service leave 3 0 91 100
Total current portion 182 240 957 1,075
Non-current portion
Retirement and long service leave 20 28 113 197
Total non-current portion 20 28 113 197
Total employee entitlements 202 325 1,070 1,272
Critical accounting estimates and assumptions Estimating retirement and long service leave obligations A discount rate of 7.0%, and an inflation factor of 1.8% were used. The discount rate is based on the weighted average of Government interest rates for stock with terms to maturity similar to those of the relevant liabilities. The inflation factor is based on the expected long-term increase in remuneration for employees. The rates employed are taken from BERL forecasts. NOTE 18: BORROWINGS Accounting policy Borrowings are initially recognised at their fair value, plus transaction costs. After initial recognition, all borrowings are measured at amortised cost using the effective interest method. Borrowings are classified as current liabilities unless the Council has an unconditional right to defer settlement of the liability for at least 12 months after balance date or if the borrowings are expected to be settled within 12 months of balance date. Finance leases A finance lease is a lease that transfers to the lessee substantially all the risks and rewards incidental to ownership of an asset, whether or not title is eventually transferred. At the commencement of the lease term, the Council and Group recognises finance leases as assets and liabilities in the Statement of Financial Position at the lower of the fair value of the leased item or the present value of the minimum lease payments. The finance charge is charged to the surplus or deficit over the lease period so as to produce a constant periodic rate of interest on the remaining balance of the liability. The amount recognised as an asset is depreciated over its useful life. If there is no certainty as to whether the Council will obtain ownership at the end of the lease term, the asset is fully depreciated over the shorter of the lease term and its useful life.
Council Group
2017 2016 2017 2016
$000 $000 $000 $000
Current portion
Bank overdraft 0 0 379 0
Term debts 0 0 819 817
Total current portion 0 0 1,198 817
Non-current portion
Secured loans 0 0 0 0
Secured Bank Loan 0 0 0 2,000
Term debts 16,790 17,600 21,146 21,332
Total non-current portion 16,790 17,600 21,146 23,332
Total borrowings 16,790 17,600 22,344 24,149
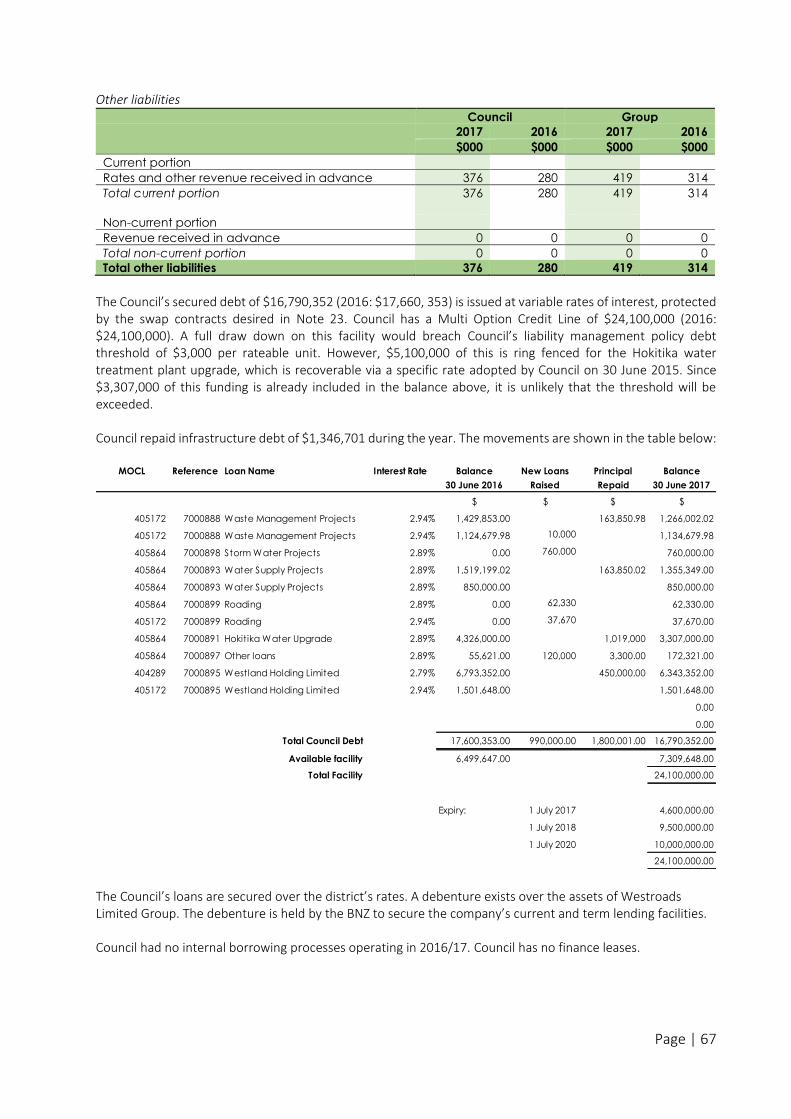
Page | 67
Other liabilities
Council Group
2017 2016 2017 2016
$000 $000 $000 $000
Current portion
Rates and other revenue received in advance 376 280 419 314
Total current portion 376 280 419 314
Non-current portion
Revenue received in advance 0 0 0 0
Total non-current portion 0 0 0 0
Total other liabilities 376 280 419 314
The Council’s secured debt of $16,790,352 (2016: $17,660, 353) is issued at variable rates of interest, protected by the swap contracts desired in Note 23. Council has a Multi Option Credit Line of $24,100,000 (2016: $24,100,000). A full draw down on this facility would breach Council’s liability management policy debt threshold of $3,000 per rateable unit. However, $5,100,000 of this is ring fenced for the Hokitika water treatment plant upgrade, which is recoverable via a specific rate adopted by Council on 30 June 2015. Since $3,307,000 of this funding is already included in the balance above, it is unlikely that the threshold will be exceeded. Council repaid infrastructure debt of $1,346,701 during the year. The movements are shown in the table below:
The Council’s loans are secured over the district’s rates. A debenture exists over the assets of Westroads Limited Group. The debenture is held by the BNZ to secure the company’s current and term lending facilities. Council had no internal borrowing processes operating in 2016/17. Council has no finance leases.
MOCL Reference Loan Name Interest Rate Balance
30 June 2016
New Loans
Raised
Principal
Repaid
Balance
30 June 2017
$ $ $ $
405172 7000888 Waste Management Projects 2.94% 1,429,853.00 163,850.98 1,266,002.02
405172 7000888 Waste Management Projects 2.94% 1,124,679.98 10,000 1,134,679.98
405864 7000898 Storm Water Projects 2.89% 0.00 760,000 760,000.00
405864 7000893 Water Supply Projects 2.89% 1,519,199.02 163,850.02 1,355,349.00
405864 7000893 Water Supply Projects 2.89% 850,000.00 850,000.00
405864 7000899 Roading 2.89% 0.00 62,330 62,330.00
405172 7000899 Roading 2.94% 0.00 37,670 37,670.00
405864 7000891 Hokitika Water Upgrade 2.89% 4,326,000.00 1,019,000 3,307,000.00
405864 7000897 Other loans 2.89% 55,621.00 120,000 3,300.00 172,321.00
404289 7000895 Westland Holding Limited 2.79% 6,793,352.00 450,000.00 6,343,352.00
405172 7000895 Westland Holding Limited 2.94% 1,501,648.00 1,501,648.00
0.00
0.00
Total Council Debt 17,600,353.00 990,000.00 1,800,001.00 16,790,352.00
Available facility 6,499,647.00 7,309,648.00
Total Facility 24,100,000.00
Expiry: 1 July 2017 4,600,000.00
1 July 2018 9,500,000.00
1 July 2020 10,000,000.00
24,100,000.00
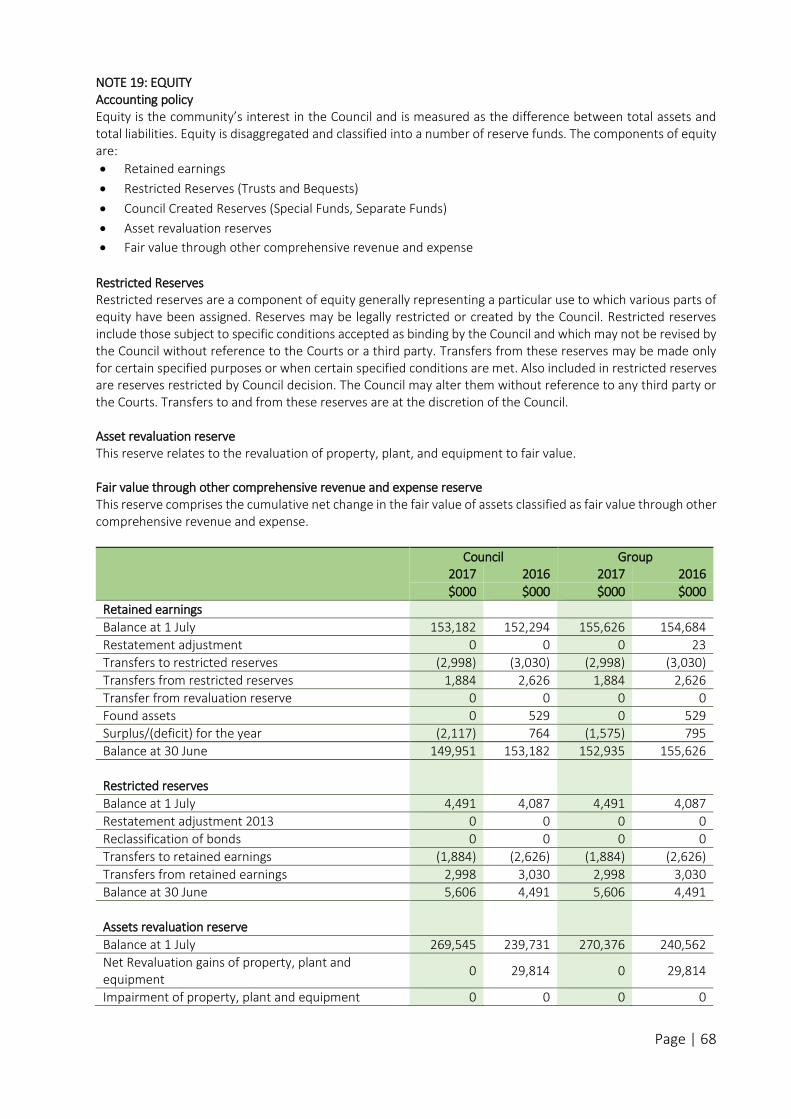
Page | 68
NOTE 19: EQUITY Accounting policy Equity is the community’s interest in the Council and is measured as the difference between total assets and total liabilities. Equity is disaggregated and classified into a number of reserve funds. The components of equity are:
Retained earnings
Restricted Reserves (Trusts and Bequests)
Council Created Reserves (Special Funds, Separate Funds)
Asset revaluation reserves
Fair value through other comprehensive revenue and expense
Restricted Reserves Restricted reserves are a component of equity generally representing a particular use to which various parts of equity have been assigned. Reserves may be legally restricted or created by the Council. Restricted reserves include those subject to specific conditions accepted as binding by the Council and which may not be revised by the Council without reference to the Courts or a third party. Transfers from these reserves may be made only for certain specified purposes or when certain specified conditions are met. Also included in restricted reserves are reserves restricted by Council decision. The Council may alter them without reference to any third party or the Courts. Transfers to and from these reserves are at the discretion of the Council. Asset revaluation reserve This reserve relates to the revaluation of property, plant, and equipment to fair value. Fair value through other comprehensive revenue and expense reserve This reserve comprises the cumulative net change in the fair value of assets classified as fair value through other comprehensive revenue and expense.
Council Group
2017 2016 2017 2016
$000 $000 $000 $000
Retained earnings
Balance at 1 July 153,182 152,294 155,626 154,684
Restatement adjustment 0 0 0 23
Transfers to restricted reserves (2,998) (3,030) (2,998) (3,030)
Transfers from restricted reserves 1,884 2,626 1,884 2,626
Transfer from revaluation reserve 0 0 0 0
Found assets 0 529 0 529
Surplus/(deficit) for the year (2,117) 764 (1,575) 795
Balance at 30 June 149,951 153,182 152,935 155,626
Restricted reserves
Balance at 1 July 4,491 4,087 4,491 4,087
Restatement adjustment 2013 0 0 0 0
Reclassification of bonds 0 0 0 0
Transfers to retained earnings (1,884) (2,626) (1,884) (2,626)
Transfers from retained earnings 2,998 3,030 2,998 3,030
Balance at 30 June 5,606 4,491 5,606 4,491
Assets revaluation reserve
Balance at 1 July 269,545 239,731 270,376 240,562
Net Revaluation gains of property, plant and equipment
0 29,814 0 29,814
Impairment of property, plant and equipment 0 0 0 0
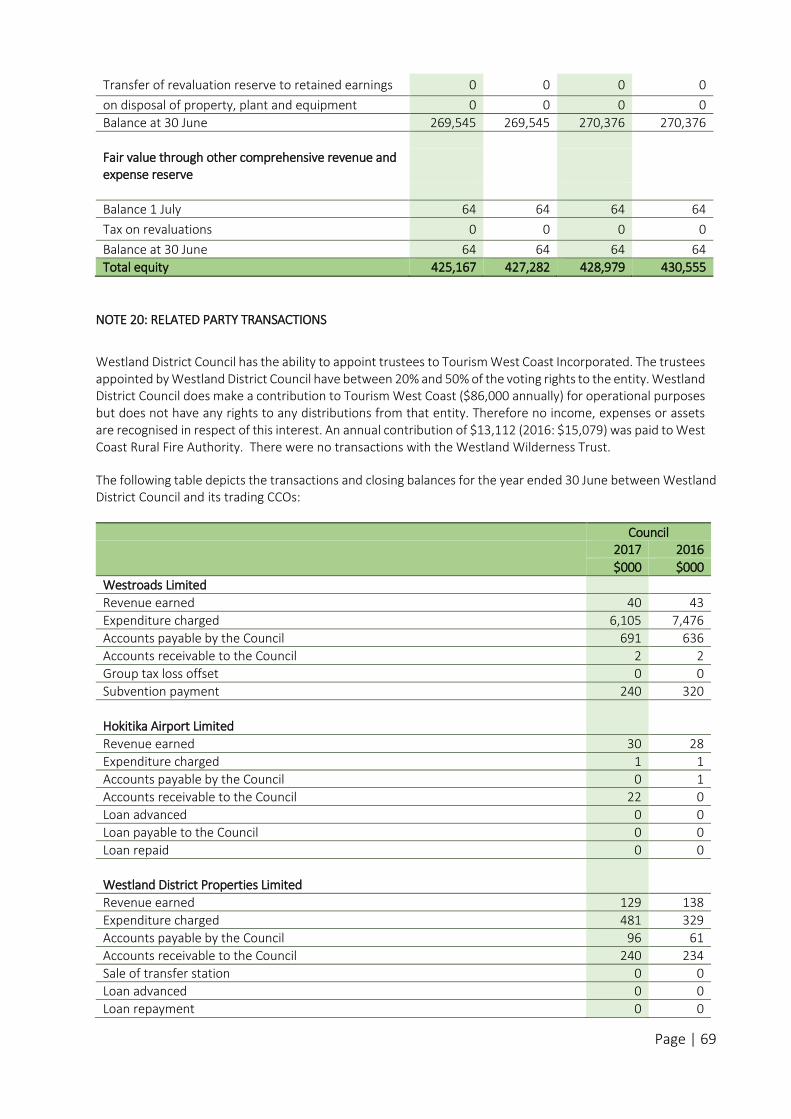
Page | 69
Transfer of revaluation reserve to retained earnings 0 0 0 0
on disposal of property, plant and equipment 0 0 0 0
Balance at 30 June 269,545 269,545 270,376 270,376
Fair value through other comprehensive revenue and expense reserve
Balance 1 July 64 64 64 64
Tax on revaluations 0 0 0 0
Balance at 30 June 64 64 64 64
Total equity 425,167 427,282 428,979 430,555
NOTE 20: RELATED PARTY TRANSACTIONS
Westland District Council has the ability to appoint trustees to Tourism West Coast Incorporated. The trustees appointed by Westland District Council have between 20% and 50% of the voting rights to the entity. Westland District Council does make a contribution to Tourism West Coast ($86,000 annually) for operational purposes but does not have any rights to any distributions from that entity. Therefore no income, expenses or assets are recognised in respect of this interest. An annual contribution of $13,112 (2016: $15,079) was paid to West Coast Rural Fire Authority. There were no transactions with the Westland Wilderness Trust.
The following table depicts the transactions and closing balances for the year ended 30 June between Westland District Council and its trading CCOs:
Council
2017 2016
$000 $000
Westroads Limited
Revenue earned 40 43
Expenditure charged 6,105 7,476
Accounts payable by the Council 691 636
Accounts receivable to the Council 2 2
Group tax loss offset 0 0
Subvention payment 240 320
Hokitika Airport Limited
Revenue earned 30 28
Expenditure charged 1 1
Accounts payable by the Council 0 1
Accounts receivable to the Council 22 0
Loan advanced 0 0
Loan payable to the Council 0 0
Loan repaid 0 0
Westland District Properties Limited
Revenue earned 129 138
Expenditure charged 481 329
Accounts payable by the Council 96 61
Accounts receivable to the Council 240 234
Sale of transfer station 0 0
Loan advanced 0 0
Loan repayment 0 0
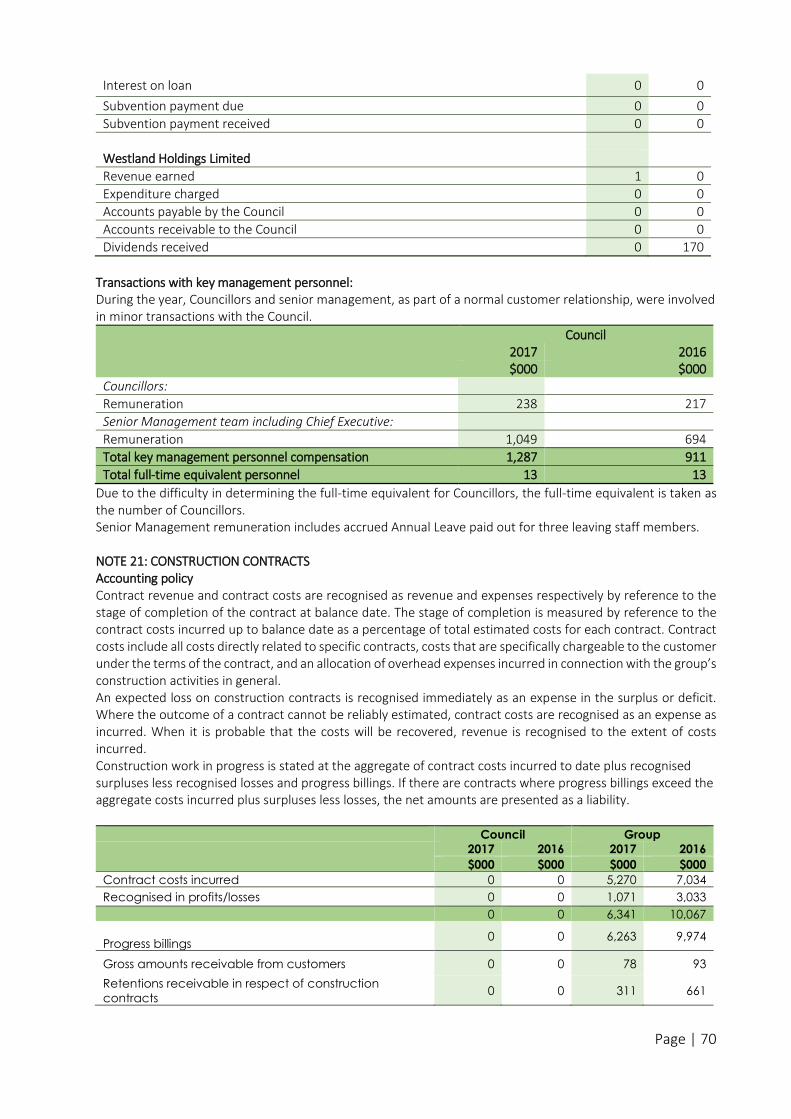
Page | 70
Interest on loan 0 0
Subvention payment due 0 0
Subvention payment received 0 0
Westland Holdings Limited
Revenue earned 1 0
Expenditure charged 0 0
Accounts payable by the Council 0 0
Accounts receivable to the Council 0 0
Dividends received 0 170
Transactions with key management personnel: During the year, Councillors and senior management, as part of a normal customer relationship, were involved in minor transactions with the Council.
Council
2017 2016 $000 $000
Councillors:
Remuneration 238 217
Senior Management team including Chief Executive:
Remuneration 1,049 694
Total key management personnel compensation 1,287 911
Total full-time equivalent personnel 13 13
Due to the difficulty in determining the full-time equivalent for Councillors, the full-time equivalent is taken as the number of Councillors. Senior Management remuneration includes accrued Annual Leave paid out for three leaving staff members. NOTE 21: CONSTRUCTION CONTRACTS Accounting policy Contract revenue and contract costs are recognised as revenue and expenses respectively by reference to the stage of completion of the contract at balance date. The stage of completion is measured by reference to the contract costs incurred up to balance date as a percentage of total estimated costs for each contract. Contract costs include all costs directly related to specific contracts, costs that are specifically chargeable to the customer under the terms of the contract, and an allocation of overhead expenses incurred in connection with the group’s construction activities in general. An expected loss on construction contracts is recognised immediately as an expense in the surplus or deficit. Where the outcome of a contract cannot be reliably estimated, contract costs are recognised as an expense as incurred. When it is probable that the costs will be recovered, revenue is recognised to the extent of costs incurred. Construction work in progress is stated at the aggregate of contract costs incurred to date plus recognised surpluses less recognised losses and progress billings. If there are contracts where progress billings exceed the aggregate costs incurred plus surpluses less losses, the net amounts are presented as a liability.
Council Group
2017 2016 2017 2016
$000 $000 $000 $000
Contract costs incurred 0 0 5,270 7,034
Recognised in profits/losses 0 0 1,071 3,033 0 0 6,341 10,067
Progress billings 0 0 6,263 9,974
Gross amounts receivable from customers 0 0 78 93
Retentions receivable in respect of construction
contracts 0 0 311 661
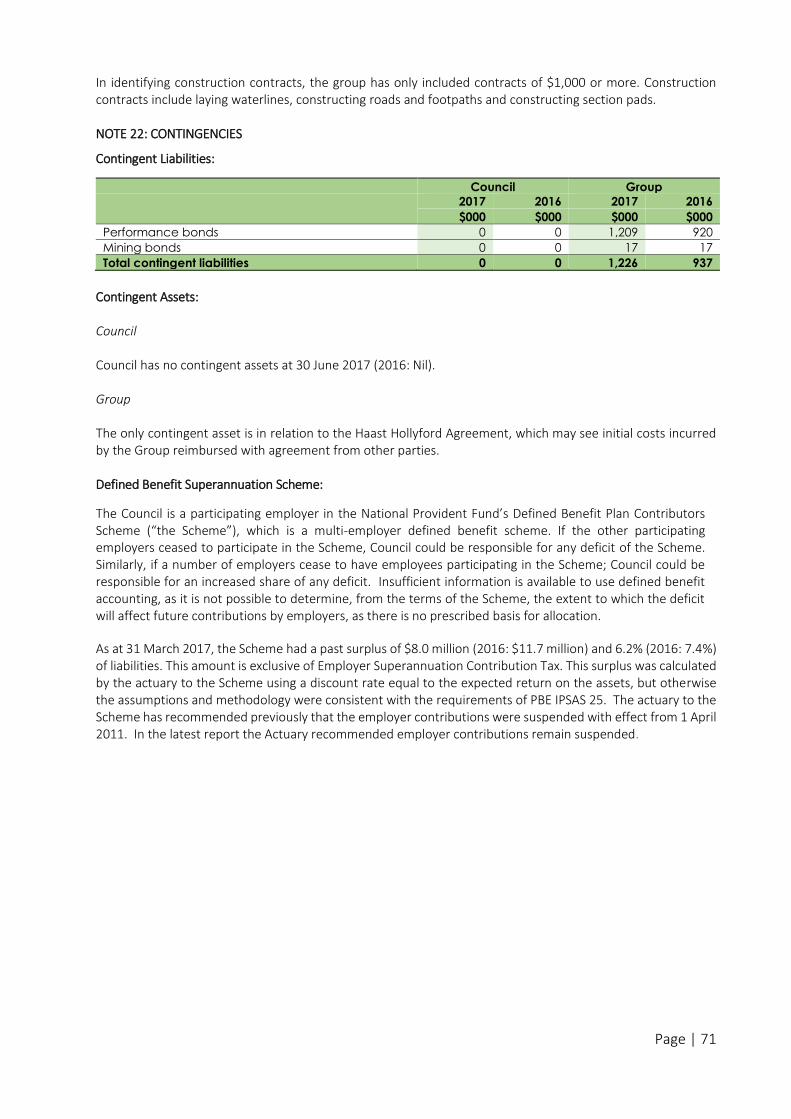
Page | 71
In identifying construction contracts, the group has only included contracts of $1,000 or more. Construction contracts include laying waterlines, constructing roads and footpaths and constructing section pads. NOTE 22: CONTINGENCIES
Contingent Liabilities:
Council Group
2017 2016 2017 2016
$000 $000 $000 $000
Performance bonds 0 0 1,209 920
Mining bonds 0 0 17 17
Total contingent liabilities 0 0 1,226 937
Contingent Assets: Council Council has no contingent assets at 30 June 2017 (2016: Nil). Group The only contingent asset is in relation to the Haast Hollyford Agreement, which may see initial costs incurred by the Group reimbursed with agreement from other parties. Defined Benefit Superannuation Scheme:
The Council is a participating employer in the National Provident Fund’s Defined Benefit Plan Contributors Scheme (“the Scheme”), which is a multi-employer defined benefit scheme. If the other participating employers ceased to participate in the Scheme, Council could be responsible for any deficit of the Scheme. Similarly, if a number of employers cease to have employees participating in the Scheme; Council could be responsible for an increased share of any deficit. Insufficient information is available to use defined benefit accounting, as it is not possible to determine, from the terms of the Scheme, the extent to which the deficit will affect future contributions by employers, as there is no prescribed basis for allocation.
As at 31 March 2017, the Scheme had a past surplus of $8.0 million (2016: $11.7 million) and 6.2% (2016: 7.4%) of liabilities. This amount is exclusive of Employer Superannuation Contribution Tax. This surplus was calculated by the actuary to the Scheme using a discount rate equal to the expected return on the assets, but otherwise the assumptions and methodology were consistent with the requirements of PBE IPSAS 25. The actuary to the Scheme has recommended previously that the employer contributions were suspended with effect from 1 April 2011. In the latest report the Actuary recommended employer contributions remain suspended.
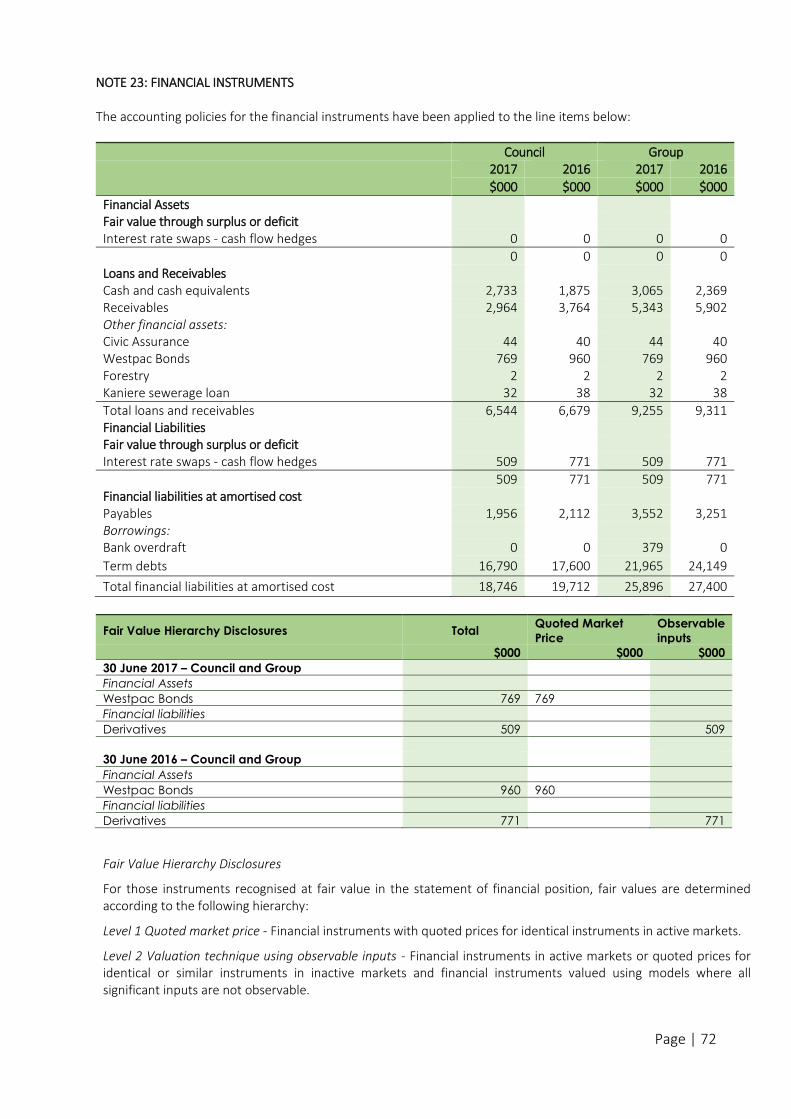
Page | 72
NOTE 23: FINANCIAL INSTRUMENTS The accounting policies for the financial instruments have been applied to the line items below:
Council Group
2017 2016 2017 2016
$000 $000 $000 $000
Financial Assets
Fair value through surplus or deficit
Interest rate swaps - cash flow hedges 0 0 0 0 0 0 0 0
Loans and Receivables
Cash and cash equivalents 2,733 1,875 3,065 2,369 Receivables 2,964 3,764 5,343 5,902 Other financial assets:
Civic Assurance 44 40 44 40 Westpac Bonds 769 960 769 960 Forestry 2 2 2 2 Kaniere sewerage loan 32 38 32 38
Total loans and receivables 6,544 6,679 9,255 9,311 Financial Liabilities
Fair value through surplus or deficit
Interest rate swaps - cash flow hedges 509 771 509 771 509 771 509 771
Financial liabilities at amortised cost
Payables 1,956 2,112 3,552 3,251 Borrowings:
Bank overdraft 0 0 379 0
Term debts 16,790 17,600 21,965 24,149
Total financial liabilities at amortised cost 18,746 19,712 25,896 27,400
Fair Value Hierarchy Disclosures Total Quoted Market
Price
Observable
inputs
$000 $000 $000
30 June 2017 – Council and Group
Financial Assets
Westpac Bonds 769 769
Financial liabilities
Derivatives 509 509
30 June 2016 – Council and Group
Financial Assets
Westpac Bonds 960 960
Financial liabilities
Derivatives 771 771
Fair Value Hierarchy Disclosures
For those instruments recognised at fair value in the statement of financial position, fair values are determined according to the following hierarchy:
Level 1 Quoted market price - Financial instruments with quoted prices for identical instruments in active markets.
Level 2 Valuation technique using observable inputs - Financial instruments in active markets or quoted prices for identical or similar instruments in inactive markets and financial instruments valued using models where all significant inputs are not observable.
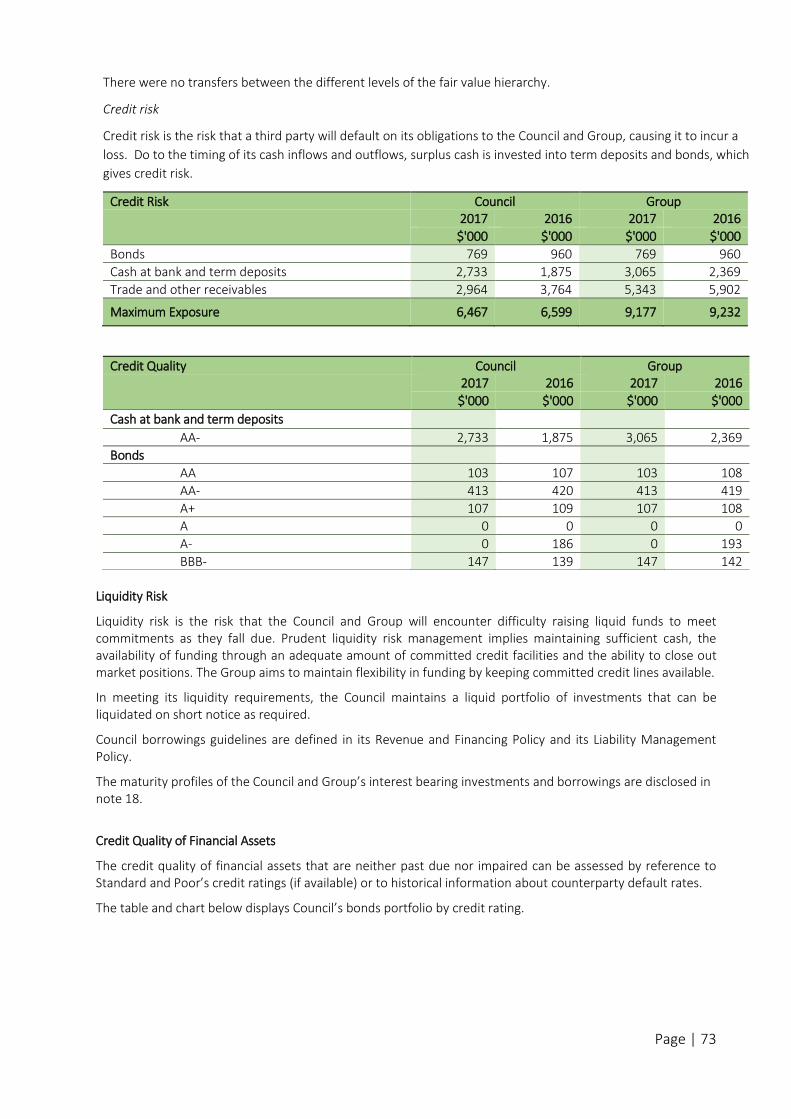
Page | 73
There were no transfers between the different levels of the fair value hierarchy.
Credit risk
Credit risk is the risk that a third party will default on its obligations to the Council and Group, causing it to incur a
loss. Do to the timing of its cash inflows and outflows, surplus cash is invested into term deposits and bonds, which
gives credit risk.
Credit Risk Council Group
2017 2016 2017 2016
$'000 $'000 $'000 $'000
Bonds 769 960 769 960
Cash at bank and term deposits 2,733 1,875 3,065 2,369
Trade and other receivables 2,964 3,764 5,343 5,902
Maximum Exposure 6,467 6,599 9,177 9,232
Credit Quality Council Group
2017 2016 2017 2016
$'000 $'000 $'000 $'000
Cash at bank and term deposits
AA- 2,733 1,875 3,065 2,369
Bonds
AA 103 107 103 108
AA- 413 420 413 419
A+ 107 109 107 108
A 0 0 0 0
A- 0 186 0 193
BBB- 147 139 147 142
Liquidity Risk
Liquidity risk is the risk that the Council and Group will encounter difficulty raising liquid funds to meet commitments as they fall due. Prudent liquidity risk management implies maintaining sufficient cash, the availability of funding through an adequate amount of committed credit facilities and the ability to close out market positions. The Group aims to maintain flexibility in funding by keeping committed credit lines available.
In meeting its liquidity requirements, the Council maintains a liquid portfolio of investments that can be liquidated on short notice as required.
Council borrowings guidelines are defined in its Revenue and Financing Policy and its Liability Management Policy.
The maturity profiles of the Council and Group’s interest bearing investments and borrowings are disclosed in note 18.
Credit Quality of Financial Assets
The credit quality of financial assets that are neither past due nor impaired can be assessed by reference to Standard and Poor’s credit ratings (if available) or to historical information about counterparty default rates.
The table and chart below displays Council’s bonds portfolio by credit rating.
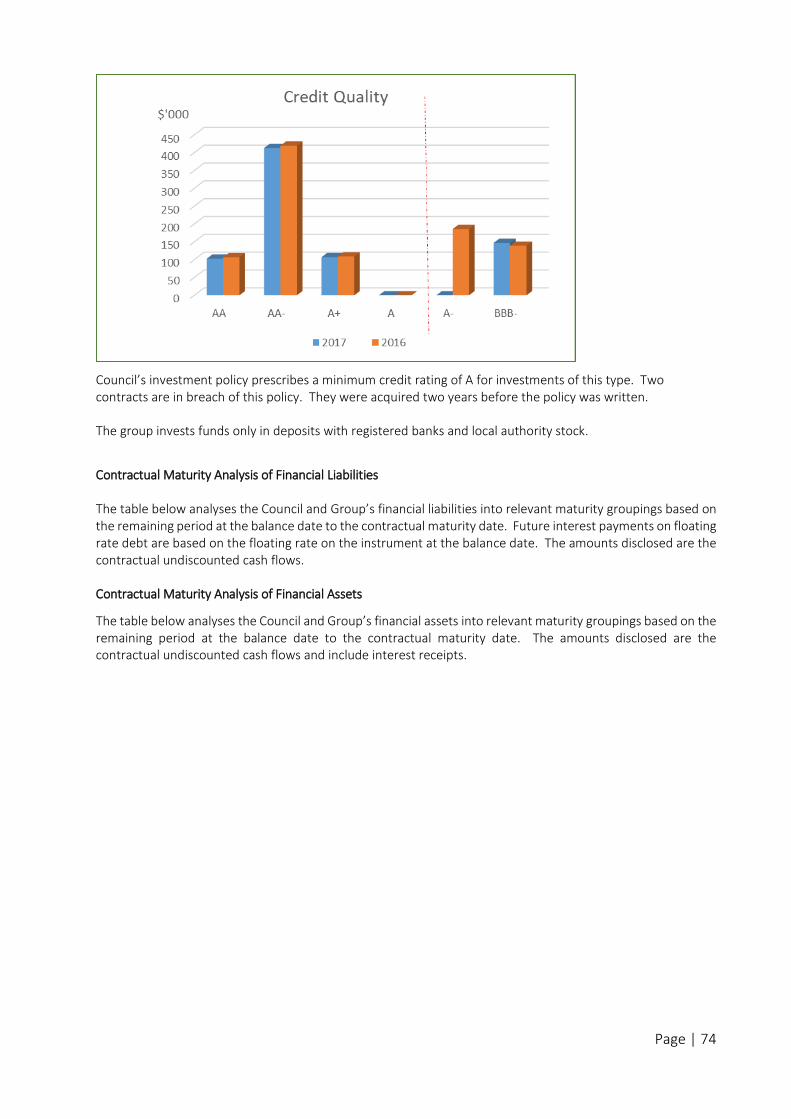
Page | 74
Council’s investment policy prescribes a minimum credit rating of A for investments of this type. Two contracts are in breach of this policy. They were acquired two years before the policy was written. The group invests funds only in deposits with registered banks and local authority stock.
Contractual Maturity Analysis of Financial Liabilities The table below analyses the Council and Group’s financial liabilities into relevant maturity groupings based on the remaining period at the balance date to the contractual maturity date. Future interest payments on floating rate debt are based on the floating rate on the instrument at the balance date. The amounts disclosed are the contractual undiscounted cash flows. Contractual Maturity Analysis of Financial Assets
The table below analyses the Council and Group’s financial assets into relevant maturity groupings based on the remaining period at the balance date to the contractual maturity date. The amounts disclosed are the contractual undiscounted cash flows and include interest receipts.
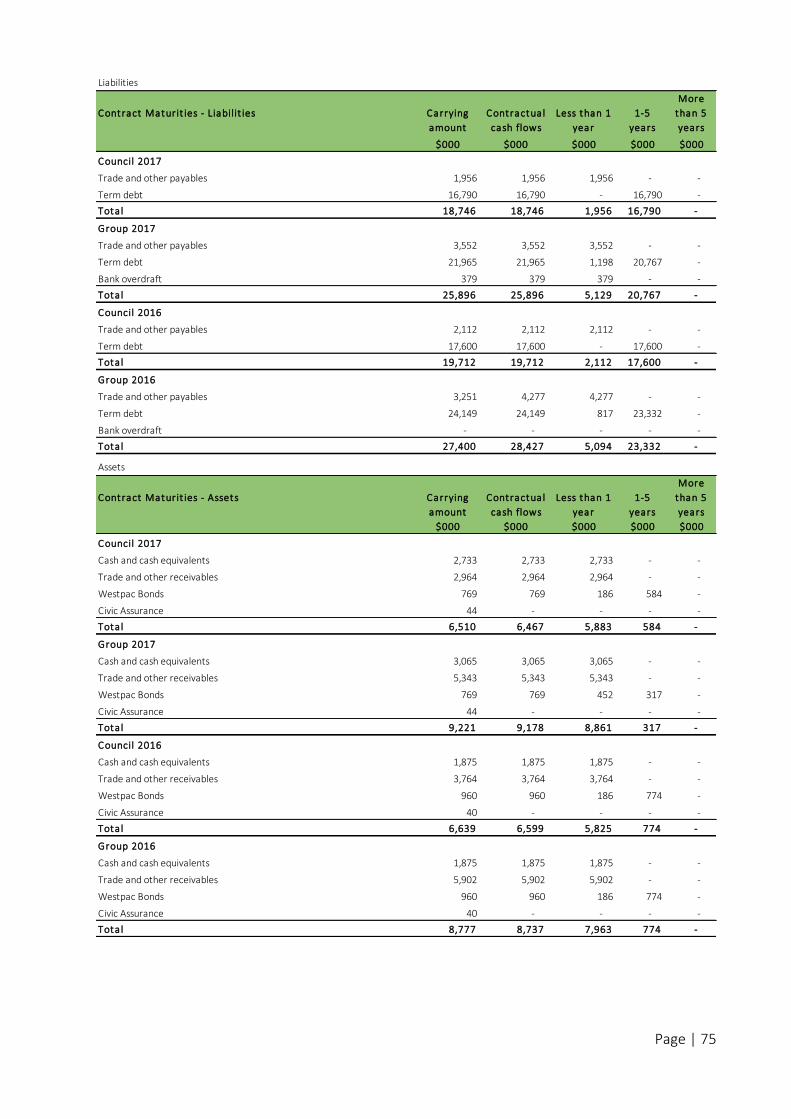
Page | 75
Liabilities
Contract Maturit ies - Liabilit ies Carrying
amount
Contractual
cash flows
Less than 1
year
1-5
years
More
than 5
years
$000 $000 $000 $000 $000
Council 2017
Trade and other payables 1,956 1,956 1,956 - -
Term debt 16,790 16,790 - 16,790 -
Tota l 18,746 18,746 1,956 16,790 -
Group 2017
Trade and other payables 3,552 3,552 3,552 - -
Term debt 21,965 21,965 1,198 20,767 -
Bank overdraft 379 379 379 - -
Tota l 25,896 25,896 5,129 20,767 -
Council 2016
Trade and other payables 2,112 2,112 2,112 - -
Term debt 17,600 17,600 - 17,600 -
Tota l 19,712 19,712 2,112 17,600 -
Group 2016
Trade and other payables 3,251 4,277 4,277 - -
Term debt 24,149 24,149 817 23,332 -
Bank overdraft - - - - -
Tota l 27,400 28,427 5,094 23,332 -
Assets
Contract Maturit ies - Assets Carrying
amount
Contractual
cash flows
Less than 1
year
1-5
years
More
than 5
years
$000 $000 $000 $000 $000
Council 2017
Cash and cash equivalents 2,733 2,733 2,733 - -
Trade and other receivables 2,964 2,964 2,964 - -
Westpac Bonds 769 769 186 584 -
Civic Assurance 44 - - - -
Tota l 6,510 6,467 5,883 584 -
Group 2017
Cash and cash equivalents 3,065 3,065 3,065 - -
Trade and other receivables 5,343 5,343 5,343 - -
Westpac Bonds 769 769 452 317 -
Civic Assurance 44 - - - -
Tota l 9,221 9,178 8,861 317 -
Council 2016
Cash and cash equivalents 1,875 1,875 1,875 - -
Trade and other receivables 3,764 3,764 3,764 - -
Westpac Bonds 960 960 186 774 -
Civic Assurance 40 - - - -
Tota l 6,639 6,599 5,825 774 -
Group 2016
Cash and cash equivalents 1,875 1,875 1,875 - -
Trade and other receivables 5,902 5,902 5,902 - -
Westpac Bonds 960 960 186 774 -
Civic Assurance 40 - - - -
Tota l 8,777 8,737 7,963 774 -
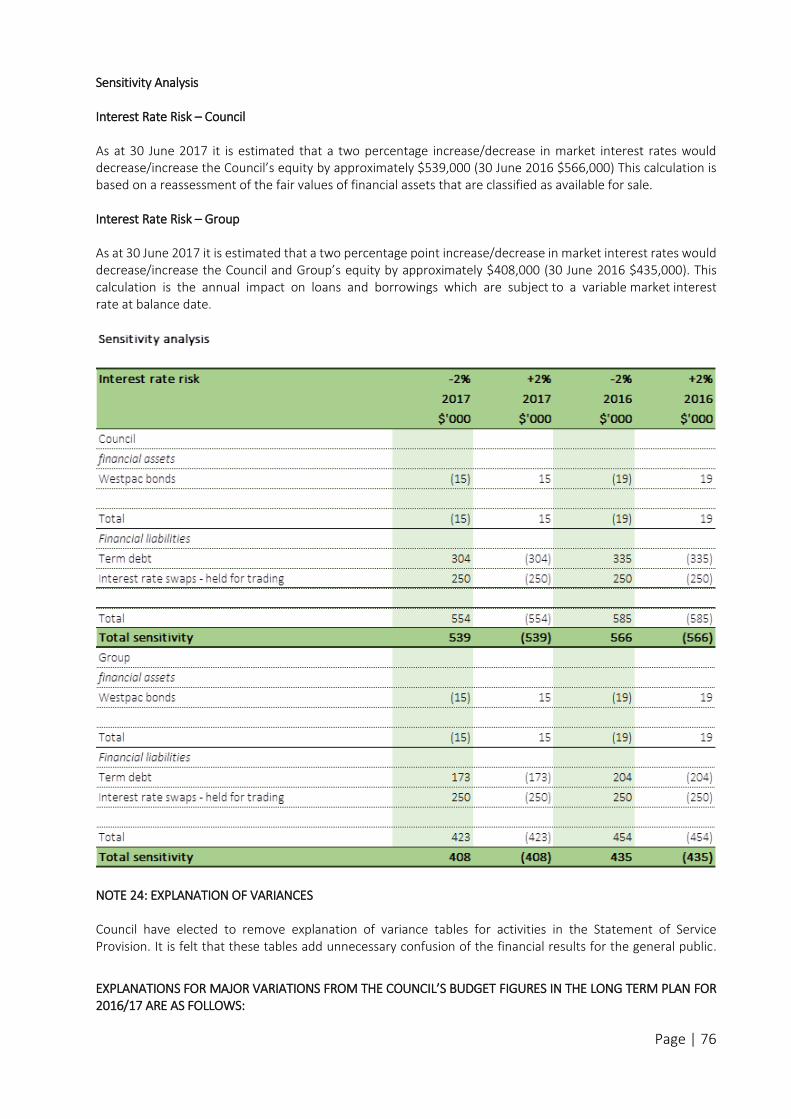
Page | 76
Sensitivity Analysis Interest Rate Risk – Council As at 30 June 2017 it is estimated that a two percentage increase/decrease in market interest rates would decrease/increase the Council’s equity by approximately $539,000 (30 June 2016 $566,000) This calculation is based on a reassessment of the fair values of financial assets that are classified as available for sale. Interest Rate Risk – Group As at 30 June 2017 it is estimated that a two percentage point increase/decrease in market interest rates would decrease/increase the Council and Group’s equity by approximately $408,000 (30 June 2016 $435,000). This calculation is the annual impact on loans and borrowings which are subject to a variable market interest rate at balance date.
NOTE 24: EXPLANATION OF VARIANCES Council have elected to remove explanation of variance tables for activities in the Statement of Service Provision. It is felt that these tables add unnecessary confusion of the financial results for the general public.
EXPLANATIONS FOR MAJOR VARIATIONS FROM THE COUNCIL’S BUDGET FIGURES IN THE LONG TERM PLAN FOR 2016/17 ARE AS FOLLOWS:
Page | 77
Statement of comprehensive revenue and expenses
The total revenue is lower than budgeted by $0.3 million mainly due to:
NZTA subsidy recognised in subsidies and grants was $0.7 million lower than budget for 2016-2017. $0.3 million of NZTA funding to be carried over to 2017-2018.
Other revenues were $0.4 million greater than budget for 2016-2017 and includes an unbudgeted $0.2 million subvention receipt from Westroads Ltd. The market value of interest rate swaps that Council hold to manage interest rate risk was higher than anticipated and resulted in a gain of $0.1 million greater than budgeted.
The total operating expenditure is higher than budget by $3.2 million due to:
Unbudgeted expenditure to repair damaged culvert pipes due to overweight vehicles $0.3 million, Sunset Point erosion control $0.2 million, Franz Josef WWTP pond remedial works $0.1 million, Blue Spur water treatment plant pH correction $0.1 million and Franz Alpine Retreat waste water proceedings $0.1 million.
Landfill provisions were $0.8 million higher than budgeted due to review and updating of methodology and calculations at year end. Better asset management data has allowed this review and updating of assumptions of the cost of the aftercare of the landfills.
Depreciation was $0.5 million higher than budgeted due to assets being revalued at the end of the last financial year and asset lives and depreciation rates updated accordingly.
Reserves funding released, Kumara Endowment Fund $150k, Franz Josef Cycleway $48k, Franz Josef Township Development Fund $35k and Kumara Township Development Fund $14k.
Current assets
The balance of cash and cash equivalents is $1.6 million lower than budget. This is due to unbudgeted expenditure depleting cash reserves.
Debtors and other receivables are $0.5 million above budget. This variance is primarily due to timing differences.
Other financial assets have increased by $1.0 million because the assets are now classified as current financial assets rather than non-current financial assets.
Non-current assets
There has been an increase of $16.0 million in relation to budget for property, plant and equipment. This variance has arisen from the 2016 revaluations of property, plant and equipment as well as additions of property, plant and equipment during the accounting period.
Other financial assets have decreased by $1.0 million because the assets are now classified as current financial assets.
Current liabilities
Creditors and other payables are $0.4 million below budget. This variance is primarily due to timing differences.
Total debt is collectively $1.9m lower than budget in current and non-current liabilities. This is due to loan funded capital expenditure not occurring and an extra debt repayment from maturing investments of $0.2 million.
Non-current liabilities
Derivative financial instruments in the form of interest rate swaps are $0.3 million greater than budgeted.
Page | 78
There are two major types of reserve funds that Council manages:
Council Created Reserve Funds
Discretionary reserves to meet Council policy objectives. These reserves often include project funds, depreciation reserves, emergency or risk management funds, rates smoothing funds, provisions and carry forwards.
Restricted Reserve Funds Reserves for which Council has a legal obligation on the use of the funds.
Council Created Reserve Funds:
Township Funds
These receive an allocation each year for development projects within those localities.
Township Development Funds are held in a reserve fund for Westland townships. To uplift the funds, the local community group/association has to work through the following steps:
a. Agree among members at a community association meeting by majority vote of members present what the funds will be spent on. The funds should enhance the well-being of the whole community in some way. Consideration is given to the number of people who will benefit, the degree to which people will benefit and the value to the wider community.
b. Minute such decision(s) in meeting minutes and email a copy of these minutes to Council. c. Generate an invoice to Council for the costs of the projects agreed on accordingly and add GST to the
amount if GST registered. d. Sign an accountability document before 12 months has expired from the time of receiving the grant.
Council has resolved to review the amounts allocated in the different rating districts within Westland during 2017/2018 in order to ensure equity for all ratepayers. Discussions have been held in 2016/2017 with the Kumara Junction Community Association, Okarito Community Association and the Bruce Bay Community Hall Board in order to achieve this in the future. The communities that went through this process for this reporting period are:
Community Association/Trust
What the funding was used for:
Kumara Residents Trust $14,000
Annual gala day expenses, community swimming pool maintenance, planning for the Chinese Reserve, brochure about Kumara, street gardens, a community event, administration expenses for KRT
Kokatahi-Kowhitirangi Community Committee $8,000
Upgrading the administration block at the Kokatahi-Kowhitirangi School
Ross Community Society $14,000
One electronic speed sign, interpretation panels, chairs for the elderly for the hall with arms, a new community noticeboard
Reserve funds
Page | 79
Hari Hari Community Association $5,000 ($9,000 held in reserve)
School and community swimming pool donation
Whataroa Community Association $14,000
Public Hall renovations
Franz Josef Community Council $35,000
Extension and refurbishment of the Community Centre and gym
Fox Glacier Community Development Society $35,000
Funding the new Fox Glacier Community Centre
Haast Promotions Group $14,000
Dennis Road Track
Asset Renewals
The main renewals from the water supply reserve were used for the Hokitika river intake and replacement of water meters
Funds from the administrative renewals reserve were used for the museum’s retail store development and to upgrade IT equipment and software to improve efficiency, service and data security.
Funds from the wastewater reserve were used for Hokitika mains upgrade.
Funds from the parks renewal were used for Sunset Point remediation work, Hokitika cemetery improvements and footpath work in Kumara.
The transportation renewals fund expended $1.8 million, with just over 50 per cent of that spent on road resurfacing. Other funds were used for drainage and structural component renewals, unsealed road metalling and pavement maintenance
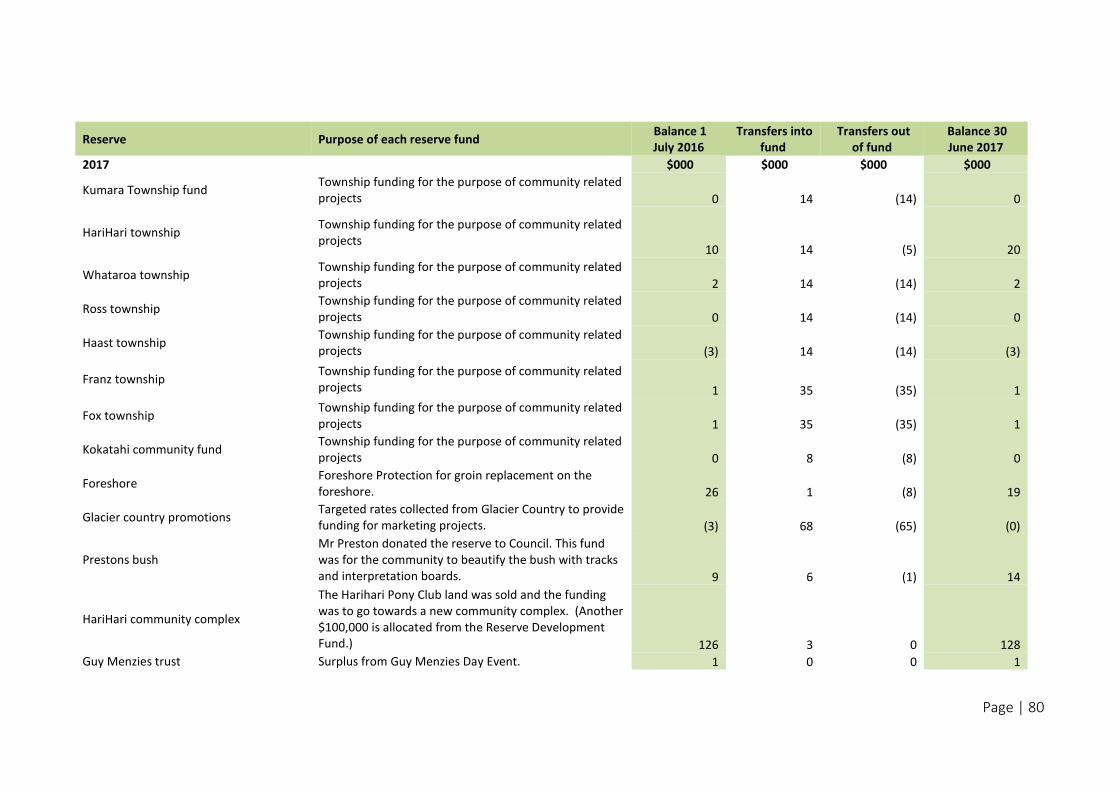
Page | 80
Reserve Purpose of each reserve fund Balance 1 July 2016
Transfers into fund
Transfers out of fund
Balance 30 June 2017
2017 $000 $000 $000 $000
Kumara Township fund Township funding for the purpose of community related projects 0 14 (14) 0
HariHari township Township funding for the purpose of community related projects
10 14 (5) 20
Whataroa township Township funding for the purpose of community related projects 2 14 (14) 2
Ross township Township funding for the purpose of community related projects 0 14 (14) 0
Haast township Township funding for the purpose of community related projects (3) 14 (14) (3)
Franz township Township funding for the purpose of community related projects 1 35 (35) 1
Fox township Township funding for the purpose of community related projects 1 35 (35) 1
Kokatahi community fund Township funding for the purpose of community related projects 0 8 (8) 0
Foreshore Foreshore Protection for groin replacement on the foreshore. 26 1 (8) 19
Glacier country promotions Targeted rates collected from Glacier Country to provide funding for marketing projects. (3) 68 (65) (0)
Prestons bush Mr Preston donated the reserve to Council. This fund was for the community to beautify the bush with tracks and interpretation boards. 9 6 (1) 14
HariHari community complex
The Harihari Pony Club land was sold and the funding was to go towards a new community complex. (Another $100,000 is allocated from the Reserve Development Fund.) 126 3 0 128
Guy Menzies trust Surplus from Guy Menzies Day Event. 1 0 0 1
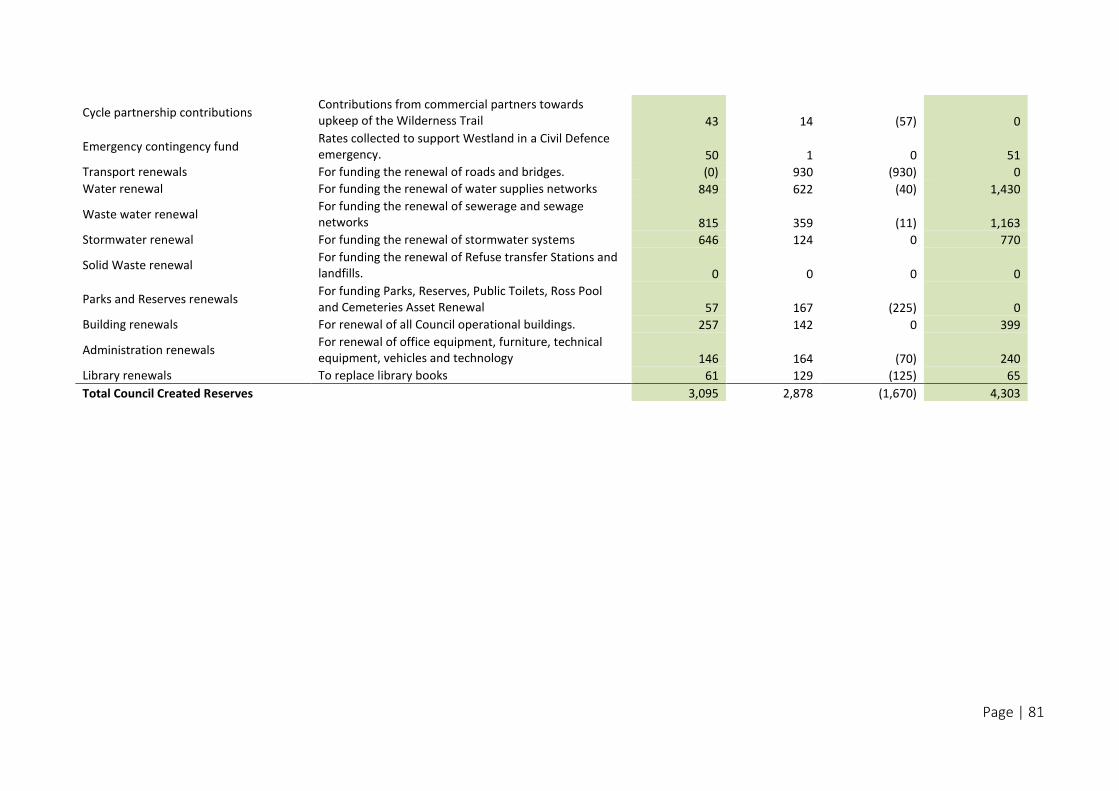
Page | 81
Cycle partnership contributions Contributions from commercial partners towards upkeep of the Wilderness Trail 43 14 (57) 0
Emergency contingency fund Rates collected to support Westland in a Civil Defence emergency. 50 1 0 51
Transport renewals For funding the renewal of roads and bridges. (0) 930 (930) 0
Water renewal For funding the renewal of water supplies networks 849 622 (40) 1,430
Waste water renewal For funding the renewal of sewerage and sewage networks 815 359 (11) 1,163
Stormwater renewal For funding the renewal of stormwater systems 646 124 0 770
Solid Waste renewal For funding the renewal of Refuse transfer Stations and landfills. 0 0 0 0
Parks and Reserves renewals For funding Parks, Reserves, Public Toilets, Ross Pool and Cemeteries Asset Renewal 57 167 (225) 0
Building renewals For renewal of all Council operational buildings. 257 142 0 399
Administration renewals For renewal of office equipment, furniture, technical equipment, vehicles and technology 146 164 (70) 240
Library renewals To replace library books 61 129 (125) 65
Total Council Created Reserves 3,095 2,878 (1,670) 4,303
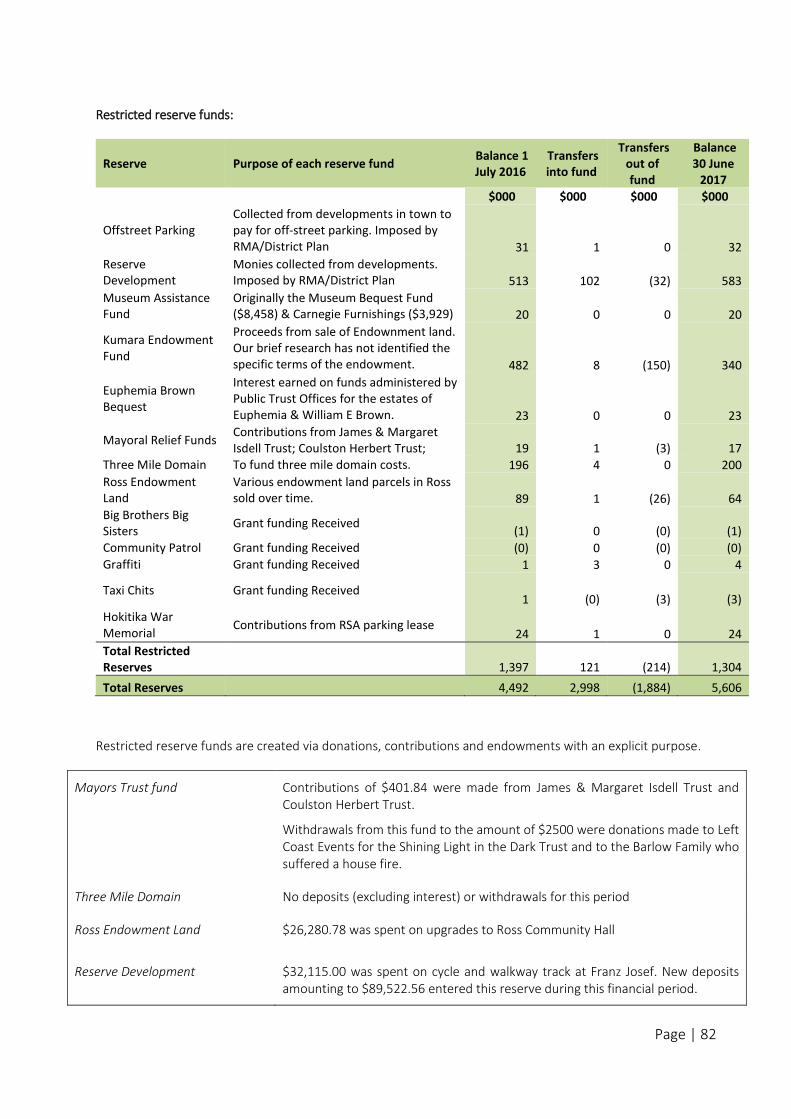
Page | 82
Restricted reserve funds:
Reserve Purpose of each reserve fund Balance 1 July 2016
Transfers into fund
Transfers out of fund
Balance 30 June
2017
$000 $000 $000 $000
Offstreet Parking Collected from developments in town to pay for off-street parking. Imposed by RMA/District Plan 31 1 0 32
Reserve Development
Monies collected from developments. Imposed by RMA/District Plan 513 102 (32) 583
Museum Assistance Fund
Originally the Museum Bequest Fund ($8,458) & Carnegie Furnishings ($3,929) 20 0 0 20
Kumara Endowment Fund
Proceeds from sale of Endownment land. Our brief research has not identified the specific terms of the endowment. 482 8 (150) 340
Euphemia Brown Bequest
Interest earned on funds administered by Public Trust Offices for the estates of Euphemia & William E Brown. 23 0 0 23
Mayoral Relief Funds Contributions from James & Margaret Isdell Trust; Coulston Herbert Trust; 19 1 (3) 17
Three Mile Domain To fund three mile domain costs. 196 4 0 200
Ross Endowment Land
Various endowment land parcels in Ross sold over time. 89 1 (26) 64
Big Brothers Big Sisters
Grant funding Received (1) 0 (0) (1)
Community Patrol Grant funding Received (0) 0 (0) (0) Graffiti Grant funding Received 1 3 0 4
Taxi Chits Grant funding Received 1 (0) (3) (3)
Hokitika War Memorial
Contributions from RSA parking lease 24 1 0 24
Total Restricted Reserves 1,397 121 (214) 1,304
Total Reserves 4,492 2,998 (1,884) 5,606
Restricted reserve funds are created via donations, contributions and endowments with an explicit purpose.
Mayors Trust fund Contributions of $401.84 were made from James & Margaret Isdell Trust and Coulston Herbert Trust.
Withdrawals from this fund to the amount of $2500 were donations made to Left Coast Events for the Shining Light in the Dark Trust and to the Barlow Family who suffered a house fire.
Three Mile Domain No deposits (excluding interest) or withdrawals for this period
Ross Endowment Land $26,280.78 was spent on upgrades to Ross Community Hall
Reserve Development $32,115.00 was spent on cycle and walkway track at Franz Josef. New deposits amounting to $89,522.56 entered this reserve during this financial period.
Page | 83
STATEMENTS OF
SERVICE PROVISION
This section contains the following information:
How Council’s activities contribute towards meeting its vision
Activity group statements
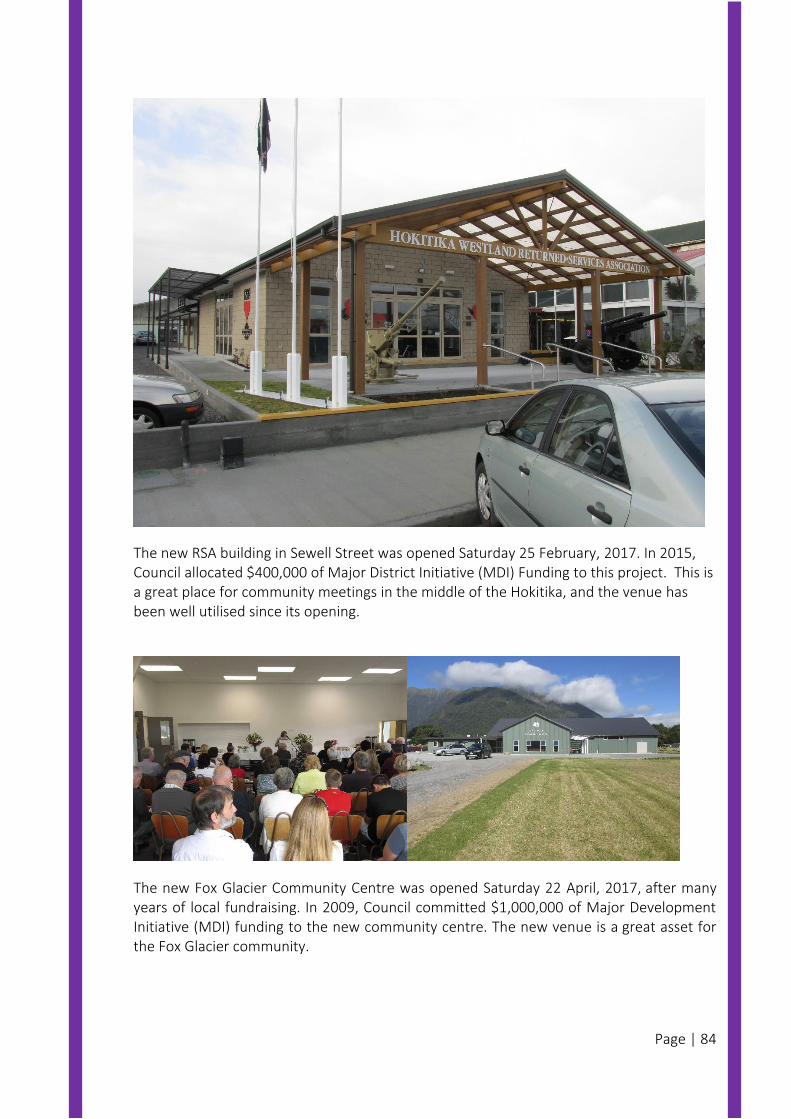
Page | 84
The new RSA building in Sewell Street was opened Saturday 25 February, 2017. In 2015, Council allocated $400,000 of Major District Initiative (MDI) Funding to this project. This is a great place for community meetings in the middle of the Hokitika, and the venue has been well utilised since its opening.
The new Fox Glacier Community Centre was opened Saturday 22 April, 2017, after many years of local fundraising. In 2009, Council committed $1,000,000 of Major Development Initiative (MDI) funding to the new community centre. The new venue is a great asset for the Fox Glacier community.
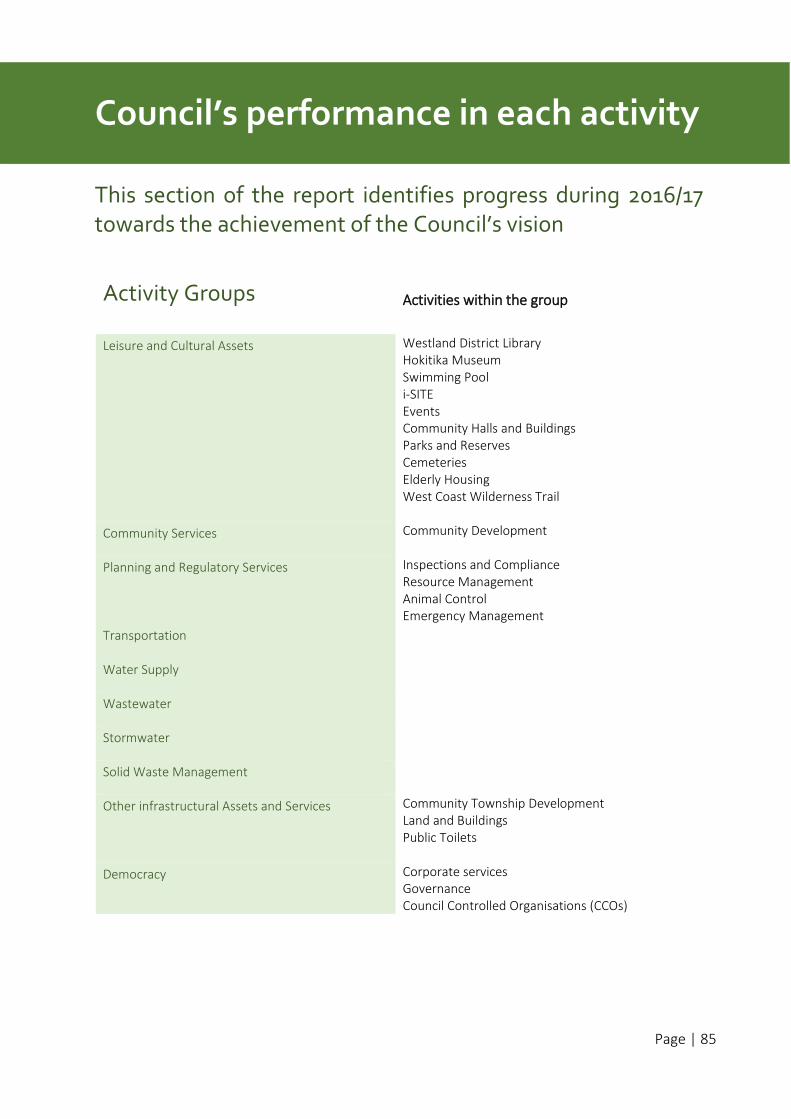
Page | 85
The following information is the extent to which we were able to deliver levels of service and to
complete projects within our budgets. In the Long Term Plan 2012/22 there are 11 Activity Groups within which the 25 Council activities sit. These are:
Activity Groups
Activities within the group
Leisure and Cultural Assets Westland District Library Hokitika Museum Swimming Pool i-SITE Events Community Halls and Buildings Parks and Reserves Cemeteries Elderly Housing West Coast Wilderness Trail
Community Services Community Development
Planning and Regulatory Services Inspections and Compliance Resource Management Animal Control Emergency Management
Transportation
Water Supply
Wastewater
Stormwater
Solid Waste Management
Other infrastructural Assets and Services Community Township Development Land and Buildings Public Toilets
Democracy Corporate services Governance Council Controlled Organisations (CCOs)
Council’s performance in each activity
This section of the report identifies progress during 2016/17 towards the achievement of the Council’s vision
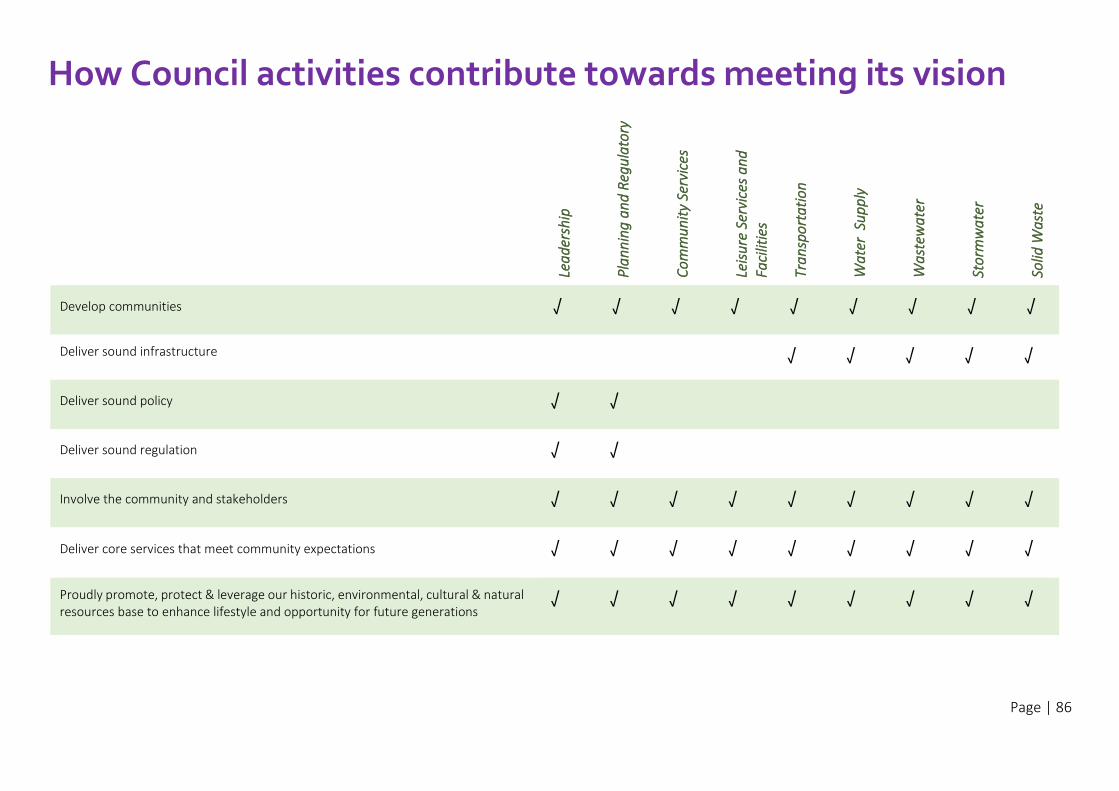
Page | 86
How Council activities contribute towards meeting its vision
Lea
der
ship
Pla
nn
ing
an
d R
egu
lato
ry
Co
mm
un
ity
Serv
ices
Leis
ure
Ser
vice
s a
nd
Fa
cilit
ies
Tra
nsp
ort
ati
on
Wa
ter
Su
pp
ly
Wa
stew
ate
r
Sto
rmw
ate
r
Solid
Was
te
Develop communities √ √ √ √ √ √ √ √ √
Deliver sound infrastructure √ √ √ √ √
Deliver sound policy √ √
Deliver sound regulation √ √
Involve the community and stakeholders √ √ √ √ √ √ √ √ √
Deliver core services that meet community expectations √ √ √ √ √ √ √ √ √
Proudly promote, protect & leverage our historic, environmental, cultural & natural resources base to enhance lifestyle and opportunity for future generations
√ √ √ √ √ √ √ √ √
Page | 87
Democracy
Corporate services
Council Controlled Organisations
An overview of the 2016/17 year: Democracy:
Meetings of Council are publicly notified in accordance with the Local Government Official Information and Meetings Act 1987, which provides the public with an opportunity to attend. Only matters where there are specific grounds under Section 48(1) of the Local Government Official Information and Meetings Act 1987 are excluded from the public sections of meetings.
During this reporting year a total of $2,500 was expended from the Mayoral Relief Fund.
Corporate Services:
In the last financial year, we moved into ‘real time’ financial reporting. This means that we are able to give Council and the public better and timelier information around our actual expenditure against our budgets. Council achieved all legal deadlines for our reporting and planning documentation.
After several years of understaffing in the finance area, Council now has filled all these vacancies. Once the new staff have settled into their positions, we are looking forward to becoming more proactive in adding value to this area and other areas of Council.
Staff are continuing to focus on collecting more from our debtors. This includes an intensive exercise in helping ratepayers to set up repayment plans. The resultant lessening debt shows how successful this has been. This process has also been assisted by the use of electronic invoicing, giving more customers the opportunity to receive invoices by email rather than through the postal system (which can result in payment delays).
We are continuing to look at our methods for communicating with our customers in an efficient manner; spending less by reducing print material while reaching out to more audiences: our use of radio advertising, our Westland Matters electronic newsletter, Facebook account and public meetings continue to be important tools. We also use our website to display all important documents and messages.
Activity group: Leadership
Page | 88
Our website revamp project started during the financial year, and is expected to be completed within the next few months. The revamp is intended to improve user-friendliness, search and navigation functions and compatibility with mobile devices. It will also contain links to other related websites.
The Information Systems area filled a long standing vacancy during the financial year. This has been a huge factor in providing a more efficient service for Council.
Westland District Council continues to work with the other West Coast councils on a collaborative approach to all new IT projects.
Wi-Fi has been established throughout all of Council’s buildings and facilities. We have installed a public and a private Wi-Fi network.
The combined Customer Service Centre and Hokitika i-SITE has been active for two years now. The multi-tasking staff have been doing an excellent job in balancing the needs of the Council customers with the different needs of tourists. With tourism increasing, the i-SITE saw increased numbers of tourists through the doors with very diverse information requirements.
The i-SITE also provide a service on behalf of the Automobile Association, which is important as this is the only place in Hokitika where this service is offered.
Council Controlled Organisations:
Council Controlled Organisations are separate entities in which Council owns 50% or more of the voting rights.
There were several retirements and appointments of Directors for most of Council’s CCOs during this financial period, with the exception of Westroads.
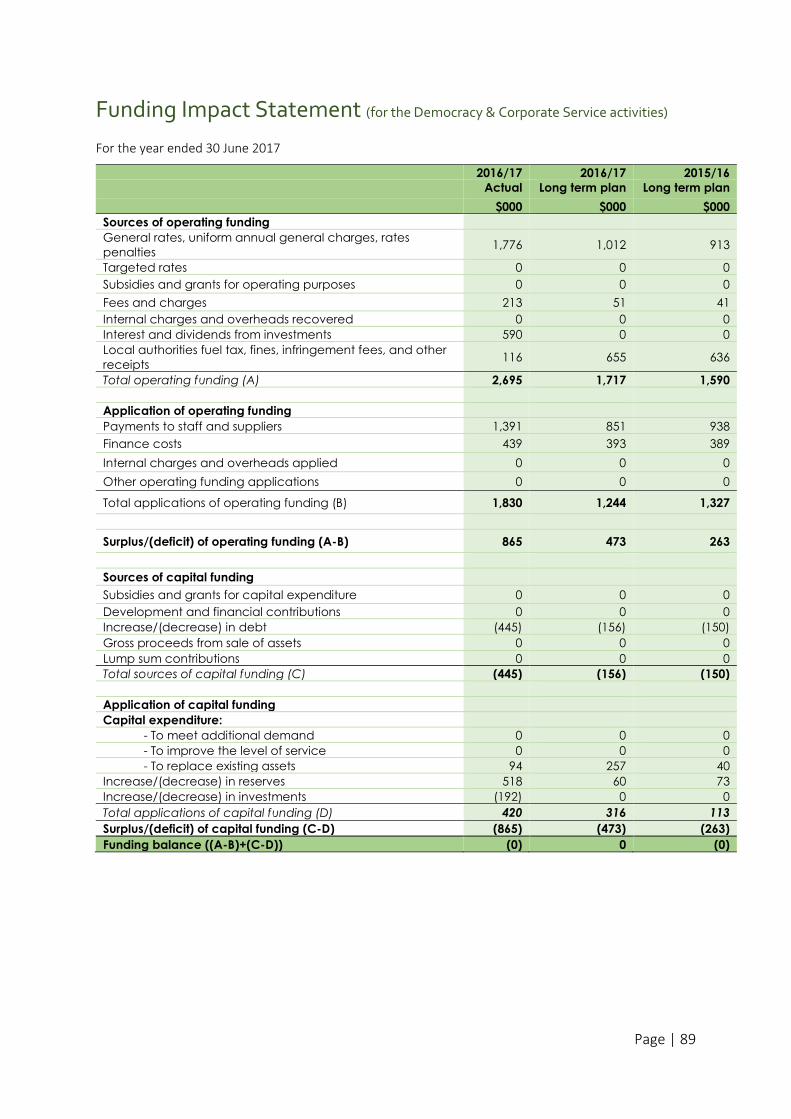
Page | 89
Funding Impact Statement (for the Democracy & Corporate Service activities)
For the year ended 30 June 2017
2016/17 2016/17 2015/16
Actual Long term plan Long term plan
$000 $000 $000
Sources of operating funding
General rates, uniform annual general charges, rates
penalties 1,776 1,012 913
Targeted rates 0 0 0
Subsidies and grants for operating purposes 0 0 0
Fees and charges 213 51 41
Internal charges and overheads recovered 0 0 0
Interest and dividends from investments 590 0 0
Local authorities fuel tax, fines, infringement fees, and other
receipts 116 655 636
Total operating funding (A) 2,695 1,717 1,590
Application of operating funding
Payments to staff and suppliers 1,391 851 938
Finance costs 439 393 389
Internal charges and overheads applied 0 0 0
Other operating funding applications 0 0 0
Total applications of operating funding (B) 1,830 1,244 1,327
Surplus/(deficit) of operating funding (A-B) 865 473 263
Sources of capital funding
Subsidies and grants for capital expenditure 0 0 0
Development and financial contributions 0 0 0
Increase/(decrease) in debt (445) (156) (150)
Gross proceeds from sale of assets 0 0 0
Lump sum contributions 0 0 0
Total sources of capital funding (C) (445) (156) (150)
Application of capital funding
Capital expenditure:
- To meet additional demand 0 0 0
- To improve the level of service 0 0 0
- To replace existing assets 94 257 40
Increase/(decrease) in reserves 518 60 73
Increase/(decrease) in investments (192) 0 0
Total applications of capital funding (D) 420 316 113
Surplus/(deficit) of capital funding (C-D) (865) (473) (263)
Funding balance ((A-B)+(C-D)) (0) 0 (0)
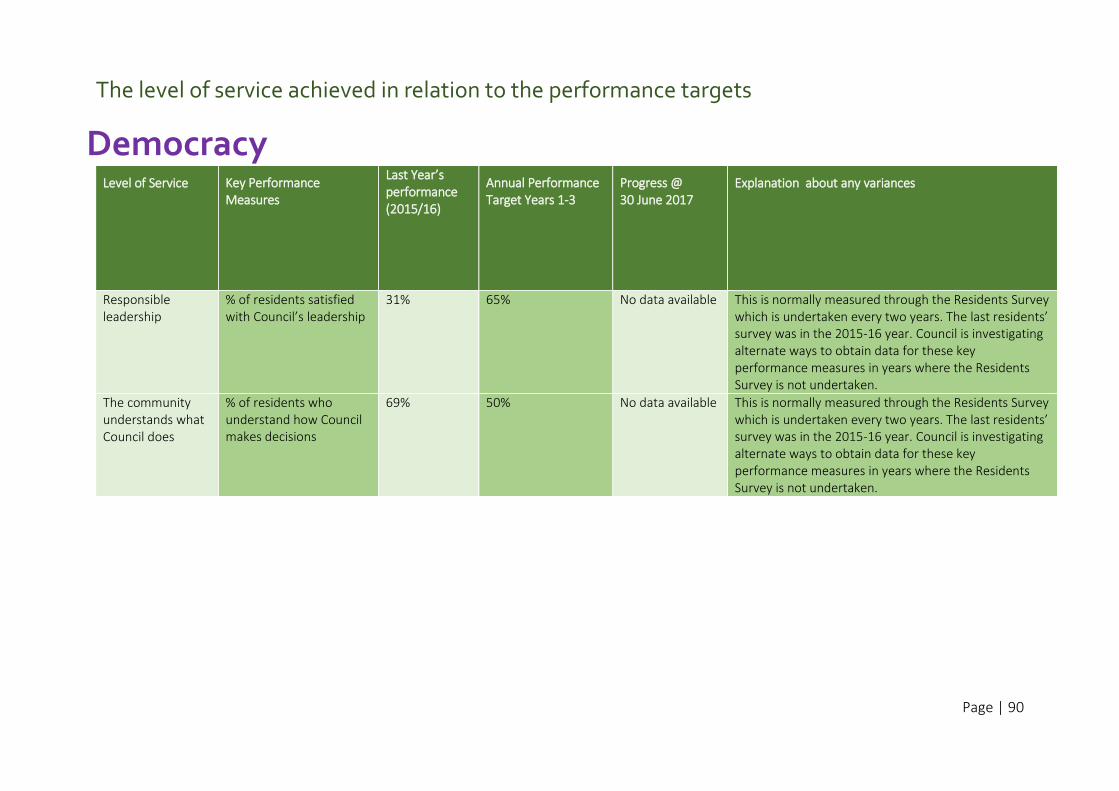
Page | 90
The level of service achieved in relation to the performance targets
Democracy Level of Service Key Performance
Measures
Last Year’s performance (2015/16)
Annual Performance Target Years 1-3
Progress @ 30 June 2017
Explanation about any variances
Responsible leadership
% of residents satisfied with Council’s leadership
31% 65% No data available This is normally measured through the Residents Survey which is undertaken every two years. The last residents’ survey was in the 2015-16 year. Council is investigating alternate ways to obtain data for these key performance measures in years where the Residents Survey is not undertaken.
The community understands what Council does
% of residents who understand how Council makes decisions
69% 50% No data available This is normally measured through the Residents Survey which is undertaken every two years. The last residents’ survey was in the 2015-16 year. Council is investigating alternate ways to obtain data for these key performance measures in years where the Residents Survey is not undertaken.
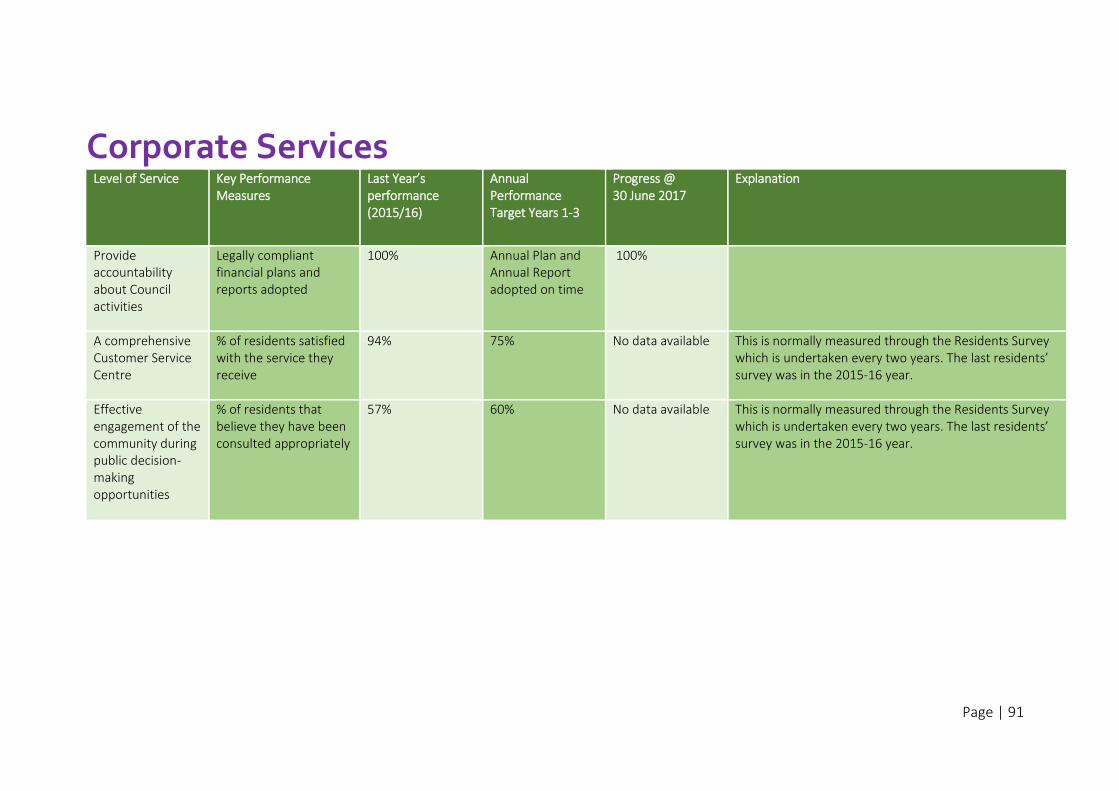
Page | 91
Corporate Services Level of Service Key Performance
Measures Last Year’s performance (2015/16)
Annual Performance Target Years 1-3
Progress @ 30 June 2017
Explanation
Provide accountability about Council activities
Legally compliant financial plans and reports adopted
100% Annual Plan and Annual Report adopted on time
100%
A comprehensive Customer Service Centre
% of residents satisfied with the service they receive
94% 75% No data available This is normally measured through the Residents Survey which is undertaken every two years. The last residents’ survey was in the 2015-16 year.
Effective engagement of the community during public decision-making opportunities
% of residents that believe they have been consulted appropriately
57% 60% No data available This is normally measured through the Residents Survey which is undertaken every two years. The last residents’ survey was in the 2015-16 year.
Page | 92
Council Controlled Organisations
Westland Wilderness Trust:
The Westland Wilderness Trust has not met in the past year and there are no audit requirements as per 24 November 2015 resolution.
Tourism West Coast and West Coast Rural Fire Authority:
Council takes a governance / advisory role with any contributions included in Council’s normal operation. Neither organisation is required to produce an annual report.
Commercial reporting entities controlled by Westland District Council:
Level of Service Key Performance Measures Last Year’s performance (2015/16)
Annual Performance Target Years 1-3
Progress @ 30 June 2017
Explanation
CCOs comply with their Statements of Intent
All performance measures in the CCO Statement of Intent are met, as reported in half yearly and annual reports
76% 100% 70%
(26 of 37)
- Westland Holdings achieved 12 out of 19 measures (including those that weren’t applicable during this financial period)
- Westland District Property achieved 7 out of 9
- Westroads achieved 3 of 4 - Hokitika Airport Limited achieved 4 of 5
Page | 93
Westland Holdings Limited
Directors:
Quentin Hix (Chairman) – Retired on 30 November 2016
Simon Bastion (Deputy Chair) – Retired on 30 November 2016
Gabrielle Wall – Retired on 30 November 2016
Kaye McNabb – Retired on 30 November 2016
Graeme King – Appointed as new Chairman following Quentin Hix’s retirement
Cr David Carruthers (appointed as Director on 15 December 2016)
Cr Desmond Routhan (appointed as Director on 24 November 2016)
Established July 2002.
Westland Holdings Limited (WHL) is the governance link between Council and its trading entities. The Company is responsible for ensuring the trading organisations meet their statutory, commercial and public obligations as defined in their Annual Statements of Intent. These are reviewed by WHL on behalf of Council, with reference to the objectives determined in the Long Term Plan 2015-2025, along with each company’s individual strategy. This report concentrates on the performance objectives contained in the Long Term Plan. The performance of the companies is extensively examined in their own Annual Reports.
Key Objective:
‘To achieve the objectives of the shareholder, Westland District Council, both commercially and non-commercially as specified in the Statement of Intent in a manner that recognises sound business practice, good employer obligations and social and environmental responsibility.’
Key Performance Measures: Achieved?
A draft SI for WHL will be submitted for approval to WDC by 1 March each year.
Not achieved: No draft submitted
A completed SI will be submitted to WDC by 30 June each year. Achieved: Final submitted 28 June 2017
At least two progress reports be made to WDC in the financial year (in addition to reporting on specific issues), with at least one presentation made to Councillors. Reports will include financial and non-financial performance.
Not Achieved: Due to review of CCO’s structure taking place and extensive change of Board in 2016/17
Major matters of urgency are reported to the appropriate Council Committee or the CE of WDC within three days.
No matters of urgency
Page | 94
The Chair will initiate an independent formal evaluation of the WHL directorate bi-annually.
Not Achieved this year: Evaluation in progress at 30 June 2016 but not completed due to significant changes in the Board. To be completed by 30 June 2018
To review the training needs of individual WHL directors, and ensure training is provided where required.
Not Achieved: Due to extensive change of Board in 2016/17
The process followed for each appointment to a subsidiary board is transparent, fully documented and reported to WDC.
Not Achieved: Appointments to subsidiaries made directly by WDC
WHL negotiates with WDC to pay an achievable distribution for the 2016/17 financial year prior to finalising WDC’s budget
No negotiation: the distribution figure was finalised during the approval of the SOI
To meet budgeted level of distribution income of $500K for the 2016/17 financial year
Not Achieved: Subvention payments of $240K to WDC
That the adopted directors’ policy be followed for any director appointments made.
WDC appointed directors to subsidiaries
Draft Statements of Intent to be received from subsidiary companies by 14 February.
Achieved: HAL & WDPL received 2 February 2017; Westroads 30 January
WHL will direct the subsidiary companies to produce commercially focused Statements of Intent that are cognisant of their responsibilities to the social and environmental needs of the communities of Westland.
Not changed year ended 30 June 2017
WHL will assess the alignment of the Statements of Intent with any specifically notified WDC strategic directive.
No directive notified
Subsidiary company Statements of Intent to incorporate specific reporting requirements in accordance with legislation and accepted practice.
Achieved
All activity reports and formal reporting will be done through the Chairman of WHL and the CE of WDC.
Not Achieved: Some reporting direct to WDC
Subsidiary company Statement of Intent’s to incorporate specific statements regarding the processes for the management of risk exposures, including reputational risk.
Achieved
Long term Investment assessment is carried out for any new projects. These must be assessed and approved by Council prior to initiating significant projects.
No projects to be assessed this year
Targeted Ratio of Shareholders funds to total assets shall not be less than 50% for the period covered by the Statement of Intent.
Achieved: 57.99%
Page | 95
Westland District Property Limited
Ian Hustwick - Joined the board as Chairperson on 31 December 2016
Richard Benton - Joined the board as Director on 31 December 2016
Pauline Cox - Joined the board as Director on 31 December 2016
Cr Latham Martin - Joined the board as Director on 12 March 2017
Graeme Purches – Former Chairperson – Resigned from role effective 31 December 2016
Les Singer – Former Director – Resigned from role effective 28 February 2017
Established May 2010.
Westland District Property Limited (WDPL) manages Council’s property portfolio; which has both commercial and public benefit elements. The former involves properties for sale, licenses to occupy and mining rights. The latter is the management of Pensioner Housing, Hokitika Swimming Pool and Jackson Bay Wharf.
Key Objective:
‘To manage the ownership and operation of the property portfolio in a commercial and strategic manner that will by year 2030 provide a return that contributes to the majority of the General Rate requirement of Council, and to become involved in strategic property development or investment, which will benefit the District and the Company, as opportunities arise.’
Key Performance Measures: Achieved?
Aged Care annual percentage occupancy to be no less than 95%.
Achieved – 100%
Swimming pool annual total admissions to be +- 5% those of the previous year.
Not achieved
16,849 admissions 2016/2017 (-7.8%). This number excludes one week in February for which no accurate data is available, although management has estimated admissions for this week to be 450.
Baches on Road Reserve annual number of licenses to occupy to be greater than 70.
Achieved
76 signed agreements to occupy (2016: 60)
5 applications in process (2016: 18)
10 signed agreements – season sites (2016: 8)
9 signed agreements – other occupations (2016:7)
Jacksons Bay Wharf annual percentage of commercial fishing vessels who use the wharf with licenses = 90%
Achieved
100% of the major fishing vessels (2016:100%). This excludes casual users
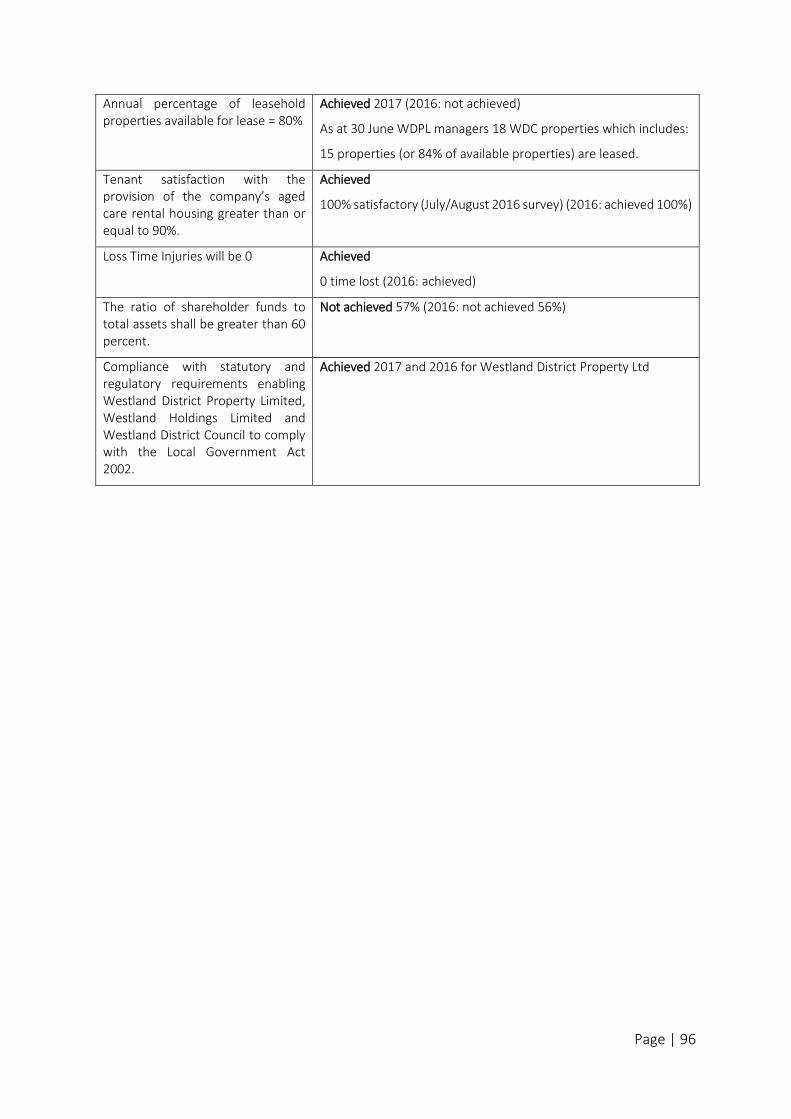
Page | 96
Annual percentage of leasehold properties available for lease = 80%
Achieved 2017 (2016: not achieved)
As at 30 June WDPL managers 18 WDC properties which includes:
15 properties (or 84% of available properties) are leased.
Tenant satisfaction with the provision of the company’s aged care rental housing greater than or equal to 90%.
Achieved
100% satisfactory (July/August 2016 survey) (2016: achieved 100%)
Loss Time Injuries will be 0 Achieved
0 time lost (2016: achieved)
The ratio of shareholder funds to total assets shall be greater than 60 percent.
Not achieved 57% (2016: not achieved 56%)
Compliance with statutory and regulatory requirements enabling Westland District Property Limited, Westland Holdings Limited and Westland District Council to comply with the Local Government Act 2002.
Achieved 2017 and 2016 for Westland District Property Ltd
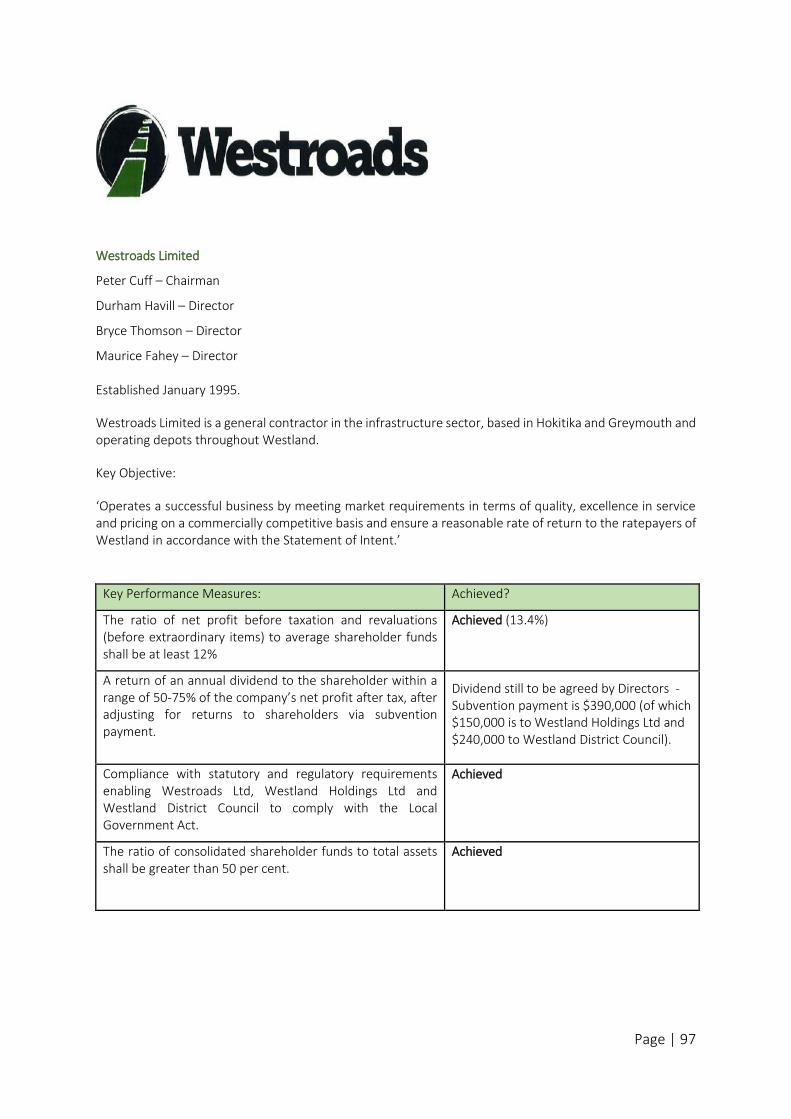
Page | 97
Westroads Limited
Peter Cuff – Chairman
Durham Havill – Director
Bryce Thomson – Director
Maurice Fahey – Director Established January 1995.
Westroads Limited is a general contractor in the infrastructure sector, based in Hokitika and Greymouth and operating depots throughout Westland.
Key Objective:
‘Operates a successful business by meeting market requirements in terms of quality, excellence in service and pricing on a commercially competitive basis and ensure a reasonable rate of return to the ratepayers of Westland in accordance with the Statement of Intent.’
Key Performance Measures: Achieved?
The ratio of net profit before taxation and revaluations (before extraordinary items) to average shareholder funds shall be at least 12%
Achieved (13.4%)
A return of an annual dividend to the shareholder within a range of 50-75% of the company’s net profit after tax, after adjusting for returns to shareholders via subvention payment.
Dividend still to be agreed by Directors - Subvention payment is $390,000 (of which $150,000 is to Westland Holdings Ltd and $240,000 to Westland District Council).
Compliance with statutory and regulatory requirements enabling Westroads Ltd, Westland Holdings Ltd and Westland District Council to comply with the Local Government Act.
Achieved
The ratio of consolidated shareholder funds to total assets shall be greater than 50 per cent.
Achieved
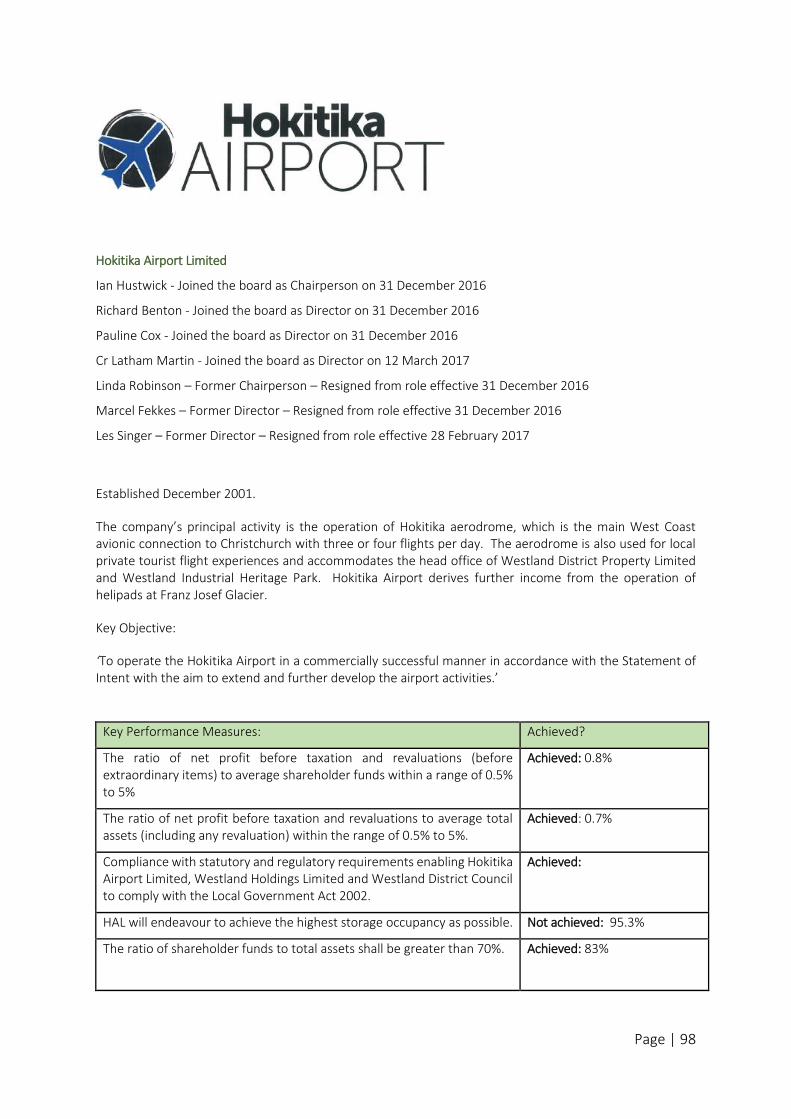
Page | 98
Hokitika Airport Limited
Ian Hustwick - Joined the board as Chairperson on 31 December 2016
Richard Benton - Joined the board as Director on 31 December 2016
Pauline Cox - Joined the board as Director on 31 December 2016
Cr Latham Martin - Joined the board as Director on 12 March 2017
Linda Robinson – Former Chairperson – Resigned from role effective 31 December 2016
Marcel Fekkes – Former Director – Resigned from role effective 31 December 2016
Les Singer – Former Director – Resigned from role effective 28 February 2017
Established December 2001.
The company’s principal activity is the operation of Hokitika aerodrome, which is the main West Coast avionic connection to Christchurch with three or four flights per day. The aerodrome is also used for local private tourist flight experiences and accommodates the head office of Westland District Property Limited and Westland Industrial Heritage Park. Hokitika Airport derives further income from the operation of helipads at Franz Josef Glacier.
Key Objective:
‘To operate the Hokitika Airport in a commercially successful manner in accordance with the Statement of Intent with the aim to extend and further develop the airport activities.’
Key Performance Measures: Achieved?
The ratio of net profit before taxation and revaluations (before extraordinary items) to average shareholder funds within a range of 0.5% to 5%
Achieved: 0.8%
The ratio of net profit before taxation and revaluations to average total assets (including any revaluation) within the range of 0.5% to 5%.
Achieved: 0.7%
Compliance with statutory and regulatory requirements enabling Hokitika Airport Limited, Westland Holdings Limited and Westland District Council to comply with the Local Government Act 2002.
Achieved:
HAL will endeavour to achieve the highest storage occupancy as possible. Not achieved: 95.3%
The ratio of shareholder funds to total assets shall be greater than 70%. Achieved: 83%
Page | 99
Inspections and Compliance
Resource Management
Emergency Management
Animal Control
An overview of the 2016/17 year: Inspections and Compliance:
Building:
Council’s existing Building Control Authority Accreditation has been maintained for the reporting period. Following the conclusion of this financial period, in September 2017, Council’s Building Consent Authority (BCA) was reaccredited, following the biennual review by IANZ in July and subsequent work to address the auditors’ suggestions around documentation and processes. Council were pleased to have cleared the audit so quickly. This signals that Council are well-equipped to deliver a high-quality service to our customers.
For this reporting period Council processed all new building consents via the AlphaOne system. Only amendments to existing paper-based consents (before the adoption of AlphaOne) were processed manually. 216 building consents were issued via AlphaOne, of which 214 met the required timeframe (a percentage of 99.07%). The average processing time for building consents lodged in AlphaOne is 10 days (9.977). There were 14 manual building consents issued, in an average time of nine days. Only one of the manual consents went over time, giving a percentage of manual building consents completed on time of 92.86% (this has been rounded to 93% in KPI table). This means that there has been a reduction of two days in the average processing time of manual building consents from the last financial year (and a minimal reduction in the average processing time of building consents through AlphaOne of about half a day – despite an increase of three times the volume of building consents lodged this way). So although there are still some technical issues with AlphaOne to work through (see below) this indicates that significant progress has been made during this period.
The Building Department had no staffing changes during this reporting period, although approval was gained to advertise for a Senior Building Control Officer. This vacancy has not yet been filled. The use of external contractors has increased again in proportion with the applications being lodged, in order to achieve its statutory timeframes for issuing consents.
It is noted that the AlphaOne processing system, which is well-regarded nationwide, is quite time-consuming, in part because the data streams between Alpha One (the nationwide processing tool) and NCS (our internal building control database) are disjointed. This still needs further development. In the interim, Council’s Business Support Officer has had to manually re-enter and re-input information to improve accuracy of data and reporting, and remove variations and discrepancies.
Activity group: Planning and Regulatory
Page | 100
The team has continued its collaborative relationship with the other West Coast Building Consent Authorities (BCAs), in order to share training opportunities and reduce overall costs for implementing and delivering shared services. Council’s building control team has also been involved with carrying out inspections for Grey District Council. Buller District Council have assisted our team with processing. In addition, the team has been working on a reciprocal agreement (which is close to sign-off) with other AlphaOne system users nationwide to share building consent processes and auditing functions.
Council remains a part of the “Mainland Group” of BCAs / Territorial Authorities and participates in quarterly meetings.
Environmental Health:
The percentage of food premises that Council is required to audit has decreased in this financial year. This is due to premises under National Programmes now required to be inspected by an Independent Verifier and anyone on a Custom Plan being directly audited by the Ministry for Primary Industries. This has led to 12 less premises for the Council to audit, thus reducing the income from audit fees payable to Council.
Good progress has been made regarding visiting and educating food premises about new food control plans under the Food Act 2014 changes. Every single food premise in the District has had the changes explained to them in person and in writing. All on-licence and high-risk food premises, which were required by law to have their food control plans in place by March 2017, have done so. These businesses will receive their first audit within the next 12 months. The Council’s Environmental Officer has started work during this financial year with a second group of lower risk food premises who are required to have their food plans in place by March 2018.
During the 2016-17 financial year, two Regional Liquor Licencing meetings were held, attended by Police, the Medical Officer of Health and Council Licensing Inspectors. In addition to the regional meetings, monthly local meetings for the Westland District were also held and attended by representatives from the same groups. A Liquor Licensing Hearing was held in August 2016 for a new off licence premises in Hokitika. This application was successful and the business has commenced operations.
Resource Management:
During this reporting year the Planning team was challenged again by not having a full complement of staff. The Planning Manager position was vacant for the majority of the financial year. Fiona Scadden, who was appointed to the position of Senior Planner which was being recruited for at the end of the last financial year, moved into the Planning Manager position to fill this gap. This meant that the Senior Planner position was once again vacant. There were several resource consents inherited from the previous financial year which had exceeded statutory timeframes and were finalised this year, leading to figures being skewed. Despite this, the Resource management and planning team managed to achieve 77.06% compliance with statutory timeframes. Staff responded to one Environment Court appeal during this financial year. This appeal was related to land use consent for a campground in a residential area. This appeal is ongoing and will go to mediation in the next financial year. The Plan Change 7 was withdrawn following the election of the new Council in late 2016. Again, further work on the District Plan Review has not been undertaken due to insufficient staffing levels. No Development and Stakeholder meetings were held during this period, however, these are expected to resume in the new financial year.
Page | 101
An extensive review of the resource consents function and systems was undertaken and improvements have been implemented as a result of the review. These include creating new processes for handling public enquiries and for notification reports and vetting of incoming applications. The resource management and planning team has also allowed for greater flexibility in terms of responding to requests for information using electronic platforms. The new Duty Planner system was introduced to enable the public to have access to a Planner as much as possible while ensuring efficiency with processing applications. If a member of the public requests a specific planner they will be made available but for general queries they are forwarded to the Planner on duty at that allocated time. Further to this, Council has a shared Planner inbox which allows emails to be accessible to all planning staff so that whoever is available can respond, avoiding delays.
Collaboration continued with other West Coast Councils on potential joint policy review and has led to joint submissions with the West Coast Regional Council, Buller District Council and Grey District Council on national policy reforms. One of the main joint submissions the Council made in this period was regarding National Planning Standards. Council staff also attended workshops regarding the Regional Policy Statement.
Council’s planning and regulatory fees (including building control and environmental health) remain unchanged from those as at 30 June 2016.
Changes to the RMA came into effect from 19th April 2017, which (most relevant to Westland) require Councils to manage the risks of natural hazards as a matter of national importance and introduced new plan making options and requirements. Further changes will come into effect from 1st October 2017 which will shape the District Plan review in the new financial year.
Emergency Management (Civil Defence and Rural Fire):
A changing West Coast Civil Defence Group: In October 2016 a new full-time Emergency Management Officer (EMO) for Westland District Council was appointed. This was the first step in moving towards shared civil defence personnel roles between West Coast Regional Council and local District Councils. The Council’s Emergency Management Officer also fulfils the Group Welfare Manager responsibilities for the region. Training and capacity building: Sixteen council staff plus volunteers took part in Comprehensive First Aid training courses this year, delivered by Tai Poutini Polytechnic. The Council provided Civil Defence Centre training in Franz Josef in December 2016, which was also attended by several residents from Fox Glacier. In April 2017, the Emergency Management Officer also ran a community Civil Defence training day and exercise in Franz Josef. Two council staff, plus volunteers and representatives from other businesses (including Police, Department Of Conservation and Westland Milk Products) attended a three day Coordinated Incident Management System training (CIMS 4) delivered by Tai Poutini Polytechnic. In addition one-on-one and small group information sessions have been provided for Council staff to revise their responsibilities and roles for responding to a Civil Defence emergency. Kaikoura earthquake: In support of the Kaikoura Earthquake on 14 November 2016, Westland District Council deployed several staff to Kaikoura to assist with the response. These roles included a Public Information Advisor, Building Inspectors, and a Group Welfare Manager.
Page | 102
Adverse weather events So far this year we have experienced a number of localised events, involving high rainfall and wind from weather bombs and cyclonic activity. Although none of these have required a formal civil defence response, they did require Council to have a team on stand-by, and connect with communities and groups who were, or could have been, affected. These activities helped generate interest from local Hokitika businesess and residences to develop a Hokitika Flood Action plan. This action plan has been drafted and is expected to be distributed to relevant agencies and interested parties for input by the end of 2017. Community engagement / Public education: There have been multiple opportunities taken to increase community education and engagement with Civil Defence. To this end Westland District Council’s Emergency Management Officer delivered presentations to community and volunteer groups across the district including Westland Soroptimists, Early Childcare Centres and Probus. An emphasis on working with youth has involved a range of activities including displays and activities at Westland District Library, mini information sessions delivered through the Clued Up Kids Programme to children aged 10 – 12 years. In addition, the YES Programme was delivered to familiarise youth aged 16-20 with the five main emergency services groups over a period of months, culminating in these youth volunteering their services for one of these groups for a two-month period. Community planning and resilience activities: The Council also provided a number of community planning and resilience activities for the Hokitika, Franz Josef, Fox Glacier, Haast and Okarito townships.
Rural Fire:
There was one Rural Fire Officer appointed within this district which proved to be effective. Support has been provided both within the region and outside of the region on request. Council prepared for the Rural Fire transition to Fire Emergency New Zealand (FENZ) which was to come into effect on 1 July 2017.
Animal Control:
The Hokitika SPCA retained the Council’s dog control contract.
The Council’s new Dog Control Policy adopted on 30th June 2016 came into effect on 1 July 2016. This saw the addition of two new classes of dog ownership, these being Working Dogs and Selected Dog Owners. This change delayed the annual dog registration start period to 1st October (previously 1st August).
Animal control incidents were relatively low this year comparative to recent years.
A notable event was that Council obtained a $13,000 subsidy from Department of Internal Affairs (DIA) to provide free neutering of residents’ “menacing” dogs. We had a 40 per cent uptake of this offer (out of dogs deemed to be menacing according to DIA guidelines in our district). This offer was advertised on our website and we were one of 30 councils nationwide that obtained this subsidy.
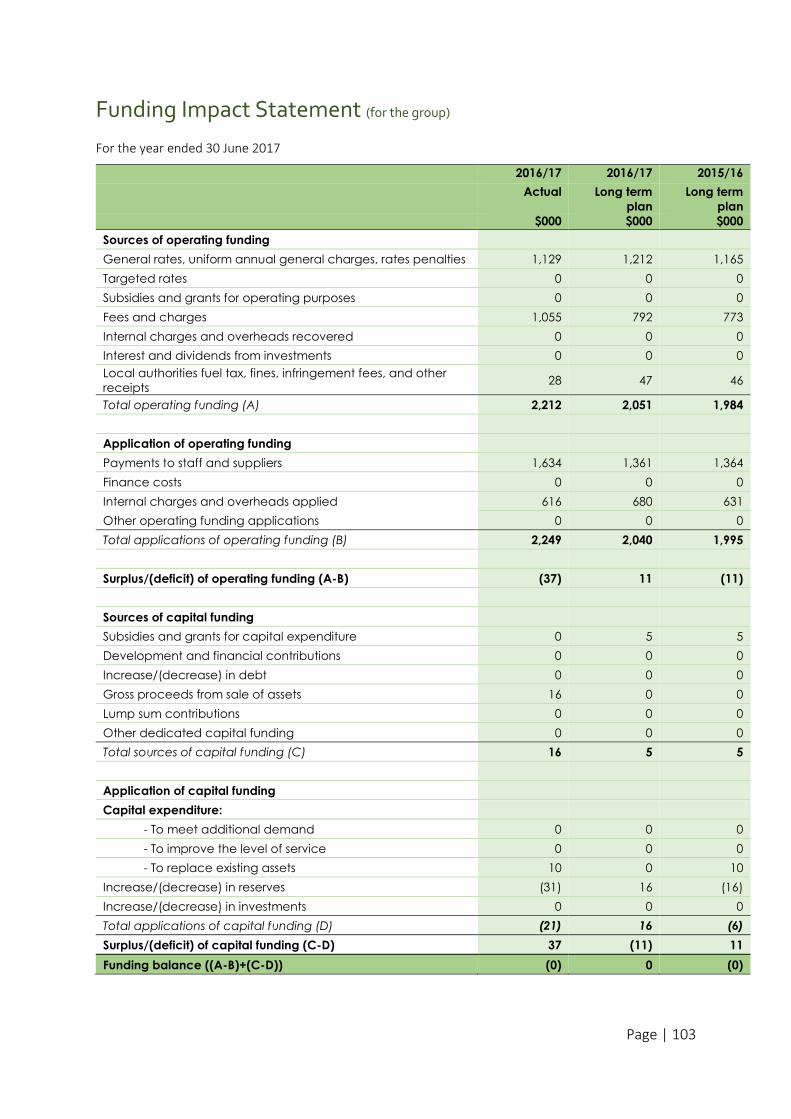
Page | 103
Funding Impact Statement (for the group)
For the year ended 30 June 2017
2016/17 2016/17 2015/16
Actual Long term
plan
Long term
plan
$000 $000 $000
Sources of operating funding
General rates, uniform annual general charges, rates penalties 1,129 1,212 1,165
Targeted rates 0 0 0
Subsidies and grants for operating purposes 0 0 0
Fees and charges 1,055 792 773
Internal charges and overheads recovered 0 0 0
Interest and dividends from investments 0 0 0
Local authorities fuel tax, fines, infringement fees, and other
receipts 28 47 46
Total operating funding (A) 2,212 2,051 1,984
Application of operating funding
Payments to staff and suppliers 1,634 1,361 1,364
Finance costs 0 0 0
Internal charges and overheads applied 616 680 631
Other operating funding applications 0 0 0
Total applications of operating funding (B) 2,249 2,040 1,995
Surplus/(deficit) of operating funding (A-B) (37) 11 (11)
Sources of capital funding
Subsidies and grants for capital expenditure 0 5 5
Development and financial contributions 0 0 0
Increase/(decrease) in debt 0 0 0
Gross proceeds from sale of assets 16 0 0
Lump sum contributions 0 0 0
Other dedicated capital funding 0 0 0
Total sources of capital funding (C) 16 5 5
Application of capital funding
Capital expenditure:
- To meet additional demand 0 0 0
- To improve the level of service 0 0 0
- To replace existing assets 10 0 10
Increase/(decrease) in reserves (31) 16 (16)
Increase/(decrease) in investments 0 0 0
Total applications of capital funding (D) (21) 16 (6)
Surplus/(deficit) of capital funding (C-D) 37 (11) 11
Funding balance ((A-B)+(C-D)) (0) 0 (0)
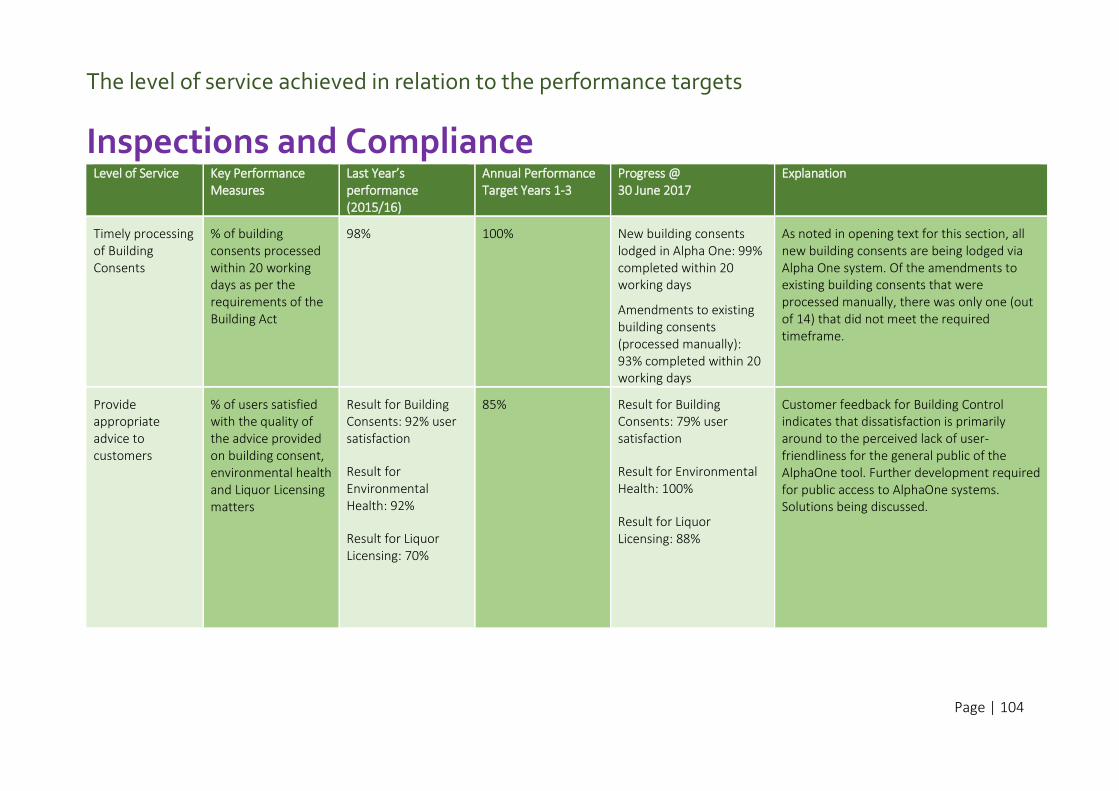
Page | 104
The level of service achieved in relation to the performance targets
Inspections and Compliance Level of Service Key Performance
Measures
Last Year’s performance (2015/16)
Annual Performance Target Years 1-3
Progress @ 30 June 2017
Explanation
Timely processing of Building Consents
% of building consents processed within 20 working days as per the requirements of the Building Act
98% 100%
New building consents lodged in Alpha One: 99% completed within 20 working days
Amendments to existing building consents (processed manually): 93% completed within 20 working days
As noted in opening text for this section, all new building consents are being lodged via Alpha One system. Of the amendments to existing building consents that were processed manually, there was only one (out of 14) that did not meet the required timeframe.
Provide appropriate advice to customers
% of users satisfied with the quality of the advice provided on building consent, environmental health and Liquor Licensing matters
Result for Building Consents: 92% user satisfaction
Result for Environmental Health: 92%
Result for Liquor Licensing: 70%
85% Result for Building Consents: 79% user satisfaction
Result for Environmental Health: 100%
Result for Liquor Licensing: 88%
Customer feedback for Building Control indicates that dissatisfaction is primarily around to the perceived lack of user-friendliness for the general public of the AlphaOne tool. Further development required for public access to AlphaOne systems. Solutions being discussed.
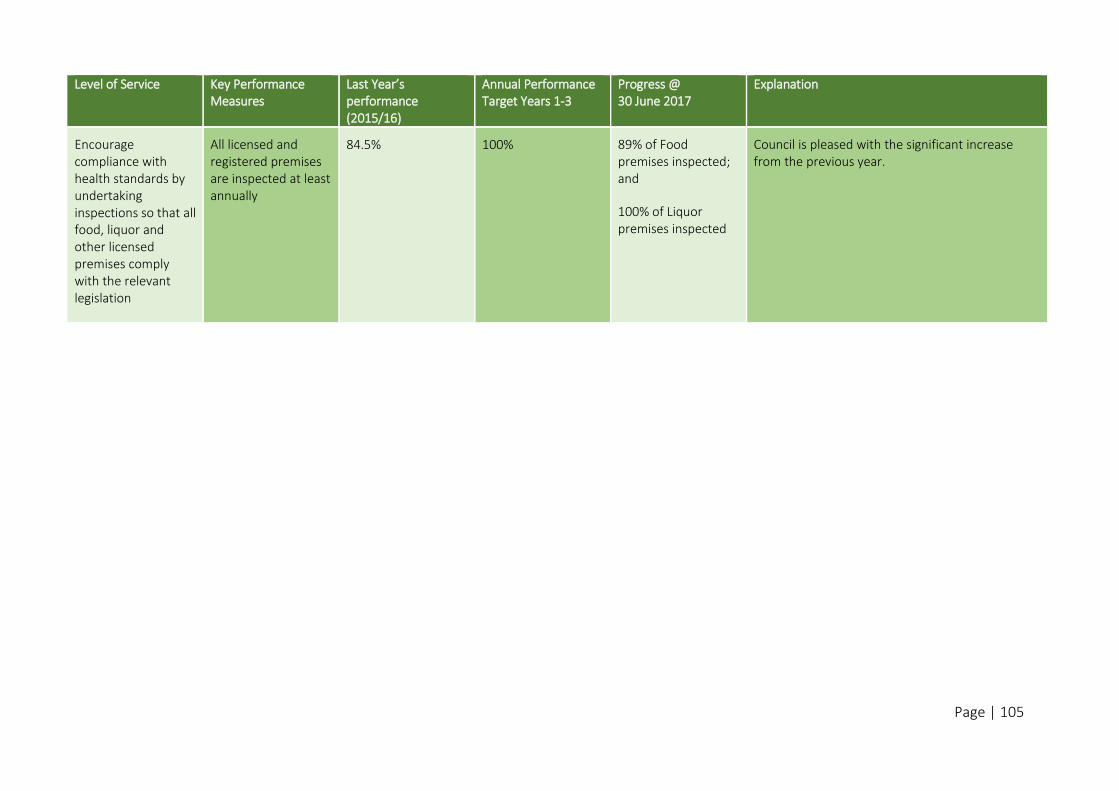
Page | 105
Level of Service Key Performance Measures
Last Year’s performance (2015/16)
Annual Performance Target Years 1-3
Progress @ 30 June 2017
Explanation
Encourage compliance with health standards by undertaking inspections so that all food, liquor and other licensed premises comply with the relevant legislation
All licensed and registered premises are inspected at least annually
84.5% 100% 89% of Food premises inspected; and
100% of Liquor premises inspected
Council is pleased with the significant increase from the previous year.
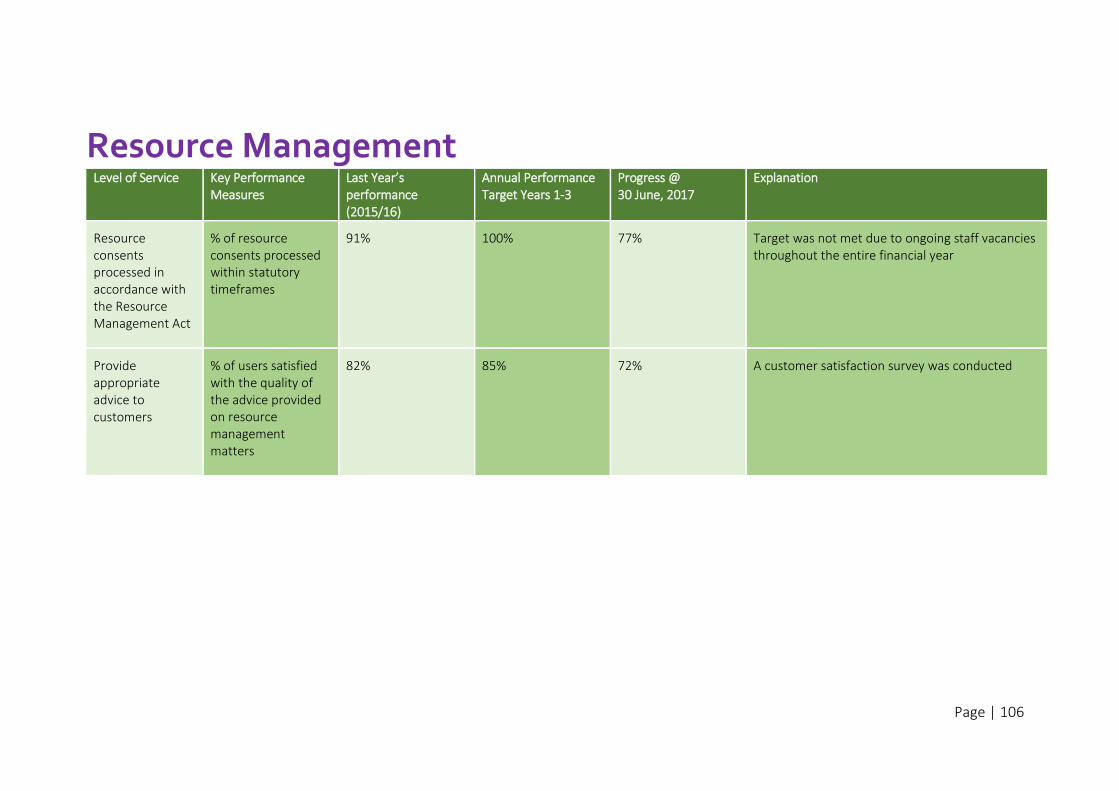
Page | 106
Resource Management Level of Service Key Performance
Measures
Last Year’s performance (2015/16)
Annual Performance Target Years 1-3
Progress @ 30 June, 2017
Explanation
Resource consents processed in accordance with the Resource Management Act
% of resource consents processed within statutory timeframes
91% 100% 77% Target was not met due to ongoing staff vacancies throughout the entire financial year
Provide appropriate advice to customers
% of users satisfied with the quality of the advice provided on resource management matters
82% 85% 72% A customer satisfaction survey was conducted
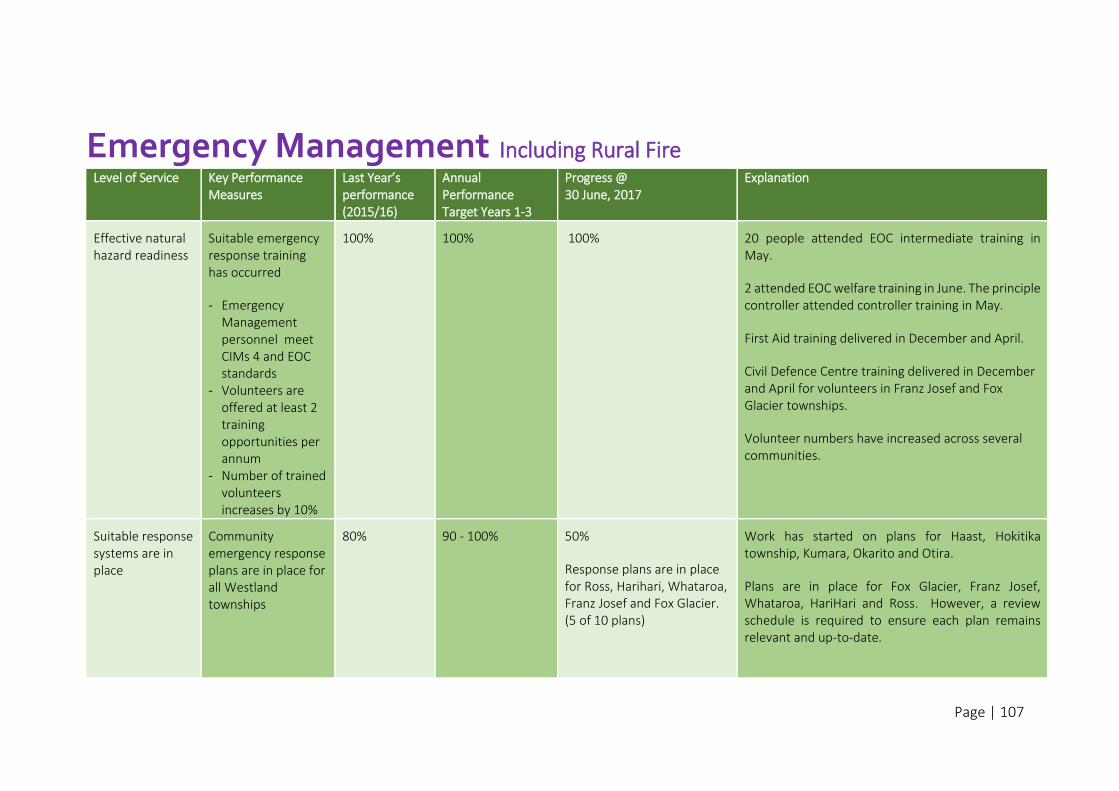
Page | 107
Emergency Management Including Rural Fire Level of Service Key Performance
Measures Last Year’s performance (2015/16)
Annual Performance Target Years 1-3
Progress @ 30 June, 2017
Explanation
Effective natural hazard readiness
Suitable emergency response training has occurred
- Emergency Management personnel meet CIMs 4 and EOC standards
- Volunteers are offered at least 2 training opportunities per annum
- Number of trained volunteers increases by 10%
100% 100% 100%
20 people attended EOC intermediate training in May.
2 attended EOC welfare training in June. The principle controller attended controller training in May.
First Aid training delivered in December and April.
Civil Defence Centre training delivered in December and April for volunteers in Franz Josef and Fox Glacier townships.
Volunteer numbers have increased across several communities.
Suitable response systems are in place
Community emergency response plans are in place for all Westland townships
80% 90 - 100% 50%
Response plans are in place for Ross, Harihari, Whataroa, Franz Josef and Fox Glacier. (5 of 10 plans)
Work has started on plans for Haast, Hokitika township, Kumara, Okarito and Otira.
Plans are in place for Fox Glacier, Franz Josef, Whataroa, HariHari and Ross. However, a review schedule is required to ensure each plan remains relevant and up-to-date.
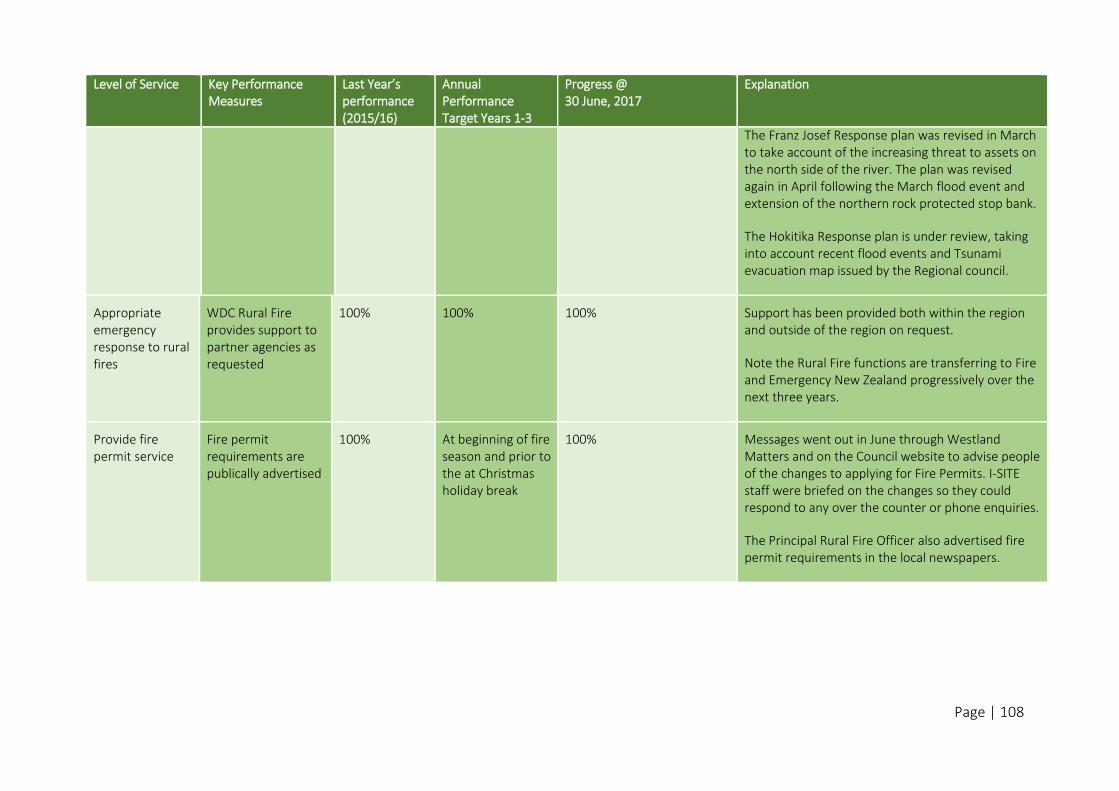
Page | 108
Level of Service Key Performance Measures
Last Year’s performance (2015/16)
Annual Performance Target Years 1-3
Progress @ 30 June, 2017
Explanation
The Franz Josef Response plan was revised in March to take account of the increasing threat to assets on the north side of the river. The plan was revised again in April following the March flood event and extension of the northern rock protected stop bank.
The Hokitika Response plan is under review, taking into account recent flood events and Tsunami evacuation map issued by the Regional council.
Appropriate emergency response to rural fires
WDC Rural Fire provides support to partner agencies as requested
100% 100% 100% Support has been provided both within the region and outside of the region on request.
Note the Rural Fire functions are transferring to Fire and Emergency New Zealand progressively over the next three years.
Provide fire permit service
Fire permit requirements are publically advertised
100% At beginning of fire season and prior to the at Christmas holiday break
100% Messages went out in June through Westland Matters and on the Council website to advise people of the changes to applying for Fire Permits. I-SITE staff were briefed on the changes so they could respond to any over the counter or phone enquiries.
The Principal Rural Fire Officer also advertised fire permit requirements in the local newspapers.
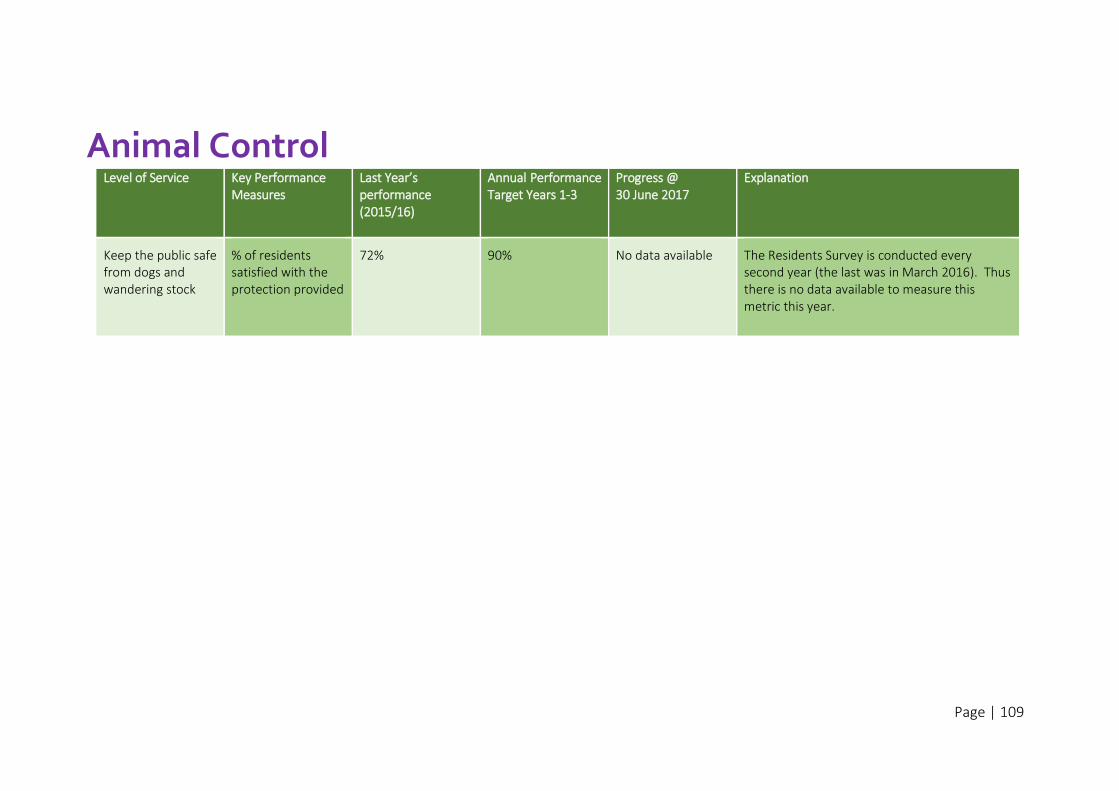
Page | 109
Animal Control Level of Service Key Performance
Measures
Last Year’s performance (2015/16)
Annual Performance Target Years 1-3
Progress @ 30 June 2017
Explanation
Keep the public safe from dogs and wandering stock
% of residents satisfied with the protection provided
72%
90% No data available The Residents Survey is conducted every second year (the last was in March 2016). Thus there is no data available to measure this metric this year.
Page | 110
Community Development and Assistance
Community Halls
Townships (the development fund & improvement projects)
An overview of the 2016/17 year: Community Development and Assistance:
Allocation and administration of Major District Initiative (MDI) Funding: Three community projects which have received Major District Initiative Funding were completed in 2016/2017:
Ross Centennial Hall Upgrade This project in Moorhouse Street, Ross, was upgraded with a modernised kitchen a new roof to replace the badly leaking 1960s roof. Costing a total of $119,883, funding of $90,000 came from MDI funds through Development West Coast. The remainder of funding was drawn from the Ross Endowment Funds. Hokitika Westland RSA new building in Hokitika The previous building in Sewell Street, Hokitika, came in under the required standard for earthquake risk and had to be demolished. The new building was opened 25 February 2017 at a cost of $825,372. Development West Coast provided $400,000 of MDI funding, the RSA raised over $300,000 and the remainder came from a Lotteries Community Facilities Fund. Fox Glacier Community Centre This $1.6 million project in Cook Flat Road, Fox Glacier was opened 22 April 2017. Development West Coast provided $1,000,000 of MDI funding, Westland District Council added $100,000 from Reserves contributions. Another grant was obtained via Lotteries Community Facilities Fund provided and over $300,000 was received in local fundraising. The project was a great example of a small local community working well together to see their dream come true. Other funding: Council has also used $19,439 of Creative Communities Funding to fund eleven local arts projects in 2016/2017. Sport New Zealand Rural Travel funding of $10,508 assisted eight sports clubs in Westland to subsidise travel to sports games and competitions. Some community groups have also gained additional funding through the annual Trustpower Community Awards for volunteers. Council also provided funding of $52,000 for the two part-time Community Development Officers administration positions at Franz Josef Glacier and Fox Glacier, as well as $13,000 for administration for Glacier Country Tourism Group. Other grants were given to the Regent Theatre ($30,000), Tourism West Coast ($86,000) and Enterprise Hokitika ($39,000).
Activity group: Community Services
Page | 111
Community Halls: There is still a desire to have well-maintained community halls within smaller townships. During this financial year, both the Bruce Bay and Okuru Halls were re-roofed and the Whataroa Hall has been repiled - all paid for by their local community associations/groups. Township Development Funding: This is reported on in the Reserves section of this report. District Economic Stimulus Fund (DESF): Funding of $1,000,000 was allocated by Development West Coast (DWC) to Westland District businesses and organisations in the first six months of 2017 through the District Economic Stimulus Fund (DESF). The fund was established to specifically help boost Westland District businesses’ development and growth. Six Westland organisations and businesses have received support of varying amounts in a combination of grants and loans. That includes the Hokitika Regent Theatre which will use its funds to update its digital cinema equipment and performance lighting system, creating a significantly different theatre experience. The update will enable better use of the facility, in particular, making the theatre’s Reynolds Room more flexible in its use. The stimulus funding was also accessed by the West Coast Wilderness Trail to help fund a Project Manager for the Trail over the next three years. This key role has been filled and will ensure the popular adventure trail has a dedicated manager, as well as the funding to extend its marketing and publicity which has the important spinoff of bringing more tourists to Westland to spend money in the hospitality and retail sectors. The DESF is also being used to fund the Co-Starters Business Start-up and Development Programme in Westland to assist business owners who want to explore and develop businesses in their Westland community. It is aimed at empowering these entrepreneurs with the tools and skills they need to run a successful business. The Regional Mid-sized Tourism Facilities Grant Fund Round 2: Council was successful with five of the six applications made to the Ministry of Business Innovation and Employment (MBIE) for much needed new toilet facilities at: 1. Dillmans (Kapitea) Dam (Kumara) - a two pan prefabricated concrete walled dry vault toilet block - estimated cost $117,690 2. Okarito – a modular two pan prefabricated toilet block - estimated cost $237,150 3. Franz Josef Glacier – a modular nine pan prefabricated toilet block located under a large overhanging roof structure with panelled walls that forms a shelter to the northern side for bus passengers – estimated cost $551,520 4. Fox Glacier – a modular two pan prefabricated toilet block beside the existing two pan unit – estimated cost $161,250 5. Bruce Bay – a two pan prefabricated dry vault toilet block – estimated cost $140,240 These new toilets are required to enhance a high quality visitor experience by providing toilet facilities that meet visitor needs. The funding was available for Districts with low ratepayer bases and funding constraints that are experiencing high or increasing levels of visitor numbers. These projects will be completed within the next financial year.
Page | 112
Youth Development:
Council’s Community Development Advisor and WestREAP’s Schools Coordinator planned and developed a Youth Development Strategy in conjunction with young people in the District.
$20,000 plus a grant of $30,000 from the Ministry of Youth Development was spent on a Youth Connections and Mentoring programme January to June 2017. WestREAP in Hokitika facilitated this programme on behalf of Council at Westland High School.
The Westland Youth Mentoring and Connections Project built the capability and capacity of youth in Westland to embrace their identity, learn how to connect with others and contribute to their communities. It involved 110 young people; 27 of these young people said they had a concern about their family circumstances or lack of family/whanau support, 14 had a feeling of a lack of belonging, six felt they had a lack of financial resources and two said they had a lack of sufficient social or environmental resources.
The one-to-one social mentoring with Senior (years 10 to 13) High School students focused on helping these young people to decide what was important to them, set goals and making incremental plans to achieve them. The project mentored individuals and groups of young people identified as demonstrating leadership abilities. They were supported to effectively develop the initiatives they were passionate about in their schools and communities. Group workshops were held where young people learnt from inspirational people with West Coast backgrounds and heard they have gone on to do and how they got there. At these workshops young people shared their ideas and concepts for youth-led initiatives. Each idea or concept was then workshopped by the group. Following the incubation workshops, the mentors continued to support groups or individual young people to design, develop, plan and implement their initiatives.
Furthermore, the mentoring service also supported young people to transition from secondary school into further education, training or work ensuring that each young person with the support of a mentor via communication by phone and social media.
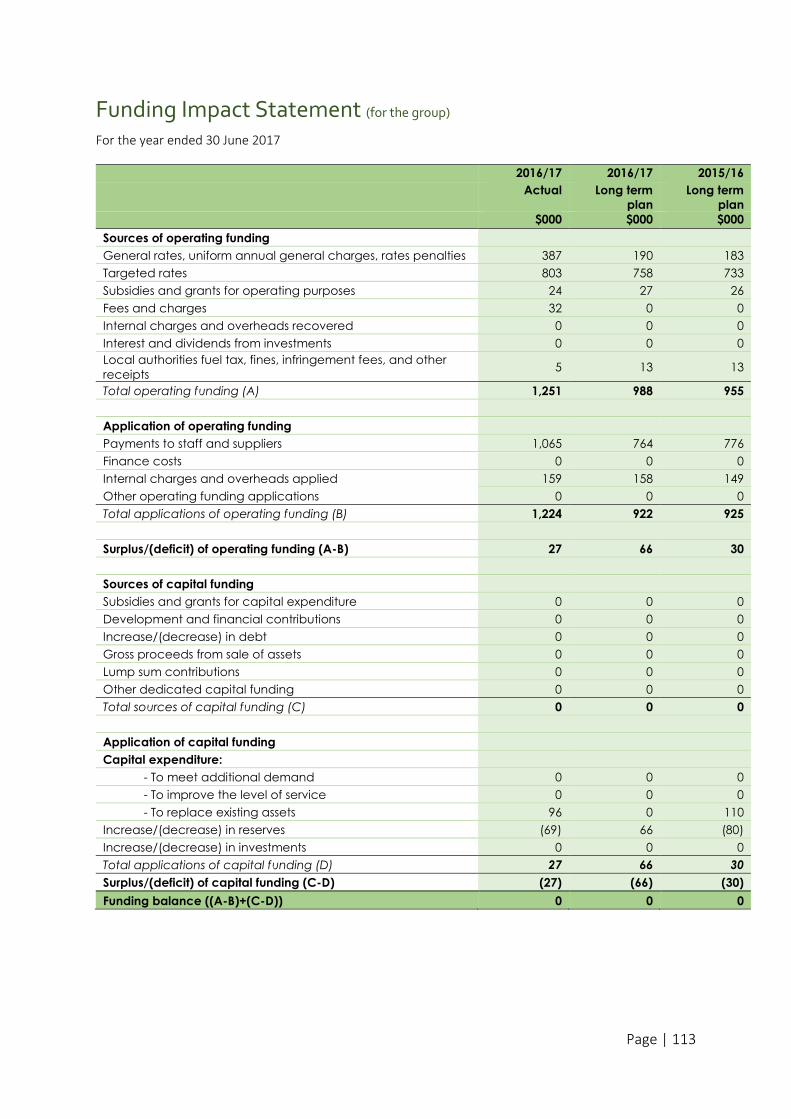
Page | 113
Funding Impact Statement (for the group) For the year ended 30 June 2017
2016/17 2016/17 2015/16
Actual Long term
plan
Long term
plan
$000 $000 $000
Sources of operating funding
General rates, uniform annual general charges, rates penalties 387 190 183
Targeted rates 803 758 733
Subsidies and grants for operating purposes 24 27 26
Fees and charges 32 0 0
Internal charges and overheads recovered 0 0 0
Interest and dividends from investments 0 0 0
Local authorities fuel tax, fines, infringement fees, and other
receipts 5 13 13
Total operating funding (A) 1,251 988 955
Application of operating funding
Payments to staff and suppliers 1,065 764 776
Finance costs 0 0 0
Internal charges and overheads applied 159 158 149
Other operating funding applications 0 0 0
Total applications of operating funding (B) 1,224 922 925
Surplus/(deficit) of operating funding (A-B) 27 66 30
Sources of capital funding
Subsidies and grants for capital expenditure 0 0 0
Development and financial contributions 0 0 0
Increase/(decrease) in debt 0 0 0
Gross proceeds from sale of assets 0 0 0
Lump sum contributions 0 0 0
Other dedicated capital funding 0 0 0
Total sources of capital funding (C) 0 0 0
Application of capital funding
Capital expenditure:
- To meet additional demand 0 0 0
- To improve the level of service 0 0 0
- To replace existing assets 96 0 110
Increase/(decrease) in reserves (69) 66 (80)
Increase/(decrease) in investments 0 0 0
Total applications of capital funding (D) 27 66 30
Surplus/(deficit) of capital funding (C-D) (27) (66) (30)
Funding balance ((A-B)+(C-D)) 0 0 0
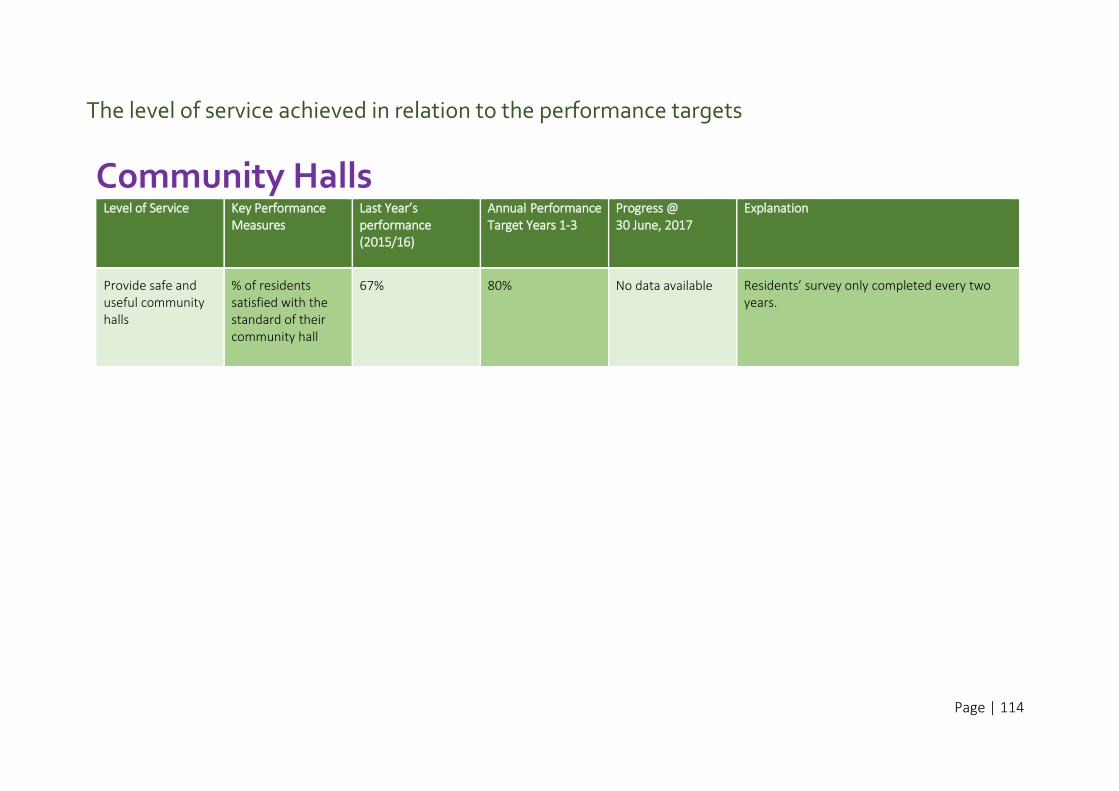
Page | 114
The level of service achieved in relation to the performance targets
Community Halls Level of Service Key Performance
Measures
Last Year’s performance (2015/16)
Annual Performance Target Years 1-3
Progress @ 30 June, 2017
Explanation
Provide safe and useful community halls
% of residents satisfied with the standard of their community hall
67%
80% No data available Residents’ survey only completed every two years.
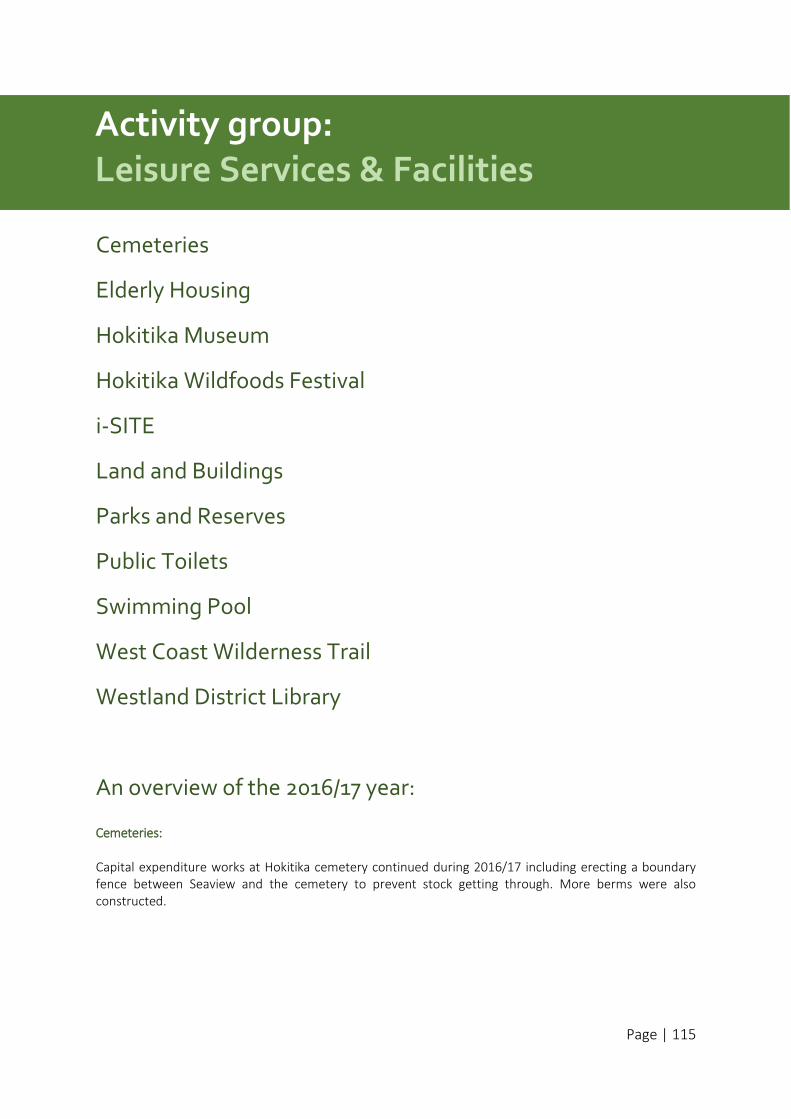
Page | 115
Cemeteries
Elderly Housing
Hokitika Museum
Hokitika Wildfoods Festival
i-SITE
Land and Buildings
Parks and Reserves
Public Toilets
Swimming Pool
West Coast Wilderness Trail
Westland District Library
An overview of the 2016/17 year:
Cemeteries: Capital expenditure works at Hokitika cemetery continued during 2016/17 including erecting a boundary fence between Seaview and the cemetery to prevent stock getting through. More berms were also constructed.
Activity group: Leisure Services & Facilities
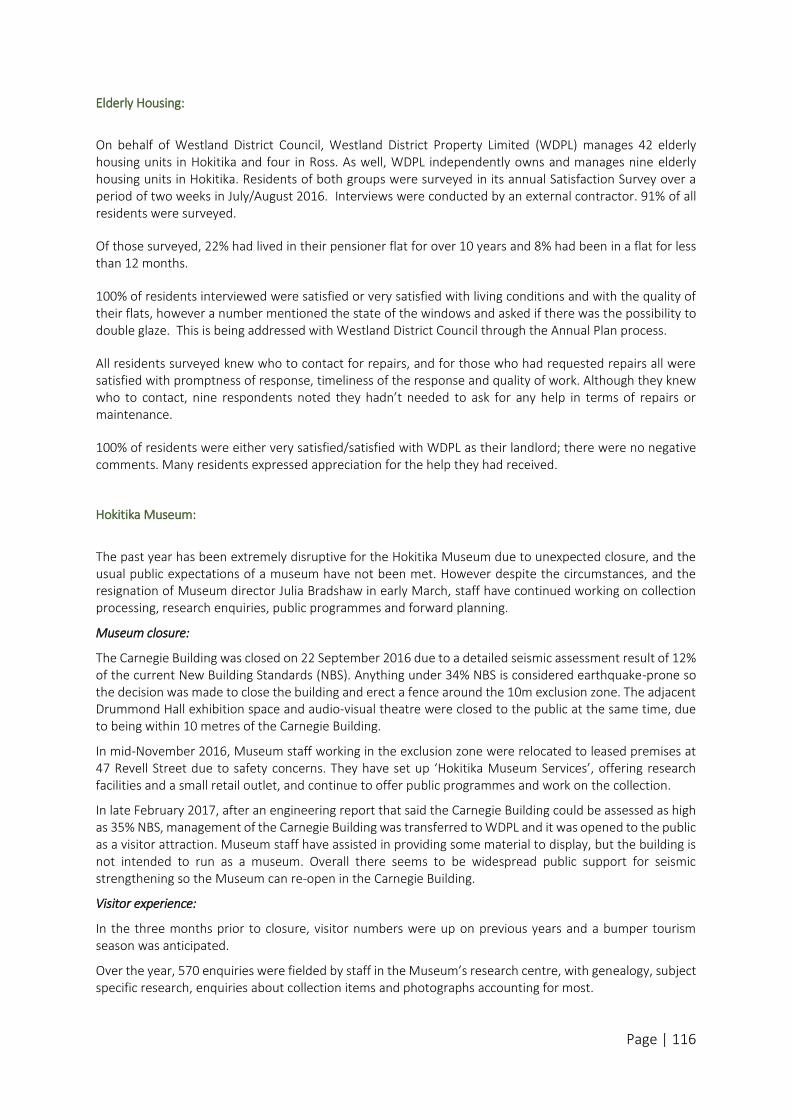
Page | 116
Elderly Housing:
On behalf of Westland District Council, Westland District Property Limited (WDPL) manages 42 elderly housing units in Hokitika and four in Ross. As well, WDPL independently owns and manages nine elderly housing units in Hokitika. Residents of both groups were surveyed in its annual Satisfaction Survey over a period of two weeks in July/August 2016. Interviews were conducted by an external contractor. 91% of all residents were surveyed.
Of those surveyed, 22% had lived in their pensioner flat for over 10 years and 8% had been in a flat for less than 12 months.
100% of residents interviewed were satisfied or very satisfied with living conditions and with the quality of their flats, however a number mentioned the state of the windows and asked if there was the possibility to double glaze. This is being addressed with Westland District Council through the Annual Plan process.
All residents surveyed knew who to contact for repairs, and for those who had requested repairs all were satisfied with promptness of response, timeliness of the response and quality of work. Although they knew who to contact, nine respondents noted they hadn’t needed to ask for any help in terms of repairs or maintenance.
100% of residents were either very satisfied/satisfied with WDPL as their landlord; there were no negative comments. Many residents expressed appreciation for the help they had received.
Hokitika Museum:
The past year has been extremely disruptive for the Hokitika Museum due to unexpected closure, and the usual public expectations of a museum have not been met. However despite the circumstances, and the resignation of Museum director Julia Bradshaw in early March, staff have continued working on collection processing, research enquiries, public programmes and forward planning.
Museum closure:
The Carnegie Building was closed on 22 September 2016 due to a detailed seismic assessment result of 12% of the current New Building Standards (NBS). Anything under 34% NBS is considered earthquake-prone so the decision was made to close the building and erect a fence around the 10m exclusion zone. The adjacent Drummond Hall exhibition space and audio-visual theatre were closed to the public at the same time, due to being within 10 metres of the Carnegie Building.
In mid-November 2016, Museum staff working in the exclusion zone were relocated to leased premises at 47 Revell Street due to safety concerns. They have set up ‘Hokitika Museum Services’, offering research facilities and a small retail outlet, and continue to offer public programmes and work on the collection.
In late February 2017, after an engineering report that said the Carnegie Building could be assessed as high as 35% NBS, management of the Carnegie Building was transferred to WDPL and it was opened to the public as a visitor attraction. Museum staff have assisted in providing some material to display, but the building is not intended to run as a museum. Overall there seems to be widespread public support for seismic strengthening so the Museum can re-open in the Carnegie Building.
Visitor experience:
In the three months prior to closure, visitor numbers were up on previous years and a bumper tourism season was anticipated.
Over the year, 570 enquiries were fielded by staff in the Museum’s research centre, with genealogy, subject specific research, enquiries about collection items and photographs accounting for most.
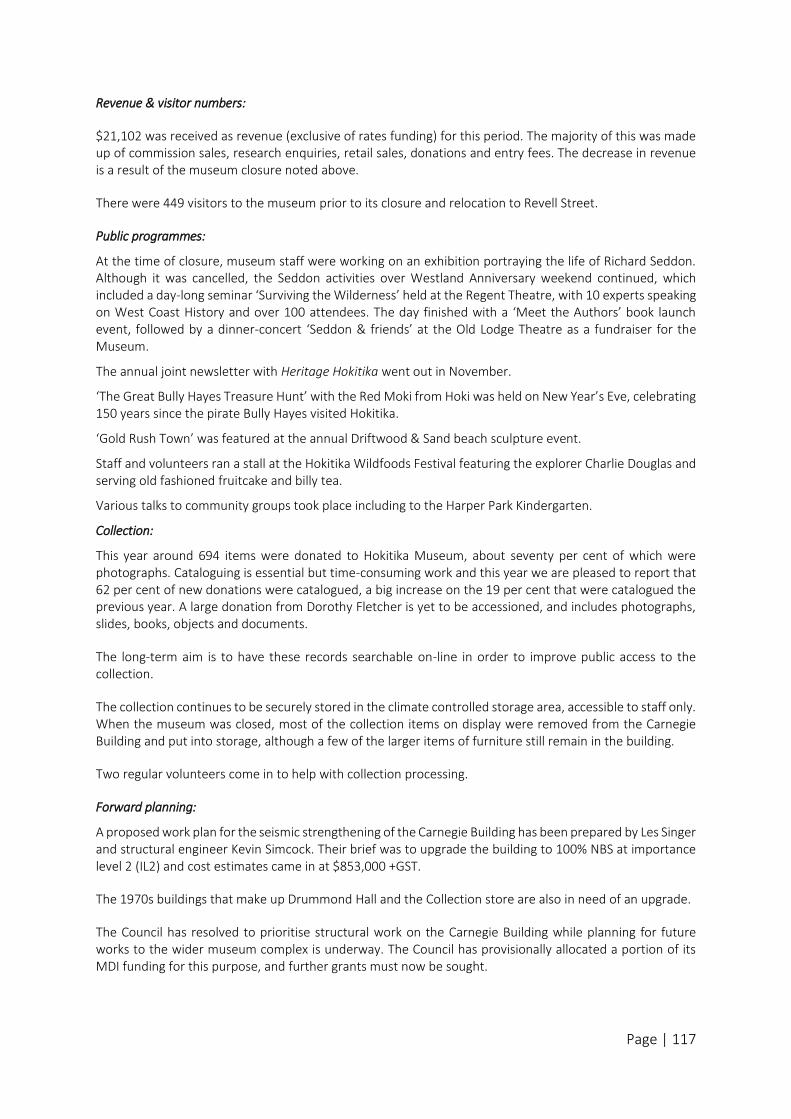
Page | 117
Revenue & visitor numbers:
$21,102 was received as revenue (exclusive of rates funding) for this period. The majority of this was made up of commission sales, research enquiries, retail sales, donations and entry fees. The decrease in revenue is a result of the museum closure noted above.
There were 449 visitors to the museum prior to its closure and relocation to Revell Street.
Public programmes:
At the time of closure, museum staff were working on an exhibition portraying the life of Richard Seddon. Although it was cancelled, the Seddon activities over Westland Anniversary weekend continued, which included a day-long seminar ‘Surviving the Wilderness’ held at the Regent Theatre, with 10 experts speaking on West Coast History and over 100 attendees. The day finished with a ‘Meet the Authors’ book launch event, followed by a dinner-concert ‘Seddon & friends’ at the Old Lodge Theatre as a fundraiser for the Museum.
The annual joint newsletter with Heritage Hokitika went out in November.
‘The Great Bully Hayes Treasure Hunt’ with the Red Moki from Hoki was held on New Year’s Eve, celebrating 150 years since the pirate Bully Hayes visited Hokitika.
‘Gold Rush Town’ was featured at the annual Driftwood & Sand beach sculpture event.
Staff and volunteers ran a stall at the Hokitika Wildfoods Festival featuring the explorer Charlie Douglas and serving old fashioned fruitcake and billy tea.
Various talks to community groups took place including to the Harper Park Kindergarten.
Collection:
This year around 694 items were donated to Hokitika Museum, about seventy per cent of which were photographs. Cataloguing is essential but time-consuming work and this year we are pleased to report that 62 per cent of new donations were catalogued, a big increase on the 19 per cent that were catalogued the previous year. A large donation from Dorothy Fletcher is yet to be accessioned, and includes photographs, slides, books, objects and documents.
The long-term aim is to have these records searchable on-line in order to improve public access to the collection.
The collection continues to be securely stored in the climate controlled storage area, accessible to staff only. When the museum was closed, most of the collection items on display were removed from the Carnegie Building and put into storage, although a few of the larger items of furniture still remain in the building.
Two regular volunteers come in to help with collection processing.
Forward planning:
A proposed work plan for the seismic strengthening of the Carnegie Building has been prepared by Les Singer and structural engineer Kevin Simcock. Their brief was to upgrade the building to 100% NBS at importance level 2 (IL2) and cost estimates came in at $853,000 +GST.
The 1970s buildings that make up Drummond Hall and the Collection store are also in need of an upgrade.
The Council has resolved to prioritise structural work on the Carnegie Building while planning for future works to the wider museum complex is underway. The Council has provisionally allocated a portion of its MDI funding for this purpose, and further grants must now be sought.
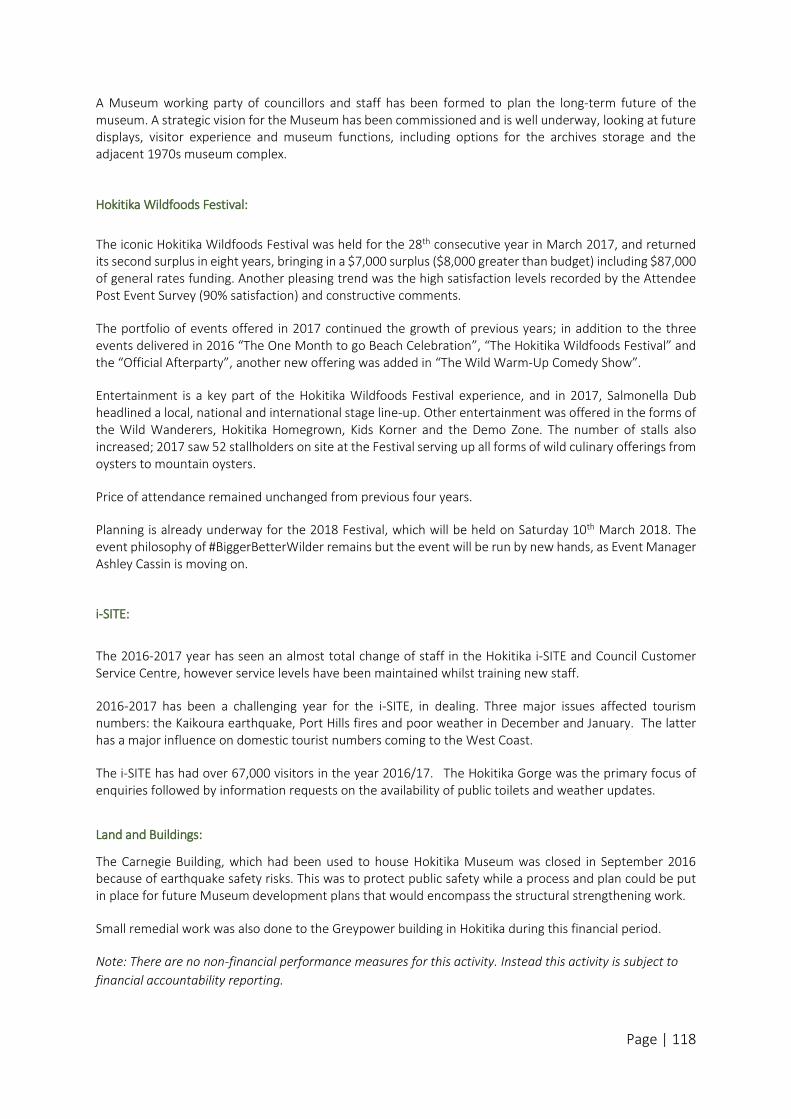
Page | 118
A Museum working party of councillors and staff has been formed to plan the long-term future of the museum. A strategic vision for the Museum has been commissioned and is well underway, looking at future displays, visitor experience and museum functions, including options for the archives storage and the adjacent 1970s museum complex.
Hokitika Wildfoods Festival:
The iconic Hokitika Wildfoods Festival was held for the 28th consecutive year in March 2017, and returned its second surplus in eight years, bringing in a $7,000 surplus ($8,000 greater than budget) including $87,000 of general rates funding. Another pleasing trend was the high satisfaction levels recorded by the Attendee Post Event Survey (90% satisfaction) and constructive comments.
The portfolio of events offered in 2017 continued the growth of previous years; in addition to the three events delivered in 2016 “The One Month to go Beach Celebration”, “The Hokitika Wildfoods Festival” and the “Official Afterparty”, another new offering was added in “The Wild Warm-Up Comedy Show”.
Entertainment is a key part of the Hokitika Wildfoods Festival experience, and in 2017, Salmonella Dub headlined a local, national and international stage line-up. Other entertainment was offered in the forms of the Wild Wanderers, Hokitika Homegrown, Kids Korner and the Demo Zone. The number of stalls also increased; 2017 saw 52 stallholders on site at the Festival serving up all forms of wild culinary offerings from oysters to mountain oysters.
Price of attendance remained unchanged from previous four years.
Planning is already underway for the 2018 Festival, which will be held on Saturday 10th March 2018. The event philosophy of #BiggerBetterWilder remains but the event will be run by new hands, as Event Manager Ashley Cassin is moving on.
i-SITE:
The 2016-2017 year has seen an almost total change of staff in the Hokitika i-SITE and Council Customer Service Centre, however service levels have been maintained whilst training new staff.
2016-2017 has been a challenging year for the i-SITE, in dealing. Three major issues affected tourism numbers: the Kaikoura earthquake, Port Hills fires and poor weather in December and January. The latter has a major influence on domestic tourist numbers coming to the West Coast.
The i-SITE has had over 67,000 visitors in the year 2016/17. The Hokitika Gorge was the primary focus of enquiries followed by information requests on the availability of public toilets and weather updates.
Land and Buildings:
The Carnegie Building, which had been used to house Hokitika Museum was closed in September 2016 because of earthquake safety risks. This was to protect public safety while a process and plan could be put in place for future Museum development plans that would encompass the structural strengthening work.
Small remedial work was also done to the Greypower building in Hokitika during this financial period.
Note: There are no non-financial performance measures for this activity. Instead this activity is subject to
financial accountability reporting.
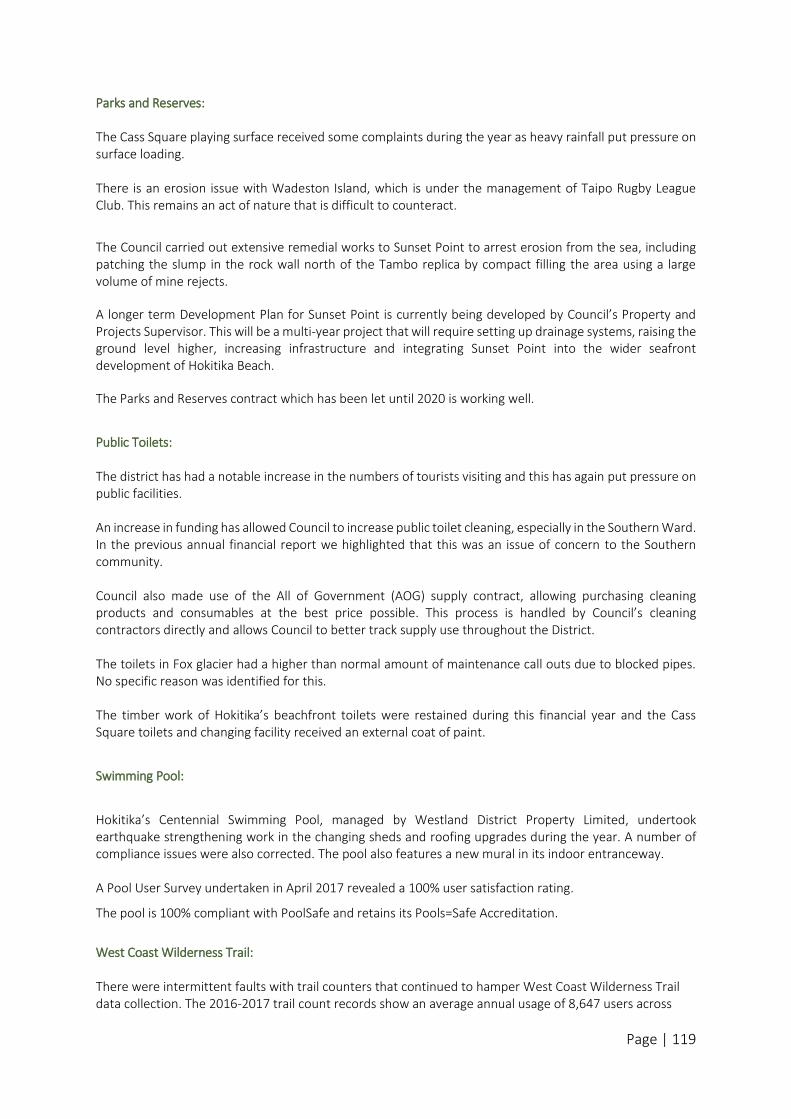
Page | 119
Parks and Reserves: The Cass Square playing surface received some complaints during the year as heavy rainfall put pressure on surface loading. There is an erosion issue with Wadeston Island, which is under the management of Taipo Rugby League Club. This remains an act of nature that is difficult to counteract.
The Council carried out extensive remedial works to Sunset Point to arrest erosion from the sea, including patching the slump in the rock wall north of the Tambo replica by compact filling the area using a large volume of mine rejects.
A longer term Development Plan for Sunset Point is currently being developed by Council’s Property and Projects Supervisor. This will be a multi-year project that will require setting up drainage systems, raising the ground level higher, increasing infrastructure and integrating Sunset Point into the wider seafront development of Hokitika Beach.
The Parks and Reserves contract which has been let until 2020 is working well.
Public Toilets: The district has had a notable increase in the numbers of tourists visiting and this has again put pressure on public facilities. An increase in funding has allowed Council to increase public toilet cleaning, especially in the Southern Ward. In the previous annual financial report we highlighted that this was an issue of concern to the Southern community. Council also made use of the All of Government (AOG) supply contract, allowing purchasing cleaning products and consumables at the best price possible. This process is handled by Council’s cleaning contractors directly and allows Council to better track supply use throughout the District. The toilets in Fox glacier had a higher than normal amount of maintenance call outs due to blocked pipes. No specific reason was identified for this. The timber work of Hokitika’s beachfront toilets were restained during this financial year and the Cass Square toilets and changing facility received an external coat of paint.
Swimming Pool:
Hokitika’s Centennial Swimming Pool, managed by Westland District Property Limited, undertook earthquake strengthening work in the changing sheds and roofing upgrades during the year. A number of compliance issues were also corrected. The pool also features a new mural in its indoor entranceway. A Pool User Survey undertaken in April 2017 revealed a 100% user satisfaction rating.
The pool is 100% compliant with PoolSafe and retains its Pools=Safe Accreditation.
West Coast Wilderness Trail: There were intermittent faults with trail counters that continued to hamper West Coast Wilderness Trail data collection. The 2016-2017 trail count records show an average annual usage of 8,647 users across
Page | 120
accumulation of counts at four counter locations (excluding Grey District). This highlights that the counts are most likely being under-valued in terms of total counts as the assumption has been that all riders have ridden the entire trail, which is not an accurate representation. More trail counters were purchased during this financial year to assist with better trail usage monitoring. This proved to be a valuable investment as we have managed a marginally better consistency with the data collected. The government is also sponsoring three new trail counters to be installed in late 2017 as part of the national data collection. A rider survey was undertaken in summer 2016/17. This is proving to be very valuable in understanding the demographics and types of trail riders and their average spends in terms of tourism activities. The West Coast Wilderness Trail’s 2016 accountability audit recommendation of the Council appointing a
Project Manager came to fruition this financial year with the appointment of David Inwood on secondment
to this position from November 2016 to May 2017.
More trail work continued this year to complete the outstanding projects for Nga Haerenga signoff. This
requires five trail locations to be completed in conjunction with a revised Project Completion Plan
agreement with the Ministry of Business, Innovation and Employment.
There was a cash shortfall identified in the Project Completion Plan and unfortunately the source of
funding sought to complete the trail did not eventuate. There is therefore uncertainty about the
completion date of the trail due to financial shortfalls.
Five trail shelters were also constructed and installed at regular intervals along the Wilderness trail to
combine with the temporary toilets. Two ‘Gangers Sheds’ were installed on the Ross Rail Trail section at
Papakamai and Camp Creek.
The West Coast Wilderness Trail Trust has progressed many action tasks and milestones this year to
promote and advance the trail status.
Westland District Library:
This year 78,427 items were issued to the public. This is similar to last year. There were 69,197 visitors to
Westland District Library this year, a decrease of 7% on last year. 22,888 wifi connections were made
through the Library’s wifi network, this is up 5% on last year.
A number of staffing changes occurred. Laura Fisher from Nelson Public Libraries was the Youth Librarian for three months out of this period (from July - October 2016) until Krystel Woodcock joined the team on a permanent basis as the Youth Librarian in November 2016. Sarah Thompson, Library Manager took extended leave from February to April 2017 and Shona Winter was acting Library Manager. Kay Davidson worked 20 hours per week on a fixed term during this period and also replaced Courtney Wright-Watson working 3 hours on Saturday.
Regional collaboration:
The three West Coast Public Libraries (Grey, Buller and Westland) agreed to continue the Large Print joint
purchasing plan, as well as the circulation of 50 Large Print books among the libraries on a biannual basis.
Page | 121
In addition, the three West Coast Libraries agreed to continue to be part of the OverDrive consortia for
eBooks and eAudiobooks. A joint subscription to PressReader, an online newspaper and magazine database
is being investigated.
Westland District and Grey District Libraries have continued their reciprocal borrowing agreement, allowing
members of each District to have access to more than 60,000 items.
Staff training:
All library staff have completed a comprehensive Kotui Library Management System training course and two
library staff attended a Kotui regional training day at Westport Library.
In addition, the Youth Librarian attended a Youth Mentoring workshop, while two library staff visited newly-
built public libraries in Christchurch – Halswell Centre, Lincoln and Kaiapoi - and were able to look at the
public and staffing areas.
Programmes and events:
An extensive range of programmes and events took place at the library throughout the year including:
Book Launches – Two local authors launched their books in the library during the year – Lynda Murphy
launched a children’s picture book ‘Chips’ and Jack Marcotte launched ‘Jack and Charlie: Boys of the Bush’.
Stepping Up computer classes – Run in collaboration with 20/20 Communications Trust. One-on-one
sessions on ‘How to use a tablet’ have been offered throughout the year to members of the community
Library Talks – This is a new programme for adults who are keen to share an exciting travel experience or
interesting job or hobby with the community. The talks happen on a two-monthly basis.
A number of events tailored specifically for children were also held including:
Children’s Reading Challenges – 201 children aged 5-13 years successfully completed the six week Summer
Reading Challenge. 58 children completed the July 2016 Winter Reading Challenge and 21 completed the
April 2017 Reading Challenge.
Roald Dahl 100 celebrations – 13th September marked 100 years since the birth of the world’s greatest
storyteller. The library held a birthday tea party, craft activities, story-time sessions and many Roald Dahl
themed competitions.
New Zealand Book Awards for Children and Young Adults 2016 - ‘Stripes! No Spots!’ by Vasanti Unka was
one of the Picture Book finalist titles that the library showcased for the festival week. Two staff dressed up
as a tiger and a leopard to entertain six class visits. There were also craft activities, a scavenger hunt,
colouring-in and word find puzzles.
Storyteller - Andy Wright, an international storyteller, held two ANZAC themed story-time sessions in the
library during April for visiting school classes.
Matariki - In June, the History Room was transformed into the night sky to celebrate Matariki, the Māori
New Year.
VR Technology sessions – In conjunction with Techspace, Greymouth sessions were held for adults and
children to experience virtual reality by wearing a VR Headset.
Balloon twisting – Several balloon twisting events have been held during the school holidays.
Pre-school story-time – This runs on a weekly basis and is a combination of songs, stories, rhymes and poems
for under 5 year olds.
Page | 122
Lego Club – Launched in May 2017, this club runs on 1st, 2nd and 3rd Monday of each month. Children are
encouraged to let their imagination run wild and each masterpiece is photographed for display in the library.
Code Club - The Code Club runs weekly during the school term to introduce 8- 14 year olds to the basics of
computer programming. This programme runs in collaboration with Westland High School.
Book Club – The monthly book club was re-launched in March 2017 for 8-12 year olds who love to talk about
their favourite books, write reviews and play fun games.
Visit to South Westland Schools – In February, two library staff visited every Westland School to perform an
interactive story-time and to present prizes for the Summer Reading Challenge.
Civil Defence display – In collaboration with the WDC Emergency Management Officer five Primary school
classes visited the library to learn more about how to prepare for a natural disaster. The Ministry of Civil
Defence kindly loaned Stan, the Dog costume which the children loved.
KOTUI Library Management System:
Westland District Council is the 34th Council to join the KOTUI consortia group which is managed by the National Library of New Zealand.
Westland District Library migrated to the Kotui Library Management System on 7 July 2016. This significant Council investment guarantees the future provision of excellent library services for the District.
The new online catalogue has greatly improved the customers’ library experience. More efficient processes and procedures ensure that books are shelf-ready within a week of delivery.
Volunteers:
Six Friends of the Library volunteers have supported the library throughout the year by carrying out shelving, book selection for community libraries and other back room tasks. Their help makes a big difference and is much appreciated.
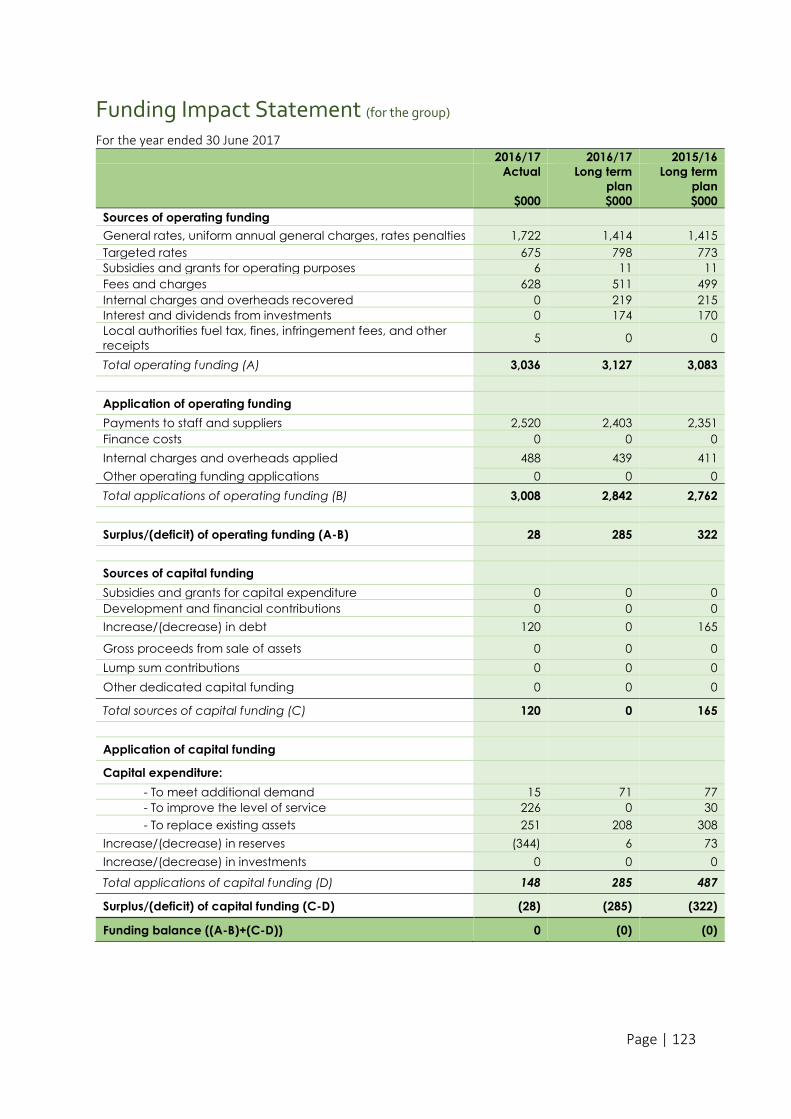
Page | 123
Funding Impact Statement (for the group)
For the year ended 30 June 2017 2016/17 2016/17 2015/16
Actual Long term
plan
Long term
plan
$000 $000 $000
Sources of operating funding
General rates, uniform annual general charges, rates penalties 1,722 1,414 1,415
Targeted rates 675 798 773
Subsidies and grants for operating purposes 6 11 11
Fees and charges 628 511 499
Internal charges and overheads recovered 0 219 215
Interest and dividends from investments 0 174 170
Local authorities fuel tax, fines, infringement fees, and other
receipts 5 0 0
Total operating funding (A) 3,036 3,127 3,083
Application of operating funding
Payments to staff and suppliers 2,520 2,403 2,351
Finance costs 0 0 0
Internal charges and overheads applied 488 439 411
Other operating funding applications 0 0 0
Total applications of operating funding (B) 3,008 2,842 2,762
Surplus/(deficit) of operating funding (A-B) 28 285 322
Sources of capital funding
Subsidies and grants for capital expenditure 0 0 0
Development and financial contributions 0 0 0
Increase/(decrease) in debt 120 0 165
Gross proceeds from sale of assets 0 0 0
Lump sum contributions 0 0 0
Other dedicated capital funding 0 0 0
Total sources of capital funding (C) 120 0 165
Application of capital funding
Capital expenditure:
- To meet additional demand 15 71 77
- To improve the level of service 226 0 30
- To replace existing assets 251 208 308
Increase/(decrease) in reserves (344) 6 73
Increase/(decrease) in investments 0 0 0
Total applications of capital funding (D) 148 285 487
Surplus/(deficit) of capital funding (C-D) (28) (285) (322)
Funding balance ((A-B)+(C-D)) 0 (0) (0)
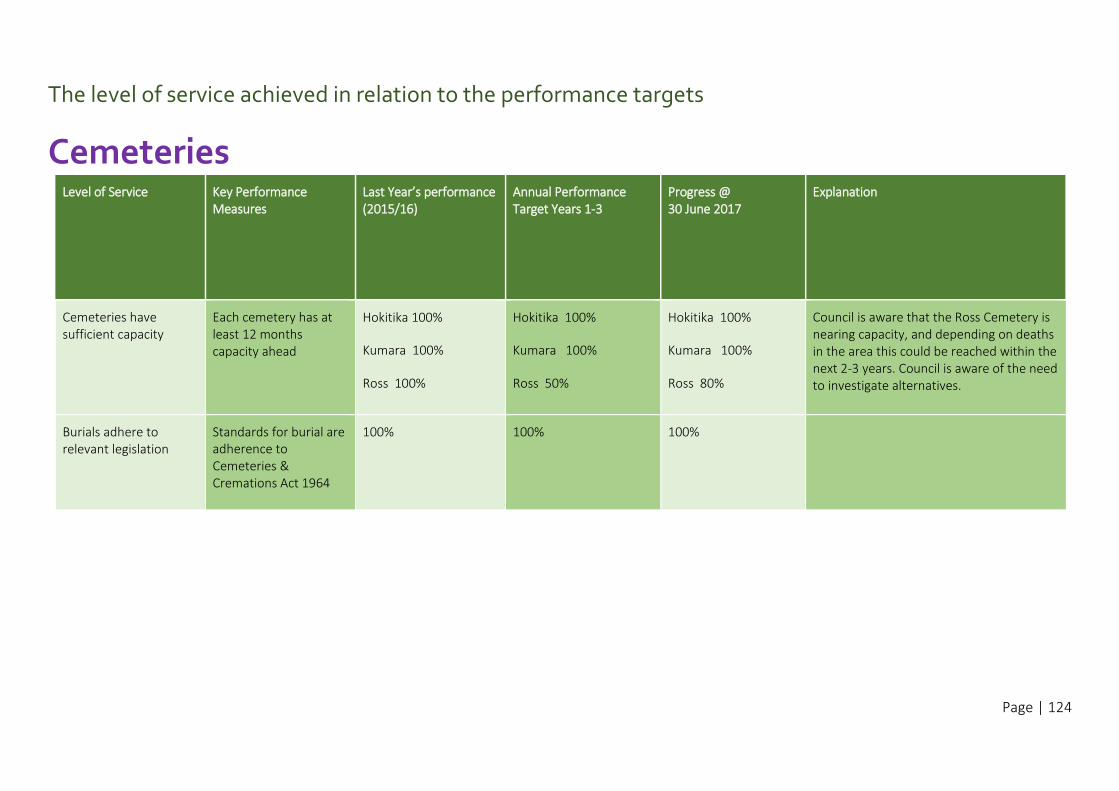
Page | 124
The level of service achieved in relation to the performance targets
Cemeteries Level of Service Key Performance
Measures
Last Year’s performance (2015/16)
Annual Performance Target Years 1-3
Progress @ 30 June 2017
Explanation
Cemeteries have sufficient capacity
Each cemetery has at least 12 months capacity ahead
Hokitika 100%
Kumara 100%
Ross 100%
Hokitika 100%
Kumara 100%
Ross 50%
Hokitika 100%
Kumara 100%
Ross 80%
Council is aware that the Ross Cemetery is nearing capacity, and depending on deaths in the area this could be reached within the next 2-3 years. Council is aware of the need to investigate alternatives.
Burials adhere to relevant legislation
Standards for burial are adherence to Cemeteries & Cremations Act 1964
100% 100% 100%
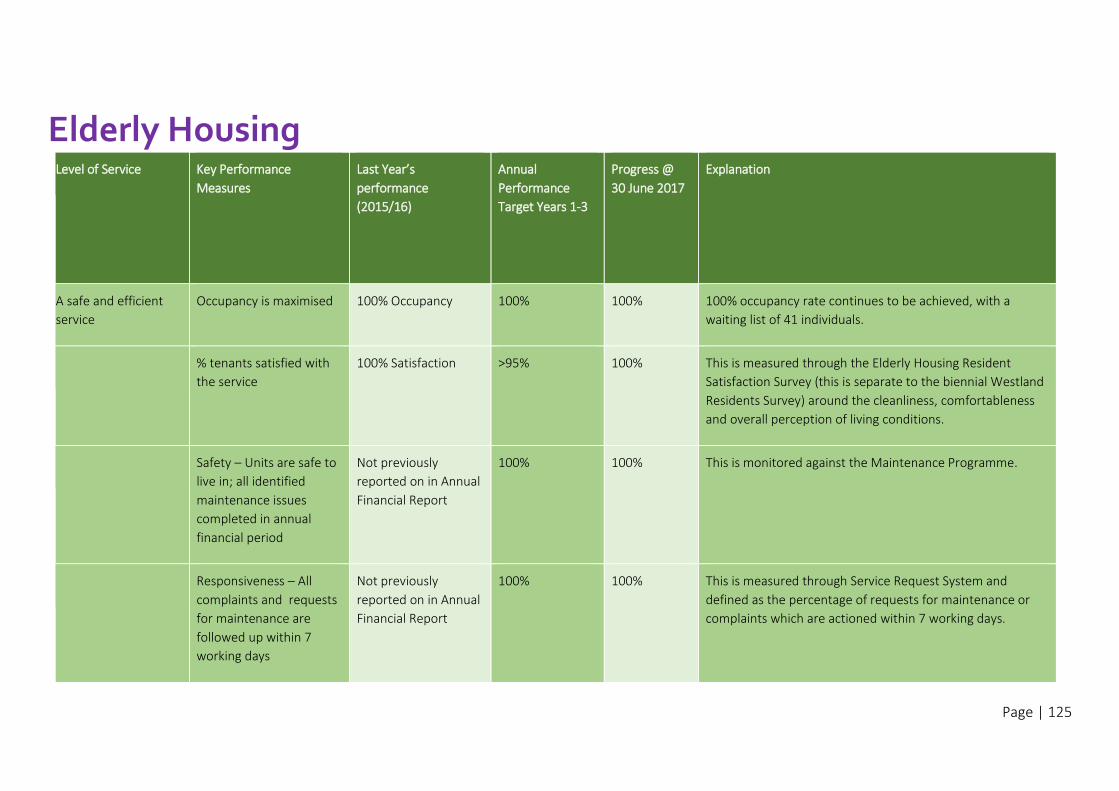
Page | 125
Elderly Housing
Level of Service Key Performance
Measures
Last Year’s
performance
(2015/16)
Annual
Performance
Target Years 1-3
Progress @
30 June 2017
Explanation
A safe and efficient
service
Occupancy is maximised 100% Occupancy 100% 100% 100% occupancy rate continues to be achieved, with a
waiting list of 41 individuals.
% tenants satisfied with
the service
100% Satisfaction >95% 100% This is measured through the Elderly Housing Resident
Satisfaction Survey (this is separate to the biennial Westland
Residents Survey) around the cleanliness, comfortableness
and overall perception of living conditions.
Safety – Units are safe to
live in; all identified
maintenance issues
completed in annual
financial period
Not previously
reported on in Annual
Financial Report
100% 100% This is monitored against the Maintenance Programme.
Responsiveness – All
complaints and requests
for maintenance are
followed up within 7
working days
Not previously
reported on in Annual
Financial Report
100% 100% This is measured through Service Request System and
defined as the percentage of requests for maintenance or
complaints which are actioned within 7 working days.
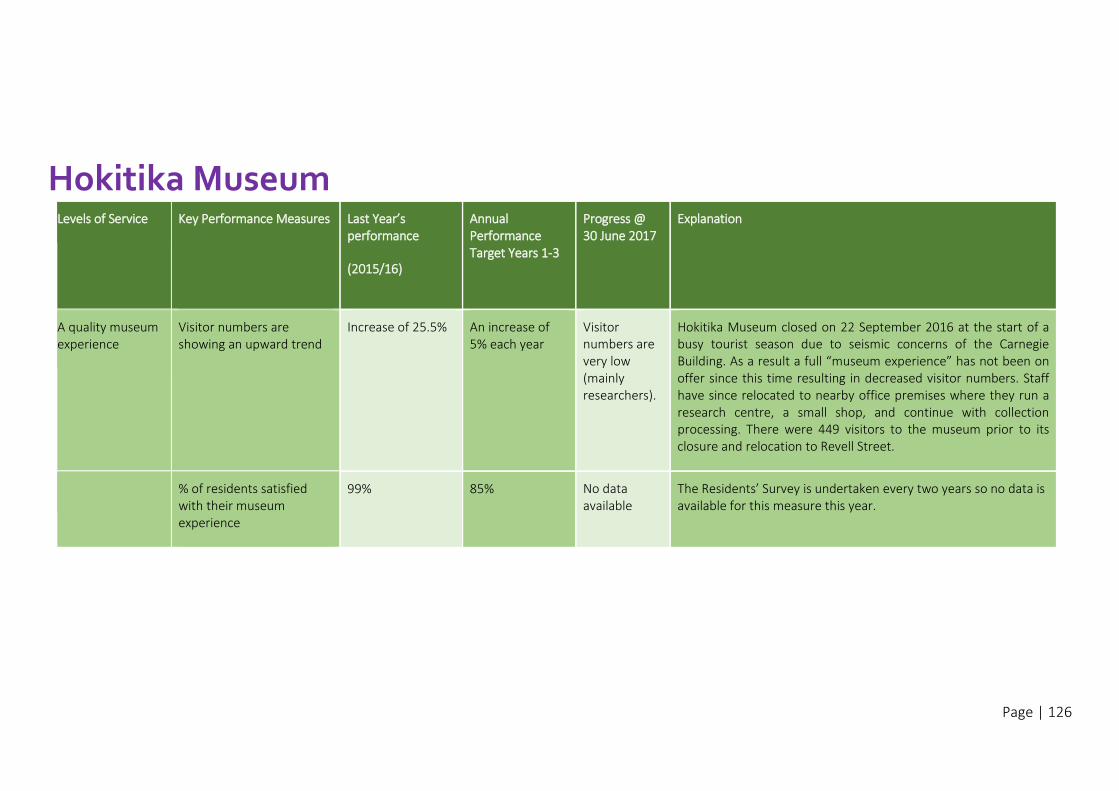
Page | 126
Hokitika Museum Levels of Service Key Performance Measures
Last Year’s performance
(2015/16)
Annual Performance Target Years 1-3
Progress @ 30 June 2017
Explanation
A quality museum experience
Visitor numbers are showing an upward trend
Increase of 25.5%
An increase of 5% each year
Visitor numbers are very low (mainly researchers).
Hokitika Museum closed on 22 September 2016 at the start of a busy tourist season due to seismic concerns of the Carnegie Building. As a result a full “museum experience” has not been on offer since this time resulting in decreased visitor numbers. Staff have since relocated to nearby office premises where they run a research centre, a small shop, and continue with collection processing. There were 449 visitors to the museum prior to its closure and relocation to Revell Street.
% of residents satisfied with their museum experience
99% 85% No data available
The Residents’ Survey is undertaken every two years so no data is available for this measure this year.
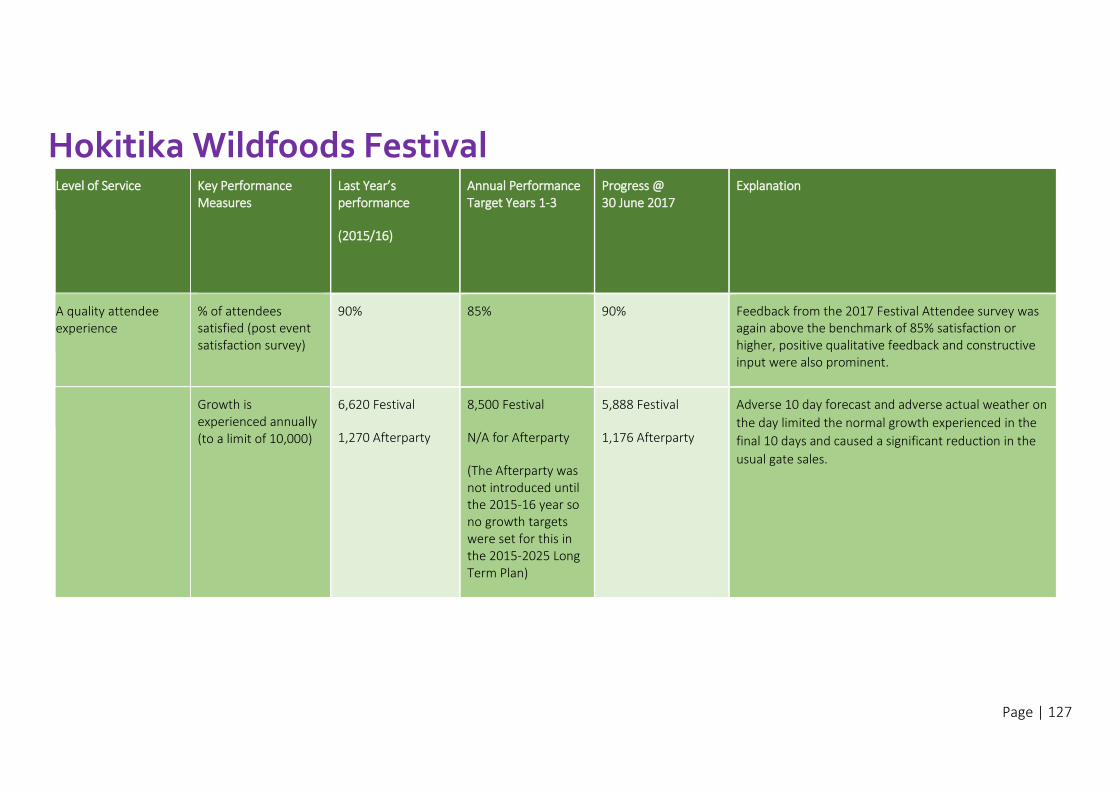
Page | 127
Hokitika Wildfoods Festival Level of Service Key Performance
Measures
Last Year’s performance
(2015/16)
Annual Performance Target Years 1-3
Progress @ 30 June 2017
Explanation
A quality attendee experience
% of attendees satisfied (post event satisfaction survey)
90% 85% 90%
Feedback from the 2017 Festival Attendee survey was again above the benchmark of 85% satisfaction or higher, positive qualitative feedback and constructive input were also prominent.
Growth is experienced annually (to a limit of 10,000)
6,620 Festival
1,270 Afterparty
8,500 Festival
N/A for Afterparty
(The Afterparty was not introduced until the 2015-16 year so no growth targets were set for this in the 2015-2025 Long Term Plan)
5,888 Festival
1,176 Afterparty
Adverse 10 day forecast and adverse actual weather on
the day limited the normal growth experienced in the
final 10 days and caused a significant reduction in the
usual gate sales.
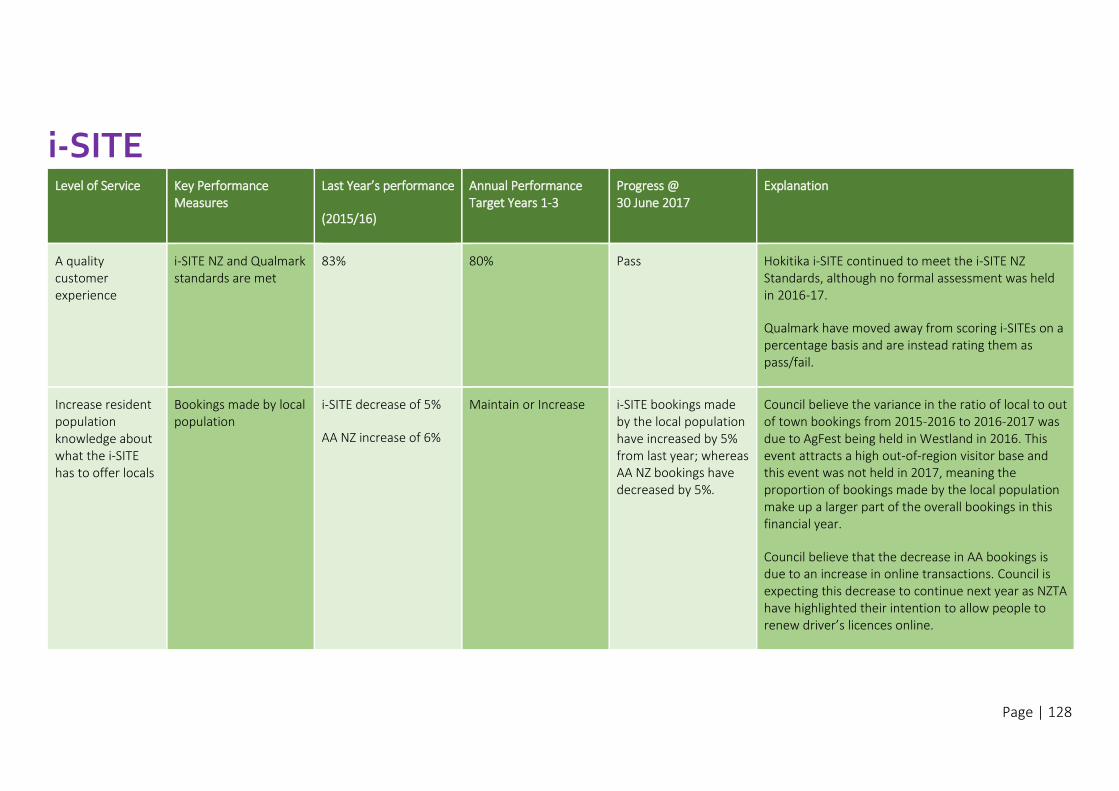
Page | 128
i-SITE
Level of Service Key Performance Measures
Last Year’s performance
(2015/16)
Annual Performance Target Years 1-3
Progress @ 30 June 2017
Explanation
A quality customer experience
i-SITE NZ and Qualmark standards are met
83% 80% Pass Hokitika i-SITE continued to meet the i-SITE NZ Standards, although no formal assessment was held in 2016-17.
Qualmark have moved away from scoring i-SITEs on a percentage basis and are instead rating them as pass/fail.
Increase resident population knowledge about what the i-SITE has to offer locals
Bookings made by local population
i-SITE decrease of 5%
AA NZ increase of 6%
Maintain or Increase i-SITE bookings made by the local population have increased by 5% from last year; whereas AA NZ bookings have decreased by 5%.
Council believe the variance in the ratio of local to out of town bookings from 2015-2016 to 2016-2017 was due to AgFest being held in Westland in 2016. This event attracts a high out-of-region visitor base and this event was not held in 2017, meaning the proportion of bookings made by the local population make up a larger part of the overall bookings in this financial year.
Council believe that the decrease in AA bookings is due to an increase in online transactions. Council is expecting this decrease to continue next year as NZTA have highlighted their intention to allow people to renew driver’s licences online.
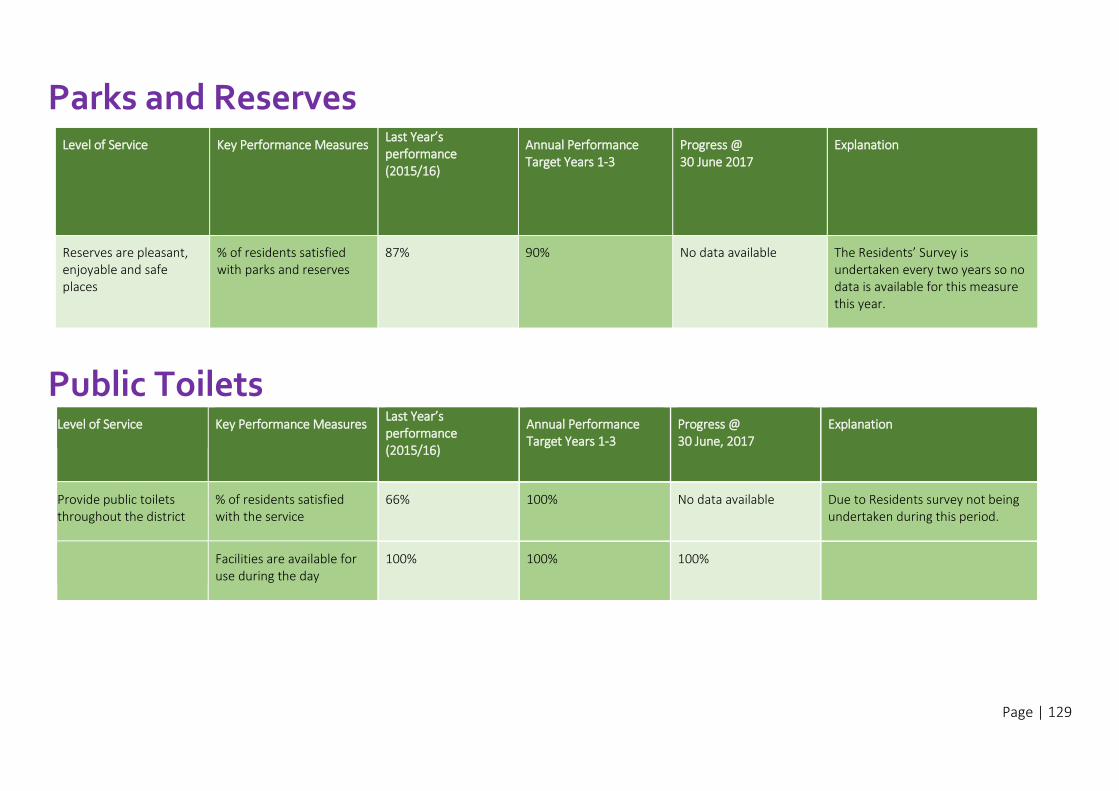
Page | 129
Parks and Reserves
Level of Service Key Performance Measures
Last Year’s performance (2015/16)
Annual Performance Target Years 1-3
Progress @ 30 June 2017
Explanation
Reserves are pleasant, enjoyable and safe places
% of residents satisfied with parks and reserves
87% 90% No data available The Residents’ Survey is undertaken every two years so no data is available for this measure this year.
Public Toilets Level of Service Key Performance Measures
Last Year’s performance (2015/16)
Annual Performance Target Years 1-3
Progress @ 30 June, 2017
Explanation
Provide public toilets throughout the district
% of residents satisfied with the service
66% 100% No data available Due to Residents survey not being undertaken during this period.
Facilities are available for use during the day
100% 100% 100%
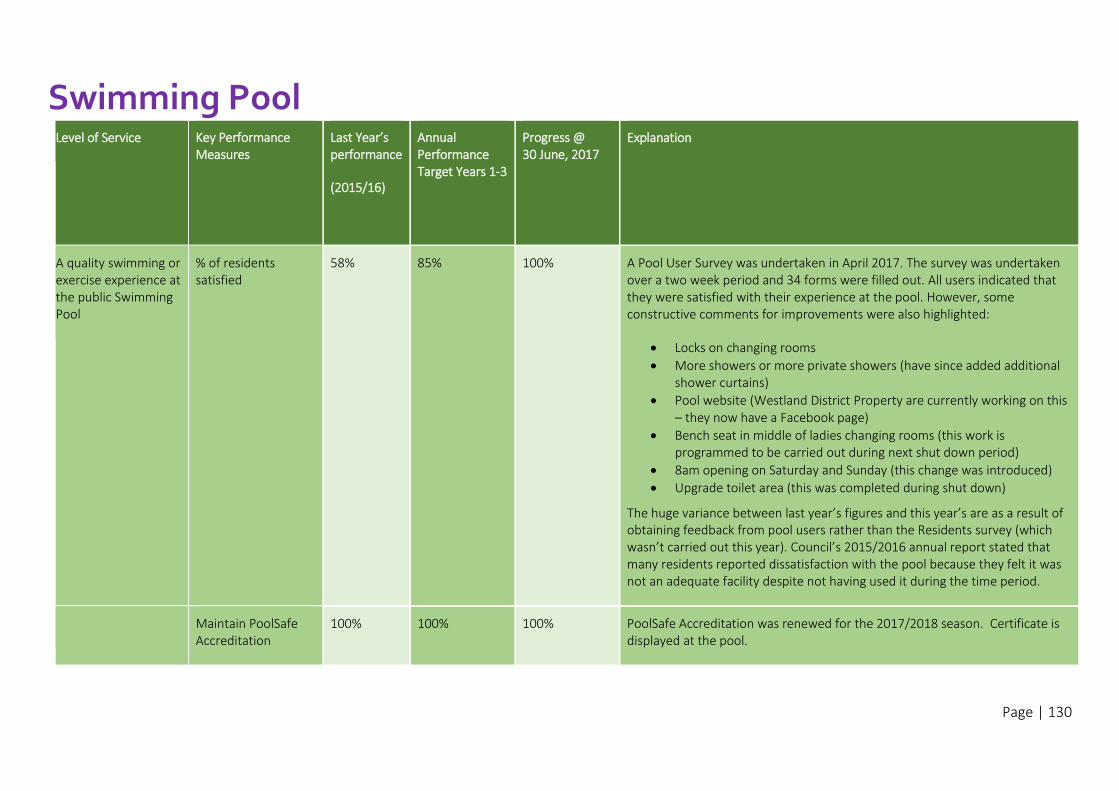
Page | 130
Swimming Pool Level of Service Key Performance
Measures
Last Year’s performance
(2015/16)
Annual Performance Target Years 1-3
Progress @ 30 June, 2017
Explanation
A quality swimming or exercise experience at the public Swimming Pool
% of residents satisfied
58% 85% 100% A Pool User Survey was undertaken in April 2017. The survey was undertaken over a two week period and 34 forms were filled out. All users indicated that they were satisfied with their experience at the pool. However, some constructive comments for improvements were also highlighted:
Locks on changing rooms
More showers or more private showers (have since added additional shower curtains)
Pool website (Westland District Property are currently working on this – they now have a Facebook page)
Bench seat in middle of ladies changing rooms (this work is programmed to be carried out during next shut down period)
8am opening on Saturday and Sunday (this change was introduced)
Upgrade toilet area (this was completed during shut down)
The huge variance between last year’s figures and this year’s are as a result of obtaining feedback from pool users rather than the Residents survey (which wasn’t carried out this year). Council’s 2015/2016 annual report stated that many residents reported dissatisfaction with the pool because they felt it was not an adequate facility despite not having used it during the time period.
Maintain PoolSafe Accreditation
100% 100% 100% PoolSafe Accreditation was renewed for the 2017/2018 season. Certificate is displayed at the pool.
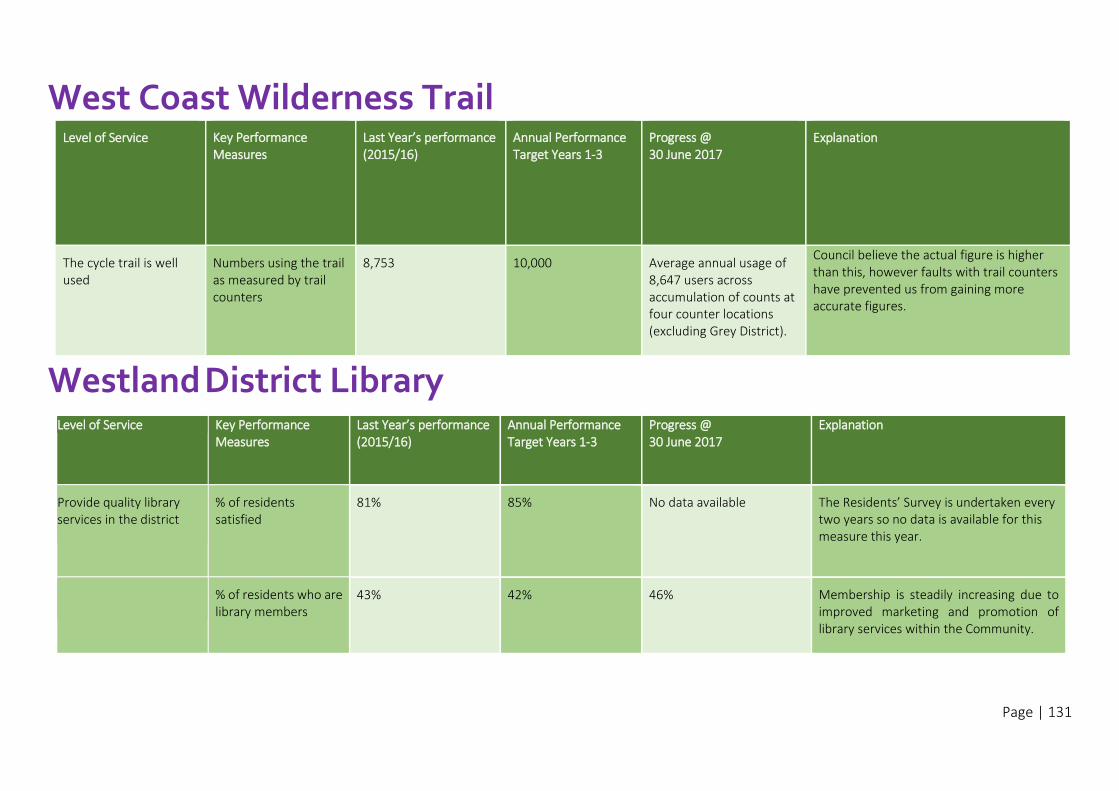
Page | 131
West Coast Wilderness Trail Level of Service Key Performance
Measures
Last Year’s performance (2015/16)
Annual Performance Target Years 1-3
Progress @ 30 June 2017
Explanation
The cycle trail is well used
Numbers using the trail as measured by trail counters
8,753 10,000 Average annual usage of 8,647 users across accumulation of counts at four counter locations (excluding Grey District).
Council believe the actual figure is higher than this, however faults with trail counters have prevented us from gaining more accurate figures.
Westland District Library
Level of Service Key Performance Measures
Last Year’s performance (2015/16)
Annual Performance Target Years 1-3
Progress @ 30 June 2017
Explanation
Provide quality library services in the district
% of residents satisfied
81% 85% No data available The Residents’ Survey is undertaken every two years so no data is available for this measure this year.
% of residents who are library members
43% 42% 46% Membership is steadily increasing due to improved marketing and promotion of library services within the Community.
Page | 132
An overview of the 2015/16 year:
An overview of the 2016/17 year: The Transportation team maintained the existing roading network for this financial period. $983,526 was expended in sealed road resurfacing.
Keoghans Road was sealed, and a business case was started to support NZTA funding for Whitcombe Valley Road safety improvements.
Work began for Council’s application for roading funding from Central Government for the period 2018-2021. This work was undertaken in alliance with Grey District Council and Buller District Council.
The Transportation team attended a number of road efficiency group seminars regarding changes to national roading under New Zealand Transport Agency’s One Network Road Classification System (ONRC).
Council’s collaboration with Grey District Council for sharing resources and combing some contracts for resealing continued. In addition, we worked in partnership with Buller District Council and Grey District Council with regards to Activity/Asset Management Plans.
A trail shape correction of one of the corduroy areas of the Haast Jacksons Bay Special Purpose was constructed during this period.
58 transportation related service requests were logged in the Council’s service request system during this period. Of this total, the largest category (26 requests) related to roading drainage issues. In addition, there were nine footpaths requests, eight streetlights requests, seven signage requests, five traffic management requests and two car parking requests (both for Hokitika) and one rural roading and drainage. These statistics indicate that there has been better utilisation of our service request system for logging transportation issues compared to the previous financial year (when zero were logged). However, further system improvements are still needed as service requests are not being correctly closed and signed off. As a result of this, only 18 have been officially closed and 39 remain open and overdue. This does not accurately reflect response times but does highlight a need to correctly update our system once jobs have been completed.
Council has met the road smoothness measure outlined in the 2015-2025 Long Term Plan.
Activity group: Transportation
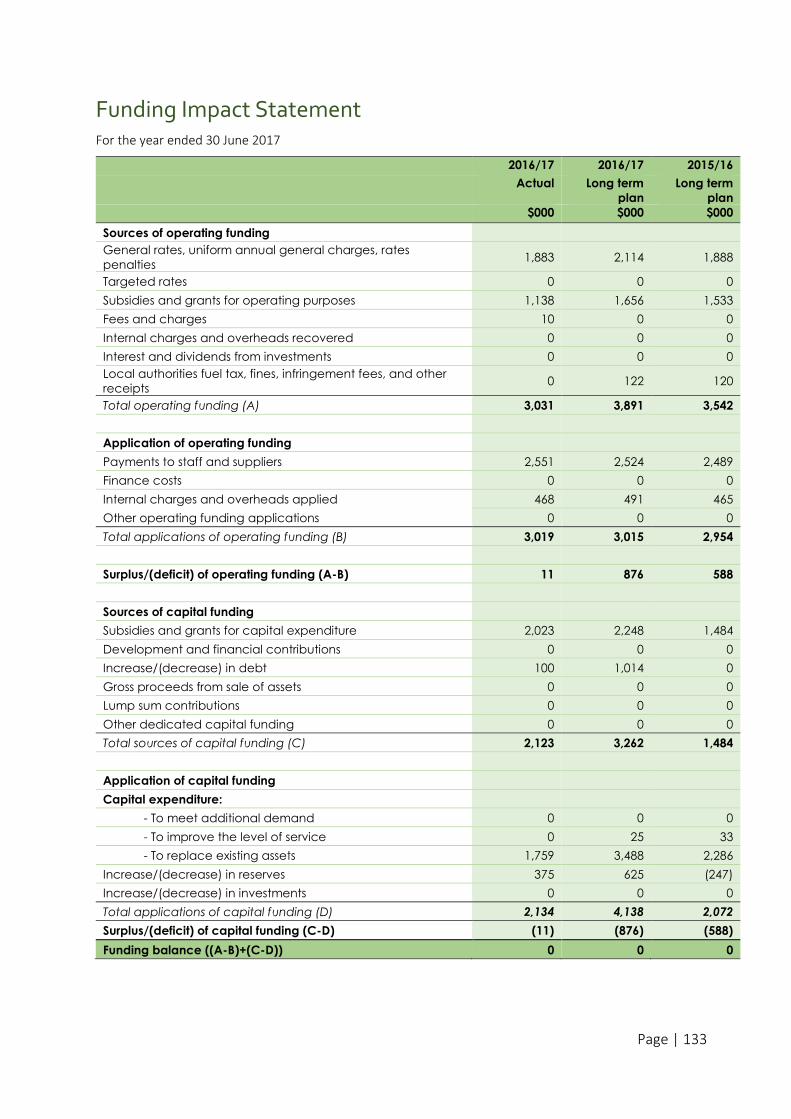
Page | 133
Funding Impact Statement For the year ended 30 June 2017
2016/17 2016/17 2015/16
Actual Long term
plan
Long term
plan
$000 $000 $000
Sources of operating funding
General rates, uniform annual general charges, rates
penalties 1,883 2,114 1,888
Targeted rates 0 0 0
Subsidies and grants for operating purposes 1,138 1,656 1,533
Fees and charges 10 0 0
Internal charges and overheads recovered 0 0 0
Interest and dividends from investments 0 0 0
Local authorities fuel tax, fines, infringement fees, and other
receipts 0 122 120
Total operating funding (A) 3,031 3,891 3,542
Application of operating funding
Payments to staff and suppliers 2,551 2,524 2,489
Finance costs 0 0 0
Internal charges and overheads applied 468 491 465
Other operating funding applications 0 0 0
Total applications of operating funding (B) 3,019 3,015 2,954
Surplus/(deficit) of operating funding (A-B) 11 876 588
Sources of capital funding
Subsidies and grants for capital expenditure 2,023 2,248 1,484
Development and financial contributions 0 0 0
Increase/(decrease) in debt 100 1,014 0
Gross proceeds from sale of assets 0 0 0
Lump sum contributions 0 0 0
Other dedicated capital funding 0 0 0
Total sources of capital funding (C) 2,123 3,262 1,484
Application of capital funding
Capital expenditure:
- To meet additional demand 0 0 0
- To improve the level of service 0 25 33
- To replace existing assets 1,759 3,488 2,286
Increase/(decrease) in reserves 375 625 (247)
Increase/(decrease) in investments 0 0 0
Total applications of capital funding (D) 2,134 4,138 2,072
Surplus/(deficit) of capital funding (C-D) (11) (876) (588)
Funding balance ((A-B)+(C-D)) 0 0 0
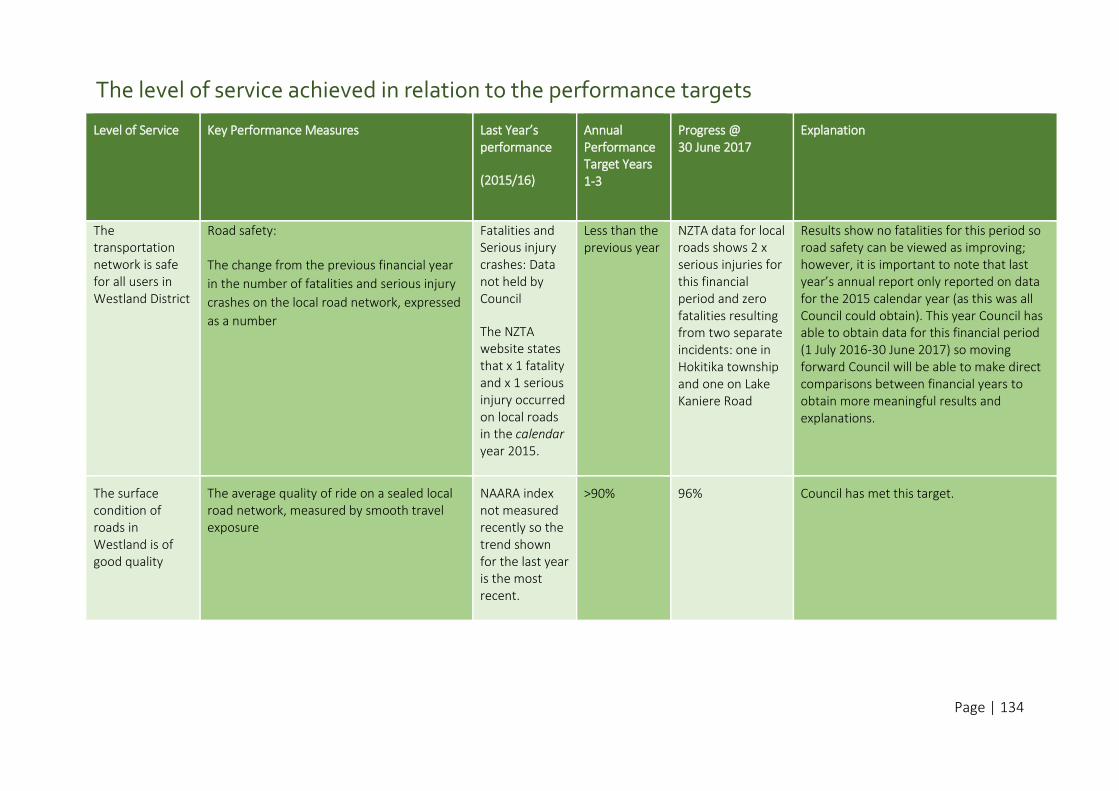
Page | 134
The level of service achieved in relation to the performance targets
Level of Service Key Performance Measures
Last Year’s performance
(2015/16)
Annual Performance Target Years 1-3
Progress @ 30 June 2017
Explanation
The transportation network is safe for all users in Westland District
Road safety:
The change from the previous financial year
in the number of fatalities and serious injury
crashes on the local road network, expressed
as a number
Fatalities and Serious injury crashes: Data not held by Council
The NZTA website states that x 1 fatality and x 1 serious injury occurred on local roads in the calendar year 2015.
Less than the previous year
NZTA data for local roads shows 2 x serious injuries for this financial period and zero fatalities resulting from two separate incidents: one in Hokitika township and one on Lake Kaniere Road
Results show no fatalities for this period so road safety can be viewed as improving; however, it is important to note that last year’s annual report only reported on data for the 2015 calendar year (as this was all Council could obtain). This year Council has able to obtain data for this financial period (1 July 2016-30 June 2017) so moving forward Council will be able to make direct comparisons between financial years to obtain more meaningful results and explanations.
The surface condition of roads in Westland is of good quality
The average quality of ride on a sealed local road network, measured by smooth travel exposure
NAARA index not measured recently so the trend shown for the last year is the most recent.
>90%
96% Council has met this target.
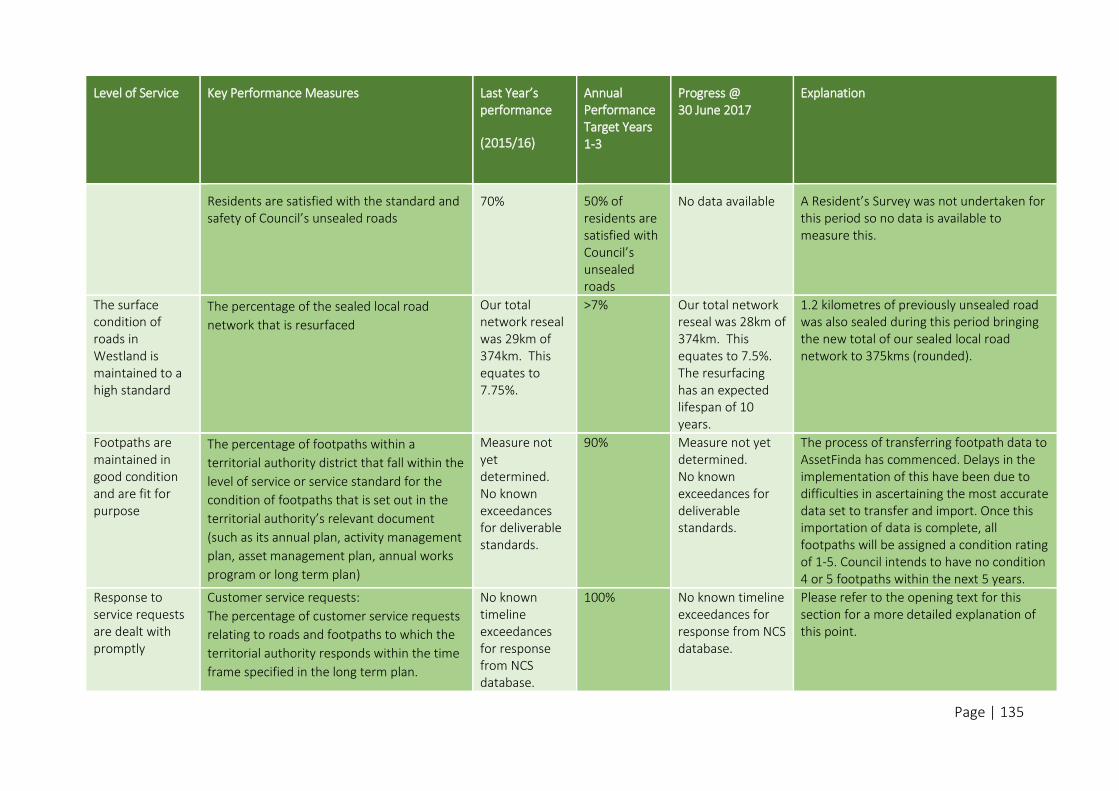
Page | 135
Level of Service Key Performance Measures
Last Year’s performance
(2015/16)
Annual Performance Target Years 1-3
Progress @ 30 June 2017
Explanation
Residents are satisfied with the standard and safety of Council’s unsealed roads
70%
50% of residents are satisfied with Council’s unsealed roads
No data available
A Resident’s Survey was not undertaken for this period so no data is available to measure this.
The surface condition of roads in Westland is maintained to a high standard
The percentage of the sealed local road
network that is resurfaced
Our total network reseal was 29km of 374km. This equates to 7.75%.
>7% Our total network reseal was 28km of 374km. This equates to 7.5%. The resurfacing has an expected lifespan of 10 years.
1.2 kilometres of previously unsealed road was also sealed during this period bringing the new total of our sealed local road network to 375kms (rounded).
Footpaths are maintained in good condition and are fit for purpose
The percentage of footpaths within a
territorial authority district that fall within the
level of service or service standard for the
condition of footpaths that is set out in the
territorial authority’s relevant document
(such as its annual plan, activity management
plan, asset management plan, annual works
program or long term plan)
Measure not yet determined. No known exceedances for deliverable standards.
90% Measure not yet determined. No known exceedances for deliverable standards.
The process of transferring footpath data to AssetFinda has commenced. Delays in the implementation of this have been due to difficulties in ascertaining the most accurate data set to transfer and import. Once this importation of data is complete, all footpaths will be assigned a condition rating of 1-5. Council intends to have no condition 4 or 5 footpaths within the next 5 years.
Response to service requests are dealt with promptly
Customer service requests:
The percentage of customer service requests
relating to roads and footpaths to which the
territorial authority responds within the time
frame specified in the long term plan.
No known timeline exceedances for response from NCS database.
100% No known timeline exceedances for response from NCS database.
Please refer to the opening text for this section for a more detailed explanation of this point.
Page | 136
An overview of the 2016/17 year: Council supplies reticulated water to 2620 connections in the district.
Council’s customer request system records show that there were 61 water related service requests logged between 1 July 2016 and 30 June 2017. Two of these were water clarity service requests which were later eliminated. The claim of kittens catching Giardia from the water supply was unsubstantiated as our water supply was not found to have Giardia. A reported incident of faecal contamination related to a private water supply not one provided by Council and was also excluded from the final tally. This reduces the total number of valid service requests to 59. Of these, there were 3 toby faults, 18 water leaks, and 4 relating to customer satisfaction of drinking water clarity, taste or odour (as detailed in the level of service table later in this section). A further 25 requests were general enquiries, water service location requests, and requests for water meters to be read. 42 of the service requests related to Hokitika, 5 for Whataroa, 3 each for Kumara and Hari Hari, 2 each for Kaniere and Ross and one each for Blue Spur and Franz Josef.
Water meters replacements were ongoing in 2016/2017 in Franz Josef, Fox Glacier and Hokitika and relevant backflow prevention devices were also installed as required at the land owner’s expense.
Westland District Council manages nine water supplies across the district. Five of the nine supplies (Kumara, Hokitika, Ross, Franz Josef and Fox Glacier) are sourced from surface water (streams, lakes, and rivers). The remaining four supplies (Arahura, Hari Hari, Whataroa and Haast) are sourced from underground from bores.
Two of the nine water supplies that Council manages are untreated water supplies. This means that no form of treatment (filtration, UV, chlorination or a combination of treatment applications that we typically use in other treatment plants across the district) are applied to the water before the water is supplied to customers. The two untreated water supplies are Kumara and Arahura. Water quality sampling is carried out more frequently as a result of these supplies being untreated and with the aim of meeting the requirements of the Drinking Water Standards for New Zealand 2005 (Revised 2008). In 2015 Council was granted a subsidy through the Ministry of Health’s Drinking Water Assistance Programme for the upgrade of the Kumara water treatment plant in the 2016/17 financial year. Both the Whataroa and Kumara Water Treatment Plant upgrade projects to achieve protozoal compliance were deferred and not carried out during this period as a result of a Serious Fraud Investigation regarding how the contracts were awarded. Negotiations then commenced with the second preferred tenderer.
Protozoal compliance:
Five of the nine water supplies that Council manages are capable of achieving protozoal compliance. These are Hokitika, Ross, Hari Hari, Franz Josef and Haast. This means that the treatment processes that are in place in these five supplies are sufficient to achieve compliance. However Council has not yet set up measuring systems on these five supplies to prove that this compliance is being achieved by use of SCADA and direct chemical dosing measurements. It intends to progress technical upgrades in the future. This is not a budgeted item as the upgrades will be achieved alongside other planned operational upgrades.
The Fox and Arahura systems are still being evaluated – they are identified as Year 3 projects.
Activity group: Water Supply
Page | 137
The Health (Drinking Water) Amendment Act 2007 requires that drinking water suppliers implement a Water Safety Plan (previously known as a Public Health Risk Management Plan) for all of their water supplies serving a population over 500. Water Safety Plans identify risks associated with the water supply and include an improvement schedule that assists in prioritising future work to minimise the risks identified. Water Safety Plans for the Arahura, Hokitika and Whataroa water supplies were reviewed in 2016 and adopted in early 2017 by the Ministry of Health.
Reporting on response timeframes: During this year, Council continued to experience frustration with the accurate logging of service request records. However, efforts began during this period and are ongoing after the conclusion of this financial period to improve our systems moving forward. Specifically:
1. The categories of water related service requests have been expanded to ensure that all fields Council needs to report on are listed as separate fields. This enables Council’s Customer Services staff who field calls to accurately select the correct field.
2. Work has begun to ensure that each service request field is automatically tagged with the appropriate response timeline as set out in Council’s 2015-2025 Long Term Plan.
3. Service request group training tutorials are underway to identify limitations of the current system, identify and implement solutions and ensure all new and existing staff are trained in the correct processes and that this knowledge is refreshed regularly.
4. A full service request logging manual is in the process of being created. 5. Staff are also upgrading their knowledge of how to accurately generate reports of the data contained
with the service request database.
Council is confident that it will be able to use its service request system to accurately report about response times going forward.
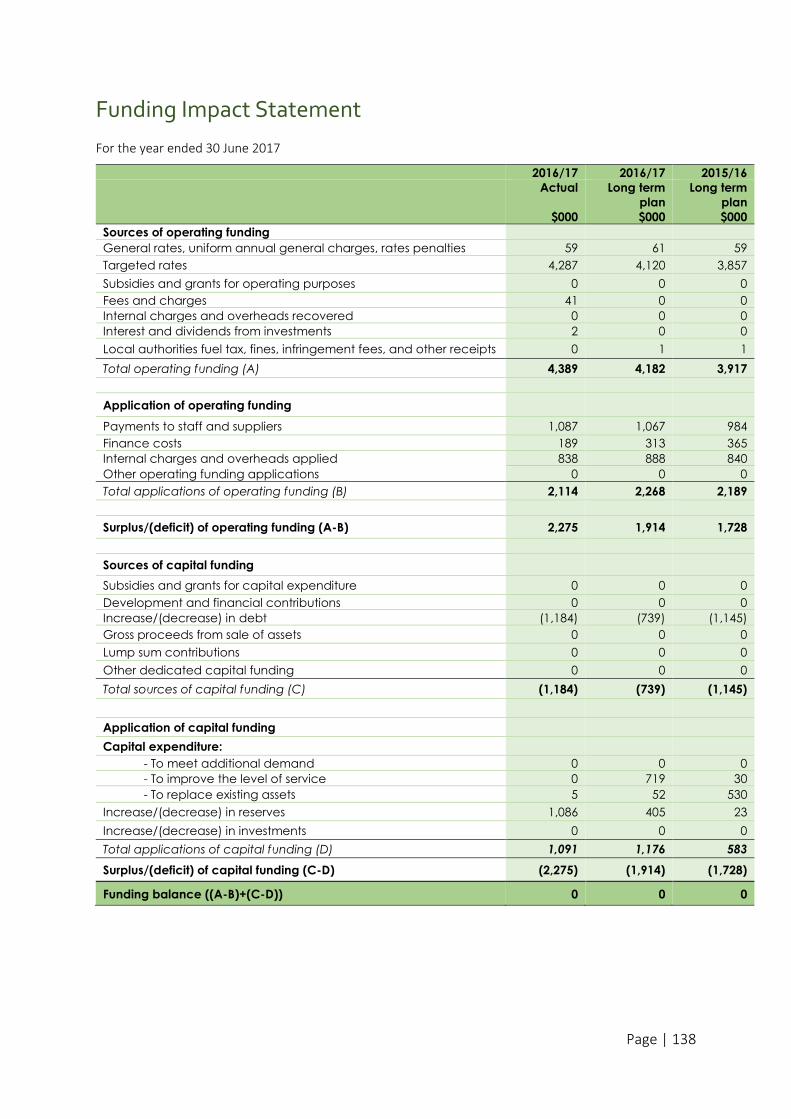
Page | 138
Funding Impact Statement
For the year ended 30 June 2017
2016/17 2016/17 2015/16
Actual Long term
plan
Long term
plan
$000 $000 $000
Sources of operating funding
General rates, uniform annual general charges, rates penalties 59 61 59
Targeted rates 4,287 4,120 3,857
Subsidies and grants for operating purposes 0 0 0
Fees and charges 41 0 0
Internal charges and overheads recovered 0 0 0
Interest and dividends from investments 2 0 0
Local authorities fuel tax, fines, infringement fees, and other receipts 0 1 1
Total operating funding (A) 4,389 4,182 3,917
Application of operating funding
Payments to staff and suppliers 1,087 1,067 984
Finance costs 189 313 365
Internal charges and overheads applied 838 888 840
Other operating funding applications 0 0 0
Total applications of operating funding (B) 2,114 2,268 2,189
Surplus/(deficit) of operating funding (A-B) 2,275 1,914 1,728
Sources of capital funding
Subsidies and grants for capital expenditure 0 0 0
Development and financial contributions 0 0 0
Increase/(decrease) in debt (1,184) (739) (1,145)
Gross proceeds from sale of assets 0 0 0
Lump sum contributions 0 0 0
Other dedicated capital funding 0 0 0
Total sources of capital funding (C) (1,184) (739) (1,145)
Application of capital funding
Capital expenditure:
- To meet additional demand 0 0 0
- To improve the level of service 0 719 30
- To replace existing assets 5 52 530
Increase/(decrease) in reserves 1,086 405 23
Increase/(decrease) in investments 0 0 0
Total applications of capital funding (D) 1,091 1,176 583
Surplus/(deficit) of capital funding (C-D) (2,275) (1,914) (1,728)
Funding balance ((A-B)+(C-D)) 0 0 0
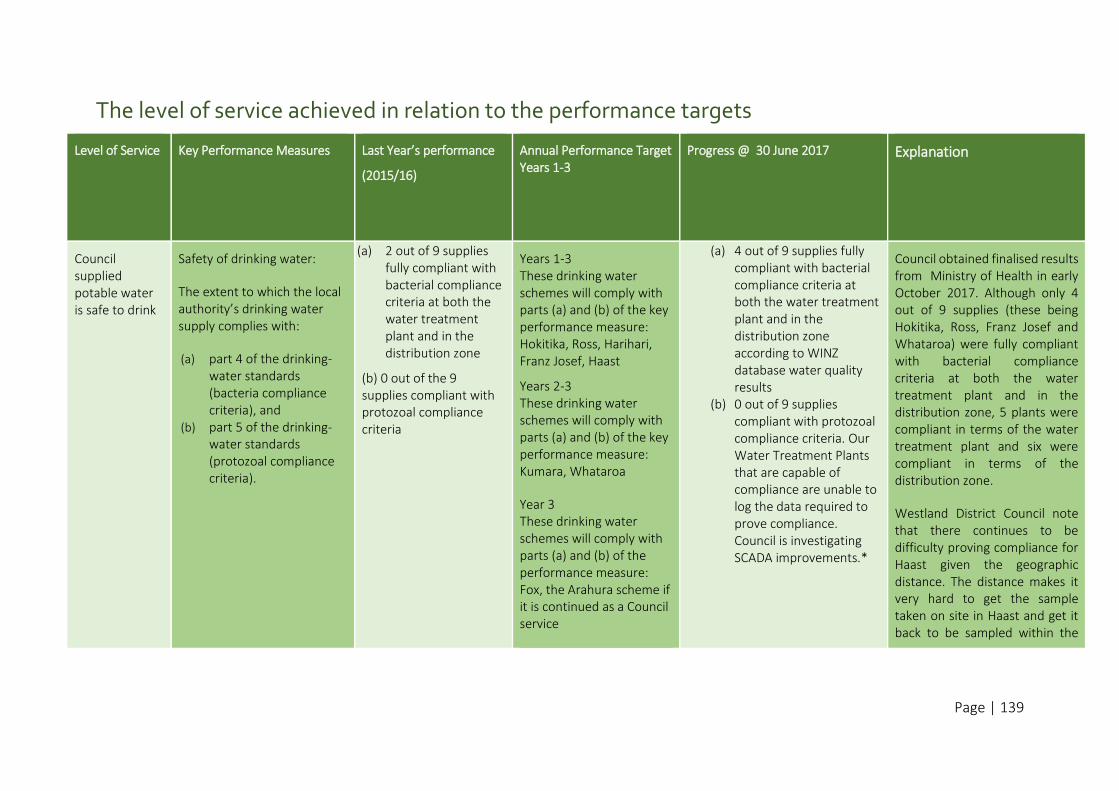
Page | 139
The level of service achieved in relation to the performance targets
Level of Service Key Performance Measures
Last Year’s performance
(2015/16)
Annual Performance Target Years 1-3
Progress @ 30 June 2017 Explanation
Council supplied potable water is safe to drink
Safety of drinking water:
The extent to which the local authority’s drinking water supply complies with:
(a) part 4 of the drinking-water standards (bacteria compliance criteria), and
(b) part 5 of the drinking-water standards (protozoal compliance criteria).
(a) 2 out of 9 supplies fully compliant with bacterial compliance criteria at both the water treatment plant and in the distribution zone
(b) 0 out of the 9 supplies compliant with protozoal compliance criteria
Years 1-3 These drinking water schemes will comply with parts (a) and (b) of the key performance measure: Hokitika, Ross, Harihari, Franz Josef, Haast
Years 2-3 These drinking water schemes will comply with parts (a) and (b) of the key performance measure: Kumara, Whataroa
Year 3 These drinking water schemes will comply with parts (a) and (b) of the performance measure: Fox, the Arahura scheme if it is continued as a Council service
(a) 4 out of 9 supplies fully compliant with bacterial compliance criteria at both the water treatment plant and in the distribution zone according to WINZ database water quality results
(b) 0 out of 9 supplies compliant with protozoal compliance criteria. Our Water Treatment Plants that are capable of compliance are unable to log the data required to prove compliance. Council is investigating SCADA improvements.*
Council obtained finalised results from Ministry of Health in early October 2017. Although only 4 out of 9 supplies (these being Hokitika, Ross, Franz Josef and Whataroa) were fully compliant with bacterial compliance criteria at both the water treatment plant and in the distribution zone, 5 plants were compliant in terms of the water treatment plant and six were compliant in terms of the distribution zone.
Westland District Council note that there continues to be difficulty proving compliance for Haast given the geographic distance. The distance makes it very hard to get the sample taken on site in Haast and get it back to be sampled within the
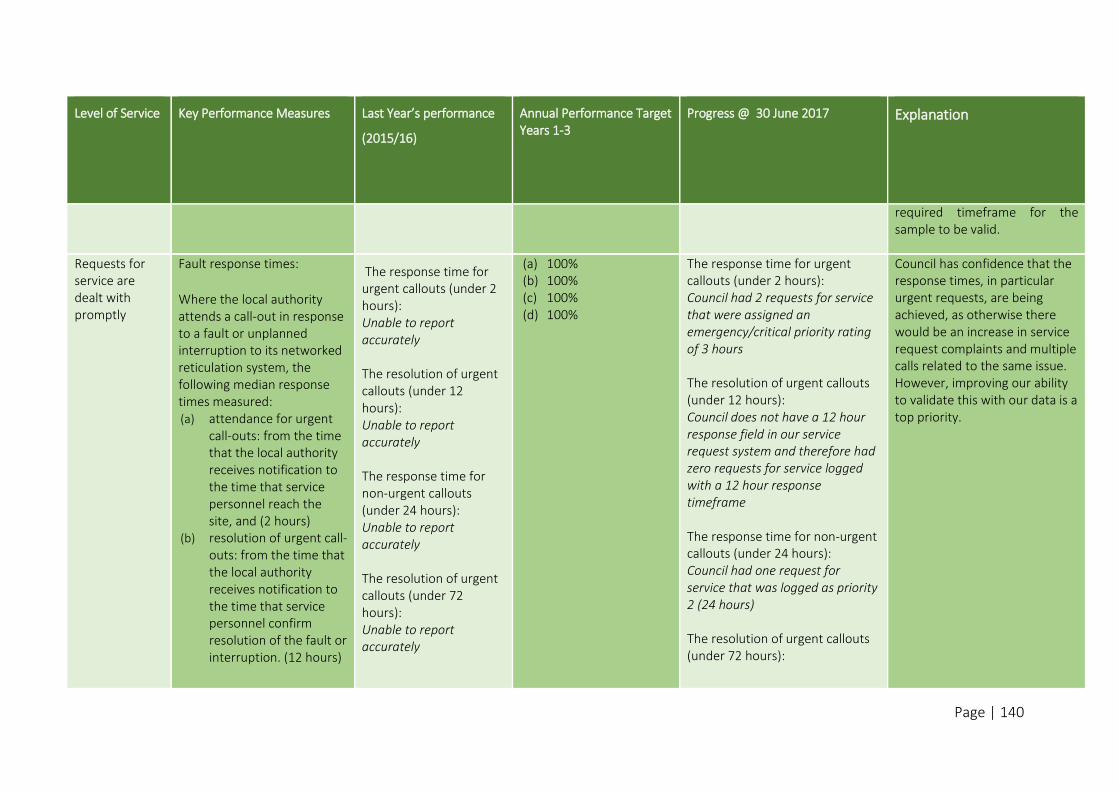
Page | 140
Level of Service Key Performance Measures
Last Year’s performance
(2015/16)
Annual Performance Target Years 1-3
Progress @ 30 June 2017 Explanation
required timeframe for the sample to be valid.
Requests for service are dealt with promptly
Fault response times:
Where the local authority attends a call-out in response to a fault or unplanned interruption to its networked reticulation system, the following median response times measured: (a) attendance for urgent
call-outs: from the time that the local authority receives notification to the time that service personnel reach the site, and (2 hours)
(b) resolution of urgent call-outs: from the time that the local authority receives notification to the time that service personnel confirm resolution of the fault or interruption. (12 hours)
The response time for urgent callouts (under 2 hours): Unable to report accurately The resolution of urgent callouts (under 12 hours): Unable to report accurately The response time for non-urgent callouts (under 24 hours): Unable to report accurately The resolution of urgent callouts (under 72 hours): Unable to report accurately
(a) 100% (b) 100% (c) 100% (d) 100%
The response time for urgent callouts (under 2 hours): Council had 2 requests for service that were assigned an emergency/critical priority rating of 3 hours The resolution of urgent callouts (under 12 hours): Council does not have a 12 hour response field in our service request system and therefore had zero requests for service logged with a 12 hour response timeframe The response time for non-urgent callouts (under 24 hours): Council had one request for service that was logged as priority 2 (24 hours) The resolution of urgent callouts (under 72 hours):
Council has confidence that the response times, in particular urgent requests, are being achieved, as otherwise there would be an increase in service request complaints and multiple calls related to the same issue. However, improving our ability to validate this with our data is a top priority.
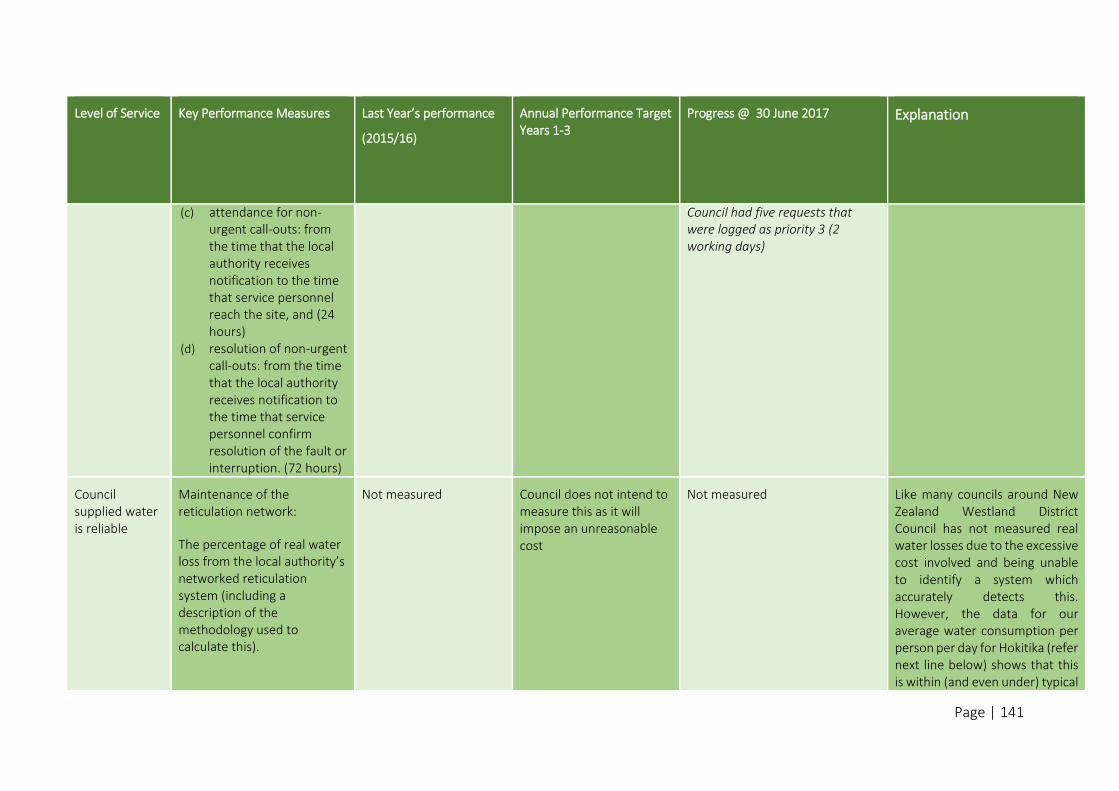
Page | 141
Level of Service Key Performance Measures
Last Year’s performance
(2015/16)
Annual Performance Target Years 1-3
Progress @ 30 June 2017 Explanation
(c) attendance for non-urgent call-outs: from the time that the local authority receives notification to the time that service personnel reach the site, and (24 hours)
(d) resolution of non-urgent call-outs: from the time that the local authority receives notification to the time that service personnel confirm resolution of the fault or interruption. (72 hours)
Council had five requests that were logged as priority 3 (2 working days)
Council supplied water is reliable
Maintenance of the reticulation network:
The percentage of real water loss from the local authority’s networked reticulation system (including a description of the methodology used to calculate this).
Not measured
Council does not intend to measure this as it will impose an unreasonable cost
Not measured Like many councils around New Zealand Westland District Council has not measured real water losses due to the excessive cost involved and being unable to identify a system which accurately detects this. However, the data for our average water consumption per person per day for Hokitika (refer next line below) shows that this is within (and even under) typical
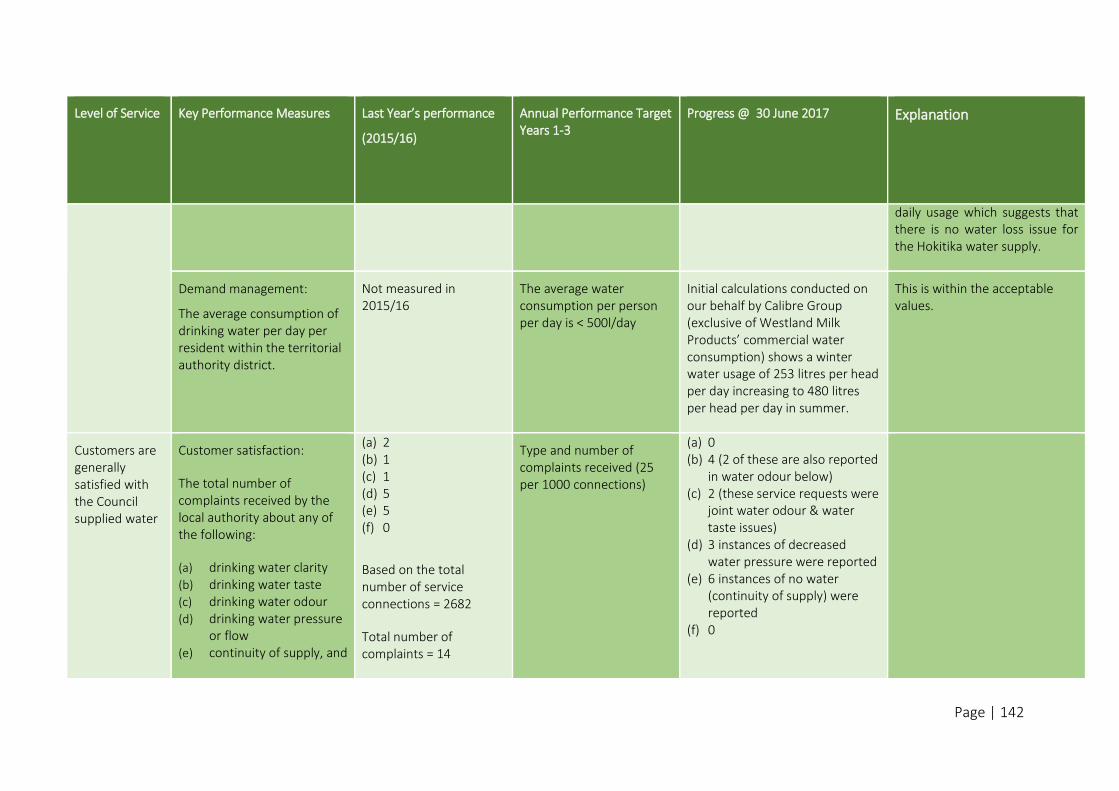
Page | 142
Level of Service Key Performance Measures
Last Year’s performance
(2015/16)
Annual Performance Target Years 1-3
Progress @ 30 June 2017 Explanation
daily usage which suggests that there is no water loss issue for the Hokitika water supply.
Demand management:
The average consumption of drinking water per day per resident within the territorial authority district.
Not measured in 2015/16
The average water consumption per person per day is < 500l/day
Initial calculations conducted on our behalf by Calibre Group (exclusive of Westland Milk Products’ commercial water consumption) shows a winter water usage of 253 litres per head per day increasing to 480 litres per head per day in summer.
This is within the acceptable values.
Customers are generally satisfied with the Council supplied water
Customer satisfaction:
The total number of complaints received by the local authority about any of the following:
(a) drinking water clarity (b) drinking water taste (c) drinking water odour (d) drinking water pressure
or flow (e) continuity of supply, and
(a) 2 (b) 1 (c) 1 (d) 5 (e) 5 (f) 0
Based on the total number of service connections = 2682
Total number of complaints = 14
Type and number of complaints received (25 per 1000 connections)
(a) 0 (b) 4 (2 of these are also reported
in water odour below) (c) 2 (these service requests were
joint water odour & water taste issues)
(d) 3 instances of decreased water pressure were reported
(e) 6 instances of no water (continuity of supply) were reported
(f) 0
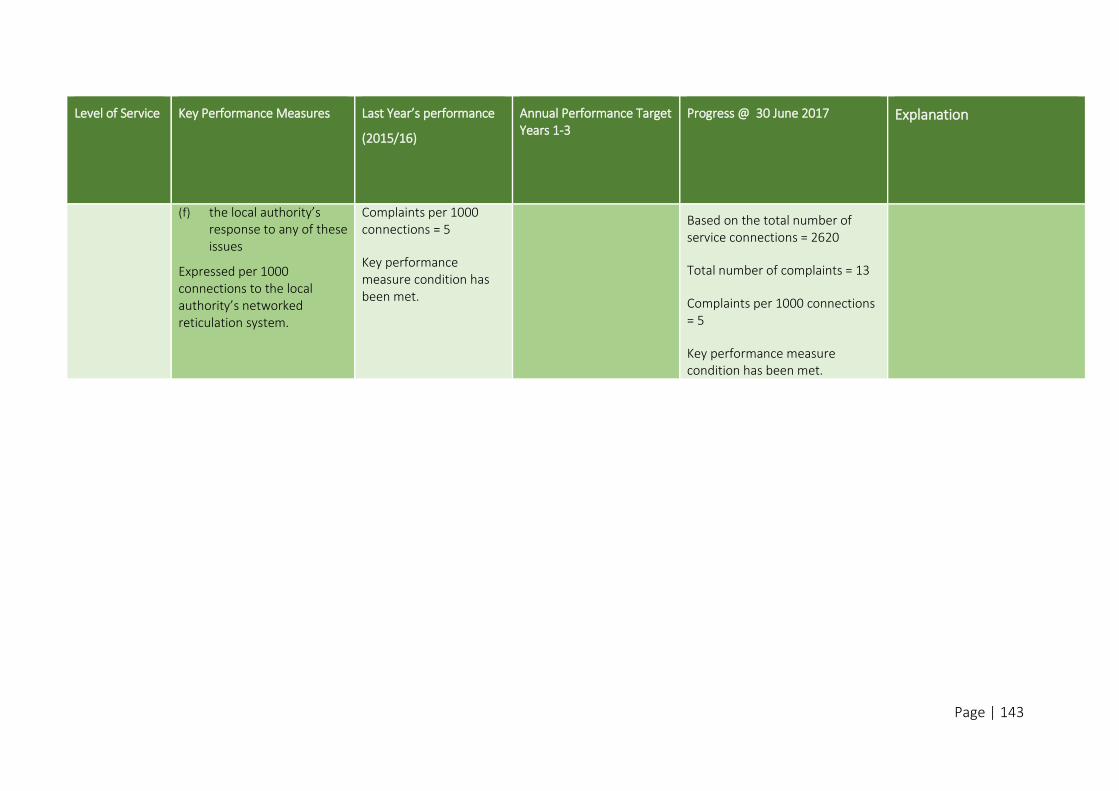
Page | 143
Level of Service Key Performance Measures
Last Year’s performance
(2015/16)
Annual Performance Target Years 1-3
Progress @ 30 June 2017 Explanation
(f) the local authority’s response to any of these issues
Expressed per 1000 connections to the local authority’s networked reticulation system.
Complaints per 1000 connections = 5
Key performance measure condition has been met.
Based on the total number of service connections = 2620
Total number of complaints = 13
Complaints per 1000 connections = 5
Key performance measure condition has been met.
Page | 144
An overview of the 2016/17 year: Council provides access to reticulated wastewater systems in Hokitika, Franz Josef, Fox Glacier and Haast.
These systems service 2,052 properties.
There were 10 wastewater related service requests logged between 1 July 2016 and 30 June 2017; 10 of
which related to Hokitika and 1 in Franz Josef. Four of these were 3 wastewater overflow issues and an
additional 3 service requests were logged in relation to odour. The remainder of service requests were
more general enquiries relating to location, measurements and quotes for connection to our sewerage
system.
The Hokitika Wastewater Treatment Plant outfall has now been repaired and Westland District Council have engaged a consultant to assist with odour reporting within the prescribed timeframe. Flow monitoring devices are also being introduced, and pond flow options are being investigated to improve treatment and discharge quality for our current resource consent.
In March 2016, the Waiho River flooded the Franz Josef Wastewater Treatment Plant resulting in significant damage to the oxidation ponds. Council undertook some immediate remedial work to mitigate the effect on the environment. Council has since resolved to protect the pond site with construction of a 700 metre long stop bank, at a cost of $1.3 million before the upgrade of the Wastewater Treatment Plant takes place. A government grant has been applied for to assist in covering the treatment upgrade costs.
Westland District Council noted the new reporting requirement introduced to differentiate between dry weather sewerage overflows and wet weather sewerage overflows. We have set up an alert in our service request system which prompts the staff member logging the request to ask about the weather conditions. This system is imperfect however as the weather can be completely different between two townships even 10 kilometres apart. Council notes that a “wet weather sewerage overflow” is defined as there being 1mm of rain in a continuous 24 hour period which is a confusing measurement for the District’s geographic environment which is used to high rainfall. Council does not have automatic rain gauges at all our Wastewater sites and are therefore reliant on Hokitika data.
Activity group: Wastewater
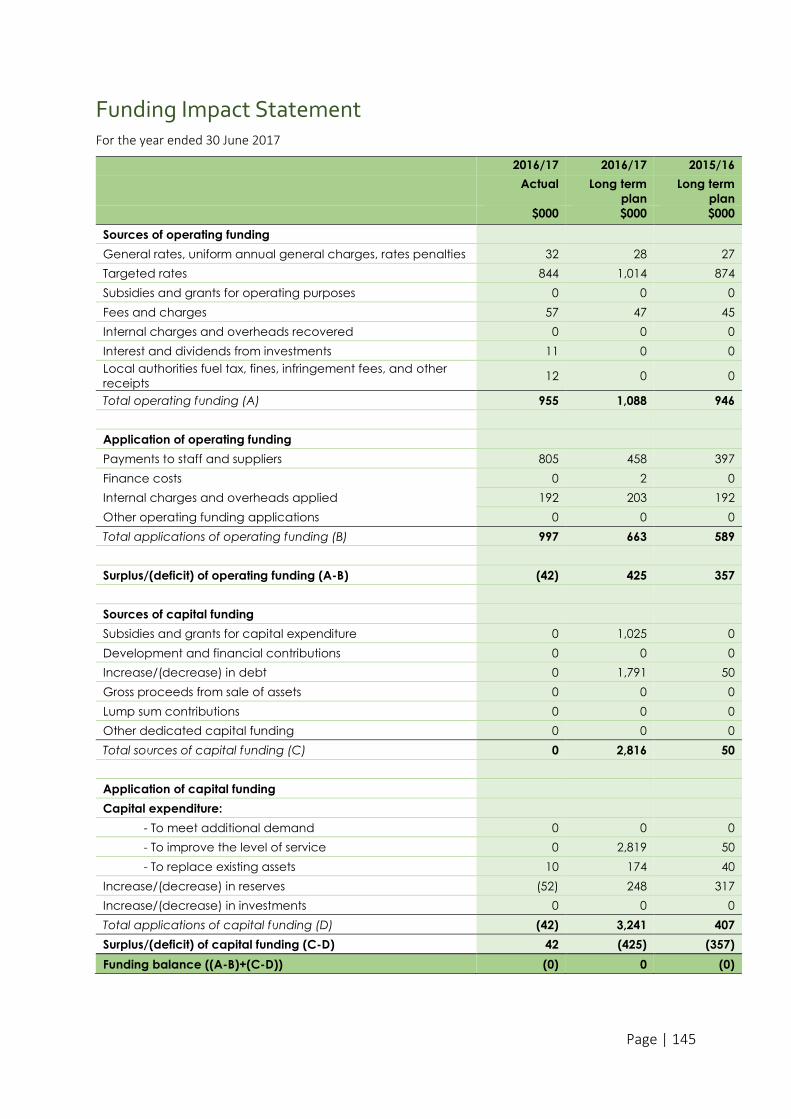
Page | 145
Funding Impact Statement For the year ended 30 June 2017
2016/17 2016/17 2015/16
Actual Long term
plan
Long term
plan
$000 $000 $000
Sources of operating funding
General rates, uniform annual general charges, rates penalties 32 28 27
Targeted rates 844 1,014 874
Subsidies and grants for operating purposes 0 0 0
Fees and charges 57 47 45
Internal charges and overheads recovered 0 0 0
Interest and dividends from investments 11 0 0
Local authorities fuel tax, fines, infringement fees, and other
receipts 12 0 0
Total operating funding (A) 955 1,088 946
Application of operating funding
Payments to staff and suppliers 805 458 397
Finance costs 0 2 0
Internal charges and overheads applied 192 203 192
Other operating funding applications 0 0 0
Total applications of operating funding (B) 997 663 589
Surplus/(deficit) of operating funding (A-B) (42) 425 357
Sources of capital funding
Subsidies and grants for capital expenditure 0 1,025 0
Development and financial contributions 0 0 0
Increase/(decrease) in debt 0 1,791 50
Gross proceeds from sale of assets 0 0 0
Lump sum contributions 0 0 0
Other dedicated capital funding 0 0 0
Total sources of capital funding (C) 0 2,816 50
Application of capital funding
Capital expenditure:
- To meet additional demand 0 0 0
- To improve the level of service 0 2,819 50
- To replace existing assets 10 174 40
Increase/(decrease) in reserves (52) 248 317
Increase/(decrease) in investments 0 0 0
Total applications of capital funding (D) (42) 3,241 407
Surplus/(deficit) of capital funding (C-D) 42 (425) (357)
Funding balance ((A-B)+(C-D)) (0) 0 (0)
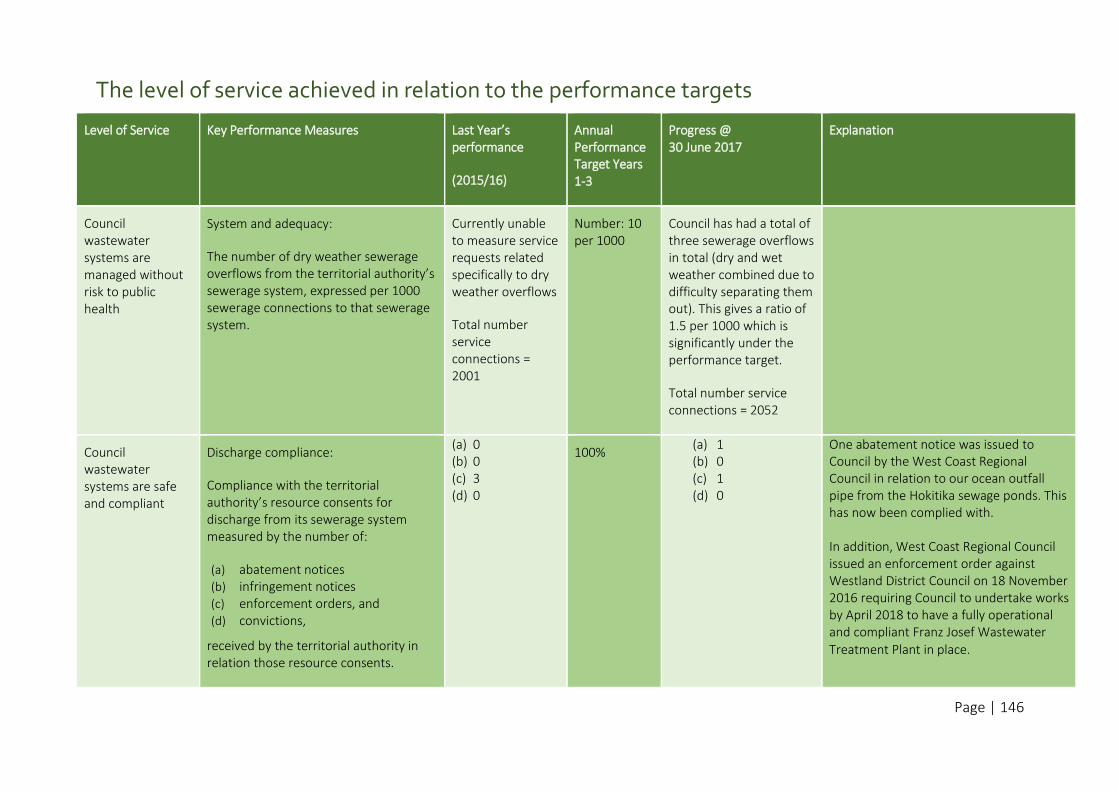
Page | 146
The level of service achieved in relation to the performance targets
Level of Service Key Performance Measures
Last Year’s performance
(2015/16)
Annual Performance Target Years 1-3
Progress @ 30 June 2017
Explanation
Council wastewater systems are managed without risk to public health
System and adequacy:
The number of dry weather sewerage overflows from the territorial authority’s sewerage system, expressed per 1000 sewerage connections to that sewerage system.
Currently unable to measure service requests related specifically to dry weather overflows
Total number service connections = 2001
Number: 10 per 1000
Council has had a total of three sewerage overflows in total (dry and wet weather combined due to difficulty separating them out). This gives a ratio of 1.5 per 1000 which is significantly under the performance target.
Total number service connections = 2052
Council wastewater systems are safe and compliant
Discharge compliance:
Compliance with the territorial authority’s resource consents for discharge from its sewerage system measured by the number of:
(a) abatement notices (b) infringement notices (c) enforcement orders, and (d) convictions,
received by the territorial authority in relation those resource consents.
(a) 0 (b) 0 (c) 3 (d) 0
100% (a) 1 (b) 0 (c) 1 (d) 0
One abatement notice was issued to Council by the West Coast Regional Council in relation to our ocean outfall pipe from the Hokitika sewage ponds. This has now been complied with. In addition, West Coast Regional Council issued an enforcement order against Westland District Council on 18 November 2016 requiring Council to undertake works by April 2018 to have a fully operational and compliant Franz Josef Wastewater Treatment Plant in place.
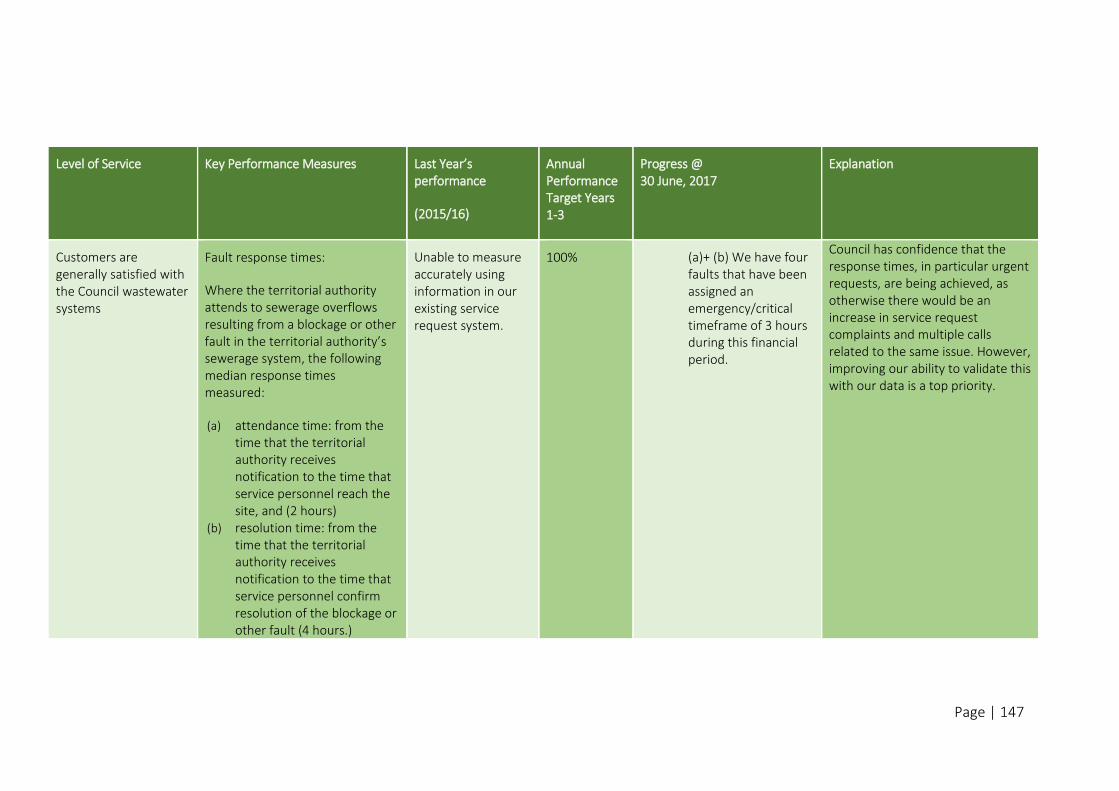
Page | 147
Level of Service Key Performance Measures
Last Year’s performance
(2015/16)
Annual Performance Target Years 1-3
Progress @ 30 June, 2017
Explanation
Customers are generally satisfied with the Council wastewater systems
Fault response times:
Where the territorial authority attends to sewerage overflows resulting from a blockage or other fault in the territorial authority’s sewerage system, the following median response times measured:
(a) attendance time: from the time that the territorial authority receives notification to the time that service personnel reach the site, and (2 hours)
(b) resolution time: from the time that the territorial authority receives notification to the time that service personnel confirm resolution of the blockage or other fault (4 hours.)
Unable to measure accurately using information in our existing service request system.
100%
(a)+ (b) We have four faults that have been assigned an emergency/critical timeframe of 3 hours during this financial period.
Council has confidence that the response times, in particular urgent requests, are being achieved, as otherwise there would be an increase in service request complaints and multiple calls related to the same issue. However, improving our ability to validate this with our data is a top priority.
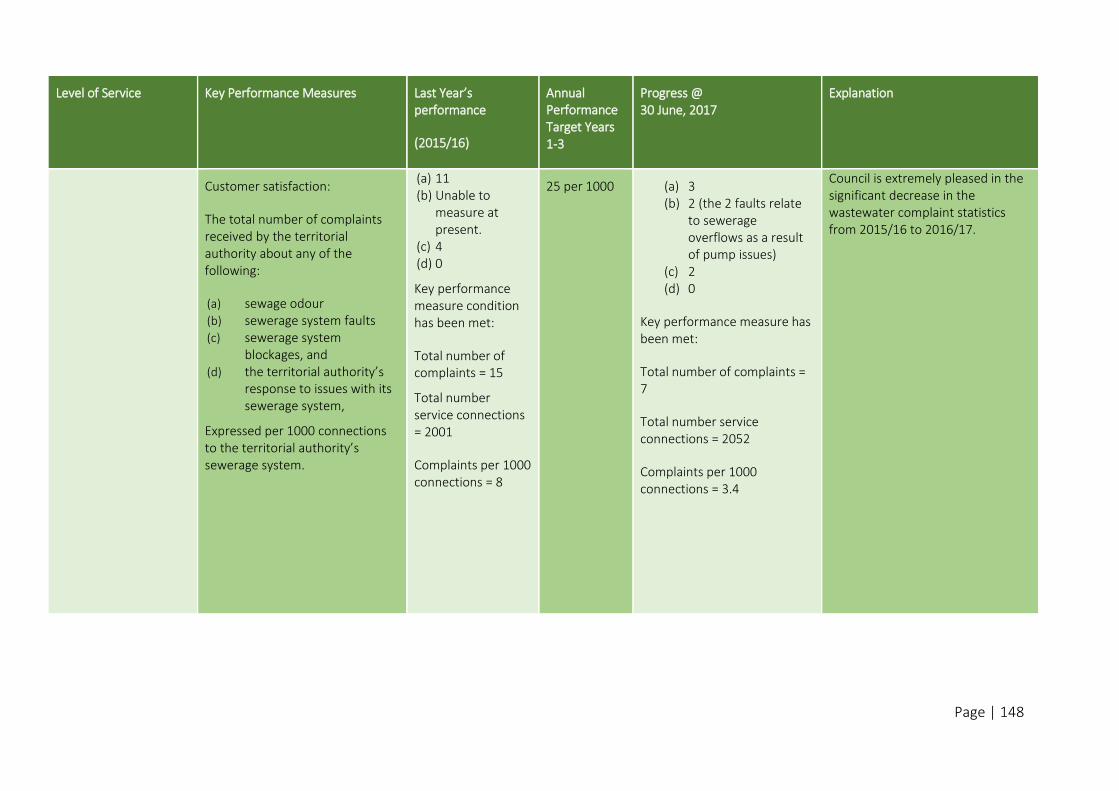
Page | 148
Level of Service Key Performance Measures
Last Year’s performance
(2015/16)
Annual Performance Target Years 1-3
Progress @ 30 June, 2017
Explanation
Customer satisfaction:
The total number of complaints received by the territorial authority about any of the following:
(a) sewage odour (b) sewerage system faults (c) sewerage system
blockages, and (d) the territorial authority’s
response to issues with its sewerage system,
Expressed per 1000 connections to the territorial authority’s sewerage system.
(a) 11 (b) Unable to
measure at present.
(c) 4 (d) 0
Key performance measure condition has been met:
Total number of complaints = 15
Total number service connections = 2001
Complaints per 1000 connections = 8
25 per 1000 (a) 3 (b) 2 (the 2 faults relate
to sewerage overflows as a result of pump issues)
(c) 2 (d) 0
Key performance measure has been met:
Total number of complaints = 7
Total number service connections = 2052
Complaints per 1000 connections = 3.4
Council is extremely pleased in the significant decrease in the wastewater complaint statistics from 2015/16 to 2016/17.
Page | 149
An overview of the 2016/17 year:
Council provides reticulated stormwater to the township of Hokitika and roadside drainage to the remainder of the townships of the district to ensure protection of public health and safety, and of the environment. The majority of the stormwater reticulation is gravity fed with a total of six pump stations in Hokitika. We have 508 stormwater laterals.
The smaller stormwater schemes mainly comprise open channels as part of the street drainage system to collect road surface run off, these are maintained by Council’s Transportation team.
There were 21 stormwater related service requests logged between 1 July 2016 and 30 June 2017. Excluding private problems, erroneous service requests (that is a problem was reported but when investigated it was found that no problem existed) and requests for general information, there were 11 service requests related to blocked drains, ponding or requests for maintenance. All stormwater requests related to Hokitika.
Hokitika stormwater systems response:
The first part of the stormwater upgrade work to the Tancred St, Bealey St and Rolleston St catchments was carried out in 2016/17. As at 30 June, there was still some remaining work to be carried out to complete the work in the Bealey St catchment. Work in all three catchments involved installing larger stormwater pipes to assist in conveying water to the pump stations. Some larger stormwater sumps were also installed in key locations to assist in the collection of stormwater and convey it into these new pipes. Work to upgrade the pump stations in these catchments was put on hold until the upsized pipework had been installed and the scope of the work could be assessed. There have been no reported flooding incidents in these catchments since this work was carried out.
Activity group: Stormwater
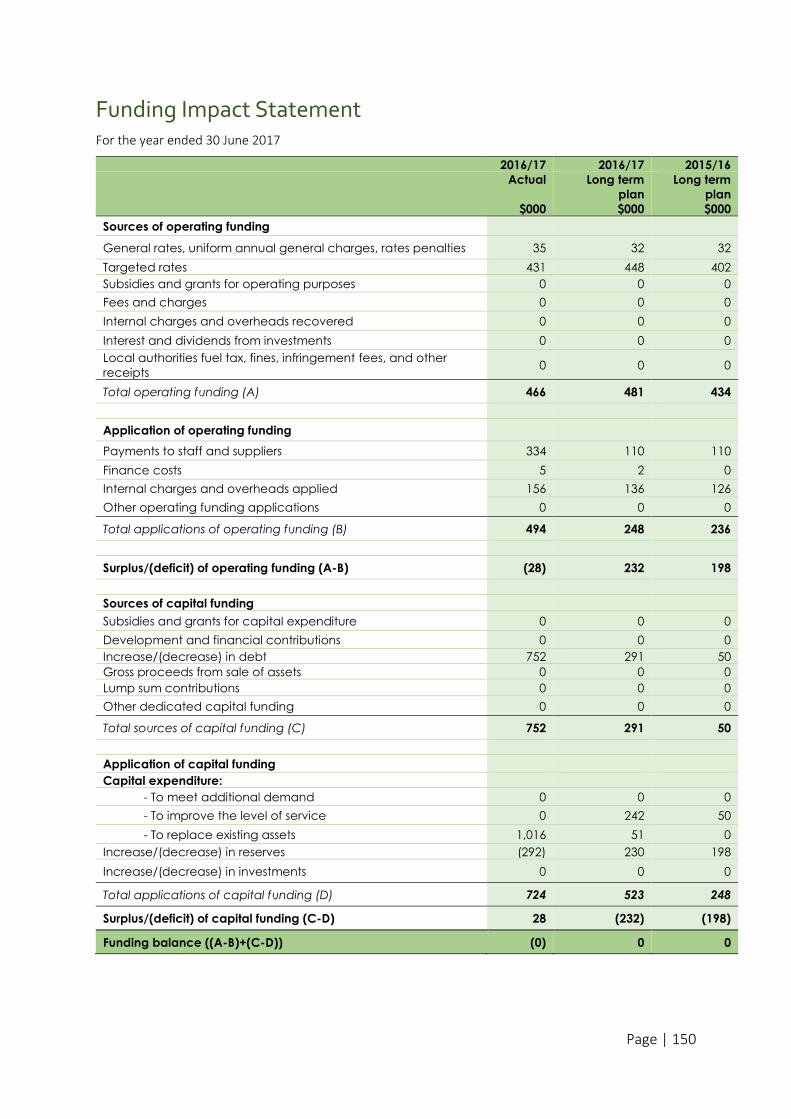
Page | 150
Funding Impact Statement For the year ended 30 June 2017
2016/17 2016/17 2015/16
Actual Long term
plan
Long term
plan
$000 $000 $000
Sources of operating funding
General rates, uniform annual general charges, rates penalties 35 32 32
Targeted rates 431 448 402
Subsidies and grants for operating purposes 0 0 0
Fees and charges 0 0 0
Internal charges and overheads recovered 0 0 0
Interest and dividends from investments 0 0 0
Local authorities fuel tax, fines, infringement fees, and other
receipts 0 0 0
Total operating funding (A) 466 481 434
Application of operating funding
Payments to staff and suppliers 334 110 110
Finance costs 5 2 0
Internal charges and overheads applied 156 136 126
Other operating funding applications 0 0 0
Total applications of operating funding (B) 494 248 236
Surplus/(deficit) of operating funding (A-B) (28) 232 198
Sources of capital funding
Subsidies and grants for capital expenditure 0 0 0
Development and financial contributions 0 0 0
Increase/(decrease) in debt 752 291 50
Gross proceeds from sale of assets 0 0 0
Lump sum contributions 0 0 0
Other dedicated capital funding 0 0 0
Total sources of capital funding (C) 752 291 50
Application of capital funding
Capital expenditure:
- To meet additional demand 0 0 0
- To improve the level of service 0 242 50
- To replace existing assets 1,016 51 0
Increase/(decrease) in reserves (292) 230 198
Increase/(decrease) in investments 0 0 0
Total applications of capital funding (D) 724 523 248
Surplus/(deficit) of capital funding (C-D) 28 (232) (198)
Funding balance ((A-B)+(C-D)) (0) 0 0
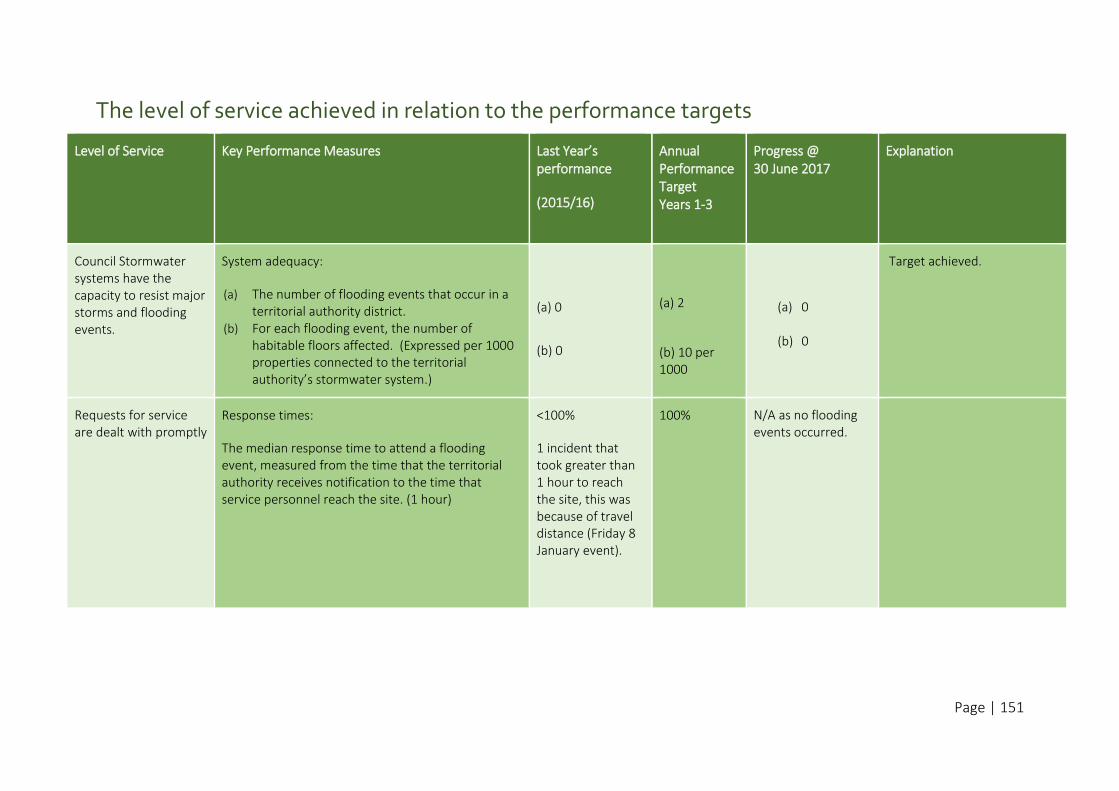
Page | 151
The level of service achieved in relation to the performance targets
Level of Service Key Performance Measures
Last Year’s performance
(2015/16)
Annual Performance Target Years 1-3
Progress @ 30 June 2017
Explanation
Council Stormwater systems have the capacity to resist major storms and flooding events.
System adequacy:
(a) The number of flooding events that occur in a territorial authority district.
(b) For each flooding event, the number of habitable floors affected. (Expressed per 1000 properties connected to the territorial authority’s stormwater system.)
(a) 0
(b) 0
(a) 2
(b) 10 per 1000
(a) 0
(b) 0
Target achieved.
Requests for service are dealt with promptly
Response times:
The median response time to attend a flooding event, measured from the time that the territorial authority receives notification to the time that service personnel reach the site. (1 hour)
<100%
1 incident that took greater than 1 hour to reach the site, this was because of travel distance (Friday 8 January event).
100% N/A as no flooding events occurred.
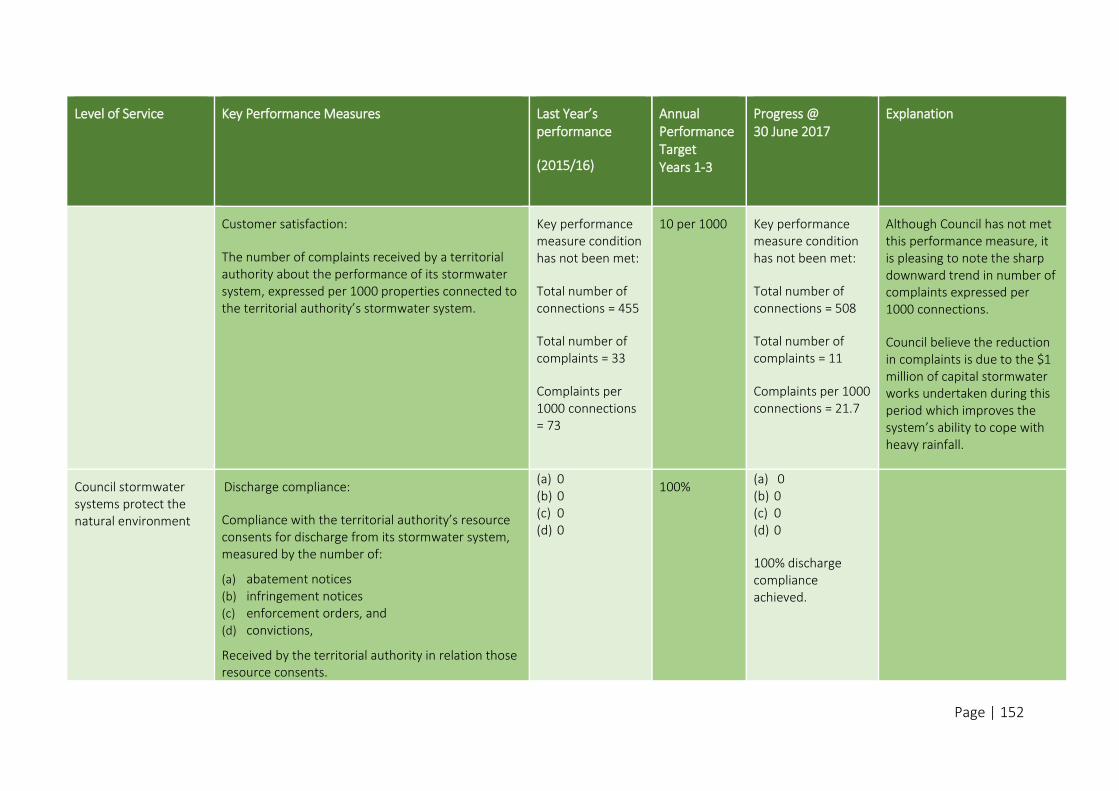
Page | 152
Level of Service Key Performance Measures
Last Year’s performance
(2015/16)
Annual Performance Target Years 1-3
Progress @ 30 June 2017
Explanation
Customer satisfaction:
The number of complaints received by a territorial authority about the performance of its stormwater system, expressed per 1000 properties connected to the territorial authority’s stormwater system.
Key performance measure condition has not been met:
Total number of connections = 455
Total number of complaints = 33
Complaints per 1000 connections = 73
10 per 1000 Key performance measure condition has not been met:
Total number of connections = 508
Total number of complaints = 11
Complaints per 1000 connections = 21.7
Although Council has not met this performance measure, it is pleasing to note the sharp downward trend in number of complaints expressed per 1000 connections.
Council believe the reduction in complaints is due to the $1 million of capital stormwater works undertaken during this period which improves the system’s ability to cope with heavy rainfall.
Council stormwater systems protect the natural environment
Discharge compliance:
Compliance with the territorial authority’s resource consents for discharge from its stormwater system, measured by the number of:
(a) abatement notices (b) infringement notices (c) enforcement orders, and (d) convictions,
Received by the territorial authority in relation those resource consents.
(a) 0 (b) 0 (c) 0 (d) 0
100% (a) 0 (b) 0 (c) 0 (d) 0
100% discharge compliance achieved.
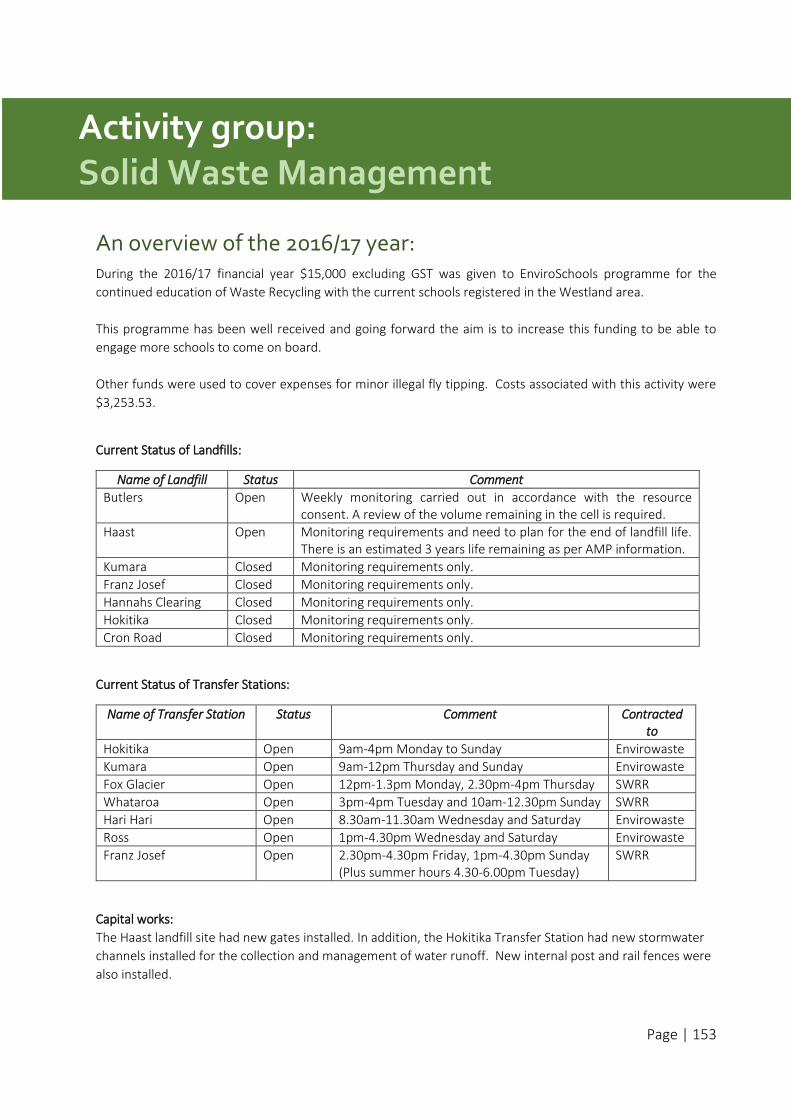
Page | 153
An overview of the 2016/17 year: During the 2016/17 financial year $15,000 excluding GST was given to EnviroSchools programme for the
continued education of Waste Recycling with the current schools registered in the Westland area.
This programme has been well received and going forward the aim is to increase this funding to be able to
engage more schools to come on board.
Other funds were used to cover expenses for minor illegal fly tipping. Costs associated with this activity were
$3,253.53.
Current Status of Landfills:
Name of Landfill Status Comment
Butlers Open Weekly monitoring carried out in accordance with the resource consent. A review of the volume remaining in the cell is required.
Haast Open Monitoring requirements and need to plan for the end of landfill life. There is an estimated 3 years life remaining as per AMP information.
Kumara Closed Monitoring requirements only.
Franz Josef Closed Monitoring requirements only.
Hannahs Clearing Closed Monitoring requirements only.
Hokitika Closed Monitoring requirements only.
Cron Road Closed Monitoring requirements only.
Current Status of Transfer Stations:
Name of Transfer Station Status Comment Contracted to
Hokitika Open 9am-4pm Monday to Sunday Envirowaste
Kumara Open 9am-12pm Thursday and Sunday Envirowaste
Fox Glacier Open 12pm-1.3pm Monday, 2.30pm-4pm Thursday SWRR
Whataroa Open 3pm-4pm Tuesday and 10am-12.30pm Sunday SWRR
Hari Hari Open 8.30am-11.30am Wednesday and Saturday Envirowaste
Ross Open 1pm-4.30pm Wednesday and Saturday Envirowaste
Franz Josef Open 2.30pm-4.30pm Friday, 1pm-4.30pm Sunday (Plus summer hours 4.30-6.00pm Tuesday)
SWRR
Capital works:
The Haast landfill site had new gates installed. In addition, the Hokitika Transfer Station had new stormwater
channels installed for the collection and management of water runoff. New internal post and rail fences were
also installed.
Activity group: Solid Waste Management
Page | 154
Volumes of Waste:
Butlers Landfill
The amount of solid waste going to land fill decreased marginally compared to the previous year.
2015/16 3249 tonne
2016/17 3216 tonne
Haast Refuse Station
The amount of solid waste going to land fill decreased significantly compared to the previous year by 75%.
This is due, however, to severe weather events and destruction of property that was disposed to landfill in
2015.
2015/16 374 tonne
2016/17 94 tonne
Hokitika Transfer Station:
Over the past year, there has been 175 tonne of green waste and 49 tonnes of scrap metal collected.
Pest Control:
Pest control remains in place with Barry Nicol Pest Control for both the Haast and Butlers landfill.
Compliance Monitoring:
Due to staff changes, Westland District Council has engaged an external agency to undertake compliance
monitoring.
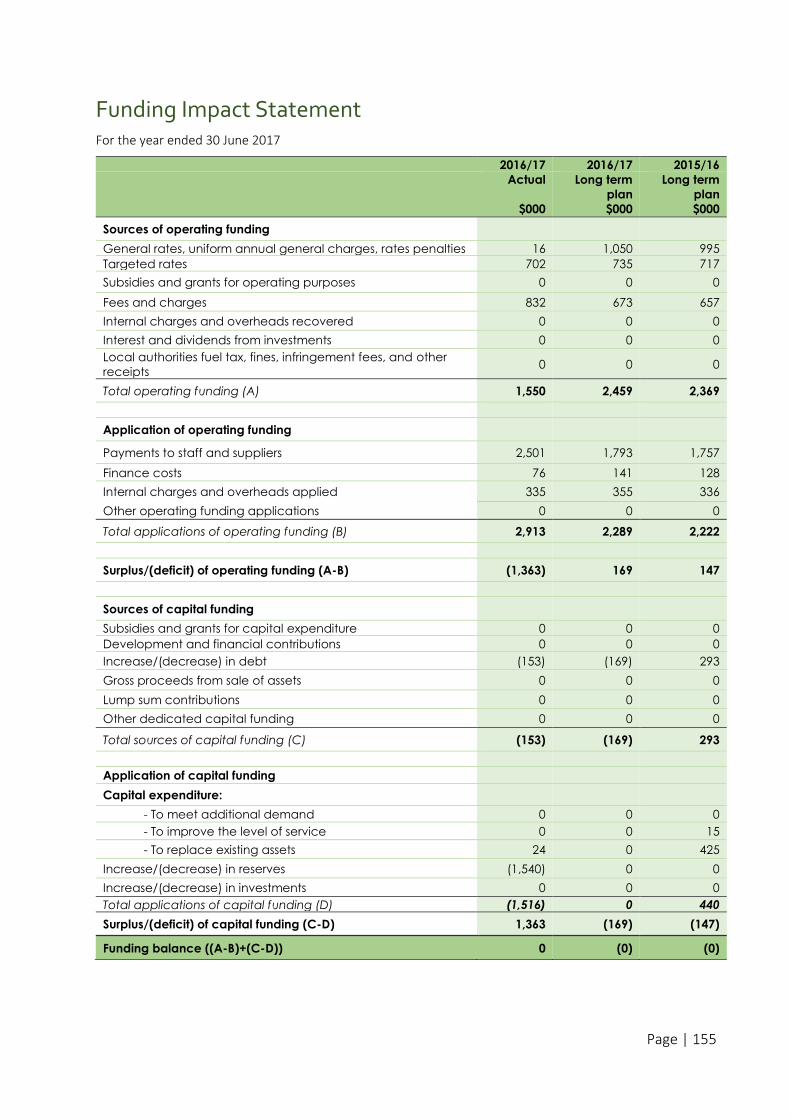
Page | 155
Funding Impact Statement For the year ended 30 June 2017
2016/17 2016/17 2015/16
Actual Long term
plan
Long term
plan
$000 $000 $000
Sources of operating funding
General rates, uniform annual general charges, rates penalties 16 1,050 995
Targeted rates 702 735 717
Subsidies and grants for operating purposes 0 0 0
Fees and charges 832 673 657
Internal charges and overheads recovered 0 0 0
Interest and dividends from investments 0 0 0
Local authorities fuel tax, fines, infringement fees, and other
receipts 0 0 0
Total operating funding (A) 1,550 2,459 2,369
Application of operating funding
Payments to staff and suppliers 2,501 1,793 1,757
Finance costs 76 141 128
Internal charges and overheads applied 335 355 336
Other operating funding applications 0 0 0
Total applications of operating funding (B) 2,913 2,289 2,222
Surplus/(deficit) of operating funding (A-B) (1,363) 169 147
Sources of capital funding
Subsidies and grants for capital expenditure 0 0 0
Development and financial contributions 0 0 0
Increase/(decrease) in debt (153) (169) 293
Gross proceeds from sale of assets 0 0 0
Lump sum contributions 0 0 0
Other dedicated capital funding 0 0 0
Total sources of capital funding (C) (153) (169) 293
Application of capital funding
Capital expenditure:
- To meet additional demand 0 0 0
- To improve the level of service 0 0 15
- To replace existing assets 24 0 425
Increase/(decrease) in reserves (1,540) 0 0
Increase/(decrease) in investments 0 0 0
Total applications of capital funding (D) (1,516) 0 440
Surplus/(deficit) of capital funding (C-D) 1,363 (169) (147)
Funding balance ((A-B)+(C-D)) 0 (0) (0)
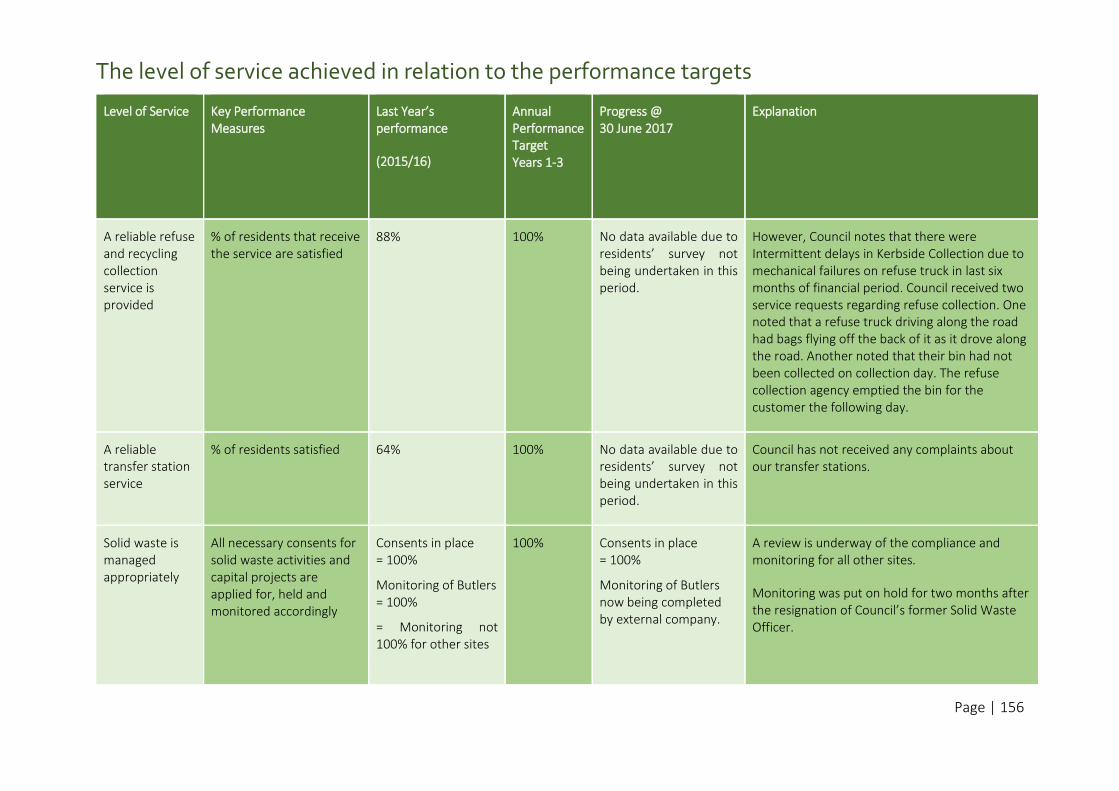
Page | 156
The level of service achieved in relation to the performance targets
Level of Service Key Performance Measures
Last Year’s performance
(2015/16)
Annual Performance Target Years 1-3
Progress @ 30 June 2017
Explanation
A reliable refuse and recycling collection service is provided
% of residents that receive the service are satisfied
88% 100% No data available due to residents’ survey not being undertaken in this period.
However, Council notes that there were Intermittent delays in Kerbside Collection due to mechanical failures on refuse truck in last six months of financial period. Council received two service requests regarding refuse collection. One noted that a refuse truck driving along the road had bags flying off the back of it as it drove along the road. Another noted that their bin had not been collected on collection day. The refuse collection agency emptied the bin for the customer the following day.
A reliable transfer station service
% of residents satisfied 64% 100% No data available due to residents’ survey not being undertaken in this period.
Council has not received any complaints about our transfer stations.
Solid waste is managed appropriately
All necessary consents for solid waste activities and capital projects are applied for, held and monitored accordingly
Consents in place = 100%
Monitoring of Butlers = 100%
= Monitoring not 100% for other sites
100% Consents in place = 100%
Monitoring of Butlers now being completed by external company.
A review is underway of the compliance and monitoring for all other sites.
Monitoring was put on hold for two months after the resignation of Council’s former Solid Waste Officer.
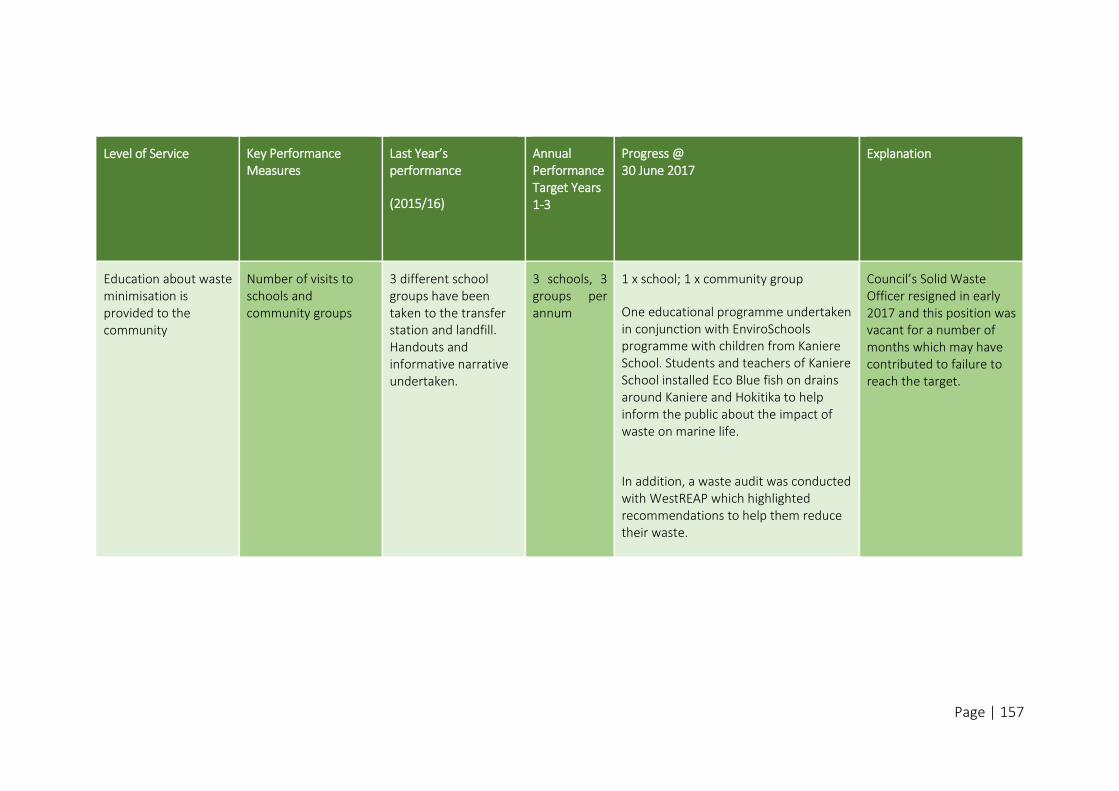
Page | 157
Level of Service Key Performance Measures
Last Year’s performance
(2015/16)
Annual Performance Target Years 1-3
Progress @ 30 June 2017
Explanation
Education about waste minimisation is provided to the community
Number of visits to schools and community groups
3 different school groups have been taken to the transfer station and landfill. Handouts and informative narrative undertaken.
3 schools, 3 groups per annum
1 x school; 1 x community group
One educational programme undertaken in conjunction with EnviroSchools programme with children from Kaniere School. Students and teachers of Kaniere School installed Eco Blue fish on drains around Kaniere and Hokitika to help inform the public about the impact of waste on marine life.
In addition, a waste audit was conducted with WestREAP which highlighted recommendations to help them reduce their waste.
Council’s Solid Waste Officer resigned in early 2017 and this position was vacant for a number of months which may have contributed to failure to reach the target.
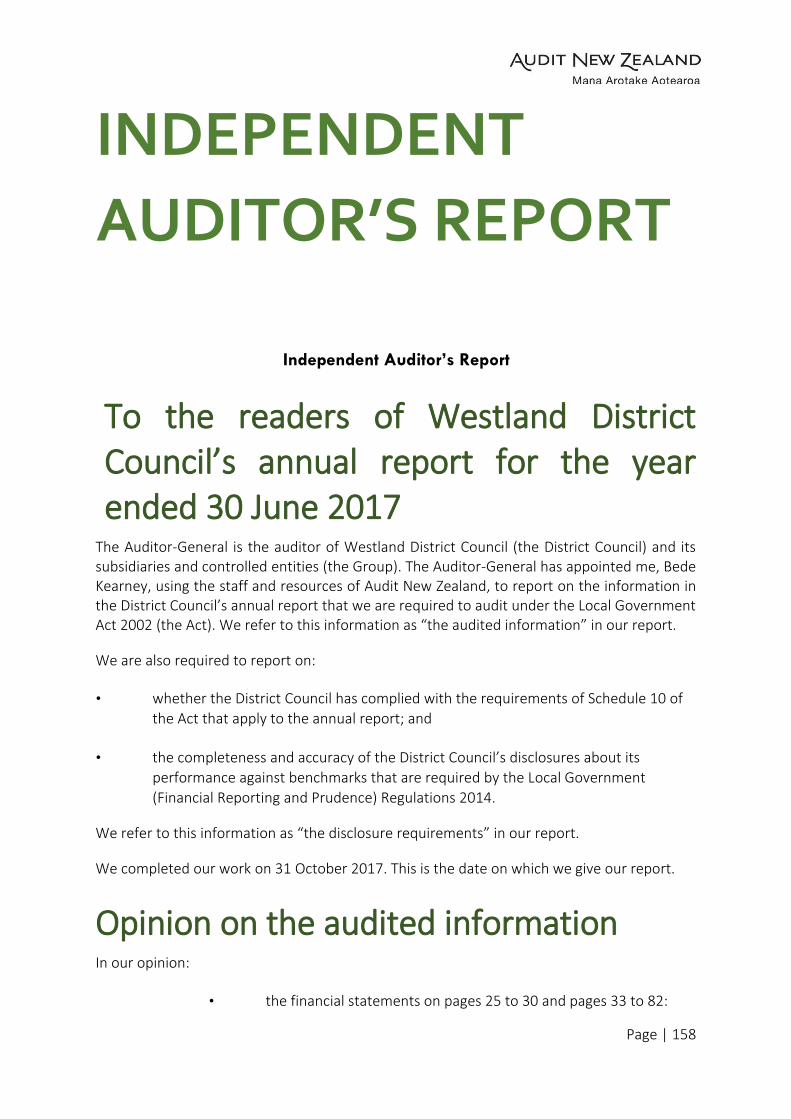
Page | 158
INDEPENDENT
AUDITOR’S REPORT
Independent Auditor’s Report
To the readers of Westland District Council’s annual report for the year ended 30 June 2017
The Auditor-General is the auditor of Westland District Council (the District Council) and its subsidiaries and controlled entities (the Group). The Auditor-General has appointed me, Bede Kearney, using the staff and resources of Audit New Zealand, to report on the information in the District Council’s annual report that we are required to audit under the Local Government Act 2002 (the Act). We refer to this information as “the audited information” in our report.
We are also required to report on:
• whether the District Council has complied with the requirements of Schedule 10 of
the Act that apply to the annual report; and
• the completeness and accuracy of the District Council’s disclosures about its
performance against benchmarks that are required by the Local Government
(Financial Reporting and Prudence) Regulations 2014.
We refer to this information as “the disclosure requirements” in our report.
We completed our work on 31 October 2017. This is the date on which we give our report.
Opinion on the audited information In our opinion:
• the financial statements on pages 25 to 30 and pages 33 to 82:
Page | 159
present fairly, in all material respects:
• the District Council and Group’s financial position as at
30 June 2017;
• the results of the operations and cash flows for the year ended on
that date; and
comply with generally accepted accounting practice in New Zealand in accordance with Public Benefit Entity Accounting Standards;
• the funding impact statement on page 31, presents fairly, in all material
respects, the amount of funds produced from each source of funding and
how the funds were applied as compared to the information included in the
District Council’s annual plan;
• the statement of service provision on pages 85 to 91 and pages 99 to 158.
presents fairly, in all material respects, the levels of service for each group of activities for the year ended 30 June 2017, including:
• the levels of service achieved compared with the intended levels of service
and whether any intended changes to levels of service were achieved;
• the reasons for any significant variation between the levels of service
achieved and the intended levels of service; and
complies with generally accepted accounting practice in New Zealand; and
• the statement about capital expenditure for each group of activities on pages 89 to
154, presents fairly, in all material respects, actual capital expenditure as compared
to the budgeted capital expenditure included in the District Council’s Long-term
plan; and
• the funding impact statement for each group of activities on pages 89 to 156,
presents fairly, in all material respects, the amount of funds produced from each
source of funding and how the funds were applied as compared to the information
included in the District Council’s Long-term plan. Report on the disclosure
requirements
We report that the District Council has:
• complied with the requirements of Schedule 10 of the Act that apply to the annual
report; and
• made the disclosures about its performance against benchmarks that are required
by the Local Government (Financial Reporting and Prudence Regulations 2014) on
Page | 160
pages 17 to 22, which represent a complete list of required disclosures and
accurately reflects the information drawn from the District Council and Group’s
audited information and, where applicable, the District Council’s long-term plan and
annual plans.
Basis for opinion on the audited information We carried out our audit in accordance with the Auditor-General’s Auditing Standards, which incorporate the Professional and Ethical Standards and the International Standards on Auditing (New Zealand) issued by the New Zealand Auditing and Assurance Standards Board. We describe our responsibilities under those standards further in the “Responsibilities of the auditor for the audited information” section of this report.
We have fulfilled our responsibilities in accordance with the Auditor-General’s Auditing Standards.
We believe that the audit evidence we have obtained is sufficient and appropriate to provide a basis for our opinion on the audited information.
Responsibilities of the Council for the audited information
The Council is responsible for meeting all legal requirements that apply to its annual report.
The Council’s responsibilities arise under the Local Government Act 2002 and the Local Government (Financial Reporting and Prudence) Regulations 2014.
The Council is responsible for such internal control as it determines is necessary to enable it to prepare the information we audit that is free from material misstatement, whether due to fraud or error.
In preparing the information we audit the Council is responsible for assessing its ability to continue as a going concern. The Council is also responsible for disclosing, as applicable, matters related to going concern and using the going concern basis of accounting, unless there is an intention to amalgamate or cease all of the functions of the District Council and the Group or there is no realistic alternative but to do so.
Responsibilities of the auditor for the audited information Our objectives are to obtain reasonable assurance about whether the audited information, as a whole, is free from material misstatement, whether due to fraud or error, and to issue an audit report that includes our opinion.
Page | 161
Reasonable assurance is a high level of assurance, but is not a guarantee that an audit carried out in accordance with the Auditor General’s Auditing Standards will always detect a material misstatement when it exists. Misstatements are differences or omissions of amounts or disclosures, and can arise from fraud or error. Misstatements are considered material if, individually or in the aggregate, they could reasonably be expected to influence the decisions of readers taken on the basis of this audited information.
For the budget information reported in the audited information, our procedures were limited to checking that the budget information agreed to the District Council’s annual plan.
We did not evaluate the security and controls over the electronic publication of the audited information.
As part of an audit in accordance with the Auditor-General’s Auditing Standards, we exercise professional judgement and maintain professional scepticism throughout the audit. Also:
• We identify and assess the risks of material misstatement of the audited
information, whether due to fraud or error, design and perform audit procedures
responsive to those risks, and obtain audit evidence that is sufficient and
appropriate to provide a basis for our opinion. The risk of not detecting a material
misstatement resulting from fraud is higher than for one resulting from error, as
fraud may involve collusion, forgery, intentional omissions, misrepresentations, or
the override of internal control.
• We obtain an understanding of internal control relevant to the audit in order to
design
audit procedures that are appropriate in the circumstances, but not for the purpose of expressing an opinion on the effectiveness of the District Council and Group’s internal control.
• We evaluate the appropriateness of accounting policies used and the
reasonableness of accounting estimates and related disclosures made by the
Council.
• We determine the appropriateness of the reported intended levels of service in the
statement of service provision, as a reasonable basis for assessing the levels of
service achieved and reported by the District Council.
• We conclude on the appropriateness of the use of the going concern basis of
accounting by the Council and, based on the audit evidence obtained, whether a
material uncertainty exists related to events or conditions that may cast a significant
doubt on the District Council and Group’s ability to continue as a going concern. If
we conclude that a material uncertainty exists, we are required to draw attention in
our audit report to the related disclosures in the audited information or, if such
disclosures are inadequate, to modify our opinion. Our conclusions are based on the
audit
Page | 162
evidence obtained up to the date of our audit report. However, future events or conditions may cause the District Council and the Group to cease to continue as a going concern.
• We evaluate the overall presentation, structure and content of the audited
information, including the disclosures, and whether the audited information
represents, where applicable, the underlying transactions and events in a manner
that achieves fair presentation.
• We obtain sufficient appropriate audit evidence regarding the entities or business
activities within the Group to express an opinion on the consolidated audited
information.
We communicate with the Council regarding, among other matters, the planned scope and timing of the audit and significant audit findings, including any significant deficiencies in internal control that we identify during our audit.
Other Information The Council is responsible for the other information included in the annual report. The other information comprises the information included on pages 6 to 16, 23, 84, 92 to 98, but does not include the audited information and the disclosure requirements.
Our opinion on the audited information and our report on the disclosure requirements do not cover the other information.
Our responsibility is to read the other information. In doing so, we consider whether the other information is materially inconsistent with the audited information and the disclosure requirements, or our knowledge obtained during our work, or otherwise appears to be materially misstated. If, based on our work, we conclude that there is a material misstatement of this other information, we are required to report that fact. We have nothing to report in this regard.
Independence We are independent of the District Council and Group in accordance with the independence requirements of the Auditor-General’s Auditing Standards, which incorporate the independence requirements of Professional and Ethical Standard 1 (Revised): Code of Ethics for Assurance Practitioners issued by the New Zealand Auditing and Assurance Standards Board.
Other than the audit and our report on the disclosure requirements, we have no relationship with or interests in the District Council or its subsidiaries and controlled entities.

Page | 163
Bede Kearney
Audit New Zealand
On behalf of the Auditor-General
Christchurch, New Zealand