7 January 2019 ISSN 1996-0808 DOI: 10.5897/AJMR www ...
41
7 January 2019 ISSN 1996-0808 DOI: 10.5897/AJMR www.academicjournals.org OPEN ACCESS African Journal of Microbiology Research
Transcript of 7 January 2019 ISSN 1996-0808 DOI: 10.5897/AJMR www ...

7 January 2019ISSN 1996-0808 DOI: 10.5897/AJMRwww.academicjournals.org
OPEN AC C ESS
African Journal of
Microbiology Research
About AJMR
The African Journal of Microbiology Research (AJMR) is a peer reviewed journal. The journal is published weekly and covers all areas of subject as Environmental Microbiology, Clinical Microbiology, Immunology, Virology, Bacteriology, Phycology, Molecular and Cellular Biology, Molecular Microbiology, Food Microbiology, Mycology and Parasitology, Microbial Ecology, Probiotics and Prebiotics and Industrial Microbiology.
Indexing
CAB Abstracts, CABI’s Global Health Database, Chemical Abstracts (CAS Source Index)
Dimensions Database, Google Scholar, Matrix of Information for The Analysis of Journals (MIAR), Microsoft Academic, Research Gate
Open Access Policy
Open Access is a publication model that enables the dissemination of research articles to the global community without restriction through the internet. All articles published under open access can be accessed by anyone with internet connection.
The African Journal of Microbiology Research is an Open Access journal. Abstracts and full texts of all articles published in this journal are freely accessible to everyone immediately after publication without any form of restriction.
Article License
All articles published by African Journal of Microbiology Research are licensed under the Creative Commons Attribution 4.0 International License. This permits anyone to copy, redistribute, remix, transmit and adapt the work provided the original work and source is appropriately cited. Citation should include the article DOI. The article license is displayed on the abstract page the following statement:
This article is published under the terms of the Creative Commons Attribution License 4.0
Please refer to https://creativecommons.org/licenses/by/4.0/legalcode for details about Creative Commons Attribution License 4.0

Article Copyright
When an article is published by in the African Journal of Microbiology Research, the author(s) of the article retain the copyright of article. Author(s) may republish the article as part of a book or other materials. When reusing a published article, author(s) should; Cite the original source of the publication when reusing the article. i.e. cite that the article was originally published in the African Journal of Microbiology Research. Include the article DOI Accept that the article remains published by the African Journal of Microbiology Research (except in occasion of a retraction of the article) The article is licensed under the Creative Commons Attribution 4.0 International License.
A copyright statement is stated in the abstract page of each article. The following statement is an example of a copyright statement on an abstract page. Copyright ©2016 Author(s) retains the copyright of this article. Self-Archiving Policy
The African Journal of Microbiology Research is a RoMEO green journal. This permits authors to archive any version of their article they find most suitable, including the published version on their institutional repository and any other suitable website. Please see http://www.sherpa.ac.uk/romeo/search.php?issn=1684-5315
Digital Archiving Policy
The African Journal of Microbiology Research is committed to the long-term preservation of its content. All articles published by the journal are preserved by Portico. In addition, the journal encourages authors to archive the published version of their articles on their institutional repositories and as well as other appropriate websites. https://www.portico.org/publishers/ajournals/
Metadata Harvesting
The African Journal of Microbiology Research encourages metadata harvesting of all its content. The journal fully supports and implement the OAI version 2.0, which comes in a standard XML format. See Harvesting Parameter
Memberships and Standards
Academic Journals strongly supports the Open Access initiative. Abstracts and full texts of all
articles published by Academic Journals are freely accessible to everyone immediately after
publication.
All articles published by Academic Journals are licensed under the Creative Commons
Attribution 4.0 International License (CC BY 4.0). This permits anyone to copy, redistribute,
remix, transmit and adapt the work provided the original work and source is appropriately
cited.
Crossref is an association of scholarly publishers that developed Digital Object Identification
(DOI) system for the unique identification published materials. Academic Journals is a
member of Crossref and uses the DOI system. All articles published by Academic Journals
are issued DOI.
Similarity Check powered by iThenticate is an initiative started by CrossRef to help its
members actively engage in efforts to prevent scholarly and professional plagiarism.
Academic Journals is a member of Similarity Check.
CrossRef Cited-by Linking (formerly Forward Linking) is a service that allows you to discover
how your publications are being cited and to incorporate that information into your online
publication platform. Academic Journals is a member of CrossRef Cited-by.
Academic Journals is a member of the International Digital Publishing Forum (IDPF).
The IDPF is the global trade and standards organization dedicated to the
development and promotion of electronic publishing and content consumption.
Contact
Editorial Office: [email protected]
Help Desk: [email protected]
Website: http://www.academicjournals.org/journal/AJMR
Submit manuscript online http://ms.academicjournals.org
Academic Journals 73023 Victoria Island, Lagos, Nigeria
ICEA Building, 17th Floor, Kenyatta Avenue, Nairobi, Kenya.
Editors
Prof. Adriano Gomes da Cruz University of Campinas (UNICAMP), Brazil. Prof. Ashok Kumar School of Biotechnology Banaras Hindu UniversityUttar Pradesh, India. Dr. Mohd Fuat Abd Razak Infectious Disease Research Centre, Institute for Medical Research, Jalan Pahang, Malaysia. Dr. Adibe Maxwell Ogochukwu Department of Clinical Pharmacy and Pharmacy Management, University of Nigeria Nsukka, Nigeria. Dr. Mehdi Azami Parasitology & Mycology Department Baghaeei Lab. Isfahan, Iran. Dr. Franco Mutinelli Istituto Zooprofilattico Sperimentale delle Venezie Italy. Prof. Ebiamadon Andi Brisibe University of Calabar, Calabar, Nigeria.
Prof. Nazime Mercan Dogan Department of Biology Faculty of Science and Arts University Denizli Turkey. Prof. Long-Liu Lin Department of Applied Chemistry National Chiayi University Chiayi County Taiwan. Prof. Natasha Potgieter University of Venda South Africa. Dr. Tamer Edirne Department of Family Medicine University of Pamukkale Turkey. Dr. Kwabena Ofori-Kwakye Department of Pharmaceutics Kwame Nkrumah University of Science & Technology Kumasi, Ghana. Dr. Tülin Askun Department of Biology Faculty of Sciences & Arts Balikesir University Turkey. Dr. Mahmoud A. M. Mohammed Department of Food Hygiene and Control Faculty of Veterinary Medicine Mansoura University Egypt.

Dr. James Stefan Rokem Department of Microbiology & Molecular Genetics Institute of Medical Research Israel – Canada The Hebrew University – Hadassah Medical School Jerusalem, Israel. Dr. Afework Kassu University of Gondar Ethiopia. Dr. Wael Elnaggar Faculty of Pharmacy Northern Border University Rafha Saudi Arabia. Dr. Maulin Shah Industrial Waste Water Research Laboratory Division of Applied & Environmental Microbiology, Enviro Technology Limited Gujarat, India. Dr. Ahmed Mohammed Pathological Analysis Department Thi-Qar University College of Science Iraq. Prof. Naziha Hassanein Department of Microbiology Faculty of Science Ain Shams University Egypt. Dr. Shikha Thakur Department of Microbiology Sai Institute of Paramedical and Allied Sciences India.
Dr. Samuel K Ameyaw Civista Medical Center USA. Dr. Anubrata Ghosal Department of Biology MIT - Massachusetts Institute of Technology USA. Dr. Bellamkonda Ramesh Department of Food Technology Vikrama Simhapuri University India. Dr. Sabiha Yusuf Essack Department of Pharmaceutical Sciences University of KwaZulu-Natal South Africa. Dr. Navneet Rai Genome Center University of California Davis USA. Dr. Iheanyi Omezuruike Okonko Department of Virology Faculty of Basic Medical Sciences University of Ibadan Ibadan, Nigeria. Dr. Mike Agenbag Municipal Health Services, Joe Gqabi, South Africa. Dr. Abdel-Hady El-Gilany Department of Public Health & Community Medicine, Faculty of Medicine Mansoura University Egypt.

Table of Content
Evaluation of starter culture fermented sweet potato flour using FTIR spectra and GCMS Chromatogram Ajayi O. I., Okedina T. A., Samuel A. E., Asieba G. O., Jegede A. A., Onyemali C. P., Ehiwuogu-Onyibe J., Lawal A. K. and Elemo G. N. In vitro antibacterial activity of Rumex nervosus and Clematis simensis plants against some bacterial human pathogens Habtamu Tedila and Addisu Assefa Study on bovine mastitis with isolation of bacterial and fungal causal agents and assessing antimicrobial resistance patterns of isolated Staphylococcus species in and around Sebeta town, Ethiopia Tesfaye Bekele, Matios Lakew, Getachew Terefe, Tafesse Koran, Abebe Olani, Letebrihan Yimesgen, Mekdes Tamiru and Tilaye Demissie

Vol. 13(1), pp. 1-13, 7 January, 2019
DOI: 10.5897/AJMR2017.8774
Article Number: 72CC0CA59753
ISSN: 1996-0808
Copyright ©2019
Author(s) retain the copyright of this article
http://www.academicjournals.org/AJMR
African Journal of Microbiology Research
Full Length Research Paper
Evaluation of starter culture fermented sweet potato flour using FTIR spectra and GCMS Chromatogram
Ajayi O. I.1*, Okedina T. A.1, Samuel A. E.4, Asieba G. O.3, Jegede A. A.2, Onyemali C. P.1, Ehiwuogu-Onyibe J.1, Lawal A. K.1 and Elemo G. N.2
1Department of Biotechnology, Federal Institute of Industrial Research, Oshodi, PMB 21023, Ikeja, Lagos State,
Nigeria. 2Department of Food Technology, Federal Institute of Industrial Research, Oshodi, PMB 21023, Ikeja, Lagos State,
Nigeria. 3Department of Production, Analytical Services and Laboratory Management (PALM), Federal Institute of Industrial
Research, Oshodi, PMB 21023, Ikeja, Lagos State, Nigeria. 4Department of Product Design and Development, Federal Institute of Industrial Research, Oshodi, PMB 21023,
Ikeja, Lagos State, Nigeria.
Received 29 November, 2017; Accepted 6 August, 2018
Starch is the major component of cereal grains and starchy foods, and changes in its biophysical and biochemical properties (such as, amylose, amylopectin, pasting, gelatinization, viscosity) will have a direct effect on its end use properties (such as, bread, malt, polymers). Lactobacillus brevis and Debaromyces polymorphous earlier obtained from fermented sweet poatao broth were used to ferment sweet potato and these starter cultures broke down the carbohydrate (starch) to produce alcohol, organic acid and carbon dioixde (CO2). The study identified that starter cultures L. brevis and D. polymorphous fermented the sweet potato thereby breaking down the carbohydrate (starch) to produce alcohol, organic acid and CO2 hence lactic acid fermentation occurred. Fourier Transform Infrared Spectroscopy (FTIR) and Gas Chromatography Mass Specrometry (GCMS) were used to identify the chemical properties of starter culture fermented sweet potato flour. The FTIR spectra showed peaks at 3322.15, 3298.87, 3292.59, 3279.59 and 3274.59 cm
-1 for the raw sweet potato,
starter culture fermented sweet potato flour at various periods (24, 48 and 72 h) and spontaneous fermented sweet potato (control) respectively. The peaks at 2930, 2928.10, 2930.33, 2929.48, 2929.31 and 2927.29 cm
-1 are attributed to C–H bond stretching. Functional groups such as hydroxyl,
aldehydes, alcohol and carboxyl were detected in the fermented samples. The GCMS analysis detected the presence of alcohol such as ethanol, butanol etc., and carboxylic acid such as hexadecanoic acid, octadecadienoic acid etc. They were produced in situ from the fermentation process and this can serve as antioxidants, help inhibit spoilage organisms and serve as preservatives, thereby increasing shelf life of the product.
Key words: Sweet potato starch, fermentation, FTIR, GCMS.
INTRODUCTION
Carbohydrate is a class of chemical compounds that consists of carbon, oxygen and H2 (Kim et al., 2007). It
*Corresponding author. E-mail: [email protected]. Tel: 09052687938.
Author(s) agree that this article remain permanently open access under the terms of the Creative Commons Attribution
License 4.0 International License

2 Afr. J. Microbiol. Res. includes sugars, starch and cellulose. These compounds are classified as monosaccharides (such as, glucose, fructose), disaccharides (such as, sucrose, lactose) or polysaccharides (such as, starch, cellulose) (Kim et al., 2007). All carbohydrate compounds have been used as a source of biomass and a large number of microorganisms use them as energy source as a result, carbohydrates are essential for maintaining life (Kim et al., 2007). Glucose is the key compound as most life systems are built around it.
Starch is a carbohydrate consisting of glucose compounds joined to form a polysaccharide (Dias et al., 2008). It is a plant natural energy source that is most abundant and valuable which needs to be converted to simple sugars before it can be utilized as a carbon source (Yoo and Jane, 2002; Mosier et al., 2005; Yang et al., 2006; Gray et al., 2006).
The starch stored in the seeds and tubers of various agricultural crops including maize, wheat, rice, barley, potato and cassava provide the main sources of energy in the human diet (Evers et al., 1999; Perez et al., 2009; Perez and Bretoft 2010, Schwartz and Whistler, 2009). Starch is the major component of cereal grains, and changes in its biophysical and biochemical properties are related to the amount and ratio of amylose and amylopectin, which influences and affect properties such as viscosity, gelatinization, that will determine its end use properties (such as, bread, malt, beer, polymers) (Evers et al.,1999; Schwartz and Whistler, 2009; Willett, 2009).
Starch functions mainly as a carbohydrate source for the growing plant (such as, for germinating seeds and leaf tissue development) and is consequently the primary source of stored energy in the plant. Depending on the plant, starch can be found in a variety of tissues, including leaves, tubers, fruits, and seeds. It is the primary source of stored energy in cereal grains. Although the amount of starch contained in grains varies, it is generally between 60 and 75% of the weight of the grain and provides 70 to 80% of the calories consumed by humans worldwide.
It consists of two α-glycan bipolymers, namely, amylose and amylopectin (Yang et al., 2006; Dias et al., 2008; Shariffa et al., 2009). Amylose is a more linear glucose polymer consisting of 200 to 20000 glucose units forming a helix shape; while amylopectin is a highly branched molecule of 10-15 nm in diameter and 200-400 nm long (Yoo and Jane, 2002; Yang et al., 2006; Shariffa et al., 2009).
Amylopectin consist of D-glucopyranose monomers linked to either α-(1,4) or α-(1,6) glucosidic bonds (Yang et al., 2006). The joined monomers of α-(1,4) results in a linear chain; however, α-(1,6) bond serves as a glue that joins together the linear chains (Yang et al., 2006). Amyloses consist of linear glucan connected via α-(1,4) bonds (Lesmes et al., 2009). Starches contain about 17 to 28% of amylose (Matveev et al., 2001). Microbial enzymes (Wang et al., 2008) easily hydrolyze these bonds.
Root vegetables are plant roots used as vegetable, they are generally storage organs enlarged to store energy in form of carbohydrates, starch root vegetable
are important staple food particularly in tropical regions overshadowing cereals throughout much of west Africa, Central Africa, they are used directly or mashed to make fufu or poi. Storage roots can be categorised in bulb, rhizome and tubers. Examples of tuberous root include desert yam (Ipeoma costata), sweet potato (Ipeoma batatas), cassava (Manihot esculenta), etc. Sweet potato carbohydrate has been reported to contain pectin substances, lignin, cellulose and hemicellulose, which are all converted to simple sugars when fermented (Yokoi et al., 2001).
Sweet potato has been processed into prickles and consumed as lacto-juices by processing it with lactic acid bacteria as the fermenting organism and the juice produced has been reported to be very rich in minerals and vitamins (Smita et al., 2007; Panda and Ray, 2007). Sweet potato has also been processed into chips in much the same way as Irish potato (Brigato et al., 2010; Hagenimana and Owori, 1998). It can also be eaten boiled, fried and in roasted form. In addition, it can be sliced, dried in the sun and ground to give flour that remains in good condition for a long time (Wheatly, 2009). Sweet potato can be fermented, dried and milled into flour. Fermentation is the conversion of carbohydrate into alcohols and short chain fatty acids by enzymes of microorganisms (Silva et al., 2008; Yuan et al., 2008). It is a basis of many biological products which involves a process of chemical reactions with the use of microbes such as bacteria, yeast and filamentous fungi (Huang and Tang, 2007; Fortman et al., 2008). The primary benefit of fermentation is the conversion of sugars and other carbohydrates to usable products. As stated earlier, not all bacteria can readily use starch as their energy and carbon source (Nigam and Singh, 1995). This means that some starches need to be broken down to simple fermentable sugars so they can be utilized by bacteria (Nigam and Singh, 1995). On the other hand, sweet potato is rich in β-amylase, which converts long chained starch into readily used maltose units making it a good energy and carbon source for bacteria (Yoshida et al., 1992; Brena et al., 1993; Cudney and McPherson, 1993; Nigam and Singh, 1995). Starter cultures are living microorganisms of defined combination used for fermentation purposes. They help to elicit specific changes in the chemical composition, nutritional value and sensorial properties of the substrate (Opere et al., 2012) and they are generally recognised as safe (Aguirre and Collins, 1993). Moreover, their properties are as follows: they are harmless, initiate and control the fermentation process, typical for product, help in rapid acid formation, and help protect against spoilage organisms. Starter cultures are cheaply reproducible in large amount; they also help provide desirable sensory properties and assist in reducing fermentation period. Ajayi et al. (2016) have done work on the fermentation of sweet potato into flour using starter culture.
Fourier transforms infrared (FTIR) spectroscopy is one of the most important and emerging tool used for analysing functional groups present in test samples. This technique is rapid and sensitive with a great variety of sampling techniques. FTIR is a rapid, non-

destructive, time saving method that can detect a range of functional groups and is sensitive to changes in molecular structure. FTIR provides information on the basis of chemical composition and physical state of the whole sample (Cocchi et al., 2004). In addition the sensitivity and accuracy of FTIR detectors along with wide variety of software algorithms have dramatically increased the practical use of infrared for quantitative analysis (Dowell et al., 2006). FTIR works because of functional groups and provide information in the form of peaks.
GCMS combines the features of gas chromatography and mass spectrometry to identify different substances within a test sample. Gas chromatography portion separates the chemical mixture into pulses of pure chemicals and the mass spectrometer identifies and quantifies the chemicals. It reveals the compounds eluted at different retention times with mass spectra corresponding to compounds present (Siong et al., 2014).
This study aimed at investigating the functional groups of the Starter culture fermented sweet potato flour using Fourier transform infrared (FTIR) spectroscopy as well as reporting the effect of the functional group on the products, the chemical compounds present in the starter culture fermented sweet potato flour will be detected using the GCMS. MATERIALS AND METHODS
Sourcing of raw materials
Yellow-fleshed sweet potatoes were obtained from Oshodi market (Oshodi), Lagos, Nigeria. The samples were transported to the biotechnology department of the Federal Institute of Industrial Research for immediate use.
Starter cultures
The starter cultures used were obtained from the biotechnology department of the Federal Institute of Industrial Research Oshodi.
Potato dextrose agar and De man Rogosa Sharpe (MRS) agar were prepared using manufacturers specification and sterilized using the autoclave at 121°C for 15 min. L. brevis and D. polymorphous stored in MRS and PDA slants were subcultured into freshly prepared MRS and PDA agar plates. Preparation of innoculum This was carried out using the method of Asmahan et al. (2009). Lactobacillus brevis were cultivated by streaking on MRS agar plates (Oxoid) and incubated anaerobically at 37°C for 24 h. A colony was picked from each pure culture plate, grown successively in MRS broth before centrifugation at 5000 rpm for 15 min. The pellet was washed in sterile distilled water centrifuged again and redistributed in distilled water. This procedure achieved a culture preparation containing about 109 colony forming units cfu/ml, checked as viable count on MRS agar. Pure cultures of D. polymorphous were cultivated by streaking on Potato dextrose agar (Oxoid), incubated at 37°C for 24 h and the picked colony was inoculated into yeast extract peptone dextrose broth (YEPD) and incubated at 28°C for 24 h. These cultures were centrifuged and washed as described above. This procedure achieved a culture preparation containing 107 cfu/ml, as viable count on potato dextrose agar.
Ajayi et al. 3 Preparation of starter culture fermented sweet potato flour
The sweet potatoes were washed to remove adhering soil particles and peeled. The peeled tubers were chipped into slices (4-5 mm).Starter cultures were prepared and inoculated into the sweet potato, then left to ferment for a period of two days (48 h).
After this period has elapsed, the fermented chips were drained and dried in a cabinet drier (Mitchel, Model SM220H) at 55°C for 9 h and milled into flour (≤ 250 μm) using the method of Ajayi et al. (2016) and the starter culture fermented sweet potato flour was produced.
Preparation of fermented sweet potato flour (control) The sweet potatoes were washed to remove adhering soil particles and peeled. The peeled tubers were chipped into slices (4-5 mm) and soaked in potable water for a period of two days (48 h).
After this period has elapsed, the fermented chips were drained and dried in a cabinet drier (Mitchel, Model SM220H) at 55°C for 9 h and milled into flour (≤ 250 μm) (Oluwole et al., 2012). Fourier Transform Infrared (FTIR) FTIR spectra illustrate absorption bands with characteristic frequency attributed to different functional groups and all spectra were obtained, using a Bruker FTIR CLASS 1 ALPHA. The spectra were collected at a resolution of 4 cm−1 in the range of 500- 4000cm−1. Each spectrum was rationed against a fresh background spectrum recorded from the bare crystal. Prior to collection of each background spectrum, the crystal was cleaned with absolute ethanol to remove any residual. Each sample was scanned in triplicate. Gas chromatography mass spectrometry (GCMS) Ten grams of samples were dissolved in 15ml of ethanol. The sample was analysed on a Shimadzu GC-MS system model QP2010, with a medium polarity capillary column SLB-5ms supelco column (length 30.0m x thickness 0.20 mm × Diameter 0.20 mm), with helium as the carrier gas. Column oven temperature was at 40°C, injection temperature was at 250°C, injection mode split (10:1), temperature program was 40°C (Hold 3 min) 9°C/min to 290°C (Hold 6mins), MS ion source temperature at 200o C interface temperature at 250°C. Detector voltage = Relative to the tuning result solvent cut time 4min, Acqusition mode-scan, scanning range 40-550 mz. One microlitre of the sample was injected using splitless injection with injector temperature 300°C according to the following scheme: 50°C for 2min with 10°C/min up to 300°C. The final temperature was held for 10 min. The total runtime for each sample was 37min. For MS detection, electron ionization with 70 eV was applied and mass fragments were detected between 40 and 500 m/z. The ion source temperature and transfer line temperature were 200°C and 300°C, respectively. The detector was activated after 5min.
RESULTS
The FTIR Spectra were recorded in regions below 800 cm
−1, 500 cm
−1 (the fingerprint region), the region
between 2,800 and 3,000 cm−1
(C-H stretch region), and finally the region between 3,000 and 3,600 cm
−1
(O-H stretch region) (Table 1). The O-H stretching for the raw sweet potato occurred at
3322.15 cm-1
.The peaks at 2928.10 cm-1
was observed as a result of C–H bondstretching. The peaks at 1097 cm
-1

4 Afr. J. Microbiol. Res. Table 1. GCMS Peak report for raw sweet potato (G).
Peak #
R Time
Area Area %
Height Height (%)
A/H Name
1 5.720 1027541 0.27 220079 0.64 4.67 Pyrimidine -2,4(1H,3H) -dione, 5-amino-6-nitro
2 6.268 3010757 0.80 1092925 3.19 2.73 2 -Furanmethanol
3 6.556 677120 0.18 262700 0.77 2.58 Propanoic acid, 2- oxo
4 6.802 2180121 0.58 454271 1.32 4.80 Cycloserine
5 7.150 1176657 0.31 484808 1.41 2.43 Dihyroxyacetone
6 7.406 881086 0.24 487437 1.42 1.81 Glyceraldehyde
7 7.440 2679476 0.72 565822 1.65 4.74 Ethanamine, N- ethyl- N- (1-methylethoxy)meth
8 7.726 112304 0.30 540485 1.58 2.08 6-Oxa-bicyclo[3.1.0] hexan-3-one
9 8.793 324740 0.09 178905 0.52 1.82 4H-pyran-4-one, 2,3- dihydro-3, 5- dihydroxy -6-
10 9.175 8645942 2.31 923865 2.69 9.36 2 -Hydroxy -gamma- butyrolactone
11 9.518 1320939 0.35 234913 0.69 5.62 2-propanol, 1- chloro- 3- (1- methylethoxy
12 9.734 482881 0.13 157144 0.46 3.07 Tetrahydro-4H- pyran-4-ol
13 10.015 492607 0.13 245929 0.72 2.00 Esprocarb
14 10.198 2912455 0.78 707736 2.06 4.12 1, 3-Dioxol-2-one
15 10.390 555860 0.15 167491 0.49 3.32 (3-Methyl-oxiran-2-yl)-methanol
16 10.498 2298739 0.61 666881 1.95 3.45 2,5-Dimethyl-4-hydroxy-3(2H)-furanone
17 10.552 557914 0.15 225743 0.66 2.47 6,7-Dioxabicyclo[3.2.2] nonane
18 10.818 2540952 0.68 662644 1.93 3.80 Cyclopentane, 1-acetyl-1,2-epoxy-
19 11.049 5259236 1.41 816451 2.38 6.44 Cyclopropyl carbinol
20 11.432 253776 0.07 82742 0.24 3.07 Homopiperazine
21 11.592 542159 0.14 161569 0.47 3.36 Hexane, 1, 1- oxybis
22 11.725 2355125 0.63 971901 2.83 2.42 Pentanoic acid, 4- oxo-
23 11.938 7737745 2.07 2812686 8.20 2.75 4H- Pyran-4- one,-2,3- dihydro-3,5- dihydroxy
24 12.203 3353258 0.90 475206 1.39 7.06 2(3H) Furanone, dihydro-4- hydroxy-
25 12.759 1974174 0.53 565909 1.65 3.49 Catechol
26 12.863 1769021 0.47 479487 1.40 3.65 Butanenitrile, 2,3- dioxo-, dioxime, O, O - diacet
27 13.168 1356627 0.36 311275 0.91 4.36 2- Furanmethanol,tetrahydro-5-methyl-
28 13.306 10515375 2.81 3280635 9.57 3.20 5-Hydroxymethylfurfural
29 13.596 1615272 0.43 388747 1.13 4.16 1,2,3- Propanetriol, 1- acetate
30 13.793 1298808 0.35 374957 1.09 3.46 Dimethylmucanoic acid
31 14.936 67094767 17.93 2900347 8.46 23.13 Sec - Butylnitrite
32 17.641 76203093 20.37 2020814 5.89 37.71 Sucrose
33 18.306 2901986 0.78 295502 0.86 9.82 Butyl 2- acetoxyacetate
34 17.597 51846108 13.86 3099727 9.04 16.73 1,6-Anhydro-2,4-dideoxy-beta-D-ribohepoxy
35 20.113 87200037 23.30 2246302 6.55 38.75 3- Deoxy- d- mannoic acid
36 23.010 5199882 1.39 1042633 3.04 4.99 n - Hexadecannoic acid
37 23.151 703283 0.19 425723 1.24 1.65 Scopoletin
38 23.344 465000 0.12 310018 0.90 1.50 Hexadecanoic acid, ethyl ester
39 24.832 4985304 1.33 913118 2.66 5.44 9, 12- Octadecadienoic acid (Z, Z) -
40 25.102 605346 0.16 264178 0.77 2.29 12 - Methyl- E- 2, 13-octadecadien-1- ol
41 26.656 4610547 1.23 1353688 3.95 3.41 1-Benzoyl-2-t-butyl-3-methyl-5-vinylimidazoli
42 28.399 304422 0.08 105130 0.31 2.90 6H - Pyrazolo [1, 2-a] [1,2,4,5] tetra-zine, hexahydr
43 28.557 188310 0.05 98405 0.29 1.91 Hexanol
44 29.915 715744 0.19 131722 0.38 5.43 Z, Z- 10, 12- Hexadecadien- 1- ol acetate
45 34.066 238334 0.06 76775 0.22 3.10 alpha- Tocopheryl acetate
374181566 100.00 34285425 100.00
and 1019 cm
-1 were assigned as the C–O bond stretching
(Table 2). This indicates that compounds belonging to hydroxyl group, hydrocarbon and aldehydes group are present in the raw sweet potato.
GCMS peak report reveals the compounds eluted at different retention times with mass spectra
corresponding to compounds present. Figure 1 shows the GCMS chromatogram of raw sweet potato sample from 5.72 to 34.066 s. It showed 45 peaks, compounds such as pyrimidine-2,4(1H,3H) dione was detected with a retention time of 5.72 s and an area percentage of 0.27%, propanoic acid had the retention time of 66.556
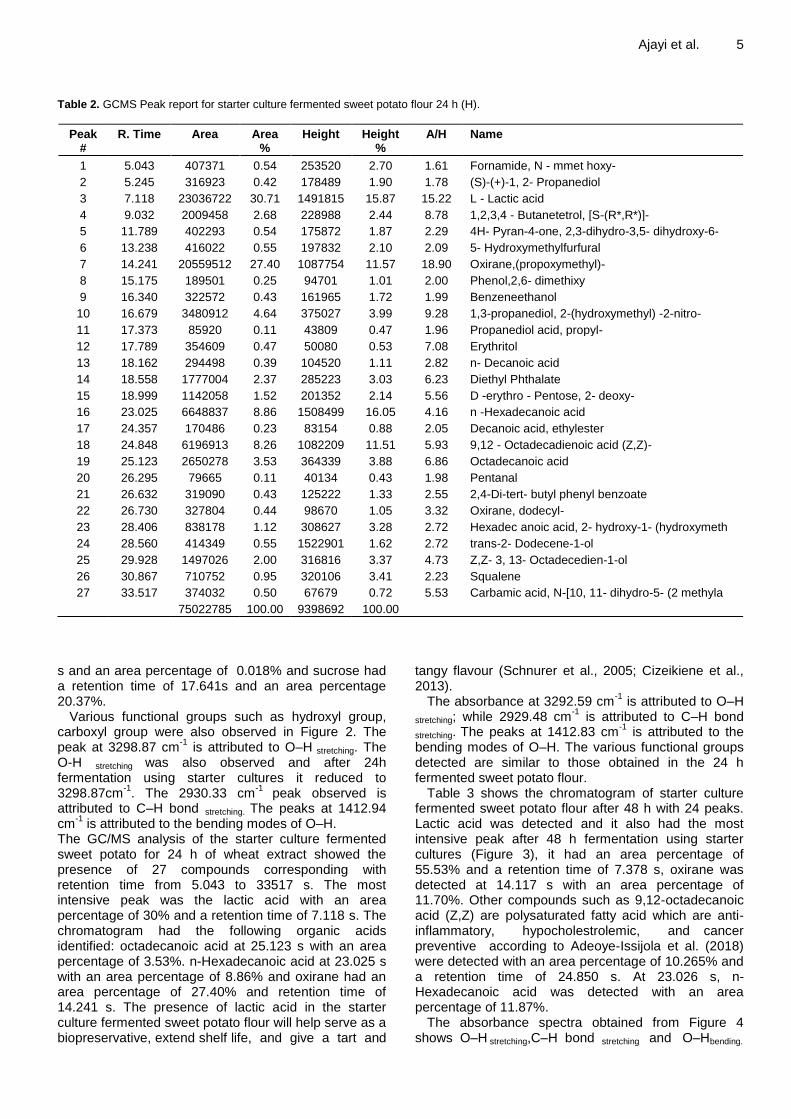
Ajayi et al. 5 Table 2. GCMS Peak report for starter culture fermented sweet potato flour 24 h (H).
Peak #
R. Time Area Area %
Height Height %
A/H Name
1 5.043 407371 0.54 253520 2.70 1.61 Fornamide, N - mmet hoxy-
2 5.245 316923 0.42 178489 1.90 1.78 (S)-(+)-1, 2- Propanediol
3 7.118 23036722 30.71 1491815 15.87 15.22 L - Lactic acid
4 9.032 2009458 2.68 228988 2.44 8.78 1,2,3,4 - Butanetetrol, [S-(R*,R*)]-
5 11.789 402293 0.54 175872 1.87 2.29 4H- Pyran-4-one, 2,3-dihydro-3,5- dihydroxy-6-
6 13.238 416022 0.55 197832 2.10 2.09 5- Hydroxymethylfurfural
7 14.241 20559512 27.40 1087754 11.57 18.90 Oxirane,(propoxymethyl)-
8 15.175 189501 0.25 94701 1.01 2.00 Phenol,2,6- dimethixy
9 16.340 322572 0.43 161965 1.72 1.99 Benzeneethanol
10 16.679 3480912 4.64 375027 3.99 9.28 1,3-propanediol, 2-(hydroxymethyl) -2-nitro-
11 17.373 85920 0.11 43809 0.47 1.96 Propanediol acid, propyl-
12 17.789 354609 0.47 50080 0.53 7.08 Erythritol
13 18.162 294498 0.39 104520 1.11 2.82 n- Decanoic acid
14 18.558 1777004 2.37 285223 3.03 6.23 Diethyl Phthalate
15 18.999 1142058 1.52 201352 2.14 5.56 D -erythro - Pentose, 2- deoxy-
16 23.025 6648837 8.86 1508499 16.05 4.16 n -Hexadecanoic acid
17 24.357 170486 0.23 83154 0.88 2.05 Decanoic acid, ethylester
18 24.848 6196913 8.26 1082209 11.51 5.93 9,12 - Octadecadienoic acid (Z,Z)-
19 25.123 2650278 3.53 364339 3.88 6.86 Octadecanoic acid
20 26.295 79665 0.11 40134 0.43 1.98 Pentanal
21 26.632 319090 0.43 125222 1.33 2.55 2,4-Di-tert- butyl phenyl benzoate
22 26.730 327804 0.44 98670 1.05 3.32 Oxirane, dodecyl-
23 28.406 838178 1.12 308627 3.28 2.72 Hexadec anoic acid, 2- hydroxy-1- (hydroxymeth
24 28.560 414349 0.55 1522901 1.62 2.72 trans-2- Dodecene-1-ol
25 29.928 1497026 2.00 316816 3.37 4.73 Z,Z- 3, 13- Octadecedien-1-ol
26 30.867 710752 0.95 320106 3.41 2.23 Squalene
27 33.517 374032 0.50 67679 0.72 5.53 Carbamic acid, N-[10, 11- dihydro-5- (2 methyla
75022785 100.00 9398692 100.00
s and an area percentage of 0.018% and sucrose had a retention time of 17.641s and an area percentage 20.37%.
Various functional groups such as hydroxyl group, carboxyl group were also observed in Figure 2. The peak at 3298.87 cm
-1 is attributed to O–H stretching. The
O-H stretching was also observed and after 24h fermentation using starter cultures it reduced to 3298.87cm
-1. The 2930.33 cm
-1 peak observed is
attributed to C–H bond stretching. The peaks at 1412.94 cm
-1 is attributed to the bending modes of O–H.
The GC/MS analysis of the starter culture fermented sweet potato for 24 h of wheat extract showed the presence of 27 compounds corresponding with retention time from 5.043 to 33517 s. The most intensive peak was the lactic acid with an area percentage of 30% and a retention time of 7.118 s. The chromatogram had the following organic acids identified: octadecanoic acid at 25.123 s with an area percentage of 3.53%. n-Hexadecanoic acid at 23.025 s with an area percentage of 8.86% and oxirane had an area percentage of 27.40% and retention time of 14.241 s. The presence of lactic acid in the starter culture fermented sweet potato flour will help serve as a biopreservative, extend shelf life, and give a tart and
tangy flavour (Schnurer et al., 2005; Cizeikiene et al., 2013).
The absorbance at 3292.59 cm-1
is attributed to O–H
stretching; while 2929.48 cm-1
is attributed to C–H bond
stretching. The peaks at 1412.83 cm-1
is attributed to the bending modes of O–H. The various functional groups detected are similar to those obtained in the 24 h fermented sweet potato flour.
Table 3 shows the chromatogram of starter culture fermented sweet potato flour after 48 h with 24 peaks. Lactic acid was detected and it also had the most intensive peak after 48 h fermentation using starter cultures (Figure 3), it had an area percentage of 55.53% and a retention time of 7.378 s, oxirane was detected at 14.117 s with an area percentage of 11.70%. Other compounds such as 9,12-octadecanoic acid (Z,Z) are polysaturated fatty acid which are anti-inflammatory, hypocholestrolemic, and cancer preventive according to Adeoye-Issijola et al. (2018) were detected with an area percentage of 10.265% and a retention time of 24.850 s. At 23.026 s, n-Hexadecanoic acid was detected with an area percentage of 11.87%.
The absorbance spectra obtained from Figure 4 shows O–H stretching,C–H bond stretching and O–Hbending.

6 Afr. J. Microbiol. Res.
Figure 1. FTIR absorbance spectra for raw sweet potato (G).
Figure 2. FTIR absorbance spectra for Starter culture fermented sweet potato flour 24 h (h).
The absorbance at 3279.59 cm-1
is attributed to O–H
stretching while C–Hstretching occurred at 2929.31 cm-1
(Table 4). The peaks at 1414.11 cm
-1 is attributed to the
bending modes of O–H.
The chromatogram for 72 h starter culture fermented sweet potato flour is showed in Table 5 and Figure 5. Compounds such as n-Hexadecanoic acid with area percentage of 11.875% with a retention time of 23.026
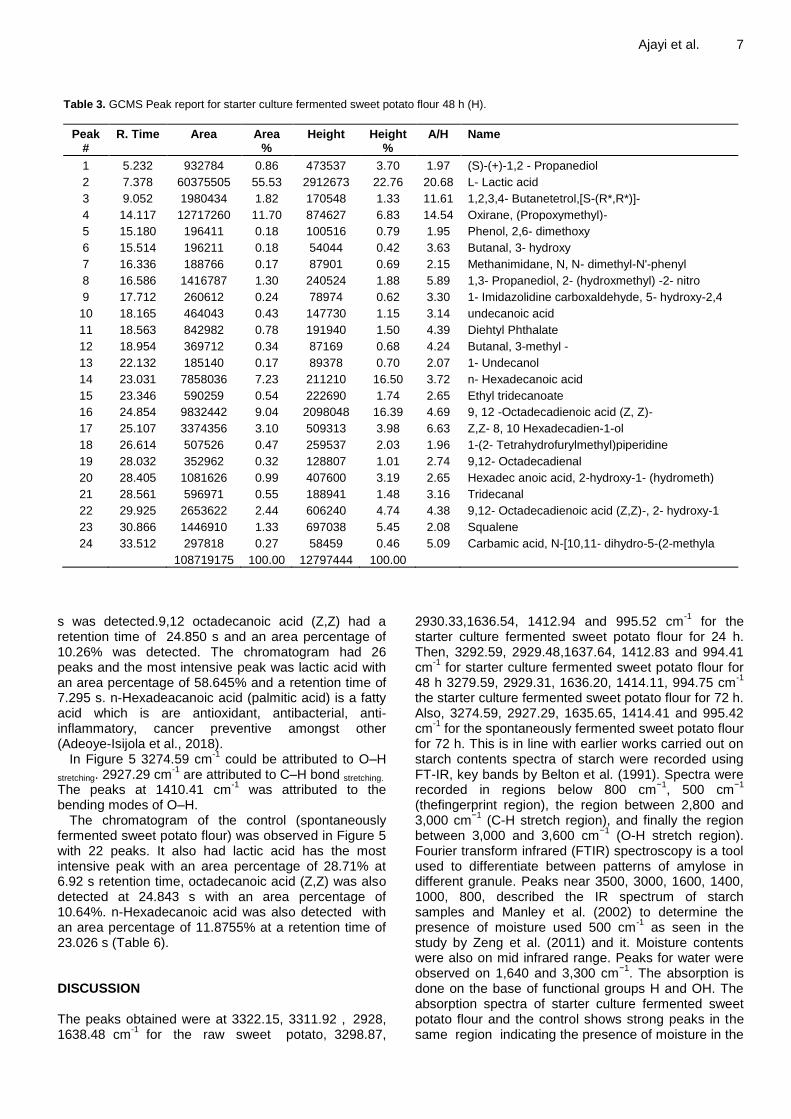
Ajayi et al. 7 Table 3. GCMS Peak report for starter culture fermented sweet potato flour 48 h (H).
Peak #
R. Time Area Area %
Height Height %
A/H Name
1 5.232 932784 0.86 473537 3.70 1.97 (S)-(+)-1,2 - Propanediol
2 7.378 60375505 55.53 2912673 22.76 20.68 L- Lactic acid
3 9.052 1980434 1.82 170548 1.33 11.61 1,2,3,4- Butanetetrol,[S-(R*,R*)]-
4 14.117 12717260 11.70 874627 6.83 14.54 Oxirane, (Propoxymethyl)-
5 15.180 196411 0.18 100516 0.79 1.95 Phenol, 2,6- dimethoxy
6 15.514 196211 0.18 54044 0.42 3.63 Butanal, 3- hydroxy
7 16.336 188766 0.17 87901 0.69 2.15 Methanimidane, N, N- dimethyl-N'-phenyl
8 16.586 1416787 1.30 240524 1.88 5.89 1,3- Propanediol, 2- (hydroxmethyl) -2- nitro
9 17.712 260612 0.24 78974 0.62 3.30 1- Imidazolidine carboxaldehyde, 5- hydroxy-2,4
10 18.165 464043 0.43 147730 1.15 3.14 undecanoic acid
11 18.563 842982 0.78 191940 1.50 4.39 Diehtyl Phthalate
12 18.954 369712 0.34 87169 0.68 4.24 Butanal, 3-methyl -
13 22.132 185140 0.17 89378 0.70 2.07 1- Undecanol
14 23.031 7858036 7.23 211210 16.50 3.72 n- Hexadecanoic acid
15 23.346 590259 0.54 222690 1.74 2.65 Ethyl tridecanoate
16 24.854 9832442 9.04 2098048 16.39 4.69 9, 12 -Octadecadienoic acid (Z, Z)-
17 25.107 3374356 3.10 509313 3.98 6.63 Z,Z- 8, 10 Hexadecadien-1-ol
18 26.614 507526 0.47 259537 2.03 1.96 1-(2- Tetrahydrofurylmethyl)piperidine
19 28.032 352962 0.32 128807 1.01 2.74 9,12- Octadecadienal
20 28.405 1081626 0.99 407600 3.19 2.65 Hexadec anoic acid, 2-hydroxy-1- (hydrometh)
21 28.561 596971 0.55 188941 1.48 3.16 Tridecanal
22 29.925 2653622 2.44 606240 4.74 4.38 9,12- Octadecadienoic acid (Z,Z)-, 2- hydroxy-1
23 30.866 1446910 1.33 697038 5.45 2.08 Squalene
24 33.512 297818 0.27 58459 0.46 5.09 Carbamic acid, N-[10,11- dihydro-5-(2-methyla
108719175 100.00 12797444 100.00
s was detected.9,12 octadecanoic acid (Z,Z) had a retention time of 24.850 s and an area percentage of 10.26% was detected. The chromatogram had 26 peaks and the most intensive peak was lactic acid with an area percentage of 58.645% and a retention time of 7.295 s. n-Hexadeacanoic acid (palmitic acid) is a fatty acid which is are antioxidant, antibacterial, anti-inflammatory, cancer preventive amongst other (Adeoye-Isijola et al., 2018).
In Figure 5 3274.59 cm-1
could be attributed to O–H
stretching. 2927.29 cm-1
are attributed to C–H bond stretching.
The peaks at 1410.41 cm-1
was attributed to the bending modes of O–H.
The chromatogram of the control (spontaneously fermented sweet potato flour) was observed in Figure 5 with 22 peaks. It also had lactic acid has the most intensive peak with an area percentage of 28.71% at 6.92 s retention time, octadecanoic acid (Z,Z) was also detected at 24.843 s with an area percentage of 10.64%. n-Hexadecanoic acid was also detected with an area percentage of 11.8755% at a retention time of 23.026 s (Table 6). DISCUSSION The peaks obtained were at 3322.15, 3311.92 ,
2928,
1638.48 cm-1
for the raw sweet potato, 3298.87,
2930.33,1636.54, 1412.94 and 995.52 cm-1
for the starter culture fermented sweet potato flour for 24 h. Then, 3292.59, 2929.48,1637.64, 1412.83 and 994.41 cm
-1 for starter culture fermented sweet potato flour for
48 h 3279.59, 2929.31, 1636.20, 1414.11, 994.75 cm-1
the starter culture fermented sweet potato flour for 72 h. Also, 3274.59, 2927.29, 1635.65, 1414.41 and 995.42 cm
-1 for the spontaneously fermented sweet potato flour
for 72 h. This is in line with earlier works carried out on starch contents spectra of starch were recorded using FT-IR, key bands by Belton et al. (1991). Spectra were recorded in regions below 800 cm
−1, 500 cm
−1
(thefingerprint region), the region between 2,800 and 3,000 cm
−1 (C-H stretch region), and finally the region
between 3,000 and 3,600 cm−1
(O-H stretch region). Fourier transform infrared (FTIR) spectroscopy is a tool used to differentiate between patterns of amylose in different granule. Peaks near 3500, 3000, 1600, 1400, 1000, 800, described the IR spectrum of starch samples and Manley et al. (2002) to determine the presence of moisture used 500 cm
-1 as seen in the
study by Zeng et al. (2011) and it. Moisture contents were also on mid infrared range. Peaks for water were observed on 1,640 and 3,300 cm
−1. The absorption is
done on the base of functional groups H and OH. The absorption spectra of starter culture fermented sweet potato flour and the control shows strong peaks in the same region indicating the presence of moisture in the

8 Afr. J. Microbiol. Res.
Figure 3. FTIR absorbance spectra for starter culture fermented sweet potato flour 48 h (I).
Figure 4. FTIR absorbance spectra for starter culture fermented sweet potato flour for 72 h (J).

Ajayi et al. 9
Table 4. GCMS Peak Report for starter culture fermented sweet potato flour 72 h (J).
Peak # R. Time Area Area % Height Height % A/H Name
1 5.235 663461 0.86 351595 3.60 1.89 (S)-(+)- 1,2- Propanediol
2 7.295 44982527 58.64 2582353 26.45 17.42 L- Lactic acid
3 8.298 78983 0.10 51596 0.53 1.53 Ethanamine, 2-propoxy-
4 9.048 1711842 2.23 182475 1.87 9.38 1,2,3,4- Butanetetrol, [S-(R*,R*)]-
5 9.848 271735 0.35 69837 0.72 3.89 Butanoic acid, 2- hydroxy-3- methyl-
6 10.011 58890 0.08 35416 0.36 1.66 Benzeneacetic acid 1- methyl ethylester
7 10.151 81200 0.11 36343 0.37 2.23 Oxirane, 2,3- dimethyl-, cis-
8 13.937 4303934 5.61 559557 5.73 7.69 2- furanol, tetrahydro-2,3- dimethyl -, trans-
9 15.780 68755 0.09 37857 0.39 1.82 2 - Heptanamine, 5- methyl-
10 15.900 58065 0.08 34379 0.35 1.69 3,4 - Hexanedione, 2,2,5- trimethyl-
11 16.332 148684 0.19 65630 0.67 2.27 2- propenoic acid, 3 - phenyl
12 17.690 417392 0.54 128830 1.32 3.24 1,2,3,4- Cyclopentanetetrol, (1.alpha., 2beta., 3.1
13 18.057 31594 0.04 17255 0.18 1.83 Cyclopropyl carbinol
14 18.160 210811 0.27 71411 0.73 2.95 Propanedioic acid propyl-
15 18.564 337334 0.44 115687 1.19 2.92 Diethyl Phthalate
16 18.674 61127 0.08 34664 0.36 1.76 Pentanal
17 23.026 9108301 11.87 2018266 20.68 4.35 n - Hexadecanoic acid
18 23.347 197817 0.26 112642 1.15 1.76 Ethyl tridecanoate
19 24.343 261728 0.34 88641 0.91 2.95 Oxalic acid, allyl pentadecyl ester
20 24.850 7871474 10.26 1756535 17.99 4.48 9, 12- Octadecadienoic acid (Z, Z)-
21 25.109 2179835 2.84 388434 3.98 5.61 9, 9- Dimethoxybicyclo[3. 3. 1] nona- 2,4- dione
22 28.404 507649 0.66 175857 1.80 2.89 Hexadecanoic acid, 2 -hydroxy-1-(hydroxymeth
23 28.562 390981 0.51 129992 1.33 3.01 Heptanal
24 29.562 1156839 1.51 206547 2.12 5.60 2- Methyl- Z,Z-3,13- octadecadienol
25 30.865 982993 1.28 419254 4.29 3.34 2,6,10,14,18- Pentamethyl-2,6,10,14,18- eicosap
26 33.516 569698 0.74 90453 0.93 6.30 Carbamic acid, N -[10, 11- dihydro-5-(2-methyla
76713649 100.00 9761506 100.00
Table 5. GCMS Peak Report for starter culture fermented sweet potato flour 72 h (J).
Peak # R. Time
Area Area %
Height Height %
A/H Name
1 5.059 537269 2.06 117343 2.34 4.58 Ethanol, 2-nitro-
2 5.264 140986 0.54 67247 1.34 2.07 Formamide
3 6.920 7496208 28.71 617319 12.33 11.93 L- Lactic acid
4 8.773 212749 0.81 52524 1.05 4.05 Propanedioic acid, propyl-
5 8.849 671411 2.57 102578 2.05 6.55 1,2,3,4 - Butanetetrol, [S-(R*, R*)]-
6 11.331 115365 0.44 53716 1.07 2.15 Phenylethyl Alcohol
7 13.932 4338523 16.62 454674 9.08 9.29 (S)-(-)-1,2,4- Butanetriol, 2- acetate
8 15.177 84153 0.32 60439 1.21 1.39 Phenol, 2,6- dimethoxy-
9 18.156 15142 0.59 50058 1.00 3.08 Propanedioic acid, propyl-
10 23.026 3099692 11.87 1051581 21.00 2.95 n - Hexadecanoic acid
11 23.346 308180 1.18 126965 2.54 2.43 Decanoic acid
12 24.343 116249 0.45 63494 1.27 1.83 2- Heptanamine, 5-methyl -
13 24.843 2779010 10.64 524660 10.48 5.30 9,12- Octadecadienoic acid (Z,Z)-
14 25.102 1304627 5.00 263292 5.26 4.96 9- Octadecyonic acid
15 25.336 183668 0.70 57224 1.14 3.21 Hexanal
16 26.429 150043 0.57 65403 1.31 2.29 2- Heptanamine, 5 -methyl-
17 26.961 173089 0.66 87917 1.76 1.97 Cyclooctyl alcohol
18 28.032 534373 2.05 130463 2.61 4.10 Z, -1,9- Hexadecadiene
19 28.405 751722 2.88 284641 5.69 2.64 Hexadecanoic acid, 2- hydroxy-1-(hydroxymeth
20 29.931 1550434 5.94 288336 5.76 5.38 Z,Z -3, 13- Octadecedien-1-ol
21 30.867 985028 3.77 403555 8.06 2.44 Squalene
22 31.417 419765 1.61 82964 1.66 5.06 Carbamic acid, N -[10,11-dihydro-5-(2-methyla
26106596 100.00 5006393 100.00

10 Afr. J. Microbiol. Res.
Figure 5. FTIR absorbance spectra for starter culture fermented sweet potato flour for 72 h control (K).
flour. FTIR is one of the most elusive methods for the analysis of moisture. Water absorbs strongly in the infrared region of the spectrum due to its O-H stretching and H bending vibrations however its quantization is frequently complicated by spectral interferences from other OH containing constituents such as alcohols, phenols and hydroperoxides and confounded further by hydrogen bonding effects (Dong et al., 2000).
The O-H stretching for the raw sweet potato occurred at 3322.15 cm
-1 and after 24h fermentation using starter
cultures, it reduced to 3298.87cm-1
; at 48 h it was 3279.59 cm
-1 and at 72h it was 3279.59 cm
-1. The
decrease in the wavelength with increase in time depicts dilution of the crystalline (amylose) region, leading to the breakage of α- 1,4- glycosidic linkage. Consequently, the hydrophilic O-H group will contribute to the increasing amorphous fraction.
The peaks at 2928.10, 2930.33, 2929.48, 2929.31 and 2927.29 cm
-1 are attributed to C–H bond stretching.
The C-H stretching for raw potato, starter culture fermented sweet potato flour at 24 h, 48 h, 72 h were 2928.10, 2930.33, 2929.48 and 2929.31 cm
-1 respectively. These
values fall within the same range. This indicates that there was a change in the functional group and this could be the oxidation of an aldehyde group (CHO) during the fermentation.
Supriya et al. (2015) observed that Crude fat of flour samples had peaks at 1,600 cm
−1 to 1,700 cm
−1 and
1,550 to 1,570 cm−1
.The absorption peaks are determined on the basis of C-H bonds. The absorption spectra of starter culture fermented sweet potato flour also show strong peaks in the same region, which indicates the presence of fat in flour. It has been reported that FTIR spectroscopy could be utilized as a quality control method for fat and moisture determination in butter and high-fat products (Van de Voort et al., 1992). Che-Man and Setiowaty (1999) and Rai et al. (2013) also reported similar results.
Supriya et al. (2015) observed absorption bands that are two primary features of the protein, amide I and amide II bands at approximately 1,660 cm
−1 and 1,550
cm−1
, respectively. Amide I arises from the stretch of C=O of the peptide group in the protein. Peaks were also observed around this region for the starter culture fermented sweet potato flour as well as the control. A cursory look at the spectra shows a slight decrease in the wavelength of the carboxyl (C=Ostretching) of the α 1,4- and α1,6- glycosidic linkeage (1638.48 cm
-1 for
raw sweet potato,1636.54 cm-1
after 24 h,1637.20 cm-1
after 48 h and 1636.64 cm-1
after 72 h. The slight decrease in wavenumber indicates arial oxidation to carboxylic acid such as, acetic acid /ascorbic acid which can serve as preservative to the flour.
The stretching vibration for α 1,4- glycosidic linage at the amylose region decreased from 1003.96 cm
-1 for
raw sweet potato to 994.75 cm-1
after 72 h, this will

Ajayi et al. 11
Table 6. Summary of some compounds obtained from GC-MS analysis.
Duration Compounds Area (%)
0 h (G)
3- Deoxy-d-mannoic acid 23.3
Sucrose 20.37
Sec- Butylnitirte 17.93
1,6- Anhdr-2,4-dieoxy-beta-D-ribo-hexopy 13.86
5-Hydroxymethylfufura 2.81
24 h (H)
L-Lactic acid 30.71
Oxirane ,(Propoxymethyl) 27.4
n-Hexadecanoic acid 8.86
9,12-Octadecadienoic acid (Z, Z) 8.26
1,3-Propanediol,2-(hydroxymethyl)-2-nitro 4.64
Octadecanoic acid 3.53
1,2,3,4-Buatanetetrol 2.68
Diethyl phthalate 2.37
L-Lactic acid 55.53
48 h (I)
Oxirane 11.7
9,12-Octadecanoic acid 9.04
n-Heaxdecanoic acid 7.23
Z, Z-8,10-Hexadecadien-1-ol 3.1
9,12-Octadeacadienoic acid 2.44
1,2,3,4-Butanetetrol 1.82
72 h (J)
L-Lactic acid 58.64
n-Hexadecanoic acid 11.87
9,12-Octadecadienoic acid 10.26
2-Furanol,tetrahydro-2,3-dimethyl-trans-9,9- 5.61
Dimethoxybicyclo(3.3.1)nona-2,4-dione 2.84
1,2,3,4-Butanetetrol 2.23
further release more glucose unit into the amorphous region thus enhancing the swelling properties of the flour.
The peaks at 1412 .94, 1412.83, 1414.11 and 1414.41 cm
-1 were attributed to the bending modes of
O–H. The peaks at 1097 and 1019 cm
-1 were assigned as
the C–O bond stretching. The bands at 1047 and 1022 cm
-1 were associated with the ordered and amorphous
structures of starch respectively. The starter culture fermented sweet potato flour had
more peaks than the control after 72 h fermentation. It also had higher concentration of lactic acid, which indicates a faster rate of fermentation with the use of starter cultures. The presence of high concentration of lactic acid will also help inhibit the presence of spoilage organisms, the elimination of spoilage organisms and it will serve as preservatives.
Some of the compounds detected by the GCMS include 9,12-octadecadienoic acid; hexadecanoic acid which are antioxidant; ethanol which is used as food preservative and propanoic acid which is widely used as an antifungal agent amongst others Supriya et al. (2015).
Generally, the chemical components were identified in each sample. The purpose of the study was identify the chemical components and compare presence of components in the various sample. Similar chromatograms were also obtained for all the starter culture fermented sweet potato samples. This study has shown that it is possible to compare the chemical compounds of samples with GCMS chromatography. Conclusion The study reveals that sweet potato contain starch (amylose and amylopectin) and sucrose as sugar.
Starter cultures L. brevis and D. polymorphous fermented the sweet potato thereby breaking down the carbohydrate (starch) to produce alcohol, organic acid and CO2 hence lactic acid fermentation occurred.
Functional groups such as hydroxyl, aldehydes, alcohol and carboxyl are present in the fermented samples. Lactic acid fermentation occurred and it caused a shift in some of the functional groups.
The chemical shift indicates that the starter culture fermented sweet potato flour containing compounds

12 Afr. J. Microbiol. Res. such as carboxylic acids, alcohols, aldehydes, hydroxyl and alkenes.
Starter culture fermented sweet potato flour had a higher concentration of carboxylic acids, alcohols, aldehydes etc. Alcohol and carboxylic acid was produced in situ from the fermentation process, which will help inhibit spoilage organisms moreover, it will also serve as preservatives thereby increasing shelf life of the product.
The FTIR showed a similar spectrum for all the fermented sweet potato flour and it was possible to verify the main organic functions associated, the results corroborate the wide variety of volatile organic compounds identified by the CGMS. The presence of OH group detected by FTIR which was further emphasized by the presence of butanol detected by the GCMS, and the presence of the C=O group detected by FTIR which was also emphasized. CONFLICT OF INTERESTS The authors have not declared any conflict of interest. ACKNOWLEDGEMENT The authors wish to acknowledge the Federal Institute of Industrial Research, Oshodi, Lagos, Nigeria for providing funds and laboratory facilities for the project. REFERENCES Adeoye-Isijola MO, Olajuuyibe OO, Jonathan SG, Coopoosamy RM
(2018). Bioactive compounds in ethanol extract of lentinus squarrosulus mont-A Nigeria medicinal macrofungus. African Journal of Traditional, Complementary and Alternative Medicines 15(2):42-50.
Ajayi OI, Ehiwuogu-Onyibe J, Oluwole OB, Salami TA, Jegede AA, Asieba G O, Chiedu IE, Suberu YL, Aba EM, Dike EN, Ajuebor FN, Elemo GN (2016). Production of fermented sweet potato flour using indigenous starter cultures. African Journal of Microbiology Research 10(41):1746-1758.
Aguirre M, Collins MD (1993). Lactic acid bacteria and human clinical infection. Journal of Applied Bacteriology 75:95-107.
Asmahan AA, Muna MM (2009). Use of starter cultures of lactic acid bacteria and yeasts in the preparation of kisra, a Sudanese fermented food. Pakistan Journal of Nutrition 8(9):1349-1353.
Belton PS, Goodfellow BJ, Wilson RH (1991). Comparison of Fourier transform mid infrared spectroscopy and near infrared reflectance spectroscopy with differential scanning and calorimetry for the study of the staling of bread. Journal of the Science of Food and Agriculture 51:453-447.
Brigato F, Oliveira, FG, Collares-Quieroz FP (2010). Optimization of the deepfrying process of sweet potato chip in palmolein or stearin. American Journal of Food Technology 105-107.
Brena BM, Ovsejevi K, Luna B, Batista Viera F (1993). Thiolation and reversible immobilization of sweet potato amylase on thiosulfonate-agarose. Journal of Molecular Catalysis 84:381-90.
Cizeikiene D, Juodeikiene G, Paskevicius A, Bartkiene E. (2013). Antimicrobial activity of lactic acid bacteria against pathogenic and spoilage microorganism isolated from food and their control in wheat bread. Food Control 31(2):539-545.
Che-Man YB, Setiowaty G (1999). Application of Fourier transform infrared spectroscopy to determine free fatty acid contents palmolein. Food Chemistry 66:109-111.
Cocchi M, Foca G, Lucisano M, Marchetti A, Paean MA, Tassi L, Ulrici A (2004). Classification of cereal flour by chemometric
analysis of MIR spectra. Journal of Agricultural and Food Chemistry 52:1062-1067.
Cudney R, Mcpherson A (1993). Preliminary crystallographic analysis of sweet potato beta amylase. Journal of Molecular Biology 229:53-254.
Dias RP, Fernandes CS, Mota M, Teixeira J, Yelshin A (2008). Starch analysis using hydrodynamic chromatography with a mixed-bed particle column. Carbohydrate Polymers 74:852-857.
Dong J, van de Voort FR, Ismail AA, Akochi-Koble E, Pinchuk D (2000). Rapid determination of the carboxylic acid contribution to the total acid number of lubricants by Fourier transform infrared spectroscopy. Lubrication Engineering 56(6):12–17.
Dowell FE, Maghirang EB, Grayboch RA, Baenziger PS, Baltensperger DD, Hansen LE (2006). An automated near –infrared system for selecting individual kernels based on specific quality characteristics. Cereal Chemistry 83:537-543.
Evers AD, Blakeney AB, O’Brien L (1999). Cereal structure and composition. Australian Journal of Agricultural Research 50:629–650.
Fortman JL, Chhabra S, Mukhopadhyay A, Chou H, Lee TS, Steen E, Keasling JD (2008). Biofuel alternatives to ethanol: pumping the microbial well. Trends in Biotechnology 26:375-381.
Gray KA, Zhao L, Emptage M (2006). Bioethanol. Current Opinion in Chemical Biology 10:141-146.
Hagenimana V, Owori C (1998). Feasibility, acceptability and production costs of sweet potato based products in Uganda. CIP Program report 1995-1996. pp. 276-281.
Huang WC, Tang IC (2007). Bacterial and Yeast Cultures-Process Characteristics, Products and Applications. In: Shang-Tian Yang (Editor). Bioprocessing for Value-Added Products from Renewable Resources. Bioprocessing Innovative Company, USA, Chapter 8. pp. 185-223.
Kim KI, Leonard E, Maldonado J, Park P (2007). Radiant energy and the determination of protein and carbohydrate content of foods. Governor's School of Engineering and Technology Research Journal (Report).
Lesmes U, Cohen SH, Shener Y, Shimoni E (2009). Effects of long chain fatty acid unsaturation on the structure and controlled release properties of amylose complexes. Food Hydrocolloid 23:667-675.
Manley M, Zyl LV, Osborne BG (2002). Using Fourier transform near infrared spectroscopy in determining kernel hardness, protein, and moisture content of whole wheat flour. Journal of Near Infrared Spectroscopy 10:71-76.
Matveev YI, van Soest JJG, Nieman C, Wasserman LA, Protserov VA, Ezernitskaja M (2001). The relationship between thermodynamic and structural properties of low and high amylose maize starches. Carbohydrate Polymers 44:151-160.
Mosier N, Wyman, C, Dale B, Elander R, Lee YY, Holtzapple M, Ladisch MR (2005). Features of Promising technologies for pretreatment of lignocellulosic biomass. Bioresource Technology 96:673-686.
Nigam P, Singh O (1995). Enzyme and microbial systems involved in starch processing. Enzyme and Microbial Technology 17:770-778.
Oluwole OB, Kosoko SB, Owolabi SO, Salami MJ, Elemo GN, Olatope SOA (2012). Development and production of fermented flour from sweet potato. (Ipeoma Batatas L.) as a potential food security product. Journal of Food Science and Engineering 2:257-262.
Opere B, Aboaba OO, Ugoji EO, Iwalokun BA (2012). Estimation of nutrition value, organoletic properties and consumer acceptability of fermented cereals gruel ogi. Advance Journal of Food Science and Technology 4(1):1-8.
Panda SH, Ray RC (2007). Lactic acid fermentation of beta carotene rich sweet potato (Ipomoea batatas L.) into lacto juice, plant foods. Human Nutrition 62(2):65-70.
Perez S, Baldwin PM, Gallant DJ (2009). Structural features of starch granules. In Starch: Chemistry and Technology, 3rd ed; BeMiller J, Whistler R, Eds. Academic Press: New York, NY, USA.
Perez S, Bertoft E (2010). The molecular structures of starch components and their contribution to the architecture of starch granules: A comprehensive review. Starch 62:389-420.
Rai MA, Faqir MA, Muhammad IK, Moazzam RK, Imran P, Muhammad N (2013). Application of Fourier transform infrared (FTIR) spectroscopy for the identification of wheat varieties. Journal of Food Science and Technology 50(5):1018-1023.
Schnürer J, Magnusson J (2005). Antifungal lactic acid bacteria as
biopreservatives. Trends in Food Science and Technology 16(1-3):70-78.
Schwartz D, Whistler RL (2009). History and future of starch. In Starch: Chemistry and Technology, 3rd ed. BeMiller J, Whistler R, Eds. Academic Press: New York, NY, USA.
Shariffa YN, Karim AA, Fazilah A, Zaidul ISM (2009). Enzymatic hydrolysis of granular native and mildly heat-treated tapioca and sweet potato starches at sub-gelatinization temperature. Food Hydrocolloid 23:434-440.
Siong FS Terri ZEL, Nurul AL, Mohd IL and Benedict S (2014). Synchronized analysis of FTIR spectra and GCMS chromatograms for evaluation of thermally degraded oil. Journal of Analyitcal methods in Chemistry. Vol. 2014.
Silva CF, Batista LR, Abreu LM, Dias ES, Schwan RF (2008).Succession of bacterial and fungal communities during natural coffee (Coffea arabica) fermentation. Food Microbiology 25:951-957.
Smita H, Parmanick PM, Ray RC (2007).Lactic acid fermentation of sweet potato (Ipomoea batatas L.) into lacto juice. Plant Foods for Human Nutrition 62(2):65-70.
Supriya MB, Rajinder Gupta K (2015). Bread (composite flour) formulation and study of its nutritive, phytochemical and functional properties. Journal of Pharmacognosy and Phytochemistry 4(2):254-268.
Van de Voort FR, Sedman J, Emo G, Ismail AA (1992). Assessment of Fourier transform infrared analysis of milk. Journal - Association of Official Analytical Chemists 75(5):780-785.
Wang AJ, Ren NQ, Shi YG, Lee DJ (2008). Bioaugmented hydrogen production from microcrystalline cellulose using co-culture - Clostridium acetobutylicum X-9 and Etilanoigenens harbinense B-49. International Journal of Hydrogen Energy 33:912-917.
Ajayi et al. 13 Willett JL (2009). Starch in polymer compositions. In Starch:
Chemistry and Technology, 3rd ed.; BeMiller J, Whistler R, Eds.; Academic Press: New York, NY, USA.
Yang C, Meng B, Chen M, Liu X, Hua Y, Ni Z.(2006). Laser-light-scattering study of structure and dynamics of waxy corn amylopectin in dilute aqueous solution. Carbohydrate Polymers 64:190-196.
Yokoi H, Saitsu A, Uchida H, Hirose J, Hayashi S, Takasaki Y( 2001).Microbial hydrogen production from sweet potato starch residue. J Biosci Bioeng 91:58-63.
Yoo SH, Jane J (2002). Molecular weight and gyration radii of amylopectins determined by high-performance size-exclusion chromatography equipped with multi-angle laser-light scattering and refractive index detectors. Carbohydrate Polymers 49:307-314.
Yuan JS, Tiller KL, Al-Ahmad H, Stewart NR, Stewart Jr CN (2008). Plants to power: bioenergy to fuel the future. Trends in Plant Science 13:421-429.
Zeng J, Li G, Gao H, Ru Z (2011). Comparison of A and B starch granules from three wheat varieties. Molecules 16:10570-10591.
Vol. 13(1), pp. 14-22, 7 January, 2019
DOI: 10.5897/AJMR2018.9017
Article Number: F17905059757
ISSN: 1996-0808
Copyright ©2019
Author(s) retain the copyright of this article
http://www.academicjournals.org/AJMR
African Journal of Microbiology Research
Full Length Research Paper
In vitro antibacterial activity of Rumex nervosus and Clematis simensis plants against some bacterial
human pathogens
Habtamu Tedila* and Addisu Assefa
College of Natural and Computational Science Department of Biology (Stream of Applied Microbiology), Madda Walabu
University, PO box 247, Bale Robe, Ethiopia.
Received 9 November, 2018; Accepted 13 December 2018
Due to quick growth of resistance and high cost of new generation antibiotics, lots of efforts were made to discover new antimicrobial agents from various sources. So, current study was assessed antibacterial activity of ethanol, methanol, acetone, diethyl ether and hexane leav e extracts of Rumex nervosus and Clematis simensis by used paper disc diffusion and broth dilution procedures against six human pathogenic bacterial strains. The pathogenic bacteria were Shigella dysenteriae, Escherichia coli, Staphylococcus aureus, Pseudomonas aeruginosa, Salmonella Typhi and Klebsiella pneumoniae were susceptible to ethanol, methanol and acetone extracts of the leaves of R. nervosus followed by C. simensis, but hexane extract didn’t displayed any activity. The extreme inhibition zone of 16.3±0.57 mm was detected against E. coli by ethanol extract of R. nervosus and MIC of 3.125 mg/ml against E. coli and S. dysenteriae by methanol extract. The methanol extract of C. simensis formed a marked inhibition of 13.1±0.37 mm against E. coli and ethanol extract of C. simensis displayed activity against S. dysenteriae 14.4±0.45 mm and MIC of 6.25 mg/ml against S. Typhi. Four dissimilar antibiotics like ciprofloxin, tetracyclin, kanamycin and chloramphenicol were used as standard for tested antibacterial activity against six different human pathogens. The activities were recognized the presence of some secondary metabolites existed in the tested floras which have related with antibacterial activities. Key words: Antibacterial activity, Clematis simensis, Human pathogens, Rumex nervosus.
INTRODUCTION Traditional medicine is a popular form therapy in developing countries and its use broadly recognized in numerous literatures. The improving emergence of antimicrobial resistance deteriorates the impact (Mulu et al., 2006; Olivier et al., 2010). It has been shown that risk of negative clinical consequences, mortality, and high
treatment costs with drug-resistant bacteria is generally higher compared to patients infected with the same non-resistant bacteria (WHO, 1991). Improved prevalence of resistant bacteria, together with lack and high cost of new generation drugs has escalated infection-related morbidity and mortality particularly in developing countries like
*Corresponding author. E-mail: [email protected].
Author(s) agree that this article remain permanently open access under the terms of the Creative Commons Attribution
License 4.0 International License

Ethiopia (Mulu et al., 2006; Borkotoky et al., 2013). This proliferation endorsed to undifferentiating use of broad-spectrum antibiotics, immunosuppressive agent, intravenous catheters and ongoing epidemics of HIV infection (Dean and Burchard, 1996; Gonzalez et al., 1996). However, the progress of new antibiotics should continue as the primary significance to retain the usefulness of antimicrobial treatment (Marchese and Shito, 2001). The potential of floras are bases for modern medicine to achieve new values (Evans et al., 2002).
In recent years, pharmacological enterprises consumed a lot of time and money in developing natural products extracted from plants, to harvest extra cost real medicines that are reasonable to the population (Doughari, 2006). Today, many commercially confirmed drugs used in modern medicine were firstly used in crude form in traditional or folk healing performs, or for other purposes that suggested potentially useful biological activity. The therapeutic floras around the world contain various compounds with antibacterial activity (Marjorie, 1999). So, orderly screening them may result in the detection of novel real antimicrobial compounds (Costa et al., 2008). The screening of plant extracts and plant products for antimicrobial activity has shown that floras represent a potential source of new anti-infective agents (Amani et al., 1998; Costa et al., 2008). Many researches have carried out to screen natural products for antimicrobial property (Nair and Chanda, 2006). Therapeutic floras possess immune modulatory and antioxidant properties, leading to antibacterial activities. They have versatile immune modulatory activity by stimulating both non-specific and specific immunity (Pandey and Chowdhry, 2006).
Rumex nervosus mostly originated high altitude areas (above 1000 m) and continue about 200 species. The leaves of this plant are edibles in Ethiopia. In Ethiopia, the leaves and stem of this herb are used for purifying the body by women traditionally as substituent of olive tree, to do this, the leaves are put on fire then they cover the patient body with that hot leaves and blanket so that the vapors and smoke surround all the body. Rumex species contains anthrax Editorial Office derivatives like chrysophanol, physician, emodin, aloe-emodin, rhein; which are the main biologically active compounds responsible for anti-cancer, cytotoxic, genotoxic and mutagenicity properties (Wegiera et al., 2012). Traditionally in Ethiopia, the leaves, stems and roots of R. nervosus were used as traditional medicines, for the eye disease, taeniacapitis, hemorrhoids, infected wounds, arthritis, eczema, abscess and gynecological disorders.
Clematis simensis is woody climber that escalates up to 10m or more, occasionally with long branches lying on the ground. The stem is pubescent; leaves are pinnate while the leaflets are ovate. The superior of the leaves have disseminated hairs while the inferior one is to Mentos. The inflorescence was various flowered, the flowers being pale yellow to white in color (Edwards et
Tedila and Assefa 15 al., 2000). Traditionally in Ethiopian the plants leaves were used for dress wounds and also for the treatment of eczema, tinea capitis and tropical ulcers and also the seeds of this plant were used for rheumatic pain while the sap was used as a febrifuge and against bloat in animals. A recent study reported that the leaves of C. simensis used in combination with another plant from the same family (Addis et al., 2001; Gedif et al., 2001). Traditionally plants used for the treatment of gonorrhea, syphilis and sore throat. The leaves have also been used for the treatment of leprosy, fever and various skin diseases and headaches (Iwu, 1993; Kakwaro, 1976). The extracts leaves of C. simensis by aqueous and methanol are exhibit activity against certain bacteria like Staphylococcus aureus, Pseudomonas aeruginosa and fungi Candida albicans (Desta et al., 1993; Cos et al., 2002).
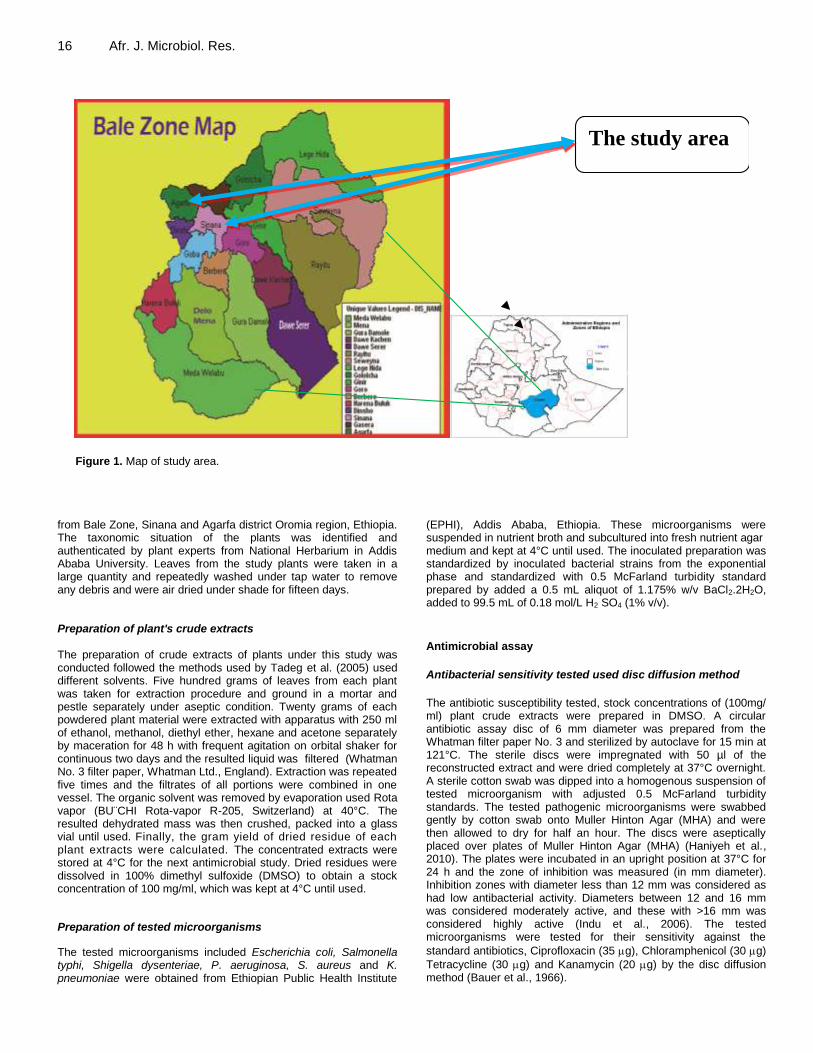
In Ethiopia, medicinal plants are still the most important and occasionally the only bases of therapeutics for nearly 80% of human and more than 90% in livestock population. Estimated floras of 6,500 to 7,000 species of higher plants are originated in Ethiopia and about 12% are endemic to the country (Tadeg et al., 2005). Despite their vital role in providing for the health of human and livestock population, large part of the knowledge of ethno medicinal plants is irreversible loss and declining to deterioration due the oral passage of herbal heritage from generation to generation rather than in writings (Mesfin et al., 2009). Ecological degradation, farming growths, cultivation of marginal lands and suburbanization are also posing a significant threat to the future wellbeing of human and animal populations that have relied on these resources to fight several ailments for generations (Lulekal et al., 2008; Devi et al., 2009). MATERIALS AND METHODS Location of the study area The study was conducted on selected medicinal plants composed from Sinana and Agarfa districts of Bale zone, Oromia Regional State, South Eastern Ethiopia. Sinana district was found at 430 km southeast of Addis Ababa. The area was situated at 7°7’ N and 40°10’ E and 2,400 masl. The mean average rainfall of the area was 353 mm. For the same period, average annual maximum temperature was 21.2°C and minimum temperature was 9.4°C. The dominant soil type was pellic vertisol and slightly acidic (pH = 6). Agricultural production system of the study area was mixed farming. Agarfa district was located at 464 km south east of Addis Ababa. The area was situated at 6°11’ N and 40°3’ E and 2,350 masl. The mean average rainfall of the area was 880 mm and bimodal. The average annual maximum temperature was 24.75°C and minimum temperature was 7.1°C. The dominant soil type was clay soil and slightly acidic (pH = 5.8). Agricultural production system of the study area was mixed farming (Figure 1). Collection and identification of plant materials Two medicinal plants R. nervosus and C. simensis were collected
16 Afr. J. Microbiol. Res.
Figure 1. Map of study area.
from Bale Zone, Sinana and Agarfa district Oromia region, Ethiopia. The taxonomic situation of the plants was identified and authenticated by plant experts from National Herbarium in Addis Ababa University. Leaves from the study plants were taken in a large quantity and repeatedly washed under tap water to remove any debris and were air dried under shade for fifteen days. Preparation of plant's crude extracts The preparation of crude extracts of plants under this study was conducted followed the methods used by Tadeg et al. (2005) used different solvents. Five hundred grams of leaves from each plant was taken for extraction procedure and ground in a mortar and pestle separately under aseptic condition. Twenty grams of each powdered plant material were extracted with apparatus with 250 ml of ethanol, methanol, diethyl ether, hexane and acetone separately by maceration for 48 h with frequent agitation on orbital shaker for continuous two days and the resulted liquid was filtered (Whatman No. 3 filter paper, Whatman Ltd., England). Extraction was repeated five times and the filtrates of all portions were combined in one vessel. The organic solvent was removed by evaporation used Rota vapor (BU¨CHI Rota-vapor R-205, Switzerland) at 40°C. The resulted dehydrated mass was then crushed, packed into a glass vial until used. Finally, the gram yield of dried residue of each plant extracts were calculated. The concentrated extracts were stored at 4°C for the next antimicrobial study. Dried residues were dissolved in 100% dimethyl sulfoxide (DMSO) to obtain a stock concentration of 100 mg/ml, which was kept at 4°C until used. Preparation of tested microorganisms
The tested microorganisms included Escherichia coli, Salmonella typhi, Shigella dysenteriae, P. aeruginosa, S. aureus and K. pneumoniae were obtained from Ethiopian Public Health Institute
(EPHI), Addis Ababa, Ethiopia. These microorganisms were suspended in nutrient broth and subcultured into fresh nutrient agar medium and kept at 4°C until used. The inoculated preparation was standardized by inoculated bacterial strains from the exponential phase and standardized with 0.5 McFarland turbidity standard prepared by added a 0.5 mL aliquot of 1.175% w/v BaCl2.2H2O, added to 99.5 mL of 0.18 mol/L H2 SO4 (1% v/v).
Antimicrobial assay
Antibacterial sensitivity tested used disc diffusion method
The antibiotic susceptibility tested, stock concentrations of (100mg/ ml) plant crude extracts were prepared in DMSO. A circular antibiotic assay disc of 6 mm diameter was prepared from the Whatman filter paper No. 3 and sterilized by autoclave for 15 min at 121°C. The sterile discs were impregnated with 50 µl of the reconstructed extract and were dried completely at 37°C overnight. A sterile cotton swab was dipped into a homogenous suspension of tested microorganism with adjusted 0.5 McFarland turbidity standards. The tested pathogenic microorganisms were swabbed gently by cotton swab onto Muller Hinton Agar (MHA) and were then allowed to dry for half an hour. The discs were aseptically placed over plates of Muller Hinton Agar (MHA) (Haniyeh et al., 2010). The plates were incubated in an upright position at 37°C for 24 h and the zone of inhibition was measured (in mm diameter). Inhibition zones with diameter less than 12 mm was considered as had low antibacterial activity. Diameters between 12 and 16 mm was considered moderately active, and these with >16 mm was considered highly active (Indu et al., 2006). The tested microorganisms were tested for their sensitivity against the
standard antibiotics, Ciprofloxacin (35 g), Chloramphenicol (30 g)
Tetracycline (30 g) and Kanamycin (20 g) by the disc diffusion method (Bauer et al., 1966).
The study area
Minimum inhibitory concentration (MIC) assay methods
The MIC was determined by compared the various concentrations of plant extracts which have different inhibitory effect and selected the lowest concentration of extract showed inhibition (Agatemor, 2009). The MIC was determined for extracts that showed
inhibition zone of7 mm diameter and for extract that inhibited the growth of all tested bacteria at concentration of 200 mg/ml. The tested was performed by used standard tube dilution (serial dilution) method used nutrient broth as diluents. Accordingly, the plant extract was prepared by double serial dilution from 2 0 0 mg/ml to obtain 1:2, 1:4, 1:8, 1:16, 1:32, and 1:64 in order to get 100, 50, 25, 12.5, 6.25, 3.125, 1.56 and 0.78 mg/ml concentration of extract, respectively using 50% DMSO. 1 ml of each extracts was dissolved in sterile test tubes which contained 9 ml of nutrient broth. Then, 0.1 ml of the tested microorganism was inoculated to the each tube. One tube was used as the control (broth + extract). The tubes were incubated at 37°C for 24 h and the existence of growth was assessed by compared the optical density (OD) of each well before and after incubation. When the difference of OD value (after incubation-before incubation) of the test (broth + extract + organism) was greater than that of the control (broth + extract) at each concentration, it was considered as presence of turbidity or growth of bacteria. The lowest concentration, at which there was no turbidity, was also regarded as MIC value of the extract.
Data analysis Data on mean inhibition zone formed by each plant extract and MIC on various bacteria were entered in to Microsoft excels spreadsheet and SPSS (Statistical Package Software for Social Science version
16). Values were given as mean standard deviation (SD).
RESULTS Antibacterial activity of the plant extracts The crude extracts study plant such as R. nervosus and C. simensis were tested for antibacterial activity on six human pathogens. The solvents that were used in this study produced an overall yield of plant crude extracts that were ranging from 0.6 to 2.4 gm from different plants (Table 1).
In-vitro antimicrobial activity of crude extracts of plants under this study was evaluated against human pathogenic bacteria of E. coli, S. Typhi, S. dysenteriae, P. aeruginosa, S. aureus and K. pneumoniae. The results obtained in the present study revealed that the tested two medicinal plants (R. nervosus and C. simensis) extracts possess a potential antibacterial activity. The antibacterial activity of R. nervosus crude extracts The antibacterial activity of R. nervosus crude extracts was assayed by disc diffusion method. The methanol and ethanol leaves extract of R. nervosus showed considerably a higher mean antibacterial activity as compared to other solvents. The highest antibacterial
Tedila and Assefa 17 activity was exhibited on E. coli (16.3±0.57 mm) by ethanol extract, followed by S. dysenteriae (12.5±0.5 mm) and a moderate inhibition of Klebsiella pneumoniae (10±1.0 mm) and the least activity against Salmonella typhi (6.1±0.76 mm). The methanol extracts showed a strong inhibitory activity against S. Typhi (14.8±0.76 mm), followed by S. dysenteriae with a zone of inhibition 11±0.57 mm and a moderate inhibition against S. aureus (9.8±0.28 mm) and P. aeruginosa (8.8±0.76 mm). With methanol, a minimum zone of inhibition of R. nervosus (6.5±0.5 mm) was exhibited by E. coli.
Acetone extracts of R. nervosus were exhibited a maximum zone of inhibition against S. Typhi (11.9±0.35 mm) followed by S. aureus (10.5±0.5 mm) and minimum activity against P. aeruginosa (5.4±0.5 mm). Diethyl ether extracts showed inhibitory activity against only three pathogens. The maximum inhibition was detected on S. Typhi (6.2±0.68 mm) followed by K. pneumoniae
(7.90.17 mm) and least activity against E. coli (4.8±0.76 mm). Hexane extract didn't show any antibacterial activity against tested pathogenic bacteria (Table 2).
The antibacterial activity of C. simensis crude extracts
The methanol extract of C. simensis formed a marked inhibition zone of 13.1±0.37 mm in diameter against E. coli, followed by K. pneumoniae (10.9±0.3 mm) and S. Typhi (9.7±0.64 mm). The methanolic extracts exhibited the least inhibitory activity against S. dysenteriae and S. aureus with mean inhibition zone of 7.2±0.46 and 7.7±0.45 mm, respectively. The prominent zone of inhibition from the ethanol extract of C. simensis against S. dysenteriae was 14.4±0.45 mm followed by K. pneumoniae (13.9±0.35 mm), S. Typhi (12.9±0.51 mm) and 11.5±0.51 mm against E. coli. Moderate inhibitory activity was noticed against S. aureus (10±0.15 mm) followed by 12.1±0.3 mm against P. aeruginosa and a moderate activity of 8±0.2 mm against S. dysenteriae and 7.9±0.35 mm against K. pneumoniae and minimum inhibitory activity against E. coli with a zone size of 5.6±0.52 mm. Acetone extract of C. simensis inhibited S. aureus with a highest zone of inhibition 11.9±0.25 mm and minimal inhibition was 6.8±0.2 and 5.7±0.32 mm against S. dysenteriae and P. aeruginosa. No good antibacterial activity was excreted by the Hexane extracts (Table 3). Inhibitory zones of test pathogens with standard antibiotics (positive control) Four dissimilar antibiotics, ciprofloxin, tetracyclin, kanamycin and chloramphenical were used as standard and as positive control for the testing of antibacterial activity of six different human pathogens. Ciprofloxin displayed maximum zone of inhibition ranging from 20 to

18 Afr. J. Microbiol. Res.
Table 1. The yield of plant crude extracts by using different solvents.
Plant species Parts used (gm) Extraction type Yield in grams (Mean in mm)
Rumex nervosus 20 g Leaves
Methanol 1.6
Ethanol 1.35
Diethyl ether 0.6
Acetone 1.6
Hexane 1
Clematis simensis 20 g Leaves
Methanol 2
Ethanol 2.4
Diethyl ether 1.3
Acetone 2.1
Hexane 1.2
Table 2. The effect of the different extracts of the leaves of Rumex nervosus against tested pathogenic bacteria (Zones of inhibition in
mm; meanSD).
Test organism Mean Inhibition zone of leaves extract
of R. nervosus in mm (MeanSD)
Methanol Ethanol Diethyl Ether Acetone Hexane
Escherichia coli 6.5±0.5 16.3±0.57 4.8±0.76 - -
Salmonella typhi 14.8±0.76 6.1±0.76 - 11.9±0.35 -
Shigella dysenteriae 11±0.57 12.5±0.5 6.2±0.68 7.3±0.57 -
Staphylococcus aureus 9.8±0.28 8.6±0.52 - 10.5±0.5 -
Pseudomonas aeruginosa 8.8±0.76 6.1±0.36 - 5.4±0.5 -
Klebsiella pneumoniae 8.8±0.28 10±1.0 7.9±0.17 5.8±0.28 -
-= implies no inhibition zone detected; = a crude extract at concentration of 100 mg/ml was used for assay.
35 against all pathogens; Kanamycin exhibited average zone of inhibition 20mm, Tetracycline exhibited ranging from 8 to 20 mm and Chlomphenicol showed least inhibition against all test pathogens.
MIC of plant extracts MIC assay was employed to evaluate the effectiveness of the plant extracts to inhibit the growth of bacterial tested microorganisms. The extracts of the two medicinal plants were exposed to the concentrations ranged from 0.78 to 100 mg/ml. In the antibacterial activity tested, five different solvents were used for their in vitro antibacterial tested among which only best three solvents methanol, ethanol and acetone had selected for MIC test. MIC of R. nervosus leaf extracts against tested pathogenic bacteria (in mg/ml)
The methanol extract of R. nervosus exhibited the lowest MIC at 3.12 mg/ml against E. coli and S. dysenteriae followed by S. typhi and P. aeruginosa at a concentration of 6.25 mg/ml. The ethanol extract exhibited MIC at 3.12
mg/ml concentration against S. dysenteriae and K. pneumoniae and at concentration of 6.25 mg/ml against E. coli. The ethanol extract also displayed its MIC at concentration of 12.5 mg/ml against S. Typhi and S. aureus. The MIC of acetone extract of Rumex nervosus was 6.25 mg/ml against the E. coli and S. Typhi followed by S. dysenteriae at 25 mg/ml and S. aureus at 50 mg/ml (Table.5).
MIC of C. simensis leaf extracts against tested pathogenic bacteria in mg/ml
The methanol extract of C. simensis showed MIC activity at 6.25 mg/ml concentration against E. coli and S. typhi followed by S. dysenteriae and K. pneumoniae at 12.5 mg/ml concentration. The ethanol extracts showed strong MIC activity at 1.56 mg/ml against S. dysenteriae and against S. Typhi at 6.25 mg/ml concentration followed by S. aureus and P. aeruginosa at 12.5 mg/ml. The acetone extract of C. simensis exhibited a MIC at 12.5 mg/ml against S. dysenteriae followed by S. aureus at 25 mg/ml and at 50 mg/ml against P. aerugenosa and K. pneumoniae (Table 6).

Tedila and Assefa 19
Table 3. The effect of the different extracts of the leaves of Clematis simensis tested pathogenic bacteria (Zones of inhibition;
meanSD mm).
Test organism Mean Inhibition zone of leaves extract Clematis simensis (meanSD mm)
Methanol Ethanol D/ Ether Acetone Hexane
Escherichia coli 13.1±0.37 11.5±0.51 5.6±0.52 - -
Salmonella typhi 9.7±0.64 12.9±0.36 6.2±0.62 - 3.7±0.26
Shigella dysenteriae 7.2±0.46 14.4±0.45 8±0.2 6.8 ±0.2 -
Staphylococcus aureus 7.7±0.45 10±0.15 - 11.9±0.25 -
Pseudomonas aeruginosa - 8.5±0.55 12.1±0.32 5.7±0.32 -
Klebsiella pneumoniae 10.9±0.3 13.9±0.35 7.9±0.35 6±0.2 -
-= implies no inhibition zone detected; = a crude extract at concentration of 100 mg/ml was used for assay.
Table 4. The inhibition zone of antibiotics against human pathogens.
Test organism Zone of inhibition in mm
Ciprofloxin Kanamycin Tetracycline Chlromphenicol
Escherichia coli 30 20 15 10
Salmonella typhi 35 20 15 10
Shigella dysenteriae 32 20 13 10
Staphylococcus aureus 31 20 10 5
Pseudomonas aeruginosa 30 15 8 5
Klebsiella pneumonia 20 15 20 11
DISCUSSION
Ethno botanical investigations have been found to offer significant evidences in the identification and development of traditionally used therapeutic florae into modern drugs. Involvement of the field has also reflected in the current study. The first step towards this goal was the in vitro antibacterial activity assay (Samy and Ignacimuthu, 2000). Many reports were available on the antiviral, antibacterial, antifungal, anthelminthic, and anti-inflammatory properties of plants (Palombo and Semple, 2001; Kumarasamy et al., 2002).
In the present study, R. nervosus and C. simensis was extracted by used different solvents such as methanol, diethyl ether, ethanol, acetone and hexane. The results of current study were an indication of such understandings. The yield of the extract that was obtained by different solvents considerably differs in two of the medicinal plants (Table 1).
In the present study, among the solvents used to extract the biologically active substances from two medicinal plants, ethanol and methanol were the best solvents, followed by acetone and least by diethyl ether and hexane (Tables 2 to 5). This specified that the extraction of medicinal plants with different solvents may produce different in vitro inhibitory result which based on the potential of the solvents used to extract the biologically active constituents (George et al., 2010). The
methanol and ethanol leaf extracts of R. nervosus showed significant antibacterial activity against most of bacterial human pathogens evaluated in the present study. The highest antibacterial activity exhibited was against E. coli (16.3±0.57 mm) by ethanol extract, followed by Shigella dysentriae (12.5±0.5 mm) and a moderate inhibition against K. pneumoniae (10±1.0 mm). In the present study, the methanol extract exhibited the second with inhibition zone of 14.8±0.76 mm against S. Typhi, followed by S. dysentriae with a zone of inhibition of 11±0.57mm. A different study reported that the antibacterial activity of the methanolic extracts of R. nervosus leaves against E. coli, P. aeruginosa, S. aureus, Streptococcus mutans and C. albicans, with zones of inhibition of 38, 36, 15, 38 and 32 mm, respectively (Mariam et al.,1993).
Pavithra et al. (2011) reported that the methanol extracts of Mollugo cerviana inhibited the growth of S. aureus and E. coli with zones of 7.33±0.57 and 11±1 mm, respectively while chloroform extracts were ineffective against these bacterial strains. Current study showed that the methanolic extract of Rumex nervosus to have a strong inhibitory activity against tested pathogens which were in concordance with other studies. The decrease of antibacterial activity of R. nervosus against tested pathogens in the current study may be attributed to the difference in the initial plant extract used and extraction
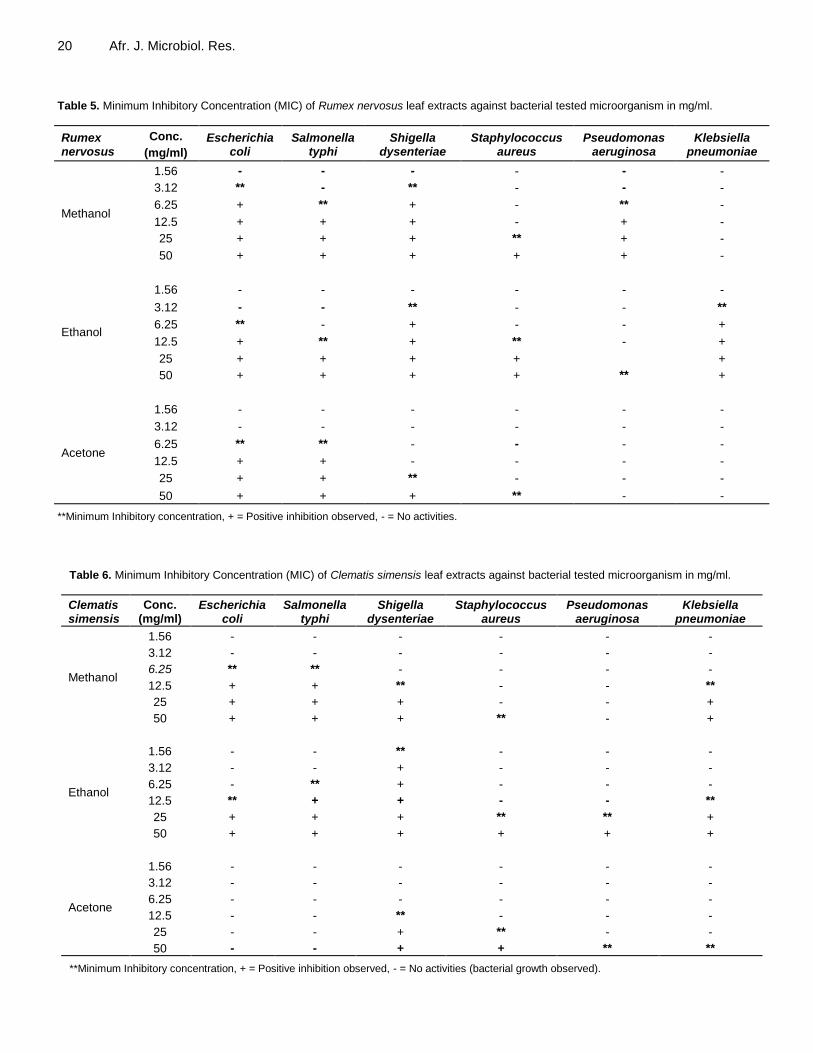
20 Afr. J. Microbiol. Res. Table 5. Minimum Inhibitory Concentration (MIC) of Rumex nervosus leaf extracts against bacterial tested microorganism in mg/ml.
Rumex nervosus
Conc.
(mg/ml)
Escherichia coli
Salmonella typhi
Shigella dysenteriae
Staphylococcus aureus
Pseudomonas aeruginosa
Klebsiella pneumoniae
Methanol
1.56 - - - - - -
3.12 ** - ** - - -
6.25 + ** + - ** -
12.5 + + + - + -
25 + + + ** + -
50 + + + + + -
Ethanol
1.56 - - - - - -
3.12 - - ** - - **
6.25 ** - + - - +
12.5 + ** + ** - +
25 + + + + +
50 + + + + ** +
Acetone
1.56 - - - - - -
3.12 - - - - - -
6.25 ** ** - - - -
12.5 + + - - - -
25 + + ** - - -
50 + + + ** - -
**Minimum Inhibitory concentration, + = Positive inhibition observed, - = No activities.
Table 6. Minimum Inhibitory Concentration (MIC) of Clematis simensis leaf extracts against bacterial tested microorganism in mg/ml.
Clematis simensis
Conc. (mg/ml)
Escherichia coli
Salmonella typhi
Shigella dysenteriae
Staphylococcus aureus
Pseudomonas aeruginosa
Klebsiella pneumoniae
Methanol
1.56 - - - - - -
3.12 - - - - - -
6.25 ** ** - - - -
12.5 + + ** - - **
25 + + + - - +
50 + + + ** - +
Ethanol
1.56 - - ** - - -
3.12 - - + - - -
6.25 - ** + - - -
12.5 ** + + - - **
25 + + + ** ** +
50 + + + + + +
Acetone
1.56 - - - - - -
3.12 - - - - - -
6.25 - - - - - -
12.5 - - ** - - -
25 - - + ** - -
50 - - + + ** **
**Minimum Inhibitory concentration, + = Positive inhibition observed, - = No activities (bacterial growth observed).

method used the difference in the strains of tested pathogens or due to unexplained reasons.
The acetone extracts of R. nervosus exhibited the maximum zone of inhibition against S. typhi (11.9±0.35 mm) followed by S. aureus (10.5±0.5 mm) and minimum activity against P. aeruginosa (5.4±0.5 mm). Related investigations have reported where acetone extracts showed a marked inhibitory effect on the growth of pathogenic bacteria (Abdullahi et al., 2010). The methanol and Ethanol extract of R. nervosus exhibited the lowest MIC at 3.21mg/ml concentration against E. coli and S. dysentriae and K. pneumoniae. The result of the present study showed that the plant extracts of Clematis simensis exhibited antibacterial activity against some of the common pathogenic bacteria. The prominent zone of inhibition from the ethanol extract of C. simensis against S. dysenteriae was 14.4±0.45 mm and against K. pneumoniae was 13.9±0.35 mm followed by Salmonella typhi 12.9±0.51 mm. Previous study showed that ethanolic extract of C. simensis exhibited a highest zone of inhibition (28.33 mm) against S. aureus with MIC 12.5 μg/ml (Mariam et al., 1993) a result higher than the size of inhibition zone in current study. The results of this study showed that the extracts from C. simensis was found to have significant antibacterial activity against both the selected Gram positive and Gram negative bacteria.
The methanol extract of C. simensis produced a pronounced inhibition zone of 13.1±0.37mm against E. coli, followed by K. pneumoniae with a zone of inhibition of 10.9±0.3 mm and S. Typhi 9.7±0.64 mm. In current study, the result clearly shows that this plant was effective against E. coli. The possible explanation for this difference in inhibitory activity might be the ecological difference on their distribution plants which might have contributed to variations in the concentration of the active ingredients. The methanol extract of C. simensis showed MIC activity at 6.25 mg/ml concentration against E. coli and S. Typhi which was supported by work of (Mariam et al.,1993) where the MIC of isolated compounds from Clematis simensis against S. aureus, Enterococcus faecalis, E. coli and P. aeruginosa was found to be varied from 16 μg/ml to more than 250 μg/ml. Ethanol extract showed a very minimal MIC of 1.56 mg/ml against S. dysenteriae and S. Typhi which was strongly supported by the results of Tegenu (2011) where the Acetone and ethyl acetate extracts of the leaves of Zehneria scabra showed best activity against S. aureus exhibited an MIC of 1.56 and 0.781 mg/ml, respectively. The least inhibition zone was observed for hexane extract against S. Typhi according to Tsuchiya et al. (1996). Conclusion From the aforementioned results it could be determined that the crude extracts of the two plants especially the ethanol and methanol revealed the fact that they have
Tedila and Assefa 21 higher potential to produce broad spectral antibacterial activity with minimal concentration against a wide range of human pathogens. The extracts were good in inhibited E. coli, S. Typhi, S. dysenteriae, P. aeruginosa and in some instances K. pneumoniae. The results of this study provided an insight into the antimicrobial properties of the extracts of C. simensis and R. nervosus. As well as it formed an opportunity for selection of bioactive extracts for initial fractionation and further studies of these two medicinal plants in the antibacterial assays. This in vitro study demonstrated that these two folklore medicinal plants have good potential. This study gives a suggestion of the efficacy of the plants acquired from the traditional healers. The results of study initiate basis for further studies of the powerful plants so as to segregate the compounds responsible for the antimicrobial activity. Numerous modern drugs were extracted from traditional therapeutic floras through the use of plant material succeeding the ethno botanical leads from indigenous cures used by traditional remedial systems.
CONFLICT OF INTERESTS
The authors have not declared conflict interests.
ACKNOWLEDGEMENTS The authors would like to thanks the Madda Walabu University for providing the facilities to work and Ethiopian Public Health Institute (EPHI) for support standard pathogen isolation and National Herbarium in Addis Ababa University for taxonomic plants identified and authenticated. REFERENCES Abdullahi MI, Iliya I, Haruna AK, Sule MI, Musa AM, Abdullahi MS
(2010). Preliminary phytochemical and antimicrobial investigations of leaf extracts of Ochna schweinfurthiana (Ochnaceae). African Journal of Pharmacy and Pharmacology 4:083-086.
Addis G, Abebe D, Urga K (2001). A survey of traditional medicinal plants in Shirka district, Arsi zone, Ethiopia. Ethiopian Pharmaceutical Journal 19:30-47.
Agatemor C (2009). Antimicrobial activity of aqueous and ethanol extracts of nine Nigerian spices against four food borne bacteria. Electronic Journal of Environmental, Agricultural and Food Chemistry 8(3):195-200.
Amani S, Isla MI, Vattuone M, Poch M, Cudmani N, Sampietro A (1998). Antimicrobial activities in some Argentine medicinal plants. Acta Horticulture 501:115-122
Bauer AW, Kirby WMM, Sherris JC, Turk M (1966). Antibiotic susceptiblity testing by a standard single disc diffusion method. American Journal of Clinical Pathology 45:493-496.
Borkotoky R, Kalita MP, Barooah M, Bora SS, Goswami C (2013). Evaluation and screening of antimicrobial activity of some important medicinal plants of Assam. International Journal of Advancements in Research and Technology 2(4):132-139.
Cos P, Hermans N, De Bruyne T, Apers S, Sindambiwe JB, Vanden Berghe D, Pieters L, Vlietinck AJ (2002). Further evaluation of Rwandan medicinal plant extracts for their antimicrobial and antiviral

22 Afr. J. Microbiol. Res.
activities. Journal of Ethnopharmacology 79:155-163. Costa ES, Hiruma-Lima CA, Lima EO, Sucupira GC, Bertolin AO, Lolis
SF, Andrade FDP, Vilegas W, Souza-Brito ARM (2008). Antimicrobial activity of some medicinal plants of the Cerrado, Brazil. Phytotherapy Research 22:705-707.
Dean DA, Burchard KW (1996). Fungal infection in surgical patients. American Journal of Surgery 171:374-382.
Desta B (1993). Ethiopian traditional herbal drugs. Part II: Antimicrobial activity of 63 medicinal plants. Journal of Ethnopharmacology 39:129-139.
Doughari JH (2006). Antimicrobial activity of Tamarindus indica Linn. Tropical Journal of Pharmaceutical Research 5:597-603.
Edwards S, Tadesse M, Demissew S, Hedberg l (2000). Flora of Ethiopia and Eritrea, The National Herbarium. Addis Ababa 2(1):21.
Evans CE, Banso A, Samuel OA (2002). Efficacy of some nupe medicinal plants against Salmonella typhi: an in vitro study. Journal of Ethnopharmacology 80:2124.
Gedif T, Hahn H. (2001). Traditional treatment of skin disorders in Butajira, South-central Ethiopia. Ethiopian Pharmaceutical Journal 19:48-56.
George FOA, Ephraim RN, Obasa SO, Bankole MO (2010). Antimicrobial properties of some plant extracts on organisms associated with fish spoilage. University of Agriculture, Abeokuta (UNAAB) Nigeria.
Gonzalez CE, Venzon D, Lee S, Mueller BU, Pizzo PA, Walsh TJ (1996). Risk factors for fungemia in children infected with human immunodeficiency virus: a case-control study. Clinical Infectious Diseases 23:515-521.
Haniyeh K, Seyyed M, Seyyed N, Hussein M (2010). Preliminary study on the antibacterial activity of some medicinal plants of Khuzestan (Iran). Asian Pacific Journal of Tropical Medicine 3(3):180-184.
Indu MN, Hatha AAM, Abirosh C, Harsha U, Vivekanandan G (2006). Antimicrobial activity of some of the south-Indian spices against serotypes of Escherichia coli, Salmonella, Listeria monocytogenes and Aeromonas hydrophila. Brazilian Journal of Microbiology 37:153-158.
Iwu MM (1993). Handbook of African Medicinal Plants, CRC Press, Boca Raton, pp. 1-7, 57. https://www.crcpress.com/Handbook-of-African-Medicinal-Plants/Iwu/p/book/9781466571976.
Kakwaro JO (1976). Medicinal plants of East Africa, East African Literature Bureau, Kampala, pp. 82-83, 114, 181.
Kumarasamy Y, Cox PJ, Jaspars M, Nahar L, Sarker DS (2002). Screening seeds of Scottish plants for antibacterial activity. Journal of Ethnopharmacology 83:73-77.
Lulekal E, Kelbessa E, Bekele T, Yineger H (2008). An ethnobotanical study of medicinal plants in Mana Angetu District, southeastern Ethiopia. Journal of Ethnobiology and Ethnomedicine 4:1-10.
Marchese A, Shito GC (2001). Resistance patterns of lower respiratory tract pathogens in Europe. International Journal of Antimicrobial Agents 16:25-29.
Mariam TG, Murthy PN, Ranganathan P, Hymete A, Daka K. (1993). Antimicrobial screening of Rumex abyssinicus and Rumex nervosus. Eastern Pharmacist 36(33):131-133.
Marjorie MC (1999). Plant products as antimicrobial agents. Clinical Microbiology. Reviews, American Society for Microbiology. Department of Microbiology, Miami University, Oxford, OH, USA 12:564-582.
Mesfin F, Demissew S, Teklehaymanot T (2009). An ethnobotanical
study of medicinal plants in Wona Woreda, SNNPR, Ethiopia. Journal of Ethnobiology and Ethnomedicine 5:28.
Mulu A, Moges F, Tessema B, Kassu A (2006). Pattern and multiple drug resistance of bacterial pathogens isolated from wound infection at University of Gondar Teaching Hospital, Northwest Ethiopia. Ethiopian Medical Journal 44(2):125-131.
Nair R, Chanda S (2006). Activity of some medicinal plants against certain pathogenic bacterial strains. Indian Journal of Pharmacology 38:142-144.
Olivier C, Williams-Jones B, Doize B, Ozdemir V (2010). Containing global antibiotic resistance: ethical drug promotion in the developing world. In: Sosa A et al., editors. Antibiotic resistance in developing countries. New York: Springer pp. 505-524.
Palombo EA, Sampled SJ (2001). Antibacterial activity of traditional Australian medicinal plants." Journal of Ethnopharmacology 77:151-157.
Pandey AK, Chowdhry PK (2006). Propagation techniques and harvesting time on productivity and root quality of Withania somnifera. Journal of Tropical Medicinal Plants 7:79-81.
Samy RP, Ignacimuthu, S (2000). Antibacterial activity of some folklore medicinal plants used by tribals in Western Ghats in India. Journal of Ethnopharmacology 69:63-71.
Tadeg H, Mohammed E, Asres K, Gebre-Mariam T (2005). Antimicrobial activities of some selected traditional Ethiopian medicinal plants used in the treatment of skin disorders. Journal of Ethnopharmacology 100:168-175.
Tegenu G (2011). Antimicrobial activity of solvent-extracts of Cucumis ficifolius and Zehneria scabra on some test microorganisms. M.sc Thesis Addis Ababa.
Tsuchiya H, Sato M, Miyazaki T, Fujiwara S, Tanigaki S, Ohyama M, Tanaka T, Iinuma M (1996). Comparative study on the antibacterial activity of phytochemical flavanones against methicillin resistant Staphylococcus aureus. Journal of Ethnopharmacology 50:27-34.
Wegiera M, Smolarz DH, Kocka BA (2012). Rumex L. species induce apoptosis in 1301, EOL-1 and H-9 cell lines. Acta Poloniae Pharmaceutica 69(3):487-499.
World Health Organization (WHO) (1991). Traditional medicine and modern health care: progress report by the director general. Geneva: World Health Organization. https://www.who.int/medicines/areas/traditional/wha4434.pdf.

Vol. 13(1), pp. 23-32, 7 January, 2019
DOI: 10.5897/AJMR2018.8909
Article Number: 294A25259761
ISSN: 1996-0808
Copyright ©2019
Author(s) retain the copyright of this article
http://www.academicjournals.org/AJMR
African Journal of Microbiology Research
Full Length Research Paper
Study on bovine mastitis with isolation of bacterial and fungal causal agents and assessing antimicrobial
resistance patterns of isolated Staphylococcus species in and around Sebeta town, Ethiopia
Tesfaye Bekele1, Matios Lakew2*, Getachew Terefe1, Tafesse Koran2, Abebe Olani2, Letebrihan Yimesgen2, Mekdes Tamiru2 and Tilaye Demissie1
1Addis Ababa University, College of Veterinary Medicine and Agriculture, P. O. Box 34, Bishoftu, Ethiopia.
2National Animal Health Diagnostic and Investigation Center, P. O. Box 04, Sebeta, Ethiopia.
Received 2 June, 2018; Accepted 17 July, 2018
A cross-sectional study was conducted from December 2016 to May 2017 in and around Sebeta town with the aim of assessing the prevalence of mastitis, isolation of aerobic bacterial and fungal causal agents and assessing antimicrobial resistance pattern of isolated Staphylococcus species in dairy cows. From a total of 383 dairy cows, 220 (57.4%) were found to be positive for mastitis of which 10.4% were affected by clinical mastitis and 47% by subclinical mastitis. Mastitis was more likely to occur in cows above 8 years of age (OR = 16.9, 95% CI = 7.8 - 36.00) and in those cows washed by hand before milking (OR =7.8, 95% CI = 4.2-14.6) as compared to those subjected to udder washing and drying using towels. Staphylococcus aureus was the most frequently isolated bacterial species (25%) followed by Streptococcus agalactiae (12.3%) and coagulase negative Staphylococcus species (10.5%). Yarrowia lipolytica (10.9%) and Candida etchellsii (7.3%) were the major yeast species isolated, while Aspergillus (6.8%), Mucor (5.9%), Penicillium (3.6%) and Fusarium (3.6%) were the major filamentous fungi species identified from the cultured milk samples. The results of antimicrobial susceptibility testing revealed that the isolated Staphylococcus species were highly resistant to penicillin G (93.1%) and oxytetracycline (79.3%) but were susceptible to vancomycin (100%), sulphamethoxazole/trimethoprim (96.6%), ampicillin (89.7%) and erythromycin (86.2%). It could be concluded that bovine mastitis is a major challenge to the dairy producers in and around Sebeta towns. Appropriate control and preventative measures must be instituted and dairy farmers and workers must be trained on proper milking and hygiene practices in order to reduce the prevalence of mastitis in this region. The penicillin resistant S. aureus could be a source of serious infection in humans as well and hence comprehensive studies including molecular characteristics of drug resistance gene of S. aureus especially of methicillin-resistant should be conducted as farm animals, primarily dairy cattle might serves as a reservoir of infection for humans. In 2% of the cases, only fungal species were identified as causes of mastitis, hence further investigation regarding their pathogenicity and contribution to bovine mastitis is needed. Key words: Antimicrobial resistance, bovine mastitis, bacteria, Ethiopia, fungus, prevalence, Sebeta.
INTRODUCTION Ethiopia has the largest cattle population in Africa with an estimated population of 57.83 million (CSA, 2016).
Development of the dairy sector in the country can contribute significantly to poverty alleviation and
24 Afr. J. Microbiol. Res. nutrition (Shapiro et al., 2015). However, currently milk production do not satisfy the countries milk requirement due to multitude of factors such as mastitis and other diseases that lead to significant loss in production (Biffa et al., 2005).
Mastitis occurs worldwide among dairy animals and it has been described to have an extreme economic impact (Al-majali et al., 2008). According to Bhikane and Kawitkar (2000), dairy cattle mastitis contributes up to 70% of reduced milk production, 9% of discarded milk after treatment, 7% of the cost of veterinary services and 14% of premature culling. The disease can be classified as clinical or subclinical (Eriskine, 2001).
The disease is caused by a multitude of etiological agents that includes bacteria, virus, fungi and algae (Wellenberg et al., 2002; Kivaria et al., 2004). The most common bacterial pathogens are Staphylococcus aureus, Streptococcus agalactiae, other Streptococcus species and coliforms (Sumathi et al., 2008). Other organisms may also include Arcanobacterium pyogenes, Pseudomonas aeruginosa, Nocardia asteroides, Clostridium perfringens, Mycobacterium, Mycoplasma, Pastuerella and Prototheca species and yeasts (Radostits et al., 2007). Fungal infections account for up to 2 to 13% of all cases of mastitis in cows (Krukowski et al., 2006). Usually mycotic mastitis is unnoticed by clinician in the first attempt of treatment and administration of antibiotics may aggravate fungal mastitis as some of the antibiotics like penicillin and tetracycline act as a source of nitrogen for various species of fungi (Tarfarosh and Purohit, 2008).
In Ethiopia, available information indicates that bovine mastitis is a serious challenge in dairy farms. Based on one meta-analysis report that evaluated 39 different studies, the overall prevalence of bovine mastitis was 47.0% (95% confidence interval [CI] = 42.0-52.0) of which 8.3% (95% CI = 6.5-10.3) was clinical mastitis and 37% (95% CI = 32.9-40.7) was subclinical mastitis (Getaneh and Gebremedhin, 2017).
Prevalence of bovine mastitis and predisposing factors were assessed 12 years ago in Sebeta towns (Sori et al., 2005). Since then, many dairy farms have been introduced into the area. Moreover, there are many complaints on poor response to treatment of mastitis using common antimicrobial drugs. Furthermore, to the author‟s knowledge, there are no published literatures on major fungal pathogens isolated from bovine mastitis in Ethiopia. Based on the aforementioned facts, this study was conducted to assess risk factors, causative agents
and to determine antimicrobial resistance patterns of isolated Staphylococcus species isolated from bovine mastitis in and around Sebeta town. MATERIALS AND METHODS Study area and population Sebeta town is located around 25 km from Addis Ababa city at 8°55′N latitude and 38°37′E longitude and 2,356 m above sea level. The climate is warm with the average annual temperature of 17.4°C and 1073 mm averages annual rainfall.
The study population comprises of lactating dairy cows that are managed under extensive, semi intensive and intensive farming systems. A total of 383 lactating dairy cows in and around Sebeta town were examined to determine the overall prevalence of mastitis in the area. Study design and sample size determination A cross-sectional study was conducted from December 2016 to May 2017 and study cows were randomly selected from extensive, semi intensive and intensive dairy farms in the area. The sample size was determined based on the formula given by Thrufield (2007) considering 5% absolute precision, 95% confidence interval and 52.78% expected prevalence from previous studies in the area (Sori et al., 2005). Therefore, the calculated sample size was 383. Study methodology Physical examination of the udder and milk The udders were first examined visually and then palpated to detect any possible fibrosis, inflammatory swelling and atrophy of the tissue. The size and consistency of the mammary quarter was inspected for the presence of any abnormalities such as disproportional symmetry, swelling, firmness and blindness of the teat canal. In addition, two streaks of milk from each quarter in a strip cup were inspected visually for the presence of any flakes, clots, pus, watery appearance, blood and color change (Radostits et al., 2007). California mastitis test (CMT) screening After physical examination, milk samples were tested by California mastitis test (CMT Kit Lot number 67467, ImmuCell, USA). Briefly, a squirt of milk from each quarter of the udder was placed in each of four shallow cups in the CMT paddle and an equal amount of the reagent was added. A gentle circular motion was applied in a horizontal plane. Positive samples show gel formation within a few seconds. The California mastitis test was conducted to diagnose the presence of subclinical mastitis and based on the thickness of the gel formed by CMT reagent and milk mixture 1:1 test results
*Corresponding author. E-mail: [email protected]. Tel: +251942076332.
Author(s) agree that this article remain permanently open access under the terms of the Creative Commons Attribution
License 4.0 International License

were scored as 0 (negative), 1 (weak positive), 2 (distinct positive) and 3 (strong positive). Milk samples with test result of CMT 1 to 3, were classified as evidence of subclinical mastitis (Radostits et al., 2007). If at least one quarter was positive by the CMT then the cow was considered positive for mastitis.
Data and sample collection A semi-structured questionnaire was used to collect data on risk factors which include age, parity and hygiene of udder, farm owners and milker‟s. The age of the animals was determined from birth records and asked from owner and categorized as young adult (3 to 5 year), adult (6 to 8 year) and old (8 years and above); parity as few (1 to 2 parities), moderate (3 to 4 parities), and many (4 and above) (Umer et al., 2015). Udder hygiene was evaluated by observing the presence of any cow dung stain or spot on the udder and hind legs and through asking milker‟s. The practice for keeping the hygiene of udder was divided into four categories; those that do not practice udder washing at all wash by hand without drying, wash using towel without drying, and wash and dry by using towels.
Milk samples were collected following the standard procedures by the national mastitis council (NMC, 2004). After a quarter had been washed with tap water and dried (in cases when there was a considerable amount of dirt), the teat end was swabbed with cotton soaked in 70% ethyl alcohol. Approximately 10 ml of milk sample was then collected aseptically from clinically and sub clinically (CMT positive) mastitic cows into sterile universal bottles after discarding the first milking streams (squirt). The bottles were labeled with permanent marker and transported on packed ice box to National Animal Health and Diagnostic Investigation Center (NAHDIC), where they were immediately cultured or stored at 4°C until processed for bacterial and fungal isolation.
Laboratory work Bacterial identification Collected milk samples were inoculated on sheep blood agar (OXOID) and MacConkey agar (OXOID) and incubated aerobically at 37°C and cultured plates were examined after 24 to 48 h of incubation for any visible growth. The colonies were identified using primary and secondary biochemical tests at least to determine the genus of the suspected isolate. Then, OMNILOG/BIOLOG (fully automated coated microplate based bacterial identification system) using GEN III micro plate (Lot number 3003241, BIOLOG, USA) with protocol A method was used to further confirm the species of suspected colonies. A single colony grown in Biolog Universal growth (BUG) agar medium was selected and emulsified into „inoculating fluid A‟ (IF A). According to the manufacturer's instructions, cell density of the bacterial inoculum was measured and adjusted for a specified transmittance (90 to 98%) using a turbidiometer. For each isolate, 100 μl of the bacterial suspension was inoculated into each of the 96 well coated micro plates, using 8 channel pipette and incubated aerobically at 33°C for 22 h. The Omni Log identification system automatically reads each microplate and provides species/sub-species identification (ID), and then the results were printed out (OMNILOG, 2010).
Fungal identification Milk samples were also simultaneously inoculated onto sabouraud
Bekele et al. 25 dextrose agar (SDA) and cultured at 26°C for up to 4 weeks (if no visible fungal growth was observed within this period, no growth was recorded). Isolates were examined macroscopically and identified based on colony shape, size, color and growing pattern. For filamentous fungi, slides were prepared from each colony using scotch tape method where transparent scotch tape was lightly pressed to colony and then the tape was fixed to slide that had a drop of lactophenol cotton blue stain. The slides were observed under microscope in X10 and X40 magnification power and were identified at genus level using fungal identification key (Quinn et al., 2002). Yeast colonies were examined microscopically using Gram staining and species level identification was conducted by OMNILOG identification system using yeast microplates.
Antimicrobial susceptibility test Three to five well isolated colonies of isolated Staphylococcus species were transferred to 5 ml nutrient broth and incubated at 35°C for 4 h. The turbidity of the broth culture was adjusted to obtain turbidity optically comparable to 0.5 McFarland standard solution. After adjusting the turbidity, sterile cotton swab was dipped into the suspension and then Mueller Hinton agar plate was inoculated by rotating 60°. Antimicrobials disc were applied on the media using disc dispenser and then incubated for 24 h. Measurement of zone of inhibition was done by using digital caliper. Six antimicrobials were used: Ampicillin, erythromycin, penicillin G, oxytetracycline, vancomycin, sulphamethoxazole/trimethoprim (OXOID discs) (CLSI, 2010). Data analysis Statistical analysis was performed using „STATA, version 12. Mastitis prevalence was calculated by dividing the number of CMT positive cows by the total number of cows tested. Multivariate logistic regression was used to see the association of the potential risk factors with occurrence of mastitis. The strength of the association was measured using odds ratio (OR). Factors with odds ratio greater than one were considered as risk factors and those with odds ratio less than one were protective factor. In all the analysis, P- value lower than 0.05 was considered as significant.
RESULTS Prevalence of clinical and subclinical mastitis From a total of 383 dairy cows examined for mastitis, 220 (57.4%) of them were found positive. The details of the types of mastitis and quarter level mastitis were indicated in Table 1. From the total of 1532 quarters examined, 60 (3.9%) were blind (inactive quarters) and 619 (42.1%) were affected by mastitis (Table 1). The association of risk factors with mastitis The prevalence of mastitis was higher in older cows than young and adults and the difference was statistically
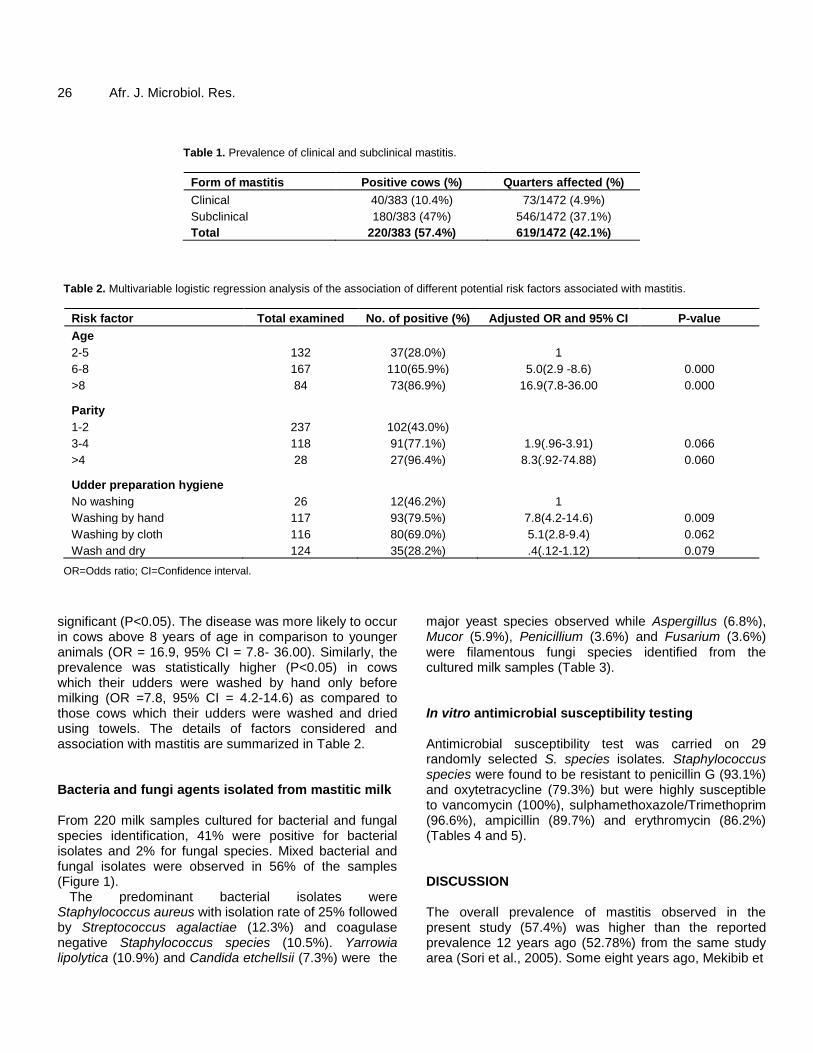
26 Afr. J. Microbiol. Res.
Table 1. Prevalence of clinical and subclinical mastitis.
Form of mastitis Positive cows (%) Quarters affected (%)
Clinical 40/383 (10.4%) 73/1472 (4.9%)
Subclinical 180/383 (47%) 546/1472 (37.1%)
Total 220/383 (57.4%) 619/1472 (42.1%)
Table 2. Multivariable logistic regression analysis of the association of different potential risk factors associated with mastitis.
Risk factor Total examined No. of positive (%) Adjusted OR and 95% CI P-value
Age
2-5 132 37(28.0%) 1
6-8 167 110(65.9%) 5.0(2.9 -8.6) 0.000
>8 84 73(86.9%) 16.9(7.8-36.00 0.000
Parity
1-2 237 102(43.0%)
3-4 118 91(77.1%) 1.9(.96-3.91) 0.066
>4 28 27(96.4%) 8.3(.92-74.88) 0.060
Udder preparation hygiene
No washing 26 12(46.2%) 1
Washing by hand 117 93(79.5%) 7.8(4.2-14.6) 0.009
Washing by cloth 116 80(69.0%) 5.1(2.8-9.4) 0.062
Wash and dry 124 35(28.2%) .4(.12-1.12) 0.079
OR=Odds ratio; CI=Confidence interval.
significant (P<0.05). The disease was more likely to occur in cows above 8 years of age in comparison to younger animals (OR = 16.9, 95% CI = 7.8- 36.00). Similarly, the prevalence was statistically higher (P<0.05) in cows which their udders were washed by hand only before milking (OR =7.8, 95% CI = 4.2-14.6) as compared to those cows which their udders were washed and dried using towels. The details of factors considered and association with mastitis are summarized in Table 2. Bacteria and fungi agents isolated from mastitic milk From 220 milk samples cultured for bacterial and fungal species identification, 41% were positive for bacterial isolates and 2% for fungal species. Mixed bacterial and fungal isolates were observed in 56% of the samples (Figure 1).
The predominant bacterial isolates were Staphylococcus aureus with isolation rate of 25% followed by Streptococcus agalactiae (12.3%) and coagulase negative Staphylococcus species (10.5%). Yarrowia lipolytica (10.9%) and Candida etchellsii (7.3%) were the
major yeast species observed while Aspergillus (6.8%), Mucor (5.9%), Penicillium (3.6%) and Fusarium (3.6%) were filamentous fungi species identified from the cultured milk samples (Table 3). In vitro antimicrobial susceptibility testing Antimicrobial susceptibility test was carried on 29 randomly selected S. species isolates. Staphylococcus species were found to be resistant to penicillin G (93.1%) and oxytetracycline (79.3%) but were highly susceptible to vancomycin (100%), sulphamethoxazole/Trimethoprim (96.6%), ampicillin (89.7%) and erythromycin (86.2%) (Tables 4 and 5). DISCUSSION The overall prevalence of mastitis observed in the present study (57.4%) was higher than the reported prevalence 12 years ago (52.78%) from the same study area (Sori et al., 2005). Some eight years ago, Mekibib et

Bekele et al. 27
Figure 1. Culture result of milk samples collected from mastitic cows.
al. (2009) reported 71.1% prevalence of bovine mastitis from Holeta, a town which was located close to the present study site. This indicated that bovine mastitis remains a serious problem to the dairy producers in and around these neighborhood towns which costs the farmers from losses associated with reduced production, increased replacement cows, drug costs, veterinary fees and labour costs. It might be due to lack of coordinated actions on prevention and control of bovine mastitis. The numbers of dairy farms has increased in the study areas as compared to previous years. However, most of these farms have poor housing facilities and this might contribute to the contamination and exposure of teats to environmental pathogens and could be reason for increased prevalence of bovine mastitis.
Region to region variations on prevalence of both clinical and subclinical mastitis were wide in Ethiopia. Lakew et al. (2009) reported 64.6% overall prevalence from Assela, a town which has similar agro-ecology with the present study site. Mungube et al. (2004) and Delelesse (2010) reported 46.6 and 44.1% overall prevalence while Tolosa et al. (2009) reported 9.5%, Bedada and Hiko (2011) 12.1%, Sori et al. (2005) 16.11% and Workineh et al. (2002) 25.1% subclinical mastitis from different localities in Ethiopia. This similarities and differences might be due to complex nature of the disease involving interactions of various factors such as management and husbandry, environmental conditions, animal risk factors, and causative agents (Radostits et al., 2007). The variation in the prevalence of mastitis might also be due to management differences like hygienic condition during milking process practiced by each farm, or individual
cow‟s defense mechanism (Suriyasathaporn et al., 2000). The higher prevalence of subclinical mastitis than that
of clinical mastitis in the present as well previous studies could be attributed to the little attention given to subclinical mastitis as subclinical mastitis is not clinically visible while treating clinical cases. Moreover, dairy farmers might not be well informed about the silent nature of subclinical mastitis (Karimuribo et al., 2006; Almaw et al., 2008). Likewise, the predominance of subclinical mastitis and its serious economic relevance compared to clinical mastitis was underscored elsewhere out of Ethiopia (Kaliwal and Kurjogi, 2011; Awale et al., 2012; Shittu et al., 2012; Elbably et al., 2013; Katsande et al. , 2013).
Quarter level prevalence of mastitis (42.14%) was lower than finding of Kifle and Tolosa (2008) who reported prevalence rate of 63.1%, but higher than the report made by Zelalem (2001) in Ethiopia. The teat canal is the first barrier against invading pathogens, and the efficiency of teat defense mechanisms depends on the integrity of teat tissue; its impairment leads to an increase in the risk of intra-mammary infection. The observed high number of inactive quarter 60(3.9%) may be an indication of a serious mastitis problem on the respective farms and the absence of culling chronically infected cows that can serve as a means to prevent and control the disease within a farm.
In the present study the prevalence of mastitis was higher in old adult cows than young adults. This might be due to older cows have largest teats and more relaxed sphincter muscles, which increase the accessibility of infectious agent in the cow‟s udder (Radostits et al., 2007). Cows with many parities were also at greater risk

28 Afr. J. Microbiol. Res.
Table 3. Bacterial and fungal species identified from milk of cows with clinical and subclinical mastitis.
Identified bacteria Identified yeasts Identified filamentous fungi
Species Number (%) Species Number (%) Species Number (%)
Staphylococcus aureus 55 (25%) Candida etchellsii 16 (7.3%) Aspergillus species 15 (6.8%)
Staphylococcus intermedius 23 (10.5%) Candida edax 8 (3.6%) Mucor species 13 (5.9%)
Staphylococcus epidermidis 12 (5.5%) Candida heamulonii 2 (0.9%) Penicillium species 8 (3.6%)
Staphylococcus hyicus 11 (5%) Yarrowia lipolytica 24 (10.9%) Fusarium species 8 (3.6%)
CNS 23 (10.5%) Rhodotorula graminis 5 (2.3%) No growth 176 (80%)
Streptococcus agalactiae 27 (12.3%) Rhodotorula glutinis 2 (0.9%) Total number of samples 220
Streptococcus dysgalactiae 12 (5.5%) Rhodosporidium diobovatum 5 (2.3%)
Streptococcus uberis 3 (1.4%) Galactomyces geotrichum 8 (3.6%)
Bacillus species 11 (5%) Geotrichum terreste 3 (1.4%)
Micrococcus species 6(2.7%) Trichosporon species 7 (3.2%)
Pseudomonas species 6(2.7%) Saccharomyces species 4 (1.8%)
Corynebacterium species 6(2.7%) No growth 136 (61.8)
E.coli 11(5%) Total number of samples 220
Klebsiella species 3(1.4%)
Pasteurella species 4(1.8%)
No growth 7 (3.2%)
Total number of samples 220
CNS = Coagulase negative Staphylococcus species other than S. epidermidis.
than moderate and few parities which might be due to physical alterations of udder, and is in line with findings reported by other authors (Carlen et al., 2004; Zwald et al., 2004; Abdel-Rady and Sayed, 2009; Belayneh et al., 2013; Katsande et al., 2013, Abrahmsen et al., 2014; Mureithi and Njuguna, 2016).
Cows in farms with poor milking hygiene were severely affected than those with good milking hygiene practices. Similar findings were reported by Sori et al. (2005); Lakew et al. (2009) and Moges et al. (2011). The reason most probably
might be due to cross contamination from infected teat to others, or from infected to non infected cows during milking. The milkers‟ hand and washing towels might also facilitate pathogens spread. It was also documented that udder preparation both before and after milking influence the prevalence of mastitis.
In this study, the dominant bacterial pathogens isolated from milk samples were Staphylococcus species (25%) however; this was lower than that of the 42.1% reported by Abera et al. (2010). Similarly, S. aureus was isolated as main
etiological agent of mastitis in cattle in many African and Asian countries (FAO, 2014). S. aureus is considered as typical contagious pathogen causing bovine mastitis. Accordingly, the wide spread S. aureus mastitis might be cows positive in herd which act as primary reservoir and infected others especially during milking. Radostits et al. (2007) asserted that S. aureus is well adapted to survive in the udder and usually establishes a mild sub clinical infection of long duration from which it shed in milk facilitating transmission to healthy animals mainly during
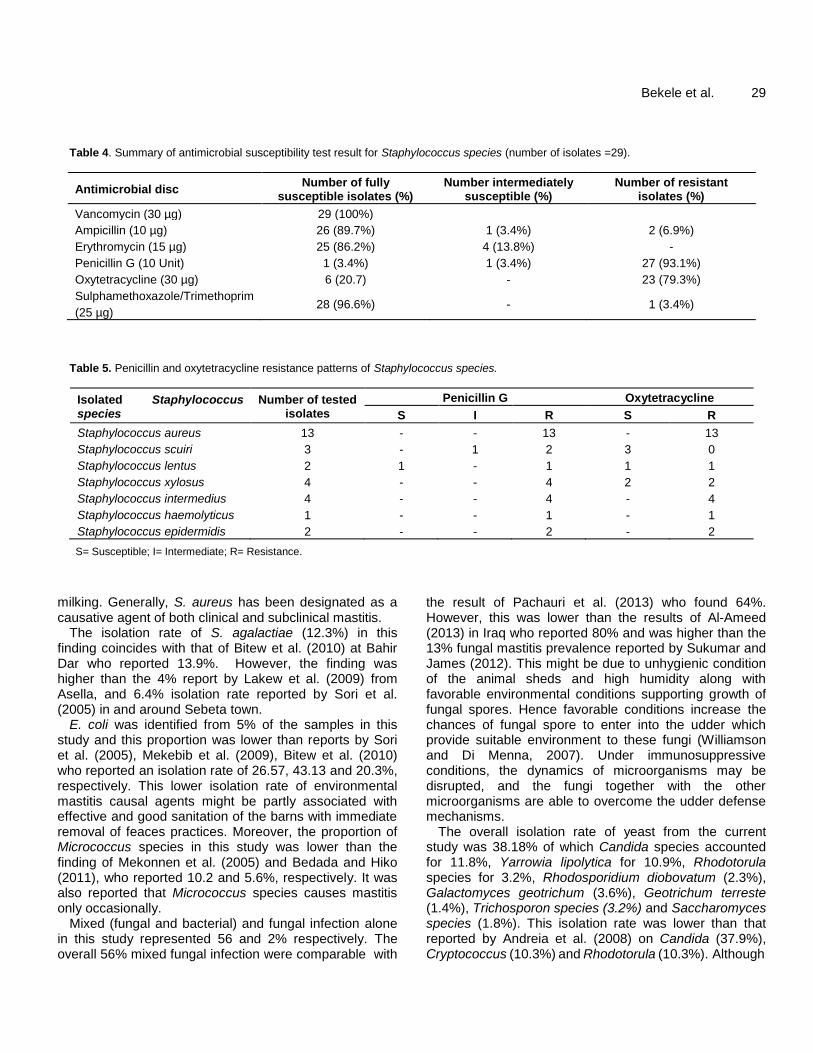
Bekele et al. 29
Table 4. Summary of antimicrobial susceptibility test result for Staphylococcus species (number of isolates =29).
Antimicrobial disc Number of fully
susceptible isolates (%) Number intermediately
susceptible (%) Number of resistant
isolates (%)
Vancomycin (30 µg) 29 (100%)
Ampicillin (10 µg) 26 (89.7%) 1 (3.4%) 2 (6.9%)
Erythromycin (15 µg) 25 (86.2%) 4 (13.8%) -
Penicillin G (10 Unit) 1 (3.4%) 1 (3.4%) 27 (93.1%)
Oxytetracycline (30 µg) 6 (20.7) - 23 (79.3%)
Sulphamethoxazole/Trimethoprim
(25 µg) 28 (96.6%) - 1 (3.4%)
Table 5. Penicillin and oxytetracycline resistance patterns of Staphylococcus species.
Isolated Staphylococcus
species
Number of tested isolates
Penicillin G Oxytetracycline
S I R S R
Staphylococcus aureus 13 - - 13 - 13
Staphylococcus scuiri 3 - 1 2 3 0
Staphylococcus lentus 2 1 - 1 1 1
Staphylococcus xylosus 4 - - 4 2 2
Staphylococcus intermedius 4 - - 4 - 4
Staphylococcus haemolyticus 1 - - 1 - 1
Staphylococcus epidermidis 2 - - 2 - 2
S= Susceptible; I= Intermediate; R= Resistance.
milking. Generally, S. aureus has been designated as a causative agent of both clinical and subclinical mastitis.
The isolation rate of S. agalactiae (12.3%) in this finding coincides with that of Bitew et al. (2010) at Bahir Dar who reported 13.9%. However, the finding was higher than the 4% report by Lakew et al. (2009) from Asella, and 6.4% isolation rate reported by Sori et al. (2005) in and around Sebeta town.
E. coli was identified from 5% of the samples in this study and this proportion was lower than reports by Sori et al. (2005), Mekebib et al. (2009), Bitew et al. (2010) who reported an isolation rate of 26.57, 43.13 and 20.3%, respectively. This lower isolation rate of environmental mastitis causal agents might be partly associated with effective and good sanitation of the barns with immediate removal of feaces practices. Moreover, the proportion of Micrococcus species in this study was lower than the finding of Mekonnen et al. (2005) and Bedada and Hiko (2011), who reported 10.2 and 5.6%, respectively. It was also reported that Micrococcus species causes mastitis only occasionally.
Mixed (fungal and bacterial) and fungal infection alone in this study represented 56 and 2% respectively. The overall 56% mixed fungal infection were comparable with
the result of Pachauri et al. (2013) who found 64%. However, this was lower than the results of Al-Ameed (2013) in Iraq who reported 80% and was higher than the 13% fungal mastitis prevalence reported by Sukumar and James (2012). This might be due to unhygienic condition of the animal sheds and high humidity along with favorable environmental conditions supporting growth of fungal spores. Hence favorable conditions increase the chances of fungal spore to enter into the udder which provide suitable environment to these fungi (Williamson and Di Menna, 2007). Under immunosuppressive conditions, the dynamics of microorganisms may be disrupted, and the fungi together with the other microorganisms are able to overcome the udder defense mechanisms.
The overall isolation rate of yeast from the current study was 38.18% of which Candida species accounted for 11.8%, Yarrowia lipolytica for 10.9%, Rhodotorula species for 3.2%, Rhodosporidium diobovatum (2.3%), Galactomyces geotrichum (3.6%), Geotrichum terreste (1.4%), Trichosporon species (3.2%) and Saccharomyces species (1.8%). This isolation rate was lower than that reported by Andreia et al. (2008) on Candida (37.9%), Cryptococcus (10.3%) and Rhodotorula (10.3%). Although

30 Afr. J. Microbiol. Res. the distribution of Candida species shows diversity in several countries, it is important to note the increase in number of mammary gland infections caused by Candida species in the recent years (Krukowski et al., 2001). Filamentous fungi was isolated from 20% of the tested samples, the isolated fungal species were Aspergillus (6.8%), Mucor (5.9%), Penicillium (3.6%) and Fusarium (3.6%). The isolation rate of Aspergillus species was lower than the 38% reported by Mdegela et al. (2005) and Blowey and Edmondson (2010). The management practices adopted on dairy cows , like discarding first few strips of milk on ground while milking of animals as well as during treatment of mastitic animals and reluctance to disinfect hand between milking by milkers may contribute as potent source of lateral transmission of fungal and yeast infections (Pachauri et al., 2013). There are also reports in which yeasts like Candida spp. utilizes nitrogen from penicillin and tetracycline antibiotics, antibiotic therapy leads to perturbation in udder homeostasis, inhibition of T cells and neutrophil activity and in consequence this may also stimulates yeast growth (Corti et al., 2003; Noris et al., 2007).
In the present study, Staphylococcus species were found resistant to penicillin G (93.1%) and oxytetracycline (79.3%) and this is comparable with many previous reports in the country. The resistance of Staphylococcus species to penicillin may be attributed to the production of beta lactamase, an enzyme that inactivates penicillin and closely related antibiotics. The development of antibiotic resistance probably is a result of repeated therapeutic use or indiscriminate use of these antibiotics (Jaims et al., 2002). The uses of antimicrobials have, overtime, increased the number of antimicrobial-resistant microbes globally, and any use of antimicrobial agents will to some extent facilitate the development of resistant strains (Williams, 2000). The majority of authors have noted the development of antimicrobial resistance by Staphylococcus species isolated from mastitis cases (Pitkala et al., 2004; Turutoglu et al., 2006; Pyorala and Taponen, 2009; Sori et al., 2011).
Conclusion
It could be concluded that bovine mastitis is a major challenge to the dairy producers in and around Sebeta towns. Large numbers of microorganism were isolated from milk of CMT positive cows with Staphylococcus, Streptococcus, Candida species and Y. lipolytica being the predominant. The demonstrated resistance pattern of Staphylococcus species to penicillin and oxytetracycline may alarm on the repeated use of these drugs for mastitis treatment in the country. Hence, comprehensive studies including molecular characteristics of drug resistance gene of S. aureus especially of methicillin-
resistant should be conducted in farm animals. In 2% of the cases, fungal species were identified as causes of mastitis, hence further investigation regarding their pathogenicity and contribution to bovine mastitis is needed.
ABBREVIATIONS
CI, Confidence interval; CLSI, Clinical Laboratory Standards Institute (CLSI); CMT, California mastitis test; FAO, Food and Agriculture Organization; NAHDIC, National Animal Health Diagnostic and Investigation Center; OR, odds ratio.
ETHICS APPROVAL AND CONSENT TO PARTICIPATE
This work is a part of sub-thematic research “Bovine mastitis: Udder morphometrical traits, common bacterial isolates, histopathological changes and predisposing factors to clinical and subclinical mastitis in local zebu and crossbreed dairy cattle in central Ethiopia “RD/LT-038/15” for which the investigators have received ethical clearance referenced with VM/ERC/005/08/2015 from ethical clearance and animal welfare committee of Addis Ababa University college of Veterinary Medicine and Agriculture. After briefing the purpose of the study consent was requested from all participating dairy farm owners for collecting samples. All the procedures used were non invasive and in addition all the results were communicated to animal owners.
FUNDING
The study was financially supported by Addis Ababa University Research and Technology transfer and Thematic Research Project, Grant No. RD/LT-038/15. This fund was used to cover the cost for field sample collection and all the consumables used for sample collection and laboratory analysis was covered by National Animal Health Diagnostic and Investigation Center. The funding body had no role in study design, data collection, analysis, interpretation, or writing of the manuscript.
CONFLICT OF INTERESTS
The authors have not declared any conflict of interests.
REFERENCES Abdel-Rady A, Sayed M (2009). Epidemiological studies on subclinical
mastitis in dairy cows in Assiut governorate Search Results Web results Veterinary World 2:373.

Abera M, Demie B, Aragaw K Regassa F, Regassa A (2010): Isolation
and identification of Staphylococcus aureus from bovine mastitic milk and their drug resistance patterns in Adama town, Ethiopia. Journal of Veterinary Medicine Animal Health 2(3):29-34.
Abrahmsen M, Persson Y, Kanyima BM, Bage. R (2014): R. Prevalence of subclinical mastitis in dairy farms in urban and peri-urban areas of Kampala, Uganda. Tropical Animal Health Production 46:99-105.
Al-Ameed AI (2013). Isolation and identification of fungi from infected milk samples obtained from cattle with mastitis and studying the antifungal activity of Rosemary Ethanolic extract agaimst the main strains. Diyala Journal of Agricultural Science 5(2):1-13.
Al-Majali AM, Al-Qudah KM, Al-Tarazi YH, Al-Rawashdeh OF (2008): Risk Factors Associated With Camel Brucellosis In Jordan. Tropical Animal Health Production 40:193-200.
Almaw G, Zerihun A, Asfaw Y (2008): Bovine mastitis and its association with selected risk factors in smallholder dairy farms in and around Bahir Dar, Ethiopia. Tropical Animal Health Production 40:427-432.
Andreia S, Elsio A, Daniela I, Juliana A, Edna C, Patricia V, Laerte F (2008). Diversity of yeasts from bovine mastitis in southern Brazil. Revista iberoamericana de micologia 25:154-156.
Awale MM, Dudhatra GB, Avinash K, Chauhan,BN, Kamani DR (2012) Bovine mastitis, a threat to economy. Open Access Scientific Reports 1:295.
Bedada BA, Hiko A (2011). Mastitis and antimicrobial susceptibility test at Asella, Oromia Regional state, Ethiopia. Journal of Microbiology and Antimicro 3(9):228-232.
Belayneh R, Belihu K, Wubete A (2013). Dairy cows mastitis survey in Adama town, Ethiopia. Journal of Veterinary Medicine and Animal Health 5:281-287.
Bhikane AV, Kawitkar SB (2000). Handbook for veterinary clinician. Venkateh Book. Udgir, India pp. 453-564.
Biffa D, Debela E, Beyene F (2005). Prevalence and risk factors of mastitis in lactating dairy cows in southern Ethiopia. International Journal of Veterinary Science Medicine 3:189-198.
Bitew M, Tafere A, Tolosa T (2010): Study on bovine mastitis in dairy farms of Bahir Dar town and its environment. Journal of Animal Veterinary Advances 9:2912-2917.
Blowey R, Edmondson P (2010). Mastitis control in dairy herds, 2nd edition. CAB international, Cambridge MA, USA P 55.
Carlen E, Strandberg E, Roth A (2004). Genetic parameters for clinical mastitis, somatic cell score, and production in the first three lactations of Swedish Holstein cows. Journal of Dairy Science 87:3062-3070.
Central Statistical Authority (CSA) (2016): Federal Democratic Republic of Ethiopia Central Statistical Agency agricultural Sample Survey Volume II Report on livestock and livestock Characteristics Statistical Bulletin P583 Addis Ababa.
Clinical Laboratory Standards Institute (CLSI) (2010): Performance Standards For Antimicrobial Disk Susceptibility Tests. M100-S20.
Corti S, Sicher D, Regli W, Stephan R (2003). Current data on antibiotic resistance of the most important bovine mastitis pathogens in Switzerland. Schweiz Arch Tierheilkd 145:571-575.
Delelesse GD (2010). Study on prevalence of bovine mastitis on Cross breed dairy cow around Holeta areas, West Shoa Zone of Oromia, Ethiopia. Global Veterinary 5(6):318-323.
Elbably MA, Emeash HH, Asmaa NM (2013). Risk factors associated with mastitis occurrence in dairy herds in Beni-Suef Governorate. World Veterinary Journal 3:05-10.
Eriskine RJ (2001). Intramuscular administration of ceftiofur sodium versus intrammamary infusion of penicillin/novobiocin for treatment of streptococcus agalactiae mastitis in dairy cows. Journal of the American Veterinary Medical Association 208:258-260.
Food and Agriculture Organization (FAO) (2014): Impact of mastitis in small scale dairy production systems. Animal Production and Health Working P 13. Rome.
Getaneh AM, Gebremedhin EZ (2017). Meta-analysis of the prevalence of mastitis and associated risk factors in dairy cattle in Ethiopia.
Bekele et al. 31
Tropical Animal Health and Production 49((4):697-705. Jaims E, Montros L, Renata D (2002). Epidemiology of drug resistance.
The case of S. aureus and CNS infection Epidemiology. Drug Research 44:108-112.
Kaliwal BB, Kurjogi MM (2011). Prevalence and antimicrobial susceptibility of bacteria isolated from bovine mastitis. Advances in Applied Science Research 2:229-235.
Karimuribo ED, Fitzpatrick JL, Bell CE, Swai ES, Kambarage DM, Ogden NH, MBryant J, French NP (2006). Clinical and subclinical mastitis in smallholder dairy farms in Tanzania: Risk, intervention and knowledge transfer. Preventive Veterinary Medicine 74:84-98.
Katsande S, Matope G, Ndengu M, Pfukenyi DM (2013). Prevalence of mastitis in dairy cows from smallholder farms in Zimbabwe. Onderstepoort Journal of Veterinary Research 80:523.
Kifle A, Tolosa T (2008). Prevalence of sub clinical mastitis in small holder dairy farms in Selale, north shewa zone, Central Ethiopia. International Journal of Veterinary Science Medicine 5(1):1-4.
Kivaria FM, Noordhuizen J.P, Kapaga AM (2004). Risk indicators associated with subclinical mastitis in smallholder dairy cows in Tanzania. Tropical Animal Health Production 36:581-592.
Krukowski H, Tietze M, Majewski T, Rozanski P (2001). Survey of yeast mastitis in dairy herds of small-type farms in the Lublin region, Poland. Mycopathologia 150:5-7.
Krukowski H, Lisowski A, Rozanski P, Skorka A (2006). Yeasts and algae isolated from cows with mastitis in the south-eastern part of Poland. Polish Journal of Veterinary Sciences 9(3):181-184.
Lakew M, Tolosa T, Tigre W (2009). Prevalence and major bacterial causes of bovine mastitis in Asella, South Eastern Ethiopia. Tropical Animal Health and Production 41:1525-1530.
Mdegela RH, Karimuribo E, Kusiluka LJM, Kabula B, Manjurano A, Kapaga AM, Kambarage DM (2005). Mastitis in smallholder dairy and pastoral cattle herds in the urban and peri-urban areas of the Dodoma municipality in Central Tanzania. Livestock Research for Rural Development 17:123.
Mekibib B, Furgasa M, Abunna F, Megersa B Regassa A (2009). Bovine Mastitis: Prevalence, Risk Factors and Major Pathogens in Dairy Farms of Holeta Town, Central Ethiopia. Veterinary World 3(9):97-403.
Mekonnen H, Workineh S, Bayleyegne M, Moges A, Tadele K (2005). Antimicrobial susceptibility profile of mastitis isolates from cows in three major Ethiopian dairies. Medicine Veterinary 176(7):391-394.
Moges N, Asfaw Y, Belihu K (2011). A Cross Sectional Study on the Prevalence of Sub Clinical Mastitis and Associated Risk Factors in and around Gondar, Northern Ethiopia. International Journal of Animal Veterinary 3(6):455-459.
Mungube ED, Tenhagen BA, Kassa T, Regessa F, Kyule MN, Greiner M, Baumann MPO (2004). Risk factors for dairy cows in the central highland of Ethiopia. Tropical Animal Health Production 36:463-472.
Mureithi DK, Njuguna MN (2016). Prevalence of subclinical mastitis and associated risk factors in dairy farms in urban and peri-urban areas of Thika Sub County, Kenya. Livest. Research for Rural Development 28:13.
National Mastitis Council NMC (2004): Microbiological procedures for the diagnosis of udder infection. 3rd ed., National Mastitis Council Inc. Arlington, VA.
Noris M, Casiraghi F, Todeschini M, Cravedi P, Cugini D, Monteferrante G, Aiello S, Cassis L (2007). role of immunosuppressive drugs. Journal of American Society 18:1007-1018.
Omnilog (2010). OMNILOG data collection software, bacterial and fungi identification system, user guide part no.90311, version 2.3.
http://www.biolog.com/pdf/milit/00P%20185rA%20GEN%20III%20MicroPlate%20IFU%20Mar2008.pdf
Pachauri S, Varshney P, Dash SK, Gupta MK (2013). Involvement of fungal species in bovine mastitis in and around Mathura, India. Veterinary World 6(7):393-395.
Pitkala A, Haveri M, Pyorala S, Myllys V, Hankonen-Buzalski T (2004). Bovine mastitis in Finland prevalence, distribution of bacteria and
32 Afr. J. Microbiol. Res.
antimicrobial resistance. Journal of Dairy Science 87:2433-2441. Pyorala S, Taponen S (2009): Coagulase negative staphylococci-
emerging mastitis pathogens. Veterinary Microbiology 134:3-8. Quinn PJ, Markey BK, Carter ME, Donnelly WJ. Leonard FC (2002).
Veterinary Microbiology and Microbial Disease. Blackwell Science Ltd, Blackwell Publishing Campany pp. 465-474.
Radostits OM, Gay CC, Hinchcliff KW, Constable PD (2007). Mastits. In: Veterinary Medicine: A Text book of disease of cattle, sheep, pigs, goats, and horses 10th edition, Ballier, Tindall, London pp. 674-762.
Shapiro BI, Gebru G, Desta S, Negassa A, Nigussie K, Aboset G, Mechal H (2015). Ethiopia livestock master plan. A contribution to the Growth and Transformation Plan II (2015-2020), ILRI Project Report.Nairobi, Kenya: International Livestock Research Institute (ILRI). https://cgspace.cgiar.org/bitstream/handle/10568/68037/lmp_roadmaps.pdf?sequence=1
Shittu M, Abdullahi J, Jibril A, Mohammed AA, Fasina FO (2012). Sub-clinical mastitis and associated risk factors on lactating cows in the Savannah Region of Nigeria. BMC. Veterinary Research 8:134.
Sori T, Zerihun A, Abdicho S (2005). Dairy cattle mastitis in and around Sebeta, Ethiopia. International Journal of Applied Research Veterinary Medicine 3(4):332-338.
Sori T, Hussien J, Bitew M (2011). Prevalence and susceptibility assay of Staphylococcus aureus isolated from bovine mastitis in Dairy Farms of Jimma Town, South West Ethiopia. Journal of Animal Veterinary Advances 10(6):745-749.
Sukumar K, James PC (2012). Incidence of fungal mastitis in cattle. Tamilnadu. Journal of Veterinary Animal Sciences 8(6):356-359.
Sumathi BR, Veeregowda BM, Amitha R (2008): Prevalence and antibiogram profile of bacterial isolates from clinical bovine mastitis. Veterinary World 1:237-238.
Suriyasathaporn W, Schukken YH, Nielsen M, Brand A (2000) Low somatic cell count: a risk factor for subsequent clinical mastitis in dairy herd. Journal of Dairy Science 83:1248-1255.
Tarfarosh MA, Purohit SK (2008). Isolation of Candida Spp. From mastitic cows and milkers. VetScan 3:14-18.
Thrufield M (2007). Veterinary Epidemiology, 3rd Edition, London:
Blackwell Science, A Blackwell Publishing Company pp. 214-265. Tolosa T, Geberetsadik Z, Regassa F (2009). Bovine mastitis and its
associated risk factor in lactating cow in Wolayta Sodo, Southern Ethiopia. Animal Health Production 57(4):311-319.
Turutoglu H, Ercelik S, Ozturk D (2006): Antibiotic resistance of Staphylococcus aureus and coagulase-negative staphylococci isolated from bovine mastitis. Bulletin of Veterinary Institute in Pulawy 50:41-45.
Umer S, Tilahun Z, Gizat A, Abdela, E., Haimanot, D, Tadele, K, Firmaye G, Girma,K (2015). Prevalence, risk factors and major bacterial causes of bovine mastitis in west Arsi zone of Oromia Region, Southern Ethiopia. Natural science 13(8):19-27.
Wellenberg GJ, Van Der Poel WHM, Van Oirschot JT (2002). Viral Infections And Bovine Mastitis: A Review Veterinary Microbiology 88:37-45.
Williams R (2000). The impact of antimicrobial resistance. Acta
Veterinaria Scandinavica Supplementum 93:17-20. Williamson JH, Di Menna ME (2007). Fungi isolated from bovine
udders, and their possible sources. NZ. Veterinary Journal 55:188-190.
Workineh SM, Bayleyegne H, Mekonnen L, Potgieter ND (2002). Prevalence and aetiology of mastitis in cow from two major Ethiopian dairies. Tropical Animal Health Production 34:19-25.
Zelalem G (2001). Prevalence of mastitis and identification of major isolates in Walaita Sodo. DVM Thesis, Jimma University, Ethiopia. Available at https://www.idosi.org/gv/gv16(2)16/5.pdf
Zwald NR, Weigel KA, Chang YM, Welper RD, Clay JS (2004). Genetic selection for health traits using producer recorded data. II. Genetic correlations, disease probabilities, and relationships with existing traits. Journal of Dairy Science 87:4295-4302.
Journal of
Microbiology and Antimicrobials
Journal of Microbiology and Antimicrobials
International Journal of
Biotechnology and Molecular
Biology Research
African Journal of
Microbiology Research
African Journal of
Microbiology Research
www.academicjournals.org
African Journal of
Biochemistry Research
African Journal of
Biochemistry Research
Journal of
Bioinformatics and Sequence Analysis
Journal of
Biophysics and Structural Biology