7. Graphing Density · 2018-09-05 · Written Prefix Prefix Symbol Equivalent multiplier mega M 106...
88
1 Unit 2: MEASUREMENT 1. Scientific Notation 2. Metric System 3. Accuracy and Precision 4. Measuring & Counting Significant Figures 5. Calculations with Significant Figures 6. Density 7. Graphing Density
Transcript of 7. Graphing Density · 2018-09-05 · Written Prefix Prefix Symbol Equivalent multiplier mega M 106...
1
Unit 2: MEASUREMENT
1. Scientific Notation2. Metric System3. Accuracy and Precision4. Measuring & Counting Significant Figures5. Calculations with Significant Figures6. Density7. Graphing Density
2
1. Scientific Notation
3
Scientific Notation• A shorthand method of displaying very (distance to the sun) or very numbers (lengths of atoms).• Consists of a , a base 10, and an • e.g. 3.95 x 10³
• The coefficient must be between and or it is not in scientific notation.• If the exponent is positive (such as above), the number will be• • If the exponent is negative, the number will be
4
Express in Scientific Notation
• Ex. 3756 =
• 0.000493 =
5
Express in Standard Notation
• E.g. 5.21 x 104 = The exponent is positive, so make the coefficient a
number (move the decimal to the )
• 2.694 x 10‐5
The exponent is , so make the coefficient a number (move decimal to the ).
6
Practice• Put in scientific notation• 1. 8720000 =• 2. 0.0000513 =• 3. 5302 =• 4. 0.00117 =• Put in standard notation• 5. 7.03 x 10‐2 =• 6. 1.38 x 104 =• 7. 3.99 x 10‐5 =• 8. 2.781 x 107 =
7
Write in Scientific Notation:
• 1. 34.79 x 103 =
• 2. 0.497 x 106 =
• 3. 19.5 x 10‐2 =
• 4. 0.837 x 10‐4 =
8
To add, subtract, multiply, and divide numbers that are in scientific notation, use your calculator.
9
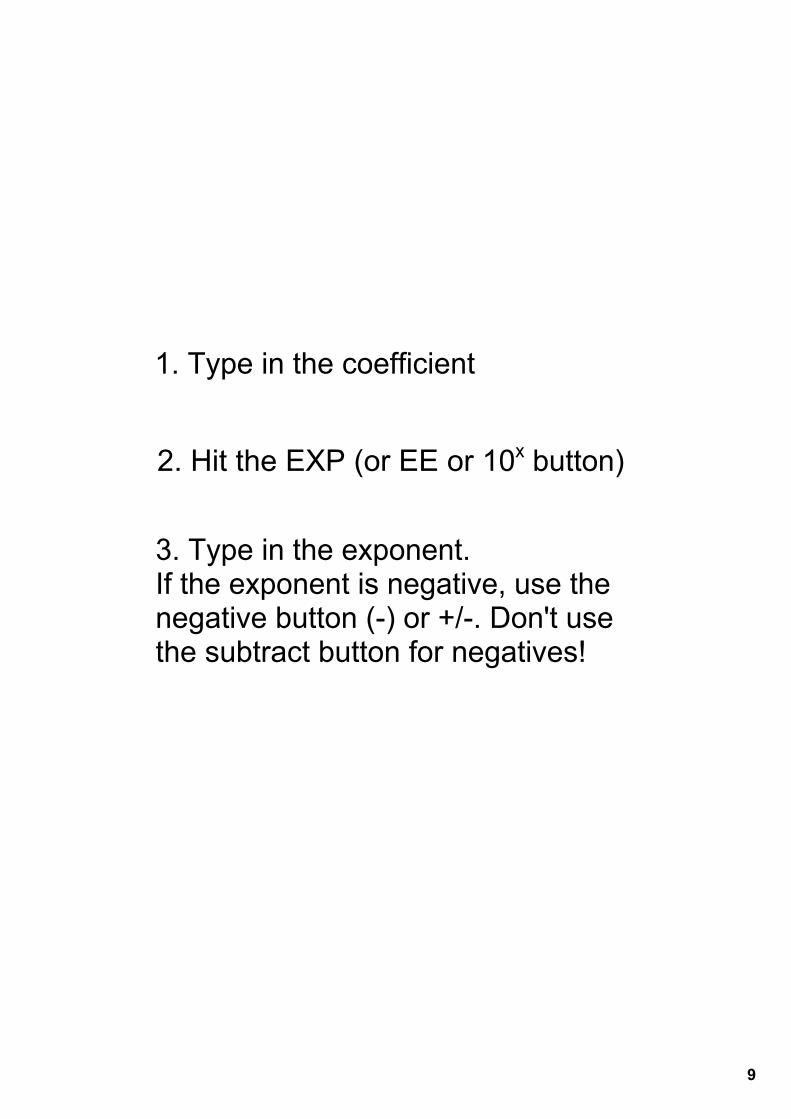
1. Type in the coefficient
2. Hit the EXP (or EE or 10x button)
3. Type in the exponent.If the exponent is negative, use the negative button () or +/. Don't use the subtract button for negatives!
10
Give the answer in scientific notationEx. (2.56 x 10⁴)(3.87 x 10³)
11
Homework:
ScientificNotationWorksheet
12
2. Metric System
13
• A measurement must include some form of unit (otherwise it’s just a number).• E.g. • 10.5 cm• 247.93 g• 0.25 mL
14
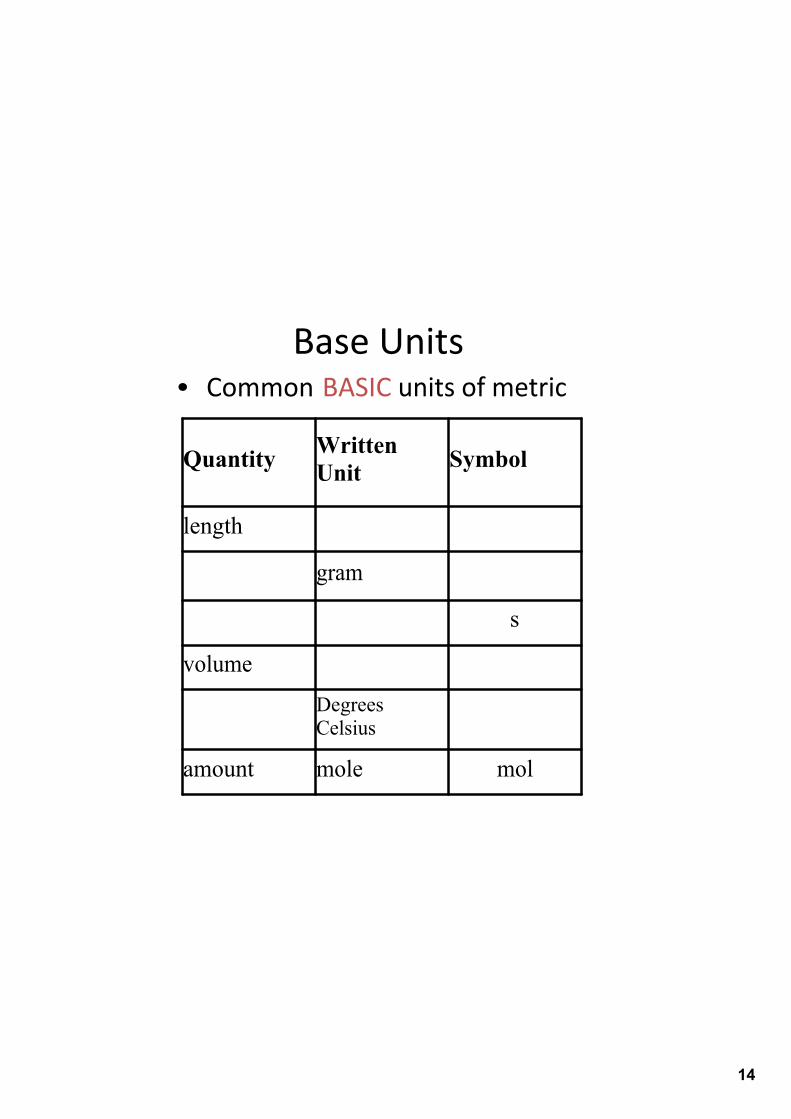
Base Units• Common BASIC units of metric
Quantity Written Unit Symbol
length
gram
s
volumeDegrees Celsius
amount mole mol
15
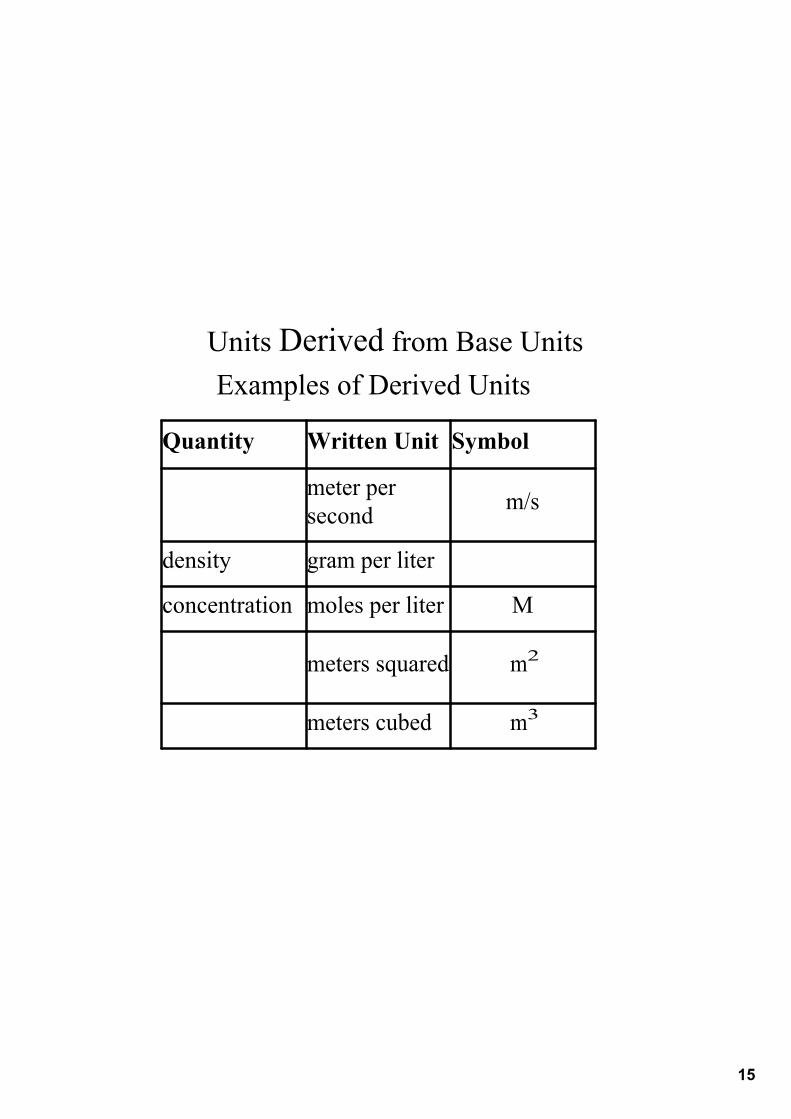
Units Derived from Base Units
Quantity Written Unit Symbol
meter per second m/s
density gram per liter
concentration moles per liter M
meters squared m2
meters cubed m3
Examples of Derived Units
16
Common Multiples of Base Units(prefixes)
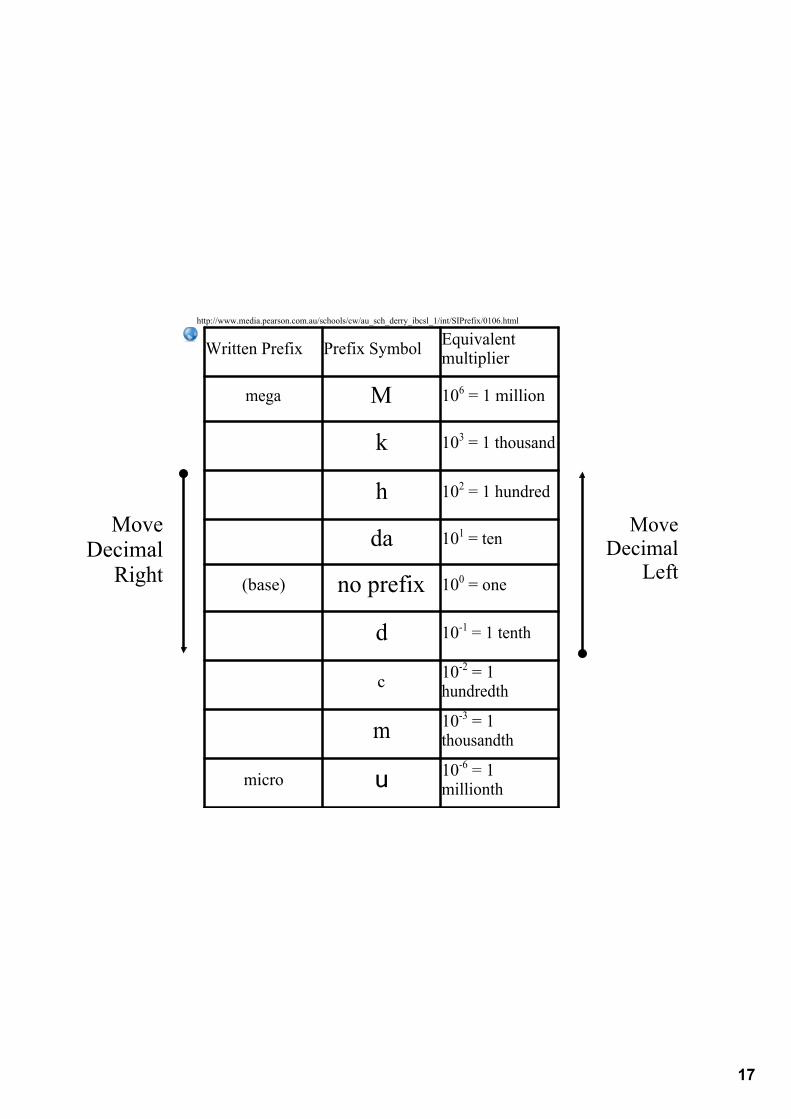
17
Written Prefix Prefix Symbol Equivalent multiplier
mega M 106 = 1 million
k 103 = 1 thousand
h 102 = 1 hundred
da 101 = ten
(base) no prefix 100 = one
d 101 = 1 tenth
c 102 = 1 hundredth
m 103 = 1 thousandth
micro u 106 = 1 millionth
MoveDecimal
Right
MoveDecimal
Left
http://www.media.pearson.com.au/schools/cw/au_sch_derry_ibcsl_1/int/SIPrefix/0106.html
18
Single Unit Conversions• 27.6 kg = ____________ cg ? We are moving down on our conversion table, therefore we move the decimal to the . In this case, jumps to the ! The new number is because the new unit is .
• 6542mm = ____________ hm ? We are moving our conversion table, therefore we move the decimal to the . In this case, jumps to the . The new number is because the new unit is .
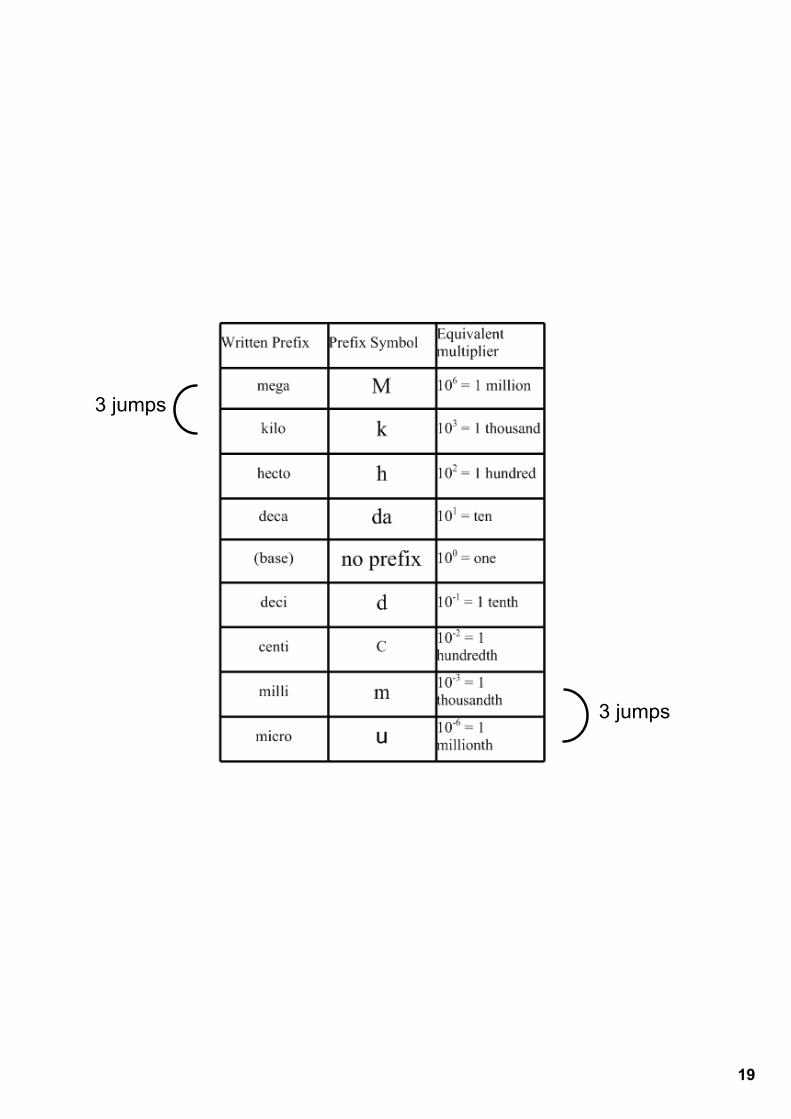
19
3 jumps
3 jumps
20
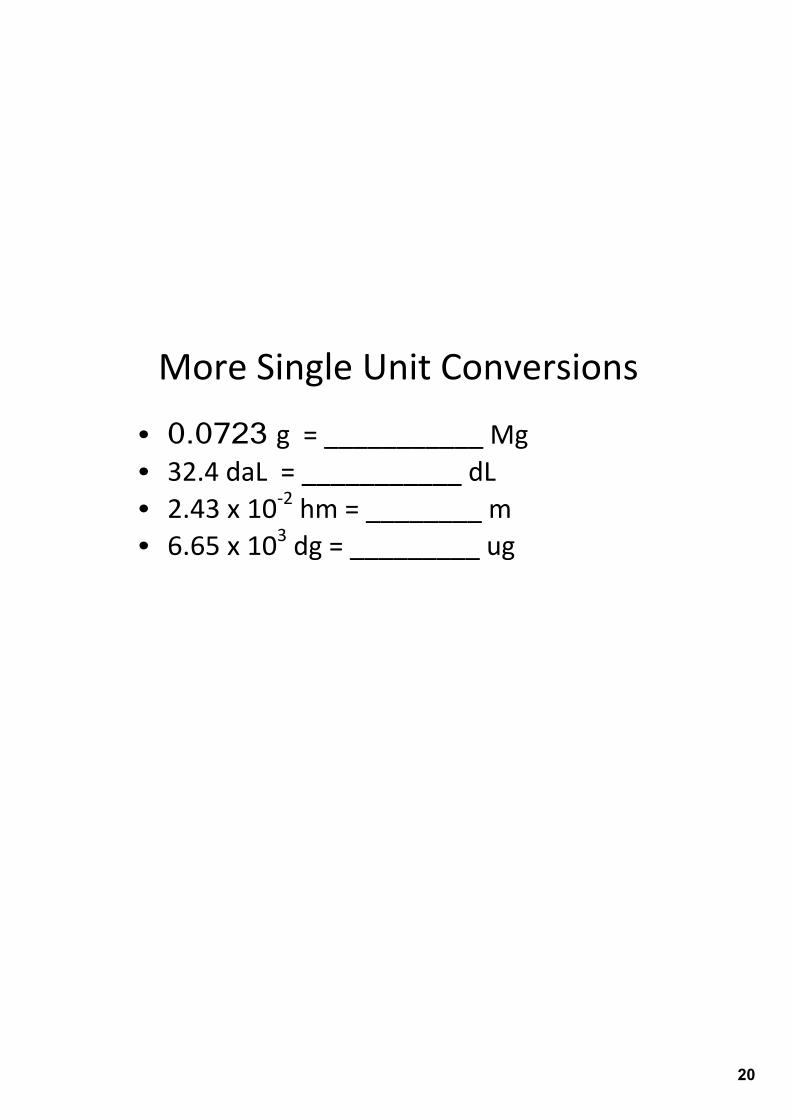
More Single Unit Conversions
• 0.0723 g = ___________ Mg• 32.4 daL = ___________ dL• 2.43 x 10‐2 hm = ________ m• 6.65 x 10³ dg = _________ ug
21
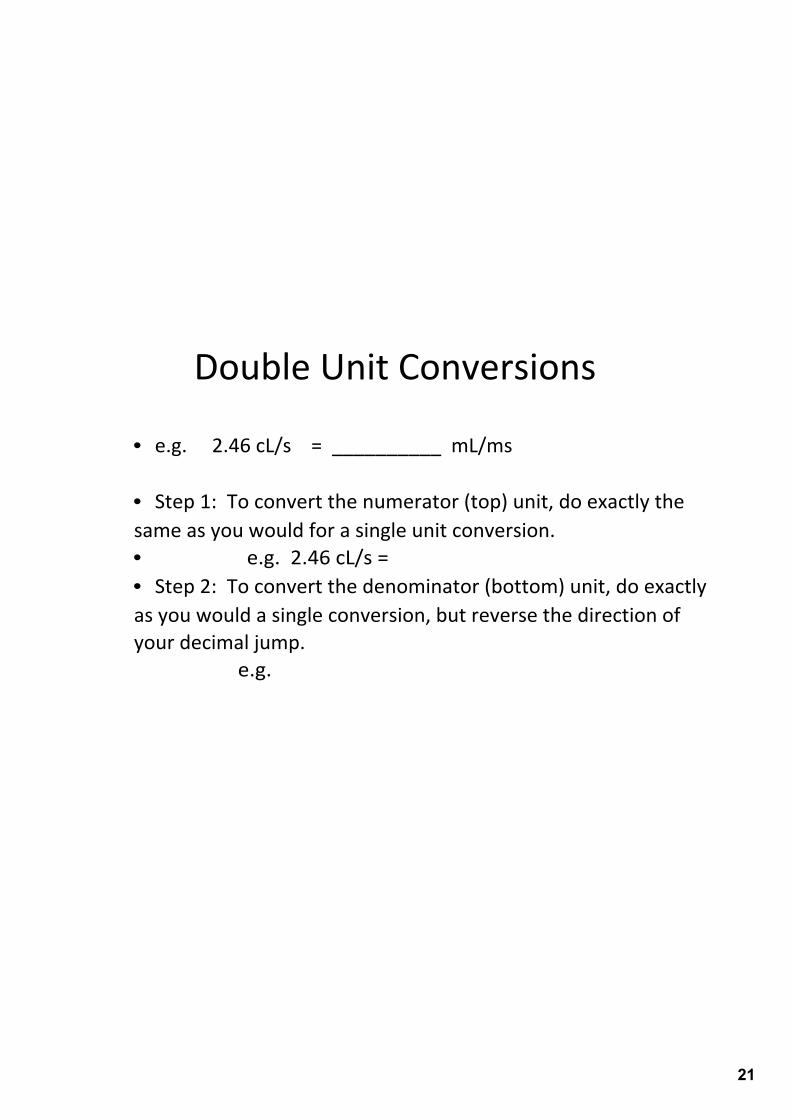
Double Unit Conversions
• e.g. 2.46 cL/s = __________ mL/ms
• Step 1: To convert the numerator (top) unit, do exactly the same as you would for a single unit conversion.• e.g. 2.46 cL/s = • Step 2: To convert the denominator (bottom) unit, do exactly as you would a single conversion, but reverse the direction of your decimal jump. e.g.
22
Double Unit Con. Examples
• 16.5 cg/hL = ___________ug/L
• 2.34 x 101 m/s = __________km/ds
23
HOMEWORK:
Metric Worksheet
24
3. Accuracy & Precision
25
Accuracy
• Depicts how close a measured value is to the actual value
• EX. If you weigh 150 lbs. But the scale reads 130 lbs., the scale is not accurate.
26
Precision of a single measurement
• A term used to depict how many decimal places (place values) you can acquire from a measuring device
• If scale 1 reads 142.6lbs and scale 2 reads 143lbs, then scale 1 is more precise – it has smaller measuring increments (tenths compared to ones)
27
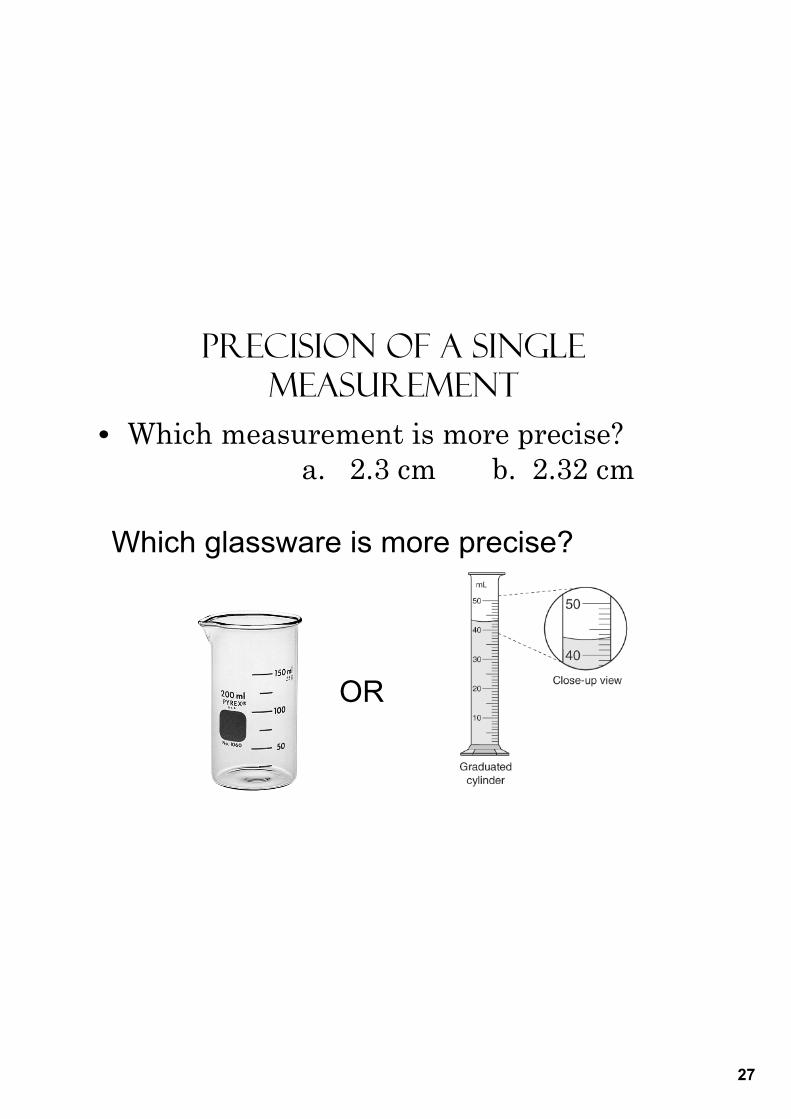
Precision of a single measurement
• Which measurement is more precise? a. 2.3 cm b. 2.32 cm
Which glassware is more precise?
OR
28
Precision of multiple measurements
• Precision can be used to describe reproducible measurements as well
• Ex. You weigh the same piece of zinc on a scale 3 times, and you get 7.60, 7.61, and 7.59 grams. the scale is precise (it gives reproducible results).
29
THE TWO MEANINGS OF PRECISION1. To how many decimal places a measuring device can measure to (the more decimal places, the more precise)
2. The reproducibility of a measurement. If you measure something three times, will the measuring device give the same result every time.
30
A scale that is giving incorrect masses (is not accurate), but does give reproducible results (is precise) needs to be CALIBRATED (kind of like setting your watch to the correct time).
A scale that is not precise could mean two things:either it doesn't measure to many decimal places ORit doesn't give reproducible resultsOR both
31
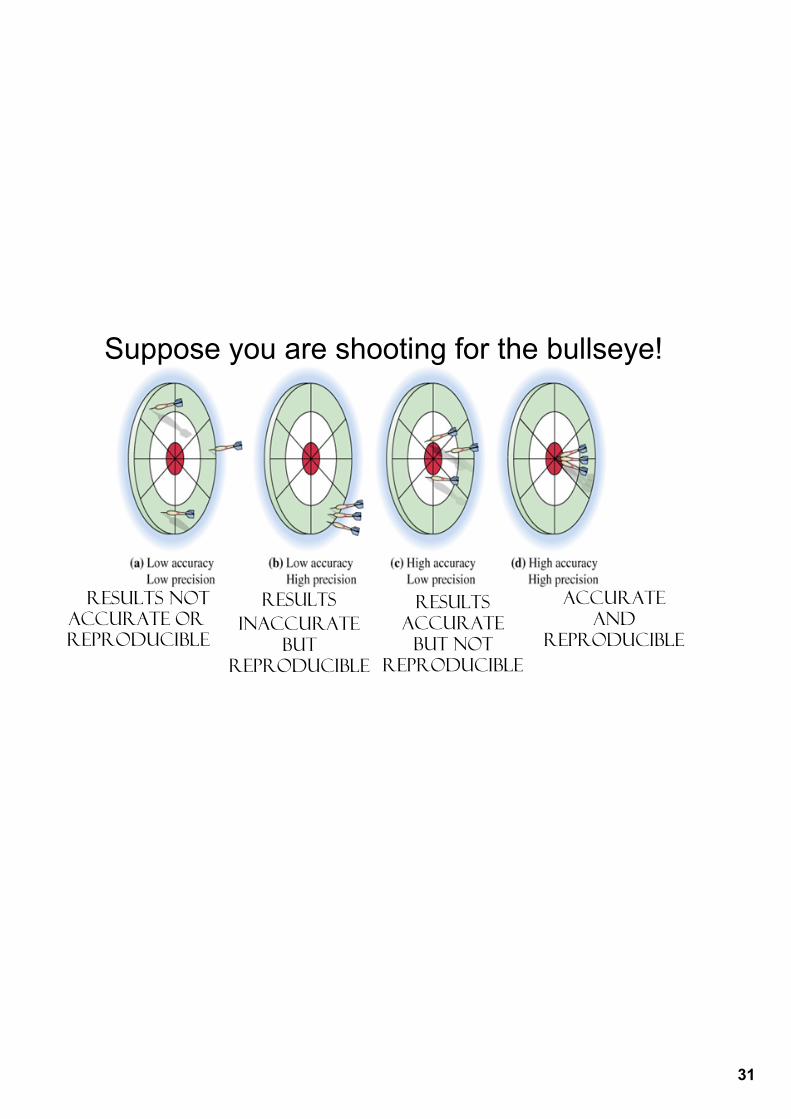
Results notAccurate or reproducible
Results Inaccurate
Butreproducible
ResultsAccurate
But notreproducible
AccurateAnd
reproducible
Suppose you are shooting for the bullseye!
32
4. Measuring & Counting Significant Figures
33
Significant Figures• When counting objects we can find an exact number that's undisputable (100% accurate)• eg numbers of students in class• number of books on a shelf
• When measuring quantities you are always limited by the of the measuring device (what place value it can measure to). The precision can always be better (to infinity), thus you can never get a completely accurate, undisputable measurement• eg length of classroom, mass of person• When making a measurement, there is a limit to the amount of meaningful digits
34
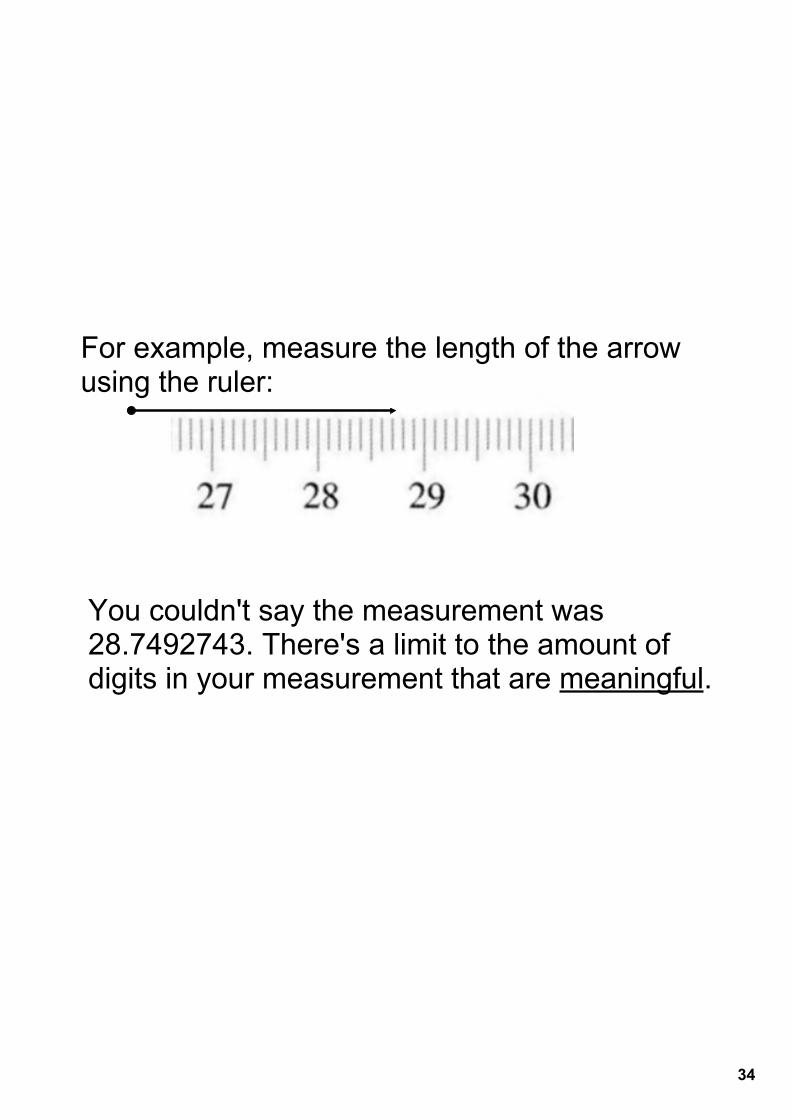
For example, measure the length of the arrow using the ruler:
You couldn't say the measurement was 28.7492743. There's a limit to the amount of digits in your measurement that are meaningful.
35
Significant Figures
• A significant figure (or significant digit) is a measured or meaningful digit.• Significant figures (or “Sig figs”) are the digits known to be exact plus one more that may have some uncertainty but is an educated guess• The following examples show how many digits can be determined in different cases.
36
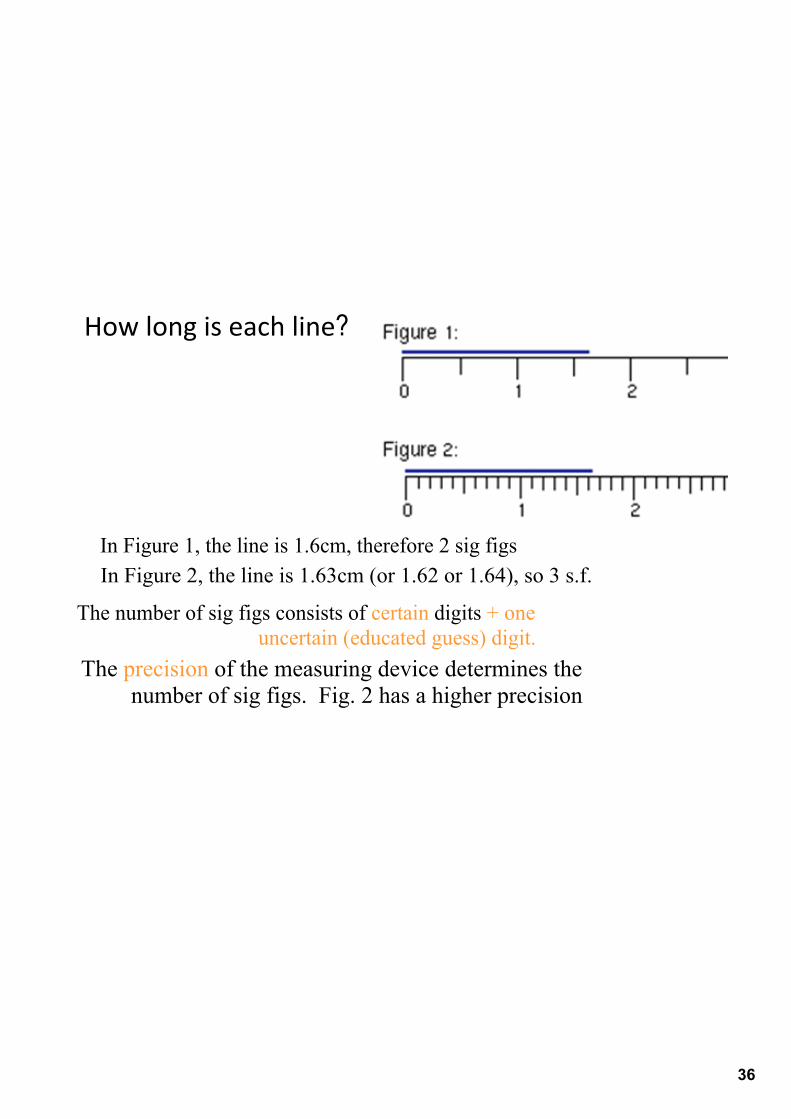
How long is each line?
In Figure 1, the line is 1.6cm, therefore 2 sig figs In Figure 2, the line is 1.63cm (or 1.62 or 1.64), so 3 s.f.
The number of sig figs consists of certain digits + one uncertain (educated guess) digit.
The precision of the measuring device determines the number of sig figs. Fig. 2 has a higher precision
37
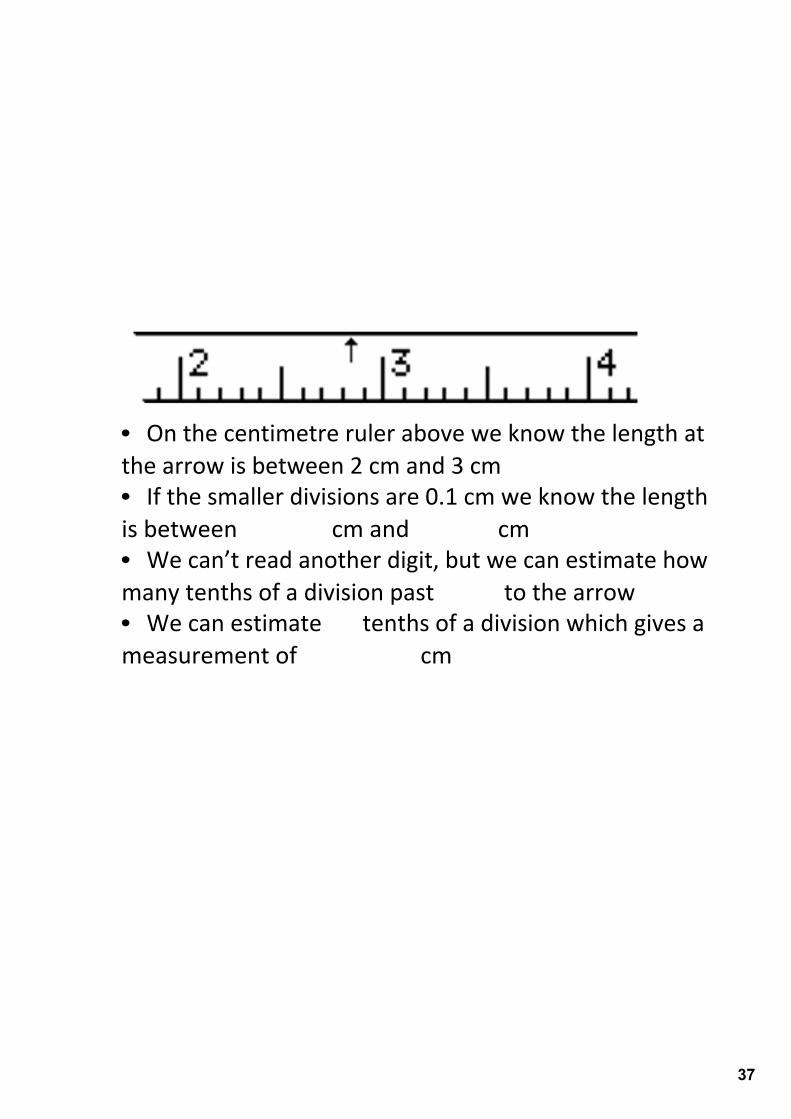
• On the centimetre ruler above we know the length at the arrow is between 2 cm and 3 cm• If the smaller divisions are 0.1 cm we know the length is between cm and cm• We can’t read another digit, but we can estimate how many tenths of a division past to the arrow• We can estimate tenths of a division which gives a measurement of cm
38
• We state the measurement as cm.• We are certain about the first digits and have some certainty about the • eg ‐ we know the third digit is not 0 or 9, (but it might be or )• This measurement has sig figs• We cannot give the measurement of because we cannot be that precise with this ruler
39
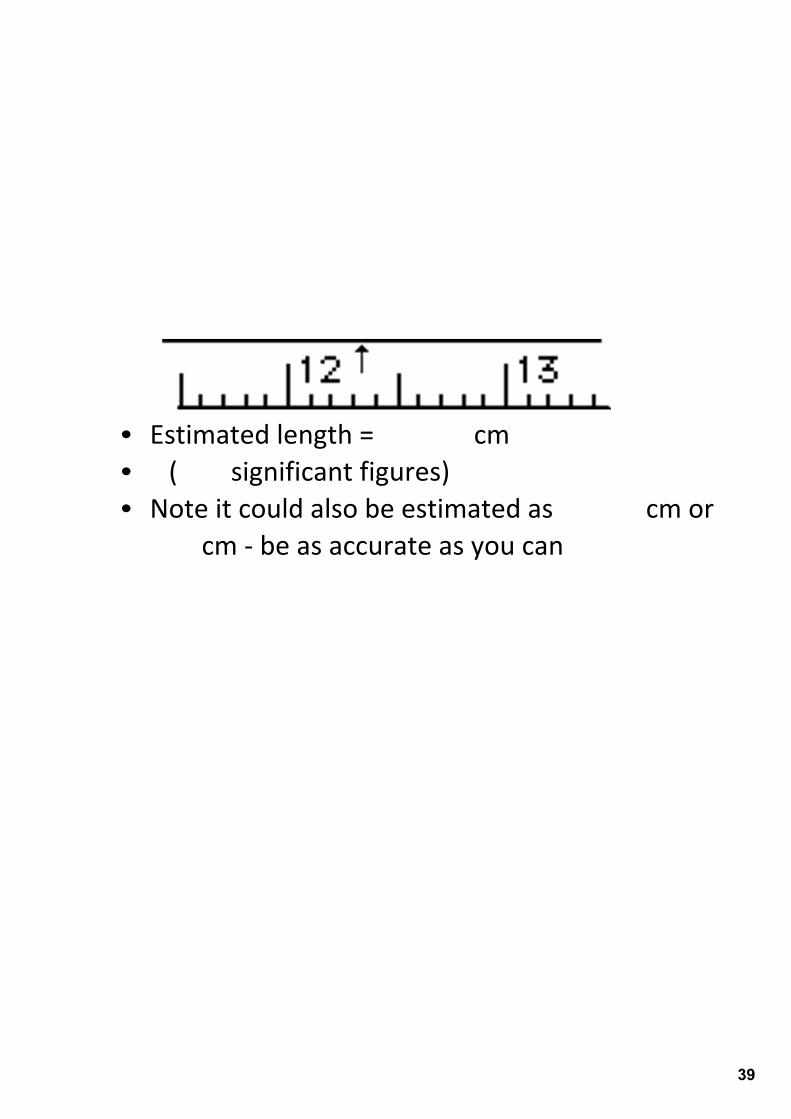
• Estimated length = cm • ( significant figures)• Note it could also be estimated as cm or
cm ‐ be as accurate as you can
40
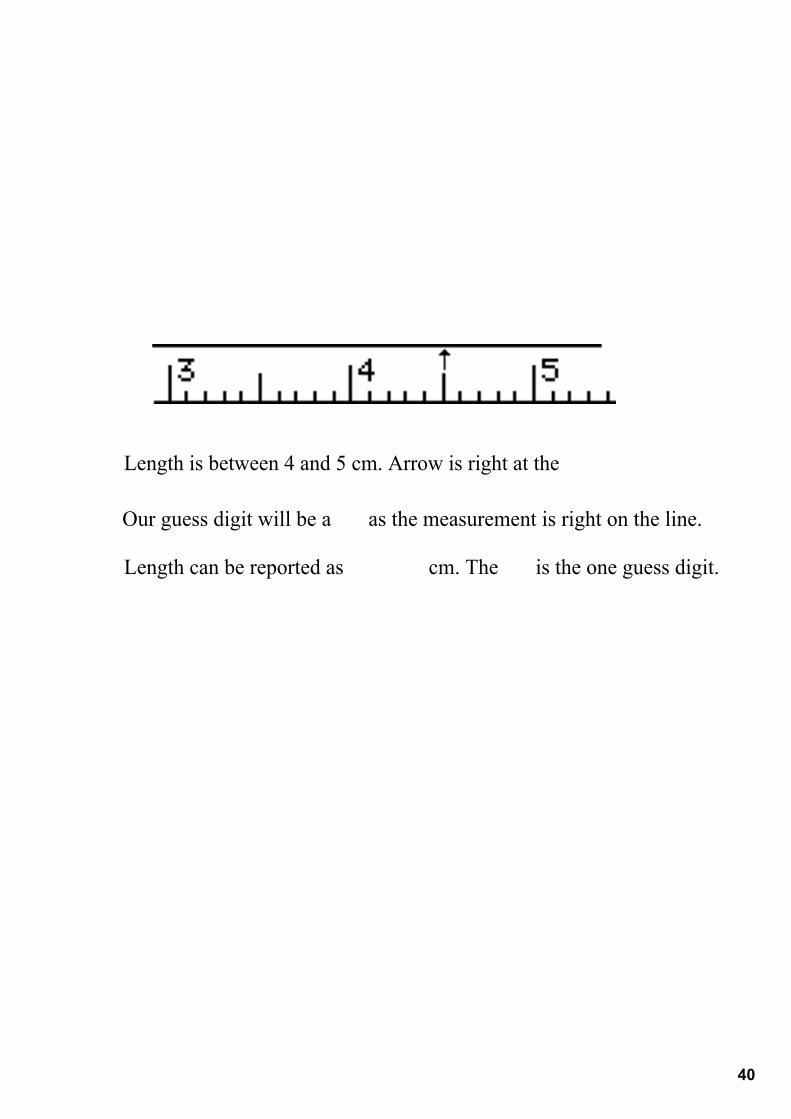
Length is between 4 and 5 cm. Arrow is right at the
Our guess digit will be a as the measurement is right on the line.
Length can be reported as cm. The is the one guess digit.
41
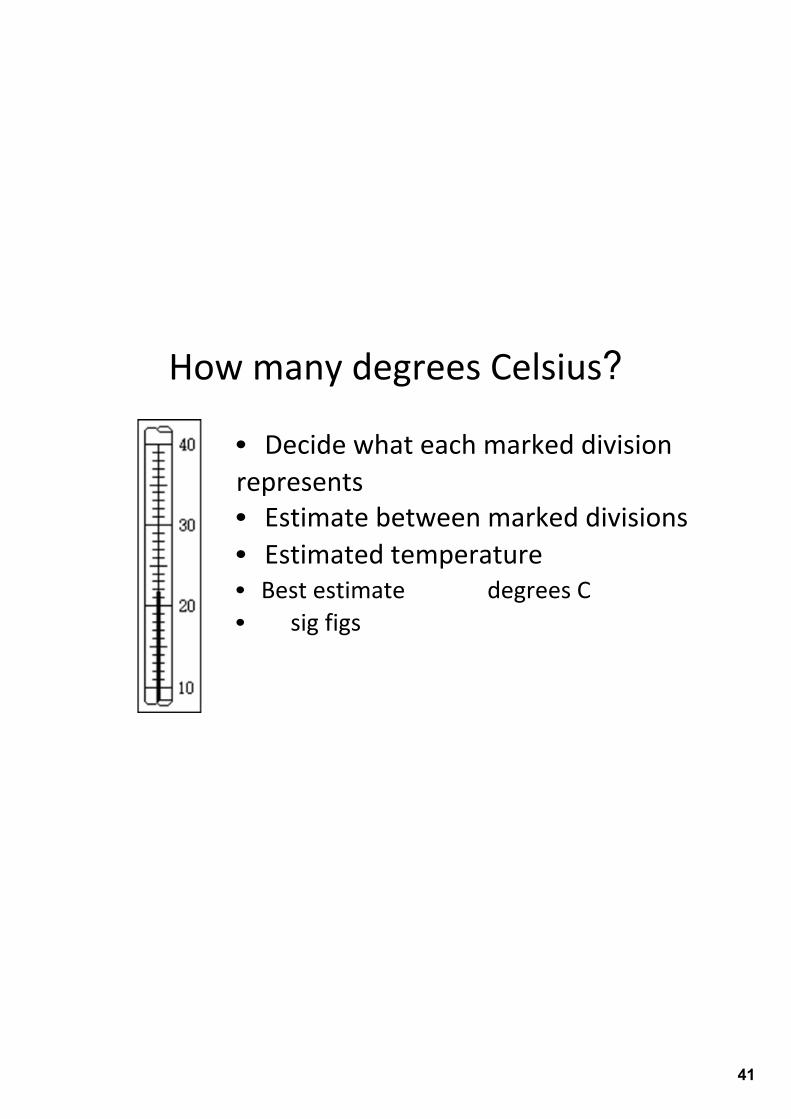
How many degrees Celsius?
• Decide what each marked division represents• Estimate between marked divisions• Estimated temperature• Best estimate degrees C• sig figs
42
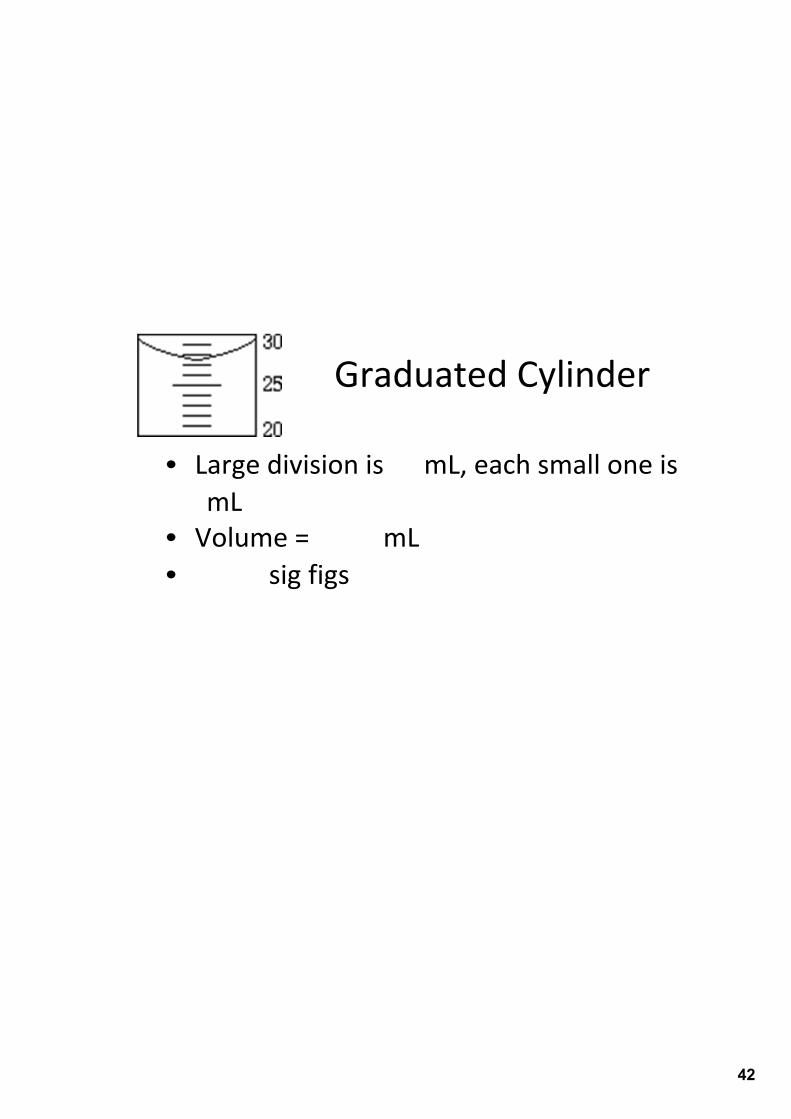
Graduated Cylinder
• Large division is mL, each small one is mL
• Volume = mL• sig figs

43
Graduated Cylinder
• scale division is mL• Volume = mL ( sig figs)
44
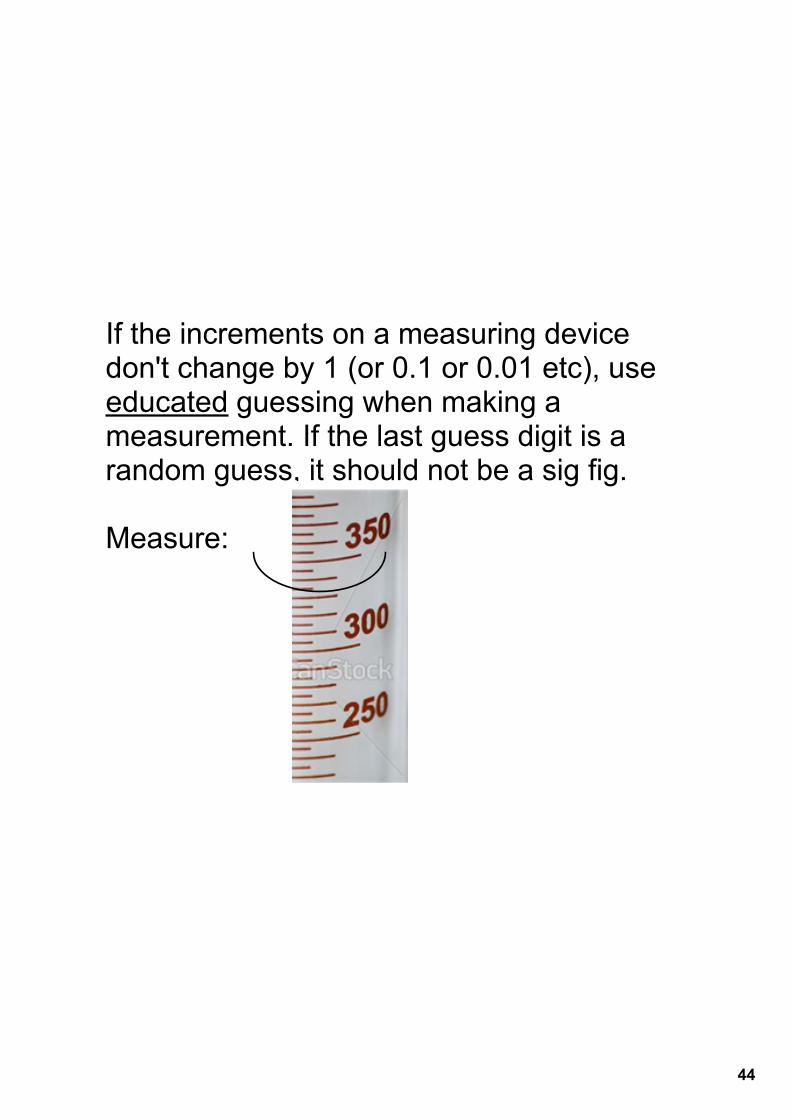
If the increments on a measuring device don't change by 1 (or 0.1 or 0.01 etc), use educated guessing when making a measurement. If the last guess digit is a random guess, it should not be a sig fig.
Measure:
45
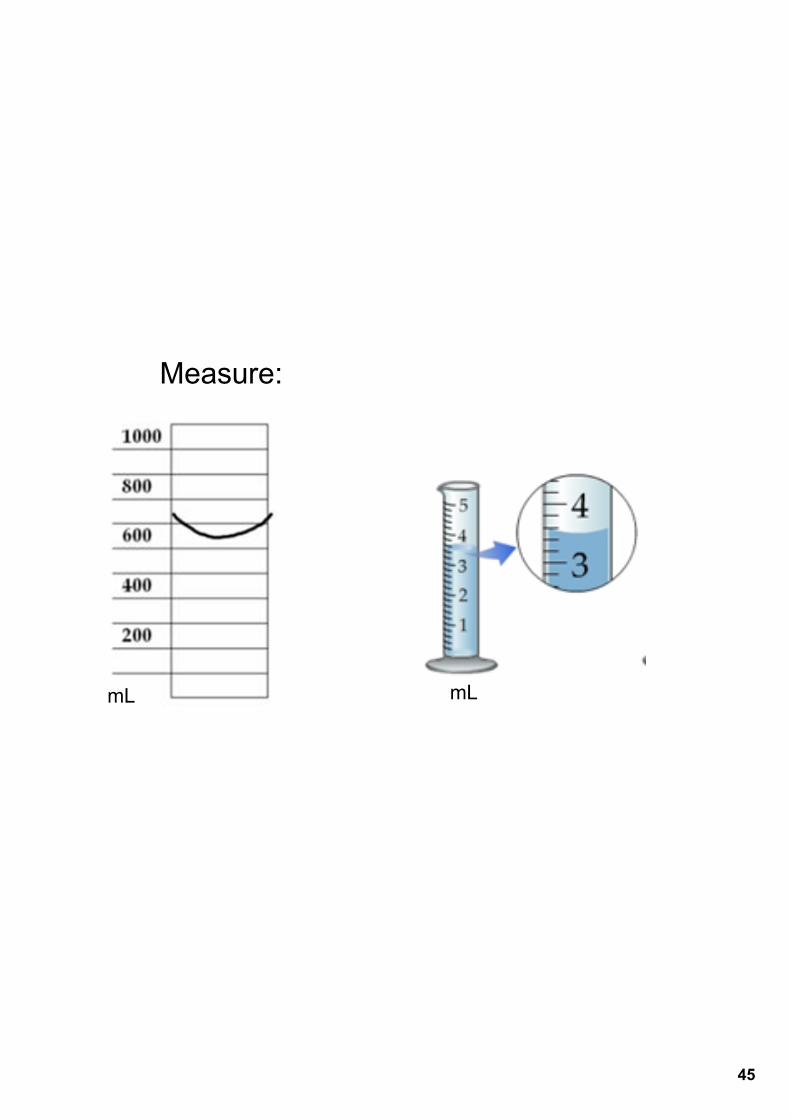
Measure:
mL mL
46
What if the measurement has been made by someone else, and then you are to work with it. How do you count the number of sig figs in the measurement?
47
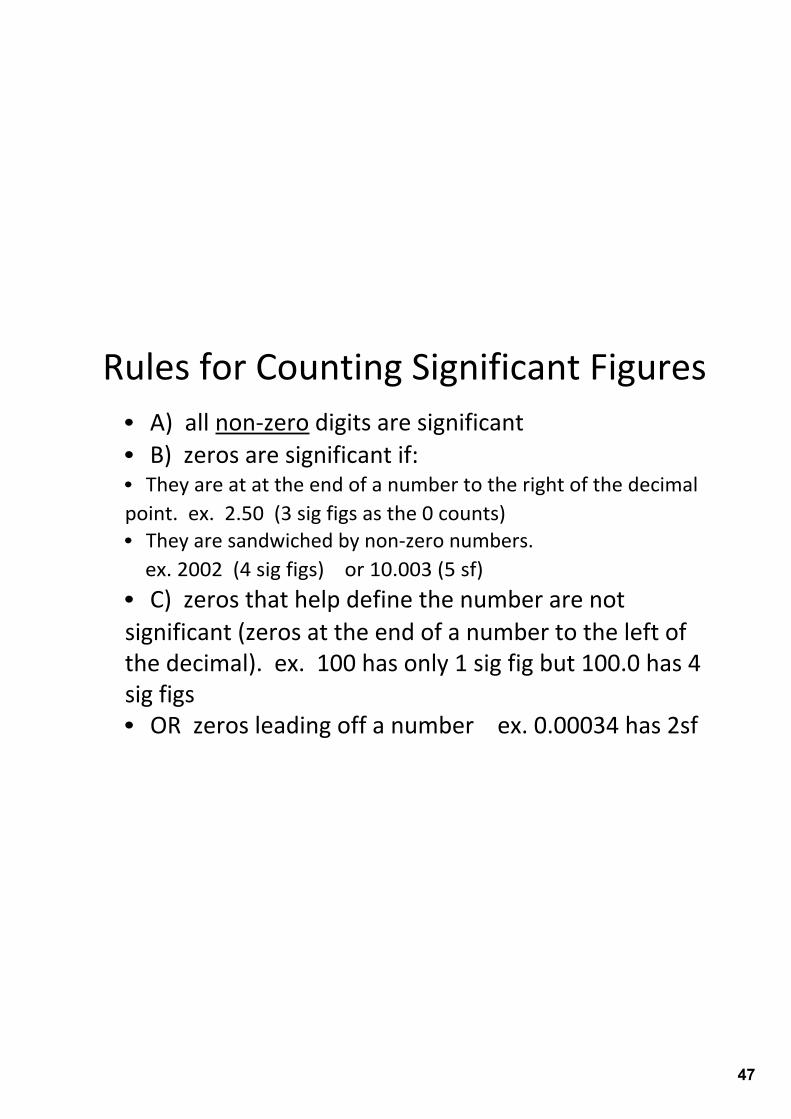
Rules for Counting Significant Figures• A) all non‐zero digits are significant• B) zeros are significant if:• They are at at the end of a number to the right of the decimal point. ex. 2.50 (3 sig figs as the 0 counts)• They are sandwiched by non‐zero numbers. ex. 2002 (4 sig figs) or 10.003 (5 sf) • C) zeros that help define the number are not significant (zeros at the end of a number to the left of the decimal). ex. 100 has only 1 sig fig but 100.0 has 4 sig figs• OR zeros leading off a number ex. 0.00034 has 2sf
48
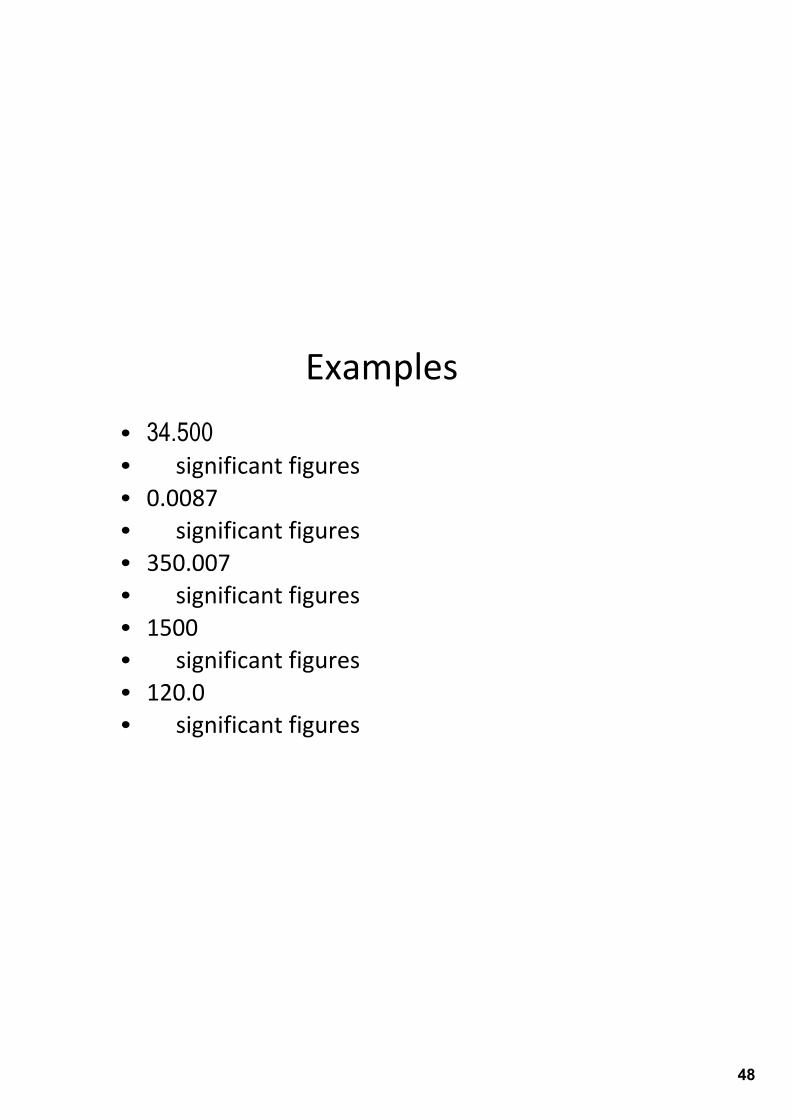
Examples• 34.500• significant figures• 0.0087 • significant figures• 350.007• significant figures• 1500• significant figures• 120.0• significant figures
49
Scientific Notation & Sig Figs
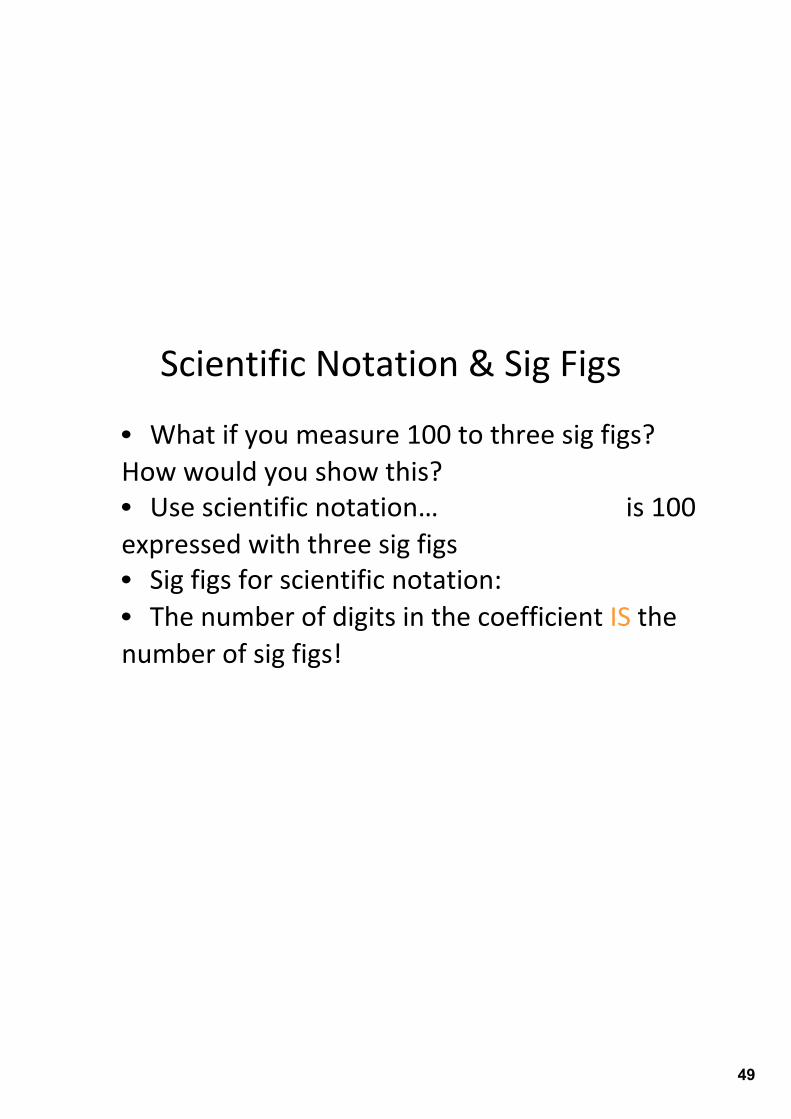
• What if you measure 100 to three sig figs? How would you show this?• Use scientific notation… is 100 expressed with three sig figs• Sig figs for scientific notation:• The number of digits in the coefficient IS the number of sig figs!
50
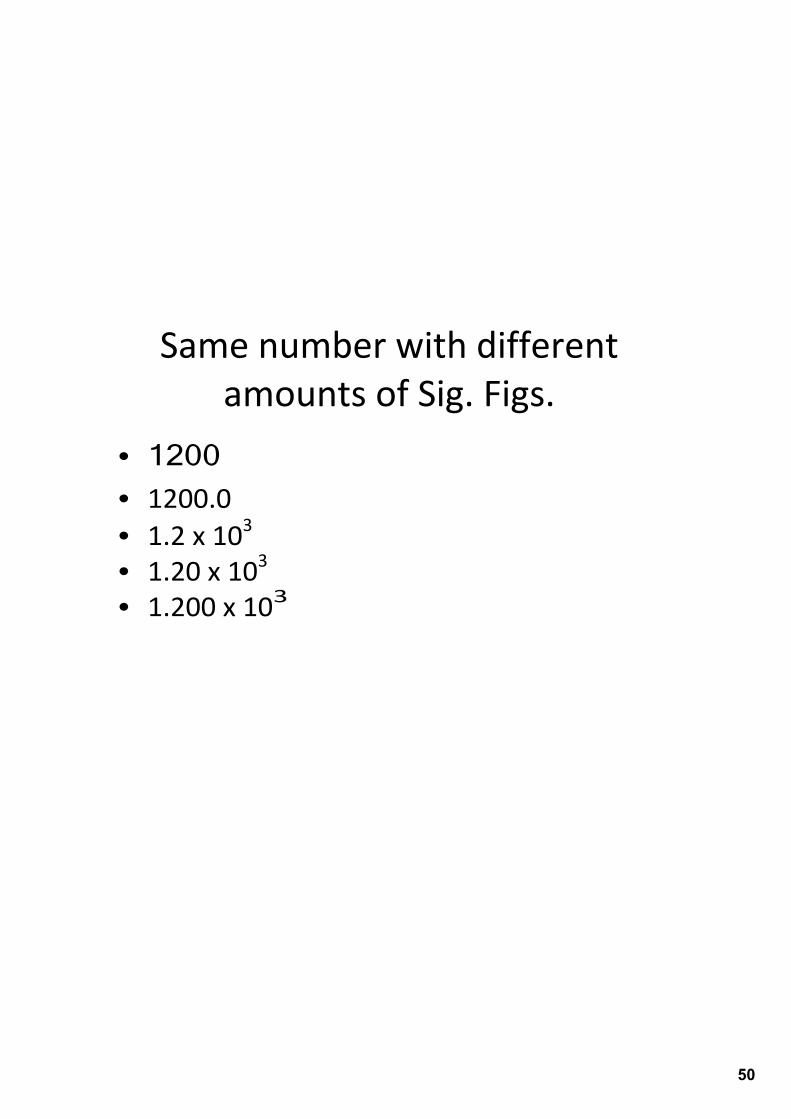
Same number with different amounts of Sig. Figs.
• 1200• 1200.0 • 1.2 x 10³
• 1.20 x 10³
• 1.200 x 10³
51
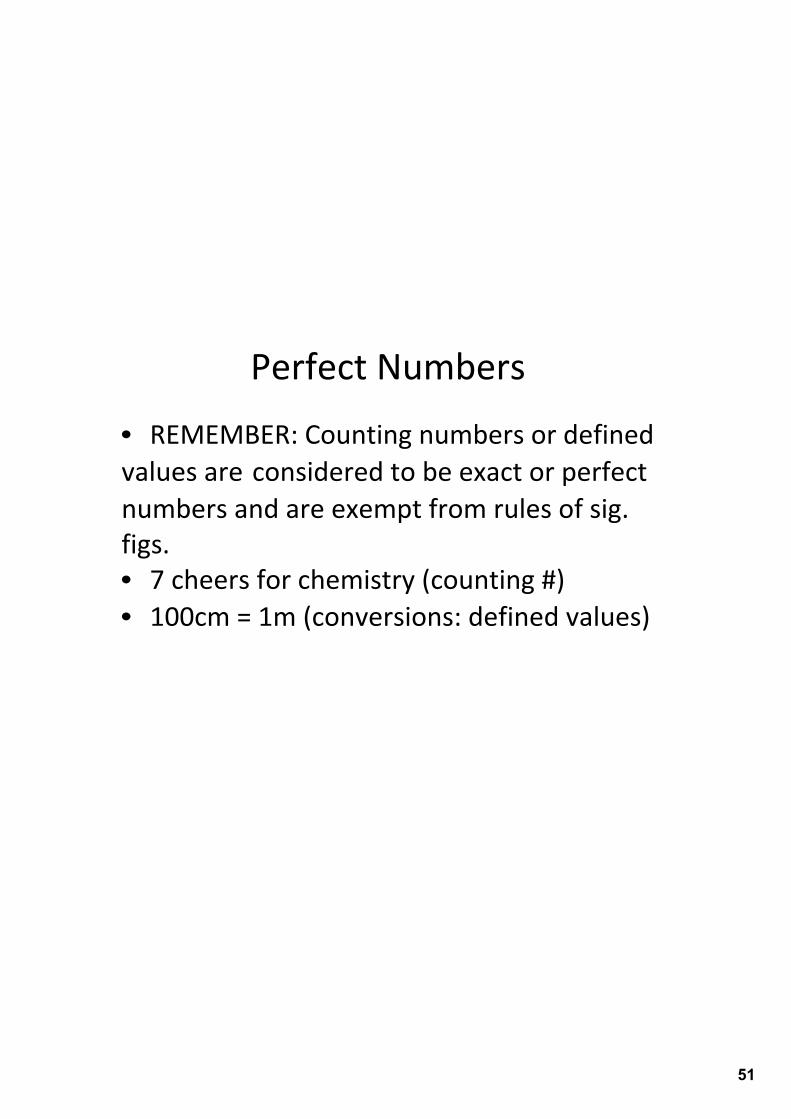
Perfect Numbers
• REMEMBER: Counting numbers or defined values are considered to be exact or perfect numbers and are exempt from rules of sig. figs.• 7 cheers for chemistry (counting #)• 100cm = 1m (conversions: defined values)
52
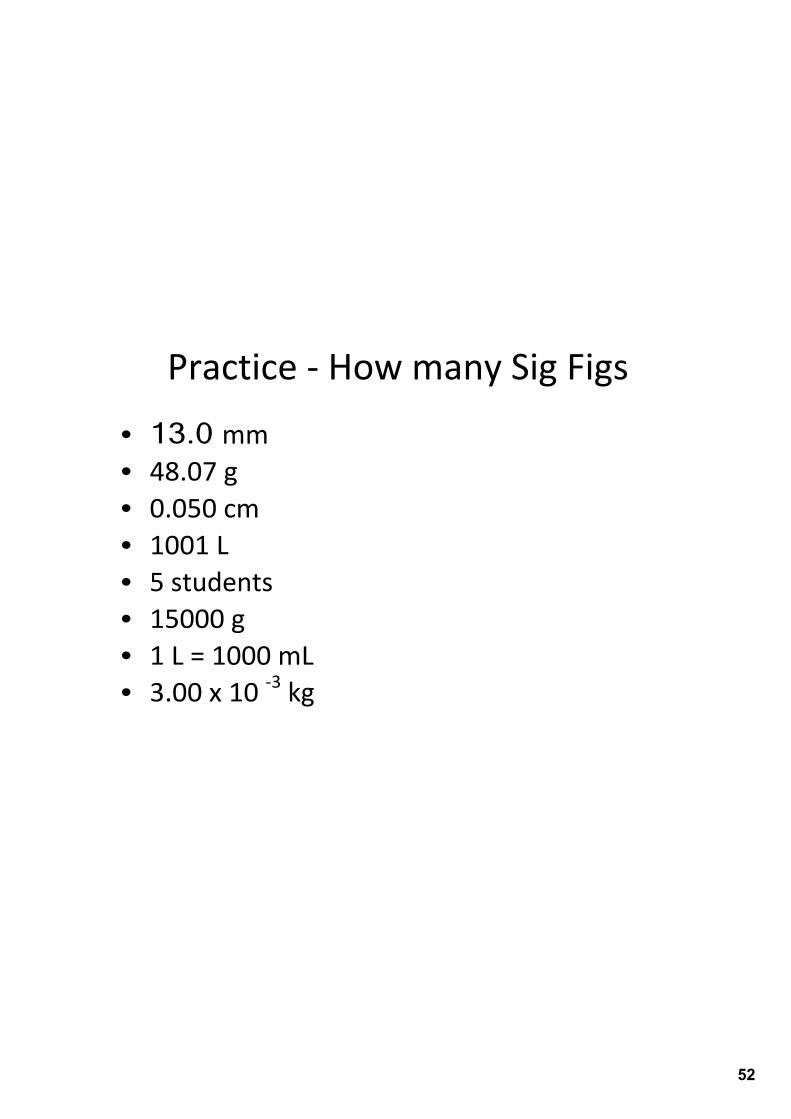
Practice ‐ How many Sig Figs
• 13.0 mm• 48.07 g• 0.050 cm• 1001 L• 5 students• 15000 g• 1 L = 1000 mL • 3.00 x 10 ‐3 kg
53
Homework:Counting Sig Figs Worksheet ANDMeasuring with Sig Figs Worksheet
54
5. Calculations with Significant Figures
1
55
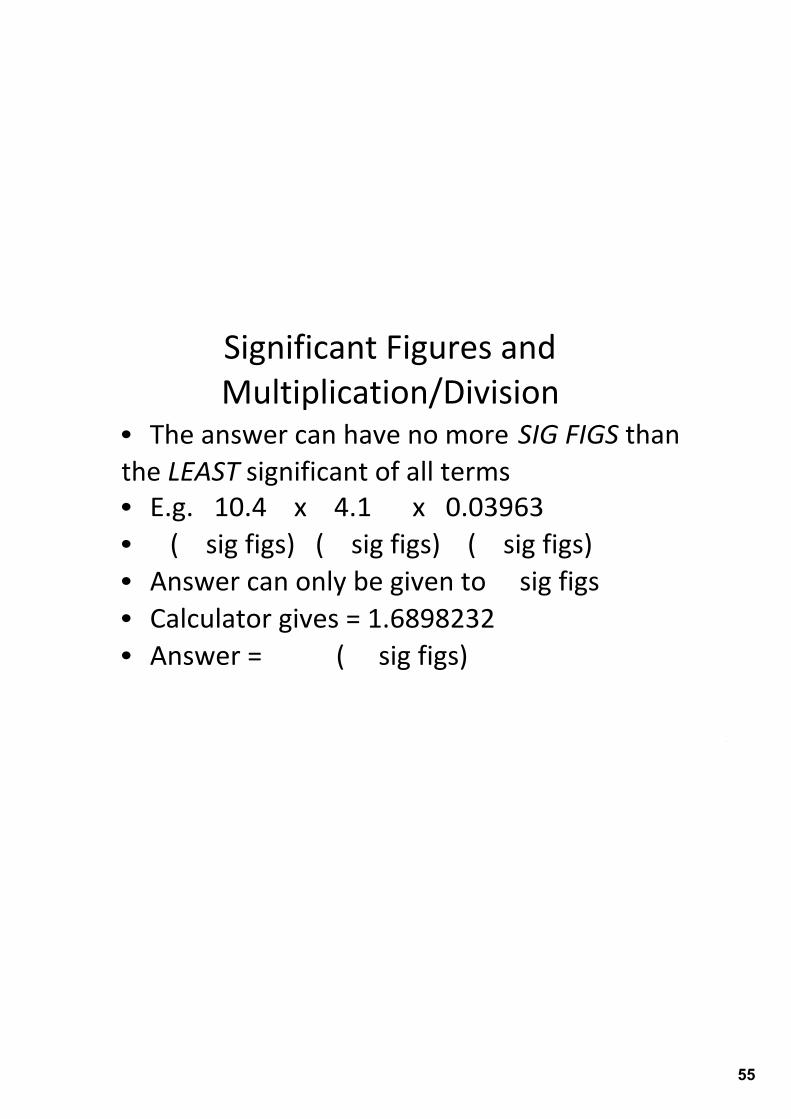
Significant Figures and Multiplication/Division
• The answer can have no more SIG FIGS than the LEAST significant of all terms• E.g. 10.4 x 4.1 x 0.03963• ( sig figs) ( sig figs) ( sig figs)• Answer can only be given to sig figs• Calculator gives = 1.6898232• Answer = ( sig figs)
2
56
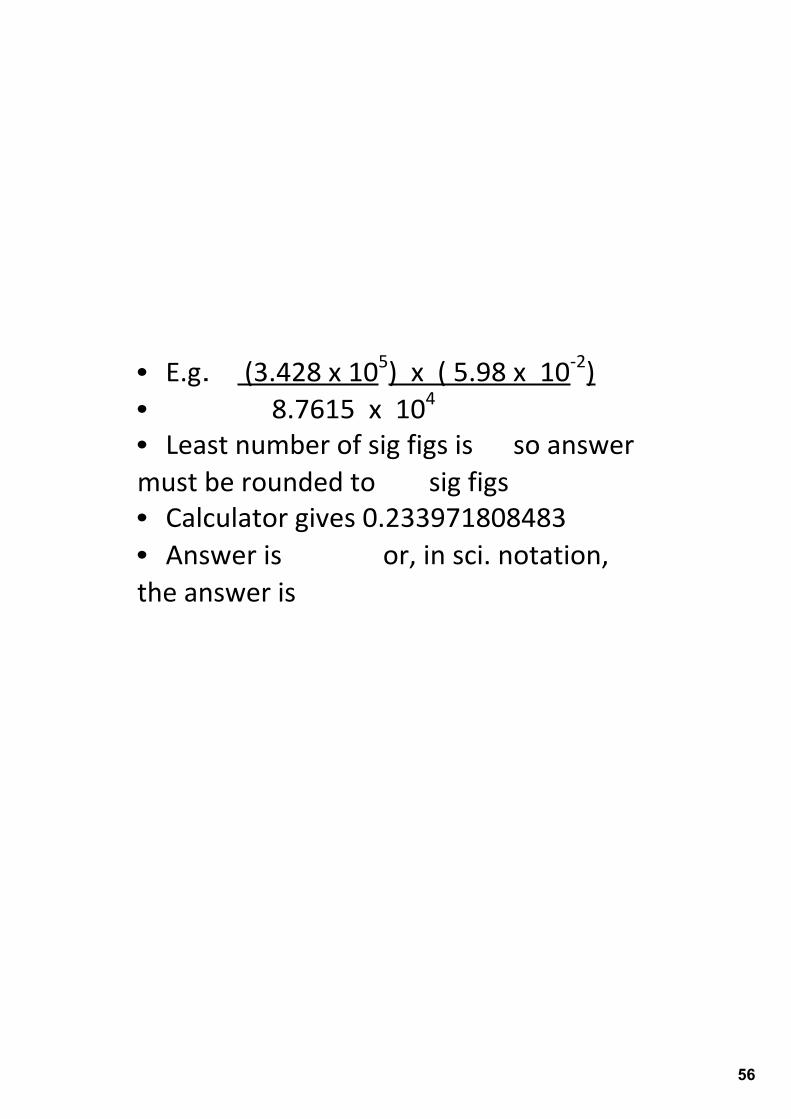
• E.g. (3.428 x 10⁵) x ( 5.98 x 10‐2)• 8.7615 x 10⁴
• Least number of sig figs is so answer must be rounded to sig figs• Calculator gives 0.233971808483 • Answer is or, in sci. notation, the answer is
3
57
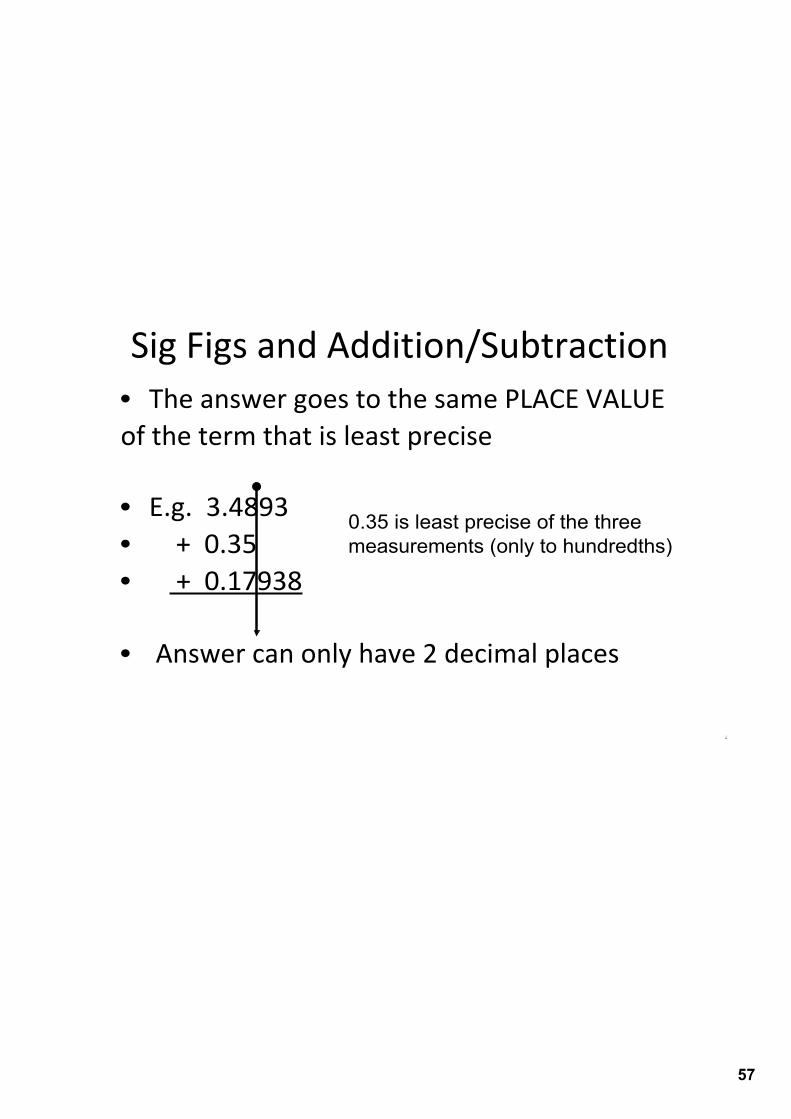
Sig Figs and Addition/Subtraction• The answer goes to the same PLACE VALUE of the term that is least precise
• E.g. 3.4893 • + 0.35 • + 0.17938
• Answer can only have 2 decimal places
4
0.35 is least precise of the three measurements (only to hundredths)
58
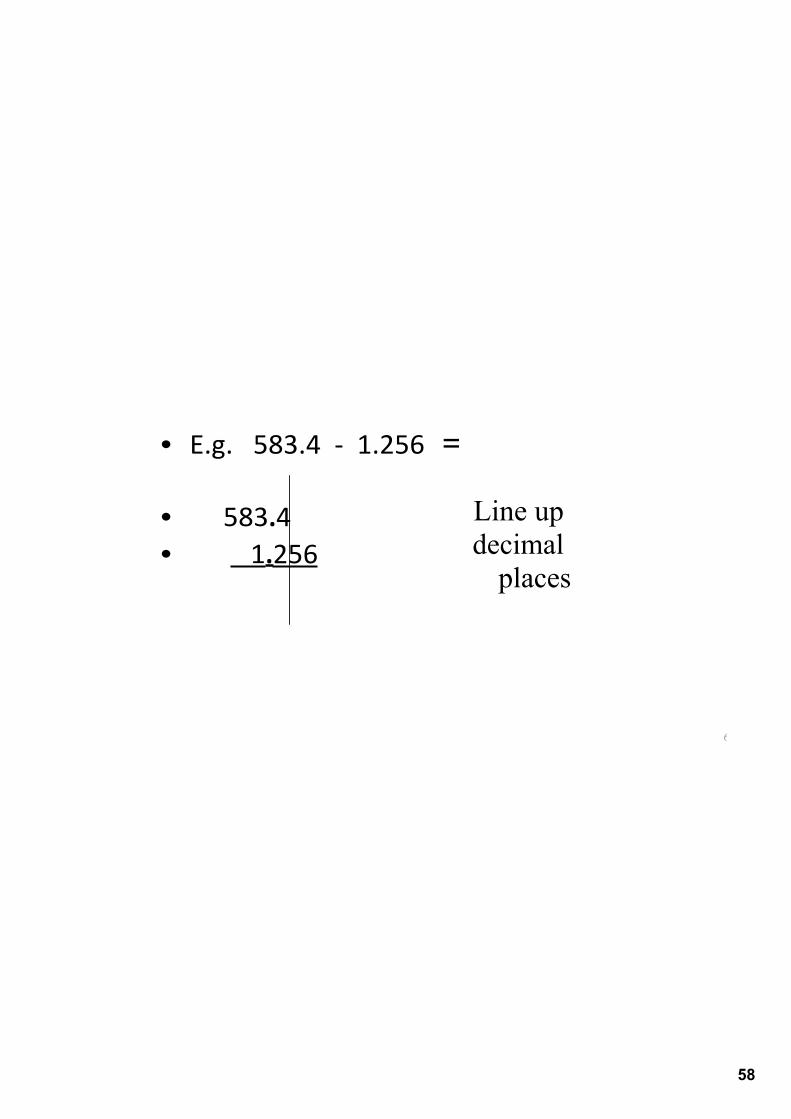
• E.g. 583.4 ‐ 1.256 =
• 583.4• 1.256
6
Line up decimal places
59
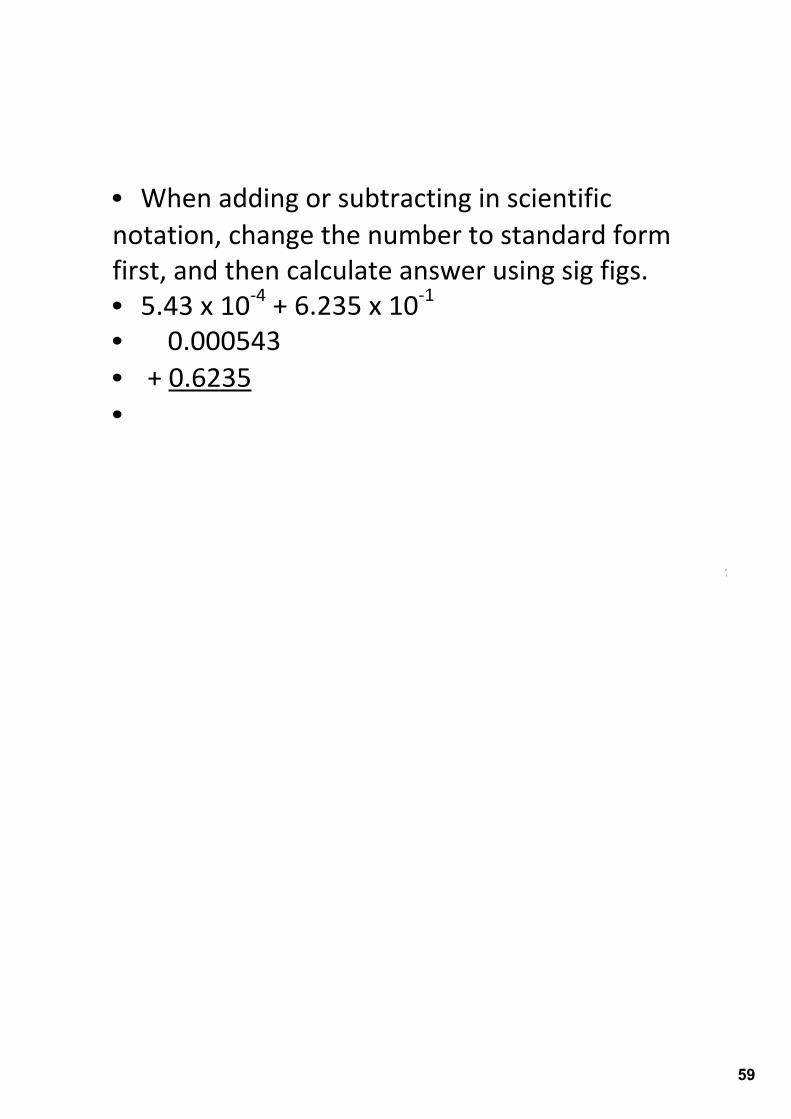
• When adding or subtracting in scientific notation, change the number to standard form first, and then calculate answer using sig figs.• 5.43 x 10‐4 + 6.235 x 10‐1
• 0.000543• + 0.6235•
7
60
Calculating Tips
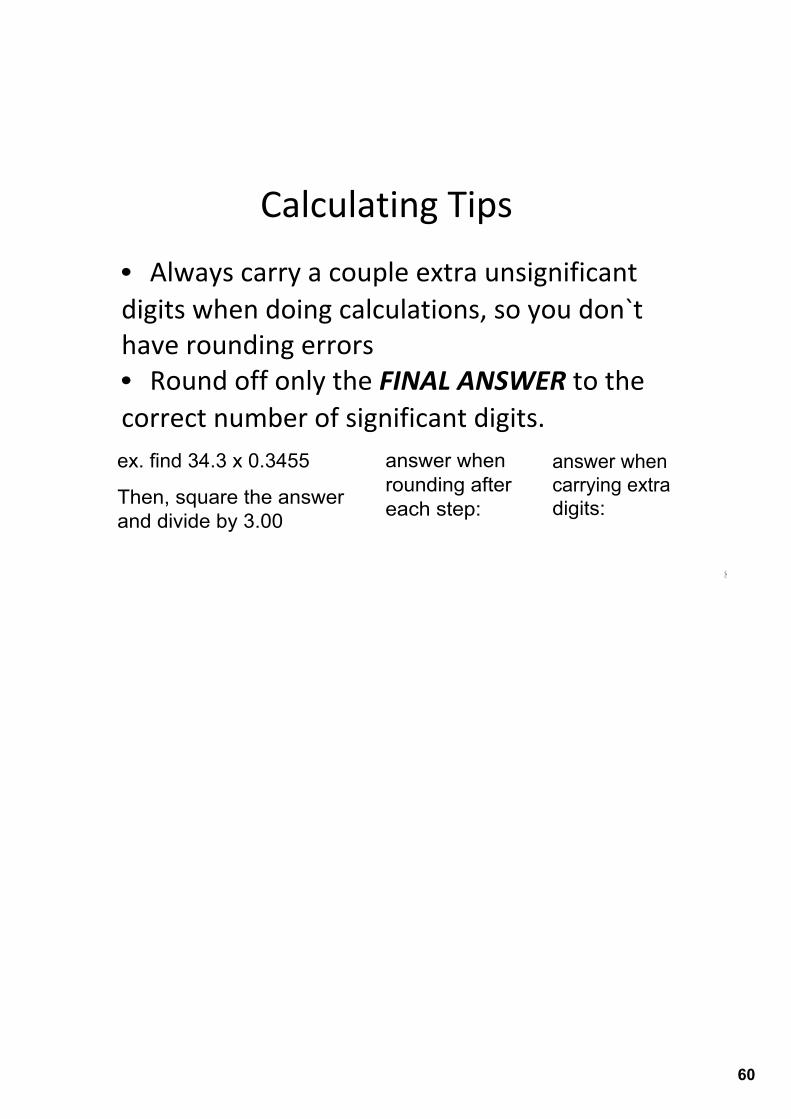
• Always carry a couple extra unsignificant digits when doing calculations, so you don`t have rounding errors • Round off only the FINAL ANSWER to the correct number of significant digits.
8
ex. find 34.3 x 0.3455
Then, square the answer and divide by 3.00
answer whenrounding aftereach step:
answer when carrying extra digits:
61
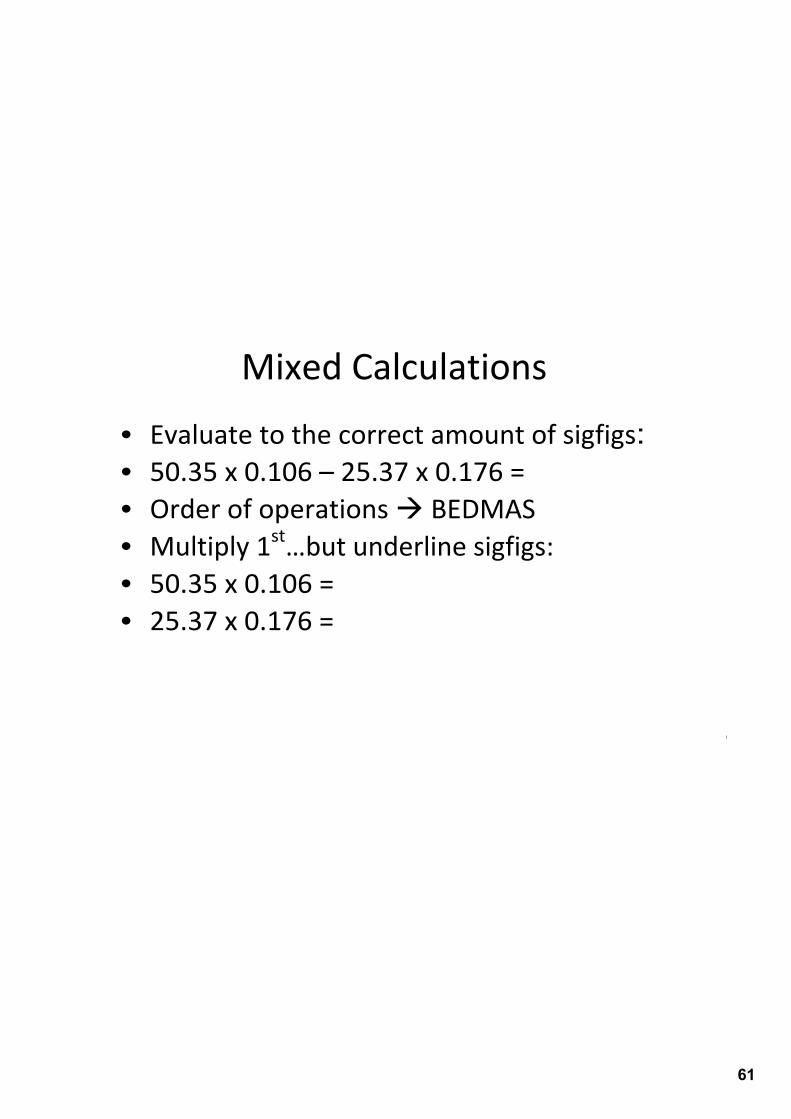
Mixed Calculations
• Evaluate to the correct amount of sigfigs:• 50.35 x 0.106 – 25.37 x 0.176 = • Order of operations à BEDMAS• Multiply 1st…but underline sigfigs:• 50.35 x 0.106 = • 25.37 x 0.176 =
9
62
• Now…perform the subtraction operation.• Since both of the multiplications are ‘legal’ to the 2nd decimal place, the result of the subtraction operation must be rounded to the
decimal place as follows:• 5.3371 – 4.46512 = • The answer is then rounded to • Again, always carry more digits through to the end, and round to the proper number of sigfigs at the end only.
10
63
11
HOMEWORK:
Sig Fig CalculationWorksheet
64
1
6. Density
65
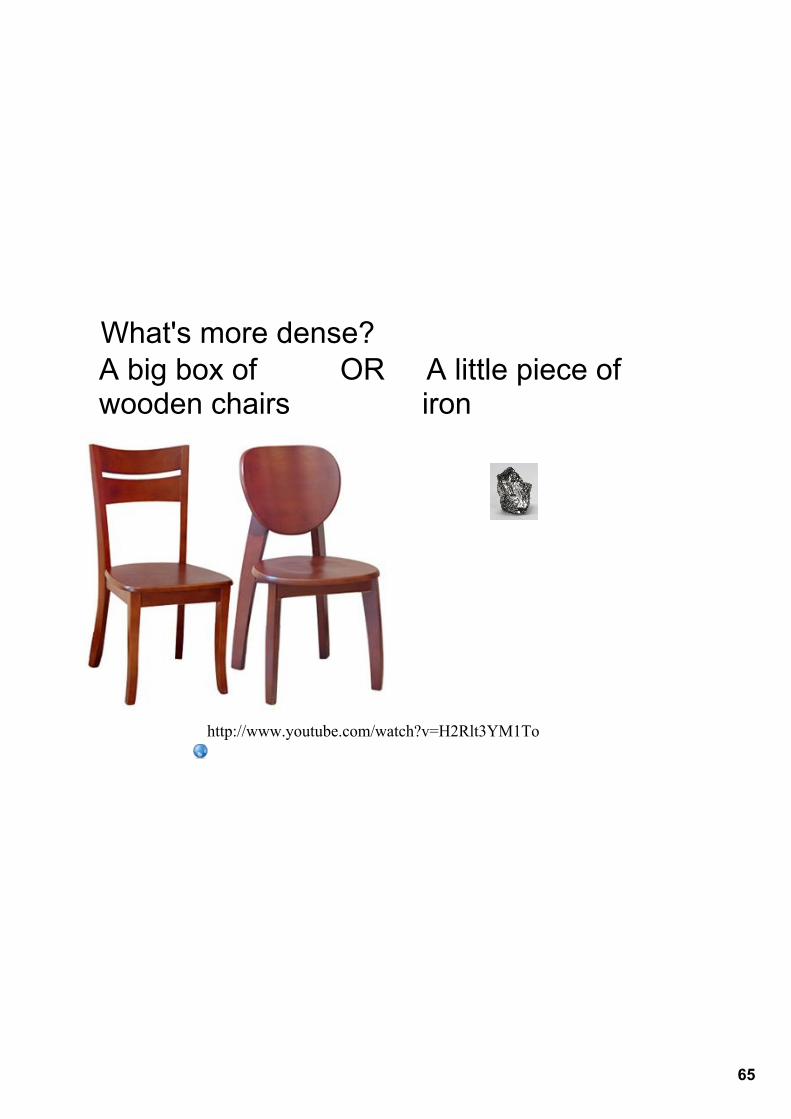
What's more dense?A big box of OR A little piece ofwooden chairs iron
http://www.youtube.com/watch?v=H2Rlt3YM1To
66
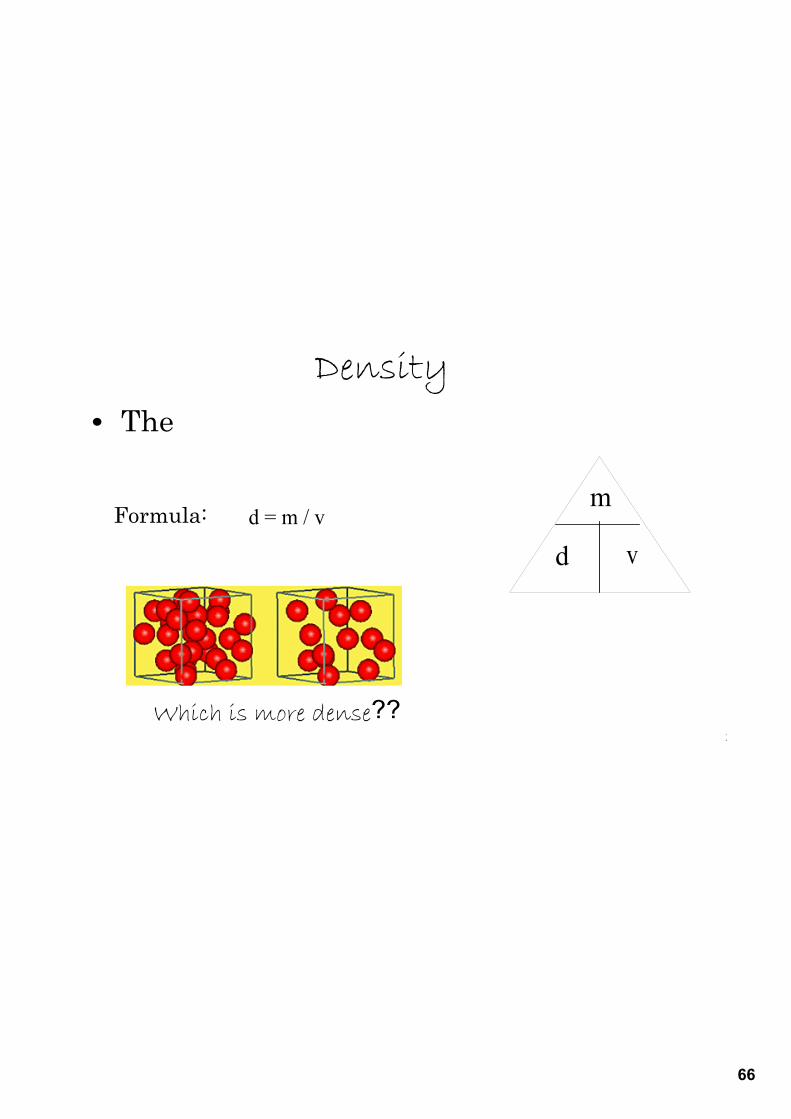
Density• The
2
m
vdFormula: d = m / v
Which is more dense??
67
Units
• Mass:
Volume:
• Density:
3
68
Example1.0mL of water at 4°C has a mass of 1.0g. • Therefore, the density of water is…
4
69
Density determines whether an object sinks or floats!
• Is the density of ice greater than or less than water?•• Is the density of ice greater than or less than isobutanol?
5
70
• Will the following sink or float in water?• Aluminum 2.70 g/cm3
• Cork 0.72 g/cm3
• Cooking Oil 0.920 g/mL
• How do you know?• Compare with the density of water.
6
71
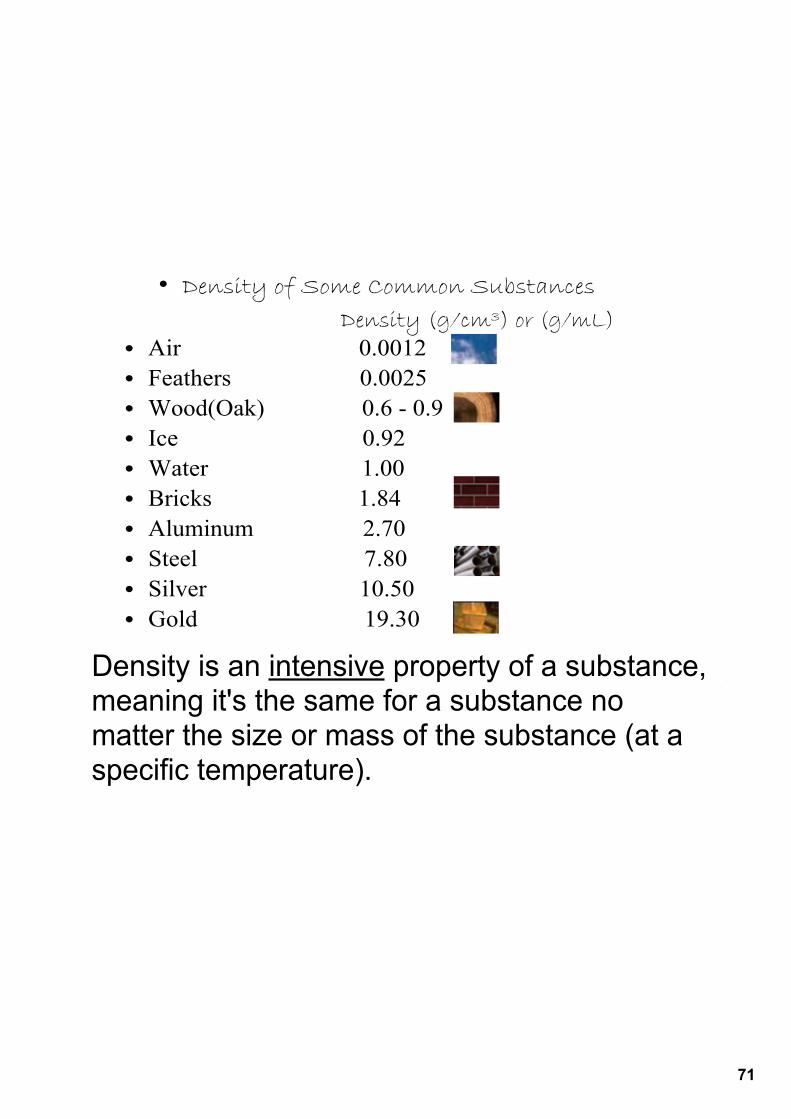
• Density of Some Common Substances Density (g/cm3) or (g/mL) • Air 0.0012 • Feathers 0.0025• Wood(Oak) 0.6 0.9• Ice 0.92 • Water 1.00 • Bricks 1.84• Aluminum 2.70• Steel 7.80• Silver 10.50• Gold 19.30
7
Density is an intensive property of a substance, meaning it's the same for a substance no matter the size or mass of the substance (at a specific temperature).
72
Density and Temperature• Is density temperature dependent?
8
73
• As a substance’s temperature increases, the molecules move faster and space out, therefore density ( mass in a given volume).• As a substance’s temperature decreases, the molecules move slower and pack in, therefore density ( mass in a given volume).• For most substances, density is ranked as follows phase > phase > phase
9
74
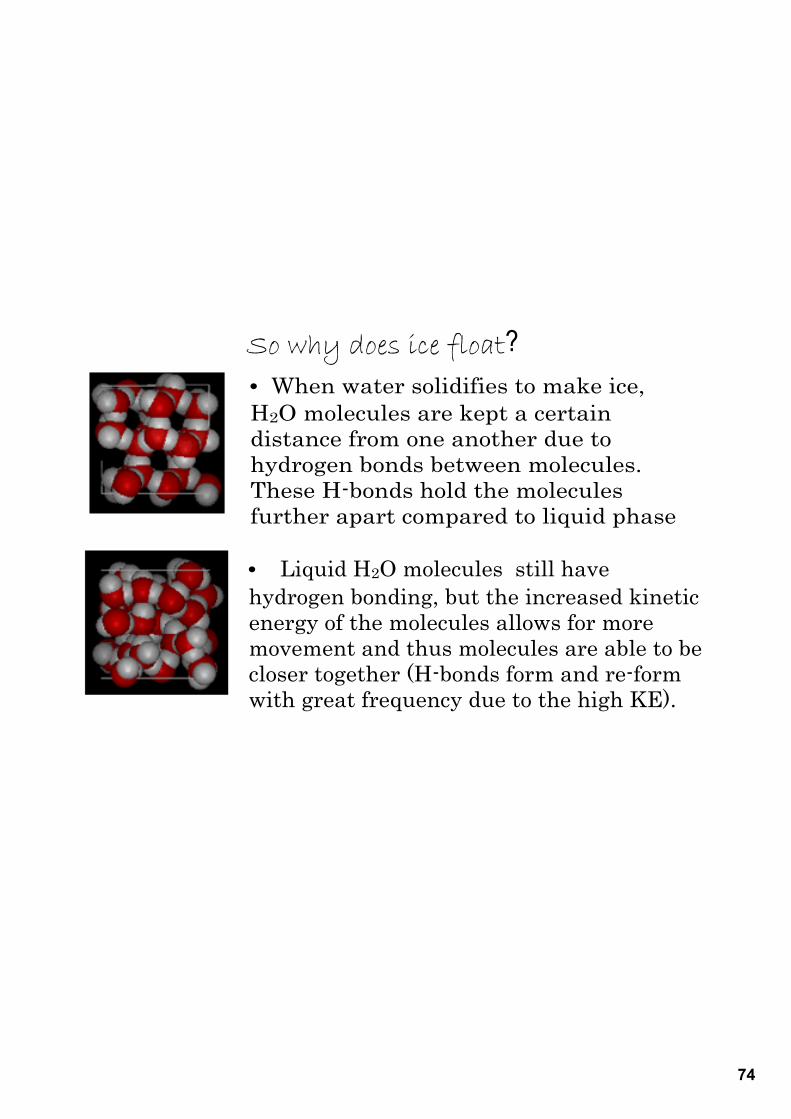
• When water solidifies to make ice, H2O molecules are kept a certain distance from one another due to hydrogen bonds between molecules. These Hbonds hold the molecules further apart compared to liquid phase
• Liquid H2O molecules still have hydrogen bonding, but the increased kinetic energy of the molecules allows for more movement and thus molecules are able to be closer together (Hbonds form and reform with great frequency due to the high KE).
So why does ice float?
75
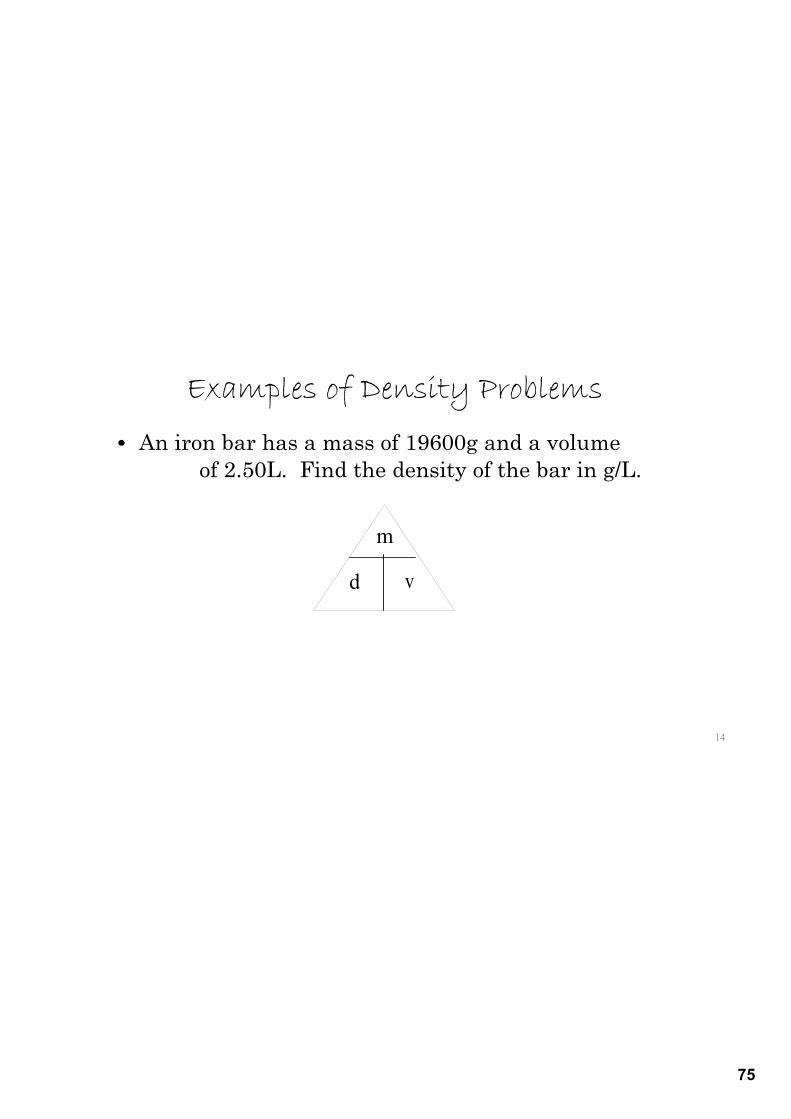
Examples of Density Problems
14
• An iron bar has a mass of 19600g and a volume of 2.50L. Find the density of the bar in g/L.
m
vd
76
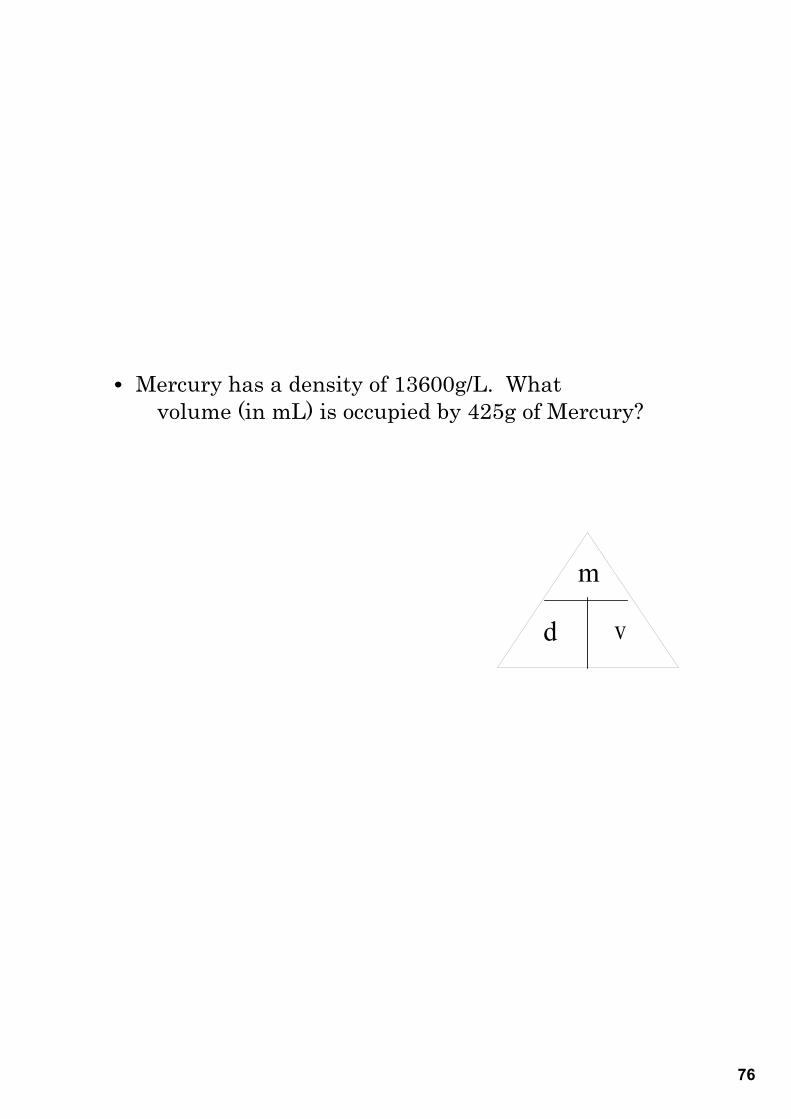
• Mercury has a density of 13600g/L. What volume (in mL) is occupied by 425g of Mercury?
m
vd
77
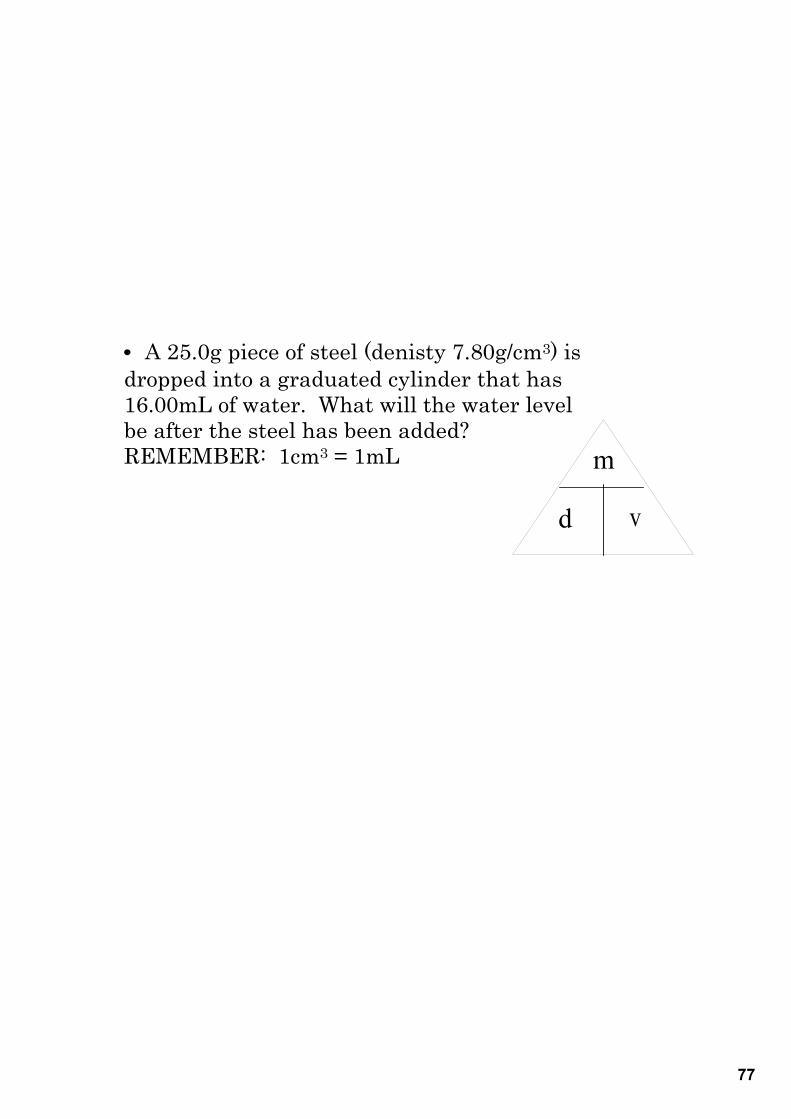
• A 25.0g piece of steel (denisty 7.80g/cm3) is dropped into a graduated cylinder that has 16.00mL of water. What will the water level be after the steel has been added?REMEMBER: 1cm3 = 1mL m
vd
78
15
Homework:
Density Worksheet
79
7. Determining Density from Graphs
80
• Density is defined as the mass of a certain volume of a substance.• Therefore, we can determine the density of a substance from experimental measurements of its mass and its volume
81
Graphing Terms• Independent Variable ‐ the variable that is manipulated as part of the experiment• placed on the x‐axis of the graph• In the following example, we manipulate the VOLUME of an unknown liquid.• Dependent Variable ‐ the variable that changes as a result of the independent variable changing• placed on the y‐axis (in this case, MASS)• as we change the volume (x value) of the unknown liquid, the mass (y value) will change
82
• Slope ‐ mathematical relationship between the x and y variables on a linear graph• “steepness” of the graph
slope =
83
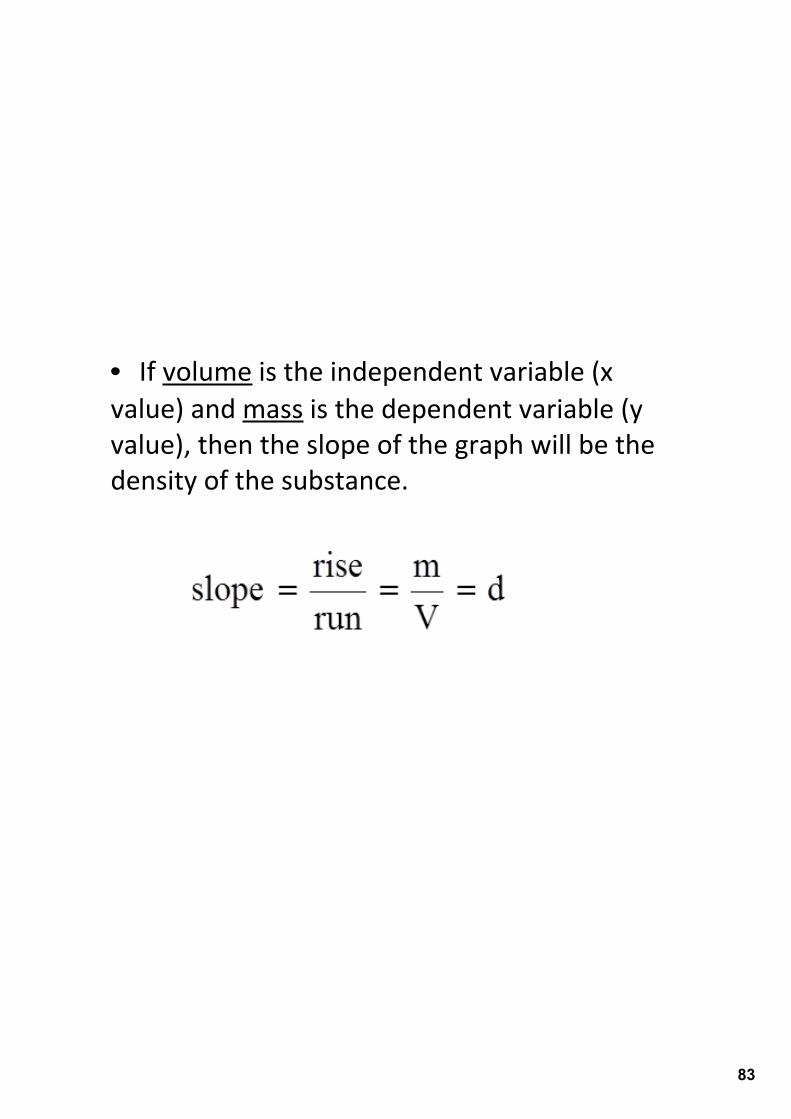
• If volume is the independent variable (x value) and mass is the dependent variable (y value), then the slope of the graph will be the density of the substance.
84
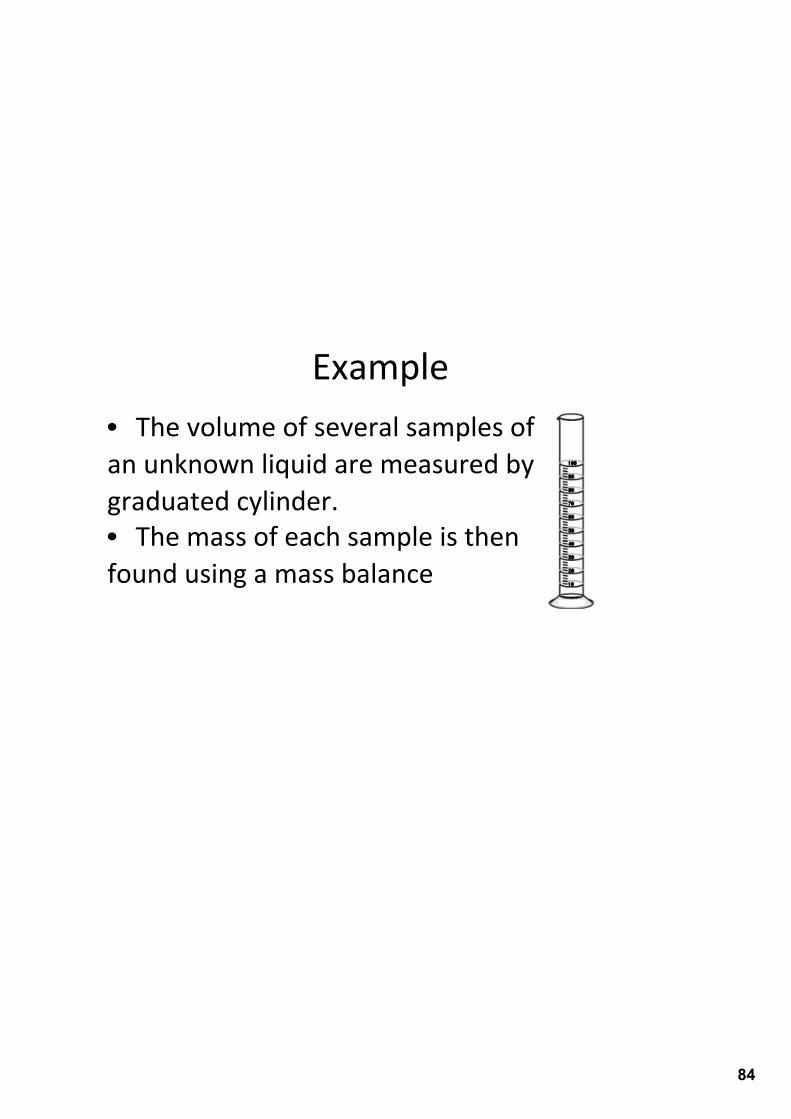
Example• The volume of several samples of an unknown liquid are measured by graduated cylinder.• The mass of each sample is then found using a mass balance
85
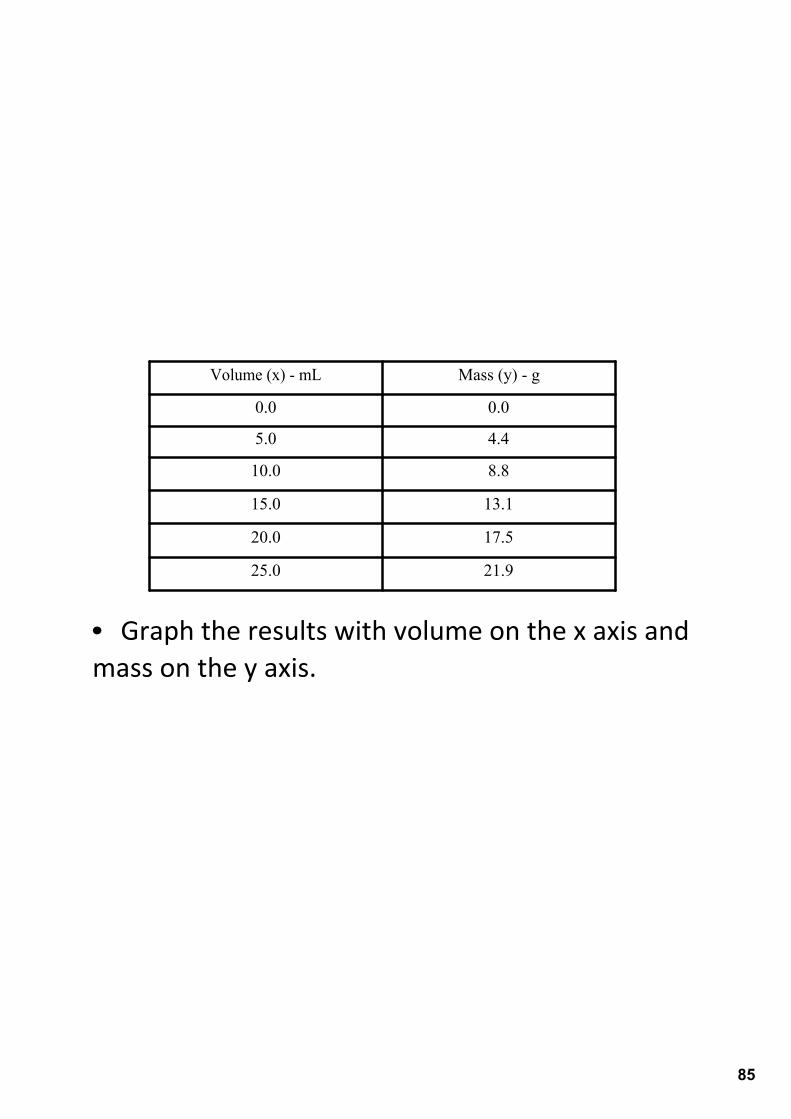
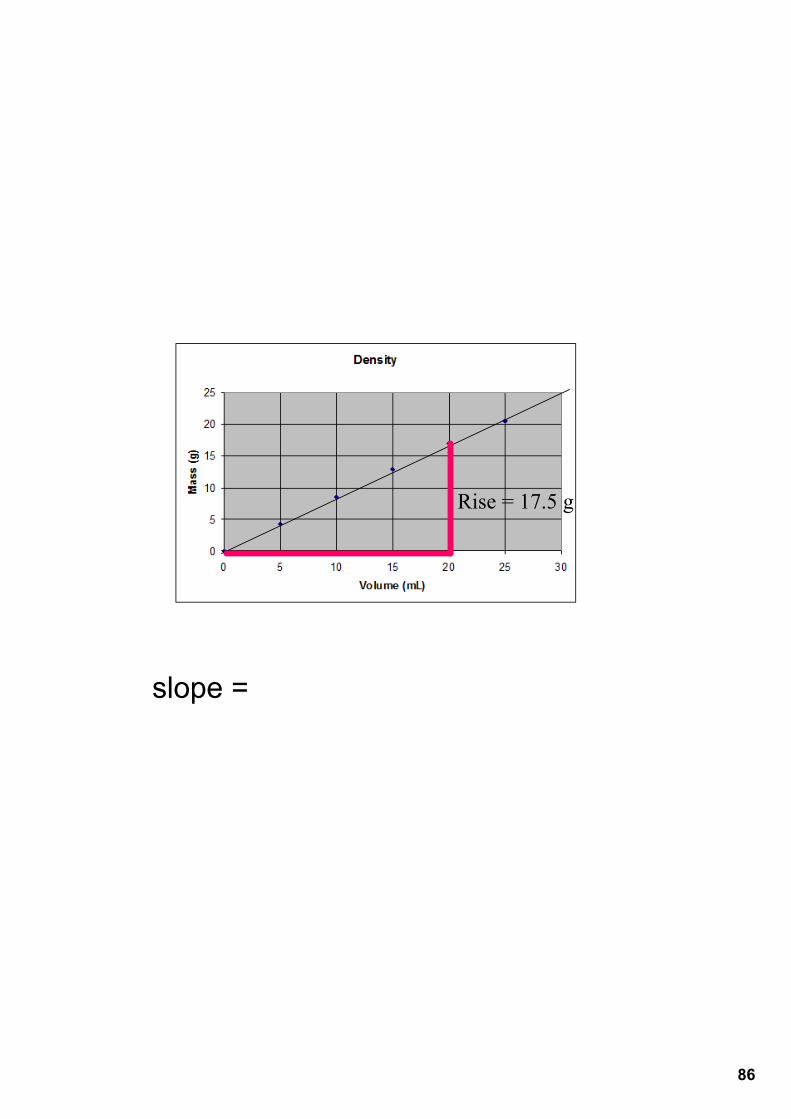
• Graph the results with volume on the x axis and mass on the y axis.
Volume (x) mL Mass (y) g
0.0 0.0
5.0 4.4
10.0 8.8
15.0 13.1
20.0 17.5
25.0 21.9
86
Rise = 17.5 g
slope =
87
Density (from slope﴿
• From the graph, the density of the unknown liquid would be:
• d = 0.875 g/mL
• liquid air (air cooled down to liquid state) has a density of 0.875g/mL at ‐200 degrees C
88
Homework:
Density Graphing Worksheet