7 Essential Elements of Demand Forecasting, …...7 Essential Elements of Demand Forecasting,...
23
© Blue Ridge Solutions, Inc. All rights reserved. Proprietary and confidential. www.blueridgeglobal.com | 210 Interstate North Parkway SE Ste. 750 Atlanta, Georgia 30339 | O: 877-547-0346 7 Essential Elements of Demand Forecasting, Planning & Replenishment
Transcript of 7 Essential Elements of Demand Forecasting, …...7 Essential Elements of Demand Forecasting,...
© Blue Ridge Solutions, Inc. All rights reserved. Proprietary and confidential.
www.blueridgeglobal.com | 210 Interstate North Parkway SE Ste. 750 Atlanta, Georgia 30339 | O: 877-547-0346
7 Essential Elements of DemandForecasting, Planning & Replenishment
www.blueridgeglobal.com | 210 Interstate North Parkway SE Ste. 750 Atlanta, Georgia 30339 | O: 877-547-0346
7 Essential Elements of Demand Forecasting, Planning & Replenishment
INTRODUCTION
This document is for people who make decisions about forecasting, replenishment, and supply chain management in distribution and retail organizations.
The document provides a high-level view of processes and principles that can increase revenue and profit, improve cash flow and reduce operating costs by improving your forecasting and replenishment.
It attempts to fill the gap between the relatively small number of people formally trained in the principles of supply chain management and the majority who have not.
Whether you are a business owner or investor, a financial executive, a supply-chain manager or a hands-on forecaster or replenishment professional, this guide should help you see the opportunity for managing replenishment decisions more effectively.
The advice in this paper is useful whether or not you buy a replenishment system from Blue Ridge. While systems from Blue Ridge provide a reasonably priced and cost-effective way to automate the processes and principles explained here, you may be able to master and execute many of the principles in other ways.
If you decide to buy a forecasting and replenishment system, this guide can help you create a list of important functional capabilities to seek as you evaluate your alternatives.
THE ROLE OF INVENTORY IN RETAIL AND DISTRIBUTION The value you offer your customers is to provide them goods for which...
• Consumers appreciate the balance of product availability, customer service and cost.
• There are many consumers, each of whom has a relatively small requirement.
• Manufacturers won’t source directly to consumers, or in the case of distributors to retailers or operators.
• Would be cost-prohibitive to buy directly from the manufacturer because of their relatively low volume.
• Lead times would be too long from a source other than your company
Your customers may buy from you, in part, because you offer information, insight, merchandising, training, or other value-added services. But inventory is at the core of the value you offer your customers. It’s what goes on the receipt when they give you their money...it’s also the opening for all of your future opportunities with the customer.

7 Essential Elements of Demand Forecasting, Planning & Replenishment
Your inventory is also likely to be both your biggest cost and at least one of your biggest physical assets, if not the biggest. Fortunately, it’s the one asset over which you can exercise the most control.
For all of these reasons, inventory provides your best leverage to manage your business for higher revenue and profit.
FORECASTING AND REPLENISHMENT AS A DISCIPLINE
Innovators at IBM began studying “inventory management” as a science decades ago, before the broad acceptance of computer solutions. This original science has since been refined into specific niches, such as forecasting and replenishment, inventory optimization, broader supply chain management and others.
One IBM manager, Anders Herlitz, first documented a best-practice process to manage inventory for consistent product availability and cost- minimization. While significant process complexities have been discovered, and decades of ever-advancing solutions have been applied, the principles of Herlitz’ discovery still apply today. They form the foundation on which any company can better understand and manage their supply chain challenges.
www.blueridgeglobal.com | 210 Interstate North Parkway SE Ste. 750 Atlanta, Georgia 30339 | O: 877-547-0346
SEVEN ESSENTIAL ELEMENTS
Herlitz identified seven principles that are necessary to apply at an individual SKU and location level to assure optimal demand fulfillment via replenishment:
1. Demand Forecast Accuracy. First it must be accurately determined how much your customers will buy.2. Lead-Time Forecasting. Then accurately identify how long it takes to get the goods from your sources of supply.3. Order-Cycle Optimization. Next determine how much inventory you should carry between orders, by balancing your cost of carrying inventory against the cost of acquiring inventory.4. Service-Level Strategy. Determine the level of in-stock performance you desire each of your SKUs to achieve.5. Replenishment Planning. Build the basic orders to cover base demand and achieve your SKU/location specific service-level goals. 6. Special-Order Considerations. Determine the appropriate increase in order quantities to cover uplifts in demand due to promotions or other demand-shaping events, or due to forward buying or other profit generating purchasing opportunities.7. Order-Validity Assurance. Ensure that your orders are rounded to accomodate SKU rounding requirements; structured to meet supplier and logistics constraints; while assuring that inventory is positioned properly to assure product availability for future orders.
7 Essential Elements of Demand Forecasting, Planning & Replenishment
Each principle consists of multiple components. The following pages detail the principles and these components in sequence.
Among the biggest initial discoveries in these seven principles is the insight that all successful forecasting and replenishment professionals engaged all of the principles for every order placed. The best forecasting and replenishment professionals conducted them in the above sequence.
Therefore, it is necessary for a system that supports the forecasting and replenishment process to operate using at least these seven principles. Otherwise, these systems and the professionals that use them are inclined to follow an “intuitive” process that yields sub-par results.
THESE PRINCIPLES ASSURE SUCCESS...IGNORE AT YOUR PERIL Here are some of the ways forecasting and replenishment solutions can go wrong. If they don’t follow these principles systematically and in optimal order, they may:
• Omit important considerations that prevent applying a principle to enable best results
• Perform processes based on common practice or intuition that controvert the proven success of the seven principles
• Fail to apply one principle and thereby sub-optimize the information or process support required to effectively apply another
• Contradict the process foundation built in one principle by improperly applying a subsequent principle.
Your company may have experienced the pain of not employing these seven principles. Believe me, thousands have.
The omission or sub-optimization of any principle has a waterfall effect that causes not only stock outs, but also can at the same time cause unnecessary inventory, and logistics costs. This is a situation that many companies face.
Incomplete use or misuse of the principles makes it difficult to assess what factors lead to poor performance. Lack of clarity on cause, can leave companies scratching their heads in trying to get to the root of the problem, also making it nearly impossible to solve the problem.
In a seven principle environment, each principle leads to the next until an order is built that assures demand fulfillment, minimizes required inventory, and optimizes logistics costs. These seven principles still influence the structure and workflow of the best of modern forecasting and replenishment systems.
Though the seven principles have existed for decades, many forecasting and replenishment systems have been designed without incorporating all of these principles, or require the user to determine how and in what order to employ them. Such systems leave companies or implementation consultants who lack the proper depth of expertise to devise their own process and create their own workflow.
www.blueridgeglobal.com | 210 Interstate North Parkway SE Ste. 750 Atlanta, Georgia 30339 | O: 877-547-0346

7 Essential Elements of Demand Forecasting, Planning & Replenishment
Your current systems may not follow all of the principles described in these pages. Even so, you may be able to manually apply at least one, possibly more. The financial performance of your company will improve as your technology and processes engage more of these principles.
Additionally, by showing your forecasting and replenishment professionals how the seven principles guide them to perform to company goals more consistently and with less labor, you can help make their job more satisfying and enable your team to make your company more profitable.
ESSENTIAL 1: GENERATE ACCURATE DEMAND FORECASTS The first and most important element that must underpin each of the principles and sound supply chain performance is to accurately predict how much of each SKU you will sell from each stocking location. Or to be more accurate, you need a prediction of how much you could sell if you had each SKU in stock when a customer wants to buy it.
Demand forecasting is an easy concept to understand. However, many practical details can make it hard to do well. Here are several factors that complicate the process of demand forecasting:
• The number of forecasts you must generate
• Lumpy or erratic demand
• Trending demand
• Promotional/causal demand
• Seasonal or cyclical demand
• Human intuition and emotion
• Demand for new SKUs
The following sections address each in more detail.
EVERY SKU IN EVERY LOCATION MUST HAVE AN INDIVIDUAL FORECAST
Take the average number of SKUs you have in each location where you stock inventory. Now multiply it by the number of your stocking locations. This gives you your number of SKU/locations. If you stock 3,000 SKUs in each of 3 locations, you have 9,000 SKU/locations.
SKU/location count is important because it identifies the number of separate data elements that must be managed to create the required number of forecasts. Separate demand forecasts must be updated regularly for every SKU/location. No small task.
www.blueridgeglobal.com | 210 Interstate North Parkway SE Ste. 750 Atlanta, Georgia 30339 | O: 877-547-0346
7 Essential Elements of Demand Forecasting, Planning & Replenishment
As you increase the scale of your operation from hundreds of SKU/locations to tens of thousands or more, demand forecasting must be automated.
EFFECTIVE FORECASTS CONSIDER HISTORICAL AND CAUSAL DEMAND IMPACTS The process of generating demand forecasts is an exercise in statistics and probability. Today, Big Data and predictive analytics play a growing part in providing a precise and granular look at consumer/customer demand. While the assessment of this information requires complex and advanced algorithms, probability still plays a substantial part in generating a demand forecast. So even with a very detailed look at the causes for customers to purchase goods, there is still a measure of inaccuracy that must be dealt with.
Still today, human “empirical knowledge” (experience, or intuition) can come into play and introduce yet another factor, emotion, into the forecasting process. The reason that predictive analytics in fact have become so favored, is the ideal that the empirical data which drives humans can also drive technology, and without introducing the spectre of emotion or intuitive bias.
THE HIGHS AND LOWS OF FORECASTING TECHNIQUES
When a forecasting solution attempts to predict demand, either by looking at historical stochastic demand patterns, or by looking at the causal factors that impacted demand, it has inherent limitations that can impact the ability to produce an accurate, effective forecast. Below are the fundamental forecast approaches and their biases:
• Stochastic Forecast Approach. Assumes that demand is random. That demand follows some pattern that cannot be discerned in any way other than to calculate that pattern.
o Bias: Stochastic forecasting predicts from historic occurrence and projects that into the future. The presumption is that history is the only indicator of the future. This approach ignores that conditions in the market may have changed, and inherently eliminates the possibility that the cause for upcoming demand can be known and used to predict it.
• Causal Demand Effects. Assumes that some external effect impacted demand. That demand is driven by external factors such as price, availability, weather, popularity, etc.
o Bias: Causal Forecasting requires that all significant demand drivers (causal factors) be identified to be effective. The presumption is that significant causal factors can be identified and that the relative impact of each can be determined to predict demand.
• Empirical Forecast. Assumes that human experience, intuition and opinion can predict demand. This is often identified as “market knowledge.” The presumption here is that the people most closely in contact with the marketplace can best predict demand.
o Bias: Who are we kidding here? When human forecasters look at numbers, they must fight their constant tendency to react emotionally to what they see. They often lose the battle. For fascinating insight into human thought processes, you can’t do better than to read the book Thinking Fast and Slow, by Daniel Kahneman, winner of the Nobel Prize in economics.
www.blueridgeglobal.com | 210 Interstate North Parkway SE Ste. 750 Atlanta, Georgia 30339 | O: 877-547-0346
7 Essential Elements of Demand Forecasting, Planning & Replenishment
Assessing customer demand is more and more difficult today, due to a multitude of factors:
• Multi-channel retailing and the vast array of buying options available to consumers today
• Demand-shaping activities that you and your competitors conduct to try to entice customers to buy, buy now or buy more
• The relationships of items to and how one drives demand to another
A CAUSAL AND STATISTICAL APPROACH USING CUSTOMER TRANSACTION DATA GREATLY IMPROVES FORECAST ACCURACY You can see where stochastic forecasting falls short in today’s marketplace. Relational and causal factors can’t be accounted for by statistical forecasts that try to predict demand by analyzing data from the past. Yet today, demand is changing constantly. What drove customers to buy last month may not even be a consideration next month.
Causal forecasting techniques point out the factors that drive customers to buy, and determine the impact of various conditions that impact their decisions, like promotions, item relationships, display impact,
and even weather.
Independently, neither solution is comprehensive enough to produce accurate forecasts. However, advanced forecasting solutions solve this forecast dilemma by analyzing data at the customer transaction level. To the extent that causal factors cannot be identified, or don’t show substantial influence on demand, that portion of data is forecasted statistically.
By capturing transaction data, it is possible to get the best of both a statistical (stochastic) understanding of demand, and a causal understanding. Demand is segmented to apply the most effective technique to assure that the forecast is as accurate as the data will allow.
CAUSAL AND COMPLEX FORECAST CONSIDERATIONS
Each transaction has causal factors that may impact demand. These factors can be analyzed, and if significant can create a segmented forecast that represents not only the rate, pattern and trend of demand, but also the reason for it.
By accumulating each transaction and analyzing them deeply, advanced solutions can produce accurate forecasts by:
• Identifying which customer demand is relevant in predicting future demand
• Establishing the causal factors that impact customer demand, and their relative impact on the forecast
• Accounting for rate, pattern, randomness or trends in customer demand and how they impact the forecast
www.blueridgeglobal.com | 210 Interstate North Parkway SE Ste. 750 Atlanta, Georgia 30339 | O: 877-547-0346

Forecasting of demand for new SKUs with no history of sales presents special challenges. Because you have no direct customer demand data to guide your estimates, the forecast for new items must be derived by other means. One approach is to consult the forecast of predecessor or similar SKUs. Another is to identify items with similar characteristics, such as category, department, or class. This process can involve significant human intervention, but in advanced solutions can be supported with guidance from data.
It’s important to note that customer demand for an SKU may be erratic, seasonal, and trending at the same time, while also experiencing causal demand that impacts the forecast. Clearly, this is a situation that requires advanced forecasting techniques. There are solutions that can address this occurrence, and this is a great litmus test for solution selection.
A DEEPER DIVE: FUNDAMENTALS AND PITFALLS OF STATISTICAL FORECASTING Figure 1 shows four graphs for SKUs exhibiting different customer demand patterns for each SKU. In each graph, the vertical axis represents customer demand in units. The horizontal axis represents time. The orange line represents the demand forecast.
When talking about statistical demand, you can see that period-to-period demand varies within some range of the forecast, as shown by the green line in each. The shaded band shows the variability of customer demand for the SKU. Note that the bands vary in width, depending on range of customer demand variability of the SKU. The wider this band, the more unpredictable customer demand is, and the more safety stock needed in order assure fulfillment of customer demand.
With stable demand (upper left), customer demand is not trending up or down, and varies within a relatively narrow range. Customer demand for this item is very predictable.
FIGURE 1: Four Generic Demand Patterns
www.blueridgeglobal.com | 210 Interstate North Parkway SE Ste. 750 Atlanta, Georgia 30339 | O: 877-547-0346
7 Essential Elements of Demand Forecasting, Planning & Replenishment

7 Essential Elements of Demand Forecasting, Planning & Replenishment
With lumpy or erratic demand (upper right), customer demand varies period-to-period over a much wider range. Customer demand for this item is often highly unpredictable.
With trending demand (lower left), Variation in this case is fairly low, but the trend must be accounted for in the forecast. Customer demand is currently growing for this item.
With seasonal or cyclical demand, customer demand changes throughout the year. Demand follows a repeated and predictable pattern throughout the year. Variation from the pattern in this case is low. Customer demand is stable overall, but fluctuates throughout the year.
AVOID COMMON STATISTICAL FORECASTING METHODS THAT LEAD TO PROBLEMS Remember I said forecasting is simple in concept. We’ve identified that stochastic forecasting is not the complete answer, but it’s a start. Still, it is possible to do more harm than good if the forecasting technique is too simple. Some commonly used demand-forecasting approaches lead to inaccurate forecasts and improper levels of inventory:
• Simple and moving average
• Same period last year with a trending factor
• Best-fit algorithms
Simple and moving average forecasts take a static or moving average of demand and produce the forecast for the next period. The primary issues here are:
• The highs and lows of erratic demand are washed out by the average, and there is no measure of variability to help you determine safety stock need.
• The weighting of past demand doesn’t adjust fast enough to trends in customer demand.
• Perhaps most impactful, the lack of awareness to the seasonality of customer demand, causes it to trail the rising and falling seasonal customer demand, leaving your forecast too low going into a seasonal uplift, and too high coming out of a seasonal downturn.
This forecast type will misjudge demand most of the time. You’ll find yourself out of stock or overstocked much more often than with more sophisticated forecasting algorithms.
www.blueridgeglobal.com | 210 Interstate North Parkway SE Ste. 750 Atlanta, Georgia 30339 | O: 877-547-0346
The same period last year forecasting method looks at demand this same week (or month) last year and then applies a trending factor or an expected percentage change. There are many flaws in this method:
• This forecast method is almost impossible to be accurate on an item-by-item basis, as patterns and trends are different by SKU and location.
• If sales of an SKU are changing more or less than the trending factor chosen, forecasts will be consistently wrong.
• If your sales for the period last year were unusually high because of a big sale that’s not likely to occur at the same time this year, your forecast will be too high. If a demand-influencing event such as Easter moves forward by a week this year compared to last, you won’t be ready for the increase in demand when it arrives.
The inaccuracy inherent in applying universal or categorical customer demand patterns and trends will cause constant overstocks or stock outs depending on the actual pattern and trend in customer demand by item.
THE “BEST-FIT” MYTH A forecasting system that uses best-fit forecasting methods will try each of several algorithms and will automatically choose the one that produces the lowest possible forecast error.
• Because the goal of best-fit algorithms is to mimic historical demand variations as closely as possible, these techniques tend to understate the variability of customer demand.
• Best-fit algorithms completely ignore the possibility that changes in customer behavior or causal factors can impact the forecast. To best-fit, history is the only indicator of the future.
• Best-fit algorithms use fixed variables (alpha, etc.) to “fit” historic demand patterns. So in fact you’re not getting 21 (or whatever number promised) forecasting techniques, you’re getting 5 to 7 with different fixed variables set in each one.
The issue with the presumption of best-fit algorithms and their fixed variables is that these techniques try to fit the past. The method’s inherent understatement of demand variability can cause insufficient safety stock where customer demand is truly erratic and unpredictable. This technique has no view to the changing conditions of the future, such as customer demand trends, new customer behavior and can be inaccurate representing seasonality. So, while best-fit is very accurate at “predicting” the past, if the past doesn’t look exactly like the future, it produces an inaccurate forecast.
ESSENTIAL 2: FORECAST LEAD TIMES- INTERNAL AND EXTERNAL
All sound technologies that conduct replenishment somehow account for lead time in calculating the timing of replenishment orders. However, it requires a solution focused on a complete replenishment process to forecast lead time. The value of forecasting lead times is simple but not widely understood.
www.blueridgeglobal.com | 210 Interstate North Parkway SE Ste. 750 Atlanta, Georgia 30339 | O: 877-547-0346
7 Essential Elements of Demand Forecasting, Planning & Replenishment
ACCURATE LEAD TIME PREVENTS STOCKOUTS All suppliers specify standard lead times, and sometimes they specify different lead times by shipping location or by product group. If your systems maintain good SKU-master or supplier-master data, you probably have this lead time information in some system. If your systems are well integrated, you feed the supplier lead times to your replenishment system.
With an accurate lead time forecast, replenishment will be much more effectively timed.
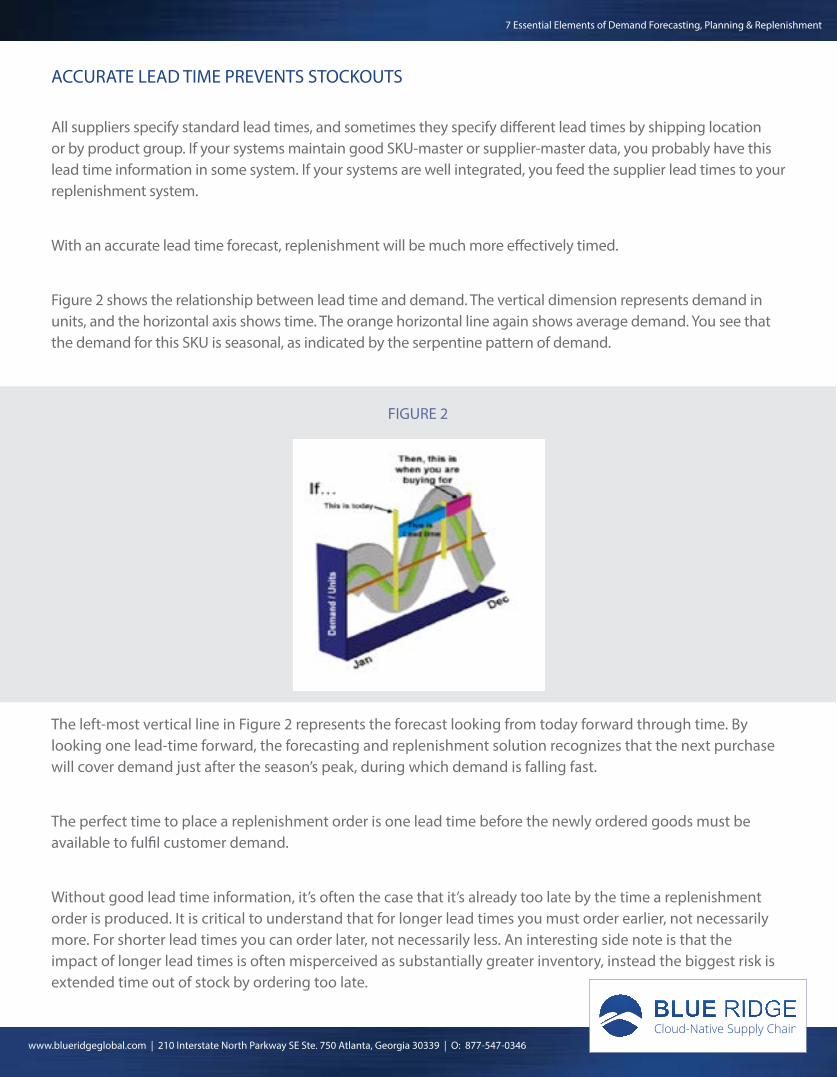
Figure 2 shows the relationship between lead time and demand. The vertical dimension represents demand in units, and the horizontal axis shows time. The orange horizontal line again shows average demand. You see that the demand for this SKU is seasonal, as indicated by the serpentine pattern of demand.
The left-most vertical line in Figure 2 represents the forecast looking from today forward through time. By looking one lead-time forward, the forecasting and replenishment solution recognizes that the next purchase will cover demand just after the season’s peak, during which demand is falling fast.
The perfect time to place a replenishment order is one lead time before the newly ordered goods must be available to fulfil customer demand.
Without good lead time information, it’s often the case that it’s already too late by the time a replenishment order is produced. It is critical to understand that for longer lead times you must order earlier, not necessarily more. For shorter lead times you can order later, not necessarily less. An interesting side note is that the impact of longer lead times is often misperceived as substantially greater inventory, instead the biggest risk is extended time out of stock by ordering too late.
FIGURE 2
www.blueridgeglobal.com | 210 Interstate North Parkway SE Ste. 750 Atlanta, Georgia 30339 | O: 877-547-0346
7 Essential Elements of Demand Forecasting, Planning & Replenishment
Many companies have seen that the natural tendency when replenishment professionals see they’re late in placing an order, is to react by purchasing more, when often there is no chance of recovering the demand that will occur while out of stock during the lead time. So often, those sales are lost forever.
MEASURE LEAD TIME VARIABILITY FOR PROPER SAFETY STOCKS Like demand, lead times tend to vary. You know they vary by supplier, and they often vary by SKU. Lead times also frequently vary by sourcing or receiving location and by time of year. These conditions occur frequently, and yet many companies underestimate the impact of these variations on replenishment effectiveness.
If supplier lead time or fill-rate performance is erratic from SKU to SKU or from order to order, it is necessary to maintain more safety stock as a hedge against lead time uncertainty.
Complete replenishment solutions automatically determine how much safety stock is required to compensate for the likely range of lead-time variation by supplier and SKU.
TRACK ACTUAL LEAD TIME PERFORMANCE BY SUPPLIER, ORDER AND SKU/LOCATION
The first step toward understanding lead time and lead time variation is to track actual lead time performance. To do this, each purchase order must be analysed to capture lead time data by supplier, shipping location, receiving location and SKU.
Lead time must be reviewed constantly to detect changes over time. This isn’t as hard as it may sound. Integration and revision of this data can be automated with advanced solutions to minimize the need for replenishment professionals to intervene.
LEAD TIME FORECAST MUST ACCOUNT FOR PARTIAL SHIPMENTS
Special considerations need to be undertaken when a partial order is received. Incomplete receipt quantities occur due to the supplier’s lack of availability on certain SKUs, picking, packing or quality errors, damage, theft, inaccurate receiving, or a multitude of other mishaps.
Clearly all of these situations, whether caused by the supplier or not, will affect your ability to fill your own customer orders. To build good replenishment orders, a solution must account for all the factors that affect your total actual lead times.
If you receive partial or damaged orders, the number of units for each SKU that did arrive must be identified. Additionally, the units that arrive damaged or on a backorder shipment must be counted.
www.blueridgeglobal.com | 210 Interstate North Parkway SE Ste. 750 Atlanta, Georgia 30339 | O: 877-547-0346
7 Essential Elements of Demand Forecasting, Planning & Replenishment

ACCOUNT FOR INTERNAL LEAD TIMES While it’s important to track and analyze supplier lead time performance, that is only part of the picture. To be sure you order in time to meet demand, your company’s receiving and putaway time must also be known.
Many factors can impact internal lead time. For example, a supplier with hundreds of tiny SKUs can be a slow process that can adversely affects the performance metrics of your receiving team. Due to this, many companies experience a delay in receiving such a purchase order until the receiving department has slack time.
Many companies and even some replenishment solutions don’t segment lead time to account for how long it takes to receive and stock the goods ordered. This can lead to poorly timed orders and ultimately stockouts.
ESSENTIAL 3: DEFINE OPTIMAL ORDER FREQUENCY When you place an order with a supplier, should you buy enough units to cover a weeks’ demand? Two weeks? A month? The answer depends on how often you usually buy from each supplier. Just about any replenishment solution can order a specified time-supply of goods to cover demand between orders. This is a common capability.
COVERING DEMAND WHILE MINIMIZING COSTS MEANS PROFIT
Covering demand can be done by many systems, though sometimes inefficiently and at excessive cost. However, advanced replenishment systems determine the optimal time supply that should be purchased on each order to achieve the lowest cost combination of inventory carrying and acquisition costs while covering demand between orders.
By balancing the cost of placing orders against the cost of carrying inventory, the solution can determine the most economically beneficial order frequency, or order cycle, for replenishing each SKU and supplier line.
Let’s consider an example. Say one of your vendor lines consists of 40 SKUs with combined annual sales of $100,000. Your cost to carry the inventory is 30% per year, and your internal cost to place and process each order is $20. You pay an additional $1.50 of internal cost, on average, to receive each SKU line on the order.
Figure 3 shows the relationship between inventory carrying costs and the costs related to cutting purchase orders and receiving goods. The vertical axis represents cost and the horizontal axis represents time supply purchased per order; from 1 day’s supply, or 365 orders per year, to 365 day’s supply or one order per year.
www.blueridgeglobal.com | 210 Interstate North Parkway SE Ste. 750 Atlanta, Georgia 30339 | O: 877-547-0346
7 Essential Elements of Demand Forecasting, Planning & Replenishment

FIGURE 3: Total Inventory Cost at Varying Order Frequencies
Looking at the graph, we note the following:
• The PO and receiving costs (red curve) go down as the size of orders increases and the number of orders placed and received in a year decreases.
• Inventory carrying cost for cycle stock (green line) increases with the as the size of orders increases.
• Total inventory cost (blue line) is the sum of carrying cost and PO and receiving cost at each order time supply level. It is lowest near the intersection of the carrying cost and PO & receiving cost lines.
In this example, we see that gross purchases -- the total amount expected to be ordered from the vendor within a year – remains constant because this vendor offers no discounts. You should expect advanced replenishment-focused solutions to consider such discounts in identifying optimal order cycles.
This economic model identifies how much time supply should be purchased on an average order to achieve the lowest combination of costs.
It is also necessary to identify the most economical quantity of each individual SKU in a supplier line. Here’s one key: each SKU order quantity should cover at least the amount of time between orders for the entire supplier line. Seems silly to say that, but without employing the seven principles, many companies make the painful mistake of ordering too little and pay the price with stockouts and/or fill-in orders.
Once every item covers at least the time between orders, there are benefits that occur by identifying each items’ economic order quantity (EOQ). The EOQ will identify when the optimal order quantity for an SKU is greater than the time between, supplier orders. By ordering these items less often than the entire supplier line, logistics costs can be minimized.
www.blueridgeglobal.com | 210 Interstate North Parkway SE Ste. 750 Atlanta, Georgia 30339 | O: 877-547-0346
7 Essential Elements of Demand Forecasting, Planning & Replenishment

ESSENTIAL 4: MANAGE SERVICE LEVEL AND SAFETY STOCK POLICY Once demand variables, lead times and ideal order frequency are known, the amount of safety stock that is required to assure product availability can be determined. Safety stock is “just-in-case” inventory carried to protect against demand variability, delays due to lead time performance, or other occurrences that can impact product availability. Safety stock is a kind of insurance policy to help ensure that you achieve your desired level in-stock performance.
THE BOTTOM LINE ON SAFETY STOCK To achieve better in-stock performance (or order-fill rates), any solution must account for variables that can impact demand and supply. More safety stock is also required if those demand and supply variables are more erratic or unpredictable. Figure 4 illustrates that you must maintain inventory at higher levels as your fill-rate goals increase.
Today your company may set safety-stock levels by using rules of thumb. For example, you may carry a number of days of supply for each SKU, based on its ABC ranking, or demand forecast range.
For example, you may decide to carry ten days’ supply of inventory for your ‘A’ SKUs; seven days for your ‘B’ SKUs; and three days for your ‘C’ SKUs. This method, often touted by supply chain consultants, is convenient and labor-efficient, but it is also inaccurate and can be expensive. Here’s why:
• Here’s a shocker for most companies; “A” SKUs often have the most predictable demand, and are purchased more often and in larger quantities. Therefore they require fewer days of supply in safety stock. So carrying more days of safety stock on faster movers can dramatically swell your inventory.
• You may have too broad a range of SKUs defined as “A”. Many companies find that among ‘A’ SKUs, the range of demand can be vastly different. Causing both excessive inventory on the fastest moving A’s and stockouts on the less rapid and less predictable A’s.
FIGURE 4: Relationship of In-Stock/Fill-Rate Goals and Safety Stock Requirements
www.blueridgeglobal.com | 210 Interstate North Parkway SE Ste. 750 Atlanta, Georgia 30339 | O: 877-547-0346
7 Essential Elements of Demand Forecasting, Planning & Replenishment
Let’s consider an example in automotive retail:
• Antifreeze is an “A” SKU. There are only 2 SKUs of antifreeze and the fastest sells 14,000 units a week, with variability of about five percent. Antifreeze requires 3 days of safety stock.
• 20w-50 Motor oil is also an “A” SKU. But because motor oil has multiple grades (10w-40, 30w, etc.), it is not nearly as rapid or predictable as antifreeze. Let’s say it has average demand of 1,350 units a month and about 35 percent variability. 20w-50 requires 10 days of safety stock.
Based on this example, you can see that if you carry seven days’ supply of safety stock on both SKUs, you’ll be constantly overstocked on anti-freeze by about 8,000 cases, yet you’ll run out of oil when demand spikes.
The lesson here is this: Safety stock, like demand and lead times, should be based on the individual attributes of the SKU in a location. To avoid stockouts without excessive inventory, you must classify your SKUs more precisely than by A, B and C designations. Many companies find five classifications better than three, but individual service goals by SKU provide the ideal product availability and demand fulfilment.
ESSENTIAL 5: APPLYING THE FIRST 4 PRINCIPLES MAKES REPLENISHMENT SIMPLY ARITHMETIC Once the right demand, lead time, safety-stock level and order frequency for every SKU has been determined, the number of units required to meet future demand can be easily determined. It’s a straightforward calculation that involves a simple understanding of future demand vs. future inventory levels. The solution then assesses when to order and what quantity is necessary to assure product availability to fulfill upcoming demand.
OPTIMIZE TIMING, QUANTITY AND COST OF ORDERS
Order placement must be timed so orders arrive on your shelf, available to sell to your customers before you sell into safety stock. The order quantity itself must cover demand from its arrival to the next time an order will be delivered from the supplier.
To determine whether it is time to place an order, the stock status of every SKU must be assessed throughout the day. The solution then determines whether an order must be placed today to meet the fill-rate objective without incurring excessive costs (e.g., inventory carrying, expediting, etc.).
Because demand fluctuates, advanced replenishment systems, are flexible, with no need to order on fixed order cycles. There is plenty of benefit in ordering based on need rather than a schedule. It’s most cost- effective to place orders whenever your lead times, demand forecasts and on-hand inventory levels suggest that it’s time to order.
www.blueridgeglobal.com | 210 Interstate North Parkway SE Ste. 750 Atlanta, Georgia 30339 | O: 877-547-0346
7 Essential Elements of Demand Forecasting, Planning & Replenishment
CALCULATE AN ORDER FOR EACH SKU YOU’LL BUY
Today’s order needs to contain every SKU in the supplier line that requires immediate replenishment. Still, due to economics, not every SKU needs to be ordered every time we order from the supplier. We discussed this in Order Cycle Optimization above.
To accomplish fulfilling base demand with optimal economics, advanced solutions establish an “Order Trigger Point” (OTP, or something similar). This is the inventory level for the item at which you begin recommending quantities to be ordered. When the item reaches OTP, the “order cycle” quantity is ordered (plus any units of safety stock predicted to be sold before delivery). If an item does not reach its OTP, and won’t before the next order opportunity, it is not on this order.
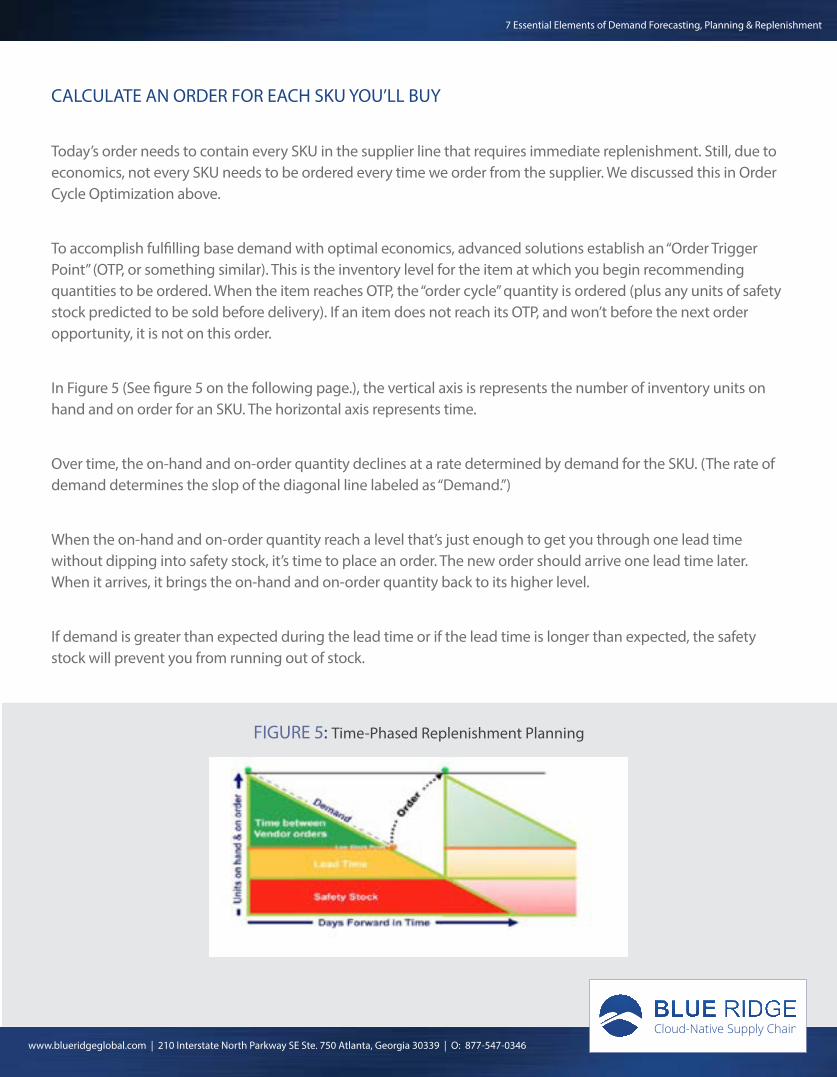
In Figure 5 (See figure 5 on the following page.), the vertical axis is represents the number of inventory units on hand and on order for an SKU. The horizontal axis represents time.
Over time, the on-hand and on-order quantity declines at a rate determined by demand for the SKU. (The rate of demand determines the slop of the diagonal line labeled as “Demand.”)
When the on-hand and on-order quantity reach a level that’s just enough to get you through one lead time without dipping into safety stock, it’s time to place an order. The new order should arrive one lead time later. When it arrives, it brings the on-hand and on-order quantity back to its higher level.
If demand is greater than expected during the lead time or if the lead time is longer than expected, the safety stock will prevent you from running out of stock.
FIGURE 5: Time-Phased Replenishment Planning
www.blueridgeglobal.com | 210 Interstate North Parkway SE Ste. 750 Atlanta, Georgia 30339 | O: 877-547-0346
7 Essential Elements of Demand Forecasting, Planning & Replenishment
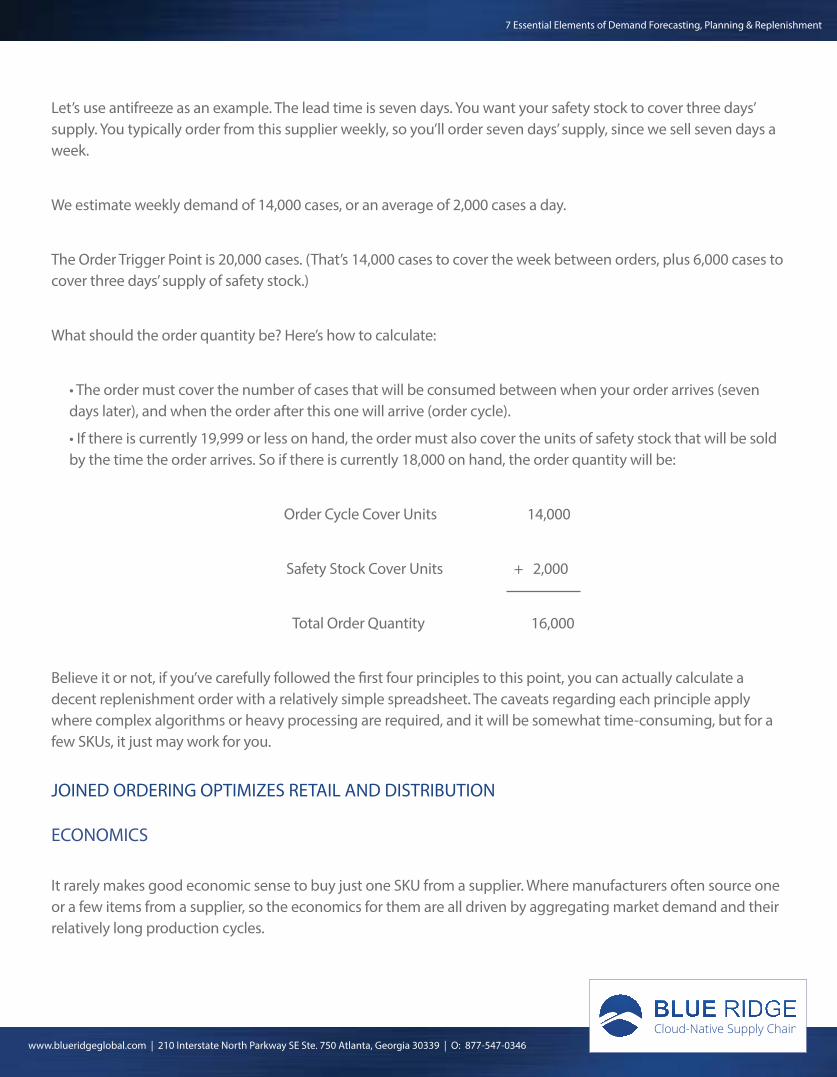
Let’s use antifreeze as an example. The lead time is seven days. You want your safety stock to cover three days’ supply. You typically order from this supplier weekly, so you’ll order seven days’ supply, since we sell seven days a week.
We estimate weekly demand of 14,000 cases, or an average of 2,000 cases a day.
The Order Trigger Point is 20,000 cases. (That’s 14,000 cases to cover the week between orders, plus 6,000 cases to cover three days’ supply of safety stock.)
What should the order quantity be? Here’s how to calculate:
• The order must cover the number of cases that will be consumed between when your order arrives (seven days later), and when the order after this one will arrive (order cycle).
• If there is currently 19,999 or less on hand, the order must also cover the units of safety stock that will be sold by the time the order arrives. So if there is currently 18,000 on hand, the order quantity will be:
Order Cycle Cover Units 14,000
Safety Stock Cover Units + 2,000
Total Order Quantity 16,000
Believe it or not, if you’ve carefully followed the first four principles to this point, you can actually calculate a decent replenishment order with a relatively simple spreadsheet. The caveats regarding each principle apply where complex algorithms or heavy processing are required, and it will be somewhat time-consuming, but for a few SKUs, it just may work for you.
JOINED ORDERING OPTIMIZES RETAIL AND DISTRIBUTION
ECONOMICS
It rarely makes good economic sense to buy just one SKU from a supplier. Where manufacturers often source one or a few items from a supplier, so the economics for them are all driven by aggregating market demand and their relatively long production cycles.
www.blueridgeglobal.com | 210 Interstate North Parkway SE Ste. 750 Atlanta, Georgia 30339 | O: 877-547-0346
7 Essential Elements of Demand Forecasting, Planning & Replenishment
For a retailer or distributor, addressing lower levels of customer demand, a single or even a few SKUs on an order drive purchasing and logistics costs prohibitively high. Retailers and distributors also typically have supplier order minimums or logistics constraints that are large relative to the demand covered by an individual order. In order to meet these economics and logistics constraints, inventory supply and costs must be spread across as many SKUs and units as possible on each order.
Advanced solutions assess which SKUs will need to be replenished not only immediately, but also before the next optimal opportunity to place an order.
This practice of ordering as many SKUs on a single purchase order as possible is known as “joined ordering.” In building joined orders, advanced replenishment solutions keep inventory balanced so that that all SKUs in a supplier line are likely to reach their lowest safe stocking level at the same time. This assures that many SKUs have need when building the next order, and reduces unnecessary costs.
Joined ordering helps ensure that orders today and in the future meet constraints such as supplier minimums or freight optimized orders. Joined ordering also avoids the necessity for placing expensive and time- consuming fill-in orders between regular cycles.
On a joined order, you buy every SKU that will have only safety stock (or will sell into safety stock) by the time the order is available for sale. If you don’t order it now, you’ll probably have place a fill-in order it between now and your next planned order. Joined ordering avoids excessive cost from sub-optimized logistics, fill-in orders, expediting and top-line risk from lost sales.
ESSENTIAL 6: ADJUST REPLENISHMENT ORDERS FOR SPECIAL CONSIDERATIONS
In addition to your normal replenishment orders, it’s possible you will have opportunities to consider special considerations, such as promotions, inventory-investment opportunities (forward buying) and the like. Here are some examples:
• You must buy additional quantities to support a special price your company has offered your customers.
• Your supplier has offered you a special price or has announced an imminent price increase. You want to buy additional quantities to increase your gross profit.
• You’ve negotiated a commitment to buy a specific volume from your vendor, and you must fulfill your commitment.
www.blueridgeglobal.com | 210 Interstate North Parkway SE Ste. 750 Atlanta, Georgia 30339 | O: 877-547-0346
7 Essential Elements of Demand Forecasting, Planning & Replenishment
It’s best to consider these factors after you’ve built orders to serve your “normal” demand. By doing so you can be sure of meeting your customers’ needs first; then you can separately evaluate the economics of any other considerations.
ESSENTIAL 7: ADJUST ORDERS TO MEET SUPPLIER AND LOGISTICS CONSTRAINTS
Much time, effort and money is put into the forecasting of demand, and rightfully so. However, assuring that an order meets supplier requirements and logistics constraints is an often overlooked need that is the final hurdle that each order must cross.
Meeting supplier and logistics constraints has far-reaching implications not only on this order but also on subsequent orders. Configuring the current order without jeopardizing future orders has very complex considerations that require advanced analytics. The complexity cannot be overstated and can wreak havoc on inventories if not managed properly.
INVALID ORDERS MEAN OUT OF STOCKS
We’ve established that proper timing of orders is critical to product availability. An order that is placed without meeting requirements can be held up in transportation, or rejected outright by the supplier until it is configured properly. Clearly, any delay in shipping undermines the entirety of the other six principles. That is why this principle, while often overlooked, is at least the second most important.
COMMON SENSE IS A PITFALL TO BUILDING VALID ORDERS
Let’s look at an example. Suppose the supplier requires a minimum order of $1,500. It’s time to order and the quantity needed to cover demand is $1,300. This leaves you $200 short of the minimum order.
To meet the supplier’s minimum, additional quantities must be added the order. The question is, what quantities of which SKUs are best to add?
What most people think is that “A” SKUs make the most sense to add to the order, because you sell the excess inventory the fastest. Common sense suggests that these would be the best SKUs to add. But they are not.
What happens to subsequent orders when your replenishment professionals do what common sense tells them?
www.blueridgeglobal.com | 210 Interstate North Parkway SE Ste. 750 Atlanta, Georgia 30339 | O: 877-547-0346
7 Essential Elements of Demand Forecasting, Planning & Replenishment
REPLENISHMENT IS A BALANCING ACT
Let’s look ahead to the next order cycle. It’s time to order again, and now replenishment analysis determines that $1,100 is required on this order to meet customer demand. This is because $200 extra was ordered last time.
The order must be placed now to meet service-level goals, because several “B” SKUs are low on stock. To meet the supplier minimum on this order, logically, a person would move further down the list of “A” SKUs. $400 worth of additional inventory is added to reach the minimum of $1,500.
You can see where this cycle leaves you. Soon you have so much stock in “A” SKUs that you have to skip an order. Now you run out of stock on “B” and “C” SKUs. Here comes the noise over stockouts. And your replenishment professionals are likely to respond to stock outages emotionally, by buying too much on the next order cycle.
With the right tools, you can avoid this situation and make sure you meet service on every SKU. Whenever you must build an order to meet a supplier minimum, advanced solutions add the same amount of days’ supply to every SKU on the order. This approach keeps the line balanced. This assures that future orders meet minimums and achieve service-level goals. And the SKUs in this supplier deplete to their order trigger point at about the same time.
Because this method uses time supply rather than units, the impact to inventory is equal in inventory risk, and doesn’t build excessive inventory of slower-moving SKUs. If you add a 30-day supply of an SKU that sells just one unit a month, you add only one more unit.
When a well-balanced order that fits the supplier’s order requirements for paid freight, pallets, layers, truckloads, cube, etc., the order is ready to release the supplier. With all of the previous principles sound and this final validation applied, you can be confident that the order quantities will meet customer demand and that your supplier will accept and will ship your order.
ONE FINAL ESSENTIAL ELEMENT: REPEAT CONSTANTLY AND CONSISTENTLY
With your process solidly established via the prior seven principles, it is only necessary to constantly evaluate current and projected inventory availability, demand and lead-time forecasts. Other aspects of the process, like service-level policy, safety-stock needs and optimal order frequency are driven by the forecast, and in advanced systems are addressed automatically. So, unless something dramatic changes in your relationship with a supplier, or your goals for service attainment, you can address many components of the principles on an exception basis.
www.blueridgeglobal.com | 210 Interstate North Parkway SE Ste. 750 Atlanta, Georgia 30339 | O: 877-547-0346
7 Essential Elements of Demand Forecasting, Planning & Replenishment

Many companies have seen that even a team of hundreds of forecasting and replenishment professionals can’t possibly apply the seven principles for every SKU/location constantly without the assistance of technology. However, technology solutions can address these principles in a real-time manner, bringing predictability and responsiveness to your business that you have likely not seen to this point.
WHY DOESN’T EVERYONE DO FORECASTING AND REPLENISHMENT THIS WAY?
Sophisticated demand-forecasting solutions that include a complete solution for replenishment are rare, but have been available for decades. Why, then, do less than 10% out of the hundreds of thousands of retail and distribution businesses use such technology?
Here are some common reasons:
• Many companies see forecasting alone as the solution to their sales and inventory issues. While forecasting is the most foundational element, it is only a foundation. As you’ve seen through the seven principles, there is much more to a complete replenishment and planning solution.
• Although inventory is usually the largest asset of any retail or wholesale company, few top executives in distribution or retail organizations have a clear understanding of how valuable accurate forecasting, along with complete replenishment planning is as a source of revenue and profit growth.
• Because this type of technology has been focused at manufacturers and tier-one retailers and distributors, the technology has been too costly, too difficult to put into practice, and too risky for businesses to implement and use.
NEW TECHNOLOGIES REDUCE THE COST BARRIER
In the past few years, several providers have offered solutions that focus on the needs of retailers and distributors outside the top tier. With the sophisticated capabilities of lower-cost technologies and new delivery methods like Cloud solutions, more companies can now leverage the seven principles proven to bring forecasting and inventory success.
The emergence of software-as-a-service (or SaaS) Cloud solutions enable even companies of any size to forecast more accurately and manage their inventory more effectively and with greater labor and economic efficiency.
Even with all of the data, technology, and analytics available, demand forecasting and replenishment planning still involves an element of art. Forecasting and Replenishment professionals are today a key to the success of any company. In addition to offering Cloud technology solutions, any provider must be able to communicate with, enable, motivate and develop the skills of the team that operates the solution.
www.blueridgeglobal.com | 210 Interstate North Parkway SE Ste. 750 Atlanta, Georgia 30339 | O: 877-547-0346
7 Essential Elements of Demand Forecasting, Planning & Replenishment
Because of our extensive domain expertise...many of our team have held the role... and the experience of thousands of implementations, Blue Ridge can provide targeted solutions that address these seven principles. But of equal value is our LifeLine service that helps guide your forecasting and replenishment professionals to sharpen their skills, insight and processes through education, training and coaching programs that are included in your subscription.
Many companies today are concerned about the adoption rate of new solutions, and considering the history of software implementations, rightfully so. Leveraging our experience in implementing thousands of successful companies, our implementation approach and LifeLine assure that your forecasting and replenishment professionals not only have the right tools and support to make consistently better decisions, but also are evaluated, enabled and certified to improve management of your inventory investment, and contribute ever-increasing value to your company’s revenue growth, profit and cash flow.
If you would like to learn more about Blue Ridge or how new levels of visibility and precision in demand forecasting can benefit your entire supply chain and operations, please contact a member of our team at [email protected] or visit us on the web at www.blueridgeglobal.com.
ABOUT BLUE RIDGE
For use by progressive retail and distribution companies, Blue Ridge’s cloud-native supply chain planning solutions dramatically improve the ability to increase revenue and deliver superior customer experiences. The company’s technology disrupts the two-decade-old model established by client-server based software systems that cannot provide the real-time analysis and recommendations essential for more accurate and predictive inventory planning. Blue Ridge offers the first enterprise-class supply chain planning solution, built in the cloud with 24/7 proactive real-time monitoring of supply chain performance and activity. This solution predicts more precisely and responds more quickly to changing inventory demands than legacy supply chain solutions that rely on antiquated software architectures. Blue Ridge’s demand-driven solutions help improve inventory performance and optimize inventory investments to positively impact the bottom line. The solution is scalable to the most complex supply chains, and ninety five percent of Blue Ridge distribution customers are fully operational in less than 90 days. For more information, please visit www.blueridgeglobal.com.
www.blueridgeglobal.com | 210 Interstate North Parkway SE Ste. 750 Atlanta, Georgia 30339 | O: 877-547-0346
7 Essential Elements of Demand Forecasting, Planning & Replenishment