Ill/$5311: vvith biopotential measurements, thereby signi?cantly

7 AD-A168 881 IN VITRO COMPRISON OF ZINC PHOSPHATE
AND GLASS /
IONOMERS ABILITY TO INHIB (U) AIR FORCE INST OF TECHWRIGHT-PATTERSON AFB OH D J COPENHAVER AUG 85
UNCLASSIFIED RFIT/CI/NR-85-141T F/G 6/5 NLEEEEEEEEEEEEEEEIhEEEEEEEEEEEEEEEEEEEEEE-IHE,....iia/

6 1j21=.
1111 1112.0
111ii ,_..o ooI
11111.5I1. 25 11111"---4 ra .6
MICROCOPY RESOLUTION TEST CHARTNATIONAL BUREAU OF STANDARDS- 963-A
:.Y'~:~ ;.-

|INCI ASSSECOHIIY CLASSIFICATION OF THIS PAGE (*hen I)oea I.nltod)i
READP INSTRUCTIONSREPORT DOCUMENTATION PAGE BEFOH COMPLETING FORM
1. REPORT NUMBER 2. GOVT ACCE$SI6 0O0. 3. RECIPIENT'S CATALOG NUMUb.R
AFIT/CI/tIR 85-141T
4. TITLE (and Subuil.) S. TYPE OF REPORT A PERIOD COVERED
In Vitro Comparison Of Zinc Phosphate And Glass THESIS/UIr 'AWAONI o n o m e r s A b i l i t y T o I n h i b i t D e c a l c i f i c a t i o n U n d e r 6 . _ P E R O R M I N G 0 01 _. R E P O R T N U M B E
And Adjacent To Orthodontic Bands E. PErFnMING ORG, REPORT MER
T. AUTHOR(AJ 6. CONTRACT OR GRANT NUMBER(s)
Donald J. Copenhaver
9. PERFORMING ORGANIZATION NAME AND ADDRESS I0. PROGRAM ELEMENT. PROJECT, TASKAREA A WORK UNIT NUMBERS
AFIT STUDENT AT: Temple University
II. CONTROLLING OFFICE NAME AND ADDRESS 12. REPORT DATE
00 AFIT/NR Aug 198500 WPAFB OH 45433,- 6583 IS. NUMBER OF PAGES
36 + figures14. MONITORING AGENCY NAME 6 ADDRESS(i/ different Irom Conitollnl Oflfice) IS. SECURITY CLASS. (of this report)
UNCLASSOCL. OECLASSIFICATION/DOWNGRADiNG
SCHEDULE
,PPROVED FOR PUBLIC RELEASE; DISTRIBUTION UNLIMITED ELECTE
NOV 5 1I '17. VISTAIBUTION STATEMENT (of th. ab.trac .ener.ed, MBlock 20. if dif.ret ,.Rm v por)$ 1 3
I. SUPPLEMENTARY NOTES
APPROVED FOR PUBLIC RELEASE: IAW AFR 190-1 .WOLAVERDean for Research and
Professional DevelopmenAFIT. Wright-Patterson AF8
19. KEY WORDS (Continue on reverse ede it nocesaary and Identify by block number)
*20. A1STRACT (Continue on rovers side it necessary and identily by block number)
wool
ATTACHED
DD I 1473 EDITION OF I NOV 6S IS OBSOLETE UNCLASS
-585s 1 4

ABSTRACT
IN VITRO COMPARISON OF ZINC PHOSPHATE AND GLASS IONOMER CEMENTS
ABILITY TO INHIBIT DECALCIFICATION UNDER ORTHODONTIC BANDS
Donald J. CopenhaverTemple University, Philadelphia, Pennsylvania, 1985
orty sets of impacted third molar teeth were banded with custom fitted
bands and cycled in a latic acid solution for four weeks. This solution
simulates an environment that would be found only in patients with the worst
oral hygiene. Each set was from the same patient. Visual, spectrophotometric
and pH testing were done on the sample sets. All areas not banded showed
significant decalcificat-ion after four weeks in the 0.101M latic acid solution.
The teeth banded with glass ionomer cement showed significantly less visible
changes under lOX dissecting microsopy than the zinc phosphate cemented
samples. Spectrophotometric analysis confirmed that significantly more calcium
was present in solution in the zinc samples than in the glass ionomer samples.
The significantly higher pH of the zinc phosphate cemented sample solutions also
confirmed more Ca*+ ions in solution. The evidence suggests that glass ionomer
cement protects the tooth surfaces from decalification under and adjacent to
orthodontic bands significantly better than zinc phosphate cements. Further
study on solubility and setting time of this new glass ionomer cement is
necessary before routine clinical use can be considered.
Accession F
tNTiSGR2DTIC TAB
Unannourc-ASJust ificat ior -
.I DiIVQipccr :1, D
Availabl t
I,. Dist SpScla1.
%-I
_ t *:t,'.: },: :"' ' - [ :' "i" " m' - P -' :i. . . m ia ~ d a i i l i
85- 141T
AFIT RESEARCH ASSESSMENT
The purpose of this questionnaire is to ascertain the value alid/or contribution of researchaccomplished by students or faculty of the Air Force Institute of Technology (AU). It would begreatly appreciated if you would complete the following questionnaire and return it to:
AF IT/NRWright-Patterson AFB OH 45433
RESEARCH TITLE: In Vitro Comparison Of Zinc Phosphate And Glass Iononters Ability ToInhibit Decalcification Under And Adjacent To Orthodontic Bands
AUTHOR: Donald J. CopenhaverRESEARCH ASSESSMENT QUESTIONS:
1. Did this research contribute to a current Air Force project?
( ) a. YES ( ) b. NO2. Do you believe this research topic is significant enough that it would have been researched
(or contracted) by your organization or another agency if AFIT had not?-
()a. YES ()b. NO3. The benefits of AFIT research can often be expressed by the equivalent value that your
agency achieved/received by virtue of AFIT performing the research. Can you estimate what thisresearch would have cost if it had been accomplished under contract or if it had been done in-housein terms of manpower and/or dollars?
a. MAN-YEARS ______()b. $_____
4. Often it is not possible to attach equivalent dollar values to research, although theresults of the research nay, in fact, be important. Whether or not you Were able to establish anequivalent value for this research (3. above), what is your estimate of its significance?
= ( )a. HIGHLY ()b. SIGNIFICANT ()c. SLIGHTLY ()d. OF NOSIGNIFICANT .SIGNIFICANT SIGNIFICANCE
5. AFIT welcomes any further commients you may have on the above questions, or any additionaldetails concerning the current application, future potential, or other value of this research.Please use the bottom part of this questionnaire for your statement(s).
NAME. GRADE POSITION
ORGANIZATIONLCAIN
STATEMENT(s):

IN VITRO COMPARISON OF ZINC PHOSPHATE AND GLASS IONOMERS
ABILITY TO INHIBIT DECALCIFICATION UNDER AND
ADJACENT TO ORTHODONTIC BANDS
Donald J. Copenhaver
D.D.S., University of Texas Health Science Center at Houston
A Thesis Submitted to the Faculty of the
Department of Orthodontics in
Partial Fulfillment of the
Requirements for a Master of Science in Dentistry
Temple University School of Dentistry
Philidelphia, Pennsylavania
August, 1985
.,

This Thesis for
Master o± Science in Dentistry
by
Donald J. Copenhaver
Has Been Approved by the Following Members
- of the Thesis Defense Committee
of
Temple University School of Dentristry
.2 ........
p.
)"

1ADIE QE CONENTS
I ACKNOWLEDGEMENTS . ... ................ . ... i
II INTRODUCTION.................... ...... 1
III REVIEW OF THE LITERATURE................. 2
IV MATERIALSAND METHOD........... .....13
A. RATIONALE AND DESIGN ................ 1
B. SAMPLE ........ ................... 14
C. CEMENTS ................................ 15
D. BANDING ........................... 16
E. CONTROLS ....... .. ...... ......... .... 16
F. CEMENTING PROCEEDURE. ........... ...... 18
G.* TESTING SOLUTION.................. .. .. . .. .18
H. METHODOLOGY ...................... ....... 19
VII DISCUSSION ............................ .25
VIII SUMMARY AND CONCLUSION................. 30
IX BIBLIOGRAPHY....... .. .. ............ . .. .. .33
X APPENDIX................................. 3

ACKNOWLEDGEMENTS
The author wishes to express his sincere gratitude to his
advisor, Donald B. Grosser, D.D.S., M.S., Clinical Professor ot
Orthodontics, tor his guidance and perserverance in preparation
of this investigation. The author would also like to express his
appreciation to Milton J. Lande, D.D.S., M.S., Clinical Professor
of Orthodontics, for his invaluable assistance in obtaining the
sample teeth used in this study.
Acknowledgements are accorded to George R. Schacterle,
P.M.D., Professor of Biochemistry, for his assistance with the
spectrophotometric analysis; Gerald Orner, D.D.S., M.P.H Sc.D.,
Associate Protessor of Community Dentistry, for his assistance
with the statistical data; and Kourosh Zarrinnia, D.D.S., M.S.,
Associate Professor and Chairman, Department of Orthodontics, for
his suggestions and councel in preparation ot this paper.
4
!i
.. ..
'-

INTRODUCTION
Zinc phosphate cement has long been the standard in orthodo-
ntics for cementation of appliances. It has many desireable
properties including high strength, good manipulative time and
relative insolubility in oral fluids. Perhaps its greatest
shortcoming is its lack of protection to the enamel surfaces it
- contacts. This lack of protection coupled with patient neglect
often leads to decalcification under and adjacent to orthodontic
appliances.
Glass ionomer cements have recently held promise of signifi-
cantly reducing the problem of decalcification in orthodontics.
While possessing many properties similar to or superior to zinc
phosphate cement, these new cements also appear to leach signifi-
cant amounts of fluoride to the enamel surfaces.
The paper compares the decalcification protection of these
, two cements in vitro.

REVIEW OF THE LITERATURE
Enamel demineralization occurring under orthodontic bands is
of concern to orthodontists. Factors contributing to this decal-
icification include seal breakdown, inadequate strength and bond-
ing of the cements, and their solubility in oral fluids. 1 Of
course, oral hygiene is also an important contributing factor.
Many authors2 - 4 have discussed the higher incidence of car-
ies in patients undergoing orthodontic treatment. Areas of ena-
mel demineralization are often observed after removal of
orthodontic bands. Tillery and associates 4 noted that enamel
*decalcification is the initial step in the development of cariuus
lesions.
Fluoride has anticariogenic properties, and this has led to
its incorporation into drinking water, dentrifices, and mouthwas-
hes. Fluoride has also been used or occurrs naturally in dental
cements used for cementing orthodontic bands.5
Recently, a new glass ionomer cement, incorporating fluoride
was introduced. This cements unique properties include bonding
to both stainless steel and enamel, release of stannous fluoride
ions, and relative insolubility in oral fluids 6 .
According to the American Dental Association, 7 certain fac-
tors must be considered when analyzing cements. These are
strength (compressive and tensile), setting time, film thickness,
V solubility, adhesion, caries protection, pupal reaction, opacity,
reflectivity, and color stability.8 In orthodontics, the first
six factors are all important, An ideal cement would have great
2
#. . . . .. . . . . . . . . .

strength, ideal setting time (long manipulative time and rapid
set), low film thickness (high wetability), be impervious to oral
fluids, adhere to enamel and stainless steel, and impart caries
protection to the contacted enamel surface.7
~Zinc Phosphate Cement
Zinc phosphate cement powders consist primarily of calcined
zinc oxide and magnesium oxide in the approximate ratio of 9 to
I.9 The chief difference in cements appears to be in the compo-
*- sition of the powders. The variations occur in the addition of
small amounts of modifiers, su--h as silica, rubidium trioxide,
and bismuth trioxide.I0
Zinc phosphate cement liquids are phosphoric acid solutions
buffered by aluminum salts, and in some instances by both alumi-
num and zinc salts.8 These metallic phosphate salts reduce the
reaction rate of the liquid and the powder. The average water
content of the liquid is 33± 5 per cent.1 1 The amount of water
present is a factor in the ionization of the liquid, and it is a
critical ingredient in the rate of the liquid-powder reaction. 1 1
The exact nature of the product of this reaction is not
certain. Set cement contains no oxy-salts, so the term "zinc-
* oxyphosphate cement" is incorrect.9 It has been generally
thought that the tertiary zinc phosphate crystal
{Zn 3(PO4) 2"4H20}, hopeite, is the final product. However, it
has been reported by Servais and Cartz,11 that no crystalline
component forms during the setting process. The compounds formed
by the reaction of the powder and liquid are non-crystalline,
amorphous phosphates of zinc, aluminum, and magnesium. These
3
4w..~ -1 ..
*." .4

phosphates form only part of the set cement; the rest is unreac-
ted cores of larger powder particles, surrounded by the phosphate
matrix. 10 Servais, et al. 1 1 claimed that even though no crystal-
line phosphate is involved in the setting process of the cement,
there can be a subsequent growth of hopeite in the presence of
excess moisture (relative humidity 100%). The hopeite crystals
are held weakly to the cement surface, so that their presence
reduces any adhesive properties of the cement.
The proportion of powder particles and phosphate matrix va-
ries with the amount of powder incorporated into a given amount
of liquid. The set cement having the minimum amount of matrix
has the best values for physical properties and is most suitable
for use in the mouth.1 0 Consistency of the mix is also deter-
mined by the amount of powder incorporated into a given amount of
liquid. Since most manufactures comply with the requirements
found in the American Dental Association Specification No. 8 for
Dental Zinc Phosphate Cement, it behooves the practitioner to use
the recommended powder/liquid ratio and mixing instructions pro-
vided.12
Norman, Swartz, and Phillips 1 3 determined the pH of setting
cements with microelectrodes. They found zinc phosphate cement
to have an initial pH of 4.0. This acidic pH rose to approxima-
tely 6.0 in 1-1.5 hours. It remained at this level until, at 4
hours it again rose to approach neutrality in 24 hours. In a
subsequent study, Norman, et al114 stated that variation in the
powder/liquid ratio of zinc phosphate cement has the most
influence on pH. Thin mixes have a lower initial pH than thick
-4
!11
". . . . ... . . . . . . . . . . . . . - , . • .• . . ° .° ° . - . . - ° . ° . o .

mixes, and they remain 0.5 to 1.0 pH unit lower even after
several days. Cook and Horne 15 used a spectrophotometric method
of determining the pH of zinc phosphate cement and found it to
have a pH of 5.0 after 30 days. They claimed that their study
supported previous reports that the powder does not react comple-
* tely with the liquid, and that residual acidity, in some form is
present in set zinc phosphate cement.
Zinc phosphate cement has long been known to cause possible
harmful effects on tooth structure.16 ,17 Seniff,18 using 8% SnF 2
as a topical solution to the enamel surface, produced a marked
reduction in the etching effects of zinc phosphate cement.
Muhler,19 found that the application of 10% aqueous SnF 2 , prior
to the cementation of orthodontic bands, gave a significant
reduction in dental caries and inhibited enamel demineralization.
The incorporation of SnF 2 directly into zinc phosphate
cement could result in comparable protection, and the clinically
practicality could be dramatic. Gursin,2 0 dehydrated a small
portion of the cement liquid and replaced it with 30% SnF 2 , which
resulted in a zinc phosphate cement. He found the SnF 2 /ZnP0 4
cement to be superior in solubility reduction of enamel.
Scull, 2 1 incoroporated SnF 2 into zinc phosphate cement to
determine its effect on decalcification under orthodontic bands.
He compared the effects of this cement to plain ZnPO 4 cement and
to a third cement, which had SnF2 added to the powder portion at
a 2.0% level. All cements showed protection against solubility
. of enamel, with the 2.0% SnF 2 /ZnPO 4 cement exhibiting the most
protection. It should be stated that the original cement had
fluoride in it from the manufacturer.
5
U

Ram, Gadalia, and Reisstein 2 2 were concerned about changes
in the physical properties of zinc phosphate cement with stannous
fluoride added. In testing 2.0%, 5.0%, and 10.0% SnF 2 /ZnPO 4
cement for consistency, setting time, compressive strength, film
thickness, solubility, and degree of disintegration, they found
the 5.0% and 10.0% cements showed detrimental effects in all
categories. However, the cement with 2.0% SnF 2 exhibited no
significant change in physical properties. The authors curiously
failed to report the method used to incorporate the SnF 2 into the
ZnP04cement.
The L.D. Caulk Company manufactures a zinc phosphate cement
(orthocem) containing 10.0% SnF 2 in the powder portion. The
production of this cement is aimed at convenient commercial use
in orthodontics to prevent the deleterious etching effect of
regular ZnP0 4 cement. Wei, et al. 2 3 conducted a simulated in
vivo experiment to determine the fluoride uptake by enamel with
this cement using plain ZnP0 4 cement as a control. The enamel
treated with 10.0% SnF 2 /ZnPO 4 cement showed a significant amount
of fluoride concentration. This was even greater than the fluor-
ide uptake of another group that received a five minute applica-
tion of topical 10.0% SnF 2 before cementation with regular ZnP0 4
cement. Myers, et al. 2 4 (1973) banded 68 teeth with this
SnF 2 /ZnPO 4 cement and regular cement by the same manufacturer.
The teeth were extracted after seven days for orthodontic rea-
sons, and no apparent topographical change in the enamel was
observed with either cement.
Sadowsky et al.2 5 studied enamel fluoride uptake from ortho-
6
* d% d%

'.C,
dontic cements and its effect on demineralization. He used two
Zn2 PO4 cements one of which contained 5% SnF 2 and a third cement,
a slicophosphate, all from the same manufacturer (Stratford-
Cookson Company). He used enamel biopsies to test enamel uptake
of fluoride under orthodontic bands. He then used the same
biopsy technique to test the teeth after they had been subjected
to a demineralization bath. He found that the cement containing
SnF 2 gave its fluoride to the enamel surface, and this fluoride
gave the surface significant protection against demineralization.
.. Further, the greater the fluoride uptake, the more resistant the
enamel was to demineralization. In a follow-up study, 2 6 he
subjected teeth to a longer period in the demineralization bath
and examined them micro-radiographically. He found that the
enamel which had acquired fluoride fron the fluoride containing
cements was apparently more resistant to caries attack.
Glass Ionomer Cement
Glass ionomer cements for restorative and luting purposes
are based on the hardening reaction between ion-leachable glasses
(fine Calcium aluminosilicate glass powders prepared with fluo-
ride flux) and aqueous solutions of homopolymers and copolymers
of acrylic acid.7 The properties of the cement can be modified
by using different formulations of glass and polyacid.8 Working
and setting time can also be varied by alteration of the size of
the powder particle, addition of chelating agents such as tarta-
ric acid, and adjustment of the concentration and viscosity of
the liquid. 7 The setting reaction of glass ionomer cement is
similar to silicate cements. 8 When the acid (acrylic acid co-
7
itL

polymers) is mixed with the powders (fine aluminosilicate glass
powders prepared with a fluoride flux), a paste is formed that
rapidly hardens into a solid mass bound by a polysalt gel. These
polysalts bind unreacted glass particles in a cement matrix.
Wilson 2 8 regards formation of cement as an acid-base reaction
between polymeric substances. The acid (the liquid) reacts with
a base (the powder) to form a salt. Because of the polymeric
nature of the salt, it acts like a binding matrix. The reaction
is ionic, as are all salt forming reactions, that is, cations
(+charge), interact with anions (-charge), to form a neutral
salt.2 8 Unlike the polymerization of restorative resins, no
toxic monomers, initiators or activators are involved in the
setting reaction. While setting, calcium and aluminum ions are
displaced by the acid as positively charged ions, and fluorine is
displaced as a negatively charged ion. Crisp and co-wor-
kers 2 9 930 ,3 1 have shown that the soluble calcium and aluminum
ions react with negatively charged polycarboxylate ions in the
liquid to form insoluble calcium and aluminum polycarboxylate.
These are termed ion-exchange glasses, because the organic bin-
ding matrix is formed during the mixing of the cement.
The glass ionomers then, are similar to silicate cements.
Calcium polycarboxylates are formed first as a firm gel that has
the property of being carvable like amalgam. At this stage, the
ionomer system is highly suspectable to water-sorption. If the
water is absorbed, the matrix becomes chalky and can erode rapid-
ly.8
The mechanism of adhesion of glass ionomer cement has yet to
be fully explained. Glass ionomer cements can bond only to sur-
8

faces with which they can chemically react and that provide cat-
ions (dentin is the one exception)3 2 . Adhesion results from
electrostatic attraction with cations sandwiched between negati-
vely charged oxide surfaces and CO0- groups in the cement.3 2
These mechanisms can only operate effectively if intimate contact
is achieved between the adhesive and the tooth substrate: such
contact is the first requirement for good adhesion.2 8 Thus the
adhesive is required to spread over the tooth surface displacing
contaminants (i.e. water and air). Unlike other cements, glass
ionomer cements also adhere to dentin. Collagen contains some
pendant chains that include COOH and NH2 groups. These could
provide sites for adhesive ionic and dipole interactions.34 Be-
cause the attachment is by ionic and polar bonds, the release of
. fluoride and its uptake by the enamel are facilitated.3 4 The
intimate molecular contact facilitates exchange of the fluoride
ions with the hydroxyl ions in the apatite of the surrounding
enamel.34 The intimate contact from the molecular interaction is
essential for flouride ion-exchange. In contrast, a material
that does not adhere by molecular interactions would leave gaps
between the cement and tooth, so that, even if it releases fluor-
ide, ion-exchange would be hindered (i.e. zinc phosphate cements
with fluoride).
Glass ionomer cements adhere to enamel and dentin in a
manner similar to carboxylate cements. 8 Several studies have
shown that when precious metals are electroplated with one to two
microns of tin, the ionomer cement will adhere to the surface of
tin oxide via polar and ionic bonds 3 2 , 3 4 .
9

McClean and co-workers 3 6 have shown that the matrix of the
glass ionomer cement contains sheathed droplets of calcium fluor-
ide that confer the ability to leach fluoride ions into the
surrounding tooth enamel. Kidd 3 7 using an artifical caries tec-
hnique with a diffusion controlled acidified gel, concluded that
ionomer cements exert a cariostatic effect. Tveit and Gjerdet 3 8
found that fluoride release from a glass ionomer cement was five
time less than from a silicate cement. However, they were the
only workers to report this difference. In fact, Cranfield,3 9 in
- testing four glass ionomer cements, found that the release rates
of glass ionomers and slicates are broadly comparable. He also
found: that after thirteen weeks there was no sign of deviation
from linear fluoride release of glass ionomer cement, and that
the fluoride release seemed to derive from the entire volume of
the cement. Others found similar results in their studies. 0 ,4 1
Sylvia et al. 0 tested three glass ionomer cements for fluoride
release and stated that powder/liquid ratios influence the re-
lease rate and total release of fluoride from these cements: a
higher powder:liquid ratio reduces solubility due to the lower
proportion of liquid which promoted rapid dissolution. Retief
et al.4 2 testing fluoride uptake from a glass ionomer cement by
- enamel and cementum, found that the fluoride acquired by the
enamel and cementum was largely due to the topical effect of the
released fluoride in {synthetic) saliva. They concluded that
enamel and cementum can acquire j.bjantiaj amounts of fluoride
from a glass ionomer cement.
If the release of fluoride from glass ionomer cement is at
least as much as silicate cement, then glass ionomer cement
10
should impart significant protection protection to enamel under
or adjacent to orthodontic bands. De Fritas4 3 found that fluor-
4 ide-ion release from silicate cements was still occurring after
- fifty-two weeks at a rate substantial enough to protect adjacent
enamel (0.16ugm- 1g- 1).
The major criticism of glass ionomer cements is their tend-
, ency to calkiness with early contamination from moisture.8 A
limited number of clinical studies have been done. In one in-
', vivo study, done with cement on patches over crowns, Michem 4 4
showed glass ionomer to be the least soluble when compared to
polycarboxylate, silico-phosphate, zinc phosphate, zinc-oxide
eugenol and EBA+alumina cements. Causton4 5 studied earlier glass
* ionomers by exposing them to water during the first forty-eight
hours after set. The degree of hydration, rate of fluoride re-
-; lease and degree of cross-linking of the gel-matrix were shown to
be affected by the water ingress during the setting reaction.
Oils 4 6 also found that the glass ionomer cements seemed to be
.- sensitive to moisture during the setting reaction. Wilson and
Crisp4 7 found that adding chelating comonomers like tartaric acid
could significantly increase the rate of hardening without red-
-* ucing the working time (tartaric acid is the accelerator in ESPE
- Ketac-Chem). Pluim,4 8 in another experiment, determined the in-
vivo dissolution rate of glass ionomer to be only one-eightheeth
(1/80) that of zinc phosphate cement. ESPE's glass ionomer
* system, has tartaric acid in the liquid as an acelerator. It
reaches a hard set seven minutes after start of mixing. This is
a significant improvement because, before this development, glass
*1 11
* °
ionomer systems had to be protected from water sorption for
thirty minutes or rapid dissolution would occur.4 9
Compressive strength of glass ionomer cements is 4.5 N/mm 2,
tensile strength is 247N/mm2 .8 This compares to zinc phosphates
7N/mm 2 compressive strength and 83N/mm 2 tensile strength.8
112
i-
'A,.
f t - ' z J ' ' ', 'J 4 ' ' ' ' '- . , "' % ' - "' '"""" ' ""'" " """ " ' u" "" " I " """" "
''"
°"
I w _ "-">, "" """ -. . -t" ,..' ., .. .,' ,ii ,,"'"' - _'W '_, ,.

METHODS AND MATERIALS
Rationale and Desin:
This study was an attempt to elict the clinically signifi-
cant caries protection difference between a glass ionomer and a
zinc phosphate cement. To accomplish this, all experimental
.-' factors except the two cements were kept as constant as possible.
The teeth sample sets were from the same patient, all teeth
were impacted, all teeth were stored in the same solutions,
banded by the same operator on the same day, cycled in the same
solutions, and examined both prior and after the experiment in a
blind comparison by the same operator.
The following chart details the experimental design.
60 Sets examined for evidence of decalcificationon facial, lingual, mesial and distal surfaces
, II
4IO sets selected on basis of no observabledecalcification, same level of development, andacceptable morphology for banding.
V \V30 SETS: Regular mix of both 10 SETS: Regular mix ofcements as per manufacturers both cements as perinstructions manufacturers instructionsII II
V \/ZnPOu sample cycled 10 SETS: In individualin 610 ml of latic acid 6cc vials to test forpH 4.5, .10 M Ca+ + levels
I I+ V
Glass ionomer sample cycled Spectrophotometric analysisin 610 ml latic acid solution and pH determination of testpH 4.5, .10 M solutions II
VII pH determination of ZnP04
\V and glass ionomer solu ions:. II- : Vk 40 sets examined for enamel surface changes.
13-go-

Sample
Forty sets of freshly extracted human teeth were used. The
teeth sets were gathered from oral-surgeons in the Philadelphia
area and from the United States Air-Force Academy, Colorado
Springs, Colorado. The teeth were all previously fully impacted
with no portion of the crowns exposed to oral fluids. Sixty sets
were examined and the best forty sets were chosen for the sample.
All teeth samples had acceptable crown morphology for banding. To
facilitate banding, the sample teeth roots were imbedded in
orthodontic cold cure acrylic resin. Teeth from a single patient
were placed on each block. The sets were numbered and placed in
a soli-4ion of 35% ethyl alcohol and stored at room temperature
prior to banding. Previous studies testing cements have used
this storage solution.2 5 The blocks containing the teeth sets
were sectioned, the teeth carefully cleaned with flour of pumice
in a slowly rotating rubber cup, then given a ten minute fluoride
treatment with 10% acidulated fluoride gel. The exposed root
surfaces were then coated with clear nail polish to avoid root
suface demineralization. Figure 1 shows a typical tooth set
ready for banding. Each tooth was examined under 1OX dissecting
microsopy (Bausch ?nd Lomb, Stero-zoom dissecting microsope, with
two B & L 31-35-38 illuminators), for evidence of enamel defects.
These pre-decalcification readings were sealed in an envelope and
not opened until the post experimental observations had been
completed.
14
F'-S
' Cements
-.4.
The cements tested were Ames Gray-brown zinc-phosphate ce-
ment, and ESPE Ketac-Chem glass ionomer cement. The cements were
mixed according to the manufacturers instructions:
The zinc-phosphate cement was placed on a glass
slab and mixed at room temperature by the timed addi-
tion of powder to liquid. The measuring system was
developed by the author and consisted of a calibrated
mixing scoop and a one ml syringe. The scoop was calib-
rated by small additions of cold cure acylic and subse-
quent weighing of the powder on both a O'Haus Cent-O-
Gram accurate to 1/100 gm and a Mettler precision
balance accurate to 1/1000 gm. The dispensing spoon
was found to be accurate to±.05 gm by repeated weigh-
ings. The powder was fluffed and measured with the
scoop. The recommended powder/liquid ratio was 1.3 gm
powder to 0.5cc liquid. For this study the author used
one-half this amount or .65 gm of powder and 0.25 gm of
the liquid for cementing each band.
The glass ionomer was mixed by incorporating the
powder into the liquid. The ESPE system comes with a
measuring scoop and drop dispensor. These were tested
by repeated weighings and found to be accurate enough
to be used in this study (±.05gm). ESPE recommends
seven minutes from the start of the mix to completion
of set and exposure to oral fluids; Three minutes,
thiry seconds working time, and three minutes, thirty
15... . . . . . . .

setting time. The recommended powder/liquid ratio is
3.4 to 1.
The mixing of the glass ionomer was done by fluffing
the powder, measuring one level scoop of the powder,
and mixing with two drops of the liquid from the
dispensor. This produced the recommended powder/liquid
ratio. Each band received a fresh mix.
Banding
Banding was done by a single operator using the following
method:
1. All teeth sets were cleaned with water and flour of
pumice in a slowly rotating rubber cup.
2. Each band was custom fitted using Unitek .004mm
thick contoured molar band blanks.
3. Each band was then coated with cement and cemented
to place using the band plier to snug the band.
4. Each band was then welded on the facial surface
of the tooth before the cement set occurred.
5. Hand instruments were used to adapt the occulsal
and gingival margins of the band to the tooth
6. All sample sets were placed in the test media
within eight hours of banding.
Figure 3. shows a sample tooth banded with a control tooth
after decalcification.
Controls were two fold. First it was assumed that calcifi-
cation levels for contralateral impacted teeth were generally
16
equal at the beginning of the experiment. This was assumed
because the sets were not exposed to oral fluids. If differences
in root length or other morphology were noted at the time of
placing the teeth in blocks, then these sets were discarded.
In some instances, there were three teeth from a single
patient. These extra teeth were mounted on the same blocks as
the other two from that patient. These extra teeth were used as
additional controls.
* - After the teeth were mounted on acrylic blocks, they were
examined under lOX microscopy and graded according to the follow-
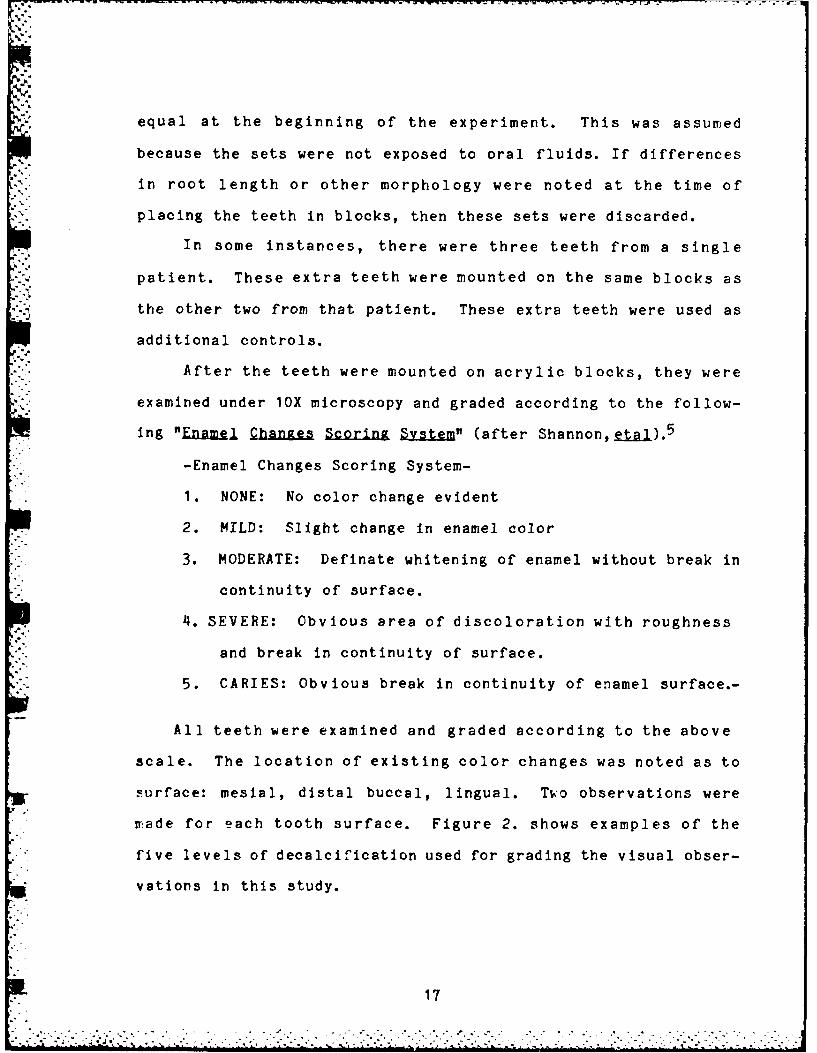
ing "Enamelj, Chaanges Scrn S.ystem" (after Shannon,&tli.). 5
-Enamel Changes Scoring System-
1. NONE: No color change evident
2. MILD: Slight change in enamel color
3.MODERATE: Definate whitening of enamel without break in
continuity of surface.
4. SEVERE: Obvious area of discoloration with roughness
and break in continuity of surface.
5. CARIES: Obvious break in continuity of enamel surface.-
All teeth were examined and graded according to the above
scale. The location of existing color changes was noted as to
surface: mesial, distal buccal, lingual. Tiuo observations were
*made for each tooth surface. Figure 2. shows examples of the
five levels of decalcification used for grading the visual obser-
vations in this study.
17
.'t - * ...
Each of the two cements was measured as previously des-
cribed. The cements were mixed on a glass slab at room tempera-
ture. Each mix was timed to insure strict compliance of manufac-
turers instructions. All cements were mixed by the same opera-
tor. Each tooth recieved a fresh mix. After the recommended
setting time, the excess cement was removed with a scaler and the
samples were placed in the latic acid solution.
Tsina Solution
The test solution selected was 0.1OM latic acid solution
buffered to pH 4.5 with sodium hydroxide. This solution was used
by Grieve51 to produce caries-like white spot leisons in vitro.
The teeth were in this solution for 27 days. The solution was
changed three times (every two weeks) except for the individual
* teeth suspended in six ml. vials. These solutions were only
changed once because the spectrophotometric testing required a
certain concentration of calcium ions for accurate analysis. The
lower storage temperature used (70 C vrs 200 C ) accounted for
the longer solution cycle time necessary to develop decalcifica-
tion on the enamel surfaces. The individual vials were cycled
an additional two weeks (41 days total) in their individual six
ml. vials. Two seperate samples of the soultions were taken from
these vials. The first set was taken after the initial test
period of 27 days. These samples were used in the spectrophoto-
metric analysis and for the initial pH measurements. Fresh solu-
tion was then added to the six ml. vials and they were stored in
this solution for an additional two weeks for a total of 41 days.
18

This was necessary because visual observation of the samples
revealed a reduced decalcification of the controls suspended in
this small volume of solution. The decision to terminate the
cycling was done on the basis of observed demineralization of the
exposed surfaces of the tooth samples and by observing the decal-
cification of the control teeth.
All teeth were examined before the experiment under light
microsopy, then banded as previously described. After a period
of 27 days in solution, the sample teeth were washed, the bands
carefully split with band removing pliers, and the remaining
cement removed with a sharp instrument. All teeth were then re-
examined twice by the same operator using 1oX microscony. The
same grading system previously mentioned was used again. The
solutions from the individually suspended sets were tested for
the presence of calcium ions and the first pH readings were
recorded. Two weeks later (41 days), a second pH reading was
taken on the ten teeth subset.
Spectrophotometric Analysis
17- The ten samples suspended in individual six ml. vials
were the sets used for analysis of Ca++ ions lost to their
test solutions during the decalcification period. The spec-
trophotometric analysis was done using the Fisher Scientific
Analysis Method (see appendix for complete test proceedure),
with a Bauch and Lomb Spectronic 80 spectrophotometer opera-
ting at 540 Nm calibrated to a 10mg% calcium standard. This
testing was done by an independent operator. This was a
19

blind comparison; the operator had no knowledge of the con-
tents of each of the tested solutions.
PH Testing
PH determinations of all solutions were done at two times
during the experimental period. The first reading was taken
at 27 days, the second at 41 days.
PH determinations were done with solutions at room
temperature with a Fisher Model 810 Accumet Digital pH meter
calibrated to pH 4.0 at 150 C.
Each of the six ml. solutions were tested individually,
with two samples (27 days and 41 days) from each vial. The
0.10M latic acid solution was checked each time to test for
possible degradation of the test solution during the experi-
mental period.
To check for possible inf" iences of the cements
themselves on the pH of the test solutions, equal samples of
each cement were mixed, allowed to set completely and then
suspended in 10 ml of the 0.10M latic acid solution for two
weeks. These solutions were also checked for pH change
against the unused test solution and the pH 4.0 standard.
20

*-*.
RESULTS
The results are presented in three parts; visual observa-
tions with 1OX light microscopy, pH differences in test solu-
tions, and spectrophotmetric analysis for calcium of six ml. test
solutions.
Visual Observations
The visual observations are presented in Tables 1., 2.,
3. and 4.* All samples showed significant changes during the
experimental period. All banded teeth showed significantly
less decalcification in the banded area compared to the unbanded
controls. The differences between the teeth sets were observed
generally at the occulsal and givgival band margins. Four surf-
aces (mesial, distal, buccal and lingual) were evaluated and the
findings for these four surfaces were summed.
The purpose of the second observation was to check the
repeatibility of the scoring method used in the visual observa-
tions. Observer errors between the first and second decalcifica-
tion reading are presented in Table 8. There was an overall
error of 6.5% for 640 observations. All errors were one scale
increments. The most common observation error was between 1 (no
color difference), and 2 (slight color difference). Because of
the small observer error, the first observations were used for
the statistical analysis.
Table I compares the differences between the teeth cemented
21
|. . . . . . . . . .
- t o -- o

r., ~ r .. n ~ r ~ r l z r tr.! ---- --- _ -, ~ w t~ CM 'C V . - -P 7' .. V. X V -~ ---
with glass ionomer before and after decalcification with the .10M
latic acid solution. At the .01 confidence level, the differen-
ces were not significant. The average difference was 0.06 with a
standard deviation of .20.
Table II shows the differences between the teeth cemented
with zinc phosphate cement before and after decalcification. At
the .01 confidence level, there were significant differences ( T
13.07) between the tooth surfaces. The average difference was
1.39, with a standard deviation of .66.
Table III compares the zinc phosphate to the glass ionomer
samples before the experiment to assertain if the samples were
the same at the beginning of the experiment. At the .01 level
the samples showed no significant differences (t = .29).
Table IV shows the differences between the teeth sets after
the experimental period. Significant differences appeared bet-
ween the average tooth surfaces of the glass ionomer cemented
teeth versus the average tooth surfaces of the zinc phosphate
cemented teeth (t =11.00 at the .01 level).
In order to access whether the ten teeth cycled in individ-
ual vials of the latic solution behaved differently than the
teeth cycled together, averages and standard deviations were
calculated for the set of thirty (without the individually cycled
teeth) and the set of forty (including the individually cycled
teeth). This data is presented in table V. As this table shows,
no significant differences occurred between these two subsets, so
the grouped data for the visual observations was used.
22

Tables I - V are summarized below and in table VI.
BEFORE CYCLING AFTER CYCLING
GLASS IONOMER avr = 1.038 -> avr = 1.10sd = .20 ns sd = .20
\II t 1.95 \IIns sig
t .29 t : 11
I I
ZINC PHOSPHATE avr = 1.05 -> avr = 2.44sd = .66 sig sd = .67
t = 13.07
avr = averagens = not significant at the .01 levelsig = significant at the .01 levelt = two tailed T testsd = standard deviation
pE Differene
Two pH readings were taken for each cemented tooth in the
ten sample subset. The first reading was taken at the end of the
initial experimental period (27 days), and the second reading was
done three weeks later when visual observation confirmed that the
samples had decalcified roughly the same as the thirty sets
cycled together (41 days in solution). The readings are presen-
ted in table VII. The differences between the pH readings of the
glass ionomer and zinc phosphate cemented teeth solutions in the
first reading averaged .68 pH units. This was a significant
difference at the .01 confidence level (t = 7.3). The second pH
reading produced similar results, the average difference being
23
b '

'.b
S.. To determine what affect the different cements themselves
might have on the pH readings, equal set samples of the two
cements were cycled in six ml. vials of the latic acid solution
for four weeks. The pH readings before and after suspension in
the solutions were roughly equal, the zinc phosphate cement pH
reading was 4.78, and the glass ionomer cement pH reading was
4.64 pH units, the difference being .05 pH unit. The pH of the
unused latic acid solution was 4.50 both at the beginning and end
of the experiment. Figure 5 graphs the pH findings.
Spectrophotometric determination Qf ci 19n concentration
The findings for the calcium ion concentration of the indi-
vidual teeth solutions are presented in table VII. Their were
significant (t = 7.88) differences at the .01 confidence level
between the teeth cemented with glass ionomer and zinc phosphate
cements. The solutions containing the zinc cemented teeth had,
on average, .210 mg% more calcium (S.D. = .08) in solution than
the glass ionomer cemented teeth. Figure 6 graphs the calcium
ion concentration differences between the teeth sample sets.
214
*-k,

DISCUSSION
The findings show that there is a significant difference
between zinc phosphate and glass ionomer cements ability to
protect tooth surfaces from decalcification under and adjacent to
orthodontic bands.
The severe environment, .01M latic acid solution, can
arguably be said to be more severe than that found in the normal
oral environment. However, Grieve51 found this solution produced
white spot leisions that most closely resembled those leisions
found in the mouth. Whether or not this solution represents a
reasonable facimile of conditions occurring in vivo is unknown.
Previous studies on the oral environment by Fehr, Adams and Bloom
53-55 suggest that lactobacilli producing latic acid play a major
role in enamel decalcification during orthodontic treatment.
The scoring method used for visual observation was partly
responsible for the high correlation coefficient values obtained
in the visual observation portion of this study. The five values
(1 =no color difference, 2 =slight color difference, 3 =white-
ning, 4 = discoloration with whiteness, 5 = carries) are not a
true linear progression. For example, the difference between a
* one score and a two score C(100%) does not really correlate to a
100% change in the tooth surface. However, it was clear after
examining the tooth surfaces that the glass ionomer cemented
tooth surfaces were closer to their original morphology than the
teeth cemented with zinc phosphate cement. Figures 7'. and 8.
25
show a typical tooth set after decalcification. Figure 7. shows
the dividing lines between the banded and non-banded areas of the
zinc phosphate cement sample are indistinct with areas of decal-
cification extending in to the banded area. In contrast, the
glass ionomer cemented sample (figure 8) shows a clear, sharp
border between the banded and non banded areas of the tooth
surfaces. The overall glassy surface appearance in the banded
areas of the glass ionomer cemented sample is closer to the
original surface appearance than the surfaces found on the zinc
phosphate cemented surfaces. Many of the zinc cemented surfaces
were characterized by white bands on the occulsal and gingival
band margin areas consisteint with decalcification lines found in
vivo. These lines generally corresponded with a score of 2
(slight color differnce) or 3 (whitening). The average score for
the zinc phosphate cemented teeth of 2 .4 4 was more than double
the average score for the glass ionomer cemented teeth (1.10) in
the post experiment observations (table IV). None of the glass
cemented teeth but seven of the zinc phosphate cemented teeth had
decalcification score average higher than 3. It should be remem-
bered that all unprotected tooth surfaces were decalcified to the
three or four level on the scale as were all of the control teeth
surfaces. From this, it is seen that just the presence of the
orthodontic band and either cement afforded substantial decalcif-
ication protection to the banded area of the tooth surfaces.
The areas where most differences between the tooth surfaces
were observed were along the margins of the bands. It appeared
that the seal integrity of the zinc phosphate cemented bands was
26

inferior to the seal integrity of the glass ionomer cemented
bands. Areas of decalcification extending well beyond the band
margins were also fairly common. This indicates that either the
cements ability to seal the margins of bands differs, or the zinc
cement is more soluble in the test solutions. Glass ionomer
cement has been shown in vitro to adhere to stainless steel and
to tooth enamel with a chemical bond 51 . Zinc phosphate, on the
other hand, does not chemically adhere to enamel or stainless
steel, though through partial etching of the enamel surface it
forms an intimate association with the tooth surface.12 The pH
testing of the two cements did not show an appreciable difference
between their solubility rates, though other studies have shown
zinc phosphate to be more soluble in oral fluids than glass
ionomer cement.
Another factor that has to be considered is the tightness or
"fit" of the experimental bands. Although every effort was made
to achieve as tight a fit as possible, it is the authors opinion
that these bands were not as tightly adapted as can be achieved
in vivo. The reasons for this are two fold: First in using
custom pinched bands, a uniform procedure had to be established
to assure the same fit of every band. This necessitated a devia-
tion from normal banding procedures. Second, the tooth samples
were all third molars, and even though they were carefully selec-
ted for acceptable anatomy, many possessed more occulsal gingival
taper than would normally be found. This made consistent banding
more difficult and may have partially accounted for the increase
in decalcification noted in the visual observations.
It was because of the necessarily subjective visual observa-
27

tion part of this experiment that the calcium ion level determin-
ation was done. This part of the study correlated with the
visual observations. As was noted, the solutions of the ten sets
of teeth cycled in six ml. of the latic acid solutions did show
significant differences between the two cements. All of the
teeth cemented with zinc phosphate cement showed more calcium in
solution than the teeth cemented with glass ionomer cement. It
should be remembered that these differences were from matched
teeth sets from the same patient. They had not been exposed to
any oral fluids. The average of .32mg% calcium in solution in
the zinc cemented teeth was nearly triple the amount of calcium
in solution in the glass ionomer cemented samples (.llmg%
calcium). This indicates that for a given set of teeth, the--..
glass ionomer cement was better at preventing loss of calcium to
the decalcifying solution than the zinc cement. This could be
due to superior sealing ability of the glass cement, but it
probably is due to the ability of the glass cement to leach
-.1 substantial amounts of fluoride to the surrounding teeth. This
t ability, combined with the chemical bonding to the tooth enamel
could have been responsible for the differences observed. Figure
4 shows a glass ionomer set after debanding with its control
tooth. The tooth in the foreground is the control tooth. The
glass ionomer cement can be seen adhering to the sample after
debanding. During debanding, the seal or bond was usually wea-
kest between the band and the cement. Removal of this cement was
more difficult than with the zinc phosphate cement. This could
be a potential problem clinically, especially on the mesial and
28
,,-
distal surfaces. The bond strength of glass ionomer is not
as strong as Bis-GMA resins. Caryle & 11 found that the bond
strength of the glass ionomer cements was roughly one-forth that
of composite resin systems.
The pH measurements correlate with the calcium ion measure-
ments. The readings were done at the end of the 27 day initial
experimental period and again two weeks later. The presence of
calcium in soultion would make the solution more alkaline and
raise the pH. The initial solution pH of 4.5 was checked at each
pH reading. The solutions in which the zinc phosphate cemented
teeth were suspended all had higher pH readings than the glass
ionomer cemented teeth, indicating more calcium in solution. The
test for possible interference from the composition of the ce-
ments themselves in the pH readings showed no significant pH
difference between the two cements samples.
29
.. ... . . .. .. . .

SUMMARY AND CONCLUSIONS
Forty sets of extracted human teeth were banded with two
different cements and cycled in latic acid solution to test for
differences in each cements ability to inhibit decalcification
under orthodontic bands. Each set of teeth was from the same
patient. After a period of 27 days, the sets were compared with
pre-experimental visual observations for cahnges in the facial,
lingual, mesial and distal surfaces. A subset of ten of the
banded teeth which were cycled in their own six ml. vials were
analyzed for the presence of calcium by Lpectrophotometric analy-
sis. PH readings were also done on the ten teeth subset.
The results show that all of the banded surfaces were resis-
tant to decalcification when compared to the nonbanded teeth.
The glass ionomer banded teeth showed significantly less
decalcification than the zinc phosphate banded teeth. The glass
ionomer cemented teeth also had significantly less calcium in
solution than the zinc phosphate cemented teeth. Further, the
zinc phosphate cemented teeth solutions were significantly more
basic, again indicating more calcium in solution than the glass
ionomer cemented teeth.
The results indicate that glass ionomer has potential to be
useful in cementing orthodontic bands, especially when decalcif-
ication is a major concern. It should be remembered however,
that problems with glass ionomer cement have still to be resol-
ved. The major problem is the seven minute setting time from
30
start of the mix during which the cement must be kept isolated
from moisture contamination. This new cement is not forgiving
in this regard. An_ moisture contamination will seriously com-
promise the solubility and strength of the set cement.3 4 Also,
the American Dental Association, while approving use of the
cement, has not specifically listed cementation of orthodontic
bands as an indication for use of this new cement. Finally,
little research has been done to test the validity of ESPES claim
that Ketac-Chem's new formulation actually is completely stable
after only seven minutes. All earlier formulations of this
cement had to be protected from moisture contamination with a
varnish for a minimum of 30 minutes after initial set. This of
course would make glass ionomer not practical for orthodontics.
Further research needs to be done to establish conclusively the
solubility of this new cement formulation at various setting
times before contamination with moisture. If this experiment
proves the validity of ESPES claims, then an in-vivo study could
be performed perhaps using contralateral teeth on the same
patient and accessing decalcification clinically after orthodon-
tic treatment.
Decalcification remains a problem in Orthodontics. If the
results of this suggested research prove the stability of ESPES
Ketac-Chem cement, then this new glass ionomer formulation offers
the potential to significantly reduce decalcification in
orthodontic practice. Possible uses for this cement could in-
clude recementation of loosened bands, cementation of bands where
tooth morphology precludes a tight seal, cementation of long term
31

retention appliances such as banded lower retainers, and for
cementation of maxillary molar bands in early treatment where
• long term wear of appliances is anticipated. The author recom-
mends however, that routine clinical use of this cement in ortho-
m .dontics be delayed until further studies are done.
1
32

APPENDIX
.5

.
BIBLIOGRAPHY
1. Sadowsky, P.L., and Retief, D.H. 1976, A comparative study ofsome dental cements used in orthodontics. Angle Ortho 46:171 - 181
2. Noyes, H.J. 1937, Dental caries and the orthodontic patient, J.Am. Dent. Assoc. 24: 1243 - 1254
3. Hughes, D.O., Hembrose, J.H., and Weber, F.N. 1979, Prepara-tions to prevent enamel decalcification during orthodontictreatment. Am J. Ortho 75: 416-420
4. Tillery, T.J., Hembree,J.H., and Weber, F.N. 1976, Preventingenamel decalcification during orthodontic treatment. Am. J.Ortho 70: 435-438
5. Shannon, T.L., St Clair, J.R., Prult, G.A. and West D.C.1977, Stannous fluoride verses sodium fluoride inpreventitive treatment of orthodontic patients. Aust J. ofOrtho. 5: 18-24
6. Maldonado, A., Swartz, M.L., Phillips, R.W. 1978, An in vitrostudy of certain properties of a glass ionomer cement. JADA96: 785-796
7. Crisp, S. et al. 1975, Properties of improved glass-ionomercement formulations. J. Dent. 3(3): 125-130
8. Smith, D.C. 1971, Dental Cements. Dental Clinics of NorthAmerica. 15(1): 3-31
9. A.D.A. Guide to Dental Materials and Devices, Tenth edition,1980-81
10. Phillips, R.W. Skinner's Science of Dental Materials. 1974W.B. Saunders Co., Philadelphia, Seventh edition
11. Servais, G., Gartz, L. 1971, Structures of zinc phosphatedental cement. J. Dent. Res. 50: 613-620
12. Docking, A.R., Donnison, J.A., Newbury, C.R. and Storey, E.1953, The effect of orthodontic cement on tooth enamel.Aust. J. Dent. 57: 139-142
13. Norman, R.D., Swartz, M.L., Phillips, R.W. and Raibley, J.W.
1966, Direct PH determination of setting cements. 1. A test
method and the effects of storage time and media. J. Dent.Res. 45: 1214-1220
33
. ........-..-... 2..........
I W_
14. Norman, R.P., Swartz, M.L., Phillips, R.W. and Raiblez, J.W.1966(b), Direct pH determination of setting cements 2. Theeffects of prolonged storage time, powder/liquid ratios,temperature and dentin. J. Dent. Res. 45: 1214-1216
15. Cook, F.W. and Horne, G.W. 1961, The acidity of zincphosphate cement after setting. J. Dent. Res. 40: 624-630
16. Lefkowitz, W. 1940, Histological evidence of the harmfuleffect of cement under orthodontic bands. J. Dent. Res. 19:47-52
17. Castello, I., Massler, M., Monteleone, U.L., and Suher, T.1948, Effect of zinc oxyphosphate cement on enamel. Amer J.Ortho. 34: 271-275
18. Seniff, R.W. 1961, Change in enamel surface caused byoxyphosphate cement. J. Dent. Res. 40: 642-645
19. Muhler, J.C. 1958, The effect of a single topicalapplication of stannous fluoride on incidence of dentalcarries in adults. J. Dent. Res. 37: 415-419
20. Gursin, A.V. 1965, Study of effect. of stannous fluoride*'[ incorporated in der;tal cement. J. Oral Ther. 1: 630-636
21. Scull, C.E. 1970, A study of the incorporation of stannousfluoride into zinc oxyphosphate cement to determine its
"* effect on decalcification under orthodontic bands. M.S.Thesis, University of Texas Dental Branch
" 22. Ram, Z., Gedalia, I., and Reisstein, I. 1973, Effects ofstannous fluoride additions to zinc phosphate cement. J.Dent. Res. 52: 1344-1350
23. Wei, S.H., Sierk, D.L. 1971, Fluoride uptake by enamel fromzinc phosphate cement containing stannous fluoride. JADP F3:621-631
24. Myers, C.L., Long, F.P., Balser, J.D., Stookey, G.K. 1973,In vivo alterations in enamel from zinc phosphate cementcontaining stannous fluoride. JADA 87: 1216-1221
25. Sadowsky, P.L., Retief, D.H., and Bradley, E.L. 1981, Enamelfluoride uptake from orthodontic cements and its effect ondemineralization. An. J. Orthod. 79(5): 523-533
26. Sadowsky, P.L., Petief, D.H., and Bradley, E.L. 1983, Acidresistance of enamel exposed to fluoride-containingorthodontic cements. Am J. Ortho 83(1): 33-37
27. McLean, J.W., and Wilson, A.D. 1977, The clinical developmentof the glass ionomer cements. formulation and preparation.Aust. Dent. J. 22(1): 31-36
'J34
28. Wilson, A.D. 1977, The development of glass ionomer cement.Dent. Update 4(7): 401 - 412
29. Crisp, S. and Wilson, A.D. 1974, Reactions in glass ionomercements. Decomposition of the powder. J. Dent. Res. 53(6):1408 - 1413
30. Crisp, S., et al 1974, Reactions in glass ionomer cements. Aninfared spectroscopic study. J. Dent. Res. 53(6): 1408 - 1413
31. Crisp, S. and Wilson, A.D. 1974, Reactions in glass ionomercements. The precipation reaction. J. Dent. Res. 53(6): 1420-1424
32. Zumstein, Th. A. 1983, Adhesion of Cement. "QuintessenceInter. 4: 465 - 472
33. Wilson, A.D. 1975, Adhesion of glass ionomer cements indentisitry. Aspects of adhesion. Transcipter Books, 285-306
34. McLean, J.W. and Sced, I.R. 1977, A new method of bondingdental cements and porcelain to metal surfaces. Oper Dent.2: 130 - 142
35. Powis, D.R., Folleras, T., Mierson, S.A. and Wilson, A.D.1982, Improved adhesion of a glass ionomer cement to dentinand enamel. J. Dent. Res. 12: 1416 - 1422
36. McLean, J.W. and Wilson, A.D. 1977, The clinical developmentof the glass ionomer cement. Some clinical applications.Aust Dent. J. 22(2): 120-127
37. Kidd, E.A. 1978, Cavity sealing ability of composite andglass ionomer cement restorations. An assessment in vitro.Br. Dent. J. 144 (5): 139-142
38. Tveit, A.B. and Gjerdet, N.R. 1981, Fluoride release froma fluoride containing amalgam, a glass ionomer cement and asilicate cement. J. 0. Rehab. 8(3): 237-241
39. Cranfield, M. 1982, Factors relating to the rate offluoride-ion release from glass ionomer cement. J. of Dent.10(4): 333-341
40. Sylvia, D., Mergon, S.D. and Smith, A.F. 1984, A comparisonof fluoride release from three glass ionomer cements and apolycarboxylate cement. Int. End. Journ. 17(0): 124 - 127
41. Forstein, L. 1977, Fluoride release from a glass ionomercement. Scand. J. Dent. Rp. 85(6): 503-504
42. Retief, D.H., Bradley, E.L., Denton J.L. , and Switzer P.1984, Enamel and cementum uptake fron a glass ionomercement. Carries Res. 18: 250-257
35

43. De Fritas, J.F. 1968, The long term solubility of silicatecement. Aust. Dent. J. 13: 129 - 135
44. Michem, J.L., Gronu, D.X. 1981, Continued evaluation of theclinical solubility of luting cements. J. Pros Dent45(3): 289 - 291
45. Causton, B.E. 1981, The Physio-mechanical consequences ofexposing glass ionomer cements to water during setting.Biomaterials 2(2): 112 - 115
46. Oilo, G. 1981, Bond strength of new ionomer cements todentin. Scad J. Dent. Res. 89(4): 344-347
47. Wilson, A.D., Crisp, S., Ferner, A.J. 1976, Reactions inglass-ionomer cements IV. Effect of chelating comonomers onsetting behavior. J. Dent. Res. 55(3): 489-495
48. Pluim, L.J. et al. 1984, Qualitative cement solubilityexperiments in vivo. J. Oral Rehabil. 11(2): 171-179
49. Mount, G. 1982, The use of glass ionomer in clinicalpractice. Dental Outlook 8(3): 37-42
50. Phillips, R.W., Swartz, M.L. 1948, Effects of fluorides onhardness of tooth enamel. JADA 37: 1-25
51. Grieve, A.R. 1979, The production of carries-like leisionsin vitro. Carries Res. 12: 35-49
52. American Dental Association, 1979. Status report on theglass ionomer cements. Prepared by J.W. McLean for theCouncil on Dental Materials and Devices. JADA 99: 221-226
53. Fehr, F.H. von der 1965, Maturation and remineralization ofenamel (abstract only). Advances Fluorine Res. 3: 83-98
54. Adams, F. J. 1967, The effect of fixed orthodonticappliances on the cariogenicity, qualtity and microscopicmorphology of oral lactobacilli. J. Oral Med. 22: 88-99
55. Bloom, R.H. and Brown, L.R. 1964, Study of the effect oforthodontic appliances on the oral microbial flora. OrqalSurg, Oral Med. and Oral Path. 17: 658-667
56. Coury, T.L., Wilker, R.D., Muconda, F.J., Probst, R.T. 1982,Adhesiveness of glass ionomer to enamel and dentin, alaboratory study. Oper Dent. 7: 2-6
57. Caryle, T.D., Chamma, A., Moir, R.W., Williams, P.T. 1978,An evaluation of the shear bond strength developed between aglass ionomer cement and enamel. J. Dent. Res. 57: 232
3
L! 36
*-,- .. - . .. . , .; . - . . . . .. _;; . , - . _,- , -. . . , . . ., - . . -

TABLE I.TEETH CEMENTED WITH GLASS IONOMER, BEFORE VRS AFTER
BEFORE LACTIC ACID CYCLING AFTER CYCLINGDIFF
TOOTH # OBSER SUM AVER DIFF OBSER SUM AVER SQR
1B 4 4 1 0 4 4 1 02B 4 4 1 0 4 4 1 03A 4 4 1 0 4 4 1 04B 4 4 1 -0.25 4 5 1.25 0.06255B 14 4 1 0 4 4 1 06B 4 4 1 0 4 4 1 07 7B 4 4 1 0 4 4 1 08A 4 5 1.25 0.25 4 4 1 0.06259B 4 4 1 0 4 4 1 0. 10A 4 4 1 0 4 4 1 0
S11A 4 4 1 0 4 4 1 012A 4 4 1 -0.25 4 5 1.25 0.062513B 4 4 1 -0.25 4 5 1.25 0.062514B 4 4 1 0 4 4 1 015A 4 4 1 -0.25 4 5 1.25 0.062516B 4 4 1 -0.25 4 5 1.25 0.062517B 4 7 1.75 -0.25 4 8 2 0.062518B 4 4 1 0 4 4 1 019B L 4 1 0 4 4 1 020A 4 5 1.25 0.25 4 4 1 0.062521B 4 4 1 -1 4 8 2 122A 4 4 1 0 4 4 1 023B 4 4 1 0 4 4 1 024A 4 4 1 -0.25 14 5 1.25 0.062525B 4 4 1 0 4 4 1 026B 4 4 1 0 4 4 1 027A 4 4 1 -0.25 4 5 1.25 0.062528B 4 4 1 0 4 4 1 029A 4 4 1 0 4 4 1 030B 4 4 1 0 4 4 1 031B 4 4 1 0 4 4 1 032B 4 4 1 0 4 4 1 033A 4 4 1 0 4 4 1 034A 4 4 1 0 4 4 1 035A 4 4 1 0 4 4 1 036B 4 4 1 -0.25 4 5 1.25 0.062537B 4 4 1 0 4 4 1 038B 4 5 1.25 0.25 4 4 1 0.062539A 4 4 1 0 4 4 1 040A 4 4 1 0 4 4 1 0
* TOTALS 160 166 1.04 -2.50 160 176 1.10 1.75SQUARE 1.08 6.25 1.21AVERAGE DIFF. 0.06
. STANDARD DEV. 0.13 0.20 0.23SUM OF DIFF. -2.5
. (DIFF) SQR 6.25SUM (DIFF) SQR 1.75M 40 SQRT M 6.324STND DEV = 0.20PAIRED T TEST 1.95 (not sig at the .01 level)
~~~~~~~... .. .. . ...... .+. .+ -+. ...........,- ... %- . .. ... o.° , -

TABLE II.TEETH CEMENTED WITH ZINC PHOSPHATE BEFORE VRS AFTER
BEFORE LACTIC ACID CYCLING AFTER CYCLINGDIFF
TOOTH # OBSER SUM AVER DIFF OBSER SUM AVER SQR
1A 4 4 1 0 4 4 1 0.002A 4 4 1 -1 4 8 2 1.003B 4 4 1 -1 4 8 2 1.004A 4 4 1 -1.5 4 10 2.5 2.255A 4 4 1 -2 4 12 3 4.006A 4 4 1 -1 4 8 2 1.007A 4 4 1 -2.25 4 13 3.25 5.068B 4 4 1 -2.25 4 13 3.25 5.069A 4 4 1 -1 4 8 2 1.00lOB 4 4 1 -1 4 8 2 1.0011B 4 4 1 -1 4 8 2 1.0012B 4 4 1 -1 4 8 2 1.0013A 4 4 1 -1.75 4 11 2.75 3.0614A 4 4 1 -1.25 4 9 2.25 1.5615B 4 4 1 -2.25 4 13 3.25 5.0616A 4 4 1 -1.25 4 9 2.25 1.5617A 4 4 1 -1 4 9 2 1.0018A 4 4 1 -2.5 4 14 3.5 6.2519A 4 4 1 -0.75 4 7 1.75 0.5620A 4 4 1 -1 4 8 2 1.0021B 4 4 1 -2 4 12 3 4.0022B 4 8 2 -2 4 16 4 4.0023A 4 4 1 -2 4 12 3 4.0024B 4 4 1 -1 4 8 2 1.0025A 4 8 2 0 4 8 2 0.0026A 4 4 1 -2 4 12 3 4.0027B 4 4 1 -2.5 4 14 3.5 6.2528A 4 4 1 -1.75 4 11 2.75 3.0629B 4 4 1 -1.25 4 9 2.25 1.5630A 4 4 1 -2.25 4 13 3.25 5.0631A 4 4 1 -1.5 4 10 2.5 2.2532A 4 4 1 -0.75 4 7 1.75 0.5633B 4 4 1 -2 4 12 3 4.0034B 4 4 1 -0.75 4 7 1.75 0.5635B 4 4 1 -1 4 8 2 1.0036A 4 4 1 -0.25 4 5 1.25 0.0637A 4 4 1 -1 4 8 2 1.0038A 4 4 1 -2 4 12 3 4.0039B 4 4 1 -2.25 4 13 3.25 5.0640B 4 4 1 -0.75 4 7 1.75 0.56
TOTALS 160 168 1.05 55.75 160 392 2.44 95.44SQUARE 1.10 3108 5.97 9108AVERAGE DIFF. 1.394STANDARD DEV. 0.22 0.67 0.67SUM OF DIFF. 55.70 0.158(DIFF) SQR 3108.1SUM (DIFF) SQR 95.44M :40STND DEV 0.67PAIRED T TEST 13.07 (sig. at the .01 level)
• 4
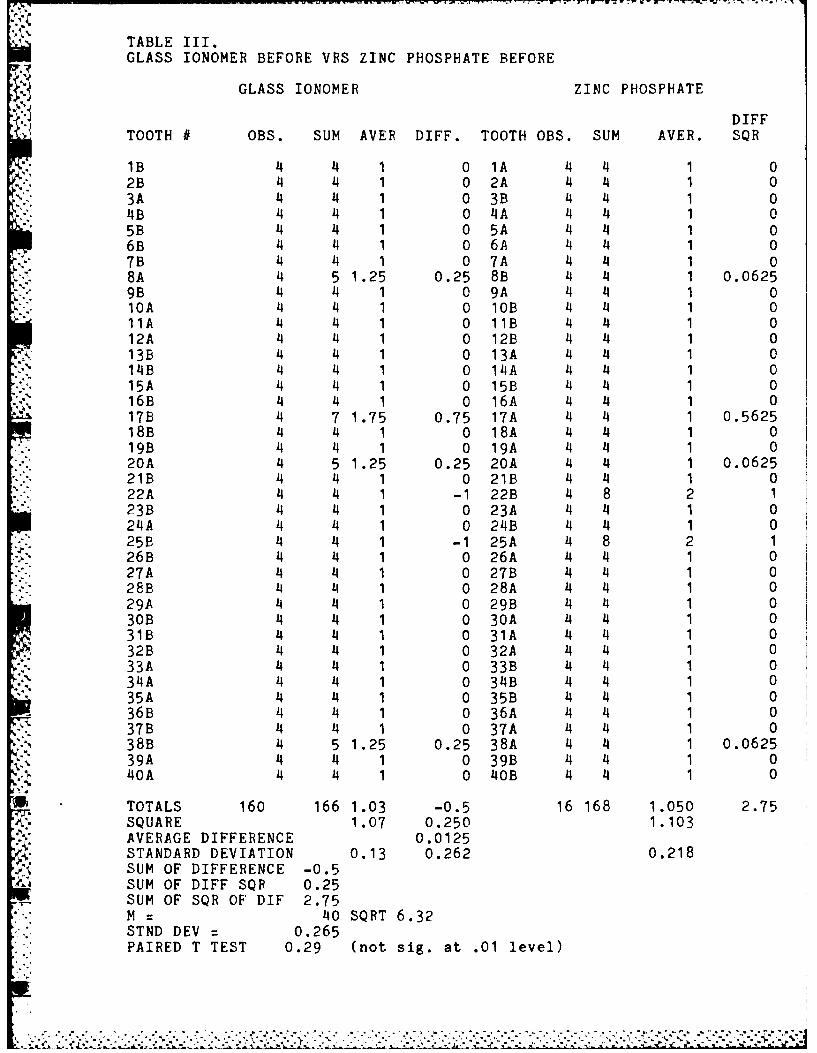
TABLE III.
GLASS IONOMER BEFORE VRS ZINC PHOSPHATE BEFORE
GLASS IONOMER ZINC PHOSPHATE
DIFFTOOTH # OBS. SUM AVER DIFF. TOOTH OBS. SUM AVER. SQR
1B 4 4 1 0 1A 4 4 1 02B 4 4 1 0 2A 4 4 1 03A 4 4 1 0 3B 4 4 1 04B 4 4 1 0 4A 4 4 1 05B 4 4 1 0 5A 4 4 1 06B 4 4 1 0 6A 4 4 1 07B 4 4 1 0 7A 4 4 1 08A 4 5 1.25 0.25 8B 4 4 1 0.06259B 4 4 1 0 9A 4 4 1 010A 4 4 1 0 lOB 4 4 1 011A 4 4 1 0 11B 4 4 1 012A 4 4 1 0 12B 4 4 1 013B 4 4 1 0 13A 4 4 1 014B 4 4 1 0 14A 4 4 1 015A 4 4 1 0 15B 4 4 1 016B 4 4 1 0 16A 4 4 1 017B 4 7 1.75 0.75 17A 4 4 1 0.562518B 4 4 1 0 18A 4 4 1 019B 4 4 1 0 19A 4 4 1 020A 4 5 1.25 0.25 20A 4 4 1 0.062521B 4 4 1 0 21B 4 4 1 022A 4 4 1 -1 22B 4 8 2 123B 4 4 1 0 23A 4 4 1 024A 4 4 1 0 24B 4 4 1 025B 4 4 1 -1 25A 4 8 2 126B 4 4 1 0 26A 4 4 1 027A 4 4 1 0 27B 4 4 1 028B 14 4 1 0 28A 4 4 1 029A 4 4 1 0 29B 4 4 1 030B 4 4 1 0 30A 4 4 1 031B 4 4 1 0 31A 4 4 1 032B 4 4 1 0 32A 4 4 1 033A 4 4 1 0 33B 4 4 1 034A 4 4 1 0 34B 4 4 1 035A 4 4 1 0 35B 4 4 1 036B 4 4 1 0 36A 4 4 1 037B 4 4 1 0 37A 4 4 1 038B 4 5 1.25 0.25 38A 4 4 1 0.062539A 4 4 1 0 39B 4 4 1 040A 4 4 1 0 40B 4 4 1 0
3' TOTALS 160 166 1.03 -0.5 16 168 1.050 2.75SQUARE 1.07 0.250 1.103AVERAGE DIFFERENCE 0.0125STANDARD DEVIATION -050.13 0.262 0.218SUM OF DIFFERENCE -.SUM OF DIFF SQR 0.25SUM OF SQR OF DIF 2.75M 40 SQRT 6.32STND DEV 0.265PAIRED T TEST 0.29 (not sig. at .01 level)
S.................................... .,-"°,'.°

TABLE IV. GLASS IONOMER AFTER VRS ZINC PHOSPHATE AFTER
GLASS IONOMER ZINC PHOSPHATEDIFF
TOOTH # OBSER SUM AVER DIFF TOOTH OBS SUM AVER. SQR
1B 4 4 1 0 1A 4 4 1 02B 4 4 1 -1 2A 4 8 2 13A 4 4 1 -1 3B 4 8 2 14B 4 5 1.25 -1.25 4A 4 10 2.5 1.56255B 4 4 1 -2 5A 4 12 3 46B 4 4 1 -1 6A 4 8 2 17B 4 4 1 -2.25 7A 4 13 3.25 5.06258A 4 4 1 -2.25 8B 4 13 3.25 5.06259B 4 4 1 -1 9A 4 8 2 110A 4 4 1 -1 lOB 4 8 2 111A 4 4 1 -1 11B 4 8 2 112A 4 5 1.25 -0.75 12B 4 8 2 0.562513B 4 5 1.25 -1.5 13A 4 11 2.75 2.2514B 4 4 1 -1.25 14A 4 9 2.25 1.562515A 4 5 1.25 -2 15B 4 13 3.25 416B 4 5 1.25 -1 16A 4 9 2.25 117B 4 8 2 0 17A 4 9 2 018B 4 4 1 -2.5 18A 4 14 3.5 6.2519B 4 4 1 -0.75 19A 4 7 1.75 0.562520A 4 4 1 -1 20A 4 8 2 121B 4 8 2 -1 21B 4 12 3 122A 4 4 1 -3 22B 4 16 4 923B 4 4 1 -2 23A 4 12 3 4
24A 4 5 1.25 -0.75 24B 4 8 2 0.562525B 4 4 1 -1 25A 4 8 2 126B 4 4 1 -2 26A 4 12 3 427A 4 5 1.25 -2.25 27B 4 14 3.5 5.062528B 4 4 1 -1.75 28A 4 11 2.75 3.062529A 4 4 1 -1.25 29B 4 9 2.25 1.562530B 4 4 1 -2.25 30A 4 13 3.25 5.062531B 4 4 1 -1.5 31A 4 10 2.5 2.2532B 4 4 1 -0.75 32A 4 7 1.75 0.562533A 4 4 1 -2 33B 4 12 3 434A 4 4 1 -0.75 34B 4 7 1.75 0.562535A 4 4 1 -1 35B 4 8 2 136B 4 5 1.25 0 36A 4 5 1.25 037B 4 4 1 -1 37A 4 8 2 138B 4 4 1 -2 38A 4 12 3 439A 4 4 1 -2.25 39B 4 13 3.25 5.062540A 4 4 1 -0.75 40B 4 7 1.75 0.5625TOTALS 160 176 1.1 53.75 16 392 2.444 92.1875
SQUARE 1.21 2889.0 5.972AVERAGE DIFF. 1.34STANDARD DEV. 0.22 0.71 0.672SUM OF DIFF. 53.75(DIFF) SQR 2889.0SUM (DIFF) SQR 92.18M = 40 SQRT 6.324STND DEV : 0.71PAIRED T TEST 11.87 (sig at .01 level)

TABLE V. COMPARISON OF SUBSET TO TOTAL SETS
SET OF 30 VRS SET OF 40 GLASS IONOMER BEFORE
30 40
SUM AVER. S.D. SUM AVER. S.D. DIFFERENCE
126 1.05 0.20 166 1.04 0.20 0.01
SET OF 30 VRS SET OF 40 GLASS IONOMER AFTER
30 40
SUM AVER. S.D. SUM AVER. S.D. DIFFERENCE
- 135 1.12 0.20 176 1.10 0.20 0.03
SET OF 30 VRS SET OF 40 ZINC PHOSPHATE BEFOPE
30 40
SUM AVER. S.D. SUM AVER. S.D. DIFFERENCE
128 1.07 0.66 168 1.05 0.66 0.02
SET OF 30 VRS SET OF 40 ZINC PHOSPHATE AFTER
30 40
SUM AVER. S.D. SUM AVER. S.D. DIFFERENCE
" 295 2.45 0.66 392 2.44 0.66 0.01
-i,
: .

TABLE VII. CA++ ION AND pH DETERMINATION OF TEN MATCHED SETS
Ca++ pHI pH 2TEETH # Ca++ pH 1 pH 2 Av. pH DIFF DIFF DIFF
3A G 0.14 5.30 5.22 5.26 0.18 0.74 0.263B Z 0.32 6.04 5.50 5.77
4A Z 0.36 5.50 5.80 5.65 0.35 0.40 0.174B G 0.01 5.10 5.53 5.32
5A Z 0.34 5.68 5.50 5.59 0.32 0.78 0.395B G 0.02 4.90 5.11 5.01
6A Z 0.35 5.61 5.75 5.68 0.16 0.38 0.456B G 0.19 5.23 5.30 5.27
IOA G 0.18 5.20 4.54 4.87 0.13 0.12 0.53lOB Z 0.31 5.08 5.07 5.08
28A Z 0.35 5.91 5.45 5.68 0.24 0.86 0.4628B G 0.11 5.05 4.99 5.02
31A Z 0.35 6.30 5.92 6.11 0.28 1.06 0.8631B G 0.07 5.24 5.06 5.15
36A Z 0.34 5.82 5.75 5.79 0.20 0.60 0.57
36B G 0.14 5.22 5.18 5.20
39A G 0.17 4.76 4.78 4.77 0.18 1.09 0.74
39B Z 0.35 5.85 5.52 5.69
40A G 0.05 4.98 4.78 4.88 0.06 0.78 0.9940B Z 0.11 5.76 5.77 5.77
SUMS 4.26 108.53 106. 107.53 2.10 6.81 5.42
.4 AVERAGE 0.21 5.43 5.33 5.38 0.21 0.68 0.54
STND DEV. 0.12 0.41 0.38 0.37 0.08 0.29 0.24
PAIRED T 7.88 7.36 6.99(all sig. at .01 level)
Si.
12,
**

TABLE VIII.OBSERVER ERRORS BETWEEN 1ST AND 2ND DECALCIFICATION READINGS
GLASS IONOMER ZINC PHOSPHATEGRAND
BEFORE AFTER TOTAL BEFORE AFTER TOTAL TOTAL
2 7 9 3 22 25 34
AV. ERROR (%)
1.25% 4.38% 3.44% 1.88% 14.0% 15.63% 7.8%
TOTAL OBSERVATION DIFFERENCES 5.32%(ALL DIFFERENCES WERE ONE SCALE INCREMENTS)
SCALE:
1 = NO COLOR DIFFERENCES
2 = SLIGHT COLOR DIFFERENCES
3 = WHITENING
4 = DISCOLORATION WITH ROUGHNESS
5 = CARRIES
TABLE IX. CALCIUM ION CONCENTRATION AND AVERAGE PH
GLASS IONOMER ZINC PHOSPHATECa++ PH
TEETH # CA++ Av. pH # [Ca++] Av.pH DIF DIFF
3A 0.14 5.26 3B 0.32 5.77 -0.1 -0.54B 0.01 5.32 4A 0.36 5.65 -0.3 -0.35B 0.02 5.01 5A 0.34 5.59 -0.3 -0.56B 0.19 5.27 6A 0.35 5.68 -0.1 -0.41OA 0.18 4.87 lOB 0.31 5.08 -0.1 -0.228B 0.11 5.02 28A 0.35 5.68 -0.2 -0.631B 0.07 5.15 31A 0.35 6.11 -0.2 -0.936B 0.14 5.20 36A 0.34 5.79 -0.2 -0.5
* 39A 0.17 4.77 39B 0.35 5.69 -0.1 -0.940A 0.05 4.88 40B 0.11 5.77 -0.0 -0.8
.4!1 SUMS 1.08 50.75 3.18 56.8 -2.1 -6.0
AVERAGES 0.11 5.08 0.32 5.68 0.21 0.61
VARIANCE .00 0.03 0.01 0.06 0.01 0.06
STND DEV. 0.06 0.18 0.07 0.24 0.08 0.,4
PAIRED T 7.88 7.89(all sig. at .01 level)
.,,-0 , -.

%,
FIG. 1. Matched teeth inacrylic blocks ready formounting.
FIG. 2. Examples ot enamelsurface changes.
A. NONE: No change, normalsurrace
B. MILD: Slight change in
enamel color (at arrow).
-
-. .. .. . . . ... . . .
. . . . . .. . . . . . . . . . . . . . . . . . .
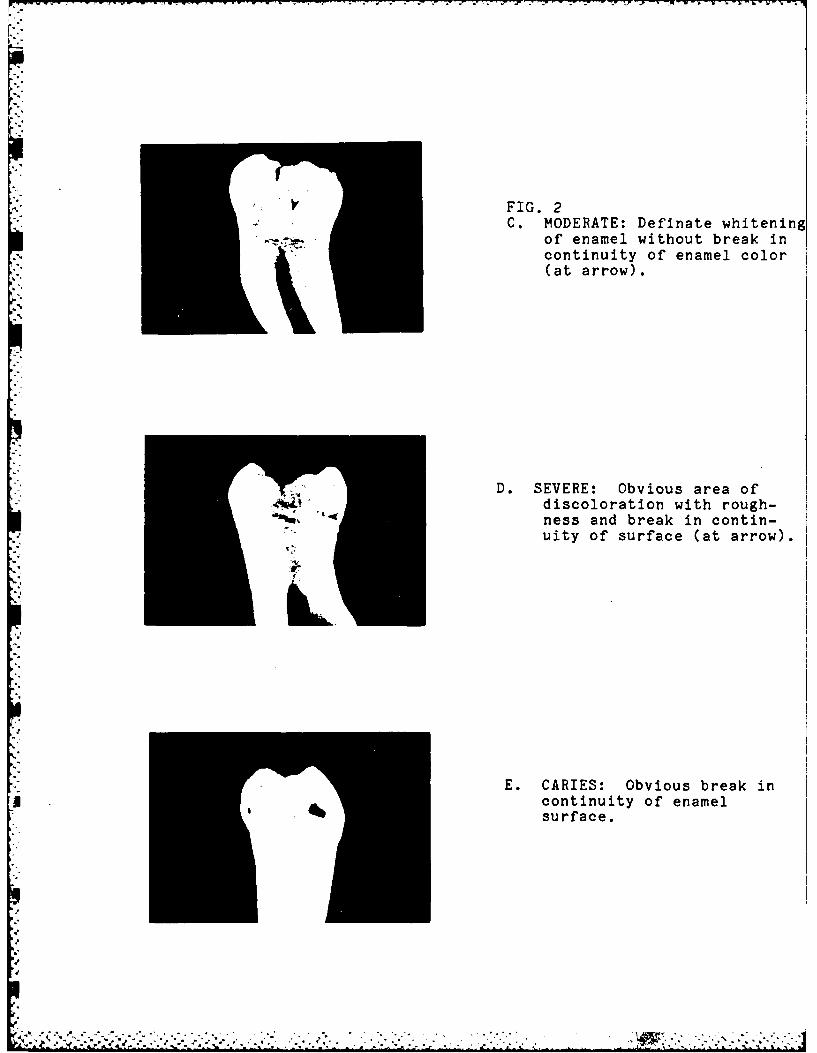
FIG. 2C. MODERATE: Definate whitening
of enamel without break incontinuity of enamel color(at arrow).
D. SEVERE: Obvious area ofdiscoloration with rough-
"ness and break in contin-uity of surface (at arrow).
E. CARIES: Obvious break incontinuity of enamelsurface.

FIG. 3. Banded tooth withcontrol afteracid cycling;note, complete decalcifi-cation of non-banded control• tooth.
FIG. 4. Glass ionomer (G)tooth sample with control (C).after decalcification; note,adherence of the glass ionomercement to the surface of thedebanded sample (at arrow).
FIG. 7. Tooth sample cementedwith zinc phosphate cement; nolindistinct border between banddarea and non-banded area (arroCompare these surfaces with th
7 glass ionomer cemented samples.1(fig. 8.)
'A- buccal
A.buccal

FIG 7. B. Lingual
FIG. 7. C. Mesial
FIG. 7. D. Distal
-I

FIG. 8. Matching tooth fromfig. 7. cemented with glassionomer cement; note, in bandedareas, the glassy surfaces andthe distinct borders betweenbanded and non-banded areas(arrows).
A. Buccal
B. Lingual
, 'V

,-'-'FIG. 8. C. Mesial
,* ,
" FIG. 8. D. Distal
WI!
4*7
*.!

FIG 5. AVERAGE PH OF TEST SOLUTIONSZINC PrOSPHATE MAS CLASS rivNomzt
7. __L
a.-- N
p 3 4 5 6 Y 10 26 1 6 3 4
rooTH SE JMBR
fla tooffEt p.w
-~a ' *yi:. % i

FIG 6. CALCIUM ION CONCENTRATIONZINC PHWOSPSiATZ MS ClASS IONOMRA
0.4-
.4.
026 - - - - - - - - - -
0.15 - - - -- - - -- -
0.1. N 'I' F - - *
0.05 - - -
a 4 6 6 10 .08 at1 861 89 40
TOOTH SET NUMBERZJgluml tonow11 Uino phosphate

FISHER SPECTROPHOTOMETRIC CALCIUM DETERMINATION METHOD
1. Prepare working standards as follows from Fisher's 15mg%
stock.
Standard ml distilled water mg% final conc.
-< 0 ml 0.3 ml blank
0.1 ml 0.2 ml 5 mg%
0.2 ml 0.1 ml 10mg%
0.3 ml 0 ml 15mg%
2. Mark test tubes as follows: B (blank): 5S, 1OS, and 15S
(standards). C (controls), and numbers for unknowns.
3. Pipette 0.1 ml of each sample directly into the bottom of the
correspondingly marked test tube
4. Add 3.0 ml of cresolphtlaein complexone (CS-952A) to each
tube, and mix well.
5. Add 3.0 ml of diethylamine (CS-952B) to each tube, and mix
well.
6. Incubate all tubes at room temperature (20-300 C) for 5
minutes.
7. Read the absorbance of each sample against the reagent blank
set a zero absorbance at 54Onm.'-4
* , 8. Plot the absorbance of each standard (5, 10, and 15 mg% )
against its concentration. Read the values for all unknowns
directly from the graph.
9. Results are expressed as mg% (mg/dl).

FILMEDI
12-85
DTIC4~~~~~~. ...~ ....... .. .. .. ....-