Notes on Placer Mining in British Columbia for the Information of the ...

676971
Mining Research
M I C H A E L D U R O S E . (416) 359-6194
October 13, 1995 Toronto, Ontario
Westmin Resources ( W M I — T S E , V S E )
Turnaround at Myra Falls and Exploration Success at Wolverine Lake Revitalizes Company
Recent 52-Week EPS/CFPS P/E & P/CF Target Price High-Low 1994A 1995E 1996E 1994A 1995E 1996E Yield Price Rating
$7 $8 3/8 - $5 ($0.77) ($0.57)
$0.26 $0.78
$0.50 $1.03
N/A 26.9 14.0 N/A 9.0 6.8
2.9% $9 1/2 4
Summary and Recommendation
The outlook for Vancouver-based Westmin Resources is the brightest it has been in several years. Since resolving a labour dispute at its M y r a Falls operation in late 1994, the operational performance at the mine has improved significantly. Growing metal production, combined with significantly reduced mining costs, wi l l result in Westmin reporting positive earnings and cash flow for the first time since 1990. Westmin's balance sheet has been severely eroded after experiencing years of operating losses. However, the company's improving f i nancial performance gives it the financial flexibility to restructure and strengthen its balance sheet moving forward. Priority has been placed on paying down its large debt level. The net result w i l l be declining interest obligations and, ultimately, improved earnings and cash flow. The exploration results being generated at the Wolverine L a k e Discovery in the Y u k o n indicate that a mine is in the making. We believe that the medium to long-term exploration potential in this region is very significant. Westmin's improving f i nancial position, combined with the very promising exploration results emerging from the Wolverine project, leads us to rate the stock a buy (4) with a 12-month target price of $9 1/2.

Table of Contents
The Company 2
The M y r a Falls Operation — A n Update 3 Myra Falls Labour Dispute Resolved 3 Ore Reserves and Production Forecasts 4 Minesite Exploration Potential 6 Summing Up 7
Premier Gold Mine 7
Coal Assets 7
Outside Exploration Programs 8
Background 8 New Base Metal Discovery at Wolverine Lake, Yukon 8 Other Exploration Programs 12
Revenues and Earnings 13
Growing Cash Flows and Earnings 13
Sensitivity Analysis 13
Balance Sheet Restructuring 14
Valuation and Target Price 14
Summary and Conclusion 16
Appendix 17

Page 2 Westmin Resources
The Company
Vancouver-based Westmin Resources is a growth-oriented mining company focusing on base metal, gold and coal development opportunities in British Columbia, the Yukon and Alberta. Brascade Resources Inc., a subsidiary of Brascan, is the majority shareholder, owning 76.0% of the common shares outstanding. Westmin's main operating asset is the Myra Falls copper-zinc-gold-silver mine located near Campbell River, Vancouver Island. The company also owns the 2,000-tonne-per-day Premier gold mill in northern British Columbia that is currently custom milling precious metal concentrates from the Snip Mine. Other sources of revenue include lease payments from a coal property located in northcentral Alberta. Westmin's primary growth strategy is to increase its base metal and gold reserves by expanding its existing mineable reserves at Myra Falls, as well as systematically explore for other base metal and gold deposits in British Columbia, the Yukon and Alaska.
JohrillllM
Frenchy
B Westmin Operations i n H f f i ^ B vestmin Exploration Properties . H n u g m m M
Custom Milling Opportunities ^ ^ ^ ^ ^ ^ ^ ^ B
Figure 1. Location of Westmin's Key Exploration Properties Source: Westmin Resources
D) NESBITT BURNS
Westmin Resources Page 3
Figure 2. Plan View and Vertical Section of Myra Falls Source: Westmin Annual Report, 1994
The Myra Falls Operation — An Update
M y r a F a l l s L a b o u r Dispu te Reso lved
The Myra Falls mine is an underground polymetallic mine producing copper, zinc, silver and gold. The mine is located on Vancouver Island near the town of Campbell River (Figure 1). A labour dispute that began April 24, 1993 was finally resolved in August 1994. The key issues that led to the strike included the high cost of unusual non-performance-based cash compensation items for unionized workers, as well as the general negative state of management-labour relations. A three-year collective agreement that expires August 15, 1997 was awarded through binding arbitration and signed. The main issues that were resolved included the elimination of a costly housing allowance, the removal of a daily attendance bonus for unionized workers, lowering of entry-level wage rates, maintaining the ability to manage an underground production bonus program, and having the ability to maintain open shop contracting out language.
(QjQ) NESBITT BURNS Mamhflr of ins Bank of MoiHiBflL Group of CompuniBs.

Page 4 Westmin Resources
In the past, management directed the mining operations with little input from the workers and miners. The flow of information between the various business units was restricted, resulting in low worker productivity. A key element of the labour negotiations was to empower the workers and use their ideas to improve the operational efficiency at the mine. Some of the new strategies adopted have included organizing a new operating team (including a new mine manager), engineering a new mining plan that emphasizes high output methods, and upgrading and modernizing mining equipment. The net result of all of these changes is that mining operating costs have decreased from an average of $65/tonne to $45/tonne this year. In addition, an ongoing long-term exploration effort has been implemented to expand and discover new reserves at Myra Falls. The outlook for the Myra Falls operation is the brightest it has been in several years.
Ore Reserves and Production Forecasts
The total mineable reserve base at Myra Falls is 9.7 million tonnes grading 1.7% copper, 6.6% zinc, 1.6 g/t gold, and 35.6 g/t silver from six different zones, sufficient for at least nine years of mine life (see Table 1).
Table 1 Myra Falls — Mineable Reserves
Zone/Deposit
H-W Gap Battle Gopher Gnu Extension (W37)
Proven & Probable (Tonnes)
5,615,240 713,475
2,546,442 371,780 334,580 136,300
Grades Gold
(g/t)
1.9 2.5
1 1
0.5 1.05
Silver (g/t)
33.3 121.2 20.3 13.7 27.5
1.2
Copper (%)
1.5 1.5
2 1.8 1.3 1.4
Zinc (%)
3.9 10.6 10.6 10.5
9 3.2
TOTAL 9,717,817 1.6 35.6 1.7 6.6
Source: Westmin Resources Annual Report 1994
Notes: Mineable Reserves as of January 1, 1995. Mine waste dilution is included Mineable Reserve and Categories. Total geological resource is 14.7 million tonnes at marginally higher grades than those stated above.
(Sjg) NESBITT BURNS Mimbir ol tho Bank of Montr..! Group of Comp.n, . .

Westmin Resources Page 5
Westmin Resources Limited Base Metal Production Trends
Metal Output (000s lbs)
200,000
150,000
100,000
50,000
1992A 1993A 1994A 1995E 1996E 1997E 1998E Year
Westmin Resources Limited Precious Metal Production Trends
Ounces (000s)
1,200
1,000
800
600
400
200
1992A 1993A 1994A 1995E 1996E 1997E 1998E Year
Figure 3. Metal Production Trends for Westmin Resources
Source: Westmin Resources Annual Reports 1992-1994; Nesbitt Burns Estimates
D) NESBITT BURNS Mop-bo.- ot tho Bulk of Mon-.raol Group at Compjn le i

Page 6 Westmin Resources
In 1992, prior to the strike, Myra Falls was processing 1.6 million tonnes of mill feed containing 37.0 million pounds of copper, 57.4 million pounds of zinc, 613,000 ounces of silver, and 34,000 ounces of gold. Production declined drastically during the strike in 1993 and 1994, with mill production reaching a low of 425,000 tonnes. With the resumption of operations, we project that the milling rate will increase to 3,450 tonnes per day (1.25 million tons) this year, and reach 3,850 tonnes per day (1.40 million tons) by 1997. Mining will focus on extracting ore from the H W and Battle-Gap zones. Our metal production projections for Myra Falls are illustrated in Figure 3, and summarized in Appendix 1. This year, the mine should produce 48 million pounds of copper, 88 million pounds of zinc, 604,000 ounces of silver, and 32,600 ounces of gold. In 1996, copper production should total 43 million pounds, with zinc production rising to 129 million pounds. The significant increase in zinc output reflects the higher zinc head grades being extracted from the Battle-Gap zones.
The metal production increases, combined with declining operating costs, are having a very positive impact on Westmin's bottom line earnings and cash flow. We expect that the company will report its first positive earnings since 1990 this year.
Minesite Exploration Potential
The exploration upside proximal to the Myra Falls minesite remains excellent as 40% of the ground remains unexplored. Myra Falls is a classic volcanogenic massive sulphide (VMS) environment. A key feature of V M S deposits is that they tend to occur in clusters reflecting the nature of the geological processes that led to their formation. Synvolcanic fault structures act as conduits that focus metal-bearing hydrothermal fluids up through the host rocks, eventually forming massive sulphides deposits on the seafloor. It is the combination of structural control (faulting), and stratigraphic control (the sea floor) which leads to V M S deposits forming in clusters. The prolific Rouyn-Noranda camp in northwestern Quebec, and the newly emerging Val D 'Or camp where Aur Resources (AUR-TSE) is working, are good examples of V M S base metal camps.
Through an ongoing systematic exploration effort, Westmin has been very successful discovering new reserves at Myra Falls. For example, in 1991, the Battle-Gap zones were discovered. More recently, the Trumpeter and Marshall zones have been found. Drilling results from the Marshall zone are shown in Table 2.
Table 2 Drilling Results from the Marshall Zone — Myra Falls Property
Drill Hole Intercept Zinc Copper Gold Silver (%) (%) (g/t) (g/t)
15-502 4.0 8.8 0.4 0.7 42.0 11.3 17.0 1.1 1.4 51.0
15-503 6.4 13.2 0.5 1.4 51.0 8.1 3.4 0.3 2.1 65.0
(Sj§) NESBITT BURNS Mimbir of tha Bank of Montreal Group of Companies

Westmin Resources Page 7
These are extremely good results and confirm the excellent exploration potential that exists on the property. We believe that the nine-year mine reserve at Myra Falls is a minimum, and that there is a lot of scope for future discoveries.
Summing Up
In summary, Westmin has turned around its operations at Myra Falls and this should serve as the foundation for Westmin's longer-term future growth. There remains very substantial exploration upside at the Myra Falls property as 40% of the ground remains to be tested. Areas of focus include the Trumpeter zone, as well as ongoing exploration at the Battle zone. The nine-year mine life at Myra Falls is likely a minimum, and we expect that the mineable reserve base will continue to increase over time.
Premier Gold Mine
At the Premier gold mining operation, located near Stewart, British Columbia, a custom milling contract was entered into to process ore from Cominco's nearby Snip Mine until March 1997. The mill on the Premier property has a daily capacity of 2,000 tonnes per day. Westmin has implemented an exploration effort in the vicinity of the Premier Mine to try and identify a new source of reserves for the mill . Ore reserves from the Northern Light Underground Zone, which has been the source of mill feed on the Premier property since 1992, were depleted in 1994. Key areas of exploration focus which hold the most promise for identifying new reserves include the Kansas/West Kansas Zones that occur immediately south of the previously mined out Facecut 35 zone. In addition, exploration work is testing for extensions to the mined out workings at the Premier gold mine.
If no new reserves can be identified by Westmin for the Premier M i l l , then the company will have to continue to focus on securing other custom milling contracts. Potential candidates include: renewing a longer-term contract for the Snip concentrates, and investigating the possibility of custom milling ore from a number of other potential mineral deposits in the region including Dome Mountain, or Red Mountain. It is conceivable that the Premier mill could be moved to the new Wolverine Discovery in the Yukon should this turn out to be an economic deposit.
Coal Assets
Westmin owns coal rights on approximately 222,800 hectares of freehold and leasehold lands with reserves of high quality, low sulphur coal. The mineral rights are held in north-central Alberta, mainly in the Wabamun Lake area, 60 km west of Edmonton.
NESBITT BURNS Mimbir of tht Bank of Montreal Group of Companies

Page 8 Westmin Resources
In the Highvale area, Westmin has 126 million tonnes of coal leased to TransAlta Uti l i ties Corporation's Whitewood coal mine and Wabamum power plant. The Magnolia coal field lands contain an estimated 106 million tonnes of mineable coal. In addition, there is a total of 240 million tonnes of coal reserves available for surface mining. Westmin is currently receiving an annual royalty stream of $5 million from its coal assets. Westmin's coal assets are not a core holding. We would view a move to sell its coal reserves and use the proceeds to pay down its debt load as a positive step.
Outside Exploration Programs
Background
Westmin spends approximately $3.0 million annually on mineral exploration and is searching for base metal and gold targets throughout British Columbia, the Yukon, and Alaska. As the company's financial position strengthens, it is likely that more money will be invested in mineral exploration. Westmin is focussing on targets in Western North America. Exploration projects in eastern Canada, including the Detour Lake area of northeastern Ontario and the Clearwater property in northern Quebec, have been farmed out. Westmin's exploration group has particular expertise in polymetallic massive sulphide exploration and is prioritizing these targets as part of its overall exploration strategy. Figure 1 on Page 2 illustrates the location of current exploration activities.
New Base Metal Discovery at Wolverine Lake, Yukon
Wolverine Project ; H B .-. W a s i m i n C l a i m s ':
. 'G fd f r ss j Q t h e i t ;
Y U K O N • T A N A N A TERRA N £ : - • j gg lntorkiy*rec! M a f i c a n d
F d s k M e i a r o l c t a i i c K i x & s -
Figure 4. Location of the Wolverine Discovery Source: Westmin Resources, Annual Report 1994
A significant new polymetallic base metal discovery has been made on the Wolverine Lake property in the Yukon. The property is a joint venture with Vancouver-based Atna Resources (ATN-VSE). Under the terms of the agreement, Westmin can earn a 60% interest in three properties, termed the Pak, the Foot and the Toe, by spending $3 million in exploration. Thereafter, expenditures are split proportionally.
The geology underlying these properties is very favourable to hosting volcanogenic massive sulphide (VMS) deposits similar to the Kidd Creek, Home, Louvicourt and Myra Falls Mines. In fact, Cominco's new A B M base metal discovery that hosts 13 mil-
(fHQ) NESBITT BURNS Mimb»i o* lh« Bank of '-' •••• -• Group of Cornpmiat

Westmin Resources Page 9
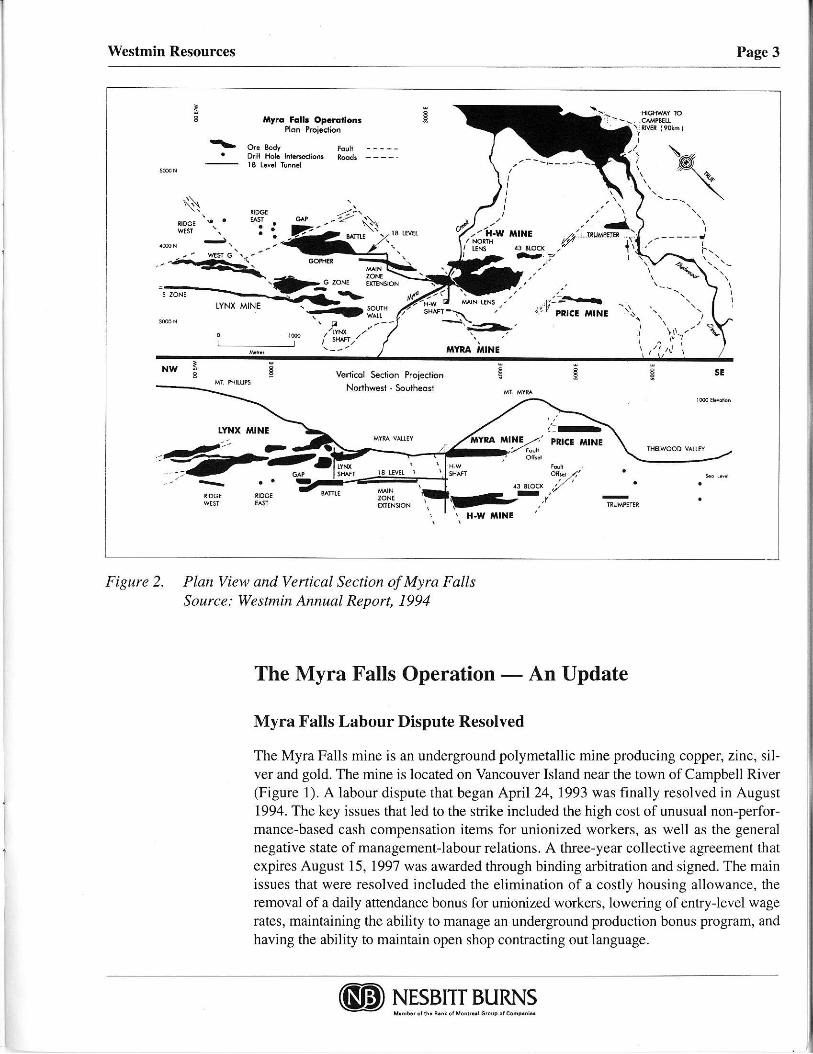
lion tonnes grading 1.0% copper, 5.5% zinc, 1.3% lead, 125 g/t silver, and 1.2 g/t gold is located approximately 25 kilometres north of the Wolverine discovery in a similar geological setting. Although still relatively early in the exploration process, the mineralization hosted at the Wolverine discovery is very near surface, and has exceptionally high zinc, gold, and silver grades. The assay results from the first eight drill holes at the Wolverine discovery are listed in Table 3. Figure 5 illustrates a plan view and west-facing section for the Wolverine property.
Table 3 Wolverine Massive Sulphide Deposit
Summary of Drill Results
Drill Hole Interval Copper Lead Zinc Gold Silver (m) (%) (%) (%) (g/t) (g/t)
W V 95-1 3.9 0.3 0.5 10.2 0.3 59.6 WV 95-4 8.3 0.6 3.5 14.2 7.6 1,348.9 W V 95-5 6.8 1.5 1.4 19.2 2.5 435.1 W V 95-8 2.2 0.8 1.6 11.2 2.0 485.8 WV 95-9 5.4 2.7 0.3 12.4 0.8 183.6 WV 95-10 7.4 0.4 2.3 15.4 2.6 253.3 WV 95-11 9.3 1.4 1.7 14.5 1.1 248.8 WV 95-12 11.9 0.9 0.8 9.0 2.3 316.2
Average 6.9 1.1 1.5 13.3 2.4 416.4
Based on the drilling completed to date, we estimate that the Wolverine discovery has 150 metres of strike length, 450 metres of down dip extent and an average width of 6.5 metres. This implies a tonnage of 1.7 million tonnes so far. The deposit remains open at depth and along strike. We are confident that this tonnage will increase with further drilling.
The histograms in Figure 6 illustrate that the quality of the metal grades reported to date are among the highest for this deposit type. Although at this stage the deposit is relatively small, indications are the deposit size will grow.
The purpose of the current drilling program, which will last until the end of November, is to increase the tonnage of the known mineral deposit both along strike and down dip of the known intersections. There are currently two drill rigs working on this delineation drilling program. In addition, a third drill has been mobilized to the property to test a number of other targets on the property. Thus far, a new separate zone of mineralization termed the Fisher Zone has intersected anomalous copper-zinc-lead-gold-silver mineralization in the form of semi-massive and stringer sulphides. This suggests that the medium to long-term exploration potential on this property is very significant. The key to the project is to continue to build up the tonnage of the known mineral deposits through a systematic, integrated exploration effort. A n airborne geophysical survey (magnetics and electromagnetics) will be conducted during the winter to define priority targets for ground follow-up in the spring.
QB) NESBITT BURNS Member of the Bank of Montreal Group of Companies

Page 10 Westmin Resources
D r i l l H o l e C o l l Atna PeaourcBH Lid
WOLVERINE PROJECT F O O T C L A I M S
Figure 5. Plan View and West-Facing Section of the Wolverine Zone Source; Westmin Resources
NESBITT BURNS U i n i b i i of Ih« Bank of M o i m o i l Group of Conipanie i
Westmin Resources Page 11
25
Relative Ranking of Wolverine Discovery Versus Similar Deposit Types
25
20 ^ — Wolverine
Discovery
"55 o Q. 0) Q 4—
15
Num
ber o
10
5
0
10
5
0 0-500 500-1000 1000-1500 1500-2000 2000+
Total Deposit Size (US$ Million)
Source: Economic Geology Vol. 88 No. 6
Distribution of VMS Deposits by Quality of Reserves 12 i
o La 01
0-40 40-80 80-120 120-160 160-200 200+ Quality of Reserves (US$/tonne)
Source: Economic Geology Vol. 88 No. 6
Figure 6. Relative Ranking of the Wolverine Discovery Compared to Other Similar Deposit Types
NESBITT BURNS
Page 12 Westmin Resources
Other Exploration Programs
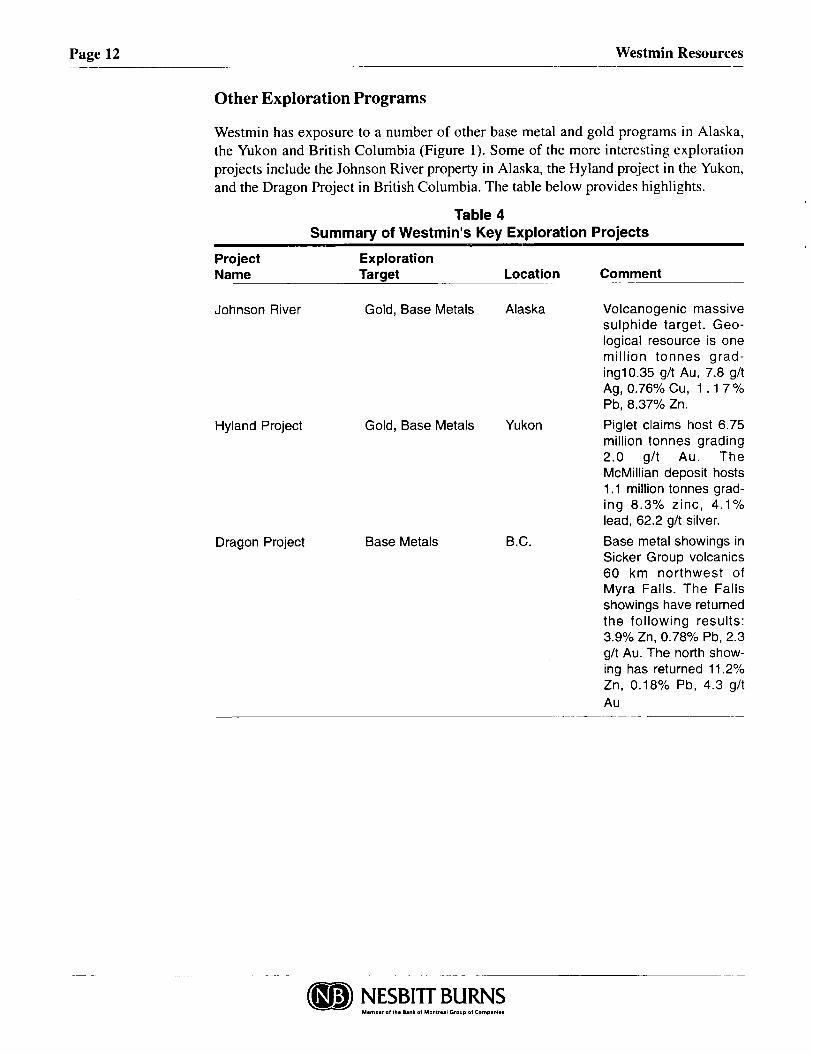
Westmin has exposure to a number of other base metal and gold programs in Alaska, the Yukon and British Columbia (Figure 1). Some of the more interesting exploration projects include the Johnson River property in Alaska, the Hyland project in the Yukon, and the Dragon Project in British Columbia. The table below provides highlights.
Table 4
Summary of Westmin's Key Exploration Projects
Project Exploration Name Target Location Comment
Johnson River Gold, Base Metals Alaska Volcanogenic massive sulphide target. G e o logical resource is one mil l ion tonnes grad-ing10.35 g/t Au, 7.8 g/t Ag, 0.76% C u , 1.1 7 % Pb, 8.37% Zn.
Hyland Project Gold, Base Metals Yukon Piglet claims host 6.75 million tonnes grading 2.0 g/t A u . The McMillian deposit hosts 1.1 million tonnes grading 8 . 3 % z inc , 4 . 1 % lead, 62.2 g/t silver.
Dragon Project Base Metals B.C. Base metal showings in Sicker Group volcanics 60 km northwest of Myra Fa l ls . The Fal ls showings have returned the fo l lowing resul ts : 3.9% Zn, 0.78% Pb, 2.3 g/t Au. The north showing has returned 11.2% Zn, 0.18% Pb, 4.3 g/t Au
NESBITT BURNS Mambar of tha Bank of Montreal Group of Companies

Westmin Resources Page 13
Revenues and Earnings
Growing Cash Flows and Earnings
We are projecting a significant turnaround in Westmin's operating cash flows and earnings performance this year, reflecting the resolution of the labour dispute at Myra Falls. Increased metal production combined with lower mining costs wil l result in Westmin reporting positive financial results for the first time since 1990. Our revenue and earnings projections are highlighted in Table 5 and further detailed in Appendix 1.
Table 5 Historical and Forecast Revenues and Earnings
($000s) except per share data
1994A 1995E 1996E 1997E 1998E
Mining Revenues 32,718 105,049 114,041 125,544 124,070 Per share $0.75 $2.23 $2.42 $2.66 $2.63 Mining Costs 41,609 56,356 56,502 55,902 53,900
Per share $0.88 $1.20 $1.20 $1.19 $1.14
After-tax earnings (loss) -24,786 17,779 28,667 30,484 32,730
Per share ($0.57) $0.38 $0.61 $0.65 $0.69
Earnings (loss) to common -33,396 12,241 23,465 25,618 28,199
Per share ($0.77) $0.26 $0.50 $0.54 $0.60
Operating Cash Flow ($24,786) $36,564 $48,377 $51,447 $52,942
Per share ($0.57) $0.78 $1.03 $1.09 $1.12
Wtd. Avg Shares O/S (000s) 43,536 47,110 47,110 47,110 47,110
Sensitivity Analysis
Westmin's earnings are very sensitive to changes in metal prices, as summarized in Table 6. Earnings are particularly sensitive to zinc prices.
Table 6 Sensitivity Analysis
Commodity % Change Earnings Impact
Copper 10% $0.09 Zinc 10% $0.14 Silver 10% $0.01 Gold 10% $0.03
(0$ NESBITT BURNS Mimbir of tha Bank of Montreal Group of Companiaa
Page 14 Westmin Resources
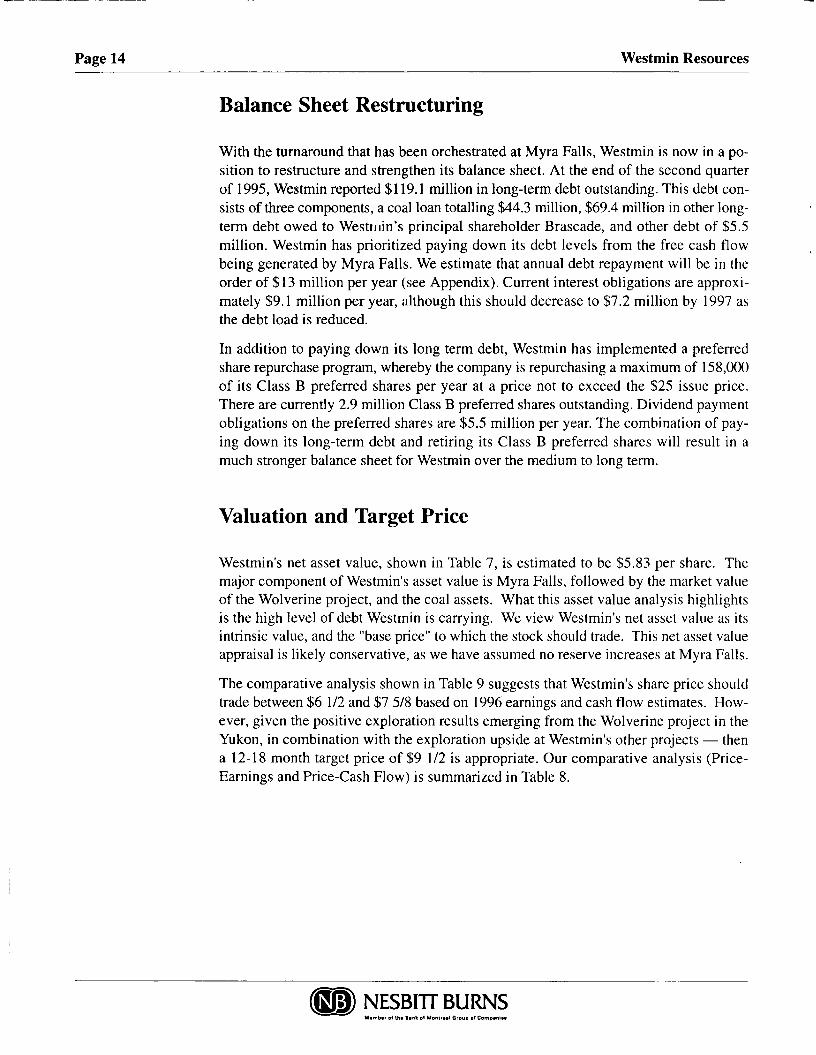
Balance Sheet Restructuring
With the turnaround that has been orchestrated at Myra Falls, Westmin is now in a position to restructure and strengthen its balance sheet. At the end of the second quarter of 1995, Westmin reported $119.1 million in long-term debt outstanding. This debt consists of three components, a coal loan totalling $44.3 million, $69.4 million in other long-term debt owed to Westmin's principal shareholder Brascade, and other debt of $5.5 million. Westmin has prioritized paying down its debt levels from the free cash flow being generated by Myra Falls. We estimate that annual debt repayment will be in the order of $13 million per year (see Appendix). Current interest obligations are approximately $9.1 million per year, although this should decrease to $7.2 million by 1997 as the debt load is reduced.
In addition to paying down its long term debt, Westmin has implemented a preferred share repurchase program, whereby the company is repurchasing a maximum of 158,000 of its Class B preferred shares per year at a price not to exceed the $25 issue price. There are currently 2.9 million Class B preferred shares outstanding. Dividend payment obligations on the preferred shares are $5.5 million per year. The combination of paying down its long-term debt and retiring its Class B preferred shares will result in a much stronger balance sheet for Westmin over the medium to long term.
Valuation and Target Price
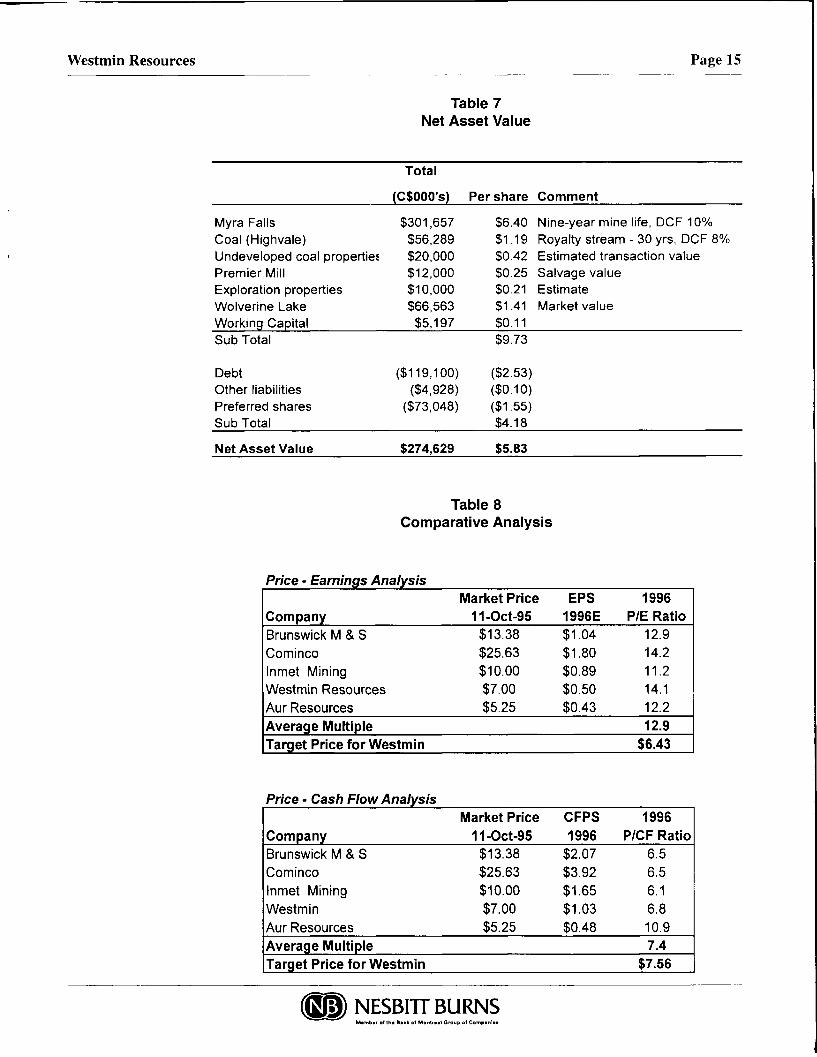
Westmin's net asset value, shown in Table 7, is estimated to be $5.83 per share. The major component of Westmin's asset value is Myra Falls, followed by the market value of the Wolverine project, and the coal assets. What this asset value analysis highlights is the high level of debt Westmin is carrying. We view Westmin's net asset value as its intrinsic value, and the "base price" to which the stock should trade. This net asset value appraisal is likely conservative, as we have assumed no reserve increases at Myra Falls.
The comparative analysis shown in Table 9 suggests that Westmin's share price should trade between $6 1/2 and $7 5/8 based on 1996 earnings and cash flow estimates. However, given the positive exploration results emerging from the Wolverine project in the Yukon, in combination with the exploration upside at Westmin's other projects — then a 12-18 month target price of $9 1/2 is appropriate. Our comparative analysis (Price-Earnings and Price-Cash Flow) is summarized in Table 8.
(fgj§) NESBITT BURNS Member of the Bank of Montreal Group of Companies
Westmin Resources Page 15
Table 7 Net Asset Value
Total
(C$000's) Per share Comment
Myra Falls $301,657 $6.40 Nine-year mine life, DCF 10% Coal (Highvale) $56,289 $1.19 Royalty stream - 30 yrs, DCF 8% Undeveloped coal properties $20,000 $0.42 Estimated transaction value Premier Mill $12,000 $0.25 Salvage value Exploration properties $10,000 $0.21 Estimate Wolverine Lake $66,563 $1.41 Market value Working Capital $5,197 $0.11 Sub Total $9.73
Debt ($119,100) ($2.53) Other liabilities ($4,928) ($0.10) Preferred shares ($73,048) ($1.55) Sub Total $4.18
Net Asset Value $274,629 $5.83
Table 8 Comparative Analysis
Price • Earnings Analysis Market Price EPS 1996
Company 11-Oct-95 1996E P/E Ratio Brunswick M & S $13.38 $1.04 12.9 Cominco $25.63 $1.80 14.2 Inmet Mining $10.00 $0.89 11.2 Westmin Resources $7.00 $0.50 14.1 Aur Resources $5.25 $0.43 12.2 Average Multiple 12.9 Target Price for Westmin $6.43
Price - Cash Flow Analysis Market Price CFPS 1996
Company 11-Oct-95 1996 P/CF Ratio Brunswick M & S $13.38 $2.07 6.5 Cominco $25.63 $3.92 6.5 Inmet Mining $10.00 $1.65 6.1 Westmin $7.00 $1.03 6.8 Aur Resources $5.25 $0.48 10.9 Average Multiple 7.4 Target Price for Westmin $7.56
(jSfj) NESBITT BURNS Mtmbir of the Benk of Montreal Group of Companies

Page 16 Westmin Resources
Summary and Conclusion
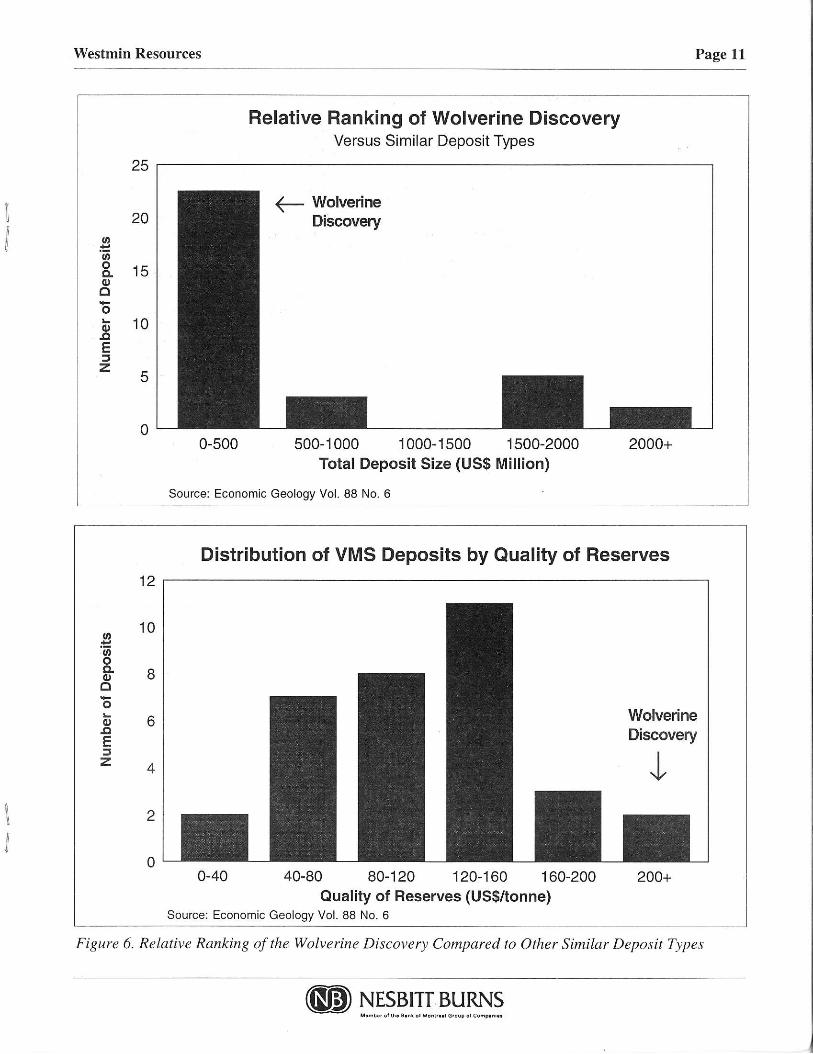
Westmin is a turnaround situation. The labour problems at the Myra Falls operation have been resolved and a new labour contract has been ratified. We are projecting a significant increase in the metal output from Myra Falls together with decreasing mine operating costs. The net result will be significantly enhanced operating earnings and cash flow. In fact, 1995 will be Westmin's first profitable year since 1990. Investors should be aware of Westmin's weak balance sheet — a situation that tempers the company's profitability. Nevertheless, the improved operating performance at Myra Falls gives the company the flexibility to continue to restructure and strengthen its balance sheet through paying down long-term debt, as well as retiring its preferred shares. Westmin's prospects are the best they have been in several years. The exploration success at Wolverine Lake has added sizzle to the stock, and there is a very good possibility that an economic discovery is in the making. Westmin is rated a 4 (buy) with a 12-month target price of $9 1/2.
15
10
5
1
0
-1
Monthly Price (High, Low, C lose, Moving Average)
•cm.
1980 1982 1984 1986 1988 1990 1992 1994
Earnings (4 Quarter Trailing) - WMI
15
10
5
1
0
-1
a) NESBITT BURNS

Westmin Resources
APPENDIX 1
Consolidated Statement Of Income and Retained Earnings
1994A 1995E 1996E 1997E 1998E Major Assumptions Copper $1.05 $1.33 $1.20 $1.20 $1.10 Zinc $0.45 $0.45 $0.50 $0.50 $0.55 Silver $5.29 $5.19 $5.25 $5.25 $5.25 Gold $384.00 $384.00 $385.00 $375.00 $375.00 Exchange rate (C$/US$) 1.37 1.38 1.38 1.33 1.33
Production Summary Copper (pounds) 7,871,893 48,316,289 43,090,560 45,830,451 44,189,140 Zinc (pounds) 11,012,110 88,128,911 128,967,513 165,636,642 159,704,751 Silver (ounces) 224,565 603,950 963,194 1,024,439 987,751 Gold (ounces) 9,058 32,613 32,318 34,373 33,142
Revenues Mining revenue 32,718 105,049 114,041 125,544 124,070 Coal Royalty 5,000 5,000 5,000 5,000 Investment and other income 1,521 1,500 1,500 1,500 1,500
34,239 111,549 120,541 132,044 130,570
Expenses Operating costs 41,609 56,356 56,502 55,902 53,900 Depletion and depreciation 4,666 18,785 19,710 20,963 20,213 Interest & financing expenses 7,393 9,143 8,176 7,209 6,241 Mineral exploration costs 2,465 3,000 3,500 3,500 3,500 Administration 2,076 2,250 2,250 2,250 2,250
58,209 89,534 90,138 89,824 86,104 Non-adjusted earnings (loss) before income taxes -23,970 22,015 30,403 42,220 44,466 Less one-time gain for coal arbitration award 0 2,500 0 0 0 Provision for deferred income taxes 816 1,736 1,736 11,736 11,736 Earnings (loss) (basic) -24,786 17,779 28,667 30,484 32,730 Less preferred share dividend 8,610 5,538 5,202 4,866 4,530 Earnings to common -33,396 12,241 23,465 25,618 28,199 Earnings (loss) per share (wtd. avg) (SO. 77) $0.26 $0.50 $0.54 $0.60 Earnings (loss) per share (basic) (S0.71) $0.26 $0.50 $0.54 $0.60 Net earnings (loss) fully diluted ($0.65) $0.24 $0.46 $0.50 $0.56 Operating cash flow ($24,786) $36,564 $48,377 $51,447 $52,942 Operating cash flow per share (wtd. avg) ($0.57) $0.78 $1.03 $1.09 $1.12 Operating cash flow per share (basic) ($0.53) $0.78 $1.03 $1.09 $1.12 Operating cash flow per share (fully diluted) ($0.48) $0.72 $0.95 $1.01 $1.05
Statement of Retained Earnings (Deficit)
Balance at beginning of year -134,678 -176,773 2,819 14,043 16,196
Net earnings (loss) -24,786 17,779 28,667 30,484 32,730 Increase (Reduction) of share capital -159,464 17,779 28,667 30,484 32,730 Dividends -17,309 -14,960 -14,624 -14,288 -13,952 Retained earnings end of year -176,773 2,819 14,043 16,196 18,777
Total shares outstanding Weighted average shares outstanding 43,536 47,110 47,110 47,110 47,110 Common 47,110 47,110 47,110 47,110 47,110 C lass B Preferred Shares 2,922 2,606 2,448 2,290 2,132 Options 1,354 1,354 1,354 1,354 1,354 Fully diluted shares outstanding 51,386 51,070 50,912 50,754 50,596
(f9g) NESBITT BURNS Mimbir of the Bank of Montreal Group of Companies
Page 18 Westmin Resources
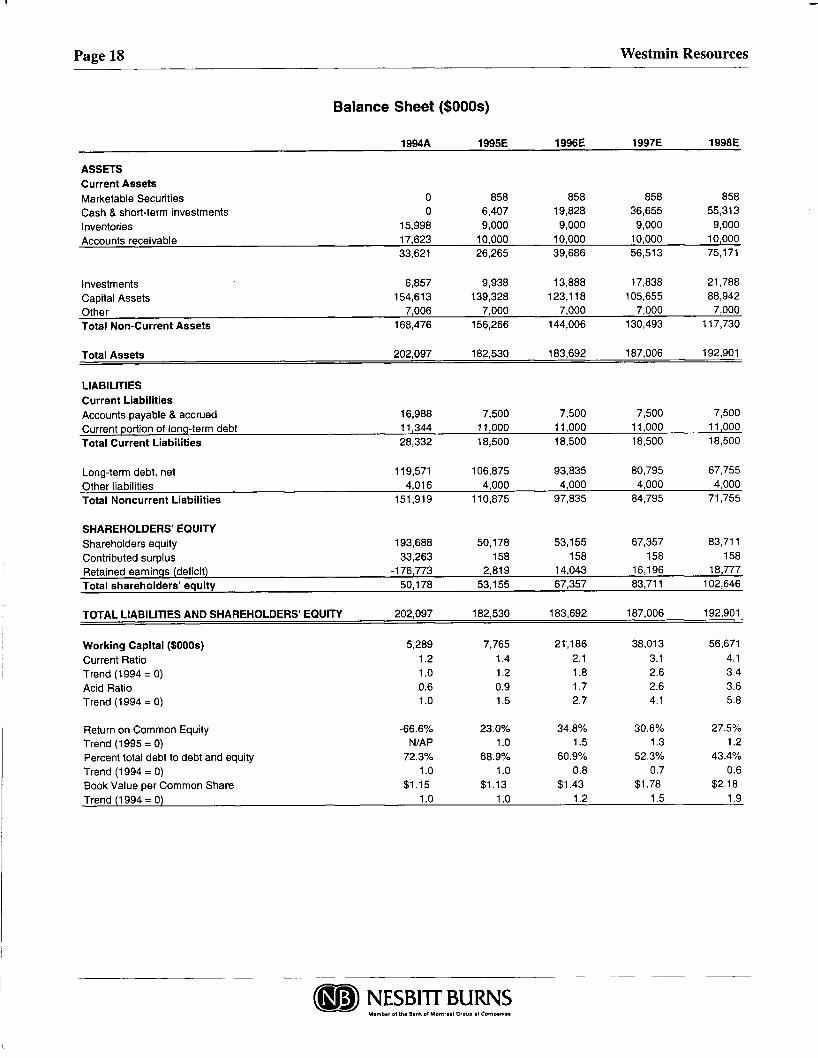
Balance Sheet ($000s)
1994A 1995E 1996E 1997E 1998E
ASSETS Current Assets Marketable Securities 0 858 858 858 858
Cash & short-term investments 0 6,407 19,828 36,655 55,313
Inventories 15,998 9,000 9,000 9,000 9,000
Accounts receivable 17,623 10,000 10,000 10,000 10,000 33,621 26,265 39,686 56,513 75,171
Investments 6,857 9,938 13,888 17,838 21,788
Capital Assets 154,613 139,328 123,118 105,655 88,942
Other 7,006 7,000 7,000 7,000 7,000
Total Non-Current Assets 168,476 156,266 144,006 130,493 117,730
Total Assets 202,097 182,530 183,692 187,006 192,901
LIABILITIES Current Liabilities Accounts payable & accrued 16,988 7,500 7,500 7,500 7,500
Current portion of long-term debt 11,344 11,000 11,000 11,000 11,000
Total Current Liabilities 28,332 18,500 18,500 18,500 18,500
Long-term debt, net 119,571 106,875 93,835 80,795 67,755
Other liabilities 4,016 4,000 4,000 4,000 4,000
Total Noncurrent Liabilities 151,919 110,875 97,835 84,795 71,755
SHAREHOLDERS' EQUITY Shareholders equity 193,688 50,178 53,155 67,357 83,711
Contributed surplus 33,263 158 158 158 158
Retained earnings (deficit) -176,773 2,819 14,043 16,196 18,777
Total shareholders' equity 50,178 53,155 67,357 83,711 102,646
TOTAL LIABILITIES AND SHAREHOLDERS' EQUITY 202,097 182,530 183,692 187,006 192,901
Working Capital ($000s) 5,289 7,765 21,186 38,013 56,671
Current Ratio 1.2 1.4 2.1 3.1 4.1
Trend (1994 = 0) 1.0 1.2 1.8 2.6 3.4
Acid Ratio 0.6 0.9 1.7 2.6 3.6
Trend (1994 = 0) 1.0 1.5 2.7 4.1 5.8
Return on Common Equity -66.6% 23.0% 34.8% 30.6% 27.5%
Trend (1995 = 0) N/AP 1.0 1.5 1.3 1.2
Percent total debt to debt and equity 72.3% 68.9% 60.9% 52.3% 43.4%
Trend (1994 = 0) 1.0 1.0 0.8 0.7 0.6 Book Value per Common Share $1.15 $1.13 $1.43 $1.78 $2.18
Trend (1994 = 0) 1.0 1.0 1.2 1.5 1.9
(®|§) NESBITT BURNS Mimbir of the Bank of Montreal Group of Companies
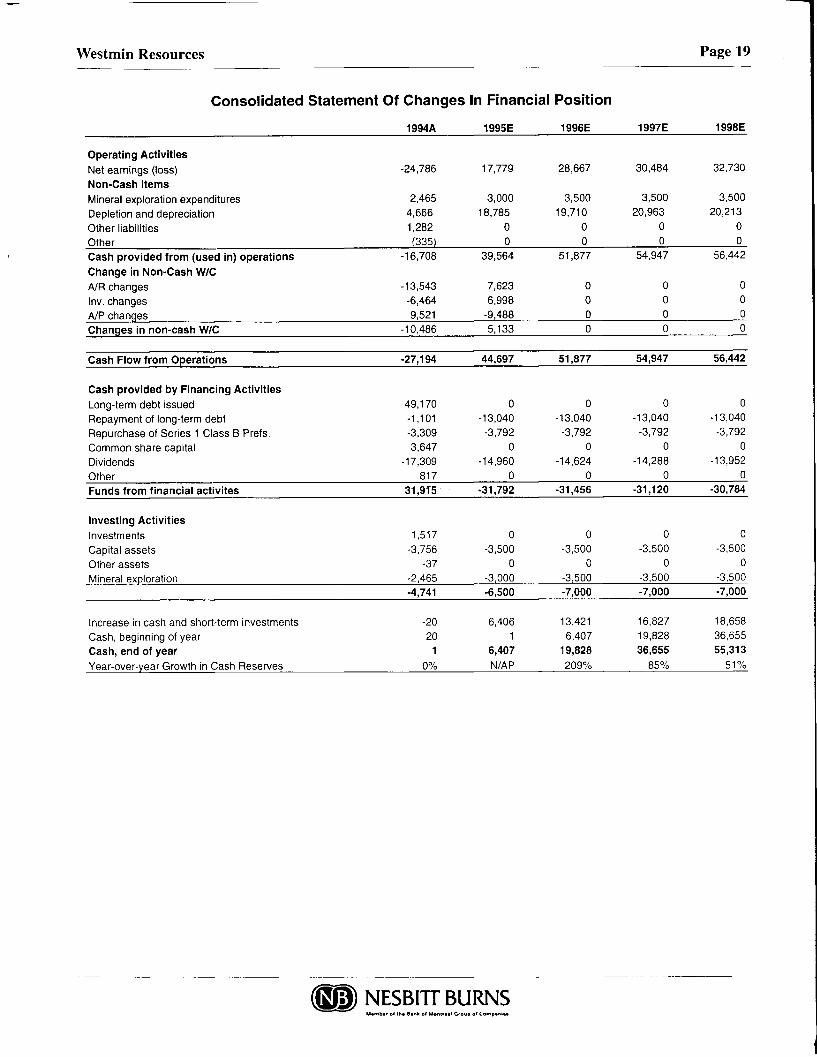
Westmin Resources Page 19
Consolidated Statement Of Changes In Financial Position
1994A 1995E 1996E 1997E 1998E
Operating Activities Net earnings (loss) -24,786 17,779 28,667 30,484 32,730
Non-Cash Items Mineral exploration expenditures 2,465 3,000 3,500 3,500 3,500
Depletion and depreciation 4,666 18,785 19,710 20,963 20,213
Other liabilities 1,282 0 0 0 0
Other (335) 0 0 0 0
Cash provided from (used in) operations -16,708 39,564 51,877 54,947 56,442
Change in Non-Cash W/C A/R changes -13,543 7,623 0 0 0
Inv. changes -6,464 6,998 0 0 0
A / P changes 9,521 -9,488 0 0 0
Changes in non-cash W/C -10,486 5,133 0 0 0
Cash Flow from Operations -27,194 44,697 51,877 54,947 56,442
Cash provided by Financing Activities Long-term debt issued 49,170 0 0 0 0
Repayment of long-term debt -1,101 -13,040 -13,040 -13,040 -13,040
Repurchase of Series 1 C lass B Prefs. -3,309 -3,792 -3,792 -3,792 -3,792
Common share capital 3,647 0 0 0 0
Dividends -17,309 -14,960 -14,624 -14,288 -13,952
Other 817 0 0 0 0
Funds from financial activites 31,9T5 -31,792 -31,456 -31,120 -30,784
Investing Activities Investments 1,517 0 0 0 0
Capital assets -3,756 -3,500 -3,500 -3,500 -3,500
Other assets -37 0 0 0 0
Mineral exploration -2,465 -3,000 -3,500 -3,500 -3,500
-4,741 -6,500 -7,000 -7,000 -7,000
Increase in cash and short-term investments -20 6,406 13,421 16,827 18,658
Cash , beginning of year 20 1 6,407 19,828 36,655
Cash, end of year 1 6,407 19,828 36,655 55,313
Year-over-year Growth in Cash Reserves 0% N/AP 209% 8 5 % 5 1 %
NESBITT BURNS

The opinions, estimates and projections contained herein are those of Nesbitt Burns Inc. ("NBI") as of the date hereof and are subject to change without notice. NBI makes every effort to ensure that the contents herein have been compiled or derived from sources believed reliable and contain information and opinions which are accurate and complete. However. NBI makes no representation or warranty, express or implied, in respect thereof, takes no responsibility for any errors and omissions which may be contained herein and accepts no liability whatsoever for any loss arising from any use of or reliance on this report or its contents. Information may be available to NBI which is not reflected herein. This report is not to be construed as, an offer to sell or solicitation for or an offer to buy, any securities. NBI, its affiliates and/or their respective officers, directors or employees may from time to time acquire, hold or sell securities mentioned herein as principal or agent. NBI may act as financial advisor and/or underwriter for certain of the corporations mentioned herein and may receive remuneration for same. NBI is a wholly-owned subsidiary of The Nesbitt Burns Corporation Limited which is a majority owned subsidiary of Bank of Montreal.
T O U.S. RESIDENTS: Nesbitt Burns Securities Inc., an affiliate of NBI accepts responsibility for the contents herein, subject to the terms as set out above. Any U.S. person wishing to effect transactions in any security discussed herein should do so through Nesbitt Burns Securities Inc.