
65 Comparative
10
ISSN: 2319-8753 International Journal of Innovative Research in Science, Engineering and Technology Vol. 2, Issue 5, May 2013 Copyright to IJIRSET www.ijirset.com 1738 COMPARATIVE ANALYSIS IN PIPE DESIGN BY ANALYTICAL AND GRAPHICAL METHODS FOR SELECTION OF MATERIALS Prof. Nitinchandra R. Patel 1 , Avinash Vasava 2 , Jalesh G. Vasava³, Alpesh V. Kunapara⁴, Savan D.Patel 5 Assistant Professor, Department of Mechanical Engineering, G. H. Patel college of Engineering & technology, Vallabh vidyanagar,Gujarat, India 1 Final year student, Department of Mechanical Engineering, G. H. Patel college of Engineering & technology , Vallabh vidyanagar, Gujarat, India 2,3,4,5 Abstract: The current phase of times is experiencing problems in proper piping system. It is necessary in industries like chemical, pharmaceutical, fertilizer for maintaining current situation in competitive world. For piping system, here a small move towards is focused on pipe analysis of different pipe materials. This paper consists of analysis of pipe flow by considering stresses induced in the materials of different standards. We have analysed different type of materials with the help of working medium as water at normal temperature. For particular selected condition, analytical calculation is done to find out the thickness, tangential stresses and radial stresses induced in pipe. Keywords: Pipe design, Analysis in Ansys, Optimum thickness, Best material evaluation. I. INTRODUCTION The pipes are used for transporting various fluid like water, steam, different type of gases, oil and other chemical with or without pressure from one place to another place. Cast iron, wrought iron, steel, and brass are the material generally used for pipes in engineering practice. The fluid to be conveyed in pipes whose temperature to be varied but the annual average temperature is 35 °C while the relative humidity varies generally from 70% during the day to 90% at night. The temperature of potable water to be conveyed in the pipelines will be about 30° C. The pipes used in petroleum industry are generally seamless pipes made of heat resistance chrome molybdenum alloy steel. Such type of pipe can resist pressure more than 4Nmm 2 and temperatures greater than 440 . c. The pipes for a particular use cannot be made of desired length. Therefore pipes of standard length are taken and joined together with the help of pipe joints of different types. Pipes and pipeline components, including their protective coatings and joint materials, that will or may come into contact with potable water shall not constitute a toxic hazard; shall not support microbial growth; shall not cause taste or odour, cloudiness or discoloration of the water. There are different shape and materials to be used for conveying fluid material. The joints to be used in piping system are one of the part of pipe which are used for changing direction or distributor. Pipes are the most delicate components in any process plant. They are also the busiest entities. They are subjected to almost all kinds of loads, intentional or unintentional. It is very important to take note of all potential loads that a piping system would encounter during operation as well as during other stages in the life cycle of a process plant. Ignoring any such load while designing, erecting, hydro-testing, start-up shut-down, normal operation, maintenance etc. can lead to inadequate design and engineering of a piping system. The system may fail on the first occurrence of this overlooked load. Failure of a piping system may trigger a Domino effect and cause a major disaster. We have analyzed different type of materials with the help of working medium as water at normal temperature. For particular selected condition, analytical calculation is done to find out the thickness, tangential stresses and radial stresses induced in pipe. Accordingly we can evaluate better material for the piping system. It will be helpful in putting forward the piping system as good as possible. Further we have compared the result obtained from analytical calculation by using MATLAB programming and analysis done by Ansys, a CAD software. Here, it is assumed that the pipe is subjected to internal pressure and therefore tangential and radial stresses are induced. In case of thick wall cylinder the tangential stress has higher magnitude at inner surface and gradually decreases
-
Upload
suyogbhave -
Category
Documents
-
view
230 -
download
0
description
Piping stress anlaysis
Transcript of 65 Comparative

ISSN: 2319-8753
International Journal of Innovative Research in Science, Engineering and Technology Vol. 2, Issue 5, May 2013
Copyright to IJIRSET www.ijirset.com 1738
COMPARATIVE ANALYSIS IN PIPE DESIGN
BY ANALYTICAL AND GRAPHICAL
METHODS FOR SELECTION OF MATERIALS
Prof. Nitinchandra R. Patel1, Avinash Vasava
2, Jalesh G. Vasava³, Alpesh V. Kunapara⁴, Savan D.Patel
5
Assistant Professor, Department of Mechanical Engineering, G. H. Patel college of Engineering & technology, Vallabh
vidyanagar,Gujarat, India1
Final year student, Department of Mechanical Engineering, G. H. Patel college of Engineering & technology, Vallabh
vidyanagar, Gujarat, India2,3,4,5
Abstract: The current phase of times is experiencing problems in proper piping system. It is necessary in industries
like chemical, pharmaceutical, fertilizer for maintaining current situation in competitive world. For piping system, here
a small move towards is focused on pipe analysis of different pipe materials. This paper consists of analysis of pipe
flow by considering stresses induced in the materials of different standards. We have analysed different type of
materials with the help of working medium as water at normal temperature. For particular selected condition, analytical
calculation is done to find out the thickness, tangential stresses and radial stresses induced in pipe.
Keywords: Pipe design, Analysis in Ansys, Optimum thickness, Best material evaluation.
I. INTRODUCTION
The pipes are used for transporting various fluid like water, steam, different type of gases, oil and other chemical with
or without pressure from one place to another place. Cast iron, wrought iron, steel, and brass are the material generally
used for pipes in engineering practice.
The fluid to be conveyed in pipes whose temperature to be varied but the annual average temperature is 35 °C while the
relative humidity varies generally from 70% during the day to 90% at night. The temperature of potable water to be
conveyed in the pipelines will be about 30° C. The pipes used in petroleum industry are generally seamless pipes made
of heat resistance chrome molybdenum alloy steel. Such type of pipe can resist pressure more than 4Nmm2 and
temperatures greater than 440.c.
The pipes for a particular use cannot be made of desired length. Therefore pipes of standard length are taken and joined
together with the help of pipe joints of different types. Pipes and pipeline components, including their protective
coatings and joint materials, that will or may come into contact with potable water shall not constitute a toxic hazard;
shall not support microbial growth; shall not cause taste or odour, cloudiness or discoloration of the water. There are
different shape and materials to be used for conveying fluid material. The joints to be used in piping system are one of
the part of pipe which are used for changing direction or distributor.
Pipes are the most delicate components in any process plant. They are also the busiest entities. They are subjected to
almost all kinds of loads, intentional or unintentional. It is very important to take note of all potential loads that a piping
system would encounter during operation as well as during other stages in the life cycle of a process plant. Ignoring any
such load while designing, erecting, hydro-testing, start-up shut-down, normal operation, maintenance etc. can lead to
inadequate design and engineering of a piping system. The system may fail on the first occurrence of this overlooked
load. Failure of a piping system may trigger a Domino effect and cause a major disaster.
We have analyzed different type of materials with the help of working medium as water at normal temperature. For
particular selected condition, analytical calculation is done to find out the thickness, tangential stresses and radial
stresses induced in pipe. Accordingly we can evaluate better material for the piping system. It will be helpful in putting
forward the piping system as good as possible. Further we have compared the result obtained from analytical
calculation by using MATLAB programming and analysis done by Ansys, a CAD software.
Here, it is assumed that the pipe is subjected to internal pressure and therefore tangential and radial stresses are induced.
In case of thick wall cylinder the tangential stress has higher magnitude at inner surface and gradually decreases

ISSN: 2319-8753
International Journal of Innovative Research in Science, Engineering and Technology Vol. 2, Issue 5, May 2013
Copyright to IJIRSET www.ijirset.com 1739
towards the outer surface. Along with this radial stress has significant magnitude so it is considered to be a case of thick
cylinder.
II. DESIGN FORMULATION
A. STRESS IN PIPES
Tangential stress at any radius x, According to Lame`s equation.
σt =p(ri)
2
(ro)2 − (ri)
2 1 +
(ro)2
x2
Radial Stress at any radius x,
σr =p(ri)
2
(ro)2 − (ri)
2 1−
(ro)2
x2
Maximum tangential Stress at any inner surface of the Pipe
σt(max ) =p (ro)
2 + (ri)2
(ro)2 − (ri)
2
Minimum tangential Stress at any outer surface of the Pipe
σt(min ) =2p(ri)
2
(ro)2 − (ri)
2
Maximum radial stress at inner Surface
σr(max ) = −p(compressive)
Minimum Radial Stress at the outer surface of the Pipe
σr(min ) = 0
B. WALL THICKNESS OF THE PIPE
According to thick cylindrical formula (Lame`s Equation)
t = R σt + p
σt − p− 1
A little consideration will show that the thickness of pipe wall as obtained by above equation is
too small. Therefore for the design of pipes, a certain constant is added to the above equation,
final thickness will be….
T = t + C
Here C = Weisback constant.
T = Final thickness of pipe
t = thickness of pipe
p = Internal fluid Pressure in the pipe
ri = Inner radius of the pipe ro= outer radius of the pipe
FIG.1 Pipe Cross section and stresses
ISSN: 2319-8753
International Journal of Innovative Research in Science, Engineering and Technology Vol. 2, Issue 5, May 2013
Copyright to IJIRSET www.ijirset.com 1740
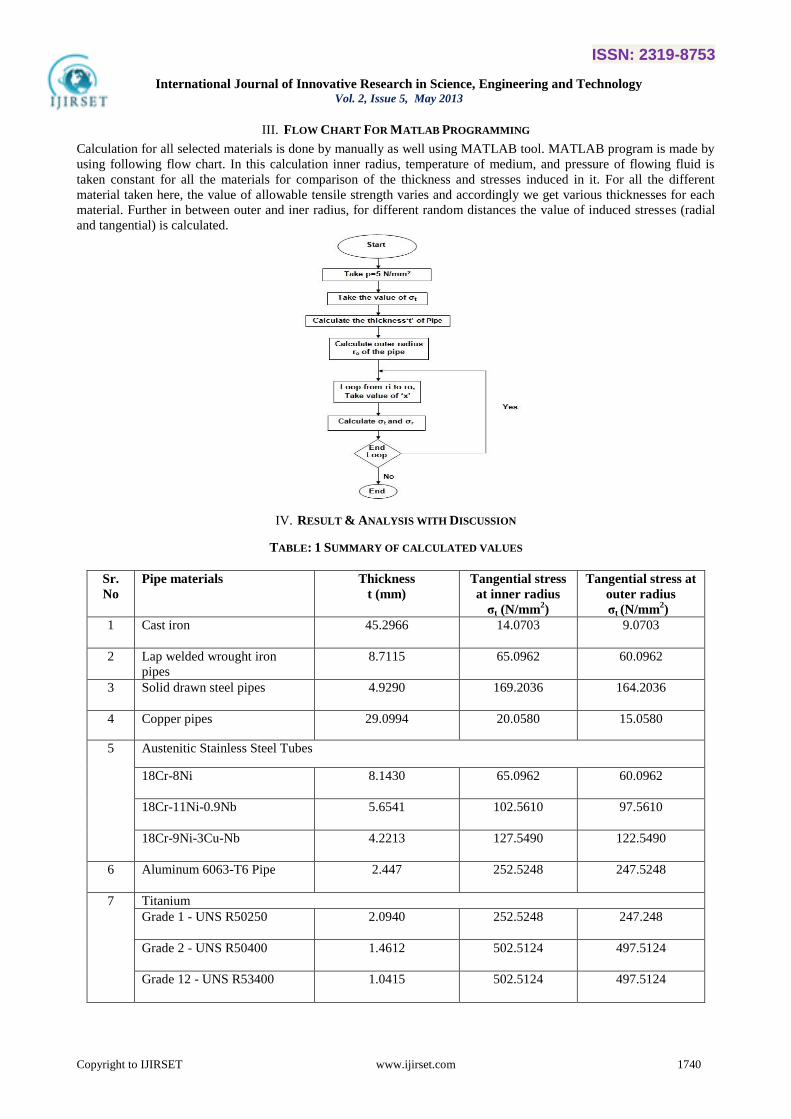
III. FLOW CHART FOR MATLAB PROGRAMMING
Calculation for all selected materials is done by manually as well using MATLAB tool. MATLAB program is made by
using following flow chart. In this calculation inner radius, temperature of medium, and pressure of flowing fluid is
taken constant for all the materials for comparison of the thickness and stresses induced in it. For all the different
material taken here, the value of allowable tensile strength varies and accordingly we get various thicknesses for each
material. Further in between outer and iner radius, for different random distances the value of induced stresses (radial
and tangential) is calculated.
IV. RESULT & ANALYSIS WITH DISCUSSION
TABLE: 1 SUMMARY OF CALCULATED VALUES
Sr.
No
Pipe materials
Thickness
t (mm)
Tangential stress
at inner radius
σt (N/mm2)
Tangential stress at
outer radius
σt (N/mm2)
1 Cast iron 45.2966 14.0703 9.0703
2 Lap welded wrought iron
pipes
8.7115 65.0962 60.0962
3 Solid drawn steel pipes 4.9290 169.2036 164.2036
4 Copper pipes 29.0994 20.0580 15.0580
5 Austenitic Stainless Steel Tubes
18Cr-8Ni
8.1430 65.0962 60.0962
18Cr-11Ni-0.9Nb
5.6541 102.5610 97.5610
18Cr-9Ni-3Cu-Nb
4.2213 127.5490 122.5490
6 Aluminum 6063-T6 Pipe 2.447 252.5248 247.5248
7 Titanium
Grade 1 - UNS R50250
2.0940 252.5248 247.248
Grade 2 - UNS R50400
1.4612 502.5124 497.5124
Grade 12 - UNS R53400
1.0415 502.5124 497.5124

ISSN: 2319-8753
International Journal of Innovative Research in Science, Engineering and Technology Vol. 2, Issue 5, May 2013
Copyright to IJIRSET www.ijirset.com 1741
FIG. 2 Comparative Thickness
We can observe from the calculated values and graph of the thickness v/s allowable tangential stress that as the value of
allowable tangential tensile stress increases, thickness decreases respectively. It means as the value of allowable
tangential stress is high, we requires low thickness of the pipe. As thickness decreases pipe will be light in weight and
becomes less costly as material requirement is low.
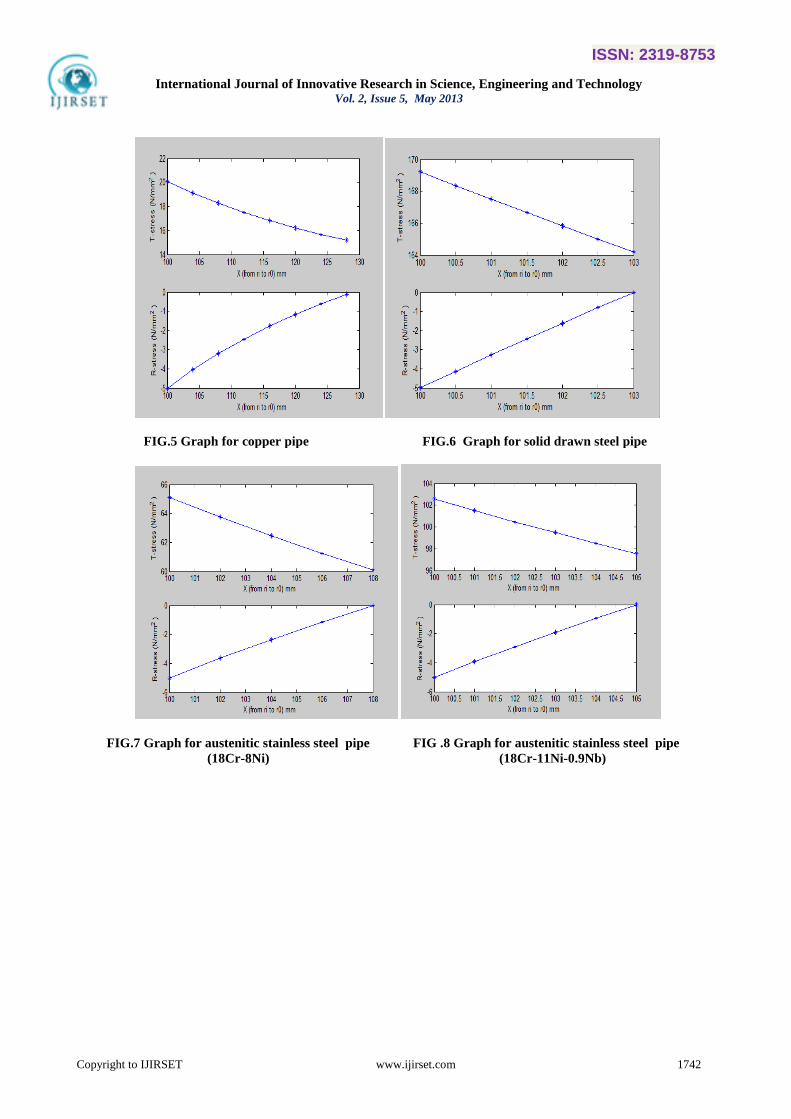
A. ANALITYCAL ANALYSIS
The following results are obtained from analytical data. It is said that as per theoretical information of the design of the
pipe, the tangential stress is maximum at the inner surface and minimum at the outer surface and the radial stress is
maximum at the inner surface of the pipe and the zero at the outer surface of the pipe. We can see this reality in graphs
obtained that as thickness increases tangential stress is decreases as well as radial stress is also decreases and tends to
zero at outer surface of the pipe.
If we change the working medium, internal pressure, flow discharge and internal radius of the pipe, the nature of stress
distribution curve will be same as we are getting the values here for particular material. For any materials metallic or
non-metallic materials the nature of stress distribution curve wiil be same.Following graphs related to strees v/s
thickness are plotted as per MATLAB programming for above different material.
FIG. 3 Graph for cast iron pipe FIG. 4 Graph for wrought iron pipe
0
5
10
15
20
25
30
35
40
45
50Th
ickn
ess
(m
m)
σt (N/mm2)
ISSN: 2319-8753
International Journal of Innovative Research in Science, Engineering and Technology Vol. 2, Issue 5, May 2013
Copyright to IJIRSET www.ijirset.com 1742
FIG.5 Graph for copper pipe FIG.6 Graph for solid drawn steel pipe
FIG.7 Graph for austenitic stainless steel pipe
(18Cr-8Ni)
FIG .8 Graph for austenitic stainless steel pipe
(18Cr-11Ni-0.9Nb)

ISSN: 2319-8753
International Journal of Innovative Research in Science, Engineering and Technology Vol. 2, Issue 5, May 2013
Copyright to IJIRSET www.ijirset.com 1743
FIG.9 Graph for austenitic stainless steel
(18Cr-9Ni-3Cu-Nb)
FIG .10 Graph for aluminium pipe
FIG.11 Graph for titanium (grade 1) FIG.12 Graph for titanium (grade 2)
FIG.13 Graph for titanium (grade 12)

ISSN: 2319-8753
International Journal of Innovative Research in Science, Engineering and Technology Vol. 2, Issue 5, May 2013
Copyright to IJIRSET www.ijirset.com 1744
B. GRAPHICAL ANALYSIS
For all the material of pipe as shown in below figures maximum tangential stress is at inner side of the shown by red
part and minimum tangential stress is at outer side of the pipe shown by blue colored part we can see from the analysis
image of this pipe that as per the theoretical reality from inner side to outer side of the pipe the tangential stress is
continuously decreasing. Here the thickness of the pipe varies from material to material.
FIG.14 Tangential stress induced in cast iron pipe
FIG.15 Tangential stress induced in wrought iron pipe
FIG.16 Tangential stress induced in copper pipe

ISSN: 2319-8753
International Journal of Innovative Research in Science, Engineering and Technology Vol. 2, Issue 5, May 2013
Copyright to IJIRSET www.ijirset.com 1745
FIG.17 Tangential stress induced in austenitic stainless steel pipe
FIG.18 Tangential stress induced in aluminum pipe
FIG.19 Tangential stress induced in titanium pipe
V. CONCLUSION
In thick pipes the stress over the section of the walls are uniformly distributed as we can see in our analytic data and the
graphical images. They develop both tangential and radial stresses with values which are dependent upon the radius of
the element under consideration.
From the calculated data we can see that the maximum tangential stress is at the inner radius and the minimum
tangential stress at the outer surface, accordingly we can compare and see this reality by graphical figure and the graph
of stress analysis. The radial stress is maximum at inner side of the pipe diameter and outer side radial stress is zero.
The maximum radial stress for all the materials is same as the internal working medium pressure is same for all the
materials.
From analytical and graphical method, we get maximum tangential stress 502.5124 N/mm2 for Titanium (grade-2) and
minimum tangential stress 14.0703 N/mm2 for cast iron pipe at inner radius 100 mm. also we get maximum tangential

ISSN: 2319-8753
International Journal of Innovative Research in Science, Engineering and Technology Vol. 2, Issue 5, May 2013
Copyright to IJIRSET www.ijirset.com 1746
stress 497.5124 N/mm2 for Titanium (grade-2) and minimum tangential stress 9.0703 N/mm
2 for cast iron pipe at outer
radius.
As we can see from the comparison graph of different materials (allowable stresses v/s thickness of the pipe), as the
allowable stress value increases the thickness value of the pipe decreases this means that the pipe required for that
material will be of less thickness and serves same purpose without failure. We get maximum thickness for cast iron as
45.29 mm and minimum thickness for Titanium as 1.0 mm. As thickness increases the pipe becomes bulky and uses
more metal and may increases the cost that depends on the material. Less thickness is thus preferable for use but the
same time we should conclude other physical condition as well as the characteristics of working medium with all the
parameters, like for water if we use iron pipe then it may corrode after some time. If we use copper or titanium pipe for
long distance piping system it will increase the cost because their cost is higher. So we have to consider cost and
application of the pipe for its proper design.
REFERENCES
[1] International Journal of Scientific & Engineering Research, Volume 3, Issue 1, January-2012, ISSN 2229-5518 “Simplified Pipeline
Calculations” by Tonye K. Jack. [2] International Journal of Scientific & Engineering Research, Volume 3, Issue 5, May-2012 , ISSN 2229-5518 “A Smart device to identify
Leakages in water pipeline” by Abbas Badami, Anmol Shahani, Fenil Shah
[3] International Journal of Scientific & Engineering Research, Volume 2 Issue 4, April -2011, ISSN 2229-5518 “Effect of Nanofluid Concentration on thePerformance of Circular Heat Pipe” by M.G.Mousa
[4] R.S.Khurmi & J.K.Gupta text book of “Machine Design”, first edition, S.Chand, Eurasia Publishing house, New delhi, India.
[5] V.B. Bhandari “Design of Machine Elements”, third edition McGraw-Hill Education India.
ACKNOWLEDGMENT
We would like to express our sincere thanks and gratitude to PROF. NITINCHANDRA R. PATEL (Department of
Mechanical Engineering) of G. H. Patel College of Engineering & Technology, Vallabh vidyanagar for devoting
much of his precious & valuable time during the entire research work & for offering numerous suggestions and
encouragement thus making this project possible.
AVINASH G. VASAVA. (ENRL NO.080110119057)
JALESH G. VASAVA (ENRL NO. 080110119059)
ALPESH V. KUNAPARA. (ENRL NO.090110119013)
SAVAN D. PATEL (ENRL NO. 090110119015)
BIOGRAPHY
Prof. Nitinchandra R. Patel is Assistant Professor in Mechanical Engineering department of
G. H. Patel College of Engineering & technology, Vallabh vidyanagar, Gujarat, India. He
completed Master degree in Machine Design in 2004 from Sardar Patel University, Vallabh
vidyanagar and Bachelor degree in Mechanical Engineering in 1997 from B.V.M.
Engineering College, Sardar Patel University. He has 5 years working experience in Industries
and 11 years in Teaching. He is a member of ASME, Associate member of Institute of
Engineers (I) and Life member of ISTE. He is also recognized as Chartered Engineer by
Institute of Engineers (I) in Mechanical Engineering Division.
Avinash Vasava is Final year student of Bachelor degree in Mechanical Engineering department
of G H. Patel college of Engineering & technology, Vallabh vidyanagar.
Jalesh Vasava is Final year student of Bachelor degree in Mechanical Engineering department
of G H. Patel college of Engineering & technology, Vallabh vidyanagar.

ISSN: 2319-8753
International Journal of Innovative Research in Science, Engineering and Technology Vol. 2, Issue 5, May 2013
Copyright to IJIRSET www.ijirset.com 1747
Alpesh Vanjibhai Kunapara is Final year student of Bachelor degree in Mechanical Engineering
department of G H. Patel college of Engineering & technology, Vallabh vidyanagar.
Savan Dahyabhai Patel is Final year student of Bachelor degree in Mechanical Engineering
department of G H. Patel college of Engineering & technology, Vallabh vidyanagar.


![Comparative Study of Microstrip Patch Antenna for Wireless ...Comparative Study of Microstrip Patch Antenna for Wireless Applications 65 C. Singh et. al [24] , this paper explains](https://static.fdocuments.in/doc/165x107/60acefb5aa77825dc453e114/comparative-study-of-microstrip-patch-antenna-for-wireless-comparative-study.jpg)