
6#4(MPCBM 3FBM &TUBUF #V CCMF*OEFY
33
September 2020 Chief Investment Office GWM Investment Research UBS Global Real Estate Bubble Index 2020
Transcript of 6#4(MPCBM 3FBM &TUBUF #V CCMF*OEFY

September 2020Chief Investment Office GWMInvestment Research
UBS Global Real Estate Bubble Index2020

2 UBS Global Real Estate Bubble Index 2020
UBS Global Real Estate Bubble Index This report has been prepared by UBS Switzerland AG. Please see the important disclaimer at the end of the document. Past performance is not an indication of future returns. The market prices provided are closing prices on the respective principal stock exchange.
Editor in Chief Matthias Holzhey
Authors Matthias HolzheyMaciej Skoczek
Regional contributors Jonathan Woloshin (US) Dean Turner (London) Dennis Lam (Hong Kong) Wen Ching Lee (Singapore) Matteo Ramenghi (Milan)Roberto Ruiz-Scholtes (Madrid)Tatiana Boroditskaya (Moscow)
Editorial deadline 28 September 2020
Design CIO Content Design
Cover photoShutterstock
Language English
Contact ubs.com/cio
Subscribe Electronic subscription is also available via Investment Views on the UBS e-banking platform.
Learn more at: www.ubs.com/cio
Content
3 Editorial
4 Key results
5 Long-term prospects called into question
7 Regional cycles
10 Global cities’ benchmarks
12 Frankfurt
13 Hong Kong
14 Zurich
15 London
16 New York
17 Singapore
18 Select cities
28 Methodology & data

UBS Global Real Estate Bubble Index 2020 3
Dear reader,
The specter of a global recession has haunted housing markets for years. Yet in the midst of the current pandemic-triggered shock, this fear has so far turned out to be unfounded. Despite the sharpest global economic downturn in more than 60 years, house prices have actually accelerated in the last four quarters.
Several puzzle pieces had to fall into place for house prices to avoid plummeting in such an environment. Governments have compensated many potential home buyers for their income losses. Financing conditions have been relaxed, and taxes and fore-closures suspended in many countries. And low interest rates that seem set in stone for years to come have kept investment demand high.
At the same time, rental markets have already taken a hit, reflecting weaker end-user housing demand. When government support runs out, house prices may be left out in the cold. Moreover, the coronavirus pandemic has called into question the growth prospects for housing in urban centers. This year’s experiment with wide-spread home office adoption has shown that many employees can potentially quit their barely affordable city apartments without losing access to the local job market.
Even so, the big urban centers will remain economic hubs and should continue to attract people. But sky-high housing market valuations, coupled with noticeably weaker demand prospects, suggest investors should be cautious. Though real estate is often regarded as a legacy investment, now is certainly not the worst time for owners of multiple properties to consider profit taking.
This report studies the housing market outlook for a broad range of urban centers, with Warsaw a new addition to this year’s selection.
We wish you an engaging read.
Editorial
Claudio SaputelliHead Swiss & Global Real EstateChief Investment Office GWM
Matthias HolzheyHead Swiss Real Estate InvestmentsChief Investment Office GWM

4 UBS Global Real Estate Bubble Index 2020
Resilience of housing marketsPrice increases in the cities we analyzed have accelerated in the last four quar-ters, despite the global recession. That said, four cities recorded negative annual price growth rates – the last time there were fewer cities with negative price growth was 2006.
No lending boomDespite historically low mortgage rates, lending has remained subdued. In the aftermath of the Great Financial Crisis, average outstanding mortgage volumes have trended in line with GDP growth.
European housing still running hot Index scores have increased in all European cities. The majority of cities in bubble-risk territory are from the Eurozone, where low rates are fueling housing prices. In the US, price changes lag the nationwide average.
Investors should be on guardPrice-to-rent ratios have reached a record high, and rental growth is uncertain. In this environment, selling properties warrants consideration, as investors are likely to find assets with better risk-return characteristics.
Pandemic impact has been postponedCredit facilities for companies and short-time work schemes mitigated the fallout from the crisis, supporting affordability. Governments helped homeowners in many cities with housing subsidies, lower taxes, or suspended foreclosure procedures.
Adverse longer-term effectsA correction phase will likely emerge when subsidies fade and pressure on incomes increases. A shift in population growth from cities to wider metropolitan areas, potential tax increases and public spending cuts do not bode well for property prices.
Key results
Stockholm
Frankfurt
Moscow
Munich
Zurich
Milan
Madrid
Dubai
Singapore
Sydney
Hong Kong
Tokyo
GenevaBoston
New York Los Angeles
San Francisco
Vancouver
Paris
Toronto
ChicagoLondon
Amsterdam
1.20
1.79
0.48
0.75
0.66
-0.40
1.11
1.51
2.35
1.26
0.23
1.681.08
0.43
2.26
1.52
1.96
-0.66
1.160.56
1.37
0.990.49
0.91 Tel Aviv
Undervalued (–1.5 to –0.5)
Bubble risk (above 1.5)
Overvalued (0.5 to 1.5)
Fair-valued (–0.5 to 0.5)
Warsaw0.36

UBS Global Real Estate Bubble Index 2020 5
Long-term prospects called into questionMunich and Frankfurt top the UBS Global Real Estate Bubble Index with the most distinct bubble risk assessments globally. Risk is also elevated in Toronto, Hong Kong, Paris, and Amsterdam, and Zurich is a new addition to the bubble risk zone. In contrast to last year, Vancouver’s housing market is now in overvalued territory. London, San Francisco, Los Angeles, and, to a lesser degree, New York are overvalued as well. Boston and Singapore remain fairly valued, and although Dubai’s valuations have decreased further, its market is still fairly valued too. Chicago is the only undervalued market in the study.
Home prices enjoy a short-lived bounceOn average, inflation-adjusted price growth rates in the cities analyzed have accelerated in the last four quarters. In many European metropoles, prices soared by more than 5%, with Munich, Frankfurt, and Warsaw leading the way. Price growth in the Asian and American cities, with the exception of Sydney, remained in a low-to-mid single-digit range. Madrid, San Francisco, Dubai, and Hong Kong are the only cities with falling prices – the last time there were fewer cities with negative price growth was 2006.
We see three reasons for the resilience of housing markets in the first half of 2020, despite the global pandemic. First, home prices are a backward-look-ing indicator of the economy, which therefore react with a delay to economic downturns. Moreover, the number of transactions declined in most cities in the second quarter of 2020 compared with the previous year, complicating price formation and reducing the validity of observed prices. Second, the majority of potential home buyers did not suffer direct income losses in the first half of 2020. Credit facilities for companies and short-time work schemes mitigated the fallout from the crisis, supporting employees’ housing affordability. Third, governments helped homeowners in many cities during the lockdown periods. Housing subsidies were increased, taxes lowered, and foreclosure procedures suspended.
Adverse effects on urban housing prospectsTo what extent higher unemployment and the gloomy outlook for household incomes will affect home prices is uncertain at this point. However, it’s clear that the current acceleration is not sustainable. Rents have been falling already in most cities, indi-cating that a correction phase will likely emerge
Stockholm
Frankfurt
Moscow
Munich
Zurich
Milan
Madrid
Dubai
Singapore
Sydney
Hong Kong
Tokyo
GenevaBoston
New York Los Angeles
San Francisco
Vancouver
Paris
Toronto
ChicagoLondon
Amsterdam
1.20
1.79
0.48
0.75
0.66
-0.40
1.11
1.51
2.35
1.26
0.23
1.681.08
0.43
2.26
1.52
1.96
-0.66
1.160.56
1.37
0.990.49
0.91 Tel Aviv
Undervalued (–1.5 to –0.5)
Bubble risk (above 1.5)
Overvalued (0.5 to 1.5)
Fair-valued (–0.5 to 0.5)
Warsaw0.36
Identifying a bubblePrice bubbles are a recurring phenomenon in property markets. The term “bubble” refers to a substantial and sustained mispric-ing of an asset, the existence of which cannot be proved unless it bursts. But historical data reveals patterns of property market excesses. Typical signs include a decoupling of prices from local incomes and rents, and imbalances in the real economy, such as excessive lending and construction activity. The UBS Global Real Estate Bubble Index gauges the risk of a property bubble on the basis of such patterns. The Index does not predict whether and when a correction will set in. A change in macroeconomic momentum, a shift in investor sentiment or a major supply increase could trigger a decline in house prices.
–0.5 0.5 1.5
MunichFrankfurtTorontoHong KongParisAmsterdam*ZurichVancouverLondonTokyoLos AngelesStockholmGenevaSan FranciscoTel AvivSydneyMoscowNew YorkBostonSingaporeMadridWarsawMilanDubaiChicago
1 2 3 4 5 6 7 8 9101112131415161718192021222324
��
���
��
������
��
��
�
��
��
�
��
25 �
Bubble risk (above 1.5)
Overvalued (0.5 to 1.5)
Fair-valued (–0.5 to 0.5)
Undervalued (–1.5 to –0.5)
Change vs. 2019
UBS Global Real Estate Bubble IndexIndex scores for the housing markets of select cities, 2020
Source: UBS * Index altered due to data source revision. For explanation see the section on Methodology & data on page 28.
�
2.352.26
1.961.79
1.681.521.51
1.371.261.201.161.111.08
0.990.91
0.750.66
0.560.490.480.430.36
0.23–0.40–0.66
�

Long-term prospects called into question
6 UBS Global Real Estate Bubble Index 2020
when subsidies fade out and pressure on house-hold incomes increases.
High market valuations and an uncertain short-term outlook are bringing the longer-term trajec-tory of city housing into focus. On the one hand, the underlying key drivers of urban housing appre-ciation – superior employment opportunities and amenities, low financing costs, and limited supply growth – remain in place. On the other hand, the coronavirus pandemic seems to be accelerating a shift of population growth from cities to wider metropolitan areas. The rise of the home office and the option to work from anywhere brings into question the need to live close to city centers. Pres-sure on household incomes is making it necessary for many people to move to more affordable sub-urban areas. Moreover, already debt-ridden or eco-nomically weaker cities will have to respond to this economic crisis with tax increases or public spend-ing cuts, neither of which bode well for property prices. Taken together, these factors suggest that some adverse longer-term effects on urban housing demand are likely.
A time to sell?The current cities at bubble risk seem to be weath-ering the coronavirus crisis relatively well. The local economies of Munich, Toronto, and Hong Kong will likely recover quickly. But even in the absence of a broad market correction, the potential for widespread capital gains seems depleted. This is of particular importance for buy-to-let investors as price-to-rent ratios have reached a record-high (i.e. yields are low) and rental growth is uncertain. In this environment, selling properties warrants consideration, as investors are likely to find assets with better risk-return characteristics.
Munich
Sydney
Frankfurt
Warsaw
Moscow
Paris
Stockholm
Toronto
Tel Aviv
Amsterdam
Geneva
Los Angeles
Boston
Zurich
Tokyo
Singapore
Milan
Chicago
Vancouver
London
New York
Madrid
San Francisco
Dubai
Hong Kong
2019 2020
Last 4 quarters Last 5 years, annualized
Housing market risk assessment
Price growthInflation-adjusted price growth rates, in %
Source: data sources on page 29
–5 0 5 10

UBS Global Real Estate Bubble Index 2020 7
Regional cycles
Eurozone The index scores of all Eurozone cities increased, with valu-ations the highest worldwide and Munich, Frankfurt, Paris, and Amsterdam in bubble risk territory. Imbalances are increasing further in the wake of record low financing costs that are not in line with the strength of the local economies. However, price growth in Amsterdam has slowed down significantly and is expected to remain sub-dued, as the lending standards have been tightened. The housing market in Milan showed signs of recovery in late 2019, but the economic uncertainty caused by the lock-down measures quashed those green shoots. Price growth in Madrid has been stalled by the pandemic, as well. Over-all, stretched affordability in most Eurozone cities out-weighs the effect of falling mortgage rates. The current price levels will be tested as soon as support measures for household incomes fade out.
Rest of EuropeIndex scores have increased in all European cities over the last year. Zurich is the only European city in bubble risk ter-ritory outside the Eurozone. Attractive mortgage rates, low supply of owner-occupied housing, and strong investment demand have underpinned rising prices. In Geneva index scores increased steadily over the last two years, and home prices have recovered all losses incurred during 2013 and 2016. London remains in overvalued territory despite the second-weakest price development of all analyzed cities since 2016. Affordability issues, political uncertainty, and a tighter tax and regulatory environment are putting pres-sure on house prices. Stockholm’s property prices have started to recover after a sharp correction. Market imbal-ances there are increasing again, but are still significantly lower than in 2017.
Moscow house prices have remained robust, as demand is being boosted by cheaper mortgages and new regulations favoring buyers. Nevertheless, economic woes and rising supply will likely put pressure on prices soon. Warsaw’s housing market has recorded sharply rising prices, as well, though the price levels are still significantly below those notched in 2008. The valuation score is fair but has increased markedly over the past two years.
2.5
1.5
0.5
–0.5
–1.5
–2.5
84 88 92 96 00 04 08 12 16 20
Eurozone
bubble risk
overvalued
fair-valued
undervalued
depressed
Frankfurt Munich AmsterdamParisMilan Madrid
UBS Global Real Estate Bubble Index
2.5
1.5
0.5
–0.5
–1.5
–2.5
84 88 92 96 00 04 08 12 16 20
Rest of Europe
London Zurich GenevaStockholm Moscow Warsaw
UBS Global Real Estate Bubble Index
bubble risk
overvalued
fair-valued
undervalued
depressed

Regional cycles
8 UBS Global Real Estate Bubble Index 2020
2.5
1.5
0.5
–0.5
–1.5
–2.5
84 88 92 96 00 04 08 12 16 20
United States
New York Los Angeles San Francisco Chicago Boston
UBS Global Real Estate Bubble Index
bubble risk
overvalued
fair-valued
undervalued
depressed
2.5
1.5
0.5
–0.5
–1.5
–2.5
84 88 92 96 00 04 08 12 16 20
Canada
Vancouver Toronto
UBS Global Real Estate Bubble Index
bubble risk
overvalued
fair-valued
undervalued
depressed
United StatesOverall, the drop of mortgage rates to historically low levels supports house prices in the US. But price changes in the analyzed cities trail the nationwide average. Inner-city demand growth has slowed down as people have moved away to cheaper and more tax-, business-, and regulatory-friendly states. The pandemic has even further accelerated this trend, and affordability issues are also spurring the migration to the suburbs. In inflation-adjusted terms, house prices are still lower than at the last peak in 2006, with the exception of San Francisco. The pandemic is likely to contribute to further relative weakness of the analyzed housing markets. The index scores have been relatively sta-ble over the last five years in the East Coast cities, whereas the West Coast markets have developed more unevenly. In Los Angeles the index scores have continued to increase, while in San Francisco valuations have declined for the sec-ond year in a row due to falling home prices.
CanadaBetween 2000 and 2017 real home prices in the Canadian cities in the study rose almost unabated by more than 5% per year. The price dynamics were closely connected to the evolution of mortgage rates. Imbalances soared over that period as fundamentals couldn’t keep up with house prices. The housing boom came to a halt in 2018 as financing conditions tightened. Moreover, the introduction of taxes on foreign buyers, vacancy fees, and stricter rent controls also took their toll. As a result, prices in Toronto stagnated and Vancouver recorded a correction of almost 10% between 2018 and late 2019. But since last year, financing conditions have improved and price growth has followed suit. Toronto ranks third in the bubble risk assess-ment. Imbalances in Vancouver have increased as well, but are still below peak valuations in 2016.

Regional cycles
UBS Global Real Estate Bubble Index 2020 9
APACHome prices both in Hong Kong and in Singapore were fairly stable during the first half of the year. But while real home prices in Hong Kong are over 50% higher than they were 10 years ago, prices in Singapore have remained virtually unchanged over this period. Regulatory tightening has proved very effective in curbing price growth there over the last decade. The uncertain economic outlook is weighing on the market prospects in both cities, but in the medium term demand is likely to remain high given their respective key roles in the region.
Real home prices in Sydney are almost 50% higher than in 2010. Prices have undergone stark swings in the last three years. Currently, valuations are still below the peak in 2017, but easier lending standards and the RBA’s rate cuts have sparked a straw fire in the last few quarters, one that has kindled a modest but likely fleeting price recovery. Tokyo has evolved into one of the most dynamic housing markets in the region, bolstered by its strong population growth and attrac-tive financing conditions. Prices have been on the rise for almost a decade now, and its housing market is increasingly overvalued.
Middle EastDubai’s property market has reached a new cyclical low. Since the last peak in 2014, prices have fallen by over 35%, and the valuation score is close to depressed levels. Positive price effects of high population growth and easier mortgage regula-tions are being offset by ongoing solid supply growth and weak oil prices.
Over the last 30 years, Tel Aviv has seen some of the highest price growth among the cities covered in this report. Prices rose nearly constantly between 2003 and 2017, triggering a bubble risk signal. Consequently, a combination of rising mortgage rates and stretched affordability temporarily paused the party. Currently, house prices are on the rise again due to easier financing conditions and scarce housing supply. On top of that, the government has lowered the purchase tax for second homes, encouraging housing market investments.
2.5
1.5
0.5
–0.5
–1.5
–2.5
84 88 92 96 00 04 08 12 16 20
APAC
Hong Kong Singapore Sydney Tokyo
UBS Global Real Estate Bubble Index
bubble risk
overvalued
fair-valued
undervalued
depressed
2.5
1.5
0.5
–0.5
–1.5
–2.5
84 88 92 96 00 04 08 12 16 20
Middle East
Tel Aviv Dubai
UBS Global Real Estate Bubble Index
bubble risk
overvalued
fair-valued
undervalued
depressed

10 UBS Global Real Estate Bubble Index 2020
Buying a 60 square meter (650 square foot) apart-ment exceeds the budget of people who earn the average annual income in the highly skilled service sector in most world cities. In Hong Kong, even those who earn twice the city’s average income would struggle to afford an apartment of that size. House prices have also decoupled from local incomes in Paris, London, Singapore, Tokyo, Tel Aviv, and New York, where price-to-income multiples exceed 10. Unaffordable housing is often a sign of strong investment demand from abroad, tight zoning, and strict rental market regulations. If investment demand weakens, the risk of a price correction increases and long-term appreciation prospects shrink.
By contrast, housing is affordable in Chicago, Boston, Los Angeles or Milan, which limits the risk of a price correction in those cities. Given high incomes, purchasing an apartment is also relatively feasible for residents of Geneva or Zurich.
From the perspective of a home buyer, affordability also depends on mortgage interest rates and amor-tization obligations. Relatively high interest and amortization rates, for example, mean that even the relatively low price-to-income multiples in US cities can place a heavy burden on monthly income. Conversely, with low interest rates and no requirement of full amortization, even elevated purchase prices can be easily sustained in, for example, Switzerland and the Netherlands.
Price-to-income
Global cities’ benchmarks
The number of years a skilled service worker needs to work to be able to buy a 60m2 (650 sqft) flat near the city center
Hong KongParisLondonSingaporeTokyoTel AvivNew YorkMunichAmsterdamMoscowVancouverSydneyFrankfurtGenevaZurichStockholmTorontoSan FranciscoMadridWarsawMilanDubaiLos AngelesBostonChicago
current value range* value in 2010
1 5 10 15 20 years
1 5 10 15 20 years
Source: UBS. Remark: For explanation see the section on Methodology & data on page 28. * Uncertainty range due to differing data quality

Global cities’ benchmarks
UBS Global Real Estate Bubble Index 2020 11
Munich, Hong Kong, and Zurich have the highest price-to-rent ratios, followed by Paris and Singa-pore. Extremely high multiples indicate an undue dependence of housing prices on low interest rates. Overall, almost half of the covered cities have price-to-rent multiples above or close to 30. House prices in all these cities are vulnerable to a sharp correction should interest rates eventually rise.
Price-to-rent values below 20 are found mainly in the US cities in this study: San Francisco, Los Angeles, Boston, and Chicago. Their low multiples reflect, among other things, higher inter-est rates and relatively mild regulation of the rental market. Conversely, rental laws in France, Germany, Switzerland, and Sweden are strongly pro-tenant, preventing rentals from reflecting true market levels.
However, those stratospheric price-to-rent multiples reflect not only interest rates and rental market regulation, but also expectations of rising prices, as is the case, for example, in Munich and Zurich. Investors anticipate being compensated with capi-tal gains for very low rental yields. If these hopes do not materialize and expectations deteriorate, homeowners in markets with high price-to-rent multiples are likely to suffer significant capital losses.
Price-to-rent
The number of years a flat of the same size needs to be rented to pay for the flat
MunichHong KongZurichParisSingaporeLondonGenevaFrankfurtStockholmVancouverMilanTorontoTel AvivSydneyNew YorkMoscowAmsterdamMadridTokyoSan FranciscoLos AngelesBostonWarsawDubaiChicago
current value range* value in 2010
1 5 10 15 20 25 30 35 40 years
1 5 10 15 20 25 30 35 40 years
Source: UBS. Remark: For explanation see the section on Methodology & data on page 28. * Uncertainty range due to differing data quality

12 UBS Global Real Estate Bubble Index 2020
Frankfurt
Victim of its own successFrankfurt’s home prices doubled in the last ten years. The rally has continued over the last four quarters, with real prices increasing by 8%. Frankfurt’s UBS Global Real Estate Bubble Index score has climbed significantly over the last year, and the city remains in bubble risk territory.
The strong market dynamics can be attributed to several fac-tors. As one of Europe’s biggest financial centers, the city has benefited from solid economic and employment growth. The population has risen rapidly driven by both birth surplus and positive migration. Consequently, rents have also increased, climbing by almost 40% since 2010 and making Frankfurt the city with the third-highest rental inflation among all analyzed cities. In addition, developers have targeted the upper seg-ment of the market, in particular, fueling the housing price inflation even more.
The medium-term outlook is mixed. As companies are unlikely to engage in a hiring frenzy amid the current economic uncer-tainty, demand growth should take a breather. The city has become increasingly unaffordable for its citizens, making living in the suburbs an attractive alternative. Sustained easy financ-ing conditions are a necessary condition for future house price stability. Moreover, construction has been accelerating over the last years.
15
5
10
0
–501 03 05 07 09 11 13 15 17 18 19 2002 04 06 08 10 12 14 16
Annual house price growth ratesInflation-adjusted in %, as of 2nd quarter
year on year 20-year average
84 88 92 96 00 04 08 12 16 20
3.0
1.5
0
–1.5
–3.0
Price-income ratio Price-rent ratio
Change in construction/GDP Change in mortgage/GDP
City/country price ratio
Development of sub-indicesStandardized values

UBS Global Real Estate Bubble Index 2020 13
Hong Kong
Stable against all the odds The Hong Kong housing boom kicked off almost 20 years ago. Between 2003 and 2019 real prices almost quadrupled, fueled largely by strong economic growth and mainland investment demand. A weakening economy from mid-2019 brought that seemingly unchecked surge to a halt, and currently prices are roughly 5% below their peak in mid-2019. The UBS Global Real Estate Bubble Index score for Hong Kong has crept down over the last four quarters, but the market remains in bubble risk territory.
The economic outlook is challenging given political tensions and rising unemployment. That said, the price level is unlikely to correct further for several reasons. First, Hong Kong is the key financial hub within the Greater Bay Area and still benefits from Chinese US-listed companies seeking listings in Hong Kong. Second, some people from mainland China may be looking for Hong Kong citizenship in order to avoid the hefty global tax in China. Third, the oversupply risks are man-ageable and new construction remains limited. Last, the rate of foreclosures is likely to remain at low levels. Most home buyers are moderately leveraged, and in light of the very low financing costs, existing holders should be able to service their debt.
Overall, we expect Hong Kong home prices to be flat to posi-tive, with a mid-single-digit increase by end-June 2021 quite possible. The mass market in the New Territories area will face slightly more volatility due to the relatively sharper pickup in the unemployment rate there. By contrast, the high-end market should fare better given the very limited new supply and owners’ ability to ride out the current flagging economy.
Annual house price growth ratesInflation-adjusted in %, as of 2nd quarter
year on year 20-year average
01 03 05 07 09 11 13 15 17 18 19 2002 04 06 08 10 12 14 16
–10
0
10
20
30
40
84 88 92 96 00 04 08 12 16 20
3.0
1.5
0
–1.5
–3.0
Price-income ratio Price-rent ratio
Change in construction/GDP Change in mortgage/GDP
Real price
Development of sub-indicesStandardized values

14 UBS Global Real Estate Bubble Index 2020
Zurich
Cause for caution The coronavirus crisis has left hardly any traces on the owner-occupied market. Housing located near the city center has even benefited from increasing demand over the last few quarters. The high willingness to pay of prospective buyers reflects both the expectations of rising prices and the sustained investment demand. Accordingly, the market is newly ranked in the bubble risk territory, according to the UBS Global Real Estate Bubble Index.
The city of Zurich has recorded the strongest price growth rates of all Swiss economic regions in the last decade. Real prices are now roughly 50% higher than they were in 2010. The local boom has been driven by a mix of dynamic employment growth, high buy-to-let demand, and falling mortgage rates. By contrast, rents have increased by only 15% over this period.
The city’s housing market has been characterized by relatively fast supply expansion. But the vast majority of new buildings have been ultimately rented out, and the owner-occupied market has dried up. Currently, less than 0.5% of the stock of owner-occupied apartments is offered on the market, the lowest fraction nationwide.
Though the prevailing excess demand for housing will likely support prices at least in the short term, the negative conse-quences of the recession have not yet made themselves felt. Potential home buyers’ willingness to pay will likely stagnate in the city center over the next few quarters. Moreover, if the economy remains in crisis mode for a longer period of time, the high prices in the Swiss owner-occupied home market will eventually be unsustainable.
84 88 92 96 00 04 08 12 16 20
3.0
1.5
0
–1.5
–3.0
Price-income ratio Price-rent ratio
Change in construction/GDP Change in mortgage/GDP
City/country price ratio
Development of sub-indicesStandardized values
8
4
6
2
001 03 05 07 09 11 13 15 17 18 19 2002 04 06 08 10 12 14 16
Annual house price growth ratesInflation-adjusted in %, as of 2nd quarter
year on year 20-year average

UBS Global Real Estate Bubble Index 2020 15
London
The long wait for the recoveryLondon’s housing market remains in overvalued territory according to the UBS Global Real Estate Bubble Index. Real prices have roughly stagnated over the last four quarters, and they remain 10% below the levels reached in 2016. Not only has London’s housing market lagged the national average since then, but it has been the weakest market of all analyzed cities after Dubai.
The broad market weakness can be attributed to increasingly stretched affordability. The average required down payment in the Greater London area is now roughly twice as high as it was 10 years ago, according to Halifax. While the extension of the help-to-buy scheme, historically low mortgage rates, and con-stant undersupply all support the market, they’re unlikely to revive it. Moreover, as London has one of the longest commut-ing times for office employees, the growing acceptance of working from home will likely curb the demand for centrally located housing.
London’s prime market has also been under pressure for the last couple of years. The ongoing political uncertainties around Brexit, unfavorable taxation, and higher stamp duties have taken their toll on wealthy and foreign investors. But we antic-ipate London will remain one of the most attractive world cities over the long term. We expect foreign buyers to take advantage of the weaker pound and lower house prices. From a US dollar perspective, London property prices are still below their 2007 levels. Moreover, the current stamp duty holiday and the upcoming introduction of a stamp duty surcharge for non-UK buyers should stimulate demand for prime properties in the coming months.
5
10
15
0
–10
–5
01 03 05 07 09 11 13 15 17 18 19 2002 04 06 08 10 12 14 16
Annual house price growth ratesInflation-adjusted in %, as of 2nd quarter
year on year 20-year average
84 88 92 96 00 04 08 12 16 20
3.0
1.5
0
–1.5
–3.0
Price-income ratio Price-rent ratio
Change in construction/GDP Change in mortgage/GDP
City/country price ratio
Development of sub-indicesStandardized values

16 UBS Global Real Estate Bubble Index 2020
New York
Beyond the headlinesThe housing market remains slightly overvalued, according to the UBS Global Real Estate Bubble Index. Prices have been stable over the last four quarters in inflation-adjusted terms. However, property market fundamentals have weakened in the wake of the recession. Local price growth rates continue to trail the nationwide average, as the supportive impact of lower mortgage rates is being offset by mounting local economic and social challenges, the threat of rising tax rates, and migration to the suburbs.
The Manhattan housing market, whose dynamics have histori-cally been dependent on the financial sector, was already strug-gling prior to the pandemic. Elevated new housing supply amid negative population growth was weighing on prices, particularly in the luxury segment, which remains substantially oversupplied. The city has been hit especially hard by the coronavirus-triggered lockdowns, as potential buyers have been avoiding central loca-tions or postponing purchases. Transactions in the second quar-ter dropped by 54% compared with the previous year and the median sales price fell 18%, according to Douglas Elliman.
In our view, New York will stay relatively attractive to wealthy investors beyond the pandemic. That said, homeowners are likely to see the pandemic’s adverse impact on property values for the foreseeable future. First, working from anywhere is more appeal-ing if commuting times are long and city center rents remain ele-vated. Second, the city is highly indebted and therefore suscepti-ble to further unfavorable taxation measures. Finally, due to Manhattan’s high dependency on the struggling financial services industry, the prospects for the regional economy are lukewarm, likely limiting future price upside.
3.0
1.5
0
–1.5
–3.084 88 92 96 00 04 08 12 16 20
Price-income ratio Price-rent ratio
Change in construction/GDP Change in mortgage/GDP
Development of sub-indicesStandardized values
City/country price ratio
15
0
5
10
–5
–10
Annual house price growth ratesInflation-adjusted in %, as of 2nd quarter
year on year 20-year average
01 03 05 07 09 11 13 15 17 18 19 2002 04 06 08 10 12 14 16

UBS Global Real Estate Bubble Index 2020 17
Singapore
Balanced fundamentalsHome prices in Singapore have only slightly increased over the last two years, and they have treaded water in 2020 in the face of the pandemic-triggered recession. There are no signs of an overheating housing market. Accordingly, the UBS Global Real Estate Bubble Index score remains virtually unchanged from the previous year’s, and indicates that Singapore’s market is in fair-valued territory.
Overall, the market still looks balanced in terms of demand and supply over the medium term. The number of households jumped from the previous year, and the vacancy rate has been declining. However, the number of unsold units remains signif-icantly higher than it was in 2017 at the start of the most recent price uptick. Also, the medium-term development pipe-line is still well stocked. We expect the vacancy rate to stabilize at current levels.
We think home prices will soften in the near term. Market evi-dence suggests that developers are adopting flexible pricing given the weak economic outlook and heightened competition from new launches. Moreover, the ongoing pandemic has not prompted the government to ease existing property cooling measures, so elevated stamp duties are continuing to constrain prices.
That said, the government remains watchful of the housing market, and has ample levers to support the downside in the event prices fall sharply. Attractive mortgage rates, balanced market fundamentals, and resilient demand should also limit the downside.
year on year 20-year average
–20
–10
0
10
20
30
Annual house price growth ratesInflation-adjusted in %, as of 2nd quarter
01 03 05 07 09 11 13 15 17 18 19 2002 04 06 08 10 12 14 16
3.0
1.5
0
–1.5
–3.084 88 92 96 00 04 08 12 16 20
Price-income ratio Price-rent ratio
Change in construction/GDP Change in mortgage/GDP
Real price
Development of sub-indicesStandardized values

18 UBS Global Real Estate Bubble Index 2020
Select cities
Munich Munich tops the index for the second year in a row. Over the last decade real prices have increased by more than 8% annually, which is the highest value of all analyzed markets. The boom can be attributed to a well-diversified and grow-ing economy, as well as to ever more attractive financing conditions. Given the city’s robust pop-ulation growth, a supply shortage has been the result. Speculative investment demand has also increased in recent years. Housing affordability is a pressing issue, and Munich has the highest price-to-rent ratio of the analyzed cities. Higher interest rates or any tightening of financing con-ditions would trigger a correction from the cur-rent lofty price levels.
Toronto Given Toronto’s robust population growth and lower mortgage rates, prices there have doubled within only a dozen years. The housing frenzy abated temporarily in 2018 as mortgages became more expensive and after the local government introduced a number of regulations, including a foreign-buyers’ tax and rent controls. However, market momentum has increased again recently. Underpinned by improving financing conditions, prices jumped by almost 6% over the last four quarters as demand for single-family houses in the suburbs grew considerably. Yet affordability is already stretched. New supply should be consid-erable in the coming quarters. Moreover, the expected appreciation of the Canadian dollar will curb the appeal of Toronto’s property to foreign buyers when travel restrictions are lifted.
Annual house price growth ratesInflation-adjusted in %, as of 2nd quarter
–5
0
5
10
15
20
01 03 05 07 09 11 13 15 17 18 19 2002 04 06 08 10 12 14 16
3.0
1.5
0
–1.5
–3.084 88 92 96 00 04 08 12 16 20
Standardized values
Development of sub-indices
Annual house price growth ratesInflation-adjusted in %, as of 2nd quarter
-5
0
5
10
15
20
01 03 05 07 09 11 13 15 17 18 19 2002 04 06 08 10 12 14 16
3.0
1.5
0
–1.5
–3.084 88 92 96 00 04 08 12 16 20
Standardized values
Development of sub-indices
City/country price ratio
year on year 20-year average
Price-income ratio Price-rent ratio
Change in construction/GDP Change in mortgage/GDP

Select cities
UBS Global Real Estate Bubble Index 2020 19
Paris Real prices have increased 6% over the last year and are now almost 30% higher than in 2015 when the recovery set in. Price growth has slightly accelerated compared with previous years. Falling mortgage rates and foreign demand in the luxury segment have propelled the price surge. Housing affordability in Paris is very stretched, and a well-skilled worker needs to work 16 years to save for a 60 square meter (650 square foot) flat – the second highest value of analyzed cities. Conse-quently, more families are gradually leaving the city. While international appeal and a lack of new housing supply support the price level, current negative population growth poses a risk to price stability.
Amsterdam Easy financing conditions, the solid economy, and high buy-to-let demand lifted housing market val-uations between 2013 and 2018. Supply could not keep up with the ballooning demand, so the overall price level increased immensely by more than 10% annually, topping all other cities in the study. But since then price growth has slowed down, and over the last year housing prices have increased by a relatively weak 4%, trailing the national average. Despite the quite decent growth in local households’ incomes, affordability has decreased considerably over time. Moreover, banks have recently tightened their mortgage acceptance criteria in expectation of higher delin-quency risks, which should limit further upside of house prices for the time being.
Annual house price growth ratesInflation-adjusted in %, as of 2nd quarter
–10
–5
0
5
10
15
20
01 03 05 07 09 11 13 15 17 18 19 2002 04 06 08 10 12 14 16
3.0
1.5
0
–1.5
–3.084 88 92 96 00 04 08 12 16 20
Standardized values
Development of sub-indices
Annual house price growth ratesInflation-adjusted in %, as of 2nd quarter
–10
–5
0
5
10
15
01 03 05 07 09 11 13 15 17 18 19 2002 04 06 08 10 12 14 16
3.0
1.5
0
–1.5
–3.084 88 92 96 00 04 08 12 16 20
Standardized values
Development of sub-indices
City/country price ratio
year on year 20-year average
Price-income ratio Price-rent ratio
Change in construction/GDP Change in mortgage/GDP

Select cities
20 UBS Global Real Estate Bubble Index 2020
Vancouver Between 2018 and late 2019, prices decreased by roughly 10%. The decline was intensified by the introduction of vacancy fees and a foreign-buy-ers’ tax in 2016, both of which reduced foreign demand. But the market has stabilized since then, and prices have even slightly increased over the last four quarters. Falling mortgage rates and eas-ier stress test rate requirements – allowing poten-tial buyers to more easily qualify for higher mort-gage loans – have supported demand. However, the rental market has been under pressure, as immigration dropped due to the pandemic. Over-all, still sky-high valuations limit the upside for price growth given uncertainty about economic growth.
Tokyo The housing market in Tokyo has benefited from relatively strong population growth in the last couple of years, while the overall population in Japan has been declining. Coupled with low mortgage rates, prices in the capital city have been increasing since 2013 even as they have stagnated countrywide. Increasing investment demand for residential property supports the market as well. However, Tokyo’s annual price growth rates have dropped from almost 8% in 2016 to currently 2% as housing affordability has become increasingly stretched. Skilled service-sector workers would need to save almost 12 years of their entire income to afford a 60 square meter (645 square foot) flat in the city.
Annual house price growth ratesInflation-adjusted in %, as of 2nd quarter
–10
–5
0
5
10
15
20
01 03 05 07 09 11 13 15 17 18 19 2002 04 06 08 10 12 14 16
Annual house price growth ratesInflation-adjusted in %, as of 2nd quarter
–5
0
5
10
15
01 03 05 07 09 11 13 15 17 18 19 2002 04 06 08 10 12 14 16
3.0
1.5
0
–1.5
–3.084 88 92 96 00 04 08 12 16 20
Standardized values
Development of sub-indices
3.0
1.5
0
–1.5
–3.084 88 92 96 00 04 08 12 16 20
Standardized values
Development of sub-indices
City/country price ratio
year on year 20-year average
Price-income ratio Price-rent ratio
Change in construction/GDP Change in mortgage/GDP

Select cities
UBS Global Real Estate Bubble Index 2020 21
Los Angeles Los Angeles’s housing market has been booming since 2013, driven by supply shortage and a pros-pering economy, particularly in the technology, media, entertainment, and manufacturing sec-tors. In total, prices increased by almost 60%. But housing affordability has deteriorated since aver-age incomes grew by only 10% during the same period. In addition, the city’s population growth has flattened since 2017. Due to the city’s expo-sure to international trade, the local economy will likely suffer disproportionately from the pandemic lockdowns and the ongoing trade tensions with China. Over the last four quarters, price growth has remained subdued. That said, we think a sig-nificant correction is unlikely given the combina-tion of low mortgage rates and limited supply.
Stockholm Between 1993 and 2017 real prices were going up almost nonstop, a rise driven by robust popu-lation growth and increasingly attractive financing conditions. Housing affordability eventually dete-riorated, and tighter amortization requirements were introduced in mid-2017. In light of the lofty housing market valuations, this move was enough to trigger a price drop of 10% within only a few quarters. However, ongoing negative interest rates and an unattractive, overregulated rental market both make homeownership still look very appealing. Real prices have increased by 6% within the last four quarters. Accelerating dwelling construction is likely to limit further price increases.
Annual house price growth ratesInflation-adjusted in %, as of 2nd quarter
–20
–10
0
10
20
01 03 05 07 09 11 13 15 17 18 19 2002 04 06 08 10 12 14 16
3.0
1.5
0
–1.5
–3.084 88 92 96 00 04 08 12 16 20
Standardized values
Development of sub-indices
Annual house price growth ratesInflation-adjusted in %, as of 2nd quarter
–10
–5
0
5
10
15
01 03 05 07 09 11 13 15 17 18 19 2002 04 06 08 10 12 14 16
3.0
1.5
0
–1.5
–3.084 88 92 96 00 04 08 12 16 20
Standardized values
Development of sub-indices
City/country price ratio
year on year 20-year average
Price-income ratio Price-rent ratio
Change in construction/GDP Change in mortgage/GDP

Select cities
22 UBS Global Real Estate Bubble Index 2020
Geneva Over the last four quarters prices have increased by more than 3%. As a result, the market has recovered all the losses incurred during the period from 2014 to 2016. Geneva has benefited from its relative stability and international status against a backdrop of global political tensions and economic uncertainty in recent years. Low mortgage rates are keeping homeownership appealing in light of inflated rents, as the rental market is highly overregulated. Moreover, the city continues to attract international immigrants despite some affordability problems. In the longer term, the Geneva region will have to prove itself against the neighboring canton of Vaud, where housing is cheaper and the economy is more competitive.
San Francisco Inflation-adjusted home prices are roughly 65% above the bottom in 2012, a rise fueled both by the surge in high-tech job opportunities and by a large amount of the capital raised through IPOs ultimately making its way into real estate. But a bubble risk is off the table for now, as prices have fallen by 8% since the peak in 2018. The pan-demic has brought the low affordability of the City by the Bay’s housing market to the fore. Moreover, lower investment demand due to immigration restrictions and reduced demand for short term rentals both have further contributed to the housing market’s weakness. However, the structural supply shortage likely limits the down-side.
Annual house price growth ratesInflation-adjusted in %, as of 2nd quarter
–10
–5
0
5
10
15
20
01 03 05 07 09 11 13 15 17 18 19 2002 04 06 08 10 12 14 16
3.0
1.5
0
–1.5
–3.084 88 92 96 00 04 08 12 16 20
Standardized values
Development of sub-indices
3.0
1.5
0
–1.5
–3.084 88 92 96 00 04 08 12 16 20
Standardized values
Development of sub-indices
Annual house price growth ratesInflation-adjusted in %, as of 2nd quarter
–4
0
4
8
12
01 03 05 07 09 11 13 15 17 18 19 2002 04 06 08 10 12 14 16
City/country price ratio
year on year 20-year average
Price-income ratio Price-rent ratio
Change in construction/GDP Change in mortgage/GDP
Select cities
UBS Global Real Estate Bubble Index 2020 23
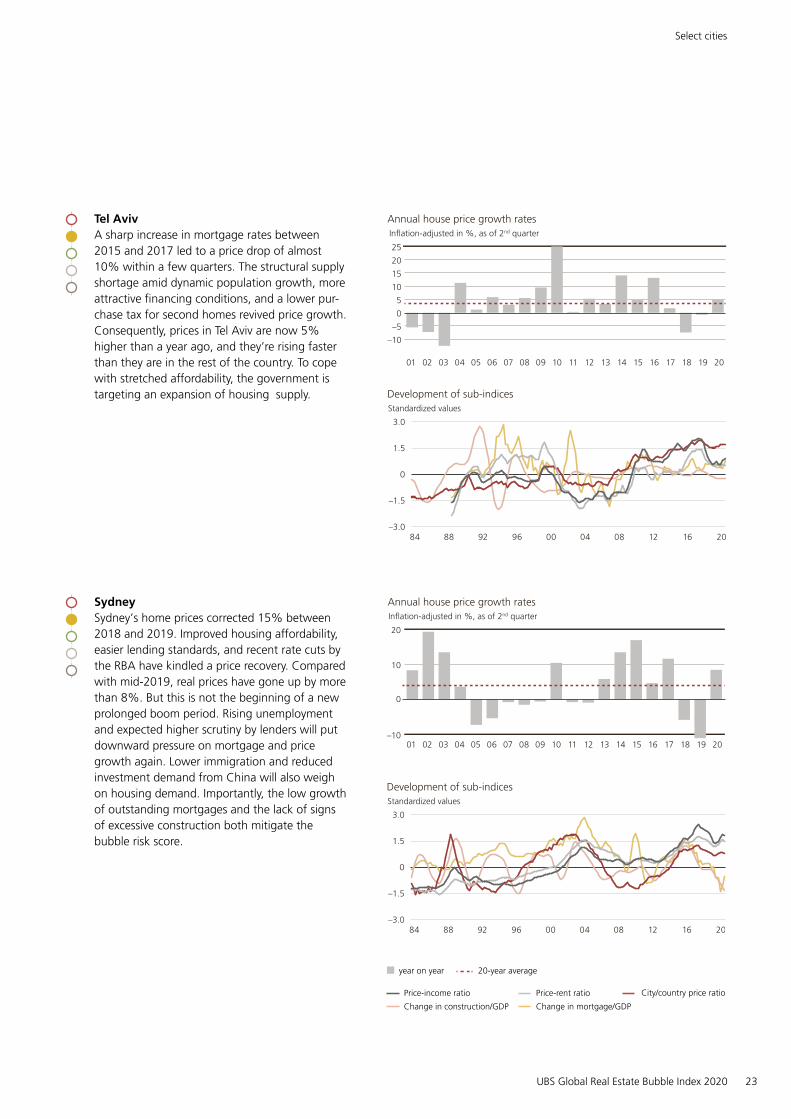
Tel Aviv A sharp increase in mortgage rates between 2015 and 2017 led to a price drop of almost 10% within a few quarters. The structural supply shortage amid dynamic population growth, more attractive financing conditions, and a lower pur-chase tax for second homes revived price growth. Consequently, prices in Tel Aviv are now 5% higher than a year ago, and they’re rising faster than they are in the rest of the country. To cope with stretched affordability, the government is targeting an expansion of housing supply.
Sydney Sydney’s home prices corrected 15% between 2018 and 2019. Improved housing affordability, easier lending standards, and recent rate cuts by the RBA have kindled a price recovery. Compared with mid-2019, real prices have gone up by more than 8%. But this is not the beginning of a new prolonged boom period. Rising unemployment and expected higher scrutiny by lenders will put downward pressure on mortgage and price growth again. Lower immigration and reduced investment demand from China will also weigh on housing demand. Importantly, the low growth of outstanding mortgages and the lack of signs of excessive construction both mitigate the bubble risk score.
Annual house price growth ratesInflation-adjusted in %, as of 2nd quarter
–10
–5
0
5
10
15
20
25
01 03 05 07 09 11 13 15 17 18 19 2002 04 06 08 10 12 14 16
Annual house price growth ratesInflation-adjusted in %, as of 2nd quarter
–10
0
10
20
01 03 05 07 09 11 13 15 17 18 19 2002 04 06 08 10 12 14 16
3.0
1.5
0
–1.5
–3.084 88 92 96 00 04 08 12 16 20
Standardized values
Development of sub-indices
3.0
1.5
0
–1.5
–3.084 88 92 96 00 04 08 12 16 20
Standardized values
Development of sub-indices
City/country price ratio
year on year 20-year average
Price-income ratio Price-rent ratio
Change in construction/GDP Change in mortgage/GDP

Select cities
24 UBS Global Real Estate Bubble Index 2020
Moscow Real house prices corrected by 30% between 2015 and 2017 in the wake of economic troubles and a depreciating currency. But then the winds shifted. Demand increased in the wake of falling financing costs and new legislation around escrow accounts, with real prices appreciating by more than 25% since the end of 2017. Despite the recent government-backed mortgage loan scheme and the Russian central bank’s regulatory easing, the price level is likely not sustainable. Russia’s lackluster economic growth and worsen-ing housing affordability are weighing on demand. Moreover, construction activity remains significant, providing ample supply.
Boston Over the last decade the city’s housing market benefited from regional economic growth, the strongest population increase among all US cities included in the study, and relatively good afford-ability. Prices have increased by 30% since 2013, but the demand drivers are weaker now. Housing affordability has worsened, as incomes have grown only half as fast as prices. Population growth roughly stagnated last year. Moreover, new housing construction has been considerable in recent years. Consequently, over the last four quarters real prices have risen by less than 3%, below the national average. Although the market is not overheated, we think the price upside is limited in the short run.
Annual house price growth ratesInflation-adjusted in %, as of 2nd quarter
–20
–10
0
10
20
30
01 03 05 07 09 11 13 15 17 18 19 2002 04 06 08 10 12 14 16
Annual house price growth ratesInflation-adjusted in %, as of 2nd quarter
–10
–5
0
5
10
15
01 03 05 07 09 11 13 15 17 18 19 2002 04 06 08 10 12 14 16
3.0
1.5
0
–1.5
–3.084 88 92 96 00 04 08 12 16 20
Standardized values
Development of sub-indices
3.0
1.5
0
–1.5
–3.084 88 92 96 00 04 08 12 16 20
Standardized values
Development of sub-indices
City/country price ratio
year on year 20-year average
Price-income ratio Price-rent ratio
Change in construction/GDP Change in mortgage/GDP

Select cities
UBS Global Real Estate Bubble Index 2020 25
Madrid Real prices increased on average by 5% per year between 2015 and 2019, fueled by attractive financing conditions, a robust supply of new dwellings, and decent income growth. Moreover, given that Madrid offers one of the highest rental yields among all European cities considered in the study, the city became a target for foreign inves-tors. As a result, the domestic income growth could not keep up with prices and affordability has worsened. Local authorities have therefore limited short-term rentals to tourists. The rapid price growth in the Spanish capital has come to an abrupt halt in 2020. Lockdown measures and the economic weakness will continue to dim the city’s prospects for a while.
Warsaw After the real house price level in Warsaw more than doubled between 2004 and 2009, by 2017 housing prices had dropped by over 30%. Since then prices have increased again by almost 10% annually. Demand for housing has been boosted by strong economic growth that has triggered a soaring need for a bigger workforce and raised household incomes. A significant amount of new supply has been built at increasing construction costs, adding to house price inflation and reduc-ing affordability. Accordingly, the index score reg-istered one of the strongest increases among all cities covered in the report since 2017, and the market is heading back into overvalued territory.
Annual house price growth ratesInflation-adjusted in %, as of 2nd quarter
–15
–10
–5
0
5
10
15
20
01 03 05 07 09 11 13 15 17 18 19 2002 04 06 08 10 12 14 16
Annual house price growth ratesInflation-adjusted in %, as of 2nd quarter
–20
–10
0
10
20
30
40
01 03 05 07 09 11 13 15 17 18 19 2002 04 06 08 10 12 14 16
3.0
1.5
0
–1.5
–3.084 88 92 96 00 04 08 12 16 20
Standardized values
Development of sub-indices
3.0
1.5
0
–1.5
–3.084 88 92 96 00 04 08 12 16 20
Standardized values
Development of sub-indices
City/country price ratio
year on year 20-year average
Price-income ratio Price-rent ratio
Change in construction/GDP Change in mortgage/GDP

Select cities
26 UBS Global Real Estate Bubble Index 2020
Milan After a decade-long price correction, real prices started to rise again in 2018. The market was accelerating in 2019, with the time required to sell properties shortening markedly on the back of rising demand both from foreign and from domestic investors and due to the redevelopment of urban areas. Despite a three-month lockdown in the first half of 2020 and the subsequent fall in transaction activity, prices have gone up by 1.5% over the last four quarters. An increase in the number of people working from home and the pandemic’s impact on tourism and large events have taken their toll on the city center, pushing demand toward semi-central locations. That said, unless the ongoing recovery of the local economy fades, housing will remain in demand in the met-ropolitan area. Positive population growth, attrac-tive financing conditions, and housing affordabil-ity that rivals the best among European cities should support the recovery over the medium term.
Dubai Housing demand development in Dubai is still closely connected to the evolution of oil prices. Alongside massive overbuilding, residential prices have trended down for the last six years and are now almost 40% below 2014 levels in inflation-adjusted terms – a fall similar in magnitude to the crash after the global financial crisis in 2008. Affordability of housing has improved even though household incomes have declined amid lower economic growth. Dubai banks have decided to ease restrictions on loan-to-value ratios for first-time home buyers to support demand. But a trend reversal in house prices looks unlikely to materialize in the next few quarters, as unemployment levels are rising and supply remains considerably high.
Annual house price growth ratesInflation-adjusted in %, as of 2nd quarter
–10
–5
0
5
10
01 03 05 07 09 11 13 15 17 18 19 2002 04 06 08 10 12 14 16
Annual house price growth ratesInflation-adjusted in %, as of 2nd quarter
–30
–20
–10
0
10
20
30
01 03 05 07 09 11 13 15 17 18 19 2002 04 06 08 10 12 14 16
3.0
1.5
0
–1.5
–3.084 88 92 96 00 04 08 12 16 20
Standardized values
Development of sub-indices
3.0
1.5
0
–1.5
–3.084 88 92 96 00 04 08 12 16 20
Standardized values
Development of sub-indices
City/country price ratio (Dubai: real price)
year on year 20-year average
Price-income ratio Price-rent ratio
Change in construction/GDP Change in mortgage/GDP

Select cities
UBS Global Real Estate Bubble Index 2020 27
Chicago As in previous years, house prices continued to increase at a slow pace. Since 2015 prices have increased by less than half as much as the coun-trywide average. With the city highly indebted, employment growth depressed, and the popula-tion declining, a turnaround is unlikely in the near future. However, affordability remains intact, as incomes are keeping pace with the slow price increases. A skilled worker needs only three years of income to be able to afford a 60 square meter (650 square foot) flat near the city center – the lowest figure among all cities included in the study.
Annual house price growth ratesInflation-adjusted in %, as of 2nd quarter
–10
–5
0
5
10
01 03 05 07 09 11 13 15 17 18 19 2002 04 06 08 10 12 14 16
3.0
1.5
0
–1.5
–3.084 88 92 96 00 04 08 12 16 20
Standardized values
Development of sub-indices
City/country price ratio
year on year 20-year average
Price-income ratio Price-rent ratio
Change in construction/GDP Change in mortgage/GDP

28 UBS Global Real Estate Bubble Index 2020
Methodology & data
UBS Global Real Estate Bubble IndexThe UBS Global Real Estate Bubble Index traces the fundamental valuation of housing markets and the valuation of cities in relation both to their country and to economic distortions (lending and building booms). Tracking current values, the index uses the following risk-based classifications: depressed (score below –1.5), undervalued (–1.5 to –0.5), fair-valued (–0.5 to 0.5), overvalued (0.5 to 1.5), and bubble risk (above 1.5). This classification is aligned with historical bubble episodes.
The index score is a weighted average of the following five standardized city sub-indexes: price-to-income and price-to-rent (fundamental valuation), change in mortgage-to-GDP ratio and change in construction-to-GDP ratio (eco-nomic distortion), and relative price-city-to-country indicator. The price-city-to-country indicator in Singapore, Hong Kong, and Dubai is replaced by an inflation-adjusted price index. The approach cannot fully account for the complexity of the bubble phenomenon. We cannot predict if or when a correction will hap-pen. Hence, “bubble risk” refers to the preva-lence of a high risk of a large price correction.
The sub-indexes are constructed from specific city-level data, except for mortgage-to-GDP and construction-to-GDP ratios, which are cal-culated on the country level. In most cases, publicly available data is used. But in a few cases, the data consists of, or is supplemented by, additional sources, including the results of the UBS Prices and Earnings survey. The index length varies by city depending on data avail-ability. The longest data series starts in 1980, the shortest in 2004. For time series shorter than 30 years, the coefficient of variation of an equivalent indicator on the country level is used as a floor value to calculate the volatility of the city-level indicator (subject to availabil-ity). We also took into account the availability of data when deciding which cities to include in the index. We considered the importance of the city for global financial markets and resi-dential real estate investments. Please see the description of data sources on page 29.
The weights of the sub-indexes are determined using factor analysis, as recommended by the OECD Handbook on Constructing Composite Indicators (2008). Factor analysis weights the sub-indexes to capture as much of the com-mon underlying bubble risk information as possible. As the drivers of bubbles vary across cities, this method results in city-specific weights on sub-indexes. To prevent over-weighting country level variables and to increase the comparability of cities, the devia-tion from the average weight across all cities is limited. So fixed weights that approximate the average factor analysis weight of single sub-indexes across the cities complement the calcu-lation. The final weights are subject to minor changes when new data enters the calculation or past data is revised.
Benchmarking The analysis is complemented by a city bench-marking using current price-to-income (PI) and price-to-rent (PR) ratios. The PI ratio indicates how many years a skilled service worker needs to work to be able to buy a 60 square meter (650 square foot) flat near the city center. The PR ratio signals how expensive owner-occupied homes are relative to rental apartments. The higher the ratios, the more expensive buying becomes. Earnings data is taken primarily from the UBS Prices and Earnings survey and from official statistical sources. Real estate prices and rents range widely near the city center. Our estimates are cross-checked, validated using different sources, and are updated and chal-lenged on an annual basis. However, we also specify an uncertainty range due to the differ-ing quality of data sources.

Methodology & data
UBS Global Real Estate Bubble Index 2020 29
Data sources
Price Index (City)
Rent Index (City)
Income Index (City)
Price Index (Country)
Mortgage, Construction, GDP, Inflation (Country)
Amsterdam 2020Q2 CBS, Maastricht University
NVM, UBS P&E UBS P&E, CBS CBS, FED Dallas DNB, CBS, EUKLEMS, Bloomberg
Boston 2020Q2 FHFA CBRE, FED St. Louis BEA FHFA FED, BEA, Bloomberg
Chicago 2020Q2 FHFA CBRE, FED St. Louis BEA FHFA FED, BEA, Bloomberg
Dubai 2020Q2 BIS Reidin, Merrill Lynch, UBS P&E
Euromonitor International, Merrill Lynch, UBS P&E
– Central Bank UAE, Dubai Statistics Center, Merrill Lynch, Bloomberg
Frankfurt 2020Q2 Bulwiengesa Bulwiengesa, OECD Destatis, UBS P&E, OECD
FED Dallas Deutsche Bundesbank, Destatis, EUKLEMS, Bloomberg
Geneva 2020Q2 Wüest Partner Statistique Genève FTA, FSO Wüest Partner SNB, SECO, BFS
Hong Kong 2020Q2 RVD RVD Census and Statistics Department Hong Kong, Bloomberg
– Census and Statistics Depart-ment Hong Kong, HKMA, Macrobond, Bloomberg
London 2020Q2 Nationwide, Lloyds Banking Group
ONS, UBS P&E ONS Nationwide, Lloyds Banking Group
BoE, ONS, EUKLEMS, Macrobond, Bloomberg
Los Angeles 2020Q2 FHFA CBRE, FED St. Louis BEA FHFA FED, BEA, Bloomberg
Madrid 2020Q2 BoS Idealista, UBS P&E INE BoS INE, BoS, EUKLEMS, Bloomberg
Milan 2020Q2 Nomisma Nomisma, OECD Dipartimento delle Finanze, UBS P&E
FED Dallas Banca d’Italia, Hypostat, Istat, EUKLEMS, Macrobond, Bloomberg
Moscow 2020Q2 Rosstat Domofond, UBS P&E
Rosstat, UBS P&E Rosstat CBR, Rosstat, Bloomberg
Munich 2020Q2 Bulwiengesa Bulwiengesa, OECD Destatis, UBS P&E, OECD
FED Dallas Deutsche Bundesbank, Destatis, EUKLEMS, Bloomberg
New York 2020Q2 FHFA, S&P/Shiller, Elliman
CBRE, FED St. Louis BEA FHFA FED, BEA, Bloomberg
Paris 2020Q2 BIS, CGEDD CGEDD, Clameur, UBS P&E
Insee, Bloomberg, UBS P&E
FED Dallas BdF, Insee, EUKLEMS, Macro-bond, Bloomberg
San Francisco 2020Q2 FHFA CBRE, FED St. Louis BEA FHFA FED, BEA, Bloomberg
Singapore 2020Q2 Government of Singapore
Government of Singapore, UBS P&E
Government of Singapore
- Government of Singapore, Bloomberg
Stockholm 2020Q2 Statistics Sweden Statistics Sweden, UBS P&E
Statistics Sweden, UBS P&E
Statistics Sweden Statistics Sweden, Bloomberg
Sydney 2020Q2 REIA, ABS REIA, NSW Govern- ment, UBS P&E
ABS, UBS P&E FED Dallas ABS, RBA, Macrobond, Bloomberg
Tel Aviv 2020Q2 CBS CBS, UBS P&E CBS, UBS P&E FED Dallas BoI, Bloomberg
Tokyo 2020Q2 The Real Estate Transaction Promo- tion Center, Haver Analytics
Miki Syoji, Official Statistics of Japan
INDB, Tokyo Metro- politan Government, UBS P&E
FED Dallas ESRI, EUKLEMS, Macrobond, Bloomberg
Toronto 2020Q2 Sauder School of Business UBC, Bloomberg
Canadian Housing Observer, Sauder School of Business UBC
Statistics Canada FED Dallas Statistics Canada, BoC, Bloomberg
Vancouver 2020Q2 Sauder School of Business UBC, Bloomberg
Canadian Housing Observer, Sauder School of Business UBC
Statistics Canada, Government of British Columbia
FED Dallas Statistics Canada, BoC, Bloomberg
Warsaw 2020Q2 National Bank of Poland
National Bank of Poland
Statistics Poland National Bank of Poland
National Bank of Poland, Statistics Poland, Bloomberg
Zurich 2020Q2 Wüest Partner Statistik Stadt Zürich
FTA, FSO Wüest Partner SNB, SECO, BFS

Methodology & data
30 UBS Global Real Estate Bubble Index 2020
Benchmarking sources
Earnings Real Estate (prices and rents)
Amsterdam UBS P&E, CBS Globalpropertyguide.com, numbeo.com
Boston BEA Zillow, numbeo.com, CBRE
Chicago BEA Zillow, numbeo.com, CBRE
Dubai numbeo.com, guide2dubai.com numbeo.com, bayut.com
Frankfurt UBS P&E, Destatis Bulwingesa, globalpropertyuide.com, numbeo.com
Geneva UBS P&E, Federal Income Tax Statistics, FSO Wüest Partner
Hong Kong UBS P&E, Census and Statistics Department Hong Kong
Hong Kong Statistical Office
London UBS P&E, ONS GLA datastore, findpoperly.co.uk, numbeo.com
Los Angeles BEA Zillow, numbeo.com, CBRE
Madrid UBS P&E Idealista, numbeo.com
Milan UBS P&E, Dipartimento delle Finanze Nomisma
Moscow UBS P&E numbeo.com
Munich UBS P&E, Destatis Bulwingesa, globalpropertyuide.com, numbeo.com
New York BEA Elliman, Zillow, globalpropertyguide.com
Paris UBS P&E, Insee Globalpropertyguide.com, numbeo.com
San Francisco BEA Zillow, numbeo.com, CBRE
Singapore Department of Statistics Singapore, Demographia.com
Globalpropertyguide.com, numbeo.com
Stockholm UBS P&E, Statistics Sweden Globalpropertyguide.com, numbeo.com, Statistics Sweden
Sydney UBS P&E, ABS Globalpropertyguide.com, numbeo.com
Tel Aviv CBS, numbeo.com, UBS P&E Globalpropertyguide.com, expatistan.com, numbeo.com, UBS P&E
Tokyo UBS P&E, INDB, Tokyo Metropolitan Government
Globalpropertyguide.com, numbeo.com
Toronto Statistics Canada Canada mortgage and housing corporation (CMHC), Globalpropertyguide.com, numbeo.com, Toronto Real Estate Board, condos.ca
Vancouver Statistics Canada Canada mortgage and housing corporation (CMHC), Globalproper-tyguide. com, numbeo.com, Real Estate Board of Greater Vancouver, condos.ca
Warsaw UBS P&E, Statistics Poland National Bank of Poland, numbeo.com
Zurich UBS P&E, Federal Income Tax Statistics, FSO Wüest Partner

Methodology & data
UBS Global Real Estate Bubble Index 2020 31
UBS Chief Investment Office’s (“CIO”) investment views are prepared and published by the Global Wealth Management business of UBS Switzerland AG (regulated by FINMA in Switzerland) or its affiliates (“UBS”).The investment views have been prepared in accordance with legal requirements designed to promote the independence of investment research.
Generic investment research – Risk information:This publication is for your information only and is not intended as an offer, or a solicitation of an offer, to buy or sell any investment or other specific product. The analysis contained herein does not constitute a personal recommendation or take into account the particular investment objectives, investment strategies, financial situation and needs of any specific recipient. It is based on numerous assumptions. Different assumptions could result in materially different results. Certain services and products are subject to legal restrictions and cannot be offered worldwide on an unrestricted basis and / or may not be eligible for sale to all investors. All information and opinions expressed in this document were obtained from sources believed to be reliable and in good faith, but no representation or warranty, express or implied, is made as to its accuracy or completeness (other than disclosures relating to UBS). All information and opinions as well as any forecasts, estimates and market prices indicated are current as of the date of this report, and are subject to change without notice. Opinions expressed herein may differ or be contrary to those expressed by other business areas or divisions of UBS as a result of using different assumptions and / or criteria.
In no circumstances may this document or any of the information (including any forecast, value, index or other calculated amount (“Values”)) be used for any of the following purposes (i) valuation or accounting purposes; (ii) to determine the amounts due or payable, the price or the value of any financial instrument or financial contract; or (iii) to measure the performance of any financial instrument including, without limitation, for the purpose of tracking the return or performance of any Value or of defining the asset allocation of portfolio or of computing performance fees. By receiving this document and the information you will be deemed to represent and warrant to UBS that you will not use this document or otherwise rely on any of the information for any of the above purposes. UBS and any of its directors or employees may be entitled at any time to hold long or short positions in investment instruments referred to herein, carry out transactions involving relevant investment instruments in the capacity of principal or agent, or provide any other services or have officers, who serve as directors, either to / for the issuer, the investment instrument itself or to / for any company commercially or financially affiliated to such issuers. At any time, investment decisions (including whether to buy, sell or hold securities) made by UBS and its employees may differ from or be contrary to the opinions expressed in UBS research publications. Some investments may not be readily realizable since the market in the securities is illiquid and therefore valuing the investment and identifying the risk to which you are exposed may be difficult to quantify. UBS relies on information barriers to control the flow of information contained in one or more areas within UBS, into other areas, units, divisions or affiliates of UBS. Futures and options trading is not suitable for every investor as there is a substantial risk of loss, and losses in excess of an initial investment may occur. Past performance of an investment is no guarantee for its future performance. Additional information will be made available upon request. Some investments may be subject to sudden and large falls in value and on realization you may receive back less than you invested or may be required to pay more. Changes in foreign exchange rates may have an adverse effect on the price, value or income of an investment. The analyst(s) responsible for the preparation of this report may interact with trading desk personnel, sales personnel and other constituencies for the purpose of gathering, synthesizing and interpreting market information.
Tax treatment depends on the individual circumstances and may be subject to change in the future. UBS does not provide legal or tax advice and makes no representations as to the tax treatment of assets or the investment returns thereon both in general or with reference to specific client’s circumstances and needs. We are of necessity unable to take into account the particular investment objectives, financial situation and needs of our individual clients and we would recommend that you take financial and / or tax advice as to the implications (including tax) of investing in any of the products mentioned herein.
This material may not be reproduced or copies circulated without prior authority of UBS. Unless otherwise agreed in writing UBS expressly prohibits the distribution and transfer of this material to third parties for any reason. UBS accepts no liability whatsoever for any claims or lawsuits from any third parties arising from the use or distribution of this material. This report is for distribution only under such circumstances as may be permitted by applicable law. For information on the ways in which CIO manages conflicts and maintains independence of its investment views and publication offering, and research and rating methodologies, please visit www.ubs.com/research. Additional information on the relevant authors of this publication and other CIO publication(s) referenced in this report; and copies of any past reports on this topic; are available upon request from your client advisor.
Options and futures are not suitable for all investors, and trading in these instruments is considered risky and may be appropriate only for sophisticated investors. Prior to buying or selling an option, and for the complete risks relating to options, you must receive a copy of “Characteristics and Risks of Standardized Options”. You may read the document at https://www.theocc.com/about/publications/character-risks.jsp or ask your financial advisor for a copy.

32 UBS Global Real Estate Bubble Index 2020
Investing in structured investments involves significant risks. For a detailed discussion of the risks involved in investing in any particular structured investment, you must read the relevant offering materials for that investment. Structured investments are unsecured obligations of a particular issuer with returns linked to the performance of an underlying asset. Depending on the terms of the investment, investors could lose all or a substantial portion of their investment based on the performance of the underlying asset. Investors could also lose their entire investment if the issuer becomes insolvent. UBS Financial Services Inc. does not guarantee in any way the obligations or the financial condition of any issuer or the accuracy of any financial information provided by any issuer. Structured investments are not traditional investments and investing in a structured investment is not equivalent to investing directly in the underlying asset. Structured investments may have limited or no liquidity, and investors should be prepared to hold their investment to maturity. The return of structured investments may be limited by a maximum gain, participation rate or other feature. Structured investments may include call features and, if a structured investment is called early, investors would not earn any further return and may not be able to reinvest in similar investments with similar terms. Structured investments include costs and fees which are generally embedded in the price of the investment. The tax treatment of a structured investment may be complex and may differ from a direct investment in the underlying asset. UBS Financial Services Inc. and its employees do not provide tax advice. Investors should consult their own tax advisor about their own tax situation before investing in any securities.
Important Information About Sustainable Investing Strategies: Sustainable investing strategies aim to consider and incorporate environmental, social and governance (ESG) factors into investment process and portfolio construction. Strategies across geographies and styles approach ESG analysis and incorporate the findings in a variety of ways. Incorporating ESG factors or Sustainable Investing considerations may inhibit the portfolio manager’s ability to participate in certain investment opportunities that otherwise would be consistent with its investment objective and other principal investment strategies. The returns on a portfolio consisting primarily of sustainable investments may be lower or higher than portfolios where ESG factors, exclusions, or other sustainability issues are not considered by the portfolio manager, and the investment opportunities available to such portfolios may differ. Companies may not necessarily meet high performance standards on all aspects of ESG or sustainable investing issues; there is also no guarantee that any company will meet expectations in connection with corporate responsibility, sustainability, and / or impact performance.
Distributed to US persons by UBS Financial Services Inc. or UBS Securities LLC, subsidiaries of UBS AG. UBS Switzerland AG, UBS Europe SE, UBS Bank, S.A., UBS Brasil Administradora de Valores Mobiliarios Ltda, UBS Asesores México, S.A. de C.V., UBS Securities Japan Co., Ltd, UBS Wealth Management Israel Ltd and UBS Menkul Degerler AS are affiliates of UBS AG. UBS Financial Services Incorporated of Puerto Rico is a subsidiary of UBS Financial Services Inc. UBS Financial Services Inc. accepts responsibility for the content of a report prepared by a non-US affiliate when it distributes reports to US persons. All transactions by a US person in the securities mentioned in this report should be effected through a US-registered broker dealer affiliated with UBS, and not through a non-US affiliate. The contents of this report have not been and will not be approved by any securities or investment authority in the United States or elsewhere. UBS Financial Services Inc. is not acting as a municipal advisor to any municipal entity or obligated person within the meaning of Section 15B of the Securities Exchange Act (the “Municipal Advisor Rule”) and the opinions or views contained herein are not intended to be, and do not constitute, advice within the meaning of the Municipal Advisor Rule.
External Asset Managers / External Financial Consultants: In case this research or publication is provided to an External Asset Manager or an External Financial Consultant, UBS expressly prohibits that it is redistributed by the External Asset Manager or the External Financial Consultant and is made available to their clients and / or third parties.
For country information, please visit ubs.com/cio-country-disclaimer-gr or ask your client advisor for the full disclaimer.
Version B / 2020. CIO82652744© UBS 2020. The key symbol and UBS are among the registered and unregistered trademarks of UBS. All rights reserved.


