64 · Email: [email protected] OVERVIEW STANDALONE FINANCIAL STATEMENTS...
97
64 Annual Report th 2013
Transcript of 64 · Email: [email protected] OVERVIEW STANDALONE FINANCIAL STATEMENTS...

veemelees efJeÐeles YeeJees veeYeeJees efJeÐeles mele:~Untrue can never be true and truth is indestructible.
64Annual Report
th
2013

Specialised Pouches
Personal Care
CORPORATE HEAD QUARTERTHANELBS Marg, Majiwade, Thane (West) - 400601, MaharashtraTel.: +91 22 2173 5551/5591Fax: +91 22 2173 5599/5650
MANUFACTURING LOCATIONSTHANELBS Marg, Majiwade, Thane (West) - 400601, MaharashtraTel.: +91 22 2173 5551/5591Fax: +91 22 2173 5599/5650
SILVASSASurvey No. 33/1, At Post Umerkoi, Via SilvassaU.T. of Dadra & Nagar Haveli - 396230Tel.: +91 97250 25351
HYDERABAD139 & 148, Sri Venkateshwara Co-op. Indl. EstateBollarum - 502325, Medak District, Andhra PradeshTel.: +91 8458 279628/616 Fax: +91 8458 279464
RUDRAPURPlot No. 70-73, Sector 4, IIE Pantanagar, Rudrapur, Udhamsingh Nagar - 263153 Uttarakhand Tel.: +91 5944 250183/84/85 Fax: +91 5944 250186
R&D CENTRELBS Marg, Majiwade, Thane (West) - 400601, MaharashtraTel.: +91 22 2173 5551/5591Fax: +91 22 2173 5599/5650
CUSTOMER SUPPORT OFFICESBANGALORE#91, West Park Road, 17th Cross, Malleswaram Bangalore - 560055 KarnatakaTel.: +91 80 23568979/23342873 Fax: +91 80 23342872
HYDERABAD139 & 148, Sri Venkateshwara Co-op. Indl. Estate,Bollarum - 502325, Medak District, Andhra PradeshTel.: +91 8458 279628/616 Fax: +91 8458 279464
KOLKATA5th Floor, Laha Paint House, 7 Chittaranjan AvenueKolkata - 700072, West BengalTel.: +91 33 2237 2812/2234 8241 Fax; +91 33 2225 5654
NEW DELHI508/510, Ansal Chamber II, 6 Bhikaji Cama Palace,New Delhi - 110066.Tel.: +91 11 2619 4795/5641
Specialised Cartons
Package Protection & Decoration Technologies
THANE
SILVASSA
HYDERABAD
RUDRAPUR
Product Portfolio

64th Annual Report & Accounts 2013 011
BOARD OF DIRECTORS
Chairman & Managing Director Mr. Suresh Gupta
Mr. Arunkumar Gandhi
Mr. P. V. Narayanan
Mr. Jukka Moisio
Mr. Johann Sippel
Mr. R. K. Dhir
Mr. S. K. Palekar
Mr. Nripjit Singh Chawla
Executive Director Mr. A. Venkatrangan
Company Secretary & Mr. Anand DagaHead - Legal
CONTENT
CORPORATE INFORMATION
BANKERS
Standard Chartered Bank
The Hongkong and Shanghai Banking Corporation Ltd.
AUDITORS
S.R. Batliboi & Co. LLPChartered Accountants
REGISTERED OFFICE
Unit No-12A-06, 13th Floor, Parinee Crescenzo, Plot No C-38/C-39,G-Block, Behind MCA, Bandra Kurla Complex, Bandra (East), Mumbai - 400051Tel No: +91 22 2653 1320Fax No: +91 22 2653 1310Website: www.pplpack.com
CORPORATE OFFICE
L. B. S. Marg, Majiwade,Thane (W) – 400 601Maharashtra, India.Tel No: +91 22 2173 5551 / 2173 5591Fax No: +91 22 2173 5599 / 2173 5650Email: [email protected]
OVERVIEW STANDALONE FINANCIAL STATEMENTS
CONSOLIDATED FINANCIAL STATEMENTS
Board of Directors 02 Auditors’ Report 30 Auditors’ Report 63
Financial Performance Indicators 03 Balance Sheet 34 Balance Sheet 64
Directors’ Report 06 Statement of Profi t & Loss 35 Statement of Profi t & Loss 65
Corporate Governance Report 11 Cash Flow Statement 36 Cash Flow Statement 66
Management Discussion & Analysis 26 Notes 38 Notes 68
Statement Pursuant to Section 212 62

022 64th Annual Report & Accounts 2013
BOARD OF DIRECTORS
MR. SURESH GUPTA - CHAIRMAN & MANAGING DIRECTOR
Mr. Suresh Gupta did his Masters in Management (MMS) from Jamnalal Bajaj Institute of Management Studies, Mumbai. He has diverse management experience of over 40 years, including 26 years in the Company. He was appointed as Managing Director since May, 1994, and designated as the Chairman & Managing Director of the Company w.e.f. 10th March, 2010. He also holds position of Executive Vice President, Flexible Packaging Global and a member of the Group Executive Team of Huhtamaki Oyj., the ultimate holding Company.
MR. ARUNKUMAR GANDHI - DIRECTOR
Mr. Arunkumar Gandhi is a Fellow Member of the Institute of Chartered Accountants of England & Wales and the Institute of Chartered Accountants of India and an Associate Member of the Chartered Institute of Taxation, London. He has been an Independent Director of the Company since March, 2002.
MR. P. V. NARAYANAN - DIRECTOR
Mr. P. V. Narayanan is a Post-Graduate in Chemistry and holds Diploma in Marketing Management. He has 47 years of experience in the fi eld of packaging covering various positions of eminence. He has also been conferred with the Honorary Membership by the Asian Packaging Federation. He has been awarded the Fellow membership of Institute of Packaging (F. Inst. Pkg) UK and Chartered Scientist (CS) by the Science Council, UK. He is an advisor of Cognizance Packaging Solutions Pvt. Ltd. Mr. Narayanan is a member of the Board of APEDA (Agricultural & Processed Food Products Export Development Authority), Ministry of Commerce, Government of India. He has been an Independent Director of the Company since March, 2002.
MR. JUKKA MOISIO - DIRECTOR
Mr. Jukka Moisio holds Masters degree in Science and (Econ) and MBA. He has worked with Ahlstrom Corp (1991-2008) before joining Huhtamaki Oyj in the year 2008. He is holding the position of CEO and Chairman of Group Executive Team of Huhtamaki Oyj. He has been nominated as Director by Huhtavefa B.V. on the Board of Directors of the Company w.e.f. 23rd April, 2008.
MR. JOHANN SIPPEL - DIRECTOR
Mr. Johann Sippel holds Post Graduate degree of Certifi ed Accounting Specialist (CCI) from Germany. He has over 28 years of experience including 24 years in Huhtamaki Group companies in different roles. He currently holds position of Vice President Finance, Flexible Packaging Global, leading the fi nance function for this segment of Huhtamaki Oyj since January, 2010. He has Finance & Accounts related expertise.
MR. RAMESH KUMAR DHIR - DIRECTOR
Mr. Ramesh Kumar Dhir is a Fellow Member of the Institute of Chartered Accountants England & Wales and also a Fellow of the Institute of Management (U.K.). He has wide corporate management experience of over 41 years working with Peat Marwick, London and a US Multinational with operations in India and overseas. He is a past President and on the Board of Council for Fair Business Practices. He is also a member of Maharashtra State General Committee of the Indian Red Cross Society. He has been an Independent Director of the Company since March, 2002.
MR. S. K. PALEKAR - DIRECTOR
Mr. S. K. Palekar did his M.Sc. (Physics) from Mumbai University and MMS (Marketing) from Jamnalal Bajaj Institute of Management Studies. He secured 1st rank both in M.Sc (Physics) & MMS (Marketing). He is currently the Chairperson of Executive Education Centre of S. P. Jain Institute of Management & Research at Mumbai. He brings with him 37 years of experience in all aspects of marketing – like sales, advertising, market research, brand management – and also of general management. He has hands on experience in FMCG, durables and service Industries. He retired as Senior Vice President of Marketing & Knowledge Management from Eureka Forbes Limited; after serving there for over a decade. He has joined as an Independent Director of the Company on 16th March, 2011.
MR. NRIPJIT SINGH CHAWLA - DIRECTOR
Mr. Nripjit Singh Chawla did his MBA from Indian Institute of Management, Calcutta. He has wide corporate management experience of over 44 years working with ITC Ltd., Korn/Ferry International, Max India Ltd. He is currently acting as Independent Management Consultant to Commercial organizations and NGO’s in the areas of Marketing, Business strategy and Business Processes, Education, Tourism and Hospitality, Healthcare, etc. He serves as teaching faculty in many Business Schools and Management Institutes. He has joined as an Independent Director of the Company on 12th March, 2013.
MR. A. VENKATRANGAN - EXECUTIVE DIRECTOR
Mr. A. Venkatrangan is Graduate in Commerce and MBA in Finance and Marketing and having a total experience of 33 years, wherein he has worked in Corporate Planning, Costing, MIS, Budget Control, Operations, Internal Audit and Commercial functions at various levels with Murugappa Group and Essar Group. He joined the Company in January, 1999. He was appointed as an Additonal Director of the Company on 4th June, 2012 and designated as the Executive Director of the Company w.e.f. 1st July, 2012.

64th Annual Report & Accounts 2013 013
TURNOVER (R in lac)
FINANCIAL PERFORMANCE INDICATORS
PROFIT BEFORE TAX, EXCEPTIONAL &EXTRAORDINARY ITEMS (R in lac)
EXPORT TURNOVER (R in lac)
0
5000
10000
15000
20000
25000
2009 2010 2011 2012 2013
Last 5 Years CAGR : 9.22%
15010
16875
21271
1195813342
EARNING BEFORE INT & TAX (EBIT) BEFORE EXCEPTIONAL & EXTRAORDINARY ITEMS
(R in lac)
02011 2012 201320102009
1,000
2,000
3,000
4,000
5,000
6,000
7,000
8,000
6,251 6,144
6,959
4,6875,071
0
1,000
2,000
3,000
4,000
5,000
6,000
7,000
8,000
2009 2010 2011 2012 2013
6,951
6,1396,247
4,6274,958
70,401 79,7300
20,000
40,000
60,000
80,000
100,000
120,000
2009 2010 2011 2013
Last 5 Years CAGR 10.22%
99,58157,769 88,299
2012

024 64th Annual Report & Accounts 2013
EPS AND BOOK VALUE PER SHARE
41.28
46.41
52.0256.18
59.63
7.68 8.39 7.188.70
0.00
10.00
20.00
30.00
40.00
50.00
60.00
70.00(R)
2009 2010 2011 2012 2013Book Value (Excluding Revaluation Reserve) 41.28 46.41 52.02 56.18 59.63EPS 5.96 7.68 8.39 7.18 8.70
5.96
NET WORTH GROWTH (R in lac)CASH PROFIT (R in lac)
PROFIT AFTER TAX, EXCEPTIONAL &EXTRAORDINARY ITEMS (R in lac)
2009 2010 2011 2012 2013
4,8125,260
4,503
5,453
3,738
0
1,000
2,000
3,000
4,000
5,000
6,000
6852
80528464
7955
8883
0
1000
2000
3000
4000
5000
6000
7000
8000
9000
10000
2009 2010 2011 2012 2013
0
5000
10000
15000
20000
25000
30000
35000
40000
2009 2010 2011 2012 2013
1254 1254 1254 1254 1254
24625 27836
31353 33961 37378
Share Capital
Reserves(Excluding Revaluation Reserve)

64th Annual Report & Accounts 2013 015
2013 2012 2011 2010 2009 2008 2007 2006 2005 2004
OPERATING RESULTS
Net Sales 99581 88299 79730 70401 57769 61209 53206 46467 39829 36178
Other Income 1550 1567 1426 832 911 1173 1074 1148 966 566
EBDIT 10389 9596 9455 7927 8186 6090 6768 6650 6437 5689
Depreciation & Amortisation 3430 3452 3204 3240 3115 2862 2886 2307 2498 2247
EBIT 6959 6144 6251 4687 5071 3228 3882 4343 3939 3442
Profi t before Tax 6951 6139 6247 4627 4958 2977 3697 4281 3868 3365
Exceptional Items & Extraordinary - Net of Tax 705 – 294 1533 – – (318) 1208 (80) –
Provision for Tax 2203 1636 1281 1348 1220 848 541 1497 1021 954
Profi t after Tax 5453 4503 5260 4812 3738 2129 2837 3992 2767 2411
EBDIT to Sales % 10.43% 10.87% 11.86% 11.26% 14.17% 9.95% 12.72% 14.31% 16.16% 15.72%
EBIT to Sales % 6.99% 6.96% 7.84% 6.66% 8.78% 5.27% 7.30% 9.35% 9.89% 9.51%
PBT to Sales % 7.69% 6.95% 8.20% 8.75% 8.58% 4.86% 6.35% 11.81% 9.51% 9.30%
Earning Per Share 8.70 7.18 8.39 7.68 5.96 3.40 4.53 6.37 4.41 3.85
Earning Per Share (Excluding Exceptional & Extraordinary items) 7.96 7.18 7.92 5.60 5.96 3.40 4.53 5.35 4.54 3.85
Cash Earning Per Share 14.17 12.69 13.50 12.84 10.93 7.96 9.13 10.05 8.39 7.37
Equity Dividend % 140 130 120 110 ***150 90 90 90 70 60
FINANCIAL POSITION
Equity Share Capital 1254 1254 1254 1254 1254 1254 1254 1254 1254 1254
Reserves & Surplus 37654 34237 31629 28112 24901 23363 22573 21131 18424 16698
Shareholders Funds 38908 35491 32883 29366 26155 24617 23827 22385 19678 17952
Loan Funds 1921 2061 2159 2253 2393 4981 6715 3378 1629 1302
Deferred Tax Liability (Net) (3) 40 252 526 677 690 852 839 602 899
Net Fixed Assets (Incl.Capital work in Progress) 16861 17568 18230 17869 20335 21055 21451 19670 13515 13650
Investments 9358 9916 6338 3945 3103 1698 1381 52 825 980
Net Assets(Current & Non Current) 14607 10108 10726 10332 5787 7535 8562 6880 7570 5518
Miscellaneous Expenditure – – – – – – – – – 5
Capital Employed 40826 37592 35294 32146 29225 30288 31394 26602 21910 20153
FINANCIAL HIGHLIGHTS
( R in lac)
*** Includes One Time Dividend @ 50%

026 64th Annual Report & Accounts 2013
DIRECTORS’ REPORT
Your Directors have pleasure in presenting the 64th Annual Report along with the Audited Statements of Accounts for the year ended 31st December, 2013.
PERFORMANCE DURING THE YEAR (STANDALONE)
Your Company’s performance during the year is summarized below:
(m in lac)
2013 2012
Net Sales 99,581 88,299
Profi t before Tax & Exceptional Item 6,951 6,139
Profi t before Tax 7,656 6,139
Less: Provision for Current Tax 2,247 1,848
Provision for Deferred Tax (44) (212)
Profi t after Tax 5,453 4,503
Add: balance of profi t for earlier years 17,542 15,383
Profi t available for appropriation 22,995 19,886
Transfer to General Reserve 545 450
Proposed Dividend on Equity Shares & Dividend Tax thereon 2,066 1,894
Balance Carried forward 20,384 17,542
During the year under review, the net sales grew by 12.8%. PBT margin improved from 6.95% to 6.98% despite increase in input and energy cost. PBT margin (including exceptional item) is 7.68%. Exceptional Income comprises gain on sale of offi ce property at Nariman Point, Mumbai of E 705 lac (provision for tax includes E 239 lac towards tax on this gain).
After providing for Income Tax of E 2,203 lac, Net Profi t after Tax & Exceptional Items was E 5,453 lac. After transferring an amount of E 545 lac to General Reserve, the amount available for appropriation was E 22,450 lac including amount brought forward of E 17,542 lac of previous year. The Earning per Equity Share (EPS) including Exceptional Items was E 8.70 & excluding exceptional items was E 7.96.
DIVIDEND
Your Directors recommend payment of dividend of E 2.80 per equity share i.e. @ 140% on the Equity Capital for the year ended 31st December, 2013. The said dividend will absorb E 2,066 lac including the dividend distribution tax and cess thereon.
FIXED DEPOSITS
The Company did not invite or accept deposits from public and/or shareholders during the year under review. As of 31st December, 2013, there was no fi xed deposit pending with the Company.
STATUTORY DISCLOSURES
The information relating to conservation of energy, technology absorption and foreign exchange earnings and outgo as required under Section 217(1)(e) of the Companies Act, 1956 read with the Companies (Disclosure of Particulars in the Report of Board of Directors) Rule, 1988 forms part of this report as Annexure 1.
In terms of the provisions of Section 217(2A) of the Companies Act, 1956, read with the Companies (Particulars of Employees) Rules, 1975 as amended, the names and other particulars of the employees are set out in the annexure to the Directors’ Report. However, as per the provisions of Section 219(b)(iv) of the said Act read with Clause 32 of the Listing Agreement, the Annual Report excluding the aforesaid information is being sent to all the members of the Company and others entitled thereto. Any member interested in obtaining such particulars may write to the Company at the registered offi ce of the Company.
64th Annual Report & Accounts 2013 017
DIRECTORS’ REPORT (contd.)
DIRECTORS
Mr. Arun Kumar Gandhi and Mr. Johann Sippel, retire by rotation at this Annual General Meeting and being eligible have offered themselves for re-appointment.
Mr. A. Venkatrangan was re-appointed as an Executive Director for a period of three years w.e.f. 1st July, 2013.
Mr. Suresh Gupta was re-appointed as the Chairman & Managing Director for a period of three years w.e.f. 1st January, 2014.
Mr. Nripjit Singh Chawla was appointed as an Additional Director of the Company w.e.f 12th March, 2013 and was subsequently appointed as Non-Executive, Independent Director on 7th May, 2013.
Mr. Timo Salonen who was an Alternate Director to Mr. Jukka Moisio, Director of the Company has resigned w.e.f 7th August, 2013.
DIRECTORS’ RESPONSIBILITY STATEMENT
The Directors confi rm that:
i) In the preparation of the annual accounts for the year ended 31st December, 2013 the applicable Accounting Standards have been followed and there are no material departures.
ii) Accounting policies have been selected and applied consistently and judgments and estimates made are reasonable and prudent so as to give a true and fair view of the state of affairs of the Company at the end of the Financial Year ended 31st December, 2013 and of the profi ts of the Company for that period.
iii) Proper and suffi cient care has been taken for the maintenance of adequate accounting records in accordance with the provisions of the Companies Act, 1956, for safeguarding the assets of the Company and for preventing and detecting fraud and other irregularities; and
iv) Annual accounts for the year ended 31st December, 2013 have been prepared on a going concern basis.
CORPORATE GOVERNANCE
A separate report on Corporate Governance forms part of this report.
Certifi cate from the Statutory Auditors of the Company regarding compliance with the Corporate Governance requirements as stipulated under Clause 49 of the Listing Agreement is attached.
MANAGEMENT DISCUSSION AND ANALYSIS
The Management Discussion and Analysis forms part of this Annual Report for the year ended 31st December, 2013.
AUDITORS’ REPORT
The Auditors’ Report does not contain any qualifi cation. Notes to Accounts and Auditors remarks in their report are self explanatory and therefore do not call for any further comments.
AUDITORS
M/s. S. R. Batliboi & Co. LLP, Chartered Accountants, Statutory Auditors of the Company hold offi ce until the conclusion of the ensuing Annual General Meeting and have furnished a certifi cate under Section 224 of the Companies Act, 1956 regarding their eligibility for re-appointment. The Audit Committee and the Board recommended their re-appointment.
COST AUDITORS
The Board of Directors have appointed M/s. R. Nanabhoy & Co., Cost Accountants, for conducting the audit of the cost accounting records maintained by the Company. The Cost Audit Report and Cost Compliance Report for the calendar year 2012 were fi led by the Company on 8th June, 2013, well within the prescribed time limit. The Cost Audit Report and Cost Compliance Report for the calendar year 2013 is expected to be fi led within the prescribed time.

028 64th Annual Report & Accounts 2013
DIRECTORS’ REPORT (contd.)
CHANGE IN THE NAME OF THE COMPANY
At the request of Huhtavefa B.V., the Board of Directors have recommended the change in the name of the Company from “The Paper Products Limited” to “Huhtamaki PPL Limited”. The Registrar of Companies, Maharashtra, Mumbai, has made the aforesaid name, viz., “Huhtamaki PPL Limited” available to the Company for adoption.
SUBSIDIARY COMPANY
In terms of General Exemption, under Section 212(8) of the Companies Act, 1956, granted by the Ministry of Corporate Affairs vide its circular no. 02/2011 dated 8th February, 2011 and in compliance with the conditions enlisted therein, the Audited Statement of Accounts, Auditors’ Report thereon and the Reports of the Board of Directors of Webtech Labels Pvt. Ltd., the Company’s subsidiary for the year ended 31st December, 2013 have not been annexed. A statement pursuant to Section 212 of the Companies Act, 1956 relating to the subsidiary is attached to the Accounts.
Further, The Annual Accounts and related documents of the Subsidiary company shall be kept open for inspection at the Registered Offi ce of the Company. The Company will also make available these documents upon request by any Member of the Company interested in obtaining the same. Further, pursuant to Accounting Standard AS-21 issued by the Institute of Chartered Accountant of India, Consolidated Financial Statements presented by the Company in this Annual Report includes the fi nancial information of its subsidiary.
INDUSTRIAL RELATIONS
The industrial relations during the year under review continued to be cordial. The Directors place on record their sincere appreciation of the services rendered by employees at all levels.
OBLIGATION OF COMPANY UNDER THE SEXUAL HARRASMENT OF WOMEN AT WORKPLACE (PREVENTION, PROHIBITION AND REDRESSAL) ACT, 2013
In order to prevent sexual harassment of women at work place a new act The Sexual Harassment of Women at Workplace (Prevention, Prohibition and Redressal) Act, 2013 has been notifi ed on 9th December, 2013. Under the said Act every company is required to set up a Committee to look into complaints relating to sexual harassment at work place of any women employee.
In view of the said Act being notifi ed on 9th December, 2013, the Company is in the process of setting up the requisite Committee and putting other Compliance requirements in place.
The Company has not received any complaints relating to sexual harassment at work place from any women employee, during the year.
ACKNOWLEDGMENT
Your Board of Directors wish to express its sincere appreciation for the excellent support and co-operation received from
Huhtamaki Group, shareholders, customers, vendors, banks and all other business associates.
By Order of the BoardFor THE PAPER PRODUCTS LIMITED
Mumbai SURESH GUPTA
21st March, 2014 Chairman & Managing Director

64th Annual Report & Accounts 2013 019
ANNEXURE TO DIRECTORS’ REPORTANNEXURE - 1A. CONSERVATION OF ENERGY
The Company has a well-structured energy management system in place. Regular efforts are made to optimize process
parameters, modernize plant and machinery and upgrade technology and equipment.
Some of the key initiatives during 2013 are:
� Replacement of old chiller by latest energy effi cient screw and scroll chillers.
� Installation of energy effi cient LED light in offi ces.
� Replacement of DC drives into AC drives in major process equipment.
� Installation of VFD in Air Handling Units, blowers etc.
� Installation of Auto Controllers for Cooling tower fans that are temperature sensitive.
B. TECHNOLOGY ABSORPTION, ADAPTION & INNOVATION
Your Company has taken continuous efforts in developing new, effective and need based products and thus has introduced many new products in the market.
The Company’s Central Research & Development Center is located at Thane and is recognized as Research & Development Center by the Department of Science & Technology, Government of India.
The Company believes that ‘Sustainability is the need of the day’. The Company has undertaken various projects to improve Sustainability and the projects are in various stages of implementation. To carry out such projects necessary trial machines have been added to the existing facilities.
Enhancement of consumer convenience by increasing value of the products, but without increasing signifi cant cost is another focus area of Innovation activities carried out by the Company.
Your Company believes in maintaining technological leadership which requires building up of strong knowledge base through absorption from external sources, creation through internal trials and experimentation on a continuous basis. The Company has upgraded its existing Laboratory facilities and instruments.
These innovative efforts in developing new products have been recognized by several organizations over the years. Your
Company has received many awards during the year for innovations in packaging.
The expenditure on R & D during the year under report is as below:
a. Capital e 53 lac
b. Recurring e 138 lac
c. Total e 191 lac
C. FOREIGN EXCHANGE EARNINGS & OUTGO
a. Foreign exchange earnings from the exports of the Company’s products & services amounted to e 19,871 lac.
b. The outfl ow of foreign exchange on account of import of goods and expenses on Travelling, Commission on
Exports, Royalty and Technical Service charges amounted to e 16,890 lac.

0210 64th Annual Report & Accounts 2013
COMPANY’S PHILOSOPHY ONCODE OF GOVERNANCE
PPL believes that good Corporate Governance is essential to achieve long term corporate goals and enhance stakeholders’ value. Thus, PPL’s philosophy on Corporate Governance is aimed at the attainment of highest level of transparency, accountability and compliance of laws in all facets of operations, leading to best standards of Corporate Governance.
It is PPL’s belief that good ethics make good business sense and our business practices are in keeping with this spirit of maintaining the highest level of ethical standards. The implementation of PPL’s code for prohibition of Insider Trading exemplifi es this spirit of good ethics.
The Company complies with the requirements of Corporate Governance as stipulated under Clause 49 of the Listing Agreement, entered into with the Stock Exchanges where its shares are listed.

64th Annual Report & Accounts 2013 0111
CORPORATE GOVERNANCE
The Directors present the Company’s Report on Corporate Governance for the year ended 31st December, 2013.
BOARD OF DIRECTORS
The Board of Directors of the Company (hereinafter referred as the Board) comprises of a combination of Executive and Non-Executive Directors. The Board of Directors, as on 31st December, 2013 comprised 9 Directors of whom two are Executive and seven are Non-Executive Directors with fi ve Directors being Independent. The Chairman of the Board is an Executive Director and more than half of the Board members are Independent. The composition of the Board is in line with requirement of Clause 49 of the Listing Agreement. The Independent Directors do not have any material pecuniary relationship or transactions with the Company, Promoters or Management, which may affect their judgment in any manner. The Directors are eminently qualifi ed and experienced professionals in business, fi nance and corporate management.
The policy formulation, evaluation of performance and the control function vest with the Board, while the Board Committees oversee operational issues. The Board meets at least once in a quarter to consider amongst other business, the quarterly performance of the Company and fi nancial results. Directors attending the meetings actively participate in the deliberations at these meetings.
The composition of the Board and attendance at Board Meetings and the last Annual General Meeting (AGM) held during the year under review is given below:
S. No.
Name of the Director Category No. of Board Meetings held
during the FY 2013 / Tenure
No. of Board Meetings attended
Attendance at Last AGM
1 Mr. Suresh Gupta * Chairman & Managing Director
Executive 6 6 Yes
2 Mr. A. Venkatrangan ~Executive Director
Executive 6 5 Yes
3 Mr. Jukka Moisio Non-Executive 6 1 Yes
4 Mr. Johann Sippel Non-Executive 6 4 Yes
5 Mr. Timo Salonen #(Alternate to Mr. Jukka Moisio)
Non-Executive 3 0 No
6 Mr. Arunkumar Gandhi Non-Executive, Independent 6 6 Yes
7 Mr. P.V. Narayanan Non-Executive, Independent 6 6 Yes
8 Mr. Ramesh K. Dhir Non-Executive, Independent 6 5 Yes
9 Mr. S. K. Palekar Non-Executive, Independent 6 6 Yes
10 Mr. Nripjit Singh Chawla $ Non-Executive, Independent 5 4 Yes
11 Mr. K. C. Narang ^ Non-Executive, Independent 2 2 N.A
* Mr. Suresh Gupta was re-appointed as the Chairman & Managing Director for a period of three years w.e.f. 1st January, 2014.
~ Mr. A. Venkatrangan was re-appointed as an Executive Director for a period of three years w.e.f. 1st July, 2013.
# Mr. Timo Salonen who was an Alternate Director to Mr. Jukka Moisio, Director of the Company has resigned as an Alternate Director of the Company w.e.f. 7th August, 2013.
$ Mr. Nripjit Singh Chawla was appointed as an Additional Director w.e.f. 12th March, 2013 and was subsequently appointed as Non-Executive, Independent Director on 7th May, 2013.
^ Mr. K. C. Narang retired as Director of the Company w.e.f. 12th March, 2013.

0212 64th Annual Report & Accounts 2013
CORPORATE GOVERNANCE (contd.)
During the year 2013, six Board Meetings were held on 6th February, 2013, 12th March, 2013, 7th May, 2013, 7th August, 2013, 19th October, 2013 and 13th November, 2013 with time gap not exceeding 4 months between two such meetings. The Annual General Meeting was held on 7th May, 2013.
Apart from physical meetings, the Board also considered and approved certain matters by circular resolutions, which were noted at the next Board Meeting.
Directorships and Committee Memberships/Chairmanships in other public limited companies are given below:
Name of the DirectorAs on 31st December, 2013
Other Directorship(s)1Committee positions in other Companies (excluding PPL)2
Member Chairman Total
Mr. Suresh Gupta 1 Nil Nil Nil
Mr. Jukka Moisio Nil Nil Nil Nil
Mr. Johann Sippel Nil Nil Nil Nil
Mr. Arunkumar Gandhi 2 1 1 2
Mr. P.V. Narayanan Nil Nil Nil Nil
Mr. Ramesh K. Dhir Nil Nil Nil Nil
Mr. S. K. Palekar 2 Nil Nil Nil
Mr. A. Venkatrangan 1 Nil Nil Nil
Mr. Nripjit Singh Chawla Nil Nil Nil Nil
1The number of Directorships excludes Directorships of private limited companies, foreign companies, companies licensed under Section 25 of the Companies Act, 1956 and Alternate Directorships.
2Committee includes only Audit Committee and Shareholders’ Grievance Committee of public limited companies (excluding foreign companies and section 25 companies) in terms of Clause 49 of the Listing agreement.
Information provided to the Board:
The annual calendar of the Board & Committee Meetings is agreed upon at the beginning of the year. The agenda is circulated well in advance to the Board members, along with comprehensive background information on the items in the agenda to enable the Board to deliberate on relevant points and arrive at an informed decision. All relevant information related to the working of the Company, including the information required under Clause 49 I (C)(i) of the Listing Agreement is made available to the Board. In addition to matters which require to be placed before the Board for its noting and/or approval, information is also provided on various other signifi cant matters.
Review of legal compliance reports:
During the year, the Board periodically reviewed reports placed by the management with respect to compliance of various laws applicable to the Company. The Internal Auditors also review compliance status and report to the Audit Committee.
Relationship between Directors inter-se:
There are no inter-se relationships amongst the Directors.
COMMITTEES OF THE BOARD:
The Board has constituted various Committees, viz., the Audit Committee, the Remuneration Committee, the Shareholders’/ Investors’ Grievance Committee and the Share Transfer Committee.

64th Annual Report & Accounts 2013 0113
CORPORATE GOVERNANCE (contd.)
a) Audit Committee:
(i) The Audit Committee comprises of three Non-Executive Independent Directors, all of them are fi nancially literate and one of them possesses accounting and/or fi nancial management expertise.
During the Year 2013, fi ve Audit Committee meetings were held on 6th February, 2013, 12th March, 2013, 7th May, 2013, 7th August, 2013 and 13th November, 2013. The time gap between two consecutive meetings of the Audit Committee was not more than four months.
The composition of the Audit Committee and the attendance of Directors at its meetings are given hereunder:
Name of the Director Qualifi cation Meetings attended / held during FY 2013
Mr. S. K. Palekar ^Chairman
M. Sc (Physics) and M.M.S (Marketing)
3/3
Mr. Arunkumar Gandhi FCA (India) and FCA (England & Wales)
5/5
Mr. P. V. Narayanan Post Graduate in Chemistry 5/5
Mr. K. C. Narang* B.A, L.L.B, FCA 2/2
^Mr. S. K. Palekar was appointed as the Chairman and member of the Audit Committee w.e.f. 12th March, 2013.
*Mr. K. C. Narang ceased to be the Chairman of the Audit Committee w.e.f. 12th March, 2013 consequent to his retirement from the Board.
(ii) The terms of reference of the Audit Committee are in line with clause 49 II (C) and (D) of the Listing Agreement and Section 292A of the Companies Act, 1956.
The terms of reference of the Audit Committee include the following:
• Overseeing Company’s fi nancial reporting process and the disclosure of its fi nancial information.
• Review of Management discussion and analysis of fi nancial condition and results of operations.
• Recommending appointment, re-appointment or removal of the statutory auditors, fi xing of audit fees and approving payments for any other services.
• Reviewing with the management the quarterly and annual fi nancial statements with primary focus on:
a. Matters required to be included in the Director’s Responsibility Statement,
b. Accounting policies and practices,
c. Compliances with accounting standards,
d. Accounting based on exercise of judgment by Management,
e. Qualifi cations in the draft Audit Report,
f. Compliance with the Listing Agreement and legal requirements concerning fi nancial statements,
g. Signifi cant adjustments arising out of audit, if any,
h. The going concern assumption,
i. Related party transactions.
• Reviewing with the management, external and internal auditors the adequacy and compliance of internal control systems.
• Reviewing Company’s fi nancial and risk management policies.
• Reviewing the internal audit function and reports and major fi ndings of the internal auditors.
• Pre-Audit and Post-Audit discussion with the Statutory Auditors to ascertain any area of concern.
The Chairman of the Committee was present at the Annual General Meeting of the Company held in 2013 for addressing the shareholders queries, if any.
The CMD, CMO, CFO, the Statutory Auditors and the Internal Auditors are invited by the Committee to attend the meetings. Operating managers are also invited to attend as and when it is required.

0214 64th Annual Report & Accounts 2013
CORPORATE GOVERNANCE (contd.)
The minutes of the Audit Committee meetings are placed before the Board. The Company Secretary of the Company acts as Secretary to the Audit Committee.
(iii) The Committee relies on the expertise and knowledge of the management, Internal Auditors and independent Statutory Auditors in carrying out its responsibilities. It also uses external expertise, if required. Management is responsible for the preparation, presentation and integrity of the Company’s fi nancial reporting principles. Management is also responsible for internal control over fi nancial reporting and all procedures are designed to ensure compliance with Accounting Standards, applicable laws and regulations as well as for objectively reviewing and evaluating the adequacy, effectiveness and quality of the Company’s system of internal control.
M/s. S. R. Batliboi & Co. LLP, Chartered Accountants, are the Company’s independent Statutory Auditors. They are responsible for performing an independent audit of the fi nancial statements and expressing an opinion on the conformity of those fi nancial statements with accounting principles generally accepted in India.
b) Shareholders/Investors Grievance Committee:
The Committee comprises of two Non–Executive Directors. During the Year 2013, one Shareholders/Investors Grievance Committee meeting was held on 12th March, 2013 in which both the Directors were present.
The composition of the Committee is given hereunder:
Name of the Director Meetings attended / held during FY 2013
Mr. Ramesh K. Dhir#
Chairman1/1
Mr. S. K. Palekar ^ N.A
Mr. K. C. Narang* 1/1
#Mr. Ramesh K. Dhir was appointed as the Chairman of Shareholders/Investors Grievance Committee w.e.f. 12th March, 2013.
^ Mr. S. K. Palekar was appointed as member of Shareholders/Investors Grievance Committee w.e.f. 12th March, 2013.
* Mr. K. C. Narang ceased to be the Chairman of Shareholders/Investors Grievance Committee w.e.f. 12th March, 2013 consequent to his retirement from the Board.
The Company has attended to all the Investor’s grievances/queries/information requests except for the cases where the Company was constrained due to pending legal proceedings or Court/statutory orders. The Company endeavors to reply to all letters/complaints received from shareholders within a week of receipt of the same.
There were no investor complaints pending at the beginning and at the end of the year. The status of complaints, if any, is also reported to the Board. The Compliance Offi cer and his team along with the registrar and share transfer agent of the Company address general queries of the shareholders to their satisfaction.
Details of investors’ complaints received during 2013:
Nature of Complaint Received Replied/resolved Pending Remarks
Non-receipt of Dividend 1 1 – –
Non-receipt of share Certifi cate after transfer/Exchange/Sub divided/consolidated/Annual Report
2 2 – –
Total 3 3 – –

64th Annual Report & Accounts 2013 0115
CORPORATE GOVERNANCE (contd.)
c) Remuneration Committee:
With a view to review and recommend to the Board the remuneration payable to the Executive Directors from time to time, a Remuneration Committee of the Board was constituted which comprises of three Independent Directors. The composition of the Committee and their attendance at the meeting(s) is given hereunder:
Name of the Director Meetings attended / held during FY 2013
Mr. Arunkumar GandhiChairman
3/3
Mr. Ramesh K. Dhir 3/3
Mr. Nripjit Singh Chawla^ 2/2
Mr. K. C. Narang* 1/1
^ Mr. Nripjit Singh Chawla was appointed as the member of the Remuneration Committee w.e.f. 12th March, 2013.
* Mr. K. C. Narang ceased to be the member of the Remuneration Committee w.e.f. 12th March, 2013 consequent to his retirement from Board.
The meetings of the Remuneration Committee were held on 12th March, 2013, 7th May, 2013 and 13th November, 2013, in which all the members were present.
The remuneration paid to Mr. Suresh Gupta, Chairman & Managing Director and Mr. A. Venkatrangan, Executive Director for the year 2013 is as under:
(Amount in e)
Name of the Directors Salary HRA Perquisites Commission Total
Mr. Suresh Gupta 12,505,874 5,352,204 2,805,574 - 20,663,652
Mr. A. Venkatrangan 12,567,678 - 2,054,394 - 14,622,072
Notes:
1. Perquisites include Company’s contribution to provident fund, medical and leave travel allowance etc., as well as monetary value of perquisites as per Income Tax Rules.
2. Salary includes incentive of r 3,429,175/- paid to Mr. Suresh Gupta and r 4,773,481/- paid to Mr. A Venkatrangan under the Management Incentive Program based on the Company performance and achievement of specifi c targets.
3. The above does not include gratuity and leave encashment benefi ts as the provisions for these are determined for the Company as a whole and therefore separate amounts for the Directors are not available.
4. The Chairman & Managing Director and Executive Director of the Company are entitled to options under “Option Rights Plan” and shares under the “Share Ownership Plan” of Huhtamaki Oyj (the ultimate Holding company) which entitles the holder of the option rights to subscribe to the shares of the ultimate holding company at a future date, at a price fi xed based on the fair market price of the shares during specifi ed period plus certain percentage of market value on the exercise date and the recipient of grants under share ownership plan is entitled to receive shares at nil cost respectively. The schemes detailed above are assessed, managed and administered by the ultimate holding company and there is no cost charged to the Company. The charge, taken by Huhtamaki Oyj in its accounts for the year ended 31st December, 2013 for these options and shares is r 1,000,213/- (previous year r 12,668,234/-)
5. The above remuneration of Mr. Suresh Gupta, Chairman & Managing Director of the Company does not include r 22,224,552/- (Previous Year r 9,303,590/-), paid by Huhtamaki Oyj, the parent company, for his role as Executive Vice President, Flexibles Global Packaging, Huhtamaki Oyj.
0216 64th Annual Report & Accounts 2013
CORPORATE GOVERNANCE (contd.)
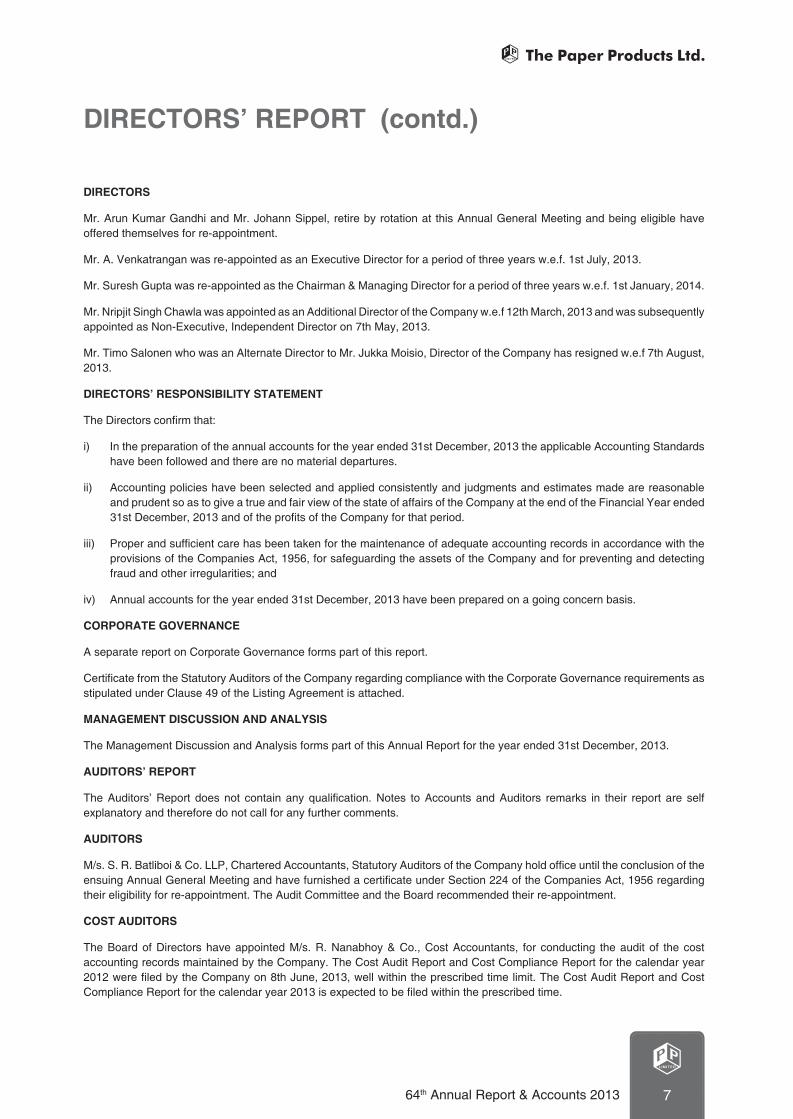
6. Details of service contracts, notice period and severance fees of the Executive Directors:
Mr. Suresh Gupta Mr. A. Venkatrangan
Date of contract 6th July, 1999 (renewed and modifi ed on 22nd June, 2001, 24th June, 2004, 27th April, 2007, 3rd March, 2010, 4th May, 2012 and 13th November, 2013)
27th July, 2012 and 7th May, 2013
Notice Period 90 days 90 days
Severance fees i. Salary and other emoluments for a period of 90 days in lieu of notice.
and
ii. Base salary for a period equal to one month’s base salary for every year of completed service.
Salary and other emoluments for a period of 90 days in lieu of notice.
Remuneration to Non–Executive Directors
Non–Executive Directors are paid sitting fees for attending Board/Committee Meetings as approved by the Board within the limits prescribed under the Companies Act, 1956.
Details of Sitting Fees paid to the Directors during the year 2013 are as follows:(Amount in e)
Names of the Directors Board Meetings Committee Meetings Total
Mr. Arunkumar Gandhi 90,000 120,000 210,000
Mr. S. K. Palekar 90,000 45,000 135,000
Mr. P. V. Narayanan 90,000 75,000 165,000
Mr. Ramesh K. Dhir 75,000 45,000 120,000
Mr. Nripjit Singh Chawla 60,000 30,000 90,000
Mr. K. C. Narang 30,000 45,000 75,000
Total 435,000 360,000 795,000
The Commission payable to the Non–Executive Independent Directors for the year 2013 is as follows:(Amount in e)
Names of the Directors Commission
Mr. Arunkumar Gandhi 1,200,000
Mr. S. K. Palekar 800,000
Mr. P.V. Narayanan 700,000
Mr. Ramesh K. Dhir 650,000
Mr. Nripjit Singh Chawla 515,000
Mr. K. C. Narang 286,000
Total 4,151,000
Commission payable to each of the Independent Directors as authorized by the Members at 62nd Annual General Meeting held on 4th May, 2012, is limited to a fi xed amount per year as determined and approved by the Board based on their contribution at the Board and Committee meetings. The total amount of commission to Non-Executive Independent Directors is within the limit of 1% of the net profi ts of the Company for the year, calculated as per the provisions of the Companies Act, 1956.
None of the Non-Executive Directors are holding any shares in the Company, except Mr. K. C. Narang (holding 150,000 equity shares), who has retired from Directorship of the Company w.e.f. 12th March, 2013. The Company has not granted any stock options to its Directors.

64th Annual Report & Accounts 2013 0117
CORPORATE GOVERNANCE (contd.)
d) Share Transfer Committee
The Board of Directors has delegated the powers to approve the transfer of shares to a Share Transfer Committee. The Committee comprises of Mr. Suresh Gupta, Chairman & Managing Director, Mr. A. Venkatrangan, Executive Director and Mr. Johann Sippel, Director.
The meetings of the Share Transfer Committee were held on 30th January, 2013, 12th February, 2013, 14th March, 2013, 2nd April, 2013, 25th April, 2013, 14th May, 2013, 4th June, 2013, 5th June, 2013, 21st June, 2013,1st July, 2013, 26th August, 2013, 2nd September, 2013, 14th October, 2013, 24th October, 2013, 25th October, 2013, 1st November, 2013, 19th December, 2013, 23rd December, 2013 and 30th December, 2013.
The report of the Practising Company Secretary on the Reconciliation of Share Capital of the Company as required by SEBI is obtained every quarter and furnished to the Stock Exchanges. The Report is also placed before the Board and noted by them as required under the applicable law.
Share Transfer System
Documents for transfer of shares in physical form can be lodged with Sharepro Services (India) Pvt. Ltd., the R&T Agents of the Company. The Board of Directors has delegated the powers to approve the transfer of shares to Share Transfer Committee. The Committee attends to share transfer formalities at least once in fortnight.
MANAGEMENT
Management Discussion and Analysis
This Annual Report has a detailed section on Management Discussion and Analysis (MDA).
Disclosures by Management
The particulars of transactions between the Company and its related parties as per the Accounting Standard are set out in Note 37 forming part of the accounts. These transactions are not likely to have any confl ict with the Company’s interest.
All details relating to fi nancial and commercial transactions where Directors may have a potential interest are provided to the Board, and interested Directors neither participate in the discussion, nor do they vote on such matters.
CEO/CFO Certifi cation
Mr. Suresh Gupta, Chairman & Managing Director, Mr. A. Venkatrangan, Executive Director & Mr. Parag Vyavahare, Chief Financial Offi cer, have issued necessary certifi cation to the Board in terms of Clause 49(V) of the Listing Agreement and the same was taken on record by the Board at its meeting held on 18th February, 2014. A copy of this certifi cate is provided as Annexure A to this report.
Code of Conduct
As required under Clause 49 of the Listing Agreement, the Company has laid down Code of Conduct for Directors and Senior Management Personnel of the Company. The same has been posted on the Company’s website www.pplpack.com. The Company has received affi rmation of compliance from Directors & Senior Managerial Personnel of the Company for the fi nancial year ended 31st December, 2013. A declaration to this effect signed by the Chairman & Managing Director of the Company is provided as Annexure B to this report.
DISCLOSURES
Disclosures Regarding Appointment or Reappointment of Directors
A. Pursuant to the Articles of Association of the Company, at every Annual General Meeting of the Company, one-third of the directors, whose offi ce is subject to retirement, are liable to retire.
Accordingly, Mr. Johann Sippel and Mr. Arunkumar Gandhi being longest in offi ce shall retire by rotation at the ensuing Annual General Meeting, and being eligible have offered themselves for re-appointment.

0218 64th Annual Report & Accounts 2013
CORPORATE GOVERNANCE (contd.)
Mr. A. Venkatrangan was re-appointed as an Executive Director of Company to hold offi ce for a period of 3 (three) years w.e.f.1st July, 2013. Mr. Suresh Gupta was re-appointed as the Chairman & Managing Director of the Company w.e.f. 1st January, 2014 for a period of 3 (three) years. Their re-appointment is subject to approval of members at the ensuing Annual General Meeting of the Company.
B. The brief resumes of the above-mentioned Directors are as follows:
Mr. Johann Sippel holds Post Graduate degree of Certifi ed Accounting specialist (CCI) from Germany. He has over 28 years of experience including 24 years in Huhtamaki Group Companies in different roles. He currently holds position of Vice President Finance, Flexible Packaging Global, leading the fi nance function for this segment of Huhtamaki Oyj since January, 2010. He has fi nance and accounts related expertise.
Mr. Arunkumar Gandhi is a Fellow Member of the Institute of Chartered Accountants England & Wales and the Institute of Chartered Accountants of India and an Associate Member of the Chartered Institute of Taxation, London. He has been an Independent director of the Company since March, 2002.
Mr. A. Venkatrangan is a Graduate in Commerce and MBA in Finance and Marketing and is having a total experience of 33 years, wherein he has worked in Corporate Planning, Costing, MIS, Budget Control, Operations, Internal Audit and Commercial functions at various levels with Murugappa Group and Essar Group. He joined the Company in January, 1999.
Mr. Suresh Gupta did his Masters in Management (MMS) from Jamnalal Bajaj Institute of Management Studies, Mumbai. He has diverse management experience of over 40 years, including 26 years in the Company. He was appointed as Managing Director since May, 1994, and designated as the Chairman & Managing Director of the Company w.e.f. 10th March, 2010. He also holds position of Executive Vice President, Flexible Packaging Global and a member of the Group Executive Team of Huhtamaki Oyj., the ultimate holding Company.
Means of Communication
The Company has always promptly reported to all the Stock Exchanges where the securities of the Company are listed, all the material information including declaration of quarterly/half-yearly and annual fi nancial results in the prescribed formats and through press releases etc.
The fi nancial results and other statutory information are communicated to the shareholders by way of advertisement in “Business Standard” the English newspaper having nationwide circulation and “Sakal” the Marathi (the local language) newspaper, as per the requirements of the Listing Agreement entered into with the Stock Exchanges.
The said results are also made available on the Company’s website: www.pplpack.com. The Offi cial press releases, Company information, Annual Reports and the extracts of media coverage are also displayed on the Company’s website.
As the fi nancial results are published in leading newspapers as well as hosted on the Company’s website, the results are not sent to the households of the individual shareholders.
Insider Trading Regulations
The Company has notifi ed and adopted the PPL Code of Conduct for Prohibition of Insider Trading made pursuant to SEBI (Prohibition of Insider Trading) Regulations, 1992. The Company Secretary of the Company is the Compliance Offi cer for the purpose of these Regulations.
Details of capital market related non-compliance, if any
There has been no non-compliance by the Company of any legal requirements during the last three years; nor has there been any penalty, stricture imposed on the Company by any stock exchange, SEBI or any statutory authority on any matter related to capital markets pertaining to this period.

64th Annual Report & Accounts 2013 0119
CORPORATE GOVERNANCE (contd.)
Risk Management
The Company has in place mechanism to inform Board Members about the Risk Assessment and Minimization procedures and periodical reviews to ensure that risk is controlled by the Executive Management.
Adoption/Non-adoption of Non-Mandatory Requirements of Clause 49 of the Listing Agreement
• The Company has not provided for tenure of Independent Directors.
• The Company has set up the Remuneration Committee.
• The Company does not send Half-yearly fi nancial performance to each household of shareholders, as it is displayed on Company’s website.
• The Audit qualifi cations if any are displayed in the fi nancial reports of the Company. There are no audit qualifi cations for the year under review.
• The Company does not have any formal training program for Board Members.
• There is no mechanism for evaluating the performance of Non-Executive Board Members.
• The Company does not have a “Whistle Blower Policy”. However no personnel has been denied access to the Audit Committee to seek redressal of his/her grievance, if any.
Annual General Meetings
The details of last three Annual General Meetings held were as under:
Year Date Time Location Special Resolutions passed
2010 27.04.2011 4.00 PM Rama Watumull Auditorium,Kishinchand Chellaram College,Dinshaw Wacha Road,Churchgate, Mumbai – 400 020
NIL
2011 04.05.2012 4.00 PM - Do - To approve payment of a sum not exceeding 1% of net profi t to Directors other than Managing/whole-time Director(s)/Executive Director(s) of the Company for a period of fi ve years commencing from 1st January, 2012.
2012 07.05.2013 4.00 PM - Do - To seek consent of the Company for holding offi ce or place of profi t by, Mr. A. Venkatrangan, under Section 314(1)(a) and payment of remuneration and perquisites.
The Company has not conducted any Postal Ballot for passing of any Special Resolution during the last three years.
GENERAL SHAREHOLDER INFORMATION
Details of ensuing Annual General Meeting
Day & Date Time Venue
7th May, 2014 4.00 PM Manik Sabhagriha, Vishwakarma, M. D. Lotlikar Vidya Sankul, Opp. Lilavati Hospital, Bandra Reclamation, Mumbai - 400 050

0220 64th Annual Report & Accounts 2013
CORPORATE GOVERNANCE (contd.)
Financial Calendar:
Financial Year: Calendar Year (1st January to 31st December)
Schedule of the Board Meetings for declaration of Financial Results (tentative and subject to change):
Quarter ended Date of Board Meetings
March, 2014 7th May, 2014 (Wednesday)
June, 2014 8th August, 2014 (Friday)
September, 2014 7th November, 2014 (Friday)
December, 2014 Second week of February, 2015
Book Closure Date
Pursuant to Section 154 of the Companies Act, 1956, the Register of Members will remain closed from Thursday 24th April, 2014 to Wednesday 7th May, 2014 (both days inclusive).
Dividend Payment Date
Dividend at the rate of r 2.80 per share has been recommended by the Board and is subject to the approval from the shareholders at the ensuing AGM, the same will be paid on or before 15th May, 2014:
a) to all those benefi cial owners holding shares in electronic form, as per the ownership data made available to the company by National Securities Depository Limited (NSDL) and the Central Depository Services (India) Limited (CDSL) as of the end-of-the-day on 23rd April, 2014; and
b) To all those shareholders holding shares in physical form, after giving effect to all the valid share transfers lodged with the Company on or before the closing hours on 23rd April, 2014.
Dividend History of the Company
Year AGM Date Divident Rate e (%)
2010 27.04.2011 r 2.20/- (110%)
2011 04.05.2012 r 2.40/- (120%)
2012 07.05.2013 r 2.60/- (130%)
Listing of Shares on Stock Exchanges
The Company’s shares are listed BSE Limited (BSE) and National Stock Exchange of India Limited (NSE). The details of the same are as follows:
Stock Exchange Stock Code/Symbol
BSE Limited (BSE)
The National Stock Exchange of India Limited (NSE)
509820
PAPERPROD
The ISIN of Company’s equity shares is INE275B01026.
Annual Listing fees for 12 months ended 31st March, 2014 have been paid to the BSE and NSE.
Company Identifi cation Number (CIN)
All the forms, returns, balance sheets, charges & all other documents, papers etc. fi led by the Company with the Registrar of Companies are available for inspection on the offi cial website of MCA www.mca.gov.in, under the Company Identifi cation Number (CIN): L21011MH1950FLC145537.

64th Annual Report & Accounts 2013 0121
CORPORATE GOVERNANCE (contd.)
Auditor’s Certifi cate on Corporate Governance
As required under Clause 49 of the Listing Agreement, the Auditor’s Certifi cate regarding the compliance of provisions of the Corporate Governance norms is attached with this report.
Stock Data
The table herein below gives the monthly high and low prices and volume of the Company’s shares traded at the BSE and NSE during the period from January, 2013 to December, 2013.
Month & Year BSE NSE
High (e/share)
Low (e/share)
Volume (No. of Shares)
High (e/share)
Low (e/share)
Volume (No. of Shares)
January 2013 81.80 68.35 960,983 82.00 68.05 2,037,709
February 2013 70.80 63.60 264,671 71.00 63.50 523,011
March 2013 65.25 61.00 207,453 65.00 60.75 431,751
April 2013 66.95 56.50 172,592 67.00 61.50 365,908
May 2013 74.30 60.00 610,735 74.00 59.65 1,439,392
June 2013 70.75 62.10 161,072 70.70 62.10 482,480
July 2013 65.95 60.55 111,427 65.70 60.50 356,549
August 2013 72.00 57.00 169,680 63.40 56.90 375,733
September 2013 68.30 56.85 502,552 68.35 56.25 931,406
October 2013 65.35 60.10 180,824 65.40 60.00 427,363
November 2013 68.40 62.00 188,437 68.35 61.70 550,566
December 2013 77.10 65.10 379,359 77.50 65.00 778,372
Note:
1. Volume is the total monthly volume of trade (in numbers) in shares of the Company on respective exchanges.
The chart herein below shows the comparison of the Company’s share price movement vis-à-vis the movement of the BSE Sensex:
COMPANY SHARE PRICE AND BSE SENSEX -HIGH
60.00
65.00
70.00
75.00
80.00
85.00
15,000
17,000
19,000
21,000
BSE
SEN
SEX
PPL HIGH 81.80 70.80 65.25 66.95 74.30 70.75 65.95 72.00 68.30 65.35 68.40 77.10
BSE HIGH 20,203.66 19,966.69 19,754.66 19,622.68 20,443.62 19,860.19 20,351.06 19,569.20 20,739.69 21,205.44 21,321.53 21,483.74
Jan-13 Feb-13 Mar-13 Apr-13 May-13 Jun-13 Jul-13 Aug-13 Sep-13 Oct-13 Nov-13 Dec-13
PP
L S
HA
RE
PR
ICE
(r)

0222 64th Annual Report & Accounts 2013
CORPORATE GOVERNANCE (contd.)
Distribution of Shareholding
Following is the distribution pattern of shareholding of the Company as on 31st December, 2013:
Distribution of shareholding by ownership:
Sr. No. Category No. of Shareholders* No. of Shares % of Total Holding
1. Indian Promoters 10 1,884,087 3.01
2. Foreign Promoters – Huhtavefa B.V. 1 38,095,166 60.77
3. Foreign Institutional Investors 8 72,250 0.12
4. NRI’s & OCB’s 224 1,007,036 1.61
5. Bodies Corporate 558 3,030,503 4.83
6. Banks/Financial Institutions 5 21,558 0.03
7. Insurance Companies 1 227,745 0.36
8. Mutual Funds 7 3,703,565 5.91
9. Resident Individuals 14096 14,640,280 23.35
10. Trust 3 5,000 0.01
Total 14913 62,687,190 100.00
* No of shareholders based on number of folios/demat accounts as per register of members.
Distribution of shareholding by number of shares held:
No. of Equity Shares Held No. of Shareholders % of Shareholders No. of Shares Held % of Shares
Upto – 500 10951 73.44 1,805,677 2.88
501 – 1000 1648 11.05 1,371,127 2.19
1001 – 2000 994 6.67 1,532,664 2.45
2001 – 3000 442 2.96 1,143,770 1.82
3001 – 4000 167 1.12 596,142 0.95
4001 – 5000 178 1.19 845,455 1.35
5001 – 10000 288 1.93 2,136,308 3.40
10001 and above 245 1.64 53,256,047 84.96
Total 14913 100 62,687,190 100.00
Following is the List of Top Ten Shareholders (other than Promoters) of the Company as on 31st December, 2013:
Sr. No. Name of Shareholder No. of Shares Held % of Total Shareholding
1.HDFC TRUSTEE COMPANY LTD - A/C MID - CAP OPPORTUNITIES FUND
3,330,525 5.31
2. DOLLY KHANNA 970,137 1.553. SHREE CAPITAL SERVICES LIMITED 896,147 1.43
4. UTI-MID CAP FUND 366,700 0.59
5. DR SANJEEV ARORA 308,610 0.49
6 THE NEW INDIA ASSURANCE COMPANY LIMITED 227,745 0.36
7. PUNIT KHANNA 215,733 0.34
8. RAJAN 204,960 0.33
9. NEWA INVESTMENTS PVT LTD 185,605 0.30
10 AMIT JAIN 180,000 0.29
Total 6,886,162 10.99

64th Annual Report & Accounts 2013 0123
CORPORATE GOVERNANCE (contd.)
Pledge of Shares
No pledge has been created over the Equity Shares held by the Promoters and/or Promoter Group Shareholders as on 31st December, 2013.
Dematerialisation of Shares
At present, 97.91% of the Company’s shares including all the shares held by the Promoters and/or Promoter Group Shareholders are held in electronic form and the Company’s shares can only be traded in compulsory demat segment in the stock exchanges where it is listed.
The table herein below gives the break up of shares in physical and demat form as at 31st December, 2013:
Form Number of Shareholders Number of shares Percentage
Physical 1540 1,308,068 2.09
Dematerialised 13373 61,379,122 97.91
Total 14913 62,687,190 100
Outstanding ADR/GDR/Warrants/Convertible instruments and their impact on Equity
The Company has not issued any ADR, GDR or Warrants and there are no Convertible instruments outstanding and hence there is no likely impact on equity.
Details of Public funding obtained in the last three years
The Company has not obtained any public funding in the last three years.
Electronic Clearance Scheme (ECS) for Dividend
To avoid risk of loss/interception of dividend warrants in postal transit and/or fraudulent encashment, shareholders are requested to avail of the ECS facility where dividends are directly credited in electronic form to their respective bank accounts. This also ensures faster credit of dividend. Shareholders who desire receipt of their dividend through ECS can obtain the form from the Registrar and Transfer agent of the Company.
Shareholders may also submit their bank details to Registrar and Transfer Agent. This will enable the Company to incorporate this information on dividend warrants to minimize the risk of fraudulent encashment.
Address for correspondence with the Company
All correspondence may please be addressed to the Registrar and Transfer Agent, SHAREPRO SERVICES (INDIA) PRIVATE LIMITED at the address given below.
In case any shareholder is not satisfi ed with the response or do not get any response within reasonable period from the Registrar and Transfer Agent, they may approach the Compliance Offi cer at the Registered Offi ce of the Company or email their queries/grievances to [email protected].
Registered Offi ce: Registrar and Transfer Agent (R&TA)
The Paper Products Limited Unit No.12A-06, 13th FloorParinee CrescenzoPlot Nos. C-38 & C-39,G Block, Behind MCA, Bandra Kurla Complex, Bandra (East), Mumbai - 400051 Tel: +91 2653 1320 / 2653 1310, Fax: +91 22 2653 1310, Website: www.pplpack.com Email:[email protected]
Sharepro Services (India) Pvt. Ltd.Sakinaka Telephone Exchange Lane,Off Andheri- Kurla Road,Sakinaka, Andheri (East),Mumbai - 400072Tel: + 91 22 6772 0300 / 6772 0351/2/3Fax : + 91 22 2837 5646Website: www.shareproservices.comEmail : [email protected]

0224 64th Annual Report & Accounts 2013
CORPORATE GOVERNANCE (contd.)
COMPLIANCE OFFICER
Mr. Anand Daga, Company Secretary & Head – Legal is the Compliance Offi cer of the Company.
LOCATIONS
Registered Offi ce: Unit No-12A-06, 13th Floor, Parinee Crescenzo, Plot No C-38/C-39, G-Block, Behind MCA, Bandra Kurla Complex, Bandra (East), Mumbai - 400 051
Corporate Offi ce: L.B.S. Marg, Majiwade, Thane - 400 601, Maharashtra
Plants:
Thane L.B.S. Marg, Majiwade, Thane - 400 601, Maharashtra
Silvassa Survey No. 33/1, At Post Umerkoi, Via Silvassa - 396 230
U. T. of Dadra & Nagar Haveli
Hyderabad Plot No.139 & 148, Sri Venkateshwara
Co-op. Industrial Estate, Bollarum - 502 325
Medak District, Andhra Pradesh
Rudrapur Plot No. 70-73, Sector 4, IIE Pantnagar, Rudrapur - 263 153
Udhamsingh Nagar, Uttarakhand
Annexure A
CEO/CFO certifi cation (As per clause 49(v) of the Listing Agreement)
18th February, 2014
To
The Board of Directors
The Paper Products Ltd.
We hereby certify that in the preparation of the accounts for the year ended 31st December, 2013,
(a) We have reviewed fi nancial statements and the cash fl ow statement for the year and that to the best of our knowledge and belief:
(i) these statements do not contain any materially untrue statement or omit any material fact or contain statements that might be misleading;
(ii) These statements together present a true and fair view of the Company’s affairs and are in compliance with existing accounting standards, applicable laws and regulations.
(b) To the best of our knowledge and belief, there are no transactions entered into by the Company during the year, which are fraudulent, illegal or in violation of the Company’s code of conduct.
(c) We accept responsibility for establishing and maintaining internal controls for fi nancial reporting and that we have evaluated the effectiveness of the internal control systems of the Company pertaining to fi nancial reporting and we have disclosed to the auditors and the Audit Committee defi ciencies in the design or operation of such internal controls, if any, of which we are aware and the steps we have taken or proposes to take to rectify these defi ciencies.
(d) We have indicated to the auditors and the Audit Committee
a. That there are no signifi cant changes in internal controls over fi nancial reporting during the year.
b. That there are no signifi cant changes in accounting policies during the year.
c. There have been no instances of signifi cant fraud of which we have become aware and the involvement therein, if any of the management or an employee having a signifi cant role in the company’s internal control system over fi nancial reporting.
Suresh Gupta A. Venkatrangan Parag VyavahareChairman & Managing Director Executive Director Chief Financial Offi cer

64th Annual Report & Accounts 2013 0125
CORPORATE GOVERNANCE (contd.)
Annexure B
Certifi cate of Compliance with the Code of Conduct for Board of Directors and Senior Management Personnel
The Members ofThe Paper Products Limited
As required under Clause 49(I)(D) of the Listing Agreement with the Stock Exchanges, I hereby declare that all the Board members and senior management personnel of the Company have complied with the Code of Conduct of the Company for the year ended 31st December, 2013.
For The Paper Products Limited
Mumbai Suresh Gupta
18th February, 2014 Chairman & Managing Director
CERTIFICATE OF COMPLIANCE WITH THE CORPORATE GOVERNANCE REQUIREMENTS UNDER CLAUSE 49 OF LISTING AGREEMENT
To
The Member of
The Paper Products Limited
We have examined the compliance of conditions of corporate governance by The Paper Products Limited, for the year ended on 31st December, 2013, as stipulated in clause 49 of the Listing Agreement of the said Company with stock exchange.
The compliances of conditions of corporate governance is the responsibility of the management. Our examination was limited to procedures and implementation thereof, adopted by the Company for ensuring the compliance of the conditions of the Corporate Governance. It is neither an audit nor an expression of opinion on the fi nancial statements of the Company.
In our opinion and to the best of our information and according to the explanations given to us, we certify that the Company has complied with the conditions of Corporate Governance as stipulated in the above mentioned Listing Agreement.
We further state that such compliance is neither an assurance as to the future viability of the Company nor the effi ciency or effectiveness with which the management has conducted the affairs of the Company.
For S. R. BATLIBOI & CO. LLPChartered Accountants
ICAI Firm registration number: 301003 E
per Vijay ManiarMumbai Partner
21st March, 2014 Membership No.: 36738

0226 64th Annual Report & Accounts 2013
MANAGEMENT DISCUSSION & ANALYSIS
HIGHLIGHTS
Despite the unfavorable economic climate PPL performed well. Consolidated Net Sales for the year 2013, at a 1,075 crore, crossed the a 1,000 crore mark for the fi rst time in the history of the Company. This included sales of a 79 crore of the subsidiary – Webtech Labels Pvt. Ltd. - which was acquired in November, 2012.
Consolidated profi t before tax and exceptional items improved to a 73.7 crore from a 61.7 crore.
ECONOMY
The Operating performance for 2013 needs to be viewed in the context of the following factors:
• One of the weakest macro-economic performance by the Indian Economy in recent history.
• Adverse geo-political developments – quantitative easing by the US Treasury, adverse developments in parts of Asia.
• Steep increase in input costs due to a sharp depreciation of the Indian Rupee.
• Steep increase in Power and Fuel cost.
• Decline in growth rates of various FMCG products.
INDUSTRY OVERVIEW
Packaging is an essential and integral component of every supply chain. From protection of the contents to informing the customer, packaging – in particular, fl exible packaging - plays a vital role in the economy. Showing a product helps to sell it. Attractive packaging is a powerful marketing tool. Food and beverages consume the bulk of fl exible packaging. The gap in per capita consumption between developed and developing countries is continuously narrowing. The Indian fl exible packaging industry has grown rapidly in the last decade. However, the industry is highly fragmented with unorganised players far outnumbering the organized players, putting a pressure on margins and devaluating quality.
STRENGTHS AND OPPORTUNITIES
Flexible packaging touches the lives of masses everyday. Aspirations of a vibrant and growing populace that drives consumption patterns assures the packaging industry a bright future. Rising expectations with respect to quality and design drive innovation. PPL is well placed to exploit every opportunity for profi table growth – through both the organic or inorganic routes. Technology, assets, people, reach and closeness to customers have traditionally been the core strengths of the Company. Consequently, the Company is well placed to take advantage of growth opportunities.
RISKS AND CONCERNS
The year 2013 has been a very challenging one for the Indian economy. The GDP growth slowed down considerably especially from June, 2013 onwards. Several macro-economic and political factors affected the overall performance of the economy. High food infl ation, steep increase in energy costs, extremely volatile Forex and capital markets, near normal monsoons but with disruptive results – all affected consumer sentiment and consumer demand. Several sectors of the economy performed below par. In 2013, India witnessed one of the weakest festival seasons in recent history.
Our customers resisted price increase on account of increases in material and other input costs. They used the fragmented nature of the industry to drive down buying prices of packaging materials – sometimes to unsustainable levels.
RESPONSE
Despite the gloomy economic scenario, your Company performed well. We grew by almost 13% despite reduced growth rates for FMCG sector. In VUCA (Volatile/Uncertain/Complex/Ambiguous) times, we steadfastly remained on course.
Your Company’s good performance is due to:
• Empowering frontline people to take all steps necessary to deliver quality products to the customers.
• Special thrust on further improving operational effi ciencies and selective investments for cost reduction.

64th Annual Report & Accounts 2013 0127
MANAGEMENT DISCUSSION & ANALYSIS (contd.)
• Substantially increasing the utilization of the IT solutions that we have implemented and continuously upgraded since 2009.
• Our NASP (New Applications, Structures, Products and Processes) programme, focus on key business segments and products – exports, specialized pouches and labeling business helped us in maintaining the growth trajectory and also manage our costs.
We have strengthened the Company on various fronts to be ready to accelerate when the overall macro-economic situation improves.
INTERNAL CONTROLS
The Company has adequate Internal Control systems in place to ensure that we maintain our high ethical standards and excellent corporate governance, provide reliable MIS and safeguard our assets. Scope and coverage of Audit are varied and enlarged as the situation demands. Reports are regularly reviewed by the Audit Committee.
RISK MANAGEMENT REVIEW
The slowdown in the economy and the forthcoming elections may well cast a long shadow across the economy. The baggage of risks carried includes:
• Competitive pressures affecting top and bottom line.
• Weak currency.
• Volatility in price of raw materials, fuel cost and transport cost.
• Attrition of personnel.
The Board undertakes a detailed periodic review of risks.
SAFETY
Safety of all the members of the PPL family is always of paramount importance to us. We have instilled a strong culture of preserving the health, safety and environment of our people across all operating units. We acutely understand the long term impact of an unsafe incident not only on the individual but also on his/her family. We have laid out a clear policy on Occupational Safety – Health and Environment and we follow it in letter and spirit. We go far beyond “numbers” that measure “incidents”.
AWARDS
Awards refl ect recognition of the Company’s commitment to quality and innovation. PPL won 15 prestigious awards during the year from various industry bodies.
PEOPLE
Our philosophy is that our people are the foundations of our success. We continue to invest heavily in training and development of our people, enhancing their knowledge, competencies and skills. Being the leader in the Flexible Packaging industry, we are a prime hunting ground for talent by an ever increasing competition. We have set in motion specifi c initiatives to attract and retain appropriate talent across all levels.
The number of employees at the end of the year stood at 1,496 as against 1,502 at the end of the previous year.
FINANCIAL OVERVIEW
Financial performance:
Sales Revenue
Sales Revenue grew to a 99,581 lac from a 88,299 lac in 2012 – a growth of 13%. All key business segments grew well

0228 64th Annual Report & Accounts 2013
especially Exports business. Our wide product portfolio along with NASP and commitment to high quality helped us achieve this growth despite adverse market conditions.
NASP – the cornerstone of PPL strategy to protect the ever declining margins in the industry and also through offering superior value added solutions to our customers continued to pay rich dividends in 2013. The NASP initiatives have contributed to over 30% of our turnover. We added over 50 customers across all businesses as well.
Other Operating Income
Other Operating Income was at a 1,066 lac against a 741 lac for the previous year. It includes a 142 lac towards compensation received for loss of business.
Other Income
Other Income was at a 484 lac against a 826 lac for the previous year. It includes a 328 lac of dividend income against a 570 lac for 2012.
Raw Material
Raw material costs rose from 70.2% of net sales in 2012 to 71.3% of net sales in 2013. Cost of fi lms, resins and paper were up by 10%. The feedstock price increases, a weakening rupee and slowing economy pushed up our input costs.
Other Input Costs
Steep increases in fuel rates and power tariffs of state controlled power utility companies led to 7-8% increase in energy costs. As a result of steep increases in fuel prices, freight costs went up by 10-12% and we were forced to absorb most of the increase.
Margins
During the year, the margins continued to be under severe pressure. While several input costs increased in double digits, relentless push for cost reduction by our customers, unhealthy competition and overall negative sentiment in the economy forced us to absorb a major portion of the input costs increases. We managed to cushion the adverse impact of such increases by excellent efforts put in by the team in value engineering, continuous improvement of operational effi ciencies, focus on energy conservation measures and appropriate changes to processes etc.
Profi t before Taxation
Profi t before tax and exceptional income rose to a 6,951 lac in 2013 against a 6,139 lac for 2012.
Exceptional Income
Exceptional income represents gain on sale of offi ce property at Nariman Point, Mumbai of a 705 lac (Provision for Tax includes a 239 lac towards tax on this gain).
Provision for Taxation
Provision for taxation including deferred tax increased to a 2,203 lac from a1,636 lac for 2012.
Financial Position
Reserves and Surplus
Reserves and Surplus increased by a 3,417 lac after providing for dividend (including tax thereon) amounting to a 2,054 lac for the year 2013.
Fixed Assets
Addition to fi xed assets amounted to a 2,075 lac of which Plant and Machinery was a 1,513 lac.
MANAGEMENT DISCUSSION & ANALYSIS (contd.)

64th Annual Report & Accounts 2013 0129
Inventories
Inventories stood at a 8,914 lac at the end of 2013 compared to a 8,317 lac at the end of the previous year. Raw materials contributed to the bulk of the increase. Inventories at the end of 2013 represent 33 days of sale value against 34 days for 2012.
Sundry Debtors
Sundry Debtors rose to a 18,556 lac from a 13,809 lac at the end of 2012. Debtors at the end of 2013, represents 68 days of sale value against 57 days for the previous year. Record sales in December pushed up the outstanding - this should smoothen out, going forward.
Cash and Bank Balances
Cash and bank balances at the end of 2013 amounted to a 1,568 lac against a 1,468 lac at the end of 2012.
Loans and Advances
Loans and Advances of a 2,609 lac at the year-end largely comprise balances and deposits with excise and VAT authorities and Prepaid Expenses against a 1,804 lac at the end of 2012.
Current Liabilities
Sundry Creditors for raw materials and packing materials at the end of 2013 amount to a13,344 lac against a 11,712 lac at the end of 2012, while other liabilities stood at a 2,401 lac against a 1,945 lac at the end of 2012. Trade creditors represent 49 days sales - similar to the previous year.
Net Working Capital
As at 31st December, 2013, Net Working Capital is a 18,263 lac against a 14,862 lac as at 31st December, 2012.
Return on Capital Employed
Return on Capital Employed was 18.5% for 2013 against 16.4% for 2012.
COMMENTS ON SUBSIDIARY
Webtech Labels Pvt. Ltd. performed to our expectations. Net Sales achieved was a 7,899 lac for 2013 which represents over 10% growth in comparable operating levels v/s 2012. The company embraced many of the good practices followed by PPL. It also follows the PPL philosophy of focusing on innovation, high levels of customer service and cost control as a platform for rapid quality growth.
FINALLY
Flexible packaging industry continues to maintain its relatively stable growth outlook. The industry is expected to grow around 10-12% CAGR in the medium term. Growing rural demand, retail push, planned investments by large MNCs in the FMCG business and strong fundamentals of the Indian economy support the view that FMCG and consequently growth for Flexible Packaging would remain strong.
CAUTIONARY STATEMENT
Statements in the Management Discussion and Analysis describing the Company’s objectives, projections, expectations and estimates regarding future performance may be “forward looking statements” within the meaning of applicable securities laws and regulations and are based on currently available information. The management believes these to be true to the best of its knowledge at the time of preparation of this report. However, these statements are subject to future events and uncertainties, which could cause actual results to differ materially from those that may be indicated by such statement.
MANAGEMENT DISCUSSION & ANALYSIS (contd.)

0230 64th Annual Report & Accounts 2013
To the Members of
The Paper Products Limited
Report on the Financial Statements
We have audited the accompanying fi nancial statements of The Paper Products Limited (“the Company”), which comprise the
Balance Sheet as at December 31, 2013, and the Statement of Profi t and Loss and Cash Flow Statement for the year then
ended, and a summary of signifi cant accounting policies and other explanatory information.
Management’s Responsibility for the Financial Statements
Management is responsible for the preparation of these fi nancial statements that give a true and fair view of the fi nancial
position, fi nancial performance and cash fl ows of the Company in accordance with accounting principles generally accepted
in India, including the Accounting Standards notifi ed under the Companies Act, 1956 (“the Act”) read with General Circular
15/2013 dated 13 September 2013, issued by the Ministry of Corporate Affairs, in respect of Section 133 of the Companies Act,
2013. This responsibility includes the design, implementation and maintenance of internal control relevant to the preparation
and presentation of the fi nancial statements that give a true and fair view and are free from material misstatement, whether
due to fraud or error.
Auditor’s Responsibility
Our responsibility is to express an opinion on these fi nancial statements based on our audit. We conducted our audit in
accordance with the Standards on Auditing issued by the Institute of Chartered Accountants of India. Those Standards require
that we comply with ethical requirements and plan and perform the audit to obtain reasonable assurance about whether the
fi nancial statements are free from material misstatement.
An audit involves performing procedures to obtain audit evidence about the amounts and disclosures in the fi nancial statements.
The procedures selected depend on the auditor’s judgment, including the assessment of the risks of material misstatement of
the fi nancial statements, whether due to fraud or error. In making those risk assessments, the auditor considers internal control
relevant to the Company’s preparation and fair presentation of the fi nancial statements in order to design audit procedures
that are appropriate in the circumstances but not for the purpose of expressing an opinion on the effectiveness of the entity’s
internal control. An audit also includes evaluating the appropriateness of accounting policies used and the reasonableness
of the accounting estimates made by management, as well as evaluating the overall presentation of the fi nancial statements.
We believe that the audit evidence we have obtained is suffi cient and appropriate to provide a basis for our audit opinion.
Opinion
In our opinion and to the best of our information and according to the explanations given to us, the fi nancial statements give
the information required by the Act in the manner so required and give a true and fair view in conformity with the accounting
principles generally accepted in India:
(a) in the case of the Balance Sheet, of the state of affairs of the Company as at December 31, 2013;
(b) in the case of the Statement of Profi t and Loss, of the profi t for the year ended on that date; and
(c) in the case of the Cash Flow Statement, of the cash fl ows for the year ended on that date.
Report on Other Legal and Regulatory Requirements
1. As required by the Companies (Auditor’s Report) Order, 2003 (“the Order”) issued by the Central Government of India
in terms of sub-section (4A) of section 227 of the Act, we give in the Annexure a statement on the matters specifi ed in
paragraphs 4 and 5 of the Order.
2. As required by section 227(3) of the Act, we report that:
(a) We have obtained all the information and explanations which to the best of our knowledge and belief were necessary
for the purpose of our audit;
INDEPENDENT AUDITORS’ REPORT

64th Annual Report & Accounts 2013 0131
(b) In our opinion proper books of account as required by law have been kept by the Company so far as appears from
our examination of those books;
(c) The Balance Sheet, Statement of Profi t and Loss, and Cash Flow Statement dealt with by this Report are in
agreement with the books of account;
(d) In our opinion, the Balance Sheet, the Statement of Profi t and Loss, and the Cash Flow Statement comply with the
Accounting Standards notifi ed under the Act read with General Circular 15/2013 dated 13 September 2013, issued
by the Ministry of Corporate Affairs, in respect of Section 133 of the Companies Act, 2013;
(e) On the basis of written representations received from the directors as on December 31, 2013, and taken on record
by the Board of Directors, none of the directors is disqualifi ed as on December 31, 2013, from being appointed as
a director in terms of clause (g) of sub-section (1) of section 274 of the Act.
For S.R. BATLIBOI & CO. LLPChartered AccountantsICAI Firm Registration Number: 301003E
per Vijay ManiarPartnerMembership No.: 36738
Mumbai18 February 2014

0232 64th Annual Report & Accounts 2013
Annexure referred to in paragraph 1 under the heading “Report on other legal and regulatory requirements” of our report of even date
Re: The Paper Products Limited (“the Company”)
(i) (a) The Company has maintained proper records showing full particulars, including quantitative details and situation of fi xed assets.
(b) Fixed assets have been physically verifi ed by the management during the year and no material discrepancies were identifi ed on such verifi cation.
(c) There was no disposal of a substantial part of fi xed assets during the year.
(ii) (a) The management has conducted physical verifi cation of inventory at reasonable intervals during the year.
(b) The procedures of physical verifi cation of inventory followed by the management are reasonable and adequate in relation to the size of the Company and nature of its business.
(c) The Company is maintaining proper records of inventory and no material discrepancies were noticed on physical verifi cation.
(iii) (a) According to the information and explanations given to us, the Company has not granted any loans, secured or unsecured to companies, fi rms or other parties covered in the register maintained under section 301 of the Act. Accordingly, the provisions of clause 4 (iii) (a) to (d) of the Order are not applicable to the Company and hence not commented upon.
(b) According to the information and explanations given to us, the Company has not taken any loans, secured or unsecured from companies, fi rms or other parties covered in the register maintained under section 301 of the Act. Accordingly, the provisions of clause 4(iii) (e) to (g) of the Order are not applicable to the Company and hence not commented upon.
(iv) In our opinion and according to the information and explanations given to us, there is an adequate internal control system commensurate with the size of the Company and the nature of its business, for the purchase of inventory and fi xed assets and for the sale of goods and services. During the course of our audit, we have not observed any major weakness or continuing failure to correct any major weakness in the internal control system of the Company in respect of these areas.
(v) (a) According to the information and explanations provided by the management, we are of the opinion that the particulars of contracts or arrangements referred to in section 301 of the Act, that need to be entered into the register maintained under section 301 have been so entered.
(b) In our opinion and according to the information and explanations given to us, the transactions made in pursuance of such contracts or arrangements and exceeding the value of Rupees fi ve lakhs have been entered into during the fi nancial year at prices which are reasonable having regard to the prevailing market prices at the relevant time.
(vi) The Company has not accepted any deposits from the public.
(vii) In our opinion, the Company has an internal audit system commensurate with the size of the Company and nature of its business.
(viii) We have broadly reviewed the books of account maintained by the Company pursuant to the rules made by the Central Government for the maintenance of cost records under section 209(1) (d) of the Act, and are of the opinion that prima facie, the prescribed accounts and records have been made and maintained. We have not, however, made a detailed examination of the same.
(ix) (a) The Company is regular in depositing with appropriate authorities undisputed statutory dues including provident fund, investor education and protection fund, employees’ state insurance, income-tax, sales-tax, wealth-tax, service tax, customs duty, excise duty, cess and other material statutory dues applicable to it.
(b) According to the information and explanations given to us, no undisputed amounts payable in respect of provident fund, investor education and protection fund, employees’ state insurance, income-tax, wealth-tax, service tax, sales-tax, customs duty, excise duty, cess and other material statutory dues were outstanding, at the year end, for a period of more than six months from the date they became payable.
(c) According to records of the Company, the dues outstanding of income tax, sales tax, wealth tax, service tax, customs duty, excise duty and cess on account of any dispute, are as follows:-
ANNEXURE TO THE AUDITORS’ REPORT

64th Annual Report & Accounts 2013 0133
Name of Statute Nature of DuesPeriod to which the
amount relatesForum where dispute is pending
AmountR in lac
Income Tax Act, 1961
Tax and Interest 2001-2002 High Court of Mumbai 51.08
State and Central Sales Tax Acts
Tax 1997-98, 2001-02, 2005-2006Joint Commissioner of Sales Tax (Appeals)
61.53
Tax 2001-02 Assistant Commissioner of Sales Tax 9.78
Tax 2003-2005, 2007-09 Deputy Commissioner of Sales Tax 41.10
Tax 2009-12Appellate Deputy Commissioner of Sales Tax
58.64
Finance Act, 1994 – Service Tax
Tax and Penalty 2002-2012Custom, Excise and Service Tax Appellate Tribunal
131.55
Tax and Penalty 2006-2013 Commissioner Appeals 10.83
Central Excise Act, 1944
Tax 1998-2004 Supreme Court 1,346.94
Tax 2005-2009 Assistant Commissioner of Central Excise 504.83
Tax and Penalty 1998-2000 The Commissioner of Central Excise 5.47
Tax and Penalty 1997-99, 2004-05 Commissioner Appeals 4.86
Tax and Penalty 1989-91, 1996-98, 2000 -2010Custom, Excise and Service Tax Appellate Tribunal
3,422.94
Tax 2011-2012Joint Secretary (Revision application unit), Govt. of India
64.47
(x) The Company has no accumulated losses at the end of the fi nancial year and it has not incurred cash losses in the current and immediately preceding fi nancial year.
(xi) Based on our audit procedures and as per the information and explanations given by the management, we are of the opinion that the Company has not defaulted in repayment of dues to fi nancial institution, bank or debenture holders.
(xii) According to the information and explanations given to us and based on the documents and records produced before us, the Company has not granted loans and advances on the basis of security by way of pledge of shares, debentures and other securities.
(xiii) In our opinion, the Company is not a chit fund or a nidhi/mutual benefi t fund/society. Therefore, the provisions of clause 4(xiii) of the Order are not applicable to the Company.
(xiv) In our opinion, the Company is not dealing in or trading in shares, securities, debentures and other investments. Accordingly, the provisions of clause 4(xiv) of the Order are not applicable to the Company.
(xv) According to the information and explanations given to us, the Company has not given any guarantee for loans taken by others from bank or fi nancial institutions.
(xvi) The Company did not have any term loans outstanding during the year.
(xvii) According to the information and explanations given to us and on an overall examination of the balance sheet of the Company, we report that no funds raised on short-term basis have been used for long-term investment.
(xviii) The Company has not made any preferential allotment of shares to parties or companies covered in the register maintained under section 301 of the Act.
(xix) The Company did not have any outstanding debentures during the year.
(xx) The Company has not raised money through public issues during the year.
(xxi) Based upon the audit procedures performed for the purpose of reporting the true and fair view of the fi nancial statements and as per the information and explanations given by the management, we report that no fraud on or by the Company has been noticed or reported during the year.
For S.R. BATLIBOI & CO. LLPChartered AccountantsICAI Firm Registration Number: 301003E
per Vijay ManiarPartnerMembership No.: 36738Mumbai18 February 2014
ANNEXURE TO THE AUDITORS’ REPORT (contd.)

Standalone
0234 64th Annual Report & Accounts 2013
BALANCE SHEETAs at 31st December 2013
(a in lac)
Notes 31 December 2013 31 December 2012
EQUITY AND LIABILITIES
Shareholders’ Funds
Share Capital 2 1,253.83 1,253.83
Reserves and Surplus 3 37,654.45 34,237.44
38,908.28 35,491.27
Non-Current Liabilities
Long - Term Borrowings 4 1,921.06 2,061.47
Deferred Tax Liability (Net) 5 – 40.34
Long Term Provisions 6 86.97 113.08
2,008.03 2,214.89
Current Liabilities
Trade Payables 7 13,344.93 11,711.89
Other Current Liabilities 8 2,400.94 1,945.33
Short Term Provisions 9 3,015.79 2,833.27
18,761.66 16,490.49
TOTAL 59,677.97 54,196.65
ASSETS
Non-Current Assets
Fixed Assets
Tangible Assets 10 15,484.52 16,661.98
Intangible Assets 10 279.49 461.75
Capital Work in Progress 1,096.47 443.81
Non-Current Investments 11 3,879.13 3,879.13
Deferred Tax Assets (Net) 5 3.31 –
Long Term Loans & Advances 12 1,485.48 1,026.40
Other Non Current Assets 13 425.26 371.37
22,653.66 22,844.44
Current Assets
Current Investments 14 5,479.38 6,037.88
Inventories 15 8,913.87 8,317.17
Trade Receivables 16 18,555.85 13,809.19
Cash and Cash Balances 17 1,568.03 1,467.94
Short Term Loans & Advances 18 1,123.37 777.69
Other Current Assets 19 1,383.81 942.34
37,024.31 31,352.21
TOTAL 59,677.97 54,196.65
Signifi cant Accounting Policies 1
Directors
The accompanying notes are an integral part of fi nancial statements
As per our report of even date
For S.R. Batliboi & Co.LLP For and on behalf of the Board of Directors
Chartered AccountantsICAI Firm Registration No. 301003E Suresh Gupta A.Venkatrangan Chairman & Managing Director Executive Director
per Vijay Maniar Parag Vyavahare Jukka MoisioPartner Chief Financial Offi cer Johann SippelMembership No. 36738 Ramesh Kumar Dhir Anand Daga Nripjit Singh ChawlaMumbai Company Secretary & Head Legal S.K.Palekar18 February 2014 Mumbai, 18 February 2014 P.V.Narayanan

Standalone
64th Annual Report & Accounts 2013 0135
STATEMENT OF PROFIT AND LOSS ACCOUNTFor the year ended 31st December 2013
(a in lac)
Notes 31 December 2013 31 December 2012
INCOME
Revenue from Operations (Gross) 20 107,286.10 95,052.08
Less : Excise Duty 6,639.17 6,011.85
Revenue from Operations (Net) 100,646.93 89,040.23
Other Income 21 484.27 825.68
Total Revenue 101,131.20 89,865.91
EXPENSES
Raw Material and Components Consumed 22 70,803.80 61,538.48
Changes in Inventories of Finished Goods and Work-in-Process
23 240.34 439.05
Employee Benefi t Expenses 24 7,669.19 7,005.29
Finance Cost 25 7.93 5.47
Depreciation and Amortisation Expenses 26 3,429.99 3,451.85
Other Expenses 27 12,028.52 11,286.79
Total Expenses 94,179.77 83,726.93
Profi t Before Exceptional Item and Tax 6,951.43 6,138.98
Exceptional Item (Refer note 43 ) 704.66 –
Profi t Before Tax 7,656.09 6,138.98
Tax Expenses
Current Tax 2,246.60 1,903.60
Excess Provision for earlier years written back – (55.60)
Deferred Tax (43.65) (211.79)
Profi t for the period 5,453.14 4,502.77
Earnings per Equity Share including Exceptional Item (Nominal value-a 2 (Previous Year-a 2))
28
1. Basic 8.70 7.18
2. Diluted 8.70 7.18
Earnings per equity share excluding Exceptional Item
1. Basic 7.96 7.18
2. Diluted 7.96 7.18
Signifi cant Accounting Policies 1
Directors
The accompanying notes are an integral part of fi nancial statements
As per our report of even date
For S.R. Batliboi & Co.LLP For and on behalf of the Board of Directors
Chartered AccountantsICAI Firm Registration No. 301003E Suresh Gupta A.Venkatrangan Chairman & Managing Director Executive Director
per Vijay Maniar Parag Vyavahare Jukka MoisioPartner Chief Financial Offi cer Johann SippelMembership No. 36738 Ramesh Kumar Dhir Anand Daga Nripjit Singh ChawlaMumbai Company Secretary & Head Legal S.K.Palekar18 February 2014 Mumbai, 18 February 2014 P.V.Narayana

Standalone
0236 64th Annual Report & Accounts 2013
31 December 2013 31 December 2012
A. Cash Flow from Operating Activities
Net Profi t before Tax 7,656.09 6,138.98
Adjustments for
Depreciation 3,429.99 3,451.85
Unrealised Foreign Exchange Loss (Net) 133.58 182.56
Interest Income (16.45) (11.43)
Dividend Income (327.59) (569.65)
Financial Expenses 7.93 5.47
Provision for Doubtful Debts made / (Written back) (39.35) 51.56
(Profi t)/Loss on Sale of Investments (3.64) (0.85)
Fixed Assets Written Off 4.44 15.28
Provision for Sales Tax made 49.61 75.73
Profi t on Sale of Assets (Net) (10.67) (5.82)
Operating Profi t before Changes in Working Capital 10,883.94 9,333.68
Adjustments for (Increase)/Decrease in
Trade Receivables (4,750.04) (1,519.82)
Inventories (596.70) 120.17
Loans and Advances (641.22) 276.03
Other Assets (495.37) 152.55
Adjustments for Increase / (Decrease) in
Trade Payables 1,682.27 281.65
Other Current Liabilities 384.21 (62.72)
Provisions (107.56) (280.08)
Cash Generated from Operations 6,359.53 8,301.46
Direct Taxes Paid (Net of Refunds Received) (2,399.66) (1,926.76)
Net Cash from Operating Activities 3,959.87 6,374.70
Exceptional Item ( Refer note 43) (704.66) –
Net Cash from Operating Activities 3,255.21 6,374.70
B. Cash Flow from Investing Activities
Purchase of Fixed Assets (2,816.56) (2,346.50)
Proceeds from Sale of Fixed Assets 715.39 12.53
Purchase of Investments (23,135.95) (27,878.12)
Sale of Investments 23,698.09 28,178.77
Investment in Subsidiary – (3,879.13)
Dividend Received 327.59 569.65
Interest Received 16.36 11.76
Capital Subsidy Received 30.00 –
Net Cash used in Investing Activities (1,165.08) (5,331.04)
($ in lac)
CASH FLOW STATEMENTFor the year ended 31st December 2013

Standalone
64th Annual Report & Accounts 2013 0137
($ in lac)
31 December 2013 31 December 2012
C. Cash Flow from Financing Activities
Repayment of Sales Tax deferral loan (97.77) (55.26)
Interest Paid (7.93) (5.47)
Dividends Paid (Including Dividend Tax thereon) (1,900.28) (1,742.47)
Net Cash Used in Financing Activities (2,005.98) (1,803.20)
Net Increase in Cash and Cash Equivalents 84.15 (759.54)
Effect of Exchange difference on Cash and Cash equivalents held in Foreign Currency 15.94 16.30
Cash and Cash Equivalents at the Beginning of the Year 1,467.94 2,211.18
Cash and Cash Equivalents at the Close of the Year 1,568.03 1,467.94
Cash and Cash Equivalents Comprise:
Cash on Hand 12.93 13.05
Cheques on Hand 19.97 18.07
Balances in Current Accounts with Scheduled Banks 1,474.14 1,237.67
Balances in Deposit Accounts with Scheduled Banks 3.75 148.50
Balances in Unpaid Dividend Bank Accounts * 57.24 50.65
1,568.03 1,467.94
CASH FLOW STATEMENT (Contd.)For the year ended 31st December 2013
* These balances are not available for use by the Company,as they represent corresponding unpaid liabilities.
Notes :
1. The above cashfl ow statement has been prepared under indirect method as per Accounting Standard-3 "Cash FlowStatement"
2. Cash and Cash equivalents for the purpose of cash fl ow statements comprise of cash at Bank and in Hand and short term investments with an original maturity of three months or less.
Directors
As per our report of even date
For S.R. Batliboi & Co.LLP For and on behalf of the Board of Directors
Chartered AccountantsICAI Firm Registration No. 301003E Suresh Gupta A.Venkatrangan Chairman & Managing Director Executive Director
per Vijay Maniar Parag Vyavahare Jukka MoisioPartner Chief Financial Offi cer Johann SippelMembership No. 36738 Ramesh Kumar Dhir Anand Daga Nripjit Singh ChawlaMumbai Company Secretary & Head Legal S.K.Palekar18 February 2014 Mumbai, 18 February 2014 P.V.Narayana

Standalone
0238 64th Annual Report & Accounts 2013
NOTES TO THE FINANCIAL STATEMENTSFor the year ended 31st December 2013
NOTE 1 - SIGNIFICANT ACCOUNTING POLICIES
1. Basis of Preparation of Financial Statements
The fi nancial statements have been prepared under the historical cost convention (with the exception of freehold land which has been revalued and derivative fi nancial instruments which have been measured at fair value),on the accrual basis of accounting and comply with the Companies (Accounting Standards) Rules 2006 (as amended) issued by the Central Government and relevant provisions of the Companies Act, 1956 to the extent applicable.The accounting policies have been consistently followed by the company.
2. Use of Estimates
The fi nancial statements are prepared in accordance with generally accepted accounting principles (GAAP) in India which requires management to make estimates and assumptions that affect the reported amounts of assets, liabilities and disclosure of contingent liabilities.The estimates and assumptions used in the accompanying fi nancial statements are based upon management’s evaluation of the relevant facts and circumstances as of the date of the fi nancial statements which in management’s opinion are prudent and reasonable. Actual results may differ from the estimates and assumptions used in preparing the accompanying fi nancial statements. Any revision to accounting estimates is recognized prospectively in current and future periods.
3. Fixed Assets
• Fixed assets are stated at cost (or revalued amounts as the case may be) less accumulated depreciation & impairment losses,if any.Cost of fi xed assets comprises of purchase price, duties, levies and any directly attributable cost of bringing each asset to its working condition for the intended use.
• Financing costs relating to borrowed funds attributable to the acquisition of qualifying fi xed assets upto the completion of construction or acquisition of such fi xed assets are included in the gross book value of the asset.
• Cenvat credit availed for excise duty and countervailing duty availed for customs duty payments made on fi xed assets is reduced from the cost of fi xed assets.
• Machinery spares which are specifi c to a particular item of fi xed asset and whose use is expected to be irregular are capitalised and depreciated over the residual useful life of the asset.
• Capital work-in-progress includes the cost of fi xed assets that are not ready to use at the balance sheet date.
4. Depreciation
a. Tangible Assets
Buildings are depreciated on written down value method at the rates prescribed in Schedule XIV to the Companies Act, 1956, which coincide with management estimate of useful life except those specifi ed below.
Other fi xed assets are depreciated on straight line method at the rates prescribed in Schedule XIV to the Companies Act, 1956 except those specifi ed below.
Following assets are depreciated at the rates higher than those prescribed in Schedule XIV to the Companies Act, 1956 as in management’s judgement, their estimated useful lives are shorter than those prescribed under Schedule XIV to the Companies Act, 1956.
Assets Method of Depreciation Rate
Computers Straight Line Method 25.00%
Motor Vehicles Straight Line Method 19.00%
General Furniture Straight Line Method 9.50%
Offi ce and Other Equipments Straight Line Method 19.00%
Cellphones and Photocopiers Straight Line Method 31.67%
Airconditioning Equipment used in manufacturing process Straight Line Method 10.34%
Administrative Buildings Written Down Value Method 10.00%
Electrical Fittings Straight Line Method 10.34%

Standalone
64th Annual Report & Accounts 2013 0139
NOTES TO THE FINANCIAL STATEMENTSFor the year ended 31st December 2013
Depreciation on additions/deletions to fi xed assets is provided prorata from the date of addition/till the date of deletion.
Leasehold Land - Premium paid for acquisition of leasehold land is amortised over the period of lease,viz 99 years.
b. Intangible Assets
ERP software is amortised over a period of 60 months commencing from the month in which software is put to use.
Specialised software is amortised over a period of 36 months commencing from the month in which such expenditure is incurred. All upgradations/enhancements are generally charged to profi t and loss account,unless they bring signifi cant additional benefi ts.
Corporate club membership fees paid are amortised over the period of use,viz 10 years.
Non compete fees paid are amortised over the period of restriction,viz 3 years.
5. Foreign Currency Transactions
• Transactions denominated in foreign currency are recorded at the exchange rate prevailing on the date of transactions. Exchange differences arising on foreign exchange transactions settled during the year are recognized in the profi t and loss account of the year.
• Monetary assets and liabilities in foreign currency, which are outstanding as at the year-end are translated at the year end at the closing exchange rate and the resultant exchange differences are recognised in the profi t and loss account.
• Non-monetary foreign currency items are carried at cost.
• The premium or discount on forward exchange contracts covered by AS-11 The Effects of Changes in Foreign Exchange Rates is recognised over the period of the contracts in the profi t and loss account. Exchange gain or loss on forward exchange contracts covered by AS-11 The Effects of Changes in Foreign Exchange Rates is recognised in the profi t and loss account.
• In compliance with the Institute of Chartered Accountants of India (ICAI) announcement dated 29th March,2008 on accounting for derivatives, the mark to market valuation loss on forward contracts entered into, to cover the forecast transactions is charged to profi t and loss account. Gain on Mark to Market valuation is ignored.
6. Inventories
• Inventories are valued at lower of cost and net realisable value.
• Raw materials,Components,Stores and Spares held for use in production of Inventories are not written down below cost if the fi nished products in which they will be incorporated are expected to be sold at or above cost.
• The cost of manufactured inventories and Work-In-Process is the direct cost of manufacture plus appropriate allocated overheads & excise duty wherever applicable. Cost is determined on Weighted Average Method.
• The cost of bought out inventory is computed using the Weighted Average Method .
• The cost of loose tools is amortised over its estimated useful life.
7. Revenue Recognition
• Revenue is recognised to the extent it is probable that the economic benefi ts will fl ow to the Company and revenue can be reliably measured. It is recognised when signifi cant risks and rewards of ownership of goods have passed to the buyer.
• Gross sales are inclusive of Excise Duty.
• Sales are net of returns & discounts.
• Dividend income is recognised when the right to receive dividend is unconditional at the balance sheet date.
• Interest on investments is accounted on a time proportion basis taking into account the amounts invested and the rate of interest.
8. Retirements Benefi ts
a. Defi ned Contribution Plans:
Contributions payable to the recognised provident fund, which is a defi ned contribution plan, are charged to the profi t and loss account as incurred.

Standalone
0240 64th Annual Report & Accounts 2013
NOTES TO THE FINANCIAL STATEMENTSFor the year ended 31st December 2013
b. Defi ned Benefi t Plans :
The Company’s gratuity benefi t scheme is a defi ned benefi t plan. The Company’s net obligation in respect of the gratuity benefi t scheme is calculated by estimating the amount of future benefi t that employees have earned in return for their service in the current and prior periods; that benefi t is discounted to determine its present value, and the fair value of any plan assets is deducted.
The present value of the obligation under such defi ned benefi t plans is determined based on actuarial valuation using the Projected Unit Credit Method, which recognises each period of service as giving rise to additional unit of employee benefi t entitlement and measures each unit separately to build up the fi nal obligation.
The obligation is measured at the present value of the estimated future cash fl ows. The discount rates used for determining the present value of the obligation under defi ned benefi t plans are based on the market yields on Government securities as at the balance sheet date.
When the calculation results in a benefi t to the Company, the recognized asset is limited to the lower of the net total of the present value of the defi ned benefi t obligation at the balance sheet date minus any past service cost minus fair value of plan assets as at balance sheet date and the present value of any future refunds from the plan or reductions in future contributions to the plan.
Actuarial gains and losses are recognised immediately in the profi t and loss account.
c. Other Long Term Employment Benefi ts :
Compensated absences which are not expected to occur within twelve months after the end of the period in which the employee renders the related services are determined on the basis of valuations, as at balance sheet date, carried out by an independent actuary using Projected Unit Credit Method. Actuarial gains and losses comprise experience adjustments and the effects of changes in actuarial assumptions and are recognised immediately in the Profi t and Loss Account.
d. Other Short Term Employment Benefi ts:
Company provides short term benefi t of sick leave to its employees with certain accumulation provisions and same being short term and expected to be utilised within twelve months are provided on undiscounted basis.
9. Investments
• Investments, which are readily realisable and intended to be held for not more than one year from the date on which such Investments are made, are classifi ed as current Investments. All other Investments are classifi ed as Long Term Investments.
• Long term investments are valued at cost and an appropriate provision is made for diminution, which is other than temporary, in their value.
• Current investments are valued at cost or market value, whichever is lower.
10. Research Expenditure
Research expenditure of a revenue nature is charged off in the year in which it is incurred and expenditure of a capital nature is capitalised to fi xed assets.
11. Taxation
Income tax expense comprises current income tax (i.e. amount of tax for the period determined in accordance with the income tax law) and deferred tax charge or credit (refl ecting the tax effects of timing differences between accounting income and taxable income for the period). The deferred tax charge or credit and the corresponding deferred tax liabilities or assets are recognized using the tax rates and tax laws that have been enacted or substantively enacted by the balance sheet date. Deferred tax assets are recognized only to the extent there is reasonable certainty that the assets can be realized in future; however, where there is unabsorbed depreciation or carried forward loss under taxation laws, deferred tax assets are recognized only if there is a virtual certainty of realization of such assets. Deferred tax assets are reviewed at each balance sheet date and written down or written up to refl ect the amount that is reasonably/virtually certain (as the case may be) to be realized.

Standalone
64th Annual Report & Accounts 2013 0141
NOTES TO THE FINANCIAL STATEMENTSFor the year ended 31st December 2013
12. Leases
Operating Leases
Lease payments under operating leases are recognised as an expense in the statement of profi t and loss account on a straight line basis over the lease term.
13. Impairment of Assets
The carrying amounts of assets are reviewed at each balance sheet date if there is any indication of impairment based on internal / external factors. An impairment loss is recognised wherever the carrying amount of an asset exceeds its recoverable amount. The recoverable amount is the greater of the asset’s net selling price and value in use.In assessing value in use, the estimated future cash fl ows are discounted to their present value using a pre-tax discount rate that refl ects current market assessments of the time value of money and risks specifi c to the assets.After impairment, depreciation is provided on their revised carrying amount of the asset over its remaining useful life.
14. Government Grants and Subsidies
Grants and Subsidies from the Governments are recognised when there is a reasonable assurance that (i) the company will comply with the conditions attached to them, and (ii) the grants / subsidy will be received.
Government Grants of the nature of Promoter Contribution are credited to Capital Reserve and treated as part of the Shareholders Funds.
15. Provisions and Contingent Liabilities
The Company creates a provision when there is present obligation as a result of a past event that probably requires an outfl ow of resources and a reliable estimate can be made of the amount of the obligation. A disclosure for a contingent liability is made when there is a possible obligation or a present obligation that may, but probably will not, require an outfl ow of resources. When there is a possible obligation or a present obligation in respect of which the likelihood of outfl ow of resources is remote, no provision or disclosure is made.
Provisions are reviewed at each balance sheet date and adjusted to refl ect the current best estimate. If it is no longer probable that an outfl ow of resources would be required to settle the obligation, the provision is reversed.
Contingent assets are not recognized in the fi nancial statements. However, contingent assets are assessed continually and if it is virtually certain that an infl ow of economic benefi ts will arise, the asset and related income are recognized in the period in which the change occurs.
16. Earnings Per Share ( EPS)
Basic EPS is computed by dividing the net profi t for the period attributable to the equity shareholders by the weighted average number of equity shares outstanding during the period. Diluted EPS is computed using the weighted average number of equity and dilutive equity equivalent shares outstanding during the period, except where the results would be anti dilutive.

Standalone
0242 64th Annual Report & Accounts 2013
NOTES TO THE FINANCIAL STATEMENTSFor the year ended 31st December 2013
(a in lac)
No. 31 December 2013 31 December 2012
2 SHARE CAPITAL
AUTHORISED CAPITAL
150,000,000 (Previous Year 150,000,000)
Equity shares of a 2/- each 3,000.00 3,000.00
700,000 (Previous Year 700,000) 12% Redeemable
Cumulative Preference Shares of a 100/- each 700.00 700.00
300,000 (Previous Year 300,000) Unclassifi ed
Shares of a 100/- each 300.00 4,000.00 300.00 4,000.00
4,000.00 4,000.00
ISSUED SUBSCRIBED AND PAID-UP CAPITAL
62,687,190 (Previous Year: 62,687,190) Equity
Shares of a 2/- each fully paid-up. 1,253.74 1,253.74
Add : Amount Received on 1,449 (Previous Year 1,449)
forfeited Shares. 0.09 1,253.83 0.09 1,253.83
TOTAL 1,253.83 1,253.83
a Reconciliation of the shares outstanding at the beginning & at the end of the reporting period
31 December 2013 31 December 2012
Nos. R in lac Nos. R in lac
At the beginning of the period 62,687,190 1,253.74 62,687,190 1,253.74
Outstanding at the end of the period 62,687,190 1,253.74 62,687,190 1,253.74
b Terms / Rights attached to equity shares.
The company has only one class of Issued, Subscribed & Paid up Equity Capital having a par value of a 2/- per share. Each holder of equity share is entitled to one vote per share. The company declares and pays dividend in Indian Rupees. The dividend proposed by the Board of Directors is subject to the approval of the shareholders in the ensuing Annual General Meeting.
During the year ended 31st December 2013, the amount of per share dividend recognised as distributions to equity shareholders was a 2.80 (31 December 2012 : a 2.60)
In the event of liquidation of the Company,the holders of equity shares will be entitled to receive remaining assets of the Company,after distribution of all Preferential amounts.The distribution will be in proportion to the number of equity shares held by the share holders.
c Shares held by holding company
Out of equity shares issued by the company, shares held by its holding company are as follows :
31 December 2013 31 December 2012
Nos. R in lac Nos. R in lac
Huhtavefa B.V., Netherlands,The Holding Company 38,095,166 761.90 38,095,166 761.90

Standalone
64th Annual Report & Accounts 2013 0143
NOTES TO THE FINANCIAL STATEMENTSFor the year ended 31st December 2013
d Details of Shareholders holding more than 5% shares in the company
(a in lac)
31 December 2013 31 December 2012
% holding in the class
% holding in the class
Nos. Nos.
Equity Shares of a 2/- each fully paid up.
Huhtavefa B. V., Netherlands,The Holding Company. 38,095,166 60.77% 38,095,166 60.77%
HDFC Trustee Company Limited 3,330,525 5.31% 3,330,525 5.31%
As per the records of the company,including its register of shareholders/members and other declarations received from shareholders regarding benefi cial interest, the above shareholding represents both legal and benefi cial ownerships of shares.
31 December 2013 31 December 2012
3 RESERVES AND SURPLUS
Capital Redemption Reserve 700.00 700.00
Securities Premium Account 7,936.32 7,936.32
Revaluation Reserve 275.77 275.77
Capital Reserve 30.00 –
(Capital subsidy received from State Government of Uttaranchal in respect of investment in setting up of Plant at Rudrapur)
General Reserve
Balance as per last Balance sheet 7,783.75 7,333.47
Add: Amount transferred from Surplus balance in the Statement of Profi t and Loss
545.31 8,329.06 450.28 7,783.75
Surplus in the statement of Profi t & Loss
Balance as per last fi nancial statement 17,541.60 15,383.38
Profi t for the year 5,453.14 4,502.77
Less : Appropriations
Proposed Final Equity Dividend (Amount per share a 2.80 (31st December, 2012 a 2.60)) (1,755.24) (1,629.87)
Tax on Proposed Equity Dividend (298.30) (264.40)
Differential Tax on dividend for previous year. (12.59) –
Transferred to General Reserve (545.31) (450.28)
Net Surplus in the statement of Profi t & Loss 20,383.30 17,541.60
Total Reserves and Surplus 37,654.45 34,237.44
31 December 2013 31 December 2012
4 LONG - TERM BORROWINGS
Deferred sales tax loan (Unsecured) 1,921.06 2,061.47
1,921.06 2,061.47
The Company has availed of unsecured interest free Sales tax deferred loan from the Government of Andhra Pradesh for its Hyderabad (Bollarum) factory, in accordance with their sales tax deferral scheme. The above amount is repayable after 14 years from the date of availment of the loan. The loan is repayable annually on 1st April with 1st instalment was due on 1st April 2011 and last one being due on 1st April 2021

Standalone
0244 64th Annual Report & Accounts 2013
The scheduled maturity of long term borrowings is summarised below.
(R in lac)
31 December 2013 31 December 2012
In the next one year (disclosed in note 8 being current maturities of long term borrowings)
140.41 97.77
In the second year 191.55 140.41
In the 3rd to 5th year 818.13 729.04
After 5 years 911.38 1,192.02
31 December 2013 31 December 2012
5 DEFERRED TAX (ASSET) / LIABILITY ( NET)
Deferred Tax Liability arising on account of timing differences in :
-Depreciation 344.53 362.83
344.53 362.83
Deferred Tax Asset arising on account of timing differences in :
-Provision for doubtful debts 47.41 58.03
-Provision for retirement benefi ts 152.65 145.93
-Effect of expenditure debited to Profi t & Loss account but allowed for Tax purposes in following years 147.78 118.53
347.84 322.49
Deferred Tax (Asset) /Liability (Net) (3.31) 40.34
31 December 2013 31 December 2012
6 LONG TERM PROVISIONS
Provisions for Employee Benefi ts
Provision for Employee Benefi ts (Refer note 39) 86.97 113.08
86.97 113.08
31 December 2013 31 December 2012
7 TRADE PAYABLES
Trade Payables (Refer note 32 for details of dues to Micro and Small Enterprises.)
13,344.93 11,711.89
13,344.93 11,711.89
NOTES TO THE FINANCIAL STATEMENTSFor the year ended 31st December 2013

Standalone
64th Annual Report & Accounts 2013 0145
31 December 2013 31 December 2012
8 OTHER CURRENT LIABILITIES
Unclaimed dividend * 57.24 50.66
Advance from Customers 223.17 90.53
Employee Benefi ts Payable 1,098.67 914.48
Employee Statutory Liabilities Payable 71.86 64.56
Taxes payable 310.53 274.42
TDS Payable 70.68 61.03
Creditors for Capital Goods 398.39 369.63
Current Maturity of Long Term Borrowings (Refer note 4) 140.41 97.77
Others 29.99 22.25
2,400.94 1,945.33
* There is no amount due and outstanding to be credited to Investor Education & Protection Fund.
31 December 2013 31 December 2012
9 SHORT TERM PROVISIONS
Provision for Income Tax (Net of Advance Tax ) 138.41 245.93
Provision for Employee Benefi ts (Refer note 39) 380.55 375.99
Provision for Mark to Market Losses on Derivative Contracts 75.04 27.39
Provision for Losses on Derivative Contracts (as per AS 11-Revised)
80.99 23.11
Provision for Litigations 287.26 266.57
Proposed Equity dividend 1,755.24 1,629.87
Provision for Tax on Proposed Equity Dividend 298.30 264.41
3,015.79 2,833.27
Provision for Litigations
At the beginning of the year 266.57 205.24
Arising during the year 166.47 84.33
Unused amount reversed / utilised during the year (145.78) (23.00)
At the end of the year 287.26 266.57
Provision for Litigation represents provision made by the company in respect of disputed Indirect Tax matters.
NOTES TO THE FINANCIAL STATEMENTSFor the year ended 31st December 2013
(a in lac)

Standalone
0246 64th Annual Report & Accounts 2013
10 .
FIX
ED
AS
SE
TS
(a in
lac)
GR
OS
S B
LO
CK
AC
CU
MU
LA
TE
D D
EP
RE
CIA
TIO
N /
AM
OR
TIS
AT
ION
NE
T B
LO
CK
Des
crip
tio
nO
rig
inal
Co
st
As
At
01-0
1-20
13
Ad
dit
ion
sD
uri
ng
T
he
Yea
r
Del
etio
ns
Du
rin
gT
he
Yea
r
Ori
gin
alC
ost
As
At
31-1
2-20
13
Op
enin
gB
alan
ce
As
At
01-0
1-20
13
On
D
elet
ion
sD
uri
ng
T
he
Yea
r
Ch
arg
eF
or
Th
eY
ear
Clo
sin
gB
alan
ce
As
up
to
31
-12-
2013
Bal
ance
As
At
31-1
2-20
13
Bal
ance
As
At
31-1
2-20
12
TA
NG
IBL
E A
SS
ET
S
Land
- F
reeh
old
522
.66
–
–
522
.66
–
–
–
–
522
.66
522
.66
-
Lea
seho
ld 2
59.4
5 –
–
2
59.4
5 2
1.06
–
2
.88
23.
94
235
.51
238
.39
Bui
ldin
gs 6
,926
.97
88.
98
25.
69
6,9
90.2
6 3
,256
.04
24.
13
366
.12
3,5
98.0
3 3
,392
.23
3,6
70.9
3
Mac
hine
ry 3
8,54
5.50
1
,513
.26
423
.24
39,
635.
52
26,
830.
86
421
.36
2,6
09.0
5 2
9,01
8.55
1
0,61
6.97
1
1,71
4.64
Com
pute
rs 8
18.9
2 1
05.3
1 4
1.77
8
82.4
6 6
89.0
1 4
1.31
8
1.12
7
28.8
2 1
53.6
4 1
29.9
1
Mot
or V
ehic
les
185
.27
8.8
8 1
5.01
1
79.1
4 1
15.1
0 1
5.01
2
5.49
1
25.5
8 5
3.56
7
0.17
Furn
iture
, Fix
ture
s 7
28.2
7 1
76.6
8 1
5.60
8
89.3
5 4
68.3
8 1
5.24
5
2.89
5
06.0
3 3
83.3
2 2
59.8
9
Offi
ce E
quip
men
ts 2
67.1
6 9
5.02
2
0.44
3
41.7
4 2
11.7
7 2
0.22
2
3.56
2
15.1
1 1
26.6
3 5
5.39
Su
b T
ota
l 4
8,25
4.20
1
,988
.13
541
.75
49,
700.
58
31,
592.
22
537
.27
3,1
61.1
1 3
4,21
6.06
1
5,48
4.52
1
6,66
1.98
INT
AN
GIB
LE
AS
SE
TS
Non
Com
pete
Fee
s 2
75.0
0 –
2
00.0
0 7
5.00
2
43.7
5 2
00.0
0 2
4.99
6
8.74
6
.26
31.
25
Com
pute
r Sof
twar
es 1
,236
.93
86.
62
16.
96
1,3
06.5
9 8
48.9
9 1
6.96
2
38.3
7 1
,070
.40
236
.19
387
.94
Clu
b M
embe
rshi
p 5
5.15
–
–
55.
15
12.
59
–
5.5
2 1
8.11
3
7.04
4
2.56
Su
b T
ota
l 1
,567
.08
86.
62
216
.96
1,4
36.7
4 1
,105
.33
216
.96
268
.88
1,1
57.2
5 2
79.4
9 4
61.7
5
Gra
nd
To
tal
49,
821.
28
2,0
74.7
5 7
58.7
1 5
1,13
7.32
3
2,69
7.55
7
54.2
3 3
,429
.99
35,
373.
31
15,
764.
01
17,
123.
73
PR
EV
IOU
S Y
EA
R 4
6,83
1.30
3
,204
.92
214
.94
49,
821.
28
29,
438.
67
192
.97
3,4
51.8
5 3
2,69
7.55
1
7,12
3.73
–
As
At 3
1st D
ecem
ber
201
3A
s A
t 31s
t Dec
emb
er 2
012
Ori
gin
al
Co
st
Wri
tten
D
ow
n V
alu
eO
rig
inal
C
ost
W
ritt
en
Do
wn
Val
ue
1B
uild
ings
incl
ude
a.
Bui
ldin
gs o
n le
aseh
old
land
1,9
70.8
7 1
,970
.87
b.O
wne
rshi
p fl a
ts in
Co-
oper
ativ
e S
ocie
ties
on fr
eeho
ld la
nd 2
12.6
2 2
12.6
2
c.
Ow
ners
hip
fl ats
in C
o-op
erat
ive
Soc
ietie
s on
leas
ehol
d la
nd 6
1.78
6
1.78
2M
achi
nery
inc
lude
s E
lect
rical
Fitt
ings
bei
ng e
xpen
ditu
re i
ncur
red
on i
nsta
lling
ove
rhea
d lin
e &
met
erin
g ya
rd f
or l
ayin
g hi
gh t
ensi
on l
ine
for
draw
ing
pow
er f
rom
Cen
tral
Pow
er D
istr
ibut
ion
Com
pany
of
And
hra
Pra
desh
Ltd
's G
rid t
o th
e H
yder
abad
pla
nt t
houg
h ow
ners
hip
of t
he s
ame
vest
s w
ith C
entr
al P
ower
D
istr
ibut
ion
Com
pany
of A
ndhr
a P
rade
sh L
td 1
3.60
3
.64
13.
60
5.0
4
3F
reeh
old
Land
at
Tha
ne w
as r
eval
ued
on 3
1.07
.198
5 ba
sed
on in
depe
nden
t va
luat
ion
repo
rt.T
he h
isto
rical
co
st o
f Fre
ehol
d La
nd fa
ir va
lued
by
the
Com
pany
was
a 1
.29
lacs
and
the
fair
valu
e w
as a
277
.06
lacs
. Hen
ce
the
reva
luat
ion
resu
lted
in a
n in
crea
se in
the
valu
e of
Fre
ehol
d La
nd b
y a
275.
77 la
cs
NOTES TO THE FINANCIAL STATEMENTSFor the year ended 31st December 2013

Standalone
64th Annual Report & Accounts 2013 0147
(a in lac)
31 December 2013 31 December 2012
11 NON-CURRENT INVESTMENTS
Trade Investments (valued at cost unless stated otherwise)
Unquoted Equity Shares
Investment in Subsidiary 3,879.13 3,879.13
10,408 Equity Shares of a 10/-each fully paid in Webtech Labels Private Limited (Previous Year 10,408 Equity Shares of a 10/-each)
3,879.13 3,879.13
31 December 2013 31 December 2012
12 LONG TERM LOANS & ADVANCES
Capital Advances
Unsecured, Considered Good 274.46 156.54
Security Deposit
Unsecured, Considered Good 377.73 204.21
Advances recoverable in Cash or in Kind
Unsecured Considered Good 27.83 35.13
Other Loans & Advances (Unsecured Considered Good)
Advance Income Tax (Net of Provision) 123.95 78.42
Advance Fringe Benefi t Tax (Net of Provision) 21.01 21.01
Loans / Advances to Staff 20.39 19.06
Prepaid Expenses 7.91 3.38
Balances with Customs, Excise & Sales Tax Authorities etc 632.20 508.65
1,485.48 1,026.40
31 December 2013 31 December 2012
13 OTHER NON-CURRENT ASSETS
Unsecured,considered good unless stated otherwise.
Non - Current bank balances being Deposits with original maturity of more than 12 months 0.73 0.73
Others
Export Rebate Receivables 290.54 290.54
Recoverable from Gratuity Trust 133.99 80.10
425.26 371.37
NOTES TO THE FINANCIAL STATEMENTSFor the year ended 31st December 2013

Standalone
0248 64th Annual Report & Accounts 2013
NOTES TO THE FINANCIAL STATEMENTSFor the year ended 31st December 2013
(a in lac)
Face Value 31 December 2013 31 December 2012
Nos. a in lac Nos. a in lac
14 CURRENT INVESTMENTS ( valued at lower of cost & fair value,unless stated otherwise)
UNITS OF MUTUAL FUNDS- UNQUOTED
Reliance Medium Term fund - Daily Dividend Plan 10 – – 1,833,273 313.66
UTI Short Term Income Fund Institutional Dividend Plan
10 – – 4,275,491 464.85
Templeton India Ultra Short Bond Fund-Super Institutional Plan
10 – – 7,370,675 738.21
DWS Ultra Short Term Fund- IP-Daily Dividend 10 – – 9,310,415 932.71
Sundaram Ultra Short Term Fund Super Institutional 10 – – 11,287,726 1,132.95
Birla Sun Life Dynamic Bond Fund-Retail-Quarterly Dividend Reinvestment
10 – –2,615,838 300.00
Birla Sun Life Short Term Fund-Monthly Dividend Reinvestment
10 – – 2,596,431 302.35
ICICI Prudential Short Term Plan -DDR Fortnightly 10 – – 2,523,476 302.29
Templeton India Low Duration Fund- MDR 10 – – 5,263,623 545.59
SBI Short term Debt Fund - Weekly Dividend 10 – – 2,875,511 302.83
JP Morgon India Treasury Fund Super Inst.-DDR 10 – – 7,018,770 702.44
Reliance Liquid fund Treasury Plan- Daily Dividend Re-investment 1,529 58,141 888.84 – –
Kotak fl oater Short Term -Daily Dividend Re-investment
1,012 98,887 1,000.39 – –
ICICI Prudential Money Market Fund-DDR 100 199,925 200.19 – –
Birla Sun Life Floating Rate Fund-STP-DDR 100 346,535 346.61 – –
Sundaram Money Fund Regular -DDR 10 8,839,948 892.44 – –
Birla Sun Life Cash Plus -DDR 100 503,170 504.16 – –
ICICI Prudential Liquid -Reg-DDR 100 734,455 734.84 – –
HDFC Liquid Fund - DDR 10 8,941,684 911.91 – –
TOTAL 5,479.38 6,037.88
Net Asset Value of Mutual fund Units 5,479.38 6,041.06
15 INVENTORIES (Valued at lower of cost and net realizable value)
Raw Materials and Components [includes in transit a 207.05 Lacs (31 December, 2012 a 224.81 Lacs)]
5,207.11 4,497.25
Work in Process 1,235.09 1,360.71
Finished Goods 795.51 903.13
Stores & Spares 700.55 573.12
Loose Tools 975.61 982.96
8,913.87 8,317.17

Standalone
64th Annual Report & Accounts 2013 0149
NOTES TO THE FINANCIAL STATEMENTSFor the year ended 31st December 2013
(a in lac)
31 December 2013 31 December 2012
16 TRADE RECEIVABLES
Trade Receivables (Unsecured)
Outstanding for more than Six Months from the date they are due for payment
Considered Good – 30.94
Considered Doubtful 128.64 171.97
128.64 202.91
Less : Provision for Doubtful Receivables 128.64 171.97
– 30.94
Other Receivables
Considered Good 18,555.85 13,778.25
Considered Doubtful 10.87 6.88
18,566.72 13,785.13
Less : Provision for Doubtful Receivables 10.87 6.88
18,555.85 13,778.25
TOTAL 18,555.85 13,809.19
31 December 2013 31 December 2012
17 CASH AND CASH BALANCES
Cash and Cash Equivalents
Balances with Banks
On Current Accounts 1,474.14 1,237.67
On Unpaid Dividend Accounts 57.24 50.65
Deposits with original maturity of less than three months
3.75 148.50
Cheques on Hand 19.97 18.07
Cash on Hand 12.93 13.05
1,568.03 1,467.94
31 December 2013 31 December 2012
18 SHORT TERM LOANS & ADVANCES
Security DepositUnsecured, Considered Good 28.91 28.50 Advances Recoverable in Cash or in KindUnsecured Considered Good 314.08 155.49 Loans & Advances to Related Parties (Refer Note 37)Unsecured Considered Good 6.36 2.91 Other Loans & Advances (Unsecured Considered Good)Loans/Advances to Staff 39.54 47.75 Prepaid Expenses 178.82 180.87 Balances with Customs, Excise & Sales Tax Authorities etc
555.66 362.17
1,123.37 777.69

Standalone
0250 64th Annual Report & Accounts 2013
31 December 2013 31 December 2012
19 OTHER CURRENT ASSETS
Unsecured,considered good unless stated otherwise.
Un-amortised Premium on Forward Contract 26.47 27.67
DEPB Licences Available 281.84 8.46
Others
Claims Recoverable 312.20 224.81 Export Rebate Receivables 687.03 681.14 Interest Accrued on Investments 0.35 0.26 Recoverable from Gratuity Trust 75.92 –
1,383.81 942.34
31 December 2013 31 December 2012
20 REVENUE FROM OPERATIONS
Revenue from operations
Sale of Products
Finished Goods 106,219.90 94,311.17 Less : Excise Duty on Sales 6,639.17 6,011.85
99,580.73 88,299.32
Other operating RevenueScrap Sales 924.22 740.91
Compensation received for loss 141.98 –Revenue from Operations (net) 100,646.93 89,040.23
Details of Products SoldFinished Goods Sold
a Laminates and Converted,Coated/Uncoated Paper and Films
96,705.44 84,780.38
b Cartons 2,460.61 3,056.34 c Others 414.68 462.60
99,580.73 88,299.32
31 December 2013 31 December 2012
21 OTHER INCOME
Interest Income onBank Deposits 4.39 1.88
Others 12.07 9.55 Dividend Income on Current Investments 327.59 569.65 Net Gain on Sale of Current Investments 3.64 0.85 Other Non-Operating Income Rent 3.87 3.76 Profi t on Sale of Fixed Assets (Net) 10.67 5.82 Doubtful Debts Provision Written Back 39.35 – Insurance Claim Received 11.57 44.08 Other Non Operating Income (net of expenses) 71.12 190.09
484.27 825.68
NOTES TO THE FINANCIAL STATEMENTSFor the year ended 31st December 2013
(a in lac)

Standalone
64th Annual Report & Accounts 2013 0151
NOTES TO THE FINANCIAL STATEMENTSFor the year ended 31st December 2013
31 December 2013 31 December 2012
22 RAW MATERIAL AND COMPONENTS CONSUMEDInventory at the beginning of the year 4,497.25 4,236.81
Add : Purchases 71,513.66 61,798.92
76,010.91 66,035.73
Less : Inventory at the end of the year 5,207.11 4,497.25
Cost of Raw Material and Components Consumed 70,803.80 61,538.48
Details of Raw Materials and Components ConsumedPaper 3,901.28 2,359.19
Paper Board 818.21 981.87
Films 35,257.31 29,651.02
Inks, Adhesives and Solvents 16,888.87 15,361.46
Polyethylene Granules 10,987.65 9,787.56
Others 2,950.48 3,397.38
70,803.80 61,538.48
31 December 2013 31 December 201223 CHANGES IN INVENTORIES OF FINISHED GOODS AND
WORK-IN-PROCESSInventories at the end of the year
Work in Process 1,235.09 1,360.71
Finished Goods 795.51 903.13
2,030.60 2,263.84
Inventories at the beginning of the yearWork in Process 1,360.71 1,998.34
Finished Goods 903.13 674.88
2,263.84 2,673.22
Changes in Inventories of Finished Goods and Work-in-Process 233.24 409.38
Excise Duty on Changes in Inventories of Finished Goods Excise Duty on Closing Finished Goods Stock 88.53 81.43
Less: Excise Duty on Opening Finished Goods Stock 81.43 7.10 51.76 29.67
240.34 439.05
Details of InventoryWork in Processa. Laminates and Converted,Coated/Uncoated Paper and Films 1,157.97 1,280.43
b. Cartons 53.92 63.58
c. Others 23.20 16.71
1,235.09 1,360.71
31 December 2013 31 December 2012
24 EMPLOYEE BENEFIT EXPENSES
Salaries,Wages and Bonus 6,607.00 5,987.05
Contribution to Provident and Other Fund 272.59 343.36
Staff Welfare Expenses 789.60 674.88
7,669.19 7,005.29
(a in lac)

Standalone
0252 64th Annual Report & Accounts 2013
31 December 2013 31 December 2012
25 FINANCE COST
Interest - To Banks 0.11 0.33
- To Others 7.82 5.14
7.93 5.47
31 December 2013 31 December 2012
26 DEPRECIATION AND AMORTISATION EXPENSES
Depreciation of Tangible Assets 3,161.11 3,200.14
Amortisation of Intangible Assets 268.88 251.71
3,429.99 3,451.85
31 December 2013 31 December 2012
27 OTHER EXPENSES
Consumption of Stores and Consumables 740.73 684.15
Power and Fuel 3,603.40 3,259.38
Repairs to Building 126.02 164.23
Repairs to Machinery 1,095.22 1,109.14
Other Repairs 191.14 169.57
Sub Contracting Expenses 882.24 870.25
Insurance 170.46 181.50
Rent 113.66 35.67
Rates and Taxes 120.11 127.93
Travelling and Conveyance 547.90 520.29
Legal and Professional Charges * 560.05 631.04
Commission-Directors 41.51 45.34
Communication Costs 132.86 130.52
Payment to Auditor (Refer note 27.1) 47.64 42.52
Donation 7.33 10.35
Printing and Stationery 67.14 78.24
Commission on Sales - Others 219.29 165.60
Freight and Forwarding Expenses 1,539.97 1,430.57
Fixed Assets Written Off 4.44 15.28
Bank Charges 64.23 70.53
Provision for Sales Tax 49.61 75.73
Provision for Doubtful Debts – 51.56
Foreign Exchange Loss (Net) 192.37 139.77
Miscellaneous Expenses 1,511.20 1,277.63
12,028.52 11,286.79
* Previous year includes a 80.74 lac being professional fees incurred on acquisition of Subsidiary- Webtech Labels Pvt. Ltd.
NOTES TO THE FINANCIAL STATEMENTSFor the year ended 31st December 2013
(a in lac)

Standalone
64th Annual Report & Accounts 2013 0153
27.1 PAYMENT TO AUDITORS :
Auditor's Remuneration
Audit Fees 42.59 38.71
In other capacity
Certifi cation Fees 1.35 2.27
Reimbursement of Expenses 3.70 1.54
47.64 42.52
31 December 2013 31 December 2012
28 EARNINGS PER SHARE (EPS)
Profi t after Tax Excluding Exceptional Item 4,987.99 4,502.77
Profi t after Tax Including Exceptional Item 5,453.14 4,502.77
Weighted Average Number of Equity Shares 62,687,190 62,687,190
Basic and Diluted Earnings per Equity Share Excluding Exceptional Item
7.96 7.18
Basic and Diluted Earnings per Equity Share Including Exceptional Item
8.70 7.18
Nominal Value of Share (in a) 2.00 2.00
31 December 2013 31 December 2012
29 NET DIVIDEND REMITTED IN FOREIGN CURRENCY (EURO) TO ITS PARENT COMPANY
Huhtavefa B.V., Netherlands.
The particulars of dividend declared and paid to above shareholder are as under:
a. Dividend for the year 2012 2011
b. Number of Non-resident Shareholder 1 1
c. Equity Shares held by Non-resident Shareholder
38,095,166 38,095,166
d. Gross Amount of Dividend Remitted 990.47 914.28
31 December 2013 31 December 2012
30 CONTINGENT LIABILITIES
a Excise Duty
Matters in Appeal - Duty 5,202.50 5,099.57
- Penalties 147.01 125.58
Show Cause Notices - Duty 3,703.92 3,221.53
b Service Tax
Show Cause Notices - Service Tax 49.74 34.47
Matters in Appeal - Service Tax 84.26 74.81
- Penalties 58.12 55.87
c Sales Tax Demands in Appeal 76.91 117.24
d Claims against the company not acknowledged as debts 65.18 120.83
NOTES TO THE FINANCIAL STATEMENTSFor the year ended 31st December 2013
(a in lac)
31 December 2013 31 December 2012

Standalone
0254 64th Annual Report & Accounts 2013
Note for (a) to (d): Future cash outfl ows / uncertainties, if any, in respect of the above are determinable only on receipt of judgements / decisions pending with various forums / authorities.
(a in lac)
31 December 2013 31 December 2012
31 CONTRACTS REMAINING TO BE EXECUTED ON CAPITAL ACCOUNT AND NOT PROVIDED FOR (NET OF ADVANCES). 3,990.31 323.04
31 December 2013 31 December 2012
32 DISCLOSURE OF THE AMOUNTS DUE TO THE MICRO AND SMALL ENTERPRISES
(On the basis of the information and records available with the Management.)
The principal amount and the interest due there on remaining unpaid to any Micro/Small supplier
- Principal amount 115.67 59.09
- Interest there on 14.18 10.85
The interest paid by the buyer as above, along with the amount of payments made beyond the appointed date during each accounting year.
– –
The amount of interest due and payable for the period of delay in making payment (which has been paid but beyond the appointed day during the year) but without adding the interest specifi ed under the Micro, Small and Medium Enterprises Development Act 2006.
– –
The amount of interest accrued and remaining unpaid at the end of each accounting year.
The amount of further interest remaining due and payable even in the succeeding years, until such date when the interest dues as above are actually paid to the small / micro enterprise.
3.33 4.43
14.18 10.85
Currency31 December 2013Foreign Currency
in lac
31 December 2012Foreign Currency
in lac
33 DISCLOSURE OF DERIVATIVE INSTRUMENTS
i Derivative Instruments Outstanding
Forward Exchange contracts for the foreign exchange exposures of receivables on account of export of goods.
USD 12.00 13.00
ii Foreign Exchange Exposures
Foreign Exchange exposures not covered by a derivative contract for payments to be received on account of export of goods.
USD
EUR
61.06
0.65
48.29
0.39
NOTES TO THE FINANCIAL STATEMENTSFor the year ended 31st December 2013

Standalone
64th Annual Report & Accounts 2013 0155
Foreign Exchange exposures not covered by a derivative contract for payments to be made against revenue imports and capital imports creditors.
USD
EUR
JPY
GBP
SFR
36.43
0.66
28.04
0.13
–
30.31
1.97
23.97
0.17
0.10
iii Bank balance in Export Earners Foreign Currency account
USD 0.93 –
iv Derivatives taken to Cover Forecast Exposures USD 28.00 35.00
Forward Exchange contracts taken for the forecast exports receivables on account of export of goods & services.
Forward Exchange contracts taken for the forecasted Capital imports.
Euro JPY
8.78 –
– 236.10
v Closing exchange rate at Balance Sheet date
(In INR) USD
EUR
JPY
GBP
SFR
61.90
85.37
0.59
102.39
69.54
54.89
72.42
0.64
88.74
59.99 vi Mark to market valuation loss on account of
forward exchange contracts entered into to cover the forecast transactions pursuant to the ICAI announcement of 29th March 2008 on Accounting for Derivatives.
a 75.04 27.39
31 December 2013 31 December 2012
34 VALUE OF IMPORTS ON CIF BASIS IN RESPECT OF
a. Raw Materials 15,169.81 12,524.16
b. Stores, Spares-Parts and Other Materials 378.25 280.91
c. Capital Goods 867.37 1,272.30
35 SEGMENT REPORTING
The Company's sole business segment is consumer packaging and all activities of the Company are incidental to this sole business segment. Given this fact and that the Company services its domestic and export markets from India only, the fi nancial statements refl ect the information required by AS-17 Segment Reporting for the sole business segment of consumer packaging.
Secondary segments for the Company are geographic, namely domestic and exports. Revenue from geographic segments is based on the domicile of customers.
NOTES TO THE FINANCIAL STATEMENTSFor the year ended 31st December 2013
Currency31 December 2013Foreign Currency
in lac
31 December 2012Foreign Currency
in lac
(a in lac)

Standalone
0256 64th Annual Report & Accounts 2013
Net Sales Domestic Customers 78,309.43 71,424.60
Net Sales Export Customers 21,271.30 16,874.72
Total Net Sales 99,580.73 88,299.32
The entire business assets other than trade receivables are situated in India.
Trade receivables outstanding in respect of domestic segment as at the year end
14,158.93 10,615.65
Trade receivables outstanding in respect of export segment as at the year end
4,396.92 3,193.54
31 December 2013 31 December 2012
36 EARNINGS IN FOREIGN CURRENCY
a. F.O.B. Value of Exports 19,419.68 15,110.80
b. Others 450.98 489.58
37 RELATED PARTY TRANSACTIONS
a. Related party where control exists :Ultimate Parent Company Huhtamaki Oyj., FinlandHolding Company Huhtavefa B.V., Netherlands
Subsidiary Company Webtech Labels Private Limited
b. Other Related Parties with whom transactions have taken place during the year :Fellow Subsidiaries Huhtamaki New Zealand Ltd., New Zealand.
Huhtamaki Australia Ltd., AustraliaHuhtamaki Deutschland Gmbh and Co.KG., GermanyHuhtamki South Africa Pty Ltd., South AfricaHuhtamaki (Thailand) Ltd., Thailand
c. Key Managerial Personnel Mr. Suresh Gupta Chairman and Managing Director Mr. M.K.Srinivasan Chief Executive Offi cer and Executive
Director (till 30th June 2012)Mr. A.Venkatrangan Executive Director
d. Relatives of Key Managerial Personnel
Mr. Suresh Gupta Mrs. Kumkum Gupta-Wife, Ms. Ratna Gupta-Daughter, Ms. Shivani Gupta-Daughter
31 December 2013 31 December 2012
e. Details of transactions with related parties that have taken place during the year :1) Ultimate Parent Company
a) Software and Expense Reimbursements Charge 33.89 31.59 b) Remuneration paid by Huhtamaki Oyj to
Mr.Suresh Gupta as EVP - Flexibles Packaging Global, Huhtamaki Oyj.Finland
222.25 93.04
2) Holding Company– Dividend Paid– Huhtavefa B.V., Netherlands 990.47 914.28
3) Subsidiary Company
– Expense Reimbursement 30.19 2.91
NOTES TO THE FINANCIAL STATEMENTSFor the year ended 31st December 2013
(a in lac)
31 December 2013 31 December 2012

Standalone
64th Annual Report & Accounts 2013 0157
4) Fellow SubsidiariesPurchase of Goods– Huhtamaki Deutschland Gmbh and Co.KG.,
Germany 18.34 2.99
Sale of Goods– Huhtamaki New Zealand Ltd., New
Zealand. (Net of Sales Returns) 453.17 525.44
– Huhtamaki (Thailand) Ltd, Thailand 114.79 46.39
– Huhtamaki Australia Ltd., Australia 418.05 408.03
– Huhtamaki South Africa Pty Ltd., South Africa 201.03 –
– Huhtamaki Deutschland Gmbh and Co.KG., Germany
5.37 –
Commission Expenses on Sales
– Huhtamaki South Africa Pty Ltd., South Africa 77.72 73.84
Expense Reimbursements - Charge
– Huhtamaki New Zealand Ltd., New Zealand – 5.72
– Huhtamaki Australia Ltd., Australia 0.11 49.77
– Huhtamaki (Thailand) Ltd., Thailand 3.56 –
Expense Reimbursements - Recovery
– Huhtamaki Deutschland Gmbh and Co.KG., Germany
0.91 –
Balances due to– Huhtamaki Oyj., Finland 21.32 23.73
– Huhtamaki South Africa Pty Ltd., South Africa 43.10 46.25
– Huhtamaki Australia Ltd., Australia 0.11 –
– Huhtamaki Deutschland Gmbh and Co.KG., Germany
8.60 –
Balances due from– Huhtamaki New Zealand Ltd., New Zealand. 155.30 32.91
– Huhtamaki Australia Ltd., Australia. 61.74 119.43
– Huhtamaki South Africa Pty Ltd., South Africa 49.16 –
– Webtech Labels Private Limited 6.36 2.91
5) Payments to Key Managerial Personnel and their Relatives
Remuneration Paid to Key Managerial PersonnelMr. Suresh Gupta, Chairman and Managing Director 206.64 187.22
Mr. M.K.Srinivasan,Chief Executive Offi cer & Executive Director
– 67.86
Mr. A.Venkatrangan,Executive Director 146.22 352.86 47.48 302.56 Dividend Paid to Key Managerial Personnel and their RelativesMr. Suresh Gupta 30.71 28.35
Mrs. Kumkum Gupta 6.53 6.03 Ms. Ratna Gupta 5.23 4.83 Ms. Shivani Gupta 5.21 4.81 Mr. A.Venkatrangan 0.13 47.81 0.12 44.14
NOTES TO THE FINANCIAL STATEMENTSFor the year ended 31st December 2013
(a in lac)
31 December 2013 31 December 2012

Standalone
0258 64th Annual Report & Accounts 2013
31 December 2013 31 December 2012
% of Consumption
Amount % of Consumption
Amount
38 CONSUMPTION OF RAW MATERIALS, PACKING MATERIALS & STORES & SPARES CONSUMED
Imported 23.69% 16,948.88 22.14% 13,774.42
Indigenous 76.31% 54,595.65 77.86% 48,448.21
100.00% 71,544.53 100.00% 62,222.63
31 December 2013 31 December 2012
39 DISCLOSURE PURSUANT TO ACCOUNTING STANDARD - 15 (REVISED) ' EMPLOYEE BENEFITS'
The Company has classifi ed the various employee benefi ts as under
i) Defi ned Contribution Plans
Amount recognised as an expense and included in "Personnel costs" for Provident Fund & ESIC contributions in the Profi t and Loss account. 307.77 298.87
ii) Defi ned Benefi t Plans
The Company has classifi ed the various benefi t plans provided to employees as under :
I Gratuity Plan
Gratuity is payable to all eligible employees of the Company on superannuation, death and resignation, in terms of the provisions of the Payment of Gratuity Act or as per the Company's Scheme whichever is more benefi cial.
II Leave Plan
Eligible employees can carry forward and encash leave on superannuation, death, and resignation subject to maximum limits as per Company policy.
The following table summarises the components of the net benefi t expense recognised in the profi t & loss account and the funded status and amount recognised in the Balance sheet for the respective plans.
(a in lac)
Gratuity - Funded Leave Encashment - Non Funded
2013 2012 2013 2012
I. Change in Benefi t Obligation
Opening Defi ned Benefi t Obligation 1,274.36 1,125.94 356.89 350.30
Interest Cost 105.77 92.27 29.62 24.72
Current Service Cost 88.02 106.05 58.22 53.13
Benefi t Paid (111.39 ) (80.83) (34.72) (56.20)
Actuarial (Gain)/ Loss on Obligations (128.37 ) 30.93 (50.36) (15.06)
Closing Defi ned Benefi t Obligation 1,228.39 1,274.36 359.65 356.89
NOTES TO THE FINANCIAL STATEMENTSFor the year ended 31st December 2013
(a in lac)

Standalone
64th Annual Report & Accounts 2013 0159
II. Fair Value of Plan Assets
Fair Value of Plan Assets at the beginning of the year 1,274.36 1,125.94 – –
Expected Return on Plan Assets 105.77 100.04 – –
Contributions (139.01) 52.02 – –
Benefi t Paid – (80.83) – –
Actuarial Gain/(Loss) on Plan Assets (12.73) 77.19 – –
Fair Value of Plan Assets at the end of the year 1,228.39 1,274.36 – –
III. Actual Return on Plan Assets
Actual Return on Plan Assets 93.04 177.23 – –
Expected Return on Plan Assets 105.77 100.04 – –
Actuarial Gain/ (Loss) on Plan Assets (12.73) 77.19 – –
Actuarial Gain/ (Loss) on Obligation 128.37 (30.93) 50.36 15.06
IV. Amount Recognised in the Balance Sheet
Defi ned Benefi t Obligation 1,228.39 1,274.36 359.65 356.89
Fair Value of Plan Assets 1,228.39 1,274.36 – –
Funded Status – – (359.65) (356.89)
Unrecognised Actuarial Gain/(Loss) – – – –
Net Asset /(Liability) Recognised in the Balance Sheet – – (359.65) (356.89)
V. Expenses Recognised in the Profi t & Loss Account
Current Service Cost 88.02 106.05 58.22 53.13
Interest Cost 105.77 92.27 29.62 24.72
Expected Return on Plan Assets (105.77) (100.04) – –
Net Actuarial (Gain)/Loss to Be Recognised (115.63) (46.26) (50.36) (15.06)
Expense Recognised in Statement of Profi t and Loss (27.62) 52.02 37.48 62.78
The Company expects to contribute a Nil to Gratuity in next year ( 31st December 2012: a Nil)
The principal assumptions used in determining benefi t obligations for the Company's plans are shown below.
Particulars 2013 2012
Discount Rate 9.50% 8.30%
Rate of Return on Plan Assets 9.50% 9.00%
Salary Escalation 7.25% 7.25%
Employee Turnover years %
0-2 12%
3-4 5%
5-9 2.5%
10 & Above
1%
Estimates of future salary increases, considered in actuarial valuation, take account of infl ation,seniority, promotion and other relevant factors, such as supply and demand in the employment.
NOTES TO THE FINANCIAL STATEMENTSFor the year ended 31st December 2013
(a in lac)
Gratuity - Funded Leave Encashment - Non Funded
2013 2012 2013 2012

Standalone
0260 64th Annual Report & Accounts 2013
(a in lac)
The major categories of plan assets as a percentage of the fair value of total plan assets are as follows.
Particulars Gratuity
31 December 2013 31 December 2012
Amount in lac
% Amount in lac
%
Investment Value in Unit Linked Plans 243.90 20% 351.12 28%
Investment Value in Non Unit Linked Plans 879.31 71% 818.06 64%
Investment Value in Special Deposit Scheme of Bank Of Baroda 105.18 9% 105.18 8%
Total 1228.39 100% 1274.36 100%
Amounts for the current and previous periods are as follows.
Particulars Gratuity
2013 2012 2011 2010 2009
Defi ned Benefi t Obligation 1,228.39 1,274.36 1,125.95 1,003.55 926.24
Plan Assets 1,228.39 1,274.36 1,125.95 1,103.17 1,057.63
Excess of Defi ned Benefi t Obligation over Fair Value of Plan Assets.
– – – (99.62) (131.39)
Experience Adjustment on Plan Assets – (77.19) (42.43) – –
Experience Adjustment on Plan Liabilities 14.71 30.93 (11.48) – –
Leave Encashment
Particulars 2013 2012 2011 2010 2009
Defi ned Benefi t Obligation 359.65 356.89 306.53 287.94 267.65
Plan Assets – – – – –
Experience Adjustment – – – – –
Excess of Defi ned Benefi t Obligation over Fair Value of Plan Assets.
359.65 356.89 306.53 287.94 267.65
31 December 2013 31 December 2012
40 LEASES
The Company has taken certain offi ce premises and residential facilities under operating Lease arrangements.
There are no restrictions imposed by lease arrangements. There are no subleases.
Future lease commitments in respect of non-cancellable operating leases are as follows :Within one year
181.32 –
After one year but not more than fi ve years 641.93 –
823.25 –
NOTES TO THE FINANCIAL STATEMENTSFor the year ended 31st December 2013

Standalone
64th Annual Report & Accounts 2013 0161
(a in lac)
31 December 2013 31 December 2012
41 EXPENDITURE IN FOREIGN CURRENCY
a. Travelling Expenses 76.96 68.54
b. Commission on Sales 213.17 162.02
c. Service Charges Paid for Technical Services 68.48 39.09
d. Royalty 12.50 19.94
e. Professional Fees 76.82 88.21
f. Others 26.49 89.81
31 December 2013 31 December 2012
42 RESEARCH AND DEVELOPMENT EXPENSES
The details of expenses incurred on in-house research and development activities during the year ended 31 December 2013 as certifi ed by the management are as follows :
Total Revenue Expenditure * 137.19 84.11
Total Capital Expenditure ** 52.61 –
Total Research & Development Expenses 189.80 84.11
NOTES TO THE FINANCIAL STATEMENTSFor the year ended 31st December 2013
Directors
As per our report of even date
For S.R. Batliboi & Co.LLP For and on behalf of the Board of Directors
Chartered AccountantsICAI Firm Registration No. 301003E Suresh Gupta A.Venkatrangan Chairman & Managing Director Executive Director
per Vijay Maniar Parag Vyavahare Jukka MoisioPartner Chief Financial Offi cer Johann SippelMembership No. 36738 Ramesh Kumar Dhir Anand Daga Nripjit Singh ChawlaMumbai Company Secretary & Head Legal S.K.Palekar18 February 2014 Mumbai, 18 February 2014 P.V.Narayana
* Revenue Expenditure of a 137.19 lacs has been grouped under various expense heads of the Financial Statements.
** Additions to Fixed Assets in Note no. 10 includes a 52.61 lacs towards Capital Expenditure have incurred for Company's in house R & D facilities.
43 EXCEPTIONAL INCOME
Exceptional Income comprises of gain realised on sale of offi ce property at Nariman Point, Mumbai during the current year of a 705 Lacs ( Provision for Tax includes a 239 lacs towards tax on this gain).
44 Previous year fi gures have been regrouped or reclassifi ed wherever necessary, to conform to this year classifi cations.

Standalone
0262 64th Annual Report & Accounts 2013
ST
AT
EM
EN
T P
UR
SU
AN
T T
O S
EC
TIO
N 2
12 (
8) O
F T
HE
CO
MP
AN
IES
AC
T,1
956
RE
LA
TIN
G T
O S
UB
SID
IAR
Y C
OM
PA
NY
In a
ccor
danc
e w
ith th
e G
ener
al C
ircul
ar N
o: 2
/201
1 da
ted
8 F
ebru
ary,
201
1,is
sued
by
the
Min
istr
y of
Cor
pora
te A
ffairs
, Gov
ernm
ent o
f Ind
ia, t
he B
alan
ce S
heet
, the
S
tate
men
t of P
rofi t
and
Los
s an
d ot
her
docu
men
ts o
f the
sub
sidi
ary
are
not b
eing
atta
ched
with
the
Ann
ual A
ccou
nts
of th
e C
ompa
ny.T
his
Ann
ual R
epor
t con
tain
s C
onso
lidat
ed F
inan
cial
Sta
tem
ent
of t
he C
ompa
ny a
nd it
s su
bsid
iary
in a
ccor
danc
e w
ith t
he r
elev
ant
Acc
ount
ing
Sta
ndar
ds a
nd t
he s
ame
has
been
dul
y au
dite
d by
Sta
tuto
ry A
udito
rs.T
he a
nnua
l Acc
ount
s of
the
sub
sidi
ary
com
pany
and
rel
ated
info
rmat
ion
will
be
mad
e av
aila
ble
to t
he s
hare
hold
ers
of t
he C
ompa
ny a
nd it
s su
bsid
iary
com
pany
on
requ
est a
nd w
ill a
lso
be k
ept o
pen
for
insp
ectio
n by
the
shar
ehol
ders
at t
he R
egis
tere
d O
ffi ce
of t
he C
ompa
ny a
nd th
e su
bsid
iary
.
Nam
e o
f S
ub
sid
iary
C
om
pan
y
Issu
ed &
S
ub
scri
bed
C
apit
alR
eser
ves
To
tal
Ass
ets
To
tal
Lia
bili
ties
Inve
stm
ents
Tu
rno
ver
Pro
fi t/
(Lo
ss)
bef
ore
Tax
Pro
visi
on
fo
r T
ax
Pro
fi t/
(Lo
ss)
Aft
er T
ax
Pro
po
sed
D
ivid
end
WE
BT
EC
H L
AB
ELS
P
RIV
AT
E L
IMIT
ED
2.0
4 4
,105
.34
8,5
03.1
6 4
,395
.78
0.0
3 7
,898
.92
418
.81
90.
19
328
.62
–
(a in
lac)

64th Annual Report & Accounts 2013 0163
To The Board of Directors of
The Paper Products Limited
We have audited the accompanying consolidated fi nancial statements of The Paper Products Limited (“the Company”) and its subsidiary, which comprise the consolidated Balance Sheet as at December 31, 2013, and the consolidated Statement of Profi t and Loss and the consolidated Cash Flow Statement for the year then ended, and a summary of signifi cant accounting policies and other explanatory information.
Management’s Responsibility for the Consolidated Financial Statements
Management is responsible for the preparation of these consolidated fi nancial statements that give a true and fair view of the consolidated fi nancial position, consolidated fi nancial performance and consolidated cash fl ows of the Company in accordance with accounting principles generally accepted in India including the Accounting Standards notifi ed under the Companies Act, 1956 (“the Act”) read with General Circular 15/2013 dated 13 September 2013, issued by the Ministry of Corporate Affairs, in respect of Section 133 of the Companies Act, 2013. This responsibility includes the design, implementation and maintenance of internal control relevant to the preparation and presentation of the consolidated fi nancial statements that give a true and fair view and are free from material misstatement, whether due to fraud or error.
Auditor’s Responsibility
Our responsibility is to express an opinion on these consolidated fi nancial statements based on our audit. We conducted our audit in accordance with the Standards on Auditing issued by the Institute of Chartered Accountants of India. Those Standards require that we comply with ethical requirements and plan and perform the audit to obtain reasonable assurance about whether the consolidated fi nancial statements are free from material misstatement.
An audit involves performing procedures to obtain audit evidence about the amounts and disclosures in the consolidated fi nancial statements. The procedures selected depend on the auditor’s judgement, including the assessment of the risks of material misstatement of the consolidated fi nancial statements, whether due to fraud or error. In making those risk assessments, the auditor considers internal control relevant to the Company’s preparation and presentation of the consolidated fi nancial statements that give a true and fair view in order to design audit procedures that are appropriate in the circumstances, but not for the purpose of expressing an opinion on the effectiveness of the entity’s internal control. An audit also includes evaluating the appropriateness of accounting policies used and the reasonableness of the accounting estimates made by management, as well as evaluating the overall presentation of the consolidated fi nancial statements. We believe that the audit evidence we have obtained is suffi cient and appropriate to provide a basis for our audit opinion.
Opinion
In our opinion and to the best of our information and according to the explanations given to us, the consolidated fi nancial statements give a true and fair view in conformity with the accounting principles generally accepted in India:
(a) in the case of the consolidated Balance Sheet, of the state of affairs of the Company as at December 31, 2013;
(b) in the case of the consolidated Statement of Profi t and Loss, of the profi t for the year ended on that date; and(c) in the case of the consolidated Cash Flow Statement, of the cash fl ows for the year ended on that date.
For S.R. BATLIBOI & CO. LLPChartered Accountants ICAI Firm registration number: 301003E
per Vijay ManiarPartner Membership No.: 36738
Mumbai18 February 2014
INDEPENDENT AUDITOR'S REPORT ON THE CONSOLIDATED FINANCIAL STATEMENTS

0264 64th Annual Report & Accounts 2013
Notes 31 December 2013 31 December 2012
EQUITY AND LIABILITIESShareholders' FundsShare Capital 2 1,253.83 1,253.83 Reserves and Surplus 3 37,826.80 34,242.19
39,080.63 35,496.02
Minority Interest 2,012.63 1,851.61
Non-Current LiabilitiesLong - Term borrowings 4 3,991.44 3,426.35 Deferred Tax Liability (Net) 5 102.00 67.77 Long Term Provisions 6 127.38 151.79
4,220.82 3,645.91 Current LiabilitiesShort - Term Borrowings 7 58.61 1,406.20 Trade Payables 8 14,854.81 12,824.58 Other Current Liabilities 9 2,995.74 2,321.08 Short Term Provisions 10 3,029.75 2,844.87
20,938.91 19,396.73
TOTAL 66,252.99 60,390.27 ASSETSNon-Current AssetsFixed Assets Tangible Assets 11 19,359.17 20,084.54 Intangible Assets 11 1,866.47 2,256.36 Capital Work in Progress 1,097.57 446.80 Goodwill On Consolidation 1,956.73 1,956.73 Non-Current Investments 12 0.03 0.03 Deferred Tax Assets (Net) 5 3.31 – Long Term Loans & Advances 13 1,675.83 1,154.80
Other Non Current Assets 14 428.02 431.66
26,387.13 26,330.92 Current AssetsCurrent Investments 15 5,479.38 6,037.88Inventories 16 9,348.30 8,861.84Trade Receivables 17 20,868.57 15,887.02Cash and Cash Balances 18 1,579.95 1,475.94Short Term Loans & Advances 19 1,205.85 854.13 Other Current Assets 20 1,383.81 942.54
39,865.86 34,059.35
TOTAL 66,252.99 60,390.27
Signifi cant Accounting Policies 1
($ in lac)
CONSOLIDATED BALANCE SHEETAs at 31st December 2013
Directors
The accompanying notes are an integral part of fi nancial statements
As per our report of even date
For S.R. Batliboi & Co.LLP For and on behalf of the Board of Directors
Chartered AccountantsICAI Firm Registration No. 301003E Suresh Gupta A.Venkatrangan Chairman & Managing Director Executive Director
per Vijay Maniar Parag Vyavahare Jukka MoisioPartner Chief Financial Offi cer Johann SippelMembership No. 36738 Ramesh Kumar Dhir Anand Daga Nripjit Singh ChawlaMumbai Company Secretary & Head Legal S.K.Palekar18 February 2014 Mumbai, 18 February 2014 P.V.Narayana

64th Annual Report & Accounts 2013 0165
Notes 31 December 2013 31 December 2012
INCOMERevenue from Operations (Gross) 21 115,871.82 96,156.74 Less: Excise Duty 7,321.78 6,098.01 Revenue from Operations (Net) 108,550.04 90,058.73 Other Income 22 490.27 825.87 Total Revenue 109,040.31 90,884.60
EXPENSESCost of Raw Material and Components Consumed 23 74,987.04 62,123.58 Changes in Inventories of Finished goods and Work-in-Process 24 242.80 367.10
Employee Benefi t Expenses 25 8,409.82 7,098.32 Finance Cost 26 374.99 59.06 Depreciation and Amortisation Expenses 27 4,201.74 3,565.28 Other Expenses 28 13,453.68 11,498.34
Total Expenses 101,670.07 84,711.68
Profi t Before Exceptional Item and Tax 7,370.24 6,172.92
Exceptional Item (Refer note 39 ) 704.66 – Profi t Before Tax 8,074.90 6,172.92 Tax Expenses Current Tax 2,329.85 1,911.17 Excess Provision for earlier years written back – (55.60)Deferred Tax 30.92 (187.16)
MAT Credit entitlement (67.63) (7.57)
Profi t for the period 5,781.76 4,512.08
Share of Minority Interest 161.02 4.56
Profi t After Minority Interest 5,620.74 4,507.52Earnings per Equity Share including Exceptional Item (Nominal value-a 2 (Previous Year-a 2))
29
1. Basic 8.97 7.19 2. Diluted 8.97 7.19 Earnings per equity share excluding Exceptional Item
1. Basic 8.23 7.19
2. Diluted 8.23 7.19
Signifi cant Accounting Policies 1
($ in lac)
CONSOLIDATED STATEMENT OF PROFIT & LOSS ACCOUNTFor the year ended 31st December 2013
Directors
The accompanying notes are an integral part of fi nancial statements
As per our report of even date
For S.R. Batliboi & Co.LLP For and on behalf of the Board of Directors
Chartered AccountantsICAI Firm Registration No. 301003E Suresh Gupta A.Venkatrangan Chairman & Managing Director Executive Director
per Vijay Maniar Parag Vyavahare Jukka MoisioPartner Chief Financial Offi cer Johann SippelMembership No. 36738 Ramesh Kumar Dhir Anand Daga Nripjit Singh ChawlaMumbai Company Secretary & Head Legal S.K.Palekar18 February 2014 Mumbai, 18 February 2014 P.V.Narayana

0266 64th Annual Report & Accounts 2013
31 December 2013 31 December 2012
A. Cash Flow from Operating Activities
Net Profi t before Tax 8,074.90 6,172.92
Adjustments for
Depreciation 4,201.74 3,565.28
Unrealised Foreign Exchange Loss (Net) 135.05 182.56
Interest Income (22.24) (11.63)
Dividend Income (327.59) (569.65)
Financial Expenses 374.99 59.06
Provision for doubtful debts made/(written back) (39.35) 51.56
(Profi t)/Loss on Sale of Investments (3.64) (0.85)
Fixed Assets written Off 4.44 15.28
Provision for Sales Tax made 49.61 75.73
Profi t on Sale of Assets (Net) (7.46) (5.82)
Operating Profi t before Changes in Working Capital 12,440.45 9,534.44
Adjustments for (Increase)/Decrease in
Trade Receivables (4,984.92) (1,635.55)
Inventories (486.46) (34.22)
Loans and Advances (651.28) 457.02
Other Assets (437.65) 92.55
Adjustments for Increase/(Decrease) in
Trade Payables 2,079.46 72.08
Other Current Liabilities 435.55 (5.73)
Provisions (103.51) (273.68)
Cash Generated from Operations 8,291.64 8,206.91
Direct Taxes Paid (Net of Refunds Received) (2,496.11) (1,954.19)
Net Cash from Operating Activities 5,795.53 6,252.72
Exceptional Item (Refer note 39) (704.66) –
Net Cash from Operating Activities 5,090.87 6,252.72
B. Cash Flow from Investing Activities
Purchase of Fixed Assets (3,818.34) (2,409.27)
Proceeds from Sale of Fixed Assets 719.54 12.53
Purchase of Investments (23,135.95) (27,878.15)
Sale of Investments 23,698.09 28,178.77
Expenditure on acquisition of subsidiary – (111.75)
Purchase of Business from Webtech Industries Pvt.Ltd – (3,767.33)
Dividend Received 327.59 569.65
Interest Received 22.14 11.76
Capital Subsidy Received 30.00 –
Net Cash used in Investing Activities (2,156.93) (5,393.79)
($ in lac)
CONSOLIDATED CASH FLOW STATEMENTFor the year ended 31st December 2013

64th Annual Report & Accounts 2013 0167
($ in lac)
31 December 2013 31 December 2012
C. Cash Flow from Financing Activities
Repayment of Sales Tax Deferral Loan (97.77) (55.26)
Repayment of Long Term Borrowings (316.41) (38.65)
Repayment of Short Term Borrowings (1,347.58) 262.08
Proceeds from Long Term Borrowings 1,195.94 –
Interest Paid (379.77) (54.28)
Dividends Paid (Including Dividend Tax thereon) (1,900.28) (1,742.47)
Net Cash Used in Financing Activities (2,845.87) (1,628.58)
Net Increase/(Decrease) in Cash and Cash Equivalents 88.07 (769.65)
Effect of Exchange difference on Cash and Cash equivalents held in Foreign Currency
15.94 16.30
Cash and Cash Equivalents at the Beginning of the Year 1,475.94 2,229.29
Cash and Cash Equivalents at the Close of the Year 1,579.95 1,475.94
Cash and Cash Equivalents Comprise:
Cash on Hand 13.94 14.73
Cheques on Hand 19.97 18.07
Balances in Current Accounts with Scheduled Banks 1,485.05 1,243.98
Balances in Deposit Accounts with Scheduled Banks 3.75 148.50
Balances in Unpaid Dividend Bank Accounts * 57.24 50.66
1,579.95 1,475.94
CONSOLIDATED CASH FLOW STATEMENTFor the year ended 31st December 2013
* These balances are not available for use by the Company,as they represent corresponding unpaid liabilities.
Notes :
1. The above cashfl ow statement has been prepared under indirect method as per Accounting Standard-3 "Cash FlowStatement"
2. Cash and Cash equivalents for the purpose of cash fl ow statements comprise of cash at Bank and in Hand and short term investments with an original maturity of three months or less.
Directors
As per our report of even date
For S.R. Batliboi & Co.LLP For and on behalf of the Board of Directors
Chartered AccountantsICAI Firm Registration No. 301003E Suresh Gupta A.Venkatrangan Chairman & Managing Director Executive Director
per Vijay Maniar Parag Vyavahare Jukka MoisioPartner Chief Financial Offi cer Johann SippelMembership No. 36738 Ramesh Kumar Dhir Anand Daga Nripjit Singh ChawlaMumbai Company Secretary & Head Legal S.K.Palekar18 February 2014 Mumbai, 18 February 2014 P.V.Narayana

0268 64th Annual Report & Accounts 2013
NOTE 1 - SIGNIFICANT ACCOUNTING POLICIESA . GROUP INFORMATION Subsidiary considered in this Consolidated Financial Statement-
Name of the Company Country of Incorporation % of Ownership at 31st December 2013
% of Ownership at 31st December 2012
Webtech Labels Private Limited
India 51% 51%
The fi nancial statements of subsidiary considered in consolidated accounts are drawn upto the same date i.e. 31 December 2013
B . PRINCIPLES OF CONSOLIDATION The consolidated fi nancial statements relate to The Paper Products Limited ( ’the company’ ) and its subsidiary company
(hereinafter referred as ”the Group”). The consolidated fi nancial statements have been prepared on the following basis.
• The fi nancial statements of the Company and its subsidiary company have been consolidated on line-by-line basis by adding together the book values of like items of assets,liabilities,income and expenses, after fully eliminating intra-group balances and intra-group transactions in accordance with Accounting Standard (AS) 21-”Consolidated Financial Statements” as notifi ed by Companies (Accounting Standards) Rules 2006 (as amended).
• The difference between the cost of investement in the subsidiary and the company’s share of equity on the date of acquisition of shares in the subsidiary is recognised in the fi nancial statement as Goodwill or Capital Reserve as the case may be.
• Minority Interest’s share of net profi t of consolidated subsidiary for the year is identifi ed and adjusted against the income of the group in order to arrive at the net income attributable to shareholders of the company.
• Minority Interest’s share of net assets of Consolidated subsidiary is identifi ed and presented in the consolidated balance sheet separate from liabilities and the equity of the company’s shareholders.
• The consolidated fi nancial statements are prepared using uniform accounting policies for like transactions and other events in similar circumstances and are presented in the same manner as the company’s seperate fi nancial statements.
C. OTHER SIGNIFICANT ACCOUNTING POLICIES a. Basis of Preparation of Financial Statements The fi nancial statements have been prepared under the historical cost convention (with the exception of freehold
land which has been revalued and derivative fi nancial instruments which have been measured at fair value),on the accrual basis of accounting and comply with the Companies (Accounting Standards) Rules 2006 (as amended) issued by the Central Government and relevant provisions of the Companies Act, 1956 to the extent applicable.The accounting policies have been consistently followed by the Group.
b. Use of Estimates The fi nancial statements are prepared in accordance with generally accepted accounting principles (GAAP) in
India which requires management to make estimates and assumptions that affect the reported amounts of assets, liabilities and disclosure of contingent liabilities.The estimates and assumptions used in the accompanying fi nancial statements are based upon management’s evaluation of the relevant facts and circumstances as of the date of the fi nancial statements which in management’s opinion are prudent and reasonable. Actual results may differ from the estimates and assumptions used in preparing the accompanying fi nancial statements. Any revision to accounting estimates is recognized prospectively in current and future periods.
c. Fixed Assets • Fixed assets are stated at cost ( or revalued amounts as the case may be) less accumulated depreciation
& impairment losses,if any.Cost of fi xed assets comprises of purchase price, duties, levies and any directly attributable cost of bringing each asset to its working condition for the intended use.
• Financing costs relating to borrowed funds attributable to the acquisition of qualifying fi xed assets upto the completion of construction or acquisition of such fi xed assets are included in the gross book value of the asset.
• Cenvat credit availed for excise duty and countervailing duty availed for customs duty payments made on fi xed assets is reduced from the cost of fi xed assets.
• Machinery spares which are specifi c to a particular item of fi xed asset and whose use is expected to be irregular are capitalised and depreciated over the residual useful life of the asset.
• Capital work-in-progress includes the cost of fi xed assets that are not ready to use at the balance sheet date.
NOTES TO THE CONSOLIDATED FINANCIAL STATEMENTSFor the year ended 31st December 2013

64th Annual Report & Accounts 2013 0169
d. Intangibles Intangible Assets acquired seperately are measured on intial recognition at cost. Following, intial recognition,
intangible assets are carried at cost less accumulated amortization and accumulated impairment losses, if any. Internally generated intangible assets, excluding capitalized development costs, are not capitalized and expenditure is refl ected in the statement of profi t and loss in the year in which the expenditure is incurred.
e. Depreciation i. Tangible Assets Buildings are depreciated on written down value method at the rates prescribed in Schedule XIV to the
Companies Act, 1956 which coincide with management estimate of useful life except those specifi ed below Other fi xed assets are depreciated on straight line method at the rates prescribed in Schedule XIV to the
Companies Act, 1956 except those specifi ed below. Following assets are depreciated at the rates higher than those prescribed in Schedule XIV to the Companies
Act, 1956 as in management’s judgement, their estimated useful lives are shorter than those prescribed under Schedule XIV to the Companies Act, 1956.
Assets Method of Depreciation Rate
Computers Straight Line Method 25.00%
Motor Vehicles Straight Line Method 19.00%
General Furniture Straight Line Method 9.50%
Offi ce and Other Equipments Straight Line Method 19.00%
Cellphones and Photocopiers Straight Line Method 31.67%
Airconditioning Equipment used in manufacturing process
Straight Line Method 10.34%
Administrative Buildings Written Down Value Method 10.00%
Electrical Fittings Straight Line Method 10.34% Depreciation on additions/deletions to fi xed assets is provided prorata from the date of addition/till the date of
deletion. Leasehold Land - Premium paid for acquisition of leasehold land is amortised over the period of lease,viz 99
years. ii. Intangible Assets ERP software is amortised over a period of 60 months commencing from the month in which software is put
to use. Specialised software is amortised over a period of 36 months commencing from the month in which such
expenditure is incurred. All upgradations/enhancements are generally charged to profi t and loss account,unless they bring signifi cant additional benefi ts.
Goodwill is amortised over a period of 10 years. Corporate club membership fees paid are amortised over the period of use, viz 10 years. Non compete fees paid are amortised over the period of restriction, viz 3/5 years.
f. Goodwill on Consolidation Goodwill arising on Consolidation is valued at cost, and provision is made for impairment if applicable.
g. Foreign Currency Transactions • Transactions denominated in foreign currency are recorded at the exchange rate prevailing on the date of
transactions. Exchange differences arising on foreign exchange transactions settled during the year are recognized in the profi t and loss account of the year.
• Monetary assets and liabilities in foreign currency, which are outstanding as at the year-end are translated at the year end at the closing exchange rate and the resultant exchange differences are recognised in the profi t and loss account.
• Non-monetary foreign currency items are carried at cost. • The premium or discount on forward exchange contracts covered by AS-11 The Effects of Changes in Foreign
Exchange Rates is recognised over the period of the contracts in the profi t and loss account. Exchange gain or loss on forward exchange contracts covered by AS-11 The Effects of Changes in Foreign Exchange Rates is recognised in the profi t and loss account.
• In compliance with the Institute of Chartered Accountants of India (ICAI) announcement dated 29th March,2008 on accounting for derivatives, the mark to market valuation loss on forward contracts entered into, to cover the forecast transactions is charged to profi t and loss account. Gain on Mark to Market valuation is ignored.
NOTES TO THE CONSOLIDATED FINANCIAL STATEMENTSFor the year ended 31st December 2013

0270 64th Annual Report & Accounts 2013
h. Inventories • Inventories are valued at lower of cost and net realisable value. • Raw materials,Components,Stores and Spares held for use in production of Inventories are not written down
below cost if the fi nished products in which they will be incorporated are expected to be sold at or above cost. • The cost of manufactured inventories and Work-In-Process is the direct cost of manufacture plus appropriate
allocated overheads & excise duty wherever applicable. Cost is determined on Weighted Average Method. • The cost of bought out inventory is computed using the Weighted Average Method. • The cost of loose tools is amortised over its estimated useful life. i. Revenue Recognition • Revenue is recognised to the extent it is probable that the economic benefi ts will fl ow to the Group and
revenue can be reliably measured. It is recognised when signifi cant risks and rewards of ownership of goods have passed to the buyer.
• Gross sales are inclusive of Excise Duty. • Sales are net of returns and discounts • Dividend income is recognised when the right to receive dividend is unconditional at the balance sheet date. • Interest on investments is accounted on a time proportion basis taking into account the amounts invested and
the rate of interest. j. Retirements Benefi ts i. Defi ned Contribution Plans: Contributions payable to the recognised provident fund, which is a defi ned contribution plan, are charged to
the profi t and loss account as incurred. ii. Defi ned Benefi t Plans : The Group’s gratuity benefi t scheme is a defi ned benefi t plan. The Group’s net obligation in respect of the
gratuity benefi t scheme is calculated by estimating the amount of future benefi t that employees have earned in return for their service in the current and prior periods; that benefi t is discounted to determine its present value, and the fair value of any plan assets is deducted.
The present value of the obligation under such defi ned benefi t plans is determined based on actuarial valuation using the Projected Unit Credit Method, which recognises each period of service as giving rise to additional unit of employee benefi t entitlement and measures each unit separately to build up the fi nal obligation.
The obligation is measured at the present value of the estimated future cash fl ows. The discount rates used for determining the present value of the obligation under defi ned benefi t plans are based on the market yields on Government securities as at the balance sheet date.
When the calculation results in a benefi t to the Group, the recognized asset is limited to the lower of the net total of the present value of the defi ned benefi t obligation at the balance sheet date minus any past service cost minus fair value of plan assets as at balance sheet date and the present value of any future refunds from the plan or reductions in future contributions to the plan.
Actuarial gains and losses are recognised immediately in the profi t and loss account. iii. Other Long Term Employment Benefi ts : Compensated absences which are not expected to occur within twelve months after the end of the period in
which the employee renders the related services are determined on the basis of valuations, as at balance sheet date, carried out by an independent actuary using Projected Unit Credit Method. Actuarial gains and losses comprise experience adjustments and the effects of changes in actuarial assumptions and are recognised immediately in the Profi t and Loss Account.
iv. Other Short Term Employment Benefi ts: Group provides short term benefi t of sick leave to its employees with certain accumulation provisions and
same being short term and expected to be utilised within twelve months are provided on undiscounted basis. k. Investments • Investments, which are readily realisable and intended to be held for not more than one year from the date on
which such Investments are made, are classifi ed as current Investments. All other Investments are classifi ed as Long Term Investments.
• Long term investments are valued at cost and an appropriate provision is made for diminution, which is other than temporary, in their value.
• Current investments are valued at cost or market value, whichever is lower. l. Research Expenditure Research expenditure of a revenue nature is charged off in the year in which it is incurred and expenditure of a
capital nature is capitalised to fi xed assets.
NOTES TO THE CONSOLIDATED FINANCIAL STATEMENTSFor the year ended 31st December 2013

64th Annual Report & Accounts 2013 0171
m. Taxation Income tax expense comprises current income tax (i.e. amount of tax for the period determined in accordance
with the income tax law) and deferred tax charge or credit (refl ecting the tax effects of timing differences between accounting income and taxable income for the period). The deferred tax charge or credit and the corresponding deferred tax liabilities or assets are recognized using the tax rates and tax laws that have been enacted or substantively enacted by the balance sheet date. Deferred tax assets and deferred tax liabilities are offset at entity level, if a legally enforceable right exists to set off current tax assets against current tax liabilities and the deferred tax assets and deferred tax liabilities relate to the taxes on income levied by same governing taxation laws.Deferred tax assets are recognized only to the extent there is reasonable certainty that the assets can be realized in future; however, where there is unabsorbed depreciation or carried forward loss under taxation laws, deferred tax assets are recognized only if there is a virtual certainty of realization of such assets. Deferred tax assets are reviewed at each balance sheet date and written down or written up to refl ect the amount that is reasonably/virtually certain (as the case may be) to be realized.
Minimum alternate tax (MAT) paid in a year is charged to the statement of profi t and loss as current tax. The individual entity recognizes MAT credit available as an asset only to the extent that there is convincing evidence that it will pay normal income tax during the specifi ed period, i.e., the period for which MAT credit is allowed to be carried forward. In the year in which individual entity recognizes MAT credit as an asset in accordance with the Guidance Note on Accounting for Credit Available in respect of Minimum Alternative Tax under the Income-tax Act, 1961, the said asset is created by way of credit to the statement of profi t and loss and shown as “MAT Credit Entitlement.” The individual entity reviews the “MAT Credit Entitlement” asset at each reporting date and writes down the asset to the extent the individual entity does not have convincing evidence that it will pay normal tax during the specifi ed period.
n. Leases Operating Leases
Lease payments under operating leases are recognised as an expense in the statement of profi t and loss account on a straight line basis over the lease term.
o. Impairment of Assets The carrying amounts of assets are reviewed at each balance sheet date if there is any indication of impairment
based on internal / external factors. An impairment loss is recognised wherever the carrying amount of an asset exceeds its recoverable amount. The recoverable amount is the greater of the asset’s net selling price and value in use.In assessing value in use, the estimated future cash fl ows are discounted to their present value using a pre-tax discount rate that refl ects current market assessments of the time value of money and risks specifi c to the assets. After impairment, depreciation is provided on their revised carrying amount of the asset over its remaining useful life.
p. Government Grants and subsidies Grants and Subsidies from the Governments are recognised when there is a reasonable assurance that (i) the
company will comply with the conditions attached to them, and (ii) the grants / subsidy will be received.
Government Grants of the nature of Promoter Contribution are credited to Capital Reserve and treated as part of the Shareholders Funds
q. Provisions and Contingent Liabilities The Group creates a provision when there is present obligation as a result of a past event that probably requires
an outfl ow of resources and a reliable estimate can be made of the amount of the obligation. A disclosure for a contingent liability is made when there is a possible obligation or a present obligation that may, but probably will not, require an outfl ow of resources. When there is a possible obligation or a present obligation in respect of which the likelihood of outfl ow of resources is remote, no provision or disclosure is made.
Provisions are reviewed at each balance sheet date and adjusted to refl ect the current best estimate. If it is no longer probable that an outfl ow of resources would be required to settle the obligation, the provision is reversed.
Contingent assets are not recognized in the fi nancial statements. However, contingent assets are assessed continually and if it is virtually certain that an infl ow of economic benefi ts will arise, the asset and related income are recognized in the period in which the change occurs.
r. Earnings Per Share ( EPS)
Basic EPS is computed by dividing the net profi t for the period attributable to the equity shareholders by the weighted average number of equity shares outstanding during the period. Diluted EPS is computed using the weighted average number of equity and dilutive equity equivalent shares outstanding during the period, except where the results would be anti dilutive.
NOTES TO THE CONSOLIDATED FINANCIAL STATEMENTSFor the year ended 31st December 2013

0272 64th Annual Report & Accounts 2013
a Reconciliation of the shares outstanding at the beginning & at the end of the reporting period.
31 December 2013 31 December 2012
Nos. $ in lac Nos. $ in lac
At the beginning of the period 62,687,190 1,253.74 62,687,190 1,253.74
Outstanding at the end of the period 62,687,190 1,253.74 62,687,190 1,253.74
b Terms /rights attached to equity shares.
The company has only one class of Issued, Subscribed & Paid up Equity Capital having a par value of $ 2/- per share. Each holder of equity shares is entitled to one vote per share. The company declares and pays dividends in Indian rupees. The dividend proposed by the Board of Directors is subject to the approval of the shareholders in the ensuing Annual General Meeting.
During the year ended 31st December 2013, the amount of per share dividend recognised as distributions to equity shareholders was $2.80 (31 December 2012 : Rs.2.60)
In the event of liquidation of the Company, the holders of equity shares will be entitled to receive remaining assets of the Company, after distribution of all Preferential amounts. The distribution will be in proportion to the number of equity shares held by the share holders.
c Shares held by holding company
Out of equity shares issued by the company,shares held by its holding company are as follows :
31 December 2013 31 December 2012
Nos. $ in lac Nos. $ in lac
Huhtavefa B.V., Netherlands,The Holding Company 38,095,166 761.90 38,095,166 761.90
($ in lac)
31 December 2013 31 December 2012
2 SHARE CAPITAL
AUTHORISED CAPITAL
150,000,000 (Previous Year 150,000,000)
Equity shares of a 2/- each 3,000.00 3,000.00
700,000 (Previous Year 700,000) 12% Redeemable
Cumulative Preference Shares of a 100/- each 700.00 700.00
300,000 (Previous Year 300,000) Unclassifi ed
Shares of a 100/- each 300.00 4,000.00 300.00 4,000.00
4,000.00 4,000.00
ISSUED SUBSCRIBED AND PAID-UP CAPITAL
62,687,190 (Previous Year: 62,687,190) Equity
Shares of a 2/- each fully paid-up. 1,253.74 1,253.74
Add : Amount Received on 1,449 (Previous Year 1,449)
forfeited Shares. 0.09 1,253.83 0.09 1,253.83
TOTAL 1,253.83 1,253.83
NOTES TO THE CONSOLIDATED FINANCIAL STATEMENTSFor the year ended 31st December 2013

64th Annual Report & Accounts 2013 0173
(R in lac)
31 December 2013 31 December 2012
Nos.% holding
in the class
Nos.% holding
in the class
dDetails of Shareholders holding more than 5% shares in the company.
Equity shares of $2/- each fully paid up.
Huhtavefa B.V., Netherlands,The Holding Company. 38,095,166 60.77% 38,095,166 60.77%
HDFC Trustee Company Limited 3,330,525 5.31% 3,330,525 5.31%
As per the records of the company,including its register of shareholders/members and other declarations received from shareholders regarding benefi cial interest, the above shareholding represents both legal and benefi cial ownerships of shares.
31 December 2013 31 December 2012
3 RESERVES AND SURPLUS
Capital Redemption Reserve 700.00 700.00 Securities Premium Account 7,936.32 7,936.32 Revaluation Reserve 275.77 275.77 Capital Reserve 30.00 – (Capital subsidy received from State Government of Uttaranchal in respect of investment in setting up of Plant at Rudrapur)General Reserve
Balance as per last Balance sheet 7,783.75 7,333.47 Add: Amount transferred from Surplus balance in the Statement of Profi t and Loss
545.31 8,329.06 450.28 7,783.75
Surplus in the statement of Profi t & Loss Balance as per last fi nancial statement 17,546.35 15,383.39Profi t for the year 5,620.74 4,507.52 Less : AppropriationsProposed Final Equity Dividend (Amount per share a 2.80 (31st December, 2012 a 2.60)) (1,755.24) (1,629.87)Tax on Proposed Equity Dividend (298.30) (264.41)Differential Tax on dividend for previous year. (12.59) – Transferred to General Reserve (545.31) (450.28)Net Surplus in the statement of Profi t & Loss 20,555.64 17,546.35
Total Reserves and Surplus 37,826.80 34,242.19
31 December 2013 31 December 2012
4 LONG - TERM BORROWINGS
Deferred sales tax loan (Unsecured) 1,921.06 2,061.47
Indian Rupee loan from bank (secured) 2,070.38 1,364.88
3,991.44 3,426.35
The Group has availed of unsecured interest free Sales tax deferred loan from the Government of Andhra Pradesh for its Hyderabad (Bollaram) factory, in accordance with their sales tax deferral scheme. The above amount is repayable after 14 years from the date of availment of the loan. The loan is repayable annualy on 1st April with 1st instalment due on 1st April 2011 and last one being due on 1st April 2021.
NOTES TO THE CONSOLIDATED FINANCIAL STATEMENTSFor the year ended 31st December 2013

0274 64th Annual Report & Accounts 2013
(R in lac)
31 December 2013 31 December 2012
The scheduled maturity of Deferred Sales Tax loan is summarised below.
In the next one year 140.41 97.77
In the second year 191.55 140.41
In the 3rd to 5th year 818.13 729.04
After 5 years 911.39 1,192.02
Indian rupee loan from bank carries interest @ Prime Lending Rate (PLR) less 5% p. a., The loan is repayable in 60 monthly installments of $ 60.84 lacs each along with interest, from the date of loan. The loan is secured by hypothecation of Machinery of Webtech Labels Pvt Ltd.
31 December 2013 31 December 2012
5 DEFERRED TAX (ASSET)/LIABILITY (NET)
Deferred Tax Asset
Deferred Tax
Liability
Deferred Tax Asset
Deferred Tax
Liability
Deferred Tax Liability arising on account of timing differences in :
-Depreciation – 476.75 – 401.21
– 476.75 – 401.21
Deferred Tax Asset arising on account of timing differences in :
-Unabsorbed losses* 30.22 – 10.95 –
-Provision for doubtful debts 47.40 – 58.03 –
-Provision for retirement benefi ts 152.65 – 145.93 –
-Effect of expenditure debited to Profi t & Loss account but allowed for Tax purposes in following years
147.79 – 118.53 –
Deferred Tax (Asset)/Liability (Net) 378.06 476.75 333.44 401.25
(*) Recognised on account of reversible timing differences.
98.69 67.77
Disclosed as under
Deferred Tax Liability (Net) 102.00 67.77
Deferred Tax Assets (Net) 3.31 –
98.69 67.77
31 December 2013 31 December 2012
6 LONG TERM PROVISIONS
Provision for Employee Benefi ts 127.38 151.79
Provision for Employee Benefi ts (Refer note 35)
127.38 151.79
NOTES TO THE CONSOLIDATED FINANCIAL STATEMENTSFor the year ended 31st December 2013

64th Annual Report & Accounts 2013 0175
(R in lac)
31 December 2013 31 December 2012
7 SHORT TERM BORROWINGS
Cash Credit from Banks (secured) 58.61 1,051.90
Other Unsecured Loan – 354.30
58.61 1,406.20
Cash credit from banks is secured against hypothecation of stock and book debts. The cash credit carries interest @ PLR less 5% p.a.Other unsecured loan carries interest @ 9% p.a., the loan is repayable on demand which has been repaid in the current year.
31 December 2013 31 December 2012
8 TRADE PAYABLES
Trade Payables 14,854.81 12,824.58
14,854.81 12,824.58
31 December 2013 31 December 2012
9 OTHER CURRENT LIABILITIES
Unclaimed dividend* 57.24 50.66
Advance from Customers 223.17 90.53
Employee Benefi ts payable 1,200.90 987.29 Employee Statutory Liabilities payable 78.00 70.64 Taxes payable 342.62 302.38 TDS Payable 83.50 68.77 Creditors for capital goods 398.67 370.11 Current maturity of Long Term Borrowings (Refer note 4) 570.36 353.69 Interest accrued and due on Borrowings – 4.78 Others 41.28 22.23
2,995.74 2,321.08
* There is no amount due and outstanding to be credited to Investor Education & Protection Fund.
31 December 2013 31 December 2012
10 SHORT TERM PROVISIONS
Provision for Income Tax (Net of Advance Tax ) 138.41 245.93 Provision for Employee Benefi ts (Refer note 35) 394.51 387.59 Provision for Mark to Market Losses on Derivative Contracts 75.04 27.39 Provision for Losses on Derivative Contracts (as per AS 11-Revised)
80.99 23.11
Provision for Litigations 287.26 266.57 Proposed Equity dividend 1,755.24 1,629.87
Provision for Tax on Proposed Equity Dividend 298.30 264.41
3,029.75 2,844.87
Provision for Litigations Opening Balance 266.57 205.24 Arising during the year 166.47 84.33
Unused amount reversed/utilised during the year (145.78) (23.00)
At the end of the year 287.26 266.57
Provision for Litigation represents provision made by the group in respect of disputed Indirect Tax matters.
NOTES TO THE CONSOLIDATED FINANCIAL STATEMENTSFor the year ended 31st December 2013

0276 64th Annual Report & Accounts 2013
($ in
lac)
11. F
IXE
D A
SS
ET
S
G
RO
SS
BL
OC
KA
CC
UM
UL
AT
ED
DE
PR
EC
IAT
ION
/ A
MO
RT
ISA
TIO
NN
ET
BL
OC
K
Des
crip
tio
nO
rig
inal
Co
st a
s at
01-0
1-20
13
Add
ition
sD
urin
g th
e Y
ear
Del
etio
nsD
urin
gth
e y
ear
Ori
gin
alC
ost
as
at31
-12-
2013
Op
enin
gB
alan
ce a
s at
01-
01-
2013
On
Dele
tions
Du
ring
The
Year
Ch
arg
efo
r th
eY
ear
Clo
sin
gB
alan
ce a
t 3
1/12
/201
3
Bal
ance
as a
t31
/12/
2013
Bal
ance
as a
t31
/12/
2012
TA
NG
IBL
E
AS
SE
TS
Land
- F
reeh
old
522
.66
–
– 5
22.6
6 –
–
–
– 5
22.6
6 5
22.6
6
-
Lea
seho
ld 2
59.4
5 –
– 2
59.4
5 2
1.06
–
2.8
8 2
3.94
2
35.5
1 2
38.3
9
Bui
ldin
gs 6
,926
.97
88.
98
25.
69
6,9
90.2
6 3
,256
.04
24.
13
366
.12
3,5
98.0
3 3
,392
.23
3,6
70.9
3
Mac
hine
ry 4
1,90
6.20
2
,502
.51
430
.42
43,
978.
29
26,
910.
20
422
.26
3,1
19.3
6 2
9,60
7.30
1
4,37
0.99
1
4,99
6.00
Com
pute
rs 8
43.1
7 1
13.4
8 4
2.69
9
13.9
6 6
93.7
3 4
1.91
9
1.12
7
42.9
4 1
71.0
2 1
49.4
4
Mot
or v
ehic
les
199
.05
10.
80
18.
63
191
.22
116
.70
17.
90
30.
12
128
.92
62.
30
82.
35
Furn
iture
, fi x
ture
s 8
29.4
9 1
80.5
1 1
5.60
9
94.4
0 4
76.4
8 1
5.24
6
8.65
5
29.8
9 4
64.5
1 3
53.0
1
Offi
ce E
quip
men
ts
287
.31
96.
32
20.
77
362
.86
215
.55
20.
53
27.
89
222
.91
139
.95
71.
76
Su
b T
ota
l 5
1,77
4.30
2
,992
.60
553
.80
54,
213.
10
31,
689.
76
541
.97
3,7
06.1
4 3
4,85
3.93
1
9,35
9.17
2
0,08
4.54
INTA
NG
IBLE
A
SS
ETS
Non
com
pete
Fee
s 6
89.0
0 –
2
00.0
0 4
89.0
0 2
58.2
7 2
00.0
0 1
07.8
0 1
66.0
7 3
22.9
3 4
30.7
3
Com
pute
rS
oftw
ares
1,2
37.4
3 1
05.7
1 1
6.96
1
,326
.18
849
.02
16.
96
240
.33
1,0
72.3
9 2
53.7
9 3
88.4
1
Clu
b M
embe
rshi
p 5
5.15
–
–
55.
15
12.
60
–
5.5
1 1
8.11
3
7.04
4
2.55
Goo
dwill
1
,419
.56
–
– 1
,419
.56
24.
89
– 1
41.9
6 1
66.8
5 1
,252
.71
1,3
94.6
7
Su
b T
ota
l 3
,401
.14
105
.71
216
.96
3,2
89.8
9 1
,144
.78
216
.96
495
.60
1,4
23.4
2 1
,866
.47
2,2
56.3
6
Gra
nd
To
tal
55,
175.
44
3,0
98.3
1 7
70.7
6 5
7,50
2.99
3
2,83
4.54
7
58.9
3 4
,201
.74
36,
277.
35
21,
225.
64
22,
340.
90
Pre
vio
us
year
46,
831.
29
8,5
59.0
9 2
14.9
4 5
5,17
5.44
2
9,43
8.67
1
92.9
5 3
,588
.82
32,
834.
54
22,
340.
90
A
s A
t 31
st D
ecem
ber
201
3A
s A
t 31
st D
ecem
ber
201
2
Ori
gin
al
Co
st
Wri
tten
D
ow
n V
alu
eO
rig
inal
C
ost
W
ritt
en
Do
wn
Val
ue
1B
uild
ings
incl
ude
a.
Bui
ldin
gs o
n le
aseh
old
land
1,97
0.87
1
,970
.87
b.O
wne
rshi
p fl a
ts in
Co-
oper
ativ
e S
ocie
ties
on fr
eeho
ld la
nd 2
12.6
2 2
12.6
2 c.
O
wne
rshi
p fl a
ts in
Co-
oper
ativ
e S
ocie
ties
on le
aseh
old
land
61.
78
61.
78
2M
achi
nery
inc
lude
s E
lect
rical
Fitt
ings
bei
ng e
xpen
ditu
re i
ncur
red
on i
nsta
lling
ove
rhea
d lin
e &
m
eter
ing
yard
for
lay
ing
high
ten
sion
lin
e fo
r dr
awin
g po
wer
fro
m C
entr
al P
ower
Dis
trib
utio
n C
ompa
ny o
f A
ndhr
a P
rade
sh L
td's
Grid
to
the
Hyd
erab
ad p
lant
tho
ugh
owne
rshi
p of
the
sam
e ve
sts
with
Cen
tral
Pow
er D
istr
ibut
ion
Com
pany
of A
ndhr
a P
rade
sh L
td 1
3.60
3
.64
13.
60
5.0
4
3 F
reeh
old
Land
at T
hane
was
rev
alue
d on
31.
07.1
985
base
d on
inde
pend
ent v
alua
tion
repo
rt.T
he h
isto
rical
cos
t of F
reeh
old
Land
fair
valu
ed b
y th
e C
ompa
ny
was
a 1
.29
lacs
and
the
fair
valu
e w
as a
277
.06
lacs
. Hen
ce th
e re
valu
atio
n re
sulte
d in
an
incr
ease
in th
e va
lue
of F
reeh
old
Land
by
a 27
5.77
lacs
NOTES TO THE CONSOLIDATED FINANCIAL STATEMENTSFor the year ended 31st December 2013

64th Annual Report & Accounts 2013 0177
($ in lac)
31 December 2013 31 December 2012
12 NON-CURRENT INVESTMENTS
Trade Investments (Valued at cost unless stated otherwise)
Unquoted Equity Instruments
100 Equity shares of $ 25/- each fully paid up in Shamrao Vithal Co-op Bank Ltd
0.03 0.03
0.03 0.03
31 December 2013 31 December 2012
13 LONG TERM LOANS & ADVANCES
Capital Advances
Unsecured,Considered good 306.36 208.50
Security Deposit
Unsecured,Considered good 427.29 253.21
Advances recoverable in Cash or in Kind
Unsecured considered good 27.82 35.13
Other loans & advances (Unsecured considered good)
Advance Income Tax (Net of Provision) 157.65 98.28
Advance Fringe Benefi t Tax (Net of Provision) 21.01 21.01
MAT Credit entitlement 75.20 7.57
Loans/Advances to Staff 20.39 19.06
Prepaid Expenses 7.91 3.38
Balances with Customs, Excise and Sales Tax Authorities etc 632.20 508.66
1,675.83 1,154.80
31 December 2013 31 December 2012
14 OTHER NON-CURRENT ASSETS
Unsecured,considered good unless stated otherwise.
Margin Money deposit 2.48 60.00
Non - Current bank balances being Deposits with original maturity of more than 12 months
1.01 1.02
Others
Export Rebate Receivables
Recoverable from Gratuity Trust
290.54
133.99
290.54
80.10
428.02 431.66
NOTES TO THE CONSOLIDATED FINANCIAL STATEMENTSFor the year ended 31st December 2013

0278 64th Annual Report & Accounts 2013
($ in lac)
31 December 2013 31 December 2012
15 CURRENT INVESTMENTS (valued at lower of cost & fair value,unless stated otherwise)
Face Value
Nos. Amount Nos. Amount
UNITS OF MUTUAL FUNDS-UNQUOTED
Reliance Medium Term fund - Daily Dividend Plan 10 – – 1,833,273 313.66
UTI Short Term Income Fund Institutional Dividend Plan 10 – – 4,275,491 464.85
Templeton India Ultra Short Bond Fund-Super Institutional Plan
10 – – 7,370,675 738.21
DWS Ultra Short Term Fund- IP-Daily Dividend 10 – – 9,310,415 932.71
Sundaram Ultra Short Term Fund Super Institutional 10 – – 11,287,726 1,132.95
Birla Sun Life Dynamic Bond Fund-Retail-Quarterly Dividend Reinvestment
10 – – 2,615,838 300.00
Birla Sun Life Short Term Fund-Monthly Dividend Reinvestment
10 – – 2,596,431 302.35
ICICI Prudential Short Term Plan -DDR Fortnightly 10 – – 2,523,476 302.29
Templeton India Low Duration Fund- MDR 10 – – 5,263,623 545.59
SBI Short term Debt Fund - Weekly Dividend 10 – – 2,875,511 302.83
JP Morgon India Treasury Fund Super Inst.-DDR 10 – – 7,018,770 702.44
Reliance Liquid fund Treasury Plan- Daily Dividend Re-investment
1,529 58,141 888.84 – –
Kotak fl oater Short Term -Daily Dividend Re-investment 1,012 98,887 1,000.39 – –
ICICI Prudential Money Market Fund-DDR 100 199,925 200.19 – –
Birla Sun Life Floating Rate Fund-STP-DDR 100 346,535 346.61 – –
Sundaram Money Fund Regular -DDR 10 8,839,948 892.44 – –
Birla Sun Life Cash Plus -DDR 100 503,170 504.16 – –
ICICI Prudential Liquid -Reg-DDR 100 734,455 734.84 – –
HDFC Liquid Fund - DDR 10 8,941,684 911.91 – –
TOTAL 5,479.38 6,037.88
Net Asset Value of Mutual fund Units 5,479.38 6,041.06
31 December 2013 31 December 2012
16 INVENTORIES (Valued at lower of cost and net realizable value)
Raw Materials and Components [includes in transit $ 207.05 lac 2012 (31 December, 2012 $ 224.81lac)]
5,572.05 4,969.96
Work in Process 1,304.58 1,432.66
Finished Goods 795.51 903.13
Stores & Spares 700.55 573.13
Loose Tools 975.61 982.96
9,348.30 8,861.84
NOTES TO THE CONSOLIDATED FINANCIAL STATEMENTSFor the year ended 31st December 2013

64th Annual Report & Accounts 2013 0179
($ in lac)
31 December 2013 31 December 2012
17 TRADE RECEIVABLES
Trade Receivables (Unsecured)
Outstanding for more than Six Months from the date they are due for payment.
Considered Good – 30.93
Considered Doubtful 161.87 205.20
161.87 236.13
Less:Provision for Doubtful Receivables 161.87 205.20
– 30.93
Other Receivables
Considered Good 20,868.57 15,856.09
Considered Doubtful 10.87 6.88
20,879.44 15,862.97
Less:Provision for Doubtful Receivables 10.87 6.88
20,868.57 15,856.09
20,868.57 15,887.02
31 December 2013 31 December 2012
18 CASH AND CASH BALANCES
Cash and Cash Equivalents
Balances with Banks
On Current Accounts 1,485.05 1,243.98
On Unpaid Dividend Accounts 57.24 50.66
Deposits with original maturity of less than three months 3.75 148.50
Cheques on Hand 19.97 18.07
Cash on Hand 13.94 14.73
1,579.95 1,475.94
31 December 2013 31 December 2012
19 SHORT TERM LOANS & ADVANCES
Security Deposit
Unsecured,Considered good 28.91 28.50
Advances recoverable in Cash or in KindUnsecured,Considered good 314.56 191.30
Other loans & advances (Unsecured considered good)
Loans/Advances to Staff 52.33 56.84
Prepaid Expenses 197.96 197.07
Balances with Customs, Excise, and Sales Tax Authorities etc 612.09 380.42
1,205.85 854.13
NOTES TO THE CONSOLIDATED FINANCIAL STATEMENTSFor the year ended 31st December 2013

0280 64th Annual Report & Accounts 2013
($ in lac)
31 December 2013 31 December 2012
20 OTHER CURRENT ASSETS
Unsecured,considered good unless stated otherwise.
Un-amortised premium on forward contract 26.47 27.67
DEPB Licences available 281.84 8.46
Others
Claims recoverable 312.20 224.80
Export Rebate Receivables 687.03 681.15
Interest Accrued on Investments & Fixed Deposits 0.35 0.46
Recoverable from Gratuity Trust 75.92 –
1,383.81 942.54
31 December 2013 31 December 2012
21 REVENUE FROM OPERATIONS
Revenue from operations
Sale of Products
Finished Goods 114,801.43 95,415.43
Less : Excise Duty on Sales 7,321.78 6,098.01
107,479.65 89,317.42
Other operating Revenue
Scrap Sales 928.41 741.31
Compensation Received 141.98 –
Revenue from Operations (net) 108,550.04 90,058.73
31 December 2013 31 December 2012
22 OTHER INCOME
Interest Income on
Bank Deposits 10.17 2.08
Others 12.07 9.55
Dividend Income on Current Investments 327.59 569.65
Net gain on sale of Investments 3.64 0.85
Other non-operating income
Rent 3.87 3.76
Profi t on Sale of Fixed Assets (Net) 7.46 5.82
Doubtful Debts Provision Written Back 39.35 –
Insurance claim Received 11.57 44.08
Other Non Operating Income (net of expenses) 74.55 190.08
490.27 825.87
31 December 2013 31 December 2012
23 COST OF RAW MATERIALS AND COMPONENTS CONSUMED
Inventory at the beginning of the year 4,969.96 4,236.81
Add : Purchases 75,589.13 62,856.73
80,559.09 67,093.54
Less : Inventory at the end of the year 5,572.05 4,969.96
Cost of raw material and components consumed 74,987.04 62,123.58
NOTES TO THE CONSOLIDATED FINANCIAL STATEMENTSFor the year ended 31st December 2013

64th Annual Report & Accounts 2013 0181
31 December 2013 31 December 2012
24 CHANGES IN INVENTORIES OF FINISHED GOODS AND WORK IN PROCESS
Inventories at the end of the year
Work in Process 1,304.58 1,432.66
Finished Goods 795.51 903.13
2,100.09 2,335.79
Inventories at the beginning of the year
Work in Process 1,432.66 1,998.34
Finished Goods 903.13 674.88
2,335.79 2,673.22
235.70 337.43
Changes in Inventories of Finished Goods and Work-in-Process
Excise Duty on Changes in Inventories of Finished Goods
Excise Duty on Closing Finished Goods Stock 88.53 81.43
Less: Excise Duty on Opening Finished Goods Stock 81.43 7.10 51.76 29.67
Net (Increase) / Decrease in Inventories 242.80 367.10
31 December 2013 31 December 2012
25 EMPLOYEE BENEFIT EXPENSES
Salaries, Wages and Bonus 7,219.92 6,067.48
Contribution to Provident and Other Fund 317.35 347.15
Staff welfare Expenses 872.55 683.69
8,409.82 7,098.32
31 December 2013 31 December 2012
26 FINANCE COST
Interest
- To Banks 303.19 41.40
- To Others 13.86 9.61
Foreign Exchange Difference on Borrowings 44.85 –
Bank Charges 13.09 8.05
374.99 59.06
31 December 2013 31 December 2012
27 DEPRECIATION AND AMORTISATION EXPENSES
Depreciation of Tangible Assets 3,706.14 3,280.90
Amortisation of Intangible Assets 495.60 284.38
4,201.74 3,565.28
NOTES TO THE CONSOLIDATED FINANCIAL STATEMENTSFor the year ended 31st December 2013
(a in lac)

0282 64th Annual Report & Accounts 2013
31 December 2013 31 December 2012
28 OTHER EXPENSES
Consumption of Stores and Consumables 831.76 693.92 Power and Fuel 3,829.11 3,291.92 Repairs to Building 171.06 166.11 Repairs to Machinery 1,270.86 1,157.85 Other Repairs 207.55 171.84 Sub Contracting Expenses 1,089.13 888.49 Insurance 183.67 182.92
Rent 221.67 50.74
Rates and Taxes 120.32 128.02
Travelling and Conveyance 547.90 520.29
Legal and Professional Charges * 771.70 671.37
Commission-Directors 41.51 45.34
Communication Costs 132.86 130.51
Payment to Auditor (Refer note 28.1) 64.85 48.52
Donation 7.33 10.35
Printing and Stationery 67.14 78.24
Commission on Sales - Others 219.29 165.60
Freight and Forwarding Expenses 1,670.40 1,447.50
Fixed Assets Written Off 4.44 15.28
Bank Charges 64.23 70.53
Provision for Sales Tax 49.61 75.73
Provision for Doubtful Debts – 51.56
Foreign Exchange Loss (Net) 220.05 139.25
Miscellaneous Expenses 1,667.24 1,296.46
13,453.68 11,498.34
* Previous year includes a 80.74 lacs being professional fees incurred on acquisition of Subsidiary- Webtech Labels Pvt.Ltd.
31 December 2013 31 December 2012
28.1 Payment to Auditors :
Auditor's RemunerationAudit Fees 57.58 44.71In other capacityCertifi cation Fees 1.35 2.27Reimbursement of Expenses 5.92 1.54
64.85 48.52
31 December 2013 31 December 2012
29 EARNINGS PER SHARE (EPS)
Profi t after Tax Excluding Exceptional Item 5,155.60 4,507.52
Profi t after Tax Including Exceptional Item 5,620.74 4,507.52
Weighted Average Number of Equity Shares 62,687,190 62,687,190
Basic and Diluted Earnings per Equity Share Excluding Exceptional Item (in a)
8.23 7.19
Basic and Diluted Earnings per Equity Share Including Exceptional Item (in a)
8.97 7.19
Nominal Value of Share (in a) 2.00 2.00
NOTES TO THE CONSOLIDATED FINANCIAL STATEMENTSFor the year ended 31st December 2013
(a in lac)

64th Annual Report & Accounts 2013 0183
31 December 2013 31 December 2012
30 CONTINGENT LIABILITIES
a Excise Duty
Matters in Appeal - Duty 5,202.50 5,099.57
- Penalties 147.01 125.58
Show Cause Notices - Duty 3,703.92 3,221.53
b Service Tax
Show Cause Notices - Service Tax 49.74 34.47
Matters in Appeal - Service Tax 84.26 74.81
- Penalties 58.12 55.87
c Sales Tax Demands in Appeal 76.91 117.24
d Claims against the group not acknowledged as debts 65.18 120.83
Note for (a) to (d): Future cash outfl ows / uncertainties, if any, in respect of the above are determinable only on receipt of judgements / decisions pending with various forums / authorities.
31 December 2013 31 December 2012
31 CONTRACTS REMAINING TO BE EXECUTED ON CAPITAL ACCOUNT AND NOT PROVIDED FOR (NET OF ADVANCES). 4,064.48 1,047.12
31 December 2013 31 December 2012
CurrencyForeign Currency
in lacForeign Currency
in lac
32 DISCLOSURE OF DERIVATIVE INSTRUMENTS
i Derivative Instruments Outstanding Forward Exchange contracts for
the foreign exchange exposures of receivables on account of export of goods.
USD 12.00 13.00
ii Foreign Exchange Exposures Foreign Exchange exposures not
covered by a derivative contract for payments to be received on account of export of goods.
USD
EUR
61.06
0.65
48.29
0.39
iii Foreign Exchange exposures not
covered by a derivative contract for payments to be made against revenue imports and capital imports creditors
USD
EUR
JPY
GBP
SFR
36.43
0.66
28.04
0.13
–
30.31
1.97
23.97
0.17
0.10
iv Bank balance in Export Earners Foreign Currency account
USD 0.93 –
NOTES TO THE CONSOLIDATED FINANCIAL STATEMENTSFor the year ended 31st December 2013
(a in lac)

0284 64th Annual Report & Accounts 2013
v Derivatives taken to Cover Forecast Exposures
Forward Exchange contracts taken for the forecast exports receivables on account of export of goods & services.
USD 28.00 35.00
Forward Exchange contracts taken for the forecasted Capital imports.
Euro
JPY
9.62
–
–
236.10
vi Closing exchange rate at Balance Sheet date ( In INR)
USD
EUR
JPY
GBP
SFR
61.90
85.37
0.59
102.39
69.54
54.89
72.42
0.64
88.74
59.99
vii Mark to market valuation loss on account of forward exchange contracts entered into to cover the forecast transactions pursuant to the ICAI announcement of 29th March 2008 on Accounting for Derivatives.
R 76.51 27.39
33 SEGMENT REPORTING
The Group’s sole business segment is consumer packaging and all activities of the Group are incidental to this sole business segment. Given this fact and that the Group services its domestic and export markets from India only, the fi nancial statements refl ect the information required by AS-17 Segment Reporting for the sole business segment of consumer packaging.
Secondary segments for the Group are geographic, namely domestic and exports. Revenue from geographic segments is based on the domicile of customers.
31 December 2013 31 December 2012
Net Sales Domestic Customers 86,172.19 72,442.70
Net Sales Export Customers 21,307.46 16,874.72
Total Net Sales 107,479.65 89,317.42
The entire business assets other than trade receivables are situated in India.
Trade receivables outstanding in respect of domestic segment as at the year end
16,471.65 12,693.49
Trade receivables outstanding in respect of export segment as at the year end
4,396.92 3,193.53
NOTES TO THE CONSOLIDATED FINANCIAL STATEMENTSFor the year ended 31st December 2013
($ in lac)
31 December 2013 31 December 2012

64th Annual Report & Accounts 2013 0185
($ in lac)
31 December 2013 31 December 2012
34 RELATED PARTY TRANSACTIONS
a) Related party where control exists :
Ultimate Parent Company Huhtamaki Oyj., Finland
Holding Company Huhtavefa B.V., Netherlands
b) Other Related Parties with whom transactions
have taken place during the year :
Fellow Subsidiaries Huhtamaki New Zealand Ltd., New Zealand.
Huhtamaki Australia Ltd., Australia
Huhtamaki Deutschland Gmbh and Co.KG., Germany
Huhtamki South Africa Pty Ltd., South Africa
Huhtamaki (Thailand) Ltd., Thailand
c) Key Managerial Personnel Mr. Suresh Gupta Chairman and Managing
Director
Mr. M.K.Srinivasan Chief Executive Offi cer and
Executive Director (till 30th
June 2012)
Mr. A.Venkatrangan Executive Director
d) Relatives of Key Managerial Personnel
Mr. Suresh Gupta Mrs. Kumkum Gupta-Wife, Ms. Ratna Gupta-Daughter,
Ms. Shivani Gupta-Daughter
e) Details of transactions with related parties that have taken place during the year :
1) Ultimate Parent Company
a) Software and Expense Reimbursements Charge 33.89 31.59
b) Remuneration paid by Huhtamaki Oyj to Mr.Suresh
Gupta as EVP - Flexibles Packaging Global,
Huhtamaki Oyj.Finland
222.25 93.04
2) Holding Company
Dividend Paid
Huhtavefa B.V., Netherlands 990.47 914.28
3) Fellow Subsidiaries
Purchase of Goods
– Huhtamaki Deutschland Gmbh and Co.KG.,
Germany
18.34 2.99
Sale of Goods
– Huhtamaki New Zealand Ltd., New
Zealand. (Net of Sales Returns)
453.17 525.44
– Huhtamaki (Thailand) Ltd, Thailand 114.79 46.39
– Huhtamaki Australia Ltd., Australia 418.05 408.03
NOTES TO THE CONSOLIDATED FINANCIAL STATEMENTSFor the year ended 31st December 2013

0286 64th Annual Report & Accounts 2013
($ in lac)
31 December 2013 31 December 2012
– Huhtamaki South Africa Pty Ltd., South Africa 201.03 –
– Huhtamaki Deutschland Gmbh and Co.KG.,
Germany
5.37 –
Commission Expenses on Sales
– Huhtamaki South Africa Pty Ltd., South Africa 77.72 73.84
Expense Reimbursements - Charge
– Huhtamaki New Zealand Ltd., New Zealand – 5.72
– Huhtamaki Australia Ltd., Australia 0.11 49.77
– Huhtamaki (Thailand) Ltd., Thailand 3.56 –
Expense Reimbursements - Recovery
– Huhtamaki Deutschland Gmbh and Co.KG.,
Germany
0.91 –
Balances due to
– Huhtamaki Oyj., Finland 21.32 23.73
– Huhtamaki South Africa Pty Ltd., South Africa 43.10 46.25
– Huhtamaki Australia Ltd., Australia 0.11 –
– Huhtamaki Deutschland Gmbh and Co.KG.,
Germany
8.60 –
Balances due from
– Huhtamaki New Zealand Ltd., New Zealand. 155.30 32.91
– Huhtamaki Australia Ltd., Australia. 61.74 119.43
– Huhtamaki South Africa Pty Ltd., South Africa 49.16 –
4) Payments to Key Managerial Personnel and their
Relatives
Remuneration Paid to Key Managerial Personnel
Mr. Suresh Gupta, Chairman and Managing Director 206.64 187.22
Mr. M.K.Srinivasan,Chief Executive Offi cer & Executive Director – 67.86
Mr. A.Venkatrangan,Executive Director 146.22 47.48
352.86 302.56
Dividend Paid to Key Managerial Personnel and their Relatives
Mr. Suresh Gupta 30.71 28.35
Mrs. Kumkum Gupta 6.53 6.03
Ms. Ratna Gupta 5.23 4.83
Ms. Shivani Gupta 5.21 4.81
Mr. A.Venkatrangan 0.13 0.12
47.81 44.14
NOTES TO THE CONSOLIDATED FINANCIAL STATEMENTSFor the year ended 31st December 2013
64th Annual Report & Accounts 2013 0187
31 December 2013 31 December 2012
35 DISCLOSURE PURSUANT TO ACCOUNTING STANDARD - 15 (REVISED)' EMPLOYEE BENEFITS'
i) Defi ned Contribution Plans
Amount recognised as an expense and included in "Personnel costs" for Provident Fund & ESIC contributions in the
Profi t and Loss account. 346.74 305.04
i) Defi ned Benefi t Plans
The Company has classifi ed the various benefi t plans provided to employees as under :
I Gratuity Plan
Gratuity is payable to all eligible employees of the Company on superannuation, death and resignation, in terms of the provisions of the Payment of Gratuity Act or as per the Company's Scheme whichever is more benefi cial.
II Leave Plan
Eligible employees can carry forward and encash leave on superannuation, death, and resignation subject to maximum limits as per Company policy.
The following table summarises the components of the net benefi t expense recognised in the profi t & loss account and the funded status and amount recognised in the Balance sheet for the respective plans.
(a in lac)
Gratuity - Funded Leave Encashment - Non Funded
2013 2012 2013 2012
I. Change in Benefi t Obligation
Opening Defi ned Benefi t Obligation 1,316.18 1,125.95 356.89 350.30
Interest cost 109.28 92.89 29.62 24.72
Current Service Cost 96.35 108.46 58.22 53.13
Benefi t Paid (115.94) (81.27) (34.72) (56.20)
Obligation taken over on acquisition of business – 43.92
Actuarial (Gain)/ Loss on Obligations (134.55) 26.23 (50.36) (15.06)
Closing Defi ned Benefi t Obligation 1,271.32 1,316.18 359.65 356.89
II Fair Value of Plan Assets
Fair Value of Plan Assets at the beginning of the year 1,274.36 1,125.95 – –
Expected Return on Plan Assets 105.77 100.04 – –
Contributions (139.01) 52.02 – –
Benefi t Paid – (80.83) – –
Actuarial Gain/(Loss) on Plan Assets (12.73) 77.19 – –
Fair Value of Plan Assets at the end of the year 1,228.39 1,274.36 – –
III. Actual Return on Plan Assets
Actual Return on Plan Assets 93.04 177.23 – –
Expected Return on Plan Assets 105.77 100.04 – –
Actuarial Gain/ (Loss) on Plan Assets (12.73) 77.19 – –
Actuarial Gain/ (Loss) on Obligation 134.55 (26.23 ) 50.36 15.06
NOTES TO THE CONSOLIDATED FINANCIAL STATEMENTSFor the year ended 31st December 2013

0288 64th Annual Report & Accounts 2013
Gratuity - Funded Leave Encashment - Non Funded
2013 2012 2013 2012
IV. Amount Recognised in the Balance Sheet
Defi ned Benefi t Obligation 1,271.32 1,316.18 359.65 356.89
Fair Value of Plan Assets 1,228.39 1,274.36 – –
Funded Status (42.93) (41.82) (359.65) (356.89)
Unrecognised Actuarial Gain/(Loss) – – – –
Net Asset /(Liability) Recognised in the Balance Sheet (42.93) (41.82) (359.65) (356.89)
V. Expenses Recognised in the Profi t & Loss Account
Current Service Cost 96.35 108.46 58.22 53.13
Interest Cost 109.28 92.89 29.62 24.72
Expected Return on Plan Assets (105.77) (100.04) – –
Net Actuarial (Gain)/Loss to Be Recognised (121.81) (50.95) (50.36) (15.06)
Expense Recognised in Statement of Profi t and Loss (21.96) 50.36 37.48 62.78
The Company expects to contribute R Nil to Gratuity in next year (31st December, 2012: R Nil)
The principal assumptions used in determining benefi t obligations for the Company’s plans are shown below.
31-Dec-13 31-Dec-12
Discount Rate 9.50% 8.30%
Rate of Return on Plan Assets 9.50% 9.50%
Salary Escalation 7.25% 7.25%
Employee Turnover
years %
0-2 12%
3-4 5%
5-9 2.5%
10 & Above
1%
Estimates of future salary increases, considered in actuarial valuation, take account of infl ation,seniority,promotion and other relevant factors, such as supply and demand in the employment.
The major categories of plan assets as a percentage of the fair value of total plan assets are as follows.
ParticularsGratuity Gratuity
31 December 2013 31 December 2012
Amount in lac
% Amount in lac
%
Investment Value in Unit Linked Plans 243.90 20% 351.12 28%
Investment Value in Non Unit Linked Plans 879.31 71% 818.06 64%
Investment Value in Special Deposit Scheme of Bank Of Baroda 105.18 9% 105.18 8%
Total 1228.39 100% 1,274.36 100%
Amounts for the current and previous periods are as follows.
NOTES TO THE CONSOLIDATED FINANCIAL STATEMENTSFor the year ended 31st December 2013
($ in lac)

64th Annual Report & Accounts 2013 0189
(a in lac)
Particulars Gratuity
2013 2012
Defi ned Benefi t Obligation 1,271.32 1,316.18
Plan Assets 1,228.39 1,274.36
Excess of Defi ned Benefi t Obligation over Fair Value of Plan Assets.
42.93 41.82
Experience Adjustment on Plan Assets – (77.19)
Experience Adjustment on Plan Liabilities 14.71 30.93
Particulars Leave Encashment
2013 2012
Defi ned Benefi t Obligation 359.65 356.89
Plan Assets – –
Experience Adjustment – –
Excess of Defi ned Benefi t Obligation over Fair Value of Plan Assets.
359.65 356.89
31 December 2013 31 December 2012
36 LEASES
The Group has taken certain offi ce premises and residential facilities under operating Lease arrangements.There are no restrictions imposed by lease arrangements. There are no subleases.Future lease commitments in respect of non-cancellable operating leases are as follows :Within one year 181.32 –After one year but not more than fi ve years 641.93 –
823.25 –
31 December 2013 31 December 2012
37 RESEARCH AND DEVELOPMENT EXPENSES
The details of expenses incurred on in-house research and development activities during theyear ended 31 December 2013 as certifi ed by the management are as follows :Total Revenue Expenditure * 137.19 84.11
Total Capital Expenditure ** 52.61 –
Total Research & Development Expenses 189.80 84.11
* Revenue Expenditure of Rs.137.19 lacs has been grouped under various expense heads of the Financial Statements.** Additions to Fixed Assets in Note no. 11 includes Rs.52.61 lacs towards Capital Expenditure have incurred for Company's in house R & D facilities.
NOTES TO THE CONSOLIDATED FINANCIAL STATEMENTSFor the year ended 31st December 2013

0290 64th Annual Report & Accounts 2013
38 The Remuneration payable by subsidiary to its Managing Director for the period from November 9, 2012 to December 31, 2013 has exceeded the limits approved by the Central Goverment under section 198, 269, 309, 310 read eith Schedule XIII to the Companies Act,1956 by R 30 Lacs. The Company has fi led a revised application with the Central Government for approval of remuneration to be paid to the Managing Director in excess to the limits prescribed.
39 EXCEPTIONAL INCOME
Exceptional Income comprises of gain realised on sale of offi ce property at Nariman Point, Mumbai during the current year of R 705 lac (Provision for Tax includes R 239 lac towards tax on this gain).
40 In the previous year on November 9, 2012 the company (‘PPL’) had subscribed to 51% share capital of Webtech Lables Pvt. Ltd., hence fi gures for the current year are not comparable to that of previous year.
41 Previous year fi gures have been regrouped or reclassifi ed wherever necessary, to conform to this year classifi cations.
Directors
As per our report of even date
For S.R. Batliboi & Co.LLP For and on behalf of the Board of Directors
Chartered AccountantsICAI Firm Registration No. 301003E Suresh Gupta A.Venkatrangan Chairman & Managing Director Executive Director
per Vijay Maniar Parag Vyavahare Jukka MoisioPartner Chief Financial Offi cer Johann SippelMembership No. 36738 Ramesh Kumar Dhir Anand Daga Nripjit Singh ChawlaMumbai Company Secretary & Head Legal S.K.Palekar18 February 2014 Mumbai, 18 February 2014 P.V.Narayana
NOTES TO THE CONSOLIDATED FINANCIAL STATEMENTSFor the year ended 31st December 2013

NOTES

NOTES

Specialised Pouches
Personal Care
CORPORATE HEAD QUARTERTHANELBS Marg, Majiwade, Thane (West) - 400601, MaharashtraTel.: +91 22 2173 5551/5591Fax: +91 22 2173 5599/5650
MANUFACTURING LOCATIONSTHANELBS Marg, Majiwade, Thane (West) - 400601, MaharashtraTel.: +91 22 2173 5551/5591Fax: +91 22 2173 5599/5650
SILVASSASurvey No. 33/1, At Post Umerkoi, Via SilvassaU.T. of Dadra & Nagar Haveli - 396230Tel.: +91 97250 25351
HYDERABAD139 & 148, Sri Venkateshwara Co-op. Indl. EstateBollarum - 502325, Medak District, Andhra PradeshTel.: +91 8458 279628/616 Fax: +91 8458 279464
RUDRAPURPlot No. 70-73, Sector 4, IIE Pantanagar, Rudrapur, Udhamsingh Nagar - 263153 Uttarakhand Tel.: +91 5944 250183/84/85 Fax: +91 5944 250186
R&D CENTRELBS Marg, Majiwade, Thane (West) - 400601, MaharashtraTel.: +91 22 2173 5551/5591Fax: +91 22 2173 5599/5650
CUSTOMER SUPPORT OFFICESBANGALORE#91, West Park Road, 17th Cross, Malleswaram Bangalore - 560055 KarnatakaTel.: +91 80 23568979/23342873 Fax: +91 80 23342872
HYDERABAD139 & 148, Sri Venkateshwara Co-op. Indl. Estate,Bollarum - 502325, Medak District, Andhra PradeshTel.: +91 8458 279628/616 Fax: +91 8458 279464
KOLKATA5th Floor, Laha Paint House, 7 Chittaranjan AvenueKolkata - 700072, West BengalTel.: +91 33 2237 2812/2234 8241 Fax; +91 33 2225 5654
NEW DELHI508/510, Ansal Chamber II, 6 Bhikaji Cama Palace,New Delhi - 110066.Tel.: +91 11 2619 4795/5641
Specialised Cartons
Package Protection & Decoration Technologies
THANE
SILVASSA
HYDERABAD
RUDRAPUR
Product Portfolio

veemelees efJeÐeles YeeJees veeYeeJees efJeÐeles mele:~Untrue can never be true and truth is indestructible.
64Annual Report
th
2013

![[600]* Auditors' reports on financial statements](https://static.fdocuments.in/doc/165x107/544fbf2caf7959cb398b7270/600-auditors-reports-on-financial-statements.jpg)