6.3 Graphing Linear Relations
13
6.3 Focus on… After this lesson, you will be able to… • graph linear relations • match equations of linear relations with graphs • solve problems by graphing a linear relation and analysing the graph Graphing Linear Relations Tina is in charge of ordering water supplies for a cruise ship. She knows the amount of water required per day for each passenger and crew member as well as the amount of water reserves that the ship carries. She decides to use her knowledge of linear relations to draw a graph representing the relationship between the amount of water needed and the length of a cruise. If Tina were to develop an equation, how could she determine if the graph and the equation represent the same relationship? Explore Graphs of Linear Relations On a cruise, the average person requires a minimum of 4 L of water per day. The cruise ship has capacity for 1500 passengers and crew. The ship also carries a reserve of 50 000 L of water in case of emergency. 1. a) Use a method of your choice to determine how much water will be needed each day of a seven-day cruise. b) On grid paper, plot the data and label your graph. Compare your graph with that of a classmate. 2. a) Predict how much water is needed for a ten-day cruise. b) What linear equation represents the litres of water needed per day? c) How could you verify your answer for part a)? Try out your strategy. Reflect and Check 3. Do your graph and the equation represent the same relationship? Explain. 4. Discuss with a partner if it would be appropriate to interpolate or extrapolate values using a fraction of a day. Explain why or why not. 5. a) If the cruise ship used 152 000 L of water, approximately how long did the trip last? Compare the method you used with a classmate’s. b) Is there more than one way to answer part a)? Explain. Which method seems more efficient? Materials • grid paper • ruler What values will you plot along the horizontal axis? along the vertical axis? 6.3 Graphing Linear Relations • MHR 231
Transcript of 6.3 Graphing Linear Relations

6.3
Focus on…After this lesson, you
will be able to…
• graph linear
relations
• match equations of
linear relations with
graphs
• solve problems by
graphing a linear
relation and
analysing the graph
Graphing Linear Relations
Tina is in charge of ordering water supplies for a cruise ship. She knows the amount of water required per day for each passenger and crew member as well as the amount of water reserves that the ship carries. She decides to use her knowledge of linear relations to draw a graph representing the relationship between the amount of water needed and the length of a cruise.
If Tina were to develop an equation, how could she determine if the graph and the equation represent the same relationship?
Explore Graphs of Linear RelationsOn a cruise, the average person requires a minimum of 4 L of water per day. The cruise ship has capacity for 1500 passengers and crew. The ship also carries a reserve of 50 000 L of water in case of emergency.
1. a) Use a method of your choice to determine how much water will be needed each day of a seven-day cruise.
b) On grid paper, plot the data and label your graph. Compare your graph with that of a classmate.
2. a) Predict how much water is needed for a ten-day cruise.b) What linear equation represents the litres of water needed per day?c) How could you verify your answer for part a)? Try out your strategy.
Refl ect and Check
3. Do your graph and the equation represent the same relationship? Explain.
4. Discuss with a partner if it would be appropriate to interpolate or extrapolate values using a fraction of a day. Explain why or why not.
5. a) If the cruise ship used 152 000 L of water, approximately how long did the trip last? Compare the method you used with a classmate’s.
b) Is there more than one way to answer part a)? Explain. Which method seems more effi cient?
Materials• grid paper
• ruler
What values will you
plot along the
horizontal axis? along
the vertical axis?
6.3 Graphing Linear Relations • MHR 231

Link the Ideas
Example 1: Graph a Linear Equation
The world’s largest cruise ship, Freedom of the Seas, uses fuel at a rate of 12 800 kg/h. The fuel consumption, f, in kilograms, can be modelled using the equation f = 12 800t, where t is the number of hours travelled.a) Create a graph to represent the linear relation for the fi rst 7 h.b) Approximately how much fuel is used in 11 h? Verify your solution.c) How long can the ship travel if it has approximately 122 000 kg of
fuel? Verify your solution.
Solution
Method 1: Use Paper and Pencila) Create a table of values.
Graph the coordinate pairs.
Time, t (h)
Fuel Consumption, f (kg)
0 0
1 12 800
2 25 600
3 38 400
4 51 200
5 64 000
6 76 800
7 89 600
4 53 6 7210
10 000
20 000
30 000
40 000
50 000
60 000
80 000
90 000
70 000
Fuel
Con
sum
ptio
n (k
g)
Time (h)
t
f Cruise Ship Fuel Consumption
b) Draw a straight
4 53 6 7 8 9 10 11 12210
10 000
20 000
30 000
40 000
50 000
60 000
80 000
90 000
100 000
110 000
120 000
130 000
140 000
70 000
Fuel
Con
sum
ptio
n (k
g)
Time (h)
t
f Cruise Ship Fuel Consumptionline to connect the data points. Extend the line past the last data point.
Approximately 140 000 kg of fuel are used in 11 h.
Describe the
connection between
the equation and the
graph.
What diff erent
methods might you
use to represent and
then solve the
problem?
232 MHR • Chapter 6

Check: Substitute the value t = 11 into the equation f = 12 800t. f = 12 800(11)
= 140 800 The approximate solution is correct.
c) The fuel will last approximately 9.5 h.
Check: Substitute f = 122 000 into the equation and solve for t. 122 000 = 12 800t
122 000 ________ 12 800
= t
t ≈ 9.53 The approximate solution is correct.
Method 2: Use a Spreadsheet
a) In the spreadsheet, cell A1 has been labelled Time, t. Cell B1 has been labelled Fuel Consumption, f.
Enter the fi rst eight values for t in cells A2 to A9. Then, enter the formula for the equation into cell B2. Use an = sign in the formula and * for multiplication. The value for t comes from cell A2.
Use the cursor to select cells B2 down to B9. Then, use the Fill Down command to enter the formula in these cells.
The appropriate cell for t will automatically be inserted. For example, =12800*A6 will be inserted into cell B6.
Use the spreadsheet’s graphing command to graph the table of values. Note that different spreadsheets have different graphing commands. Use your spreadsheet’s instructions to fi nd the correct command.
1234567891011121314151617
A B C D E F G H I
4 53 6 7 8 9 10 11 12210
20 000
40 000
60 000
80 000
100 000
120 000
140 000
Fuel
Con
sum
ptio
n (k
g)
Time (h)
t
fCruise Ship Fuel Consumption
Tech LinkYou could use a
graphing calculator to
graph this linear
relation. To learn about
how to do this go to
www.mathlinks9.ca
and follow the links.
6.3 Graphing Linear Relations • MHR 233
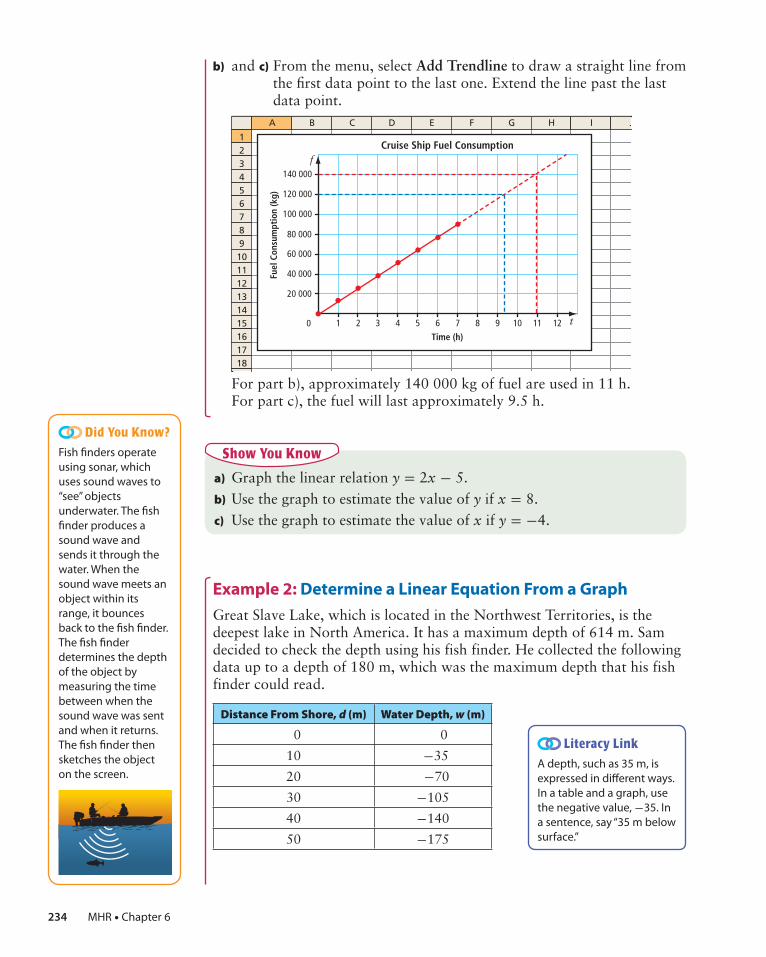
b) and c) From the menu, select Add Trendline to draw a straight line from the fi rst data point to the last one. Extend the line past the last data point.
123456789101112131415161718
A B C D E F G H I J
4 53 6 7 8 9 10 11 12210
20 000
40 000
60 000
80 000
100 000
120 000
140 000
Fuel
Con
sum
ptio
n (k
g)
Time (h)
t
fCruise Ship Fuel Consumption
For part b), approximately 140 000 kg of fuel are used in 11 h. For part c), the fuel will last approximately 9.5 h.
a) Graph the linear relation y = 2x - 5.b) Use the graph to estimate the value of y if x = 8.c) Use the graph to estimate the value of x if y = -4.
Show You Know
Example 2: Determine a Linear Equation From a Graph
Great Slave Lake, which is located in the Northwest Territories, is the deepest lake in North America. It has a maximum depth of 614 m. Sam decided to check the depth using his fish finder. He collected the following data up to a depth of 180 m, which was the maximum depth that his fish finder could read.
Distance From Shore, d (m) Water Depth, w (m)
0 0
10 -35
20 -70
30 -105
40 -140
50 -175
Did You Know?Fish fi nders operate
using sonar, which
uses sound waves to
“see” objects
underwater. The fi sh
fi nder produces a
sound wave and
sends it through the
water. When the
sound wave meets an
object within its
range, it bounces
back to the fi sh fi nder.
The fi sh fi nder
determines the depth
of the object by
measuring the time
between when the
sound wave was sent
and when it returns.
The fi sh fi nder then
sketches the object
on the screen.
Literacy LinkA depth, such as 35 m, is
expressed in diff erent ways.
In a table and a graph, use
the negative value, -35. In
a sentence, say “35 m below
surface.”
234 MHR • Chapter 6

Sam used a spreadsheet to graph the data.
123456789101112131415161718
A B C D E F G H I J
40 5030 60 70 80 90 10020100
–300
–250
–200
–150
–100
–50
Wat
er D
epth
(m)
Distance From Shore (m)
t
fGreat Slave Lake Depth Recordings
a) What linear equation does this graph represent? How do you know the equation matches the graph?
b) If this pattern continues, how far from shore would Sam be when the water is 614 m deep?
c) At what rate is the depth of the water decreasing?d) Is it appropriate to interpolate or extrapolate values on this graph?
Explain.
Solution
a) Add a column to the table to help determine the pattern.
Distance From Shore, d (m) Water Depth, w (m) Pattern: Multiply d by -3.5
0 0 0
10 -35 -35
20 -70 -70
30 -105 -105
40 -140 -140
50 -175 -175
The water depth, w, decreases by 3.5 m for each 1-m increase in the distance from shore, d. The equation is w = -3.5d.
Check by substituting a known coordinate pair, such as (30, 105), into the equation.
Left Side = -105 Right Side = -3.5(30)= -105
Left Side = Right Side The equation is correct.
What is the
connection
between the
graph and the
equation?
6.3 Graphing Linear Relations • MHR 235

b) Substitute w = 614 into the equation and solve for d. -614 = -3.5d
-614 ______ -3.5
= d
d ≈ 175.4 Sam would be approximately 175.4 m from shore when the water
is 614 m deep.
c) The depth is decreasing at a rate of 3.5 m for each metre away from shore. The rate at which the water depth is decreasing is the coeffi cient of d in the equation.
d) Yes, it is reasonable to interpolate or extrapolate values between and beyond the given data points since the values for distance and depth exist. However, it is unreasonable to extrapolate values beyond the maximum depth of 614 m.
Identify the linear equation that represents the graph.
12345678910111213141516171819
A B C D E F G H I
4 53 6 7 8 9 10 11 1221
(2, 3)(4, 4)
(6, 5)(8, 6)
(10, 7)
0
2
4
6
8
10
12
14
Dis
tanc
e (m
)
Time (s)
t
d
Show You Know
Solve an Equation
Strategies
How else could you solve this
problem?
236 MHR • Chapter 6

Example 3: Graph Horizontal and Vertical lines
For each table of values, answer the following questions:Table 1 Table 2
Time, t (s) Distance, d (m)
0 6
30 6
60 6
90 6
120 6
Distance, x (m) Height, y (m)
1.5 2.5
1.5 3.0
1.5 3.5
1.5 4.0
1.5 4.5
a) Draw a graph to represent the table of values.b) Describe a situation that the graph might represent.c) Write the equation. Explain how you know the graph represents the
equation.
Solution
a)
80 10060 120 14040200
1
2
3
4
5
6
7
Dis
tanc
e (m
)
Time (s)
t
d Graph of Table 1
1.2 1.50.9 1.80.60.30
2.0
2.5
3.0
3.5
4.0
4.5
5.0
Hei
ght
(m)
Distance (m)
x
y Graph of Table 2
b) Table 1: The graph could show the relationship between distance and time when a pedestrian is waiting for a traffi c light to change. The distance from the pedestrian to the opposite side of the road is constant.
Table 2: The graph could show the relationship between the height of a ladder and its distance from the wall where it is placed. The distance of the base of the ladder from the wall is constant as the ladder is extended.
c) Table 1: The distance, d, remains constant for each interval of time. The equation is d = 6. For each value of t in the table and the graph, the value of d is 6.
Table 2: The distance, x, remains constant for each interval of height. The equation is x = 1.5. For each value of y in the table and the graph, the value of x is 1.5.
Think of a diff erent
situation to represent
each graph.
6.3 Graphing Linear Relations • MHR 237

a) Write the linear equation that represents the graph.
b) Explain how you know the graph matches the equation.
Show You Know
8 106 12420
1
2
3
4
5
Dis
tanc
e (m
)
Time (s)
t
d
Key Ideas
• You can graph a linear relation represented by an equation.� Use the equation to make a table of values.� Graph using the coordinate pairs in the table. The graph of a linear relation
forms a straight line.
k = j __
5 - 9
2 4 6
-8.2
-7.8
0
-8.6
-9.0
j
k
j k
0 -9.0
1 -8.8
2 -8.6
3 -8.4
4 -8.2
5 -8.0
� The graph of a linear relation can form a horizontal or a vertical line.• You can use graphs to solve problems by interpolating or extrapolating values.
Check Your UnderstandingCommunicate the Ideas
1. You are given a linear equation. Describe the process you would follow to represent the equation on a graph. Use an example to support your answer.
2. Use examples and diagrams to help explain how horizontal and vertical lines and their equations are similar and how they are different.
238 MHR • Chapter 6
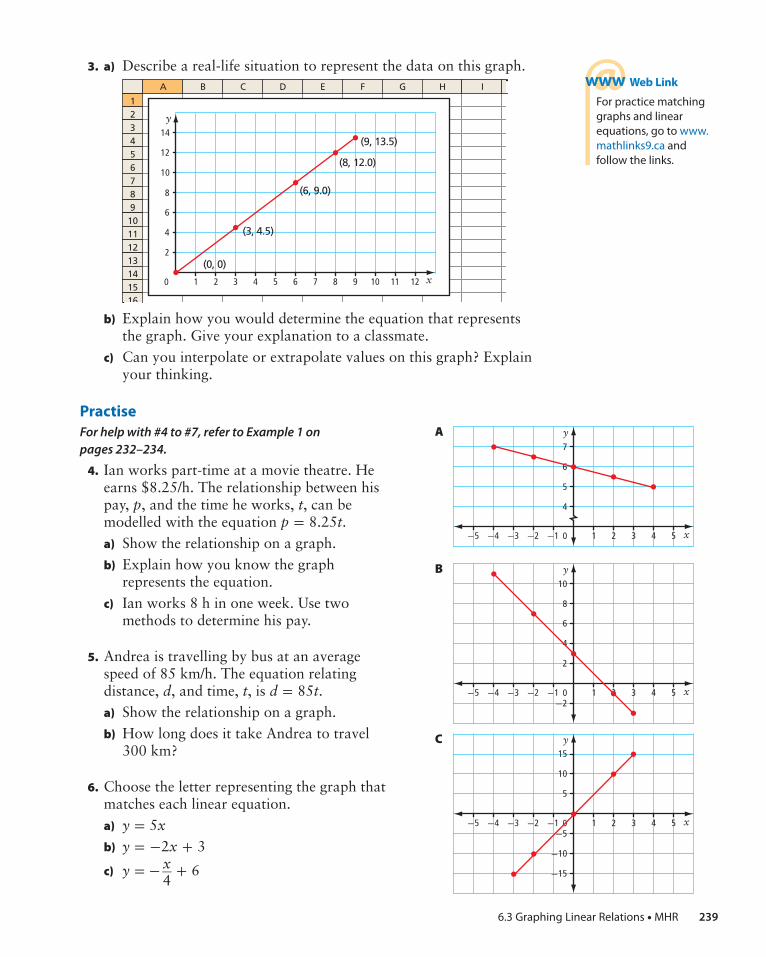
3. a) Describe a real-life situation to represent the data on this graph.
12345678910111213141516
A B C D E F G H I
4 53 6 7 8 9 10 11 1221
(0, 0)
(3, 4.5)
(6, 9.0)
(8, 12.0)
(9, 13.5)
0
2
4
6
8
10
12
14
x
y
b) Explain how you would determine the equation that represents the graph. Give your explanation to a classmate.
c) Can you interpolate or extrapolate values on this graph? Explain your thinking.
Practise
For help with #4 to #7, refer to Example 1 on
pages 232–234.
4. Ian works part-time at a movie theatre. He earns $8.25/h. The relationship between his pay, p, and the time he works, t, can be modelled with the equation p = 8.25t.a) Show the relationship on a graph.b) Explain how you know the graph
represents the equation.c) Ian works 8 h in one week. Use two
methods to determine his pay.
5. Andrea is travelling by bus at an average speed of 85 km/h. The equation relating distance, d, and time, t, is d = 85t.a) Show the relationship on a graph.b) How long does it take Andrea to travel
300 km?
6. Choose the letter representing the graph that matches each linear equation.a) y = 5x
b) y = −2x + 3
c) y = − x __ 4
+ 6
A
3 4 520
4
5
6
7
1−1−2−3−4−5 x
y
B
3 4 520
2
−2
4
6
8
10
1−1−2−3−4−5 x
y
C
3 4 520
5
−5
−10
−15
10
15
1−1−2−3−4−5 x
y
Web Link
For practice matching
graphs and linear
equations, go to www.
mathlinks9.ca and
follow the links.
6.3 Graphing Linear Relations • MHR 239

7. Create a table of values and a graph for each linear equation.a) x = 4 b) r = −3s + 4.5
c) m = k __ 5 + 13
For help with #8 to #11, refer to Example 2 on
pages 234–236.
8. The graph shows the relationship between the cost, C, in dollars and the mass, m, in kilograms of pears.
2.0 2.51.5 3.0 3.5 4.0 4.51.00.50
1
2
3
4
5
6
7
Cost
($)
Mass (kg)
m
C Cost of Pears
a) What is the linear equation?b) How much could you buy for $5?c) Is it appropriate to interpolate or
extrapolate values on this graph? Explain.
9. The graph represents the relationship between the height of water in a child’s pool, h, and the time, t, in hours as the pool fi lls.
1234567891011121314
A B C D E F G
4 53 6 7210
5
10
15
20
25
Hei
ght
(cm
)
Time (h)
t
fWater Height in Pool
a) Determine the linear equation.b) What is the height of the water after 5 h?c) Is it appropriate to interpolate or
extrapolate values on this graph? Explain.
10. Determine the linear equation that models each graph.a)
123456789
101112
A B C D E F G
4321–1–2–3–4 0
4
–4
–8
–12
8
12
x
y
b) 123456789
1011121314
A B C D E F
4321–1–2–3–4 0
2
–2
–4
–6
4
8
6
x
y
11. What linear equation does each graph represent?a)
123456789
101112
A B C D E F
4321–1–2–3–4 0
0.5
–0.5
–1.0
–1.5
–2.5
–2.0
x
y
b) 123456789
101112
A B C D E F
4321–1–2–3–4 0
1
–1
–2
–3
2
3
x
y
240 MHR • Chapter 6
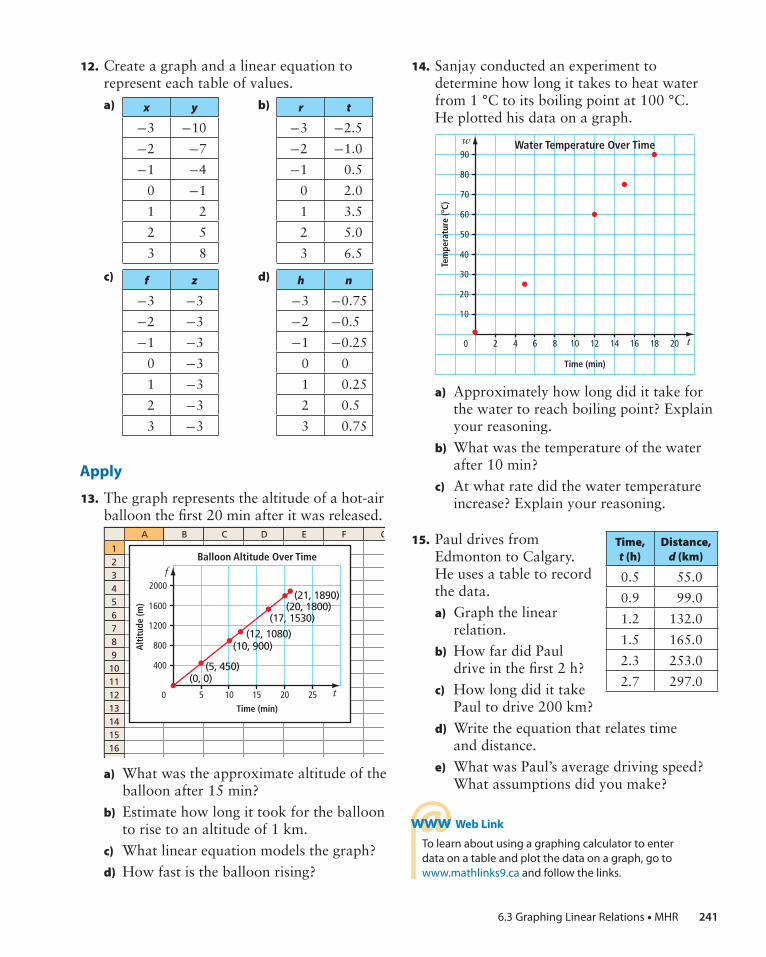
12. Create a graph and a linear equation to represent each table of values.a) x y
-3 -10
-2 -7
-1 -4
0 -1
1 2
2 5
3 8
b) r t
-3 -2.5
-2 -1.0
-1 0.5
0 2.0
1 3.5
2 5.0
3 6.5
c) f z
-3 -3
-2 -3
-1 -3
0 -3
1 -3
2 -3
3 -3
d) h n
-3 -0.75
-2 -0.5
-1 -0.25
0 0
1 0.25
2 0.5
3 0.75
Apply
13. The graph represents the altitude of a hot-air balloon the fi rst 20 min after it was released.
12345678910111213141516
A B C D E F G
20 25151050
400
800
1200
1600
2000
Alt
itud
e (m
)
Time (min)
t
fBalloon Altitude Over Time
(0, 0)(5, 450)
(10, 900)(12, 1080)
(17, 1530)(20, 1800)
(21, 1890)
a) What was the approximate altitude of the balloon after 15 min?
b) Estimate how long it took for the balloon to rise to an altitude of 1 km.
c) What linear equation models the graph?d) How fast is the balloon rising?
14. Sanjay conducted an experiment to determine how long it takes to heat water from 1 °C to its boiling point at 100 °C. He plotted his data on a graph.
8 106 12 14 16 18 20420
10
20
30
40
50
60
70
80
90
Tem
pera
ture
(ºC)
Time (min)
t
w Water Temperature Over Time
a) Approximately how long did it take for the water to reach boiling point? Explain your reasoning.
b) What was the temperature of the water after 10 min?
c) At what rate did the water temperature increase? Explain your reasoning.
15. Paul drives from Time, t (h)
Distance, d (km)
0.5 55.0
0.9 99.0
1.2 132.0
1.5 165.0
2.3 253.0
2.7 297.0
Edmonton to Calgary. He uses a table to record the data.a) Graph the linear
relation.b) How far did Paul
drive in the fi rst 2 h?c) How long did it take
Paul to drive 200 km?d) Write the equation that relates time
and distance.e) What was Paul’s average driving speed?
What assumptions did you make?
Web Link
To learn about using a graphing calculator to enter
data on a table and plot the data on a graph, go to
www.mathlinks9.ca and follow the links.
6.3 Graphing Linear Relations • MHR 241
16. The relationship between degrees Celsius (°C) and degrees Fahrenheit (°F) is modelled
by the equation F = 9 __ 5 C + 32.
a) Graph the relationship for values between -50 °C and 120 °C.
b) Water boils at 100 °C. What is this temperature in degrees Fahrenheit?
c) Water freezes at 0 °C. How did you represent this on your graph?
d) At what temperature are the values for °C and °F the same?
17. Scuba divers experience an increase in pressure as they descend. The relationship between pressure and depth can be modelled with the equation P = 10.13d + 102.4, where P is the pressure, in kilopascals, and d is the depth below the water surface, in metres.a) Graph the relationship for the fi rst 50 m
of diving depth.b) What is the approximate pressure at a
depth of 15 m? Verify your answer.c) The maximum pressure a scuba diver
should experience is about 500 kPa. At what depth does this occur? Verify your answer.
d) What does “+ 102.4” represent in the equation? How is it represented on the graph?
Extend
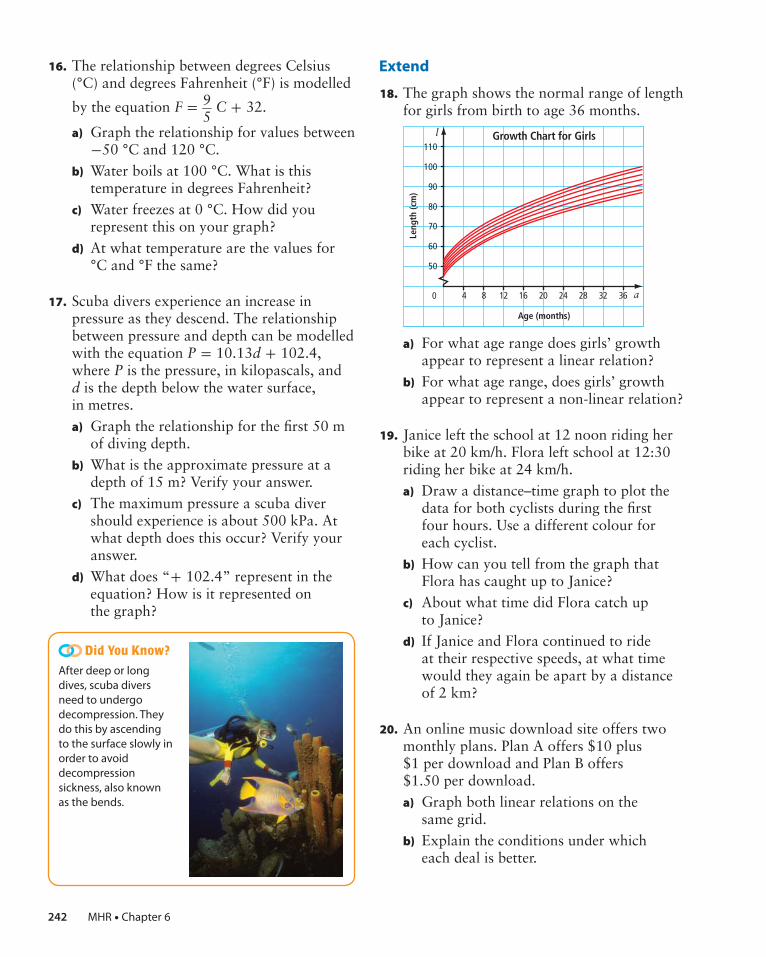
18. The graph shows the normal range of length for girls from birth to age 36 months.
20161280
50
60
70
80
90
100
110
4 24 28 32 36
Leng
th (c
m)
Age (months)
a
l Growth Chart for Girls
a) For what age range does girls’ growth appear to represent a linear relation?
b) For what age range, does girls’ growth appear to represent a non-linear relation?
19. Janice left the school at 12 noon riding her bike at 20 km/h. Flora left school at 12:30 riding her bike at 24 km/h.a) Draw a distance–time graph to plot the
data for both cyclists during the fi rst four hours. Use a different colour for each cyclist.
b) How can you tell from the graph that Flora has caught up to Janice?
c) About what time did Flora catch up to Janice?
d) If Janice and Flora continued to ride at their respective speeds, at what time would they again be apart by a distance of 2 km?
20. An online music download site offers two monthly plans. Plan A offers $10 plus $1 per download and Plan B offers $1.50 per download.a) Graph both linear relations on the
same grid.b) Explain the conditions under which
each deal is better.
Did You Know?After deep or long
dives, scuba divers
need to undergo
decompression. They
do this by ascending
to the surface slowly in
order to avoid
decompression
sickness, also known
as the bends.
242 MHR • Chapter 6

21. Simple interest is paid according to the formula I = p × r × t, where p is the principal, r is the rate of interest per year, and t is the time in years. The interest is not added to the principal until the end of the time period. Canada Savings Bonds offer a simple interest bond payable at 3.5% per year up to a maximum of ten years.
a) Create a table of values to show the interest earned on a $1000 bond for the ten-year period.
b) Use a graph to show the interest earned over ten years.
c) How many years would it take to earn $100 interest? $200 interest?
d) If you could leave the principal beyond the ten-year period, estimate the number of years it would take to earn $500 interest.
The world’s fastest submarines can reach
speeds of 74 km/h in 60 s, starting from rest.
If a submarine is already moving, then the
time to reach its top speed will diff er.
a) Choose four diff erent starting speeds up
to a maximum of 74 km/h. For each
speed, assume that the acceleration is
the same. For each speed include:
• a table of values
• a linear equation and a graph to
represent the relationship between
speed and time
b) Describe each graph. Identify any
similarities and diff erences you observe
between the graphs and the equations.
Did You Know?A student team from the University of Québec set a
new world speed record for the fastest one-person,
non-propeller submarine. In 2007, the submarine, OMER 6,
reached a speed of 4.642 knots (8.6 km/h) in the International
Submarine Races.
6.3 Graphing Linear Relations • MHR 243